Embed Size (px)
Citation preview
U. P. B. Sci. Bull. Series D, Vol. 73, Iss. 1, 2011 ISSN 1454-2358
STUDY OF WIND ENERGY AT GREAT HEIGHTS USING REMOTE SENSING TECHNIQUES LIDAR IN DOBROGEA
Corneliu DICA1, Camelia-Ioana DICA2, Daniela VASILIU3, Nicolae VASILIU4
În vara anului 2008 autorii au întreprins o campanie de evaluare a potenţialului eolian în Comuna Mihai Viteazu din Judeţul Constanţa, utilizând pentru prima dată în România un anemometru tridimensional cu laser (LIDAR) amplasat în paralel cu un anemometru clasic. Acest articol prezintă comparativ rezultatele celor două sisteme de măsură, ale căror indicaţii sunt foarte apropiate din punctul de vedere al valorilor medii ale vitezelor. Totuşi, sistemul LIDAR indică o atenuare a intensităţii longitudinale a turbulenţei faţă de cel clasic. Pe baza acestor rezultate autorii au extins prin continuitate profilele vericale de viteză medie în patru amplasamente apropiate şi au confirmt calitatea acestora până la înălţimea de 160 m în zone cu profil similar. Cercetările întreprinse permit integrarea tehnologiei LIDAR în procedura de predicţie a intensităţii vântului, necesară integrării fermelor eoliene de mari dimensiuni în piaţa de energie est-europeană.
During the summer of 2008, a LIDAR (Light Detection and Ranging) was installed for a wind assessment campaign by C-Tech in Mihai Viteazu, Constanta County in the close proximity of a 40 m wind measuring mast. This paper presents for the first time in Romania a set of results by comparison with data from two surrounding masts. Comparison between LIDAR and mast observation show a very good correlation for the mean speed on the free stream sectors. LIDAR observations of longitudinal turbulence intensity follow the behaviour of the cup anemometers with a degree of attenuation. The horizontal homogeneity of the site makes possible the extension of cup-mast profiles with LIDAR profile up to 160 m which results in a good match profile for four different free stream sectors. The results found in the paper encourage the use of ground based remote sensing techniques for wind resource assessment due to their good adaptability and performance.
Keywords: LIDAR, vertical wind profile, wind measurement.
1. Introduction
Knowledge of the shape of the vertical wind profile is an important issue particularly for site assessments and energy yield calculations. Strong efforts in the remote sensing technology yielded to state of the art wind measuring 1 EMBA, NS, PhD, C-TECH SRL Constanta, e-mail: [email protected] 2 Acc., PhD, C-TECH SRL Constanta 3 Prof., Power Engineering Faculty, University POLITEHNICA of Bucharest, Romania 4 Prof., Power Engineering Faculty, University POLITEHNICA of Bucharest, Romania,e-mail: [email protected]

112 Corneliu Dică, Camelia-Ioana Dică, Nicolae Vasiliu, Daniela Vasiliu
instruments like SODARs (SOund Detecting And Ranging) and LIDARs (LIght Detecting And Ranging) [1]...[11]. This study presents a wind measurement campaign carried out in Mihai Viteazu, Constanta County, where the terrain was medium complex and the winds were known to be some times very strong and turbulent. In Dobrogea area a number of 40/50/60 m wind measurement masts have been installed by C-TECH / NEK Umwelttechnik AG in order to record the wind conditions for wind power projects. To reduce the uncertainty of the vertical wind profile above 40 m, in particular around hub height, the developers are carrying out LIDAR campaigns alongside the installed masts. This report outlines the LIDAR measurements at Mihai Viteazu which have been carried out between the 11th of June and the 9th of July 2008.
2. The measurement site
The measurement site was located on a smooth hill northwest of the village of Mihai Viteazu at an altitude of 163 m above sea level. Tab. 1 lists the coordinates of the LIDAR and the 40 m mast 116 m apart from another. Fig. 1 shows an overview of the area.
Table 1 Coordinates of the LIDAR and 40 m mast Mihai Viteazu
Mihai Viteazu coordinates (UTM WGS 84, zone 35) altitude
LIDAR 628'660 / 4'946'693 163 masl
40 m mast 628'712 / 4'946'589 163 masl
Fig.1. Overview of the measurement area near Mihai Viteazu village.
Study of wind energy [...] using remote sensing techniques LIDAR in DOBROGEA 113
3. The measurement campaign 3.1. LIDAR configuration
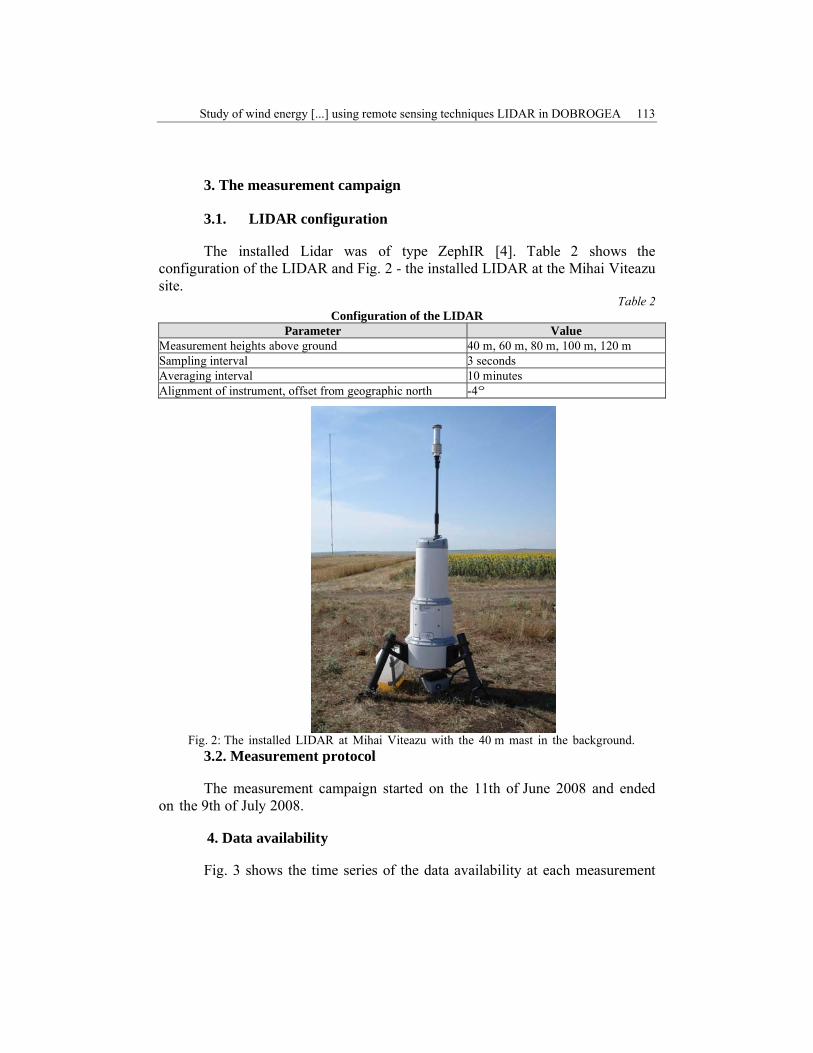
The installed Lidar was of type ZephIR [4]. Table 2 shows the configuration of the LIDAR and Fig. 2 - the installed LIDAR at the Mihai Viteazu site.
Table 2 Configuration of the LIDAR
Parameter Value Measurement heights above ground 40 m, 60 m, 80 m, 100 m, 120 m Sampling interval 3 seconds Averaging interval 10 minutes Alignment of instrument, offset from geographic north -4°
Fig. 2: The installed LIDAR at Mihai Viteazu with the 40 m mast in the background.
3.2. Measurement protocol
The measurement campaign started on the 11th of June 2008 and ended on the 9th of July 2008.
4. Data availability
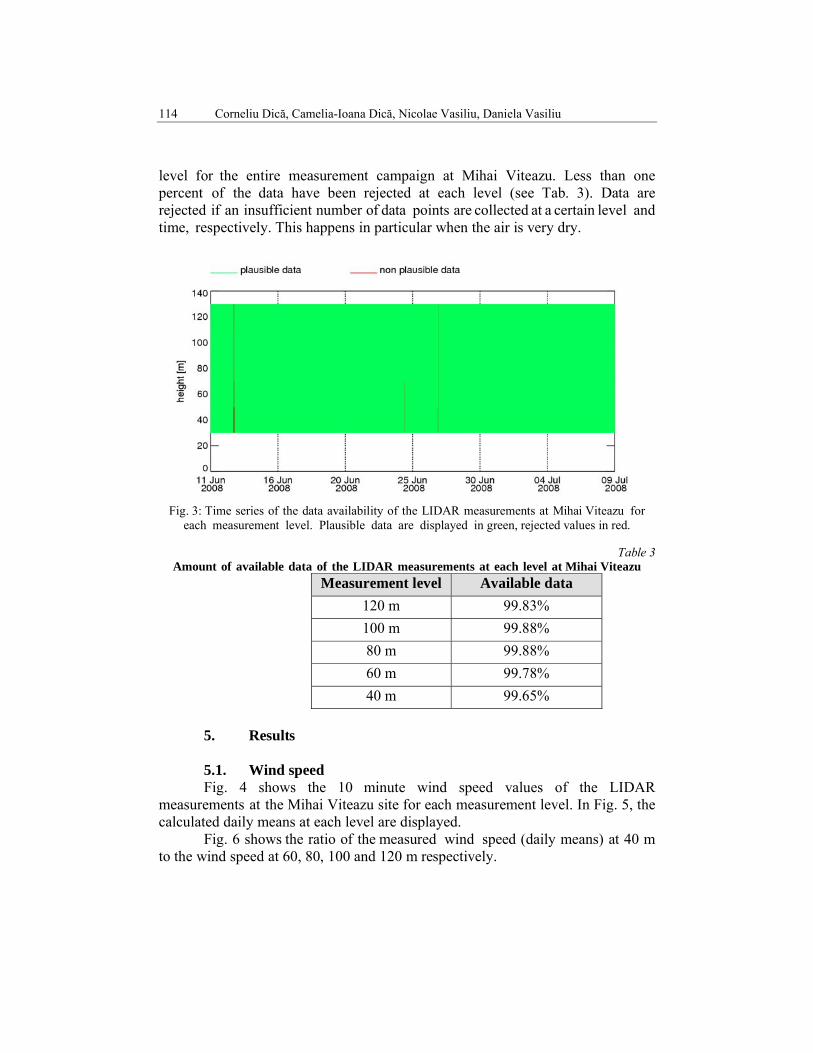
Fig. 3 shows the time series of the data availability at each measurement
114 Corneliu Dică, Camelia-Ioana Dică, Nicolae Vasiliu, Daniela Vasiliu
level for the entire measurement campaign at Mihai Viteazu. Less than one percent of the data have been rejected at each level (see Tab. 3). Data are rejected if an insufficient number of data points are collected at a certain level and time, respectively. This happens in particular when the air is very dry.
Fig. 3: Time series of the data availability of the LIDAR measurements at Mihai Viteazu for
each measurement level. Plausible data are displayed in green, rejected values in red.
Table 3 Amount of available data of the LIDAR measurements at each level at Mihai Viteazu
Measurement level Available data 120 m 99.83% 100 m 99.88% 80 m 99.88% 60 m 99.78% 40 m 99.65%
5. Results 5.1. Wind speed Fig. 4 shows the 10 minute wind speed values of the LIDAR
measurements at the Mihai Viteazu site for each measurement level. In Fig. 5, the calculated daily means at each level are displayed.
Fig. 6 shows the ratio of the measured wind speed (daily means) at 40 m to the wind speed at 60, 80, 100 and 120 m respectively.

Study of wind energy [...] using remote sensing techniques LIDAR in DOBROGEA 115
Fig. 4: The 10 minute wind speed of the LIDAR measurements at Mihai Viteazu at 40, 60, 80,
100 and 120 m above ground.
Fig. 5: The daily mean wind speed of the LIDAR measurements at Mihai Viteazu at 40, 60, 80,
100 and 120 m above ground.
Fig. 6: The ratio of the daily mean wind speed at 40 m above ground to the wind
speed at 60, 80, 100 and 120 m respectively.
5.2. Wind roses / turbulence roses Fig. 7 shows wind roses and turbulence roses for each measurement

116 Corneliu Dică, Camelia-Ioana Dică, Nicolae Vasiliu, Daniela Vasiliu
level. During the measurement campaign, winds from north-northwest and south-southeast were prevailing.
Fig. 7: Left: Wind roses of the LIDAR measurement at Mihai Viteazu at 40, 60, 80, 100 and 120 m above ground.
Right: Turbulence roses at 40, 60, 80, 100 and 120 m above ground.
The calculation of the turbulence intensity has only been carried out for wind speeds greater than 4 m/s. Sectors with less than 50 valid values are not considered.

Study of wind energy [...] using remote sensing techniques LIDAR in DOBROGEA 117
5.3. Vertical profiles of wind speed Fig. 8 shows the vertical profiles of wind speed scaled to 40 m in 30°
wind direction sectors.
Fig. 8: Vertical profiles of wind speed for 30° wind direction sectors, scaled to 40 m at the
LIDAR measurement site Mihai Viteazu. The bars indicate the standard deviation. In the center the wind rose at 40 m is displayed. Sectors with less than 50 valid values are not considered. Fig. 9, Fig. 10 and Fig. 11 show the vertical profiles of wind speed scaled to 40 m for the main wind directions north, west and south for different wind speeds as well as the statistical mean errors of the profiles. Due to rare occurrence of Easter winds, those vertical profiles of the wind speed are not shown.

118 Corneliu Dică, Camelia-Ioana Dică, Nicolae Vasiliu, Daniela Vasiliu
Fig. 9: Vertical profile of the wind speed for the main wind directions north for different wind
speeds (left) and the mean error of the profile (right).
Fig. 10: Vertical profile of wind speed for the main wind direction south for different wind
speeds (left) and the mean error of the profile (right).
5.4. Vertical profiles of turbulence Fig. 11 shows vertical profiles of the turbulence intensity at Mihai
Viteazu. Turbulence intensity was calculated only for wind speed greater than 4 m/s. No turbulence was calculated for sectors/levels with less than ten valid 10 minute values.

Study of wind energy [...] using remote sensing techniques LIDAR in DOBROGEA 119
Fig. 11: Vertical profiles of turbulence intensity for 30° wind direction sectors
at the LIDAR measurement site Mihai Viteazu. (bars indicate the standard deviation; in the center the wind rose at 40 m is displayed)
6. Conclusions
The vertical wind gradient varied over the course of the year. Large scale weather systems are more pronounced in winter than in summer, and henceforth the geotropic wind is weaker during summer compared to winter. Consequently, the low-level winds are higher during winter, resulting in a stronger vertical wind shear in winter.
The LIDAR measurement period (11.06.08 - 09.07.08) coincided with a period of low wind speed, and therefore probably lead to an underestimation of the vertical gradient. So are, for example, the vertical (standard) gradients

120 Corneliu Dică, Camelia-Ioana Dică, Nicolae Vasiliu, Daniela Vasiliu
modelled by WindSim and WAsP stronger than the ones obtained with the LIDAR measurements. We therefore expect that the use of the profiles presented in this Section tends to underestimate the actual annual average wind speed at hub height and subsequently the energy yield of the park. On the contrary, turbulence can be expected to be lower in times with slow wind speeds, so that turbulence intensity might be underestimated in our calculations.
The measurement campaign with ZephIR LIDAR came up with a remarkable data availability of better then demanded value of 90%. The deviations between LIDAR wind speeds and cup anemometers wind speed were less than 3%. The results returned from this study have shown that the QuinetiQ LIDAR system is capable of returning good quality results, useful in the energy market predictions [12].
R E F E R E N C E S
[1] S. Bourgeois, R. Cattin, I. Locker, H. Winkelmeier, Analysis of vertical wind profile at a BORA – dominated site in Bosnia based on SODAR and ZephIP LIDAR measurements, Deutsche WinGuard Consulting GmbH, February 2008.
[2] M. Courtney, I. Antoniou, Preliminary comparative ZephIR Lidar results to cup anemometer measurements., IEA meeting 51, Remote Sensing, Riso January 2007.
[3] D. Kindler – WINDTEST Kaiser-Wilhelm-Koog GmbH, Andy Oldroyd – Oldbaum Services Ltd, On-and Offshore Assessment of the ZephIR Wind-LIDAR, 51st Topical Expert Meeting on Remote Sensing, RISO January 2007.
[4] ***, Evaluation of ZephIR, Internal Project, Deutsche WinGuard Consulting GmbH, 2008. [5]. A. Sood, K. Suselj, and D. Heinemann, “High resolution NWP weather forecasts in the marine
atmospheric boundary layer,” in Proceedings of EWEC 2007, Milan, Italy. [6]. S. Dierer, and T. de Paus, “Predicting Wind Speed for Wind Energy” in Progress of the
WINDENG Project, Wind Engineering“, Vol. 29, No. 5, 2005, pp. 393-408. [7] G., Giebel, “The State-of-the-Art in Short-term Prediction”, in Wind Integration Workshop,
University NSW, 2005. [8] G. Kariniotakis, “Next Generation Short-term Forecasting of Wind Power - Overview of the
Anemos Project”, in Proc. of the European Wind Energy Conference 2006, Athens, Greece. [9] U. Focken et al.,“Predicting Offshore Wind Power”, University of Oldenburg, 2003. [10] J. Tambke et al., “Wind Speed Forecasts for the North and Baltic Sea - Verification against
10m to 100m Observations”, Geophysical Research Abstracts, Vol. 7, 2005. [11] W. Hao et al., “Analysis of MM5 Simulations based on three PBL Schemes over the eastern
US for August 6 to 16, 2002”, NYSDEC-DAR, Albany, NY 12233, 2004. [12] S. Olaru, D. Dumur and I. Dumitrache,“On the Feasibility of constrained generalized
predictive Control“, U.P.B. Sci. Bull., Series C, Vol. 72, Iss. 4, 2010, ISSN 1454-234x.