Embed Size (px)
Citation preview

PUBLIC
Royal NLR – Netherlands Aerospace Centre
CUSTOMER: World Class Maintenance (WCM)
A Literature Survey on Remote Inspection of Offshore Wind Turbine Blades Automated Inspection and Repair of Turbine Blades (AIRTuB) - WP1
NLR-CR-2020-223 | May 2021
UNCLASSIFIED
EXECUTIVE SUMMARY
Problem area
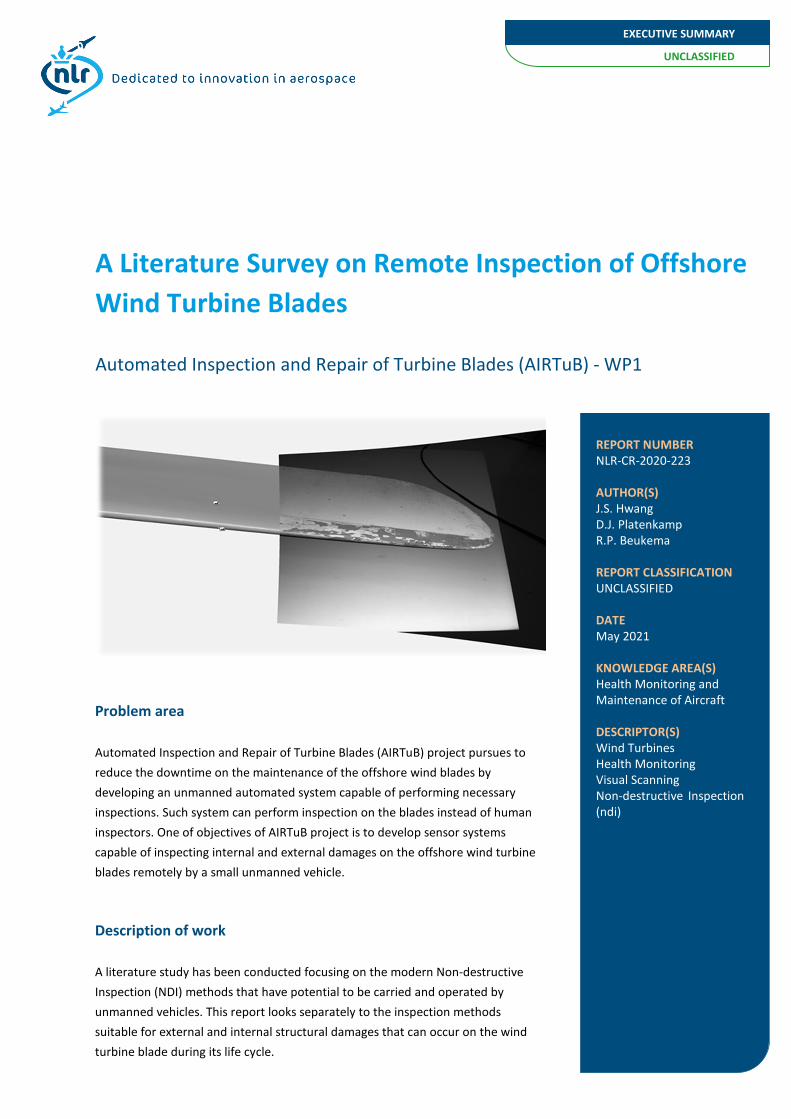
Automated Inspection and Repair of Turbine Blades (AIRTuB) project pursues to reduce the downtime on the maintenance of the offshore wind blades by developing an unmanned automated system capable of performing necessary inspections. Such system can perform inspection on the blades instead of human inspectors. One of objectives of AIRTuB project is to develop sensor systems capable of inspecting internal and external damages on the offshore wind turbine blades remotely by a small unmanned vehicle.
Description of work
A literature study has been conducted focusing on the modern Non-destructive Inspection (NDI) methods that have potential to be carried and operated by unmanned vehicles. This report looks separately to the inspection methods suitable for external and internal structural damages that can occur on the wind turbine blade during its life cycle.
A Literature Survey on Remote Inspection of Offshore Wind Turbine Blades
Automated Inspection and Repair of Turbine Blades (AIRTuB) - WP1
REPORT NUMBER NLR-CR-2020-223 AUTHOR(S) J.S. Hwang D.J. Platenkamp R.P. Beukema REPORT CLASSIFICATION UNCLASSIFIED DATE May 2021 KNOWLEDGE AREA(S) Health Monitoring and Maintenance of Aircraft DESCRIPTOR(S) Wind Turbines Health Monitoring Visual Scanning Non-destructive Inspection (ndi)
UNCLASSIFIED
EXECUTIVE SUMMARY
Royal NLR
Anthony Fokkerweg 2
1059 CM Amsterdam, The Netherlands
p ) +31 88 511 3113
e ) [email protected] i ) www.nlr.nl
Results and conclusions
The external damages, especially erosion on the leading edge on the wind blade surface, can have deteriorating effect on the efficiency of the wind turbine. In order to assess the severity of the erosion, 3D visual imagery of the damage is essential for automated inspection and repair. Considering the methods that have been explored in this study, such as photogrammetry, structured light and multispectral imaging, the triangulation based laser 3D shape sensing seems the best suitable method. This conclusion is made based on the fact that this method is less dependent on the visually recognizable features on the wind blades to stitch the data together. However, this can only be achieved if the position and orientation of the sensor is known for each measurement points. Assuming that the drone will perform steady and linear flight along the spanwise direction of a wind blade with a fixed distance from, it may suffice to know the exact position of the drone from an initial measurement point and to record velocity of the drone. Other approach may be to have a LIDAR system onboard, which can be used to determine relative position of the drone with respect to the wind blade at each measurement. Internal structural damage modes in a wind turbine blade caused by in-service events (e.g. bird strikes or overspeed) can be categorized into seven different groups (for example: adhesive joint failure between skins and sandwich panel face/core debonding). Especially if the damage has occurred in a primary structure, it is important to evaluate and repair the damage if necessary. The ultrasonic-based NDI methods is found to be the most practical approach in terms of miniaturization possibilities and damage detection possibilities in thick composite material. Phased array ultrasonic inspection method, especially in the form of array integrated in a wheel, may provide practical solution. Furthermore, there are many developments in the field of data processing and presenting from the phased array inspection, such as full matrix capture and total focusing methods, which can be added value to take into account in the further developments in the AIRTuB project.
Applicability
The results from this study provides a starting point for the further development of drone-based automated inspection system for the off-shore wind turbine blades.
PUBLIC
Royal NLR – Netherlands Aerospace Centre
AUTHOR(S):
J.S. Hwang NLR D.J. Platenkamp NLR R.P. Beukema NLR
A Literature Survey on Remote Inspection of Offshore Wind Turbine Blades Automated Inspection and Repair of Turbine Blades (AIRTuB) - WP1
NLR-CR-2020-223 | May 2021
CUSTOMER: World Class Maintenance (WCM)
2
NLR-CR-2020-223 | May 2021
--
The project is executed with subsidy from Topsector Energy part of Ministry of Economic Affairs.
APPROVED BY: Date
AUTHOR J.S. Hwang 30-04-2021
REVIEWER H.P. Jansen 30-04-2021
MANAGING DEPARTMENT M.J. Bos 30-04-2021
CUSTOMER World Class Maintenance (WCM)
CONTRACT NUMBER -----
OWNER NLR
DIVISION NLR Aerospace Vehicles
DISTRIBUTION Unlimited
CLASSIFICATION OF TITLE UNCLASSIFIED
The owner and/or contractor have granted permission to publish this report.
Content of this report may be cited on the condition that full credit is given to the owner and/or contractor. Commercial use of this report is prohibited without the prior written permission of the owner and/or contractor.
3
NLR-CR-2020-223 | May 2021
Summary
Automated Inspection and Repair of Turbine Blades (AIRTuB) project pursues to reduce the downtime on the maintenance of the offshore wind blades by developing an unmanned automated system capable of performing necessary inspections. Such system can perform inspection on the blades instead of human inspectors. One of objectives of AIRTuB project is to develop sensor systems able to inspect internal and external damages on the offshore wind turbine blades remotely and autonomously. From this objective, a literature study has been conducted focusing on the modern Non-Destructive Inspection (NDI) methods that have potential to be carried and operated by unmanned vehicles. This report looks separately to the inspection methods suitable for external and internal structural damages that can occur on the wind turbine blade during its life cycle. The external damages on the wind blade surface can have deteriorating effect on the efficiency. External damage mode in this context is erosion on the outer surface of the wind blade on the coating. Even though some commercially available drone solutions are available designed to detect external defects on the blade surface, these systems are limited to high-definition camera providing no information on depth or location. One of the ambition in AIRTuB project is to be able to repair damages on the wind blade remotely and autonomously. Therefore, information about the location, severity and shape of the erosion is essential. 3D imaging solution can provide that information. Considering the methods that have been explored in this study, such as photogrammetry, structured light and multispectral imaging, the triangulation based laser 3D shape sensing seems the best suitable method. This conclusion is made based on the fact that this method is less dependent on the visually recognizable features on the wind blades to stitch the data together. However, this can only be achieved if the position and orientation of the sensor is known for each measurement points. Assuming that the drone will perform steady and linear flight along the spanwise direction of a wind blade with a fixed distance from, it may suffice to know the exact position of the drone from an initial measurement point and to record velocity of the drone. Other approach may be to have a LIDAR system onboard, which can be used to determine relative position of the drone with respect to the wind blade at each measurement. Internal structural damage modes in a wind turbine blade caused by in-service events (e.g. bird strikes or overspeed) can be categorized into seven different groups (for example: adhesive joint failure between skins and sandwich panel face/core debonding). Especially if the damage has occurred in a primary structure, it is important to evaluate and repair the damage if necessary. Moreover, the efficiency of a wind turbine can even be optimized if the design philosophy transitions from safe-life (currently used design philosophy) towards damage-tolerance design principle (aerospace design philosophy). In order to realize this transition, non-destructive inspection is a key to this. From the literature study, few potential NDI techniques are determined that can find one or more damage modes. However, there is no one NDI technique that can cover all damage modes. The ultrasonic-based NDI methods is found to be the most practical approach in terms of miniaturization possibilities and damage detection possibilities in thick composite material. Phased array ultrasonic inspection method, especially in the form of array integrated in a wheel, may provide practical solution. Wheel probe can cover large area in a rolling motion, suitable to a large area of wind turbine blade. Furthermore, there are many developments in the field of data processing and presenting from the phased array inspection, such as full matrix capture and total focusing methods, which can be added value to take into account in the further developments in the AIRTuB project.
4
NLR-CR-2020-223 | May 2021
Contents Abbreviations 5
1 Introduction 6
2 Wind Turbine Rotor Blade 8 2.1 Description of Wind Turbine Rotor Blade Structure 8
2.1.1 Material 8 2.1.2 Coating 9 2.1.3 Outer Structure 10 2.1.4 Inner Structure 11 2.1.5 Design Philosophy Transition 12
2.2 External Surface Damage 13 2.3 Internal Damage Modes 17
3 Surface Damage Detection Techniques 22 3.1 Passive 3D Imaging 24 3.2 Active 3D Imaging by Structured Light 26 3.3 Triangulation based Laser Scanner 29 3.4 Phase Shift Based Laser Scanner 31 3.5 Time of Flight based Laser Scanner 31 3.6 Spectral Imaging 34 3.7 Concluding Remarks 37
4 Internal Damage Detection Techniques 39 4.1 NLR Project “Evaluation of Non-Destructive Inspection Methods” 39
4.1.1 Vibration Analysis 41 4.1.2 Mechanical Impedance and Sonic Testing 41 4.1.3 Ultrasonic Inspection 42 4.1.4 Thermography Inspections 45 4.1.5 Overall Conclusion NLR Project 46
4.2 Sandia Project “Development and Assessment of Advanced Inspection Methods for Wind Turbine Blades” 47 4.2.1 Microwave Technique 48 4.2.2 Phased/Linear Array Ultrasonics 50 4.2.3 Air Coupled Ultrasonic 55 4.2.4 Pulsed Thermography 56 4.2.5 Overall Conclusion Sandia Project 58
4.3 Full Matrix Capture and Reconstruction Algorithms 58 4.3.1 FMC/TFM on Metal Isotropic Material 59 4.3.2 FMC/TFM on CFRP Anisotropic Material 62 4.3.3 Overall Conclusion FMC/TFM 65
4.4 Conclusion 65
5 Conclusions 67
6 References 68
5
NLR-CR-2020-223 | May 2021
Abbreviations
ACRONYM DESCRIPTION
AEP Annual Energy Production
AWS American Welding Society
CD Drag Coëfficient
CL Lift Coëfficient
DAC Distance Amplitude Curve
FBH Flat Bottom Hole
FMC Full Matrix Capture
FOD Foreign Object Damage
FOI Foreign Object Impact
FOV Field of View
FSH Full Screen Height
GPS Global Positioning System
IRT Infrared Thermography
L-wave Longitudinal wave
MIA Mechanical Impedance Analysis
NDI Non-Destructive Inspection
NDT Non-Destructive Testing
NLR Royal NLR - Netherlands Aerospace Centre
OEM Original Equipment Manufacturer
PA Phased Array
PAUT Phased Array Ultrasonic Testing
RF Radio Frequency
SAFT Synthetic Aperture Focusing Technique
SDH Side Drilled Hole
SfM Structure from Motion
TCG Time Corrected Gain
TFM Total Focussing Method
ToF Time of Flight
TTU Through Transmission Ultrasonics
6
NLR-CR-2020-223 | May 2021
1 Introduction
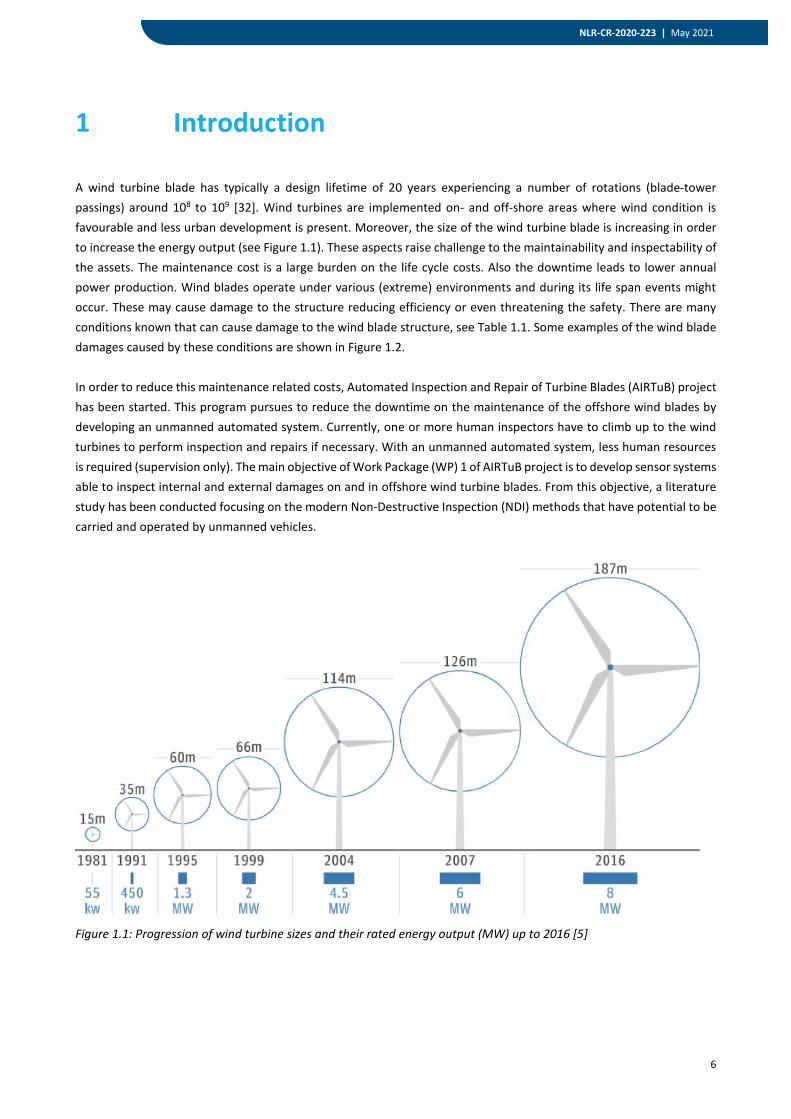
A wind turbine blade has typically a design lifetime of 20 years experiencing a number of rotations (blade-tower passings) around 108 to 109 [32]. Wind turbines are implemented on- and off-shore areas where wind condition is favourable and less urban development is present. Moreover, the size of the wind turbine blade is increasing in order to increase the energy output (see Figure 1.1). These aspects raise challenge to the maintainability and inspectability of the assets. The maintenance cost is a large burden on the life cycle costs. Also the downtime leads to lower annual power production. Wind blades operate under various (extreme) environments and during its life span events might occur. These may cause damage to the structure reducing efficiency or even threatening the safety. There are many conditions known that can cause damage to the wind blade structure, see Table 1.1. Some examples of the wind blade damages caused by these conditions are shown in Figure 1.2. In order to reduce this maintenance related costs, Automated Inspection and Repair of Turbine Blades (AIRTuB) project has been started. This program pursues to reduce the downtime on the maintenance of the offshore wind blades by developing an unmanned automated system. Currently, one or more human inspectors have to climb up to the wind turbines to perform inspection and repairs if necessary. With an unmanned automated system, less human resources is required (supervision only). The main objective of Work Package (WP) 1 of AIRTuB project is to develop sensor systems able to inspect internal and external damages on and in offshore wind turbine blades. From this objective, a literature study has been conducted focusing on the modern Non-Destructive Inspection (NDI) methods that have potential to be carried and operated by unmanned vehicles.
Figure 1.1: Progression of wind turbine sizes and their rated energy output (MW) up to 2016 [5]
7
NLR-CR-2020-223 | May 2021
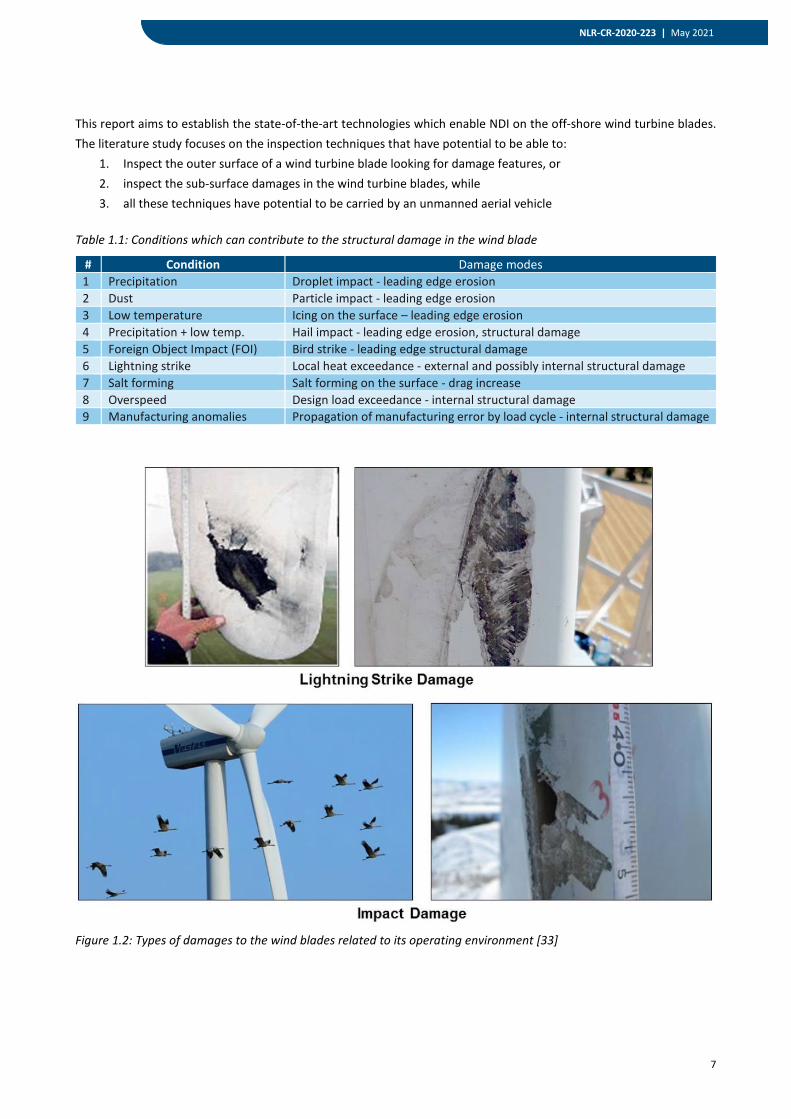
This report aims to establish the state-of-the-art technologies which enable NDI on the off-shore wind turbine blades. The literature study focuses on the inspection techniques that have potential to be able to:
1. Inspect the outer surface of a wind turbine blade looking for damage features, or 2. inspect the sub-surface damages in the wind turbine blades, while 3. all these techniques have potential to be carried by an unmanned aerial vehicle
Table 1.1: Conditions which can contribute to the structural damage in the wind blade
# Condition Damage modes 1 Precipitation Droplet impact - leading edge erosion 2 Dust Particle impact - leading edge erosion 3 Low temperature Icing on the surface – leading edge erosion 4 Precipitation + low temp. Hail impact - leading edge erosion, structural damage 5 Foreign Object Impact (FOI) Bird strike - leading edge structural damage 6 Lightning strike Local heat exceedance - external and possibly internal structural damage 7 Salt forming Salt forming on the surface - drag increase 8 Overspeed Design load exceedance - internal structural damage 9 Manufacturing anomalies Propagation of manufacturing error by load cycle - internal structural damage
Figure 1.2: Types of damages to the wind blades related to its operating environment [33]
8
NLR-CR-2020-223 | May 2021
2 Wind Turbine Rotor Blade
This chapter gives an overview on the design and damage modes that can be expected from a modern large-scale wind turbine rotor blade. Section 2.1 describes briefly about the structure of typical wind turbine blades. Section 2.2 and 2.3 provide overviews of external and internal wind turbine blade damage modes respectively.
2.1 Description of Wind Turbine Rotor Blade Structure
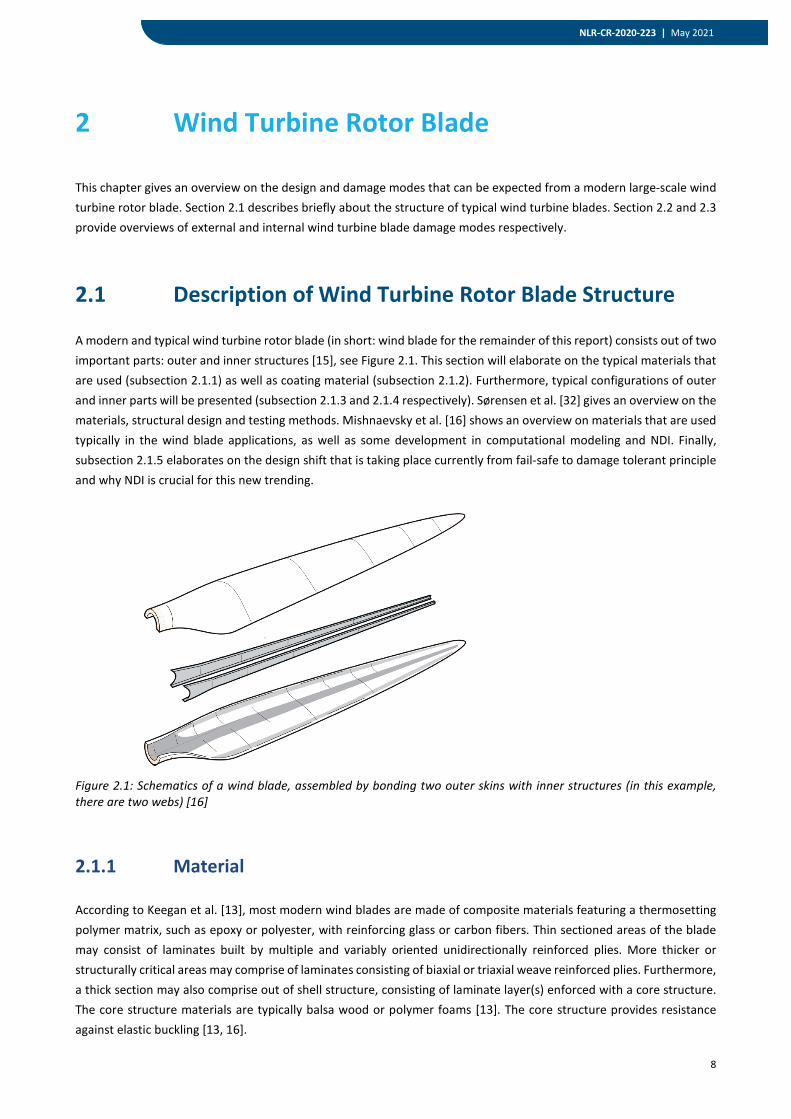
A modern and typical wind turbine rotor blade (in short: wind blade for the remainder of this report) consists out of two important parts: outer and inner structures [15], see Figure 2.1. This section will elaborate on the typical materials that are used (subsection 2.1.1) as well as coating material (subsection 2.1.2). Furthermore, typical configurations of outer and inner parts will be presented (subsection 2.1.3 and 2.1.4 respectively). Sørensen et al. [32] gives an overview on the materials, structural design and testing methods. Mishnaevsky et al. [16] shows an overview on materials that are used typically in the wind blade applications, as well as some development in computational modeling and NDI. Finally, subsection 2.1.5 elaborates on the design shift that is taking place currently from fail-safe to damage tolerant principle and why NDI is crucial for this new trending.
Figure 2.1: Schematics of a wind blade, assembled by bonding two outer skins with inner structures (in this example, there are two webs) [16]
2.1.1 Material
According to Keegan et al. [13], most modern wind blades are made of composite materials featuring a thermosetting polymer matrix, such as epoxy or polyester, with reinforcing glass or carbon fibers. Thin sectioned areas of the blade may consist of laminates built by multiple and variably oriented unidirectionally reinforced plies. More thicker or structurally critical areas may comprise of laminates consisting of biaxial or triaxial weave reinforced plies. Furthermore, a thick section may also comprise out of shell structure, consisting of laminate layer(s) enforced with a core structure. The core structure materials are typically balsa wood or polymer foams [13]. The core structure provides resistance against elastic buckling [13, 16].
9
NLR-CR-2020-223 | May 2021
Figure 2.2: A typical cross section of an adhesively bonded composite blade [12] (The figure is edited to show relevant information only)
2.1.2 Coating
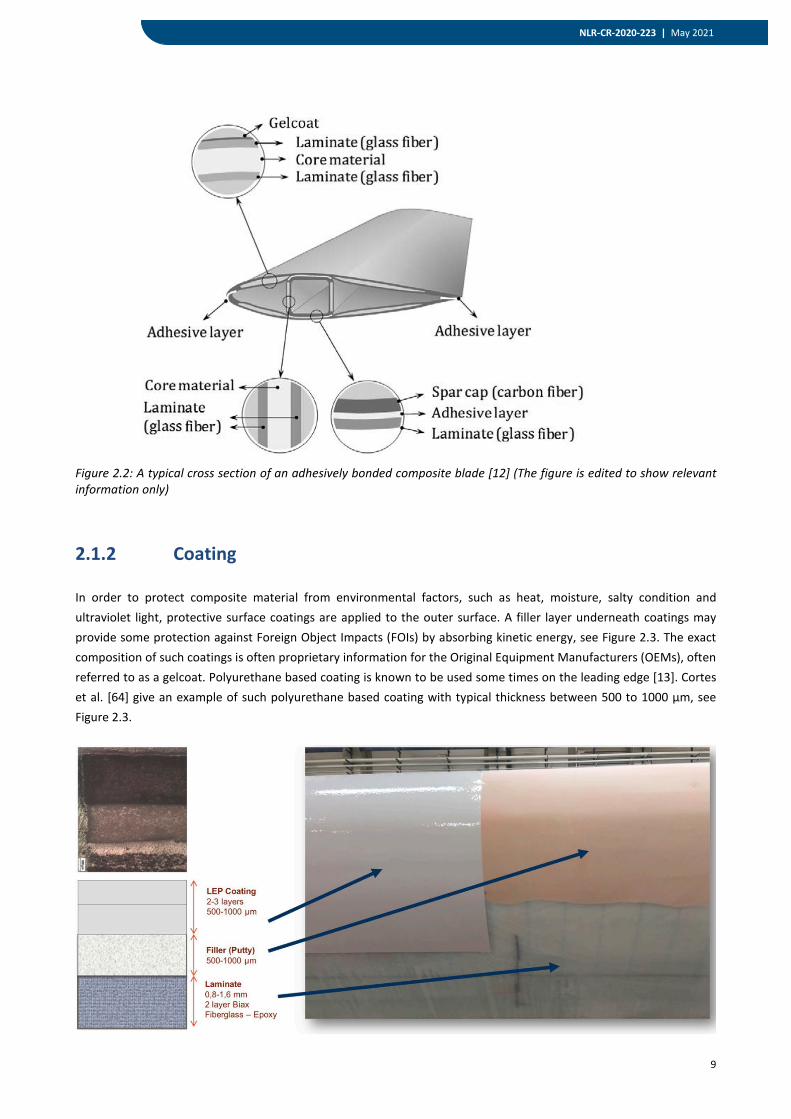
In order to protect composite material from environmental factors, such as heat, moisture, salty condition and ultraviolet light, protective surface coatings are applied to the outer surface. A filler layer underneath coatings may provide some protection against Foreign Object Impacts (FOIs) by absorbing kinetic energy, see Figure 2.3. The exact composition of such coatings is often proprietary information for the Original Equipment Manufacturers (OEMs), often referred to as a gelcoat. Polyurethane based coating is known to be used some times on the leading edge [13]. Cortes et al. [64] give an example of such polyurethane based coating with typical thickness between 500 to 1000 µm, see Figure 2.3.
10
NLR-CR-2020-223 | May 2021
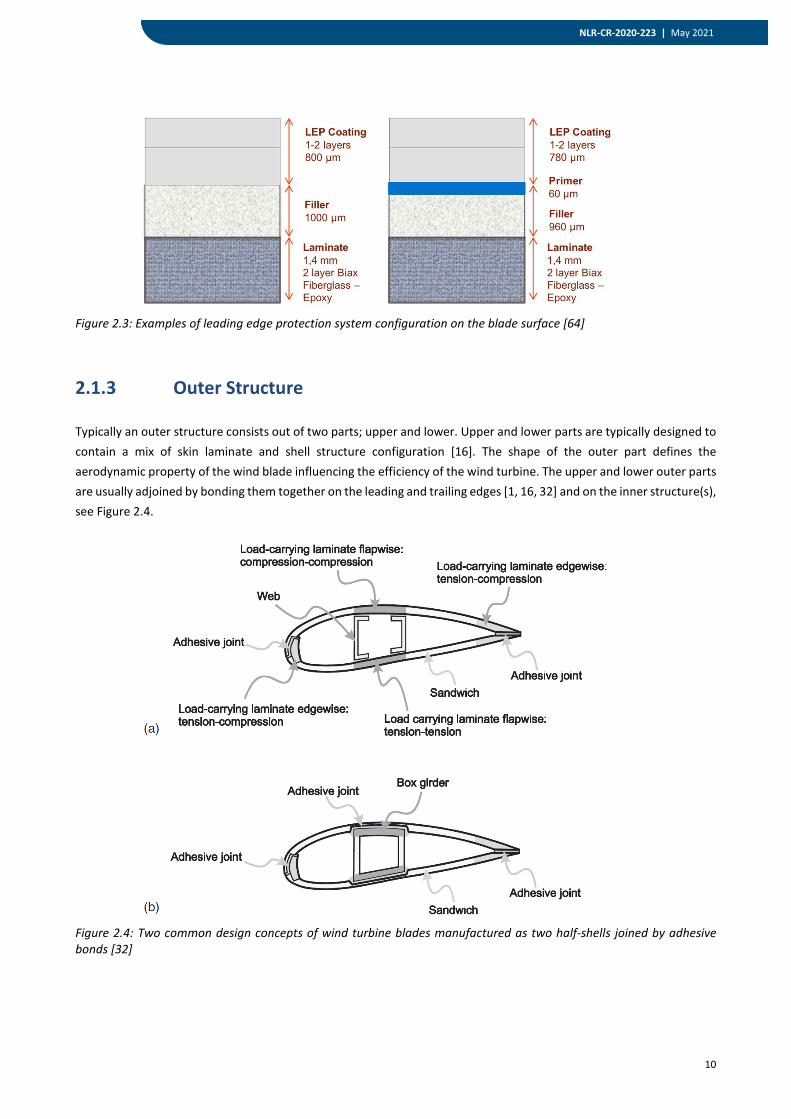
Figure 2.3: Examples of leading edge protection system configuration on the blade surface [64]
2.1.3 Outer Structure
Typically an outer structure consists out of two parts; upper and lower. Upper and lower parts are typically designed to contain a mix of skin laminate and shell structure configuration [16]. The shape of the outer part defines the aerodynamic property of the wind blade influencing the efficiency of the wind turbine. The upper and lower outer parts are usually adjoined by bonding them together on the leading and trailing edges [1, 16, 32] and on the inner structure(s), see Figure 2.4.
Figure 2.4: Two common design concepts of wind turbine blades manufactured as two half-shells joined by adhesive bonds [32]
11
NLR-CR-2020-223 | May 2021
2.1.4 Inner Structure
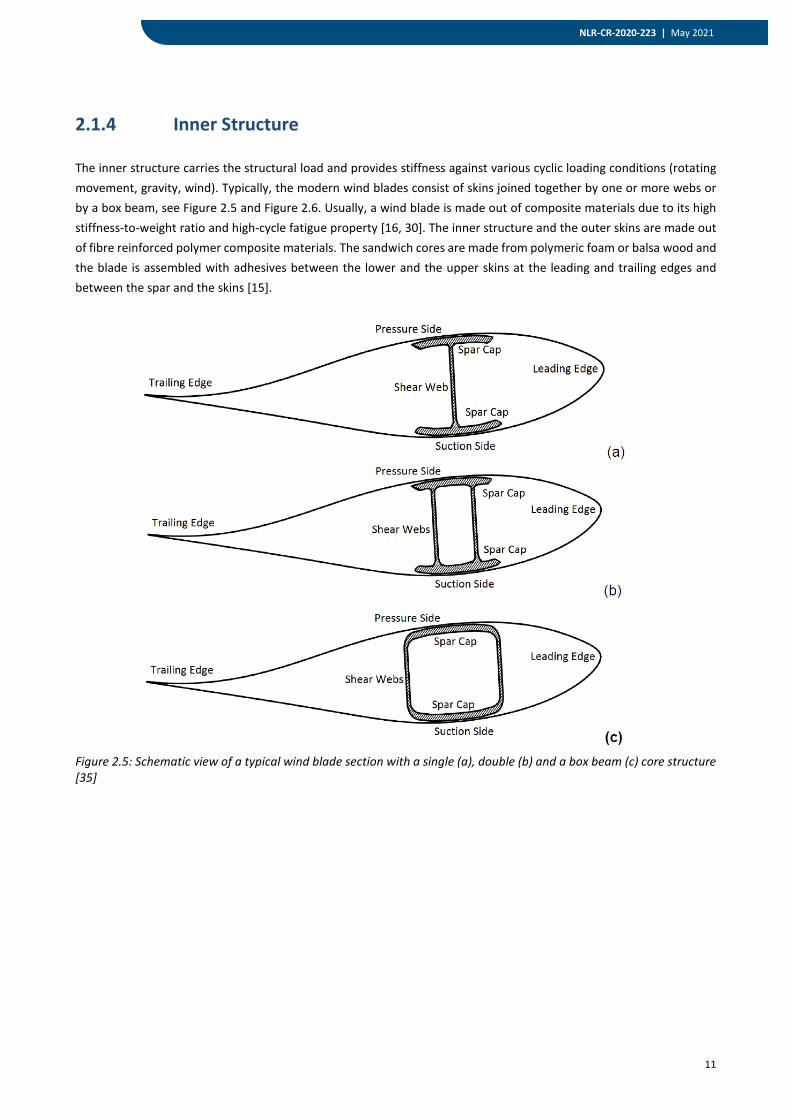
The inner structure carries the structural load and provides stiffness against various cyclic loading conditions (rotating movement, gravity, wind). Typically, the modern wind blades consist of skins joined together by one or more webs or by a box beam, see Figure 2.5 and Figure 2.6. Usually, a wind blade is made out of composite materials due to its high stiffness-to-weight ratio and high-cycle fatigue property [16, 30]. The inner structure and the outer skins are made out of fibre reinforced polymer composite materials. The sandwich cores are made from polymeric foam or balsa wood and the blade is assembled with adhesives between the lower and the upper skins at the leading and trailing edges and between the spar and the skins [15].
Figure 2.5: Schematic view of a typical wind blade section with a single (a), double (b) and a box beam (c) core structure [35]
12
NLR-CR-2020-223 | May 2021
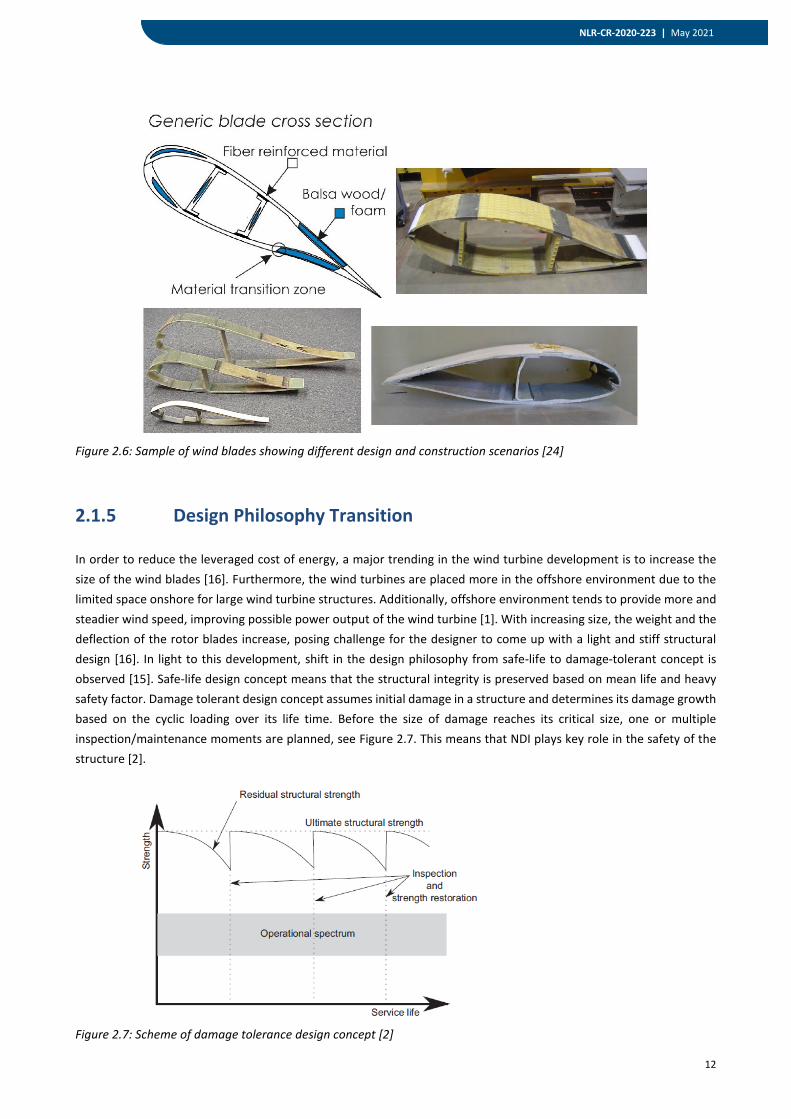
Figure 2.6: Sample of wind blades showing different design and construction scenarios [24]
2.1.5 Design Philosophy Transition
In order to reduce the leveraged cost of energy, a major trending in the wind turbine development is to increase the size of the wind blades [16]. Furthermore, the wind turbines are placed more in the offshore environment due to the limited space onshore for large wind turbine structures. Additionally, offshore environment tends to provide more and steadier wind speed, improving possible power output of the wind turbine [1]. With increasing size, the weight and the deflection of the rotor blades increase, posing challenge for the designer to come up with a light and stiff structural design [16]. In light to this development, shift in the design philosophy from safe-life to damage-tolerant concept is observed [15]. Safe-life design concept means that the structural integrity is preserved based on mean life and heavy safety factor. Damage tolerant design concept assumes initial damage in a structure and determines its damage growth based on the cyclic loading over its life time. Before the size of damage reaches its critical size, one or multiple inspection/maintenance moments are planned, see Figure 2.7. This means that NDI plays key role in the safety of the structure [2].
Figure 2.7: Scheme of damage tolerance design concept [2]
13
NLR-CR-2020-223 | May 2021
McGugan et al. [15] gives an extensive motivation why damage tolerance design philosophy is applied in the wind blade and how maintenance concept is shifting from preventive to condition based maintenance.
2.2 External Surface Damage
During the life time span of an off-shore wind blade operation, (off-shore) wind blade will experience various environmental conditions; temperature, moisture, salt spray, lightning strike and FOI (see Chapter 1). These elements may cause both external and internal damages in the wind blade structure. This section will elaborate on the external damage modes. Internal damage modes will be elaborated in Section 2.3. External damage mode in this context is meant to be any damage on the outer surface of the wind blade on the coating and/or sub-surface skin. Coating or skin may erode due to the atmospheric and environmental conditions. In the remainder of this report, this external damage mode will be called erosion. Erosion of a wind blade may affect the aerodynamic property degrading the efficiency of the wind turbine. There are studies known showing the efficiency degradation due to the erosions, see [6]. Furthermore, accreted contaminations on the blade surface (i.e. bugs, birds, dirt, etc.) may also reduce the effectivity of the wind blades especially in the high speed rotor tip essential to the optimal energy capture [26]. Nijssen and Manrique [65] concludes after a literature study on non-structural damages on wind blades that when more than 400 pits, size above 0.3 mm depth and larger than 2 mm diameter, over a span of 2.5 m will affect Annual Energy Production (AEP) of around 3%. Table 2.1: Three coating erosion modes with depth and size [6]. The given size and depth are arbitrarily chosen by the author, thus this is merely an indicative impression of the erosion modes
Erosion mode Depth (mm) Size (mm) Pits 0.1 – 0.3 0.5 – 4 Gauges 0.3 – 0.8 10 - 40
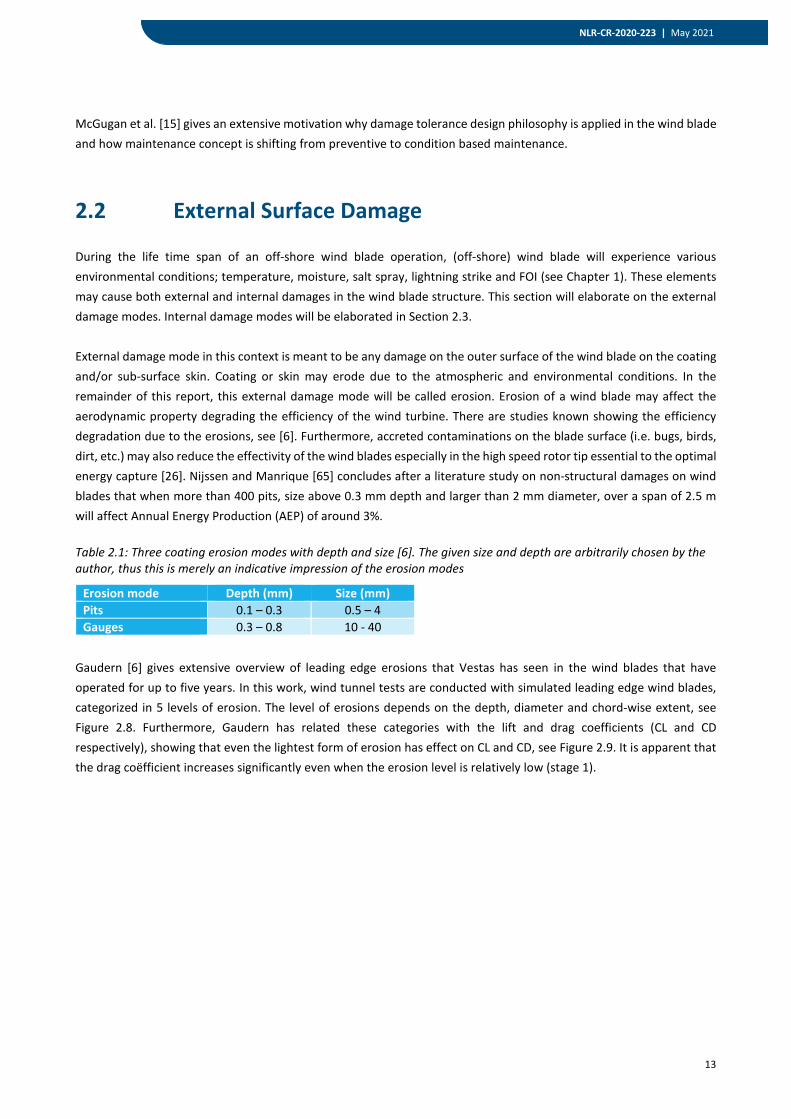
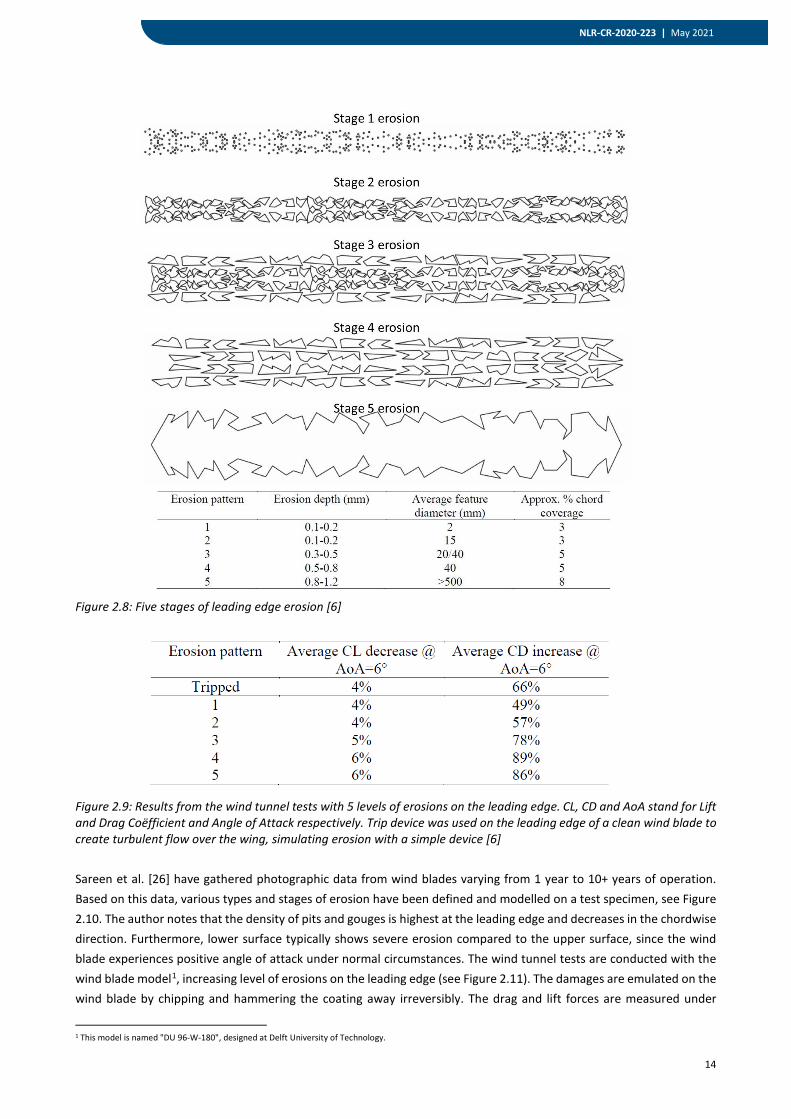
Gaudern [6] gives extensive overview of leading edge erosions that Vestas has seen in the wind blades that have operated for up to five years. In this work, wind tunnel tests are conducted with simulated leading edge wind blades, categorized in 5 levels of erosion. The level of erosions depends on the depth, diameter and chord-wise extent, see Figure 2.8. Furthermore, Gaudern has related these categories with the lift and drag coefficients (CL and CD respectively), showing that even the lightest form of erosion has effect on CL and CD, see Figure 2.9. It is apparent that the drag coëfficient increases significantly even when the erosion level is relatively low (stage 1).
14
NLR-CR-2020-223 | May 2021
Figure 2.8: Five stages of leading edge erosion [6]
Figure 2.9: Results from the wind tunnel tests with 5 levels of erosions on the leading edge. CL, CD and AoA stand for Lift and Drag Coëfficient and Angle of Attack respectively. Trip device was used on the leading edge of a clean wind blade to create turbulent flow over the wing, simulating erosion with a simple device [6] Sareen et al. [26] have gathered photographic data from wind blades varying from 1 year to 10+ years of operation. Based on this data, various types and stages of erosion have been defined and modelled on a test specimen, see Figure 2.10. The author notes that the density of pits and gouges is highest at the leading edge and decreases in the chordwise direction. Furthermore, lower surface typically shows severe erosion compared to the upper surface, since the wind blade experiences positive angle of attack under normal circumstances. The wind tunnel tests are conducted with the wind blade model1, increasing level of erosions on the leading edge (see Figure 2.11). The damages are emulated on the wind blade by chipping and hammering the coating away irreversibly. The drag and lift forces are measured under
1 This model is named "DU 96-W-180", designed at Delft University of Technology.
15
NLR-CR-2020-223 | May 2021
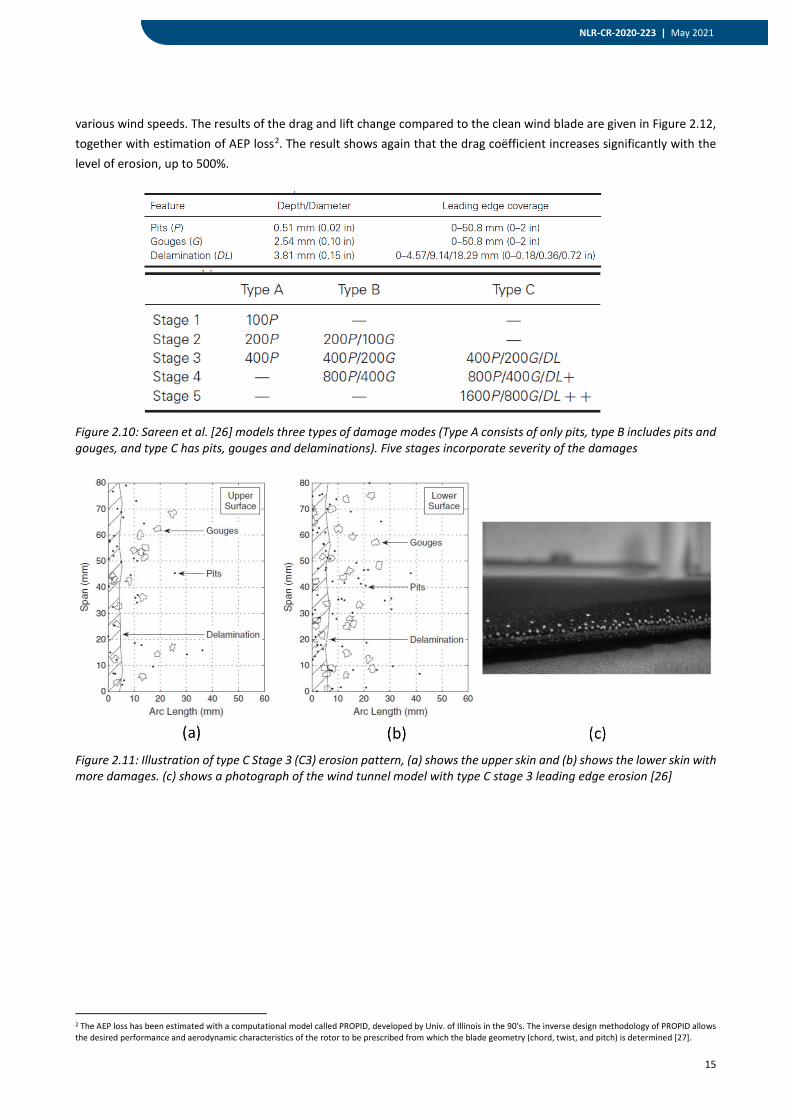
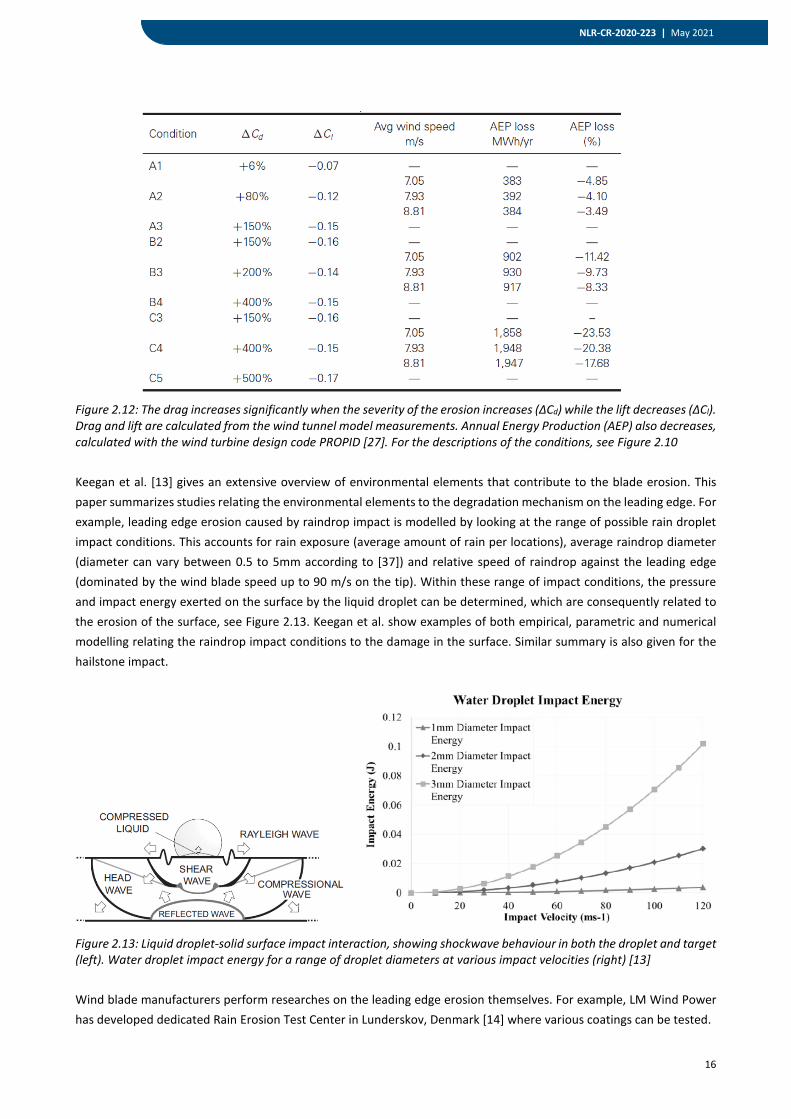
various wind speeds. The results of the drag and lift change compared to the clean wind blade are given in Figure 2.12, together with estimation of AEP loss2. The result shows again that the drag coëfficient increases significantly with the level of erosion, up to 500%.
Figure 2.10: Sareen et al. [26] models three types of damage modes (Type A consists of only pits, type B includes pits and gouges, and type C has pits, gouges and delaminations). Five stages incorporate severity of the damages
Figure 2.11: Illustration of type C Stage 3 (C3) erosion pattern, (a) shows the upper skin and (b) shows the lower skin with more damages. (c) shows a photograph of the wind tunnel model with type C stage 3 leading edge erosion [26]
2 The AEP loss has been estimated with a computational model called PROPID, developed by Univ. of Illinois in the 90's. The inverse design methodology of PROPID allows the desired performance and aerodynamic characteristics of the rotor to be prescribed from which the blade geometry (chord, twist, and pitch) is determined [27].
16
NLR-CR-2020-223 | May 2021
Figure 2.12: The drag increases significantly when the severity of the erosion increases (ΔCd) while the lift decreases (ΔCl). Drag and lift are calculated from the wind tunnel model measurements. Annual Energy Production (AEP) also decreases, calculated with the wind turbine design code PROPID [27]. For the descriptions of the conditions, see Figure 2.10 Keegan et al. [13] gives an extensive overview of environmental elements that contribute to the blade erosion. This paper summarizes studies relating the environmental elements to the degradation mechanism on the leading edge. For example, leading edge erosion caused by raindrop impact is modelled by looking at the range of possible rain droplet impact conditions. This accounts for rain exposure (average amount of rain per locations), average raindrop diameter (diameter can vary between 0.5 to 5mm according to [37]) and relative speed of raindrop against the leading edge (dominated by the wind blade speed up to 90 m/s on the tip). Within these range of impact conditions, the pressure and impact energy exerted on the surface by the liquid droplet can be determined, which are consequently related to the erosion of the surface, see Figure 2.13. Keegan et al. show examples of both empirical, parametric and numerical modelling relating the raindrop impact conditions to the damage in the surface. Similar summary is also given for the hailstone impact.
Figure 2.13: Liquid droplet-solid surface impact interaction, showing shockwave behaviour in both the droplet and target (left). Water droplet impact energy for a range of droplet diameters at various impact velocities (right) [13] Wind blade manufacturers perform researches on the leading edge erosion themselves. For example, LM Wind Power has developed dedicated Rain Erosion Test Center in Lunderskov, Denmark [14] where various coatings can be tested.
17
NLR-CR-2020-223 | May 2021
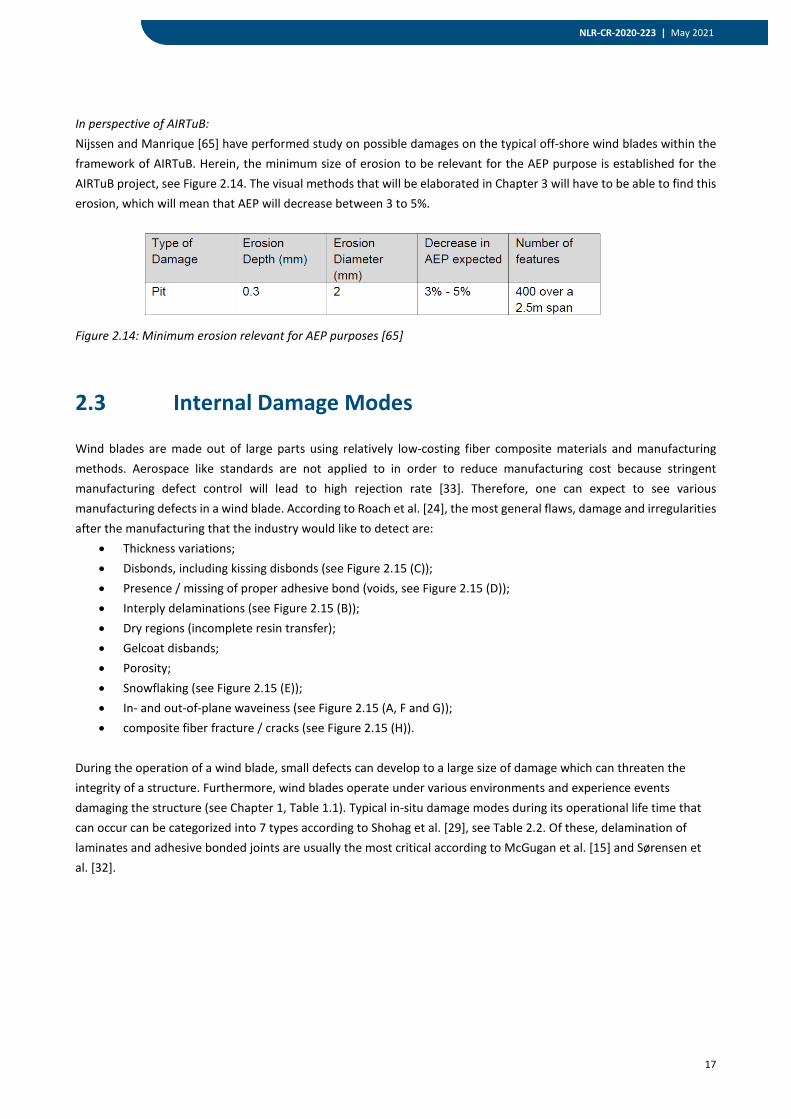
In perspective of AIRTuB: Nijssen and Manrique [65] have performed study on possible damages on the typical off-shore wind blades within the framework of AIRTuB. Herein, the minimum size of erosion to be relevant for the AEP purpose is established for the AIRTuB project, see Figure 2.14. The visual methods that will be elaborated in Chapter 3 will have to be able to find this erosion, which will mean that AEP will decrease between 3 to 5%.
Figure 2.14: Minimum erosion relevant for AEP purposes [65]
2.3 Internal Damage Modes
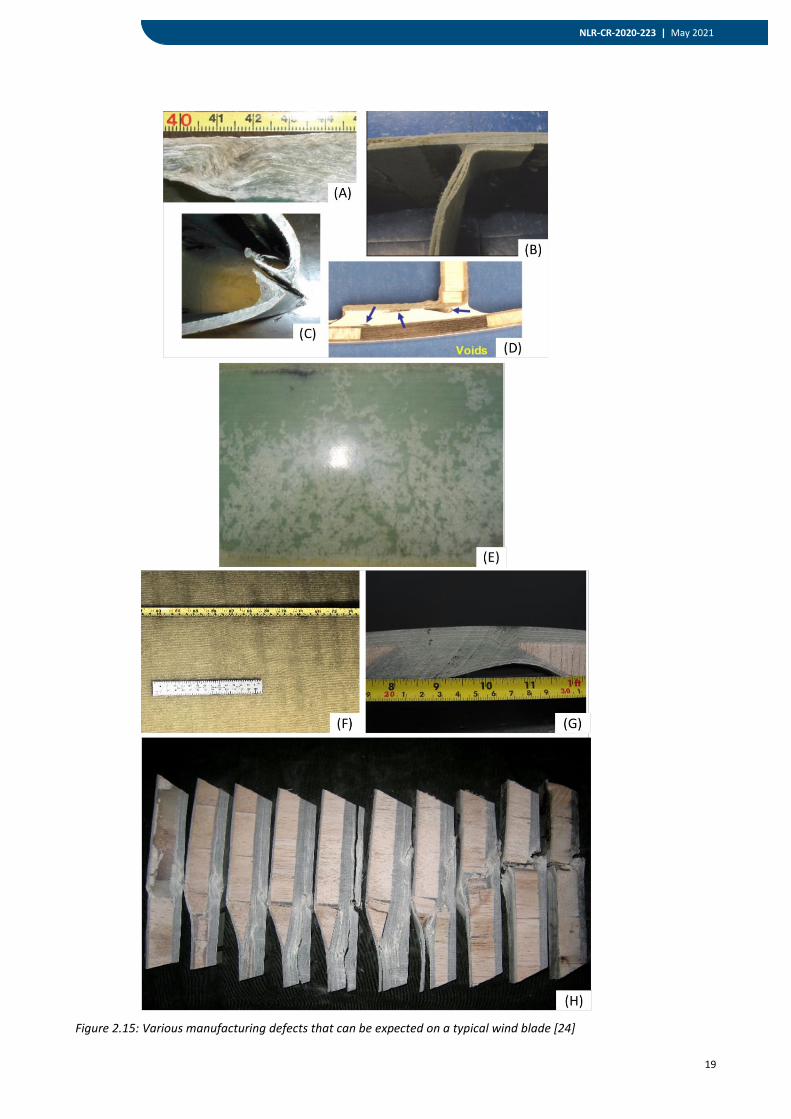
Wind blades are made out of large parts using relatively low-costing fiber composite materials and manufacturing methods. Aerospace like standards are not applied to in order to reduce manufacturing cost because stringent manufacturing defect control will lead to high rejection rate [33]. Therefore, one can expect to see various manufacturing defects in a wind blade. According to Roach et al. [24], the most general flaws, damage and irregularities after the manufacturing that the industry would like to detect are:
• Thickness variations; • Disbonds, including kissing disbonds (see Figure 2.15 (C)); • Presence / missing of proper adhesive bond (voids, see Figure 2.15 (D)); • Interply delaminations (see Figure 2.15 (B)); • Dry regions (incomplete resin transfer); • Gelcoat disbands; • Porosity; • Snowflaking (see Figure 2.15 (E)); • In- and out-of-plane waveiness (see Figure 2.15 (A, F and G)); • composite fiber fracture / cracks (see Figure 2.15 (H)).
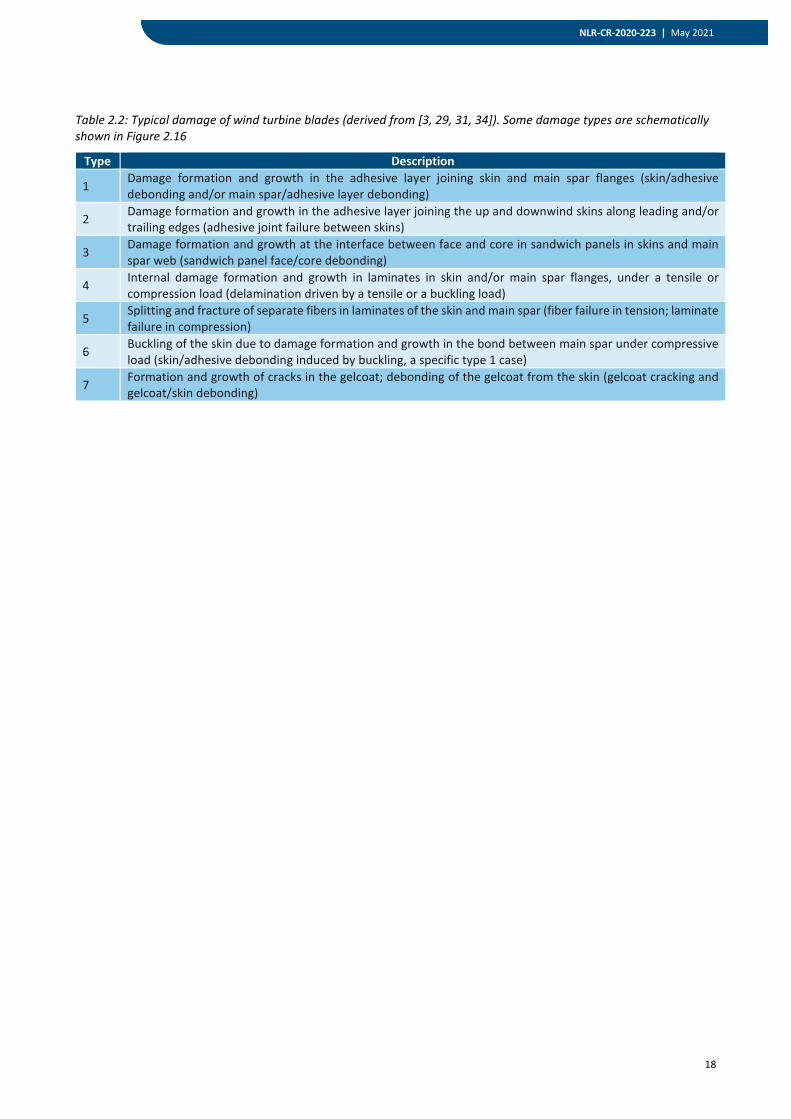
During the operation of a wind blade, small defects can develop to a large size of damage which can threaten the integrity of a structure. Furthermore, wind blades operate under various environments and experience events damaging the structure (see Chapter 1, Table 1.1). Typical in-situ damage modes during its operational life time that can occur can be categorized into 7 types according to Shohag et al. [29], see Table 2.2. Of these, delamination of laminates and adhesive bonded joints are usually the most critical according to McGugan et al. [15] and Sørensen et al. [32].
18
NLR-CR-2020-223 | May 2021
Table 2.2: Typical damage of wind turbine blades (derived from [3, 29, 31, 34]). Some damage types are schematically shown in Figure 2.16
Type Description
1 Damage formation and growth in the adhesive layer joining skin and main spar flanges (skin/adhesive debonding and/or main spar/adhesive layer debonding)
2 Damage formation and growth in the adhesive layer joining the up and downwind skins along leading and/or trailing edges (adhesive joint failure between skins)
3 Damage formation and growth at the interface between face and core in sandwich panels in skins and main spar web (sandwich panel face/core debonding)
4 Internal damage formation and growth in laminates in skin and/or main spar flanges, under a tensile or compression load (delamination driven by a tensile or a buckling load)
5 Splitting and fracture of separate fibers in laminates of the skin and main spar (fiber failure in tension; laminate failure in compression)
6 Buckling of the skin due to damage formation and growth in the bond between main spar under compressive load (skin/adhesive debonding induced by buckling, a specific type 1 case)
7 Formation and growth of cracks in the gelcoat; debonding of the gelcoat from the skin (gelcoat cracking and gelcoat/skin debonding)
19
NLR-CR-2020-223 | May 2021
Figure 2.15: Various manufacturing defects that can be expected on a typical wind blade [24]
20
NLR-CR-2020-223 | May 2021
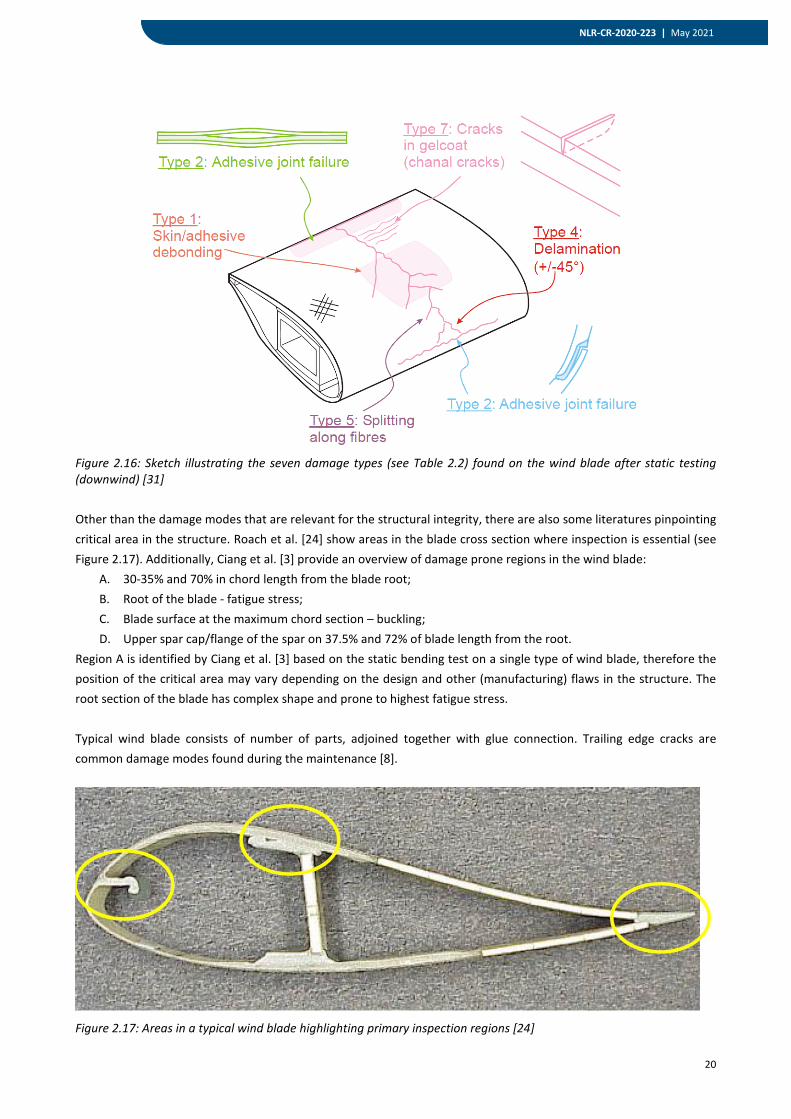
Figure 2.16: Sketch illustrating the seven damage types (see Table 2.2) found on the wind blade after static testing (downwind) [31] Other than the damage modes that are relevant for the structural integrity, there are also some literatures pinpointing critical area in the structure. Roach et al. [24] show areas in the blade cross section where inspection is essential (see Figure 2.17). Additionally, Ciang et al. [3] provide an overview of damage prone regions in the wind blade:
A. 30-35% and 70% in chord length from the blade root; B. Root of the blade - fatigue stress; C. Blade surface at the maximum chord section – buckling; D. Upper spar cap/flange of the spar on 37.5% and 72% of blade length from the root.
Region A is identified by Ciang et al. [3] based on the static bending test on a single type of wind blade, therefore the position of the critical area may vary depending on the design and other (manufacturing) flaws in the structure. The root section of the blade has complex shape and prone to highest fatigue stress. Typical wind blade consists of number of parts, adjoined together with glue connection. Trailing edge cracks are common damage modes found during the maintenance [8].
Figure 2.17: Areas in a typical wind blade highlighting primary inspection regions [24]
21
NLR-CR-2020-223 | May 2021
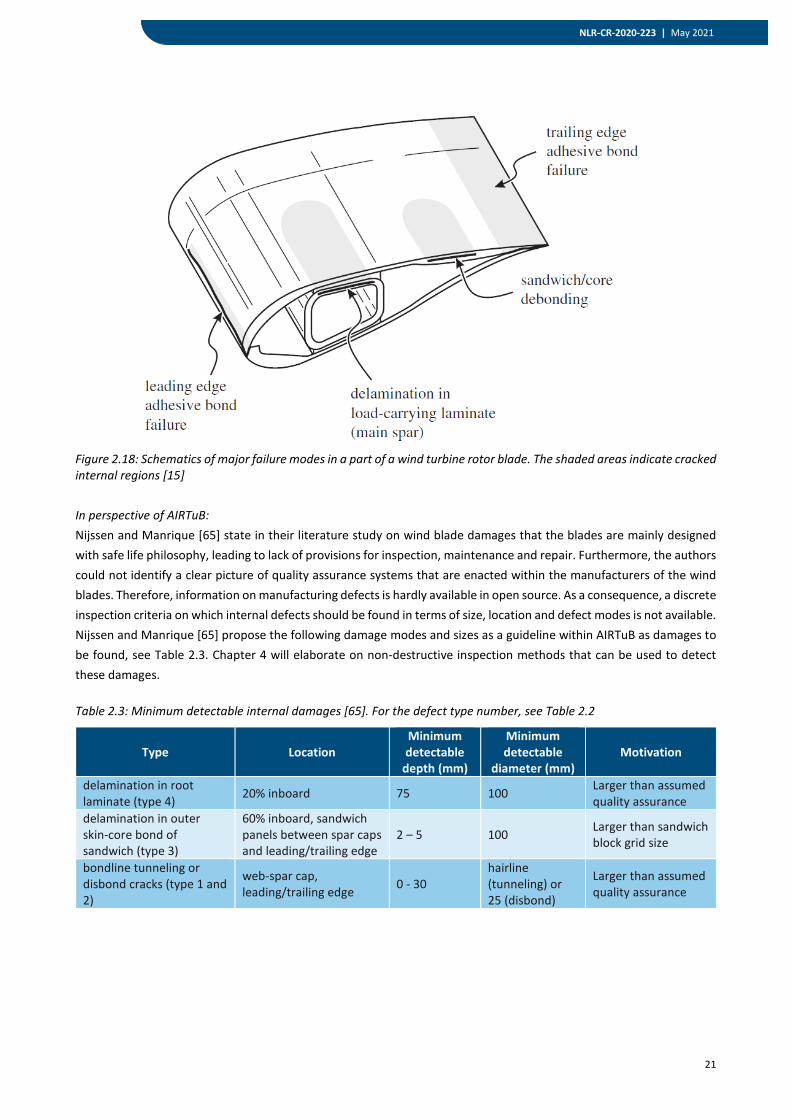
Figure 2.18: Schematics of major failure modes in a part of a wind turbine rotor blade. The shaded areas indicate cracked internal regions [15] In perspective of AIRTuB: Nijssen and Manrique [65] state in their literature study on wind blade damages that the blades are mainly designed with safe life philosophy, leading to lack of provisions for inspection, maintenance and repair. Furthermore, the authors could not identify a clear picture of quality assurance systems that are enacted within the manufacturers of the wind blades. Therefore, information on manufacturing defects is hardly available in open source. As a consequence, a discrete inspection criteria on which internal defects should be found in terms of size, location and defect modes is not available. Nijssen and Manrique [65] propose the following damage modes and sizes as a guideline within AIRTuB as damages to be found, see Table 2.3. Chapter 4 will elaborate on non-destructive inspection methods that can be used to detect these damages. Table 2.3: Minimum detectable internal damages [65]. For the defect type number, see Table 2.2
Type Location Minimum detectable
depth (mm)
Minimum detectable
diameter (mm) Motivation
delamination in root laminate (type 4) 20% inboard 75 100 Larger than assumed
quality assurance delamination in outer skin-core bond of sandwich (type 3)
60% inboard, sandwich panels between spar caps and leading/trailing edge
2 – 5 100 Larger than sandwich block grid size
bondline tunneling or disbond cracks (type 1 and 2)
web-spar cap, leading/trailing edge 0 - 30
hairline (tunneling) or 25 (disbond)
Larger than assumed quality assurance
22
NLR-CR-2020-223 | May 2021
3 Surface Damage Detection Techniques
This chapter presents novel techniques to detect surface damages on the wind turbine blades. Typical defect modes found in the wind turbine blades have been presented in Section 2.2. Evaluating the blade surface can help detect external defects such as erosion, lightning damage and debonding of the adhesive at the leading or trailing edge. On the other hand, surface inspection methods are inadequate for identifying internal defects, despite the fact that some of these flaws occasionally manifest themselves at the surface. Surface inspection methods include visual inspection by workers, whether using rope-access techniques, working on a platform suspended from the nacelle, or an elevated platform; visual inspection from the ground using binoculars or a telescope; and visual inspection with a ground-based or drone-mounted camera. The inspection can be performed either while the wind turbine is in operation or by stopping the turbine for safety and/or inspection performance. There are clearly advantages to use drone for subsurface defects inspection:
• Safety - No uptower access required for detection of surface and subsurface structural defects; • Efficiency - Towers inspected in < 30 minutes (50 meter blades), in good weather; • Multifunctional – Drone can incorporate multiple sensors technologies.
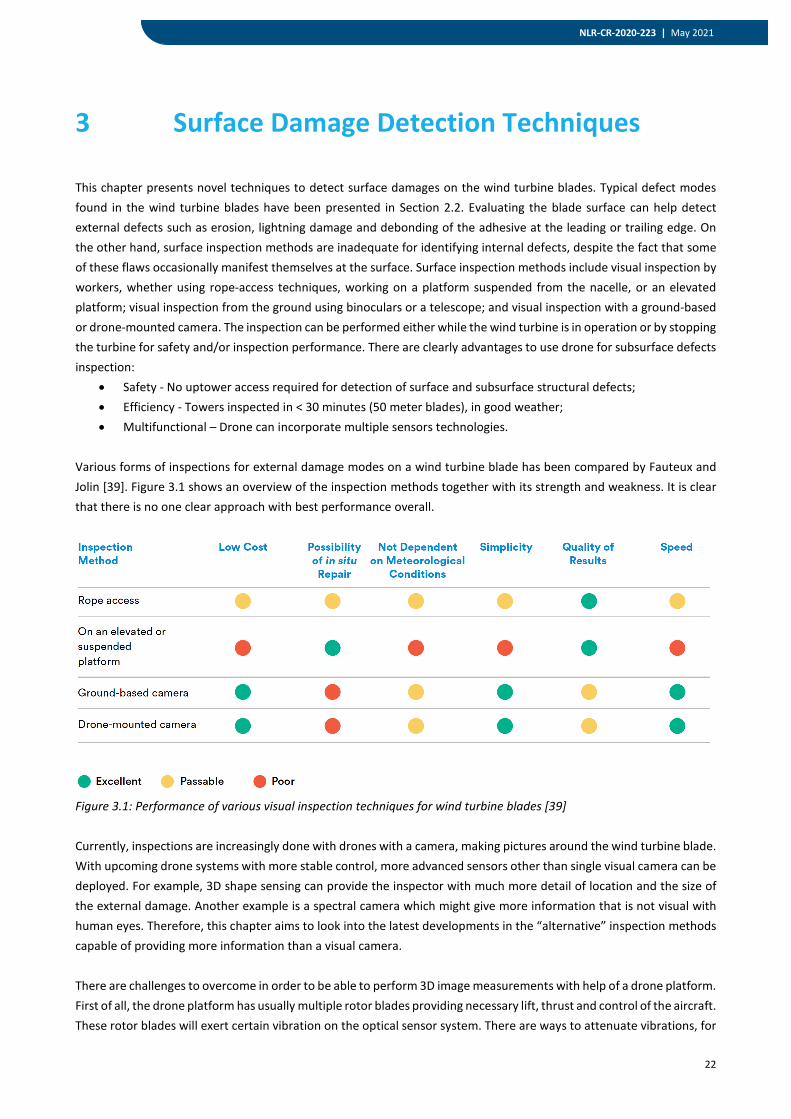
Various forms of inspections for external damage modes on a wind turbine blade has been compared by Fauteux and Jolin [39]. Figure 3.1 shows an overview of the inspection methods together with its strength and weakness. It is clear that there is no one clear approach with best performance overall.
Figure 3.1: Performance of various visual inspection techniques for wind turbine blades [39] Currently, inspections are increasingly done with drones with a camera, making pictures around the wind turbine blade. With upcoming drone systems with more stable control, more advanced sensors other than single visual camera can be deployed. For example, 3D shape sensing can provide the inspector with much more detail of location and the size of the external damage. Another example is a spectral camera which might give more information that is not visual with human eyes. Therefore, this chapter aims to look into the latest developments in the “alternative” inspection methods capable of providing more information than a visual camera. There are challenges to overcome in order to be able to perform 3D image measurements with help of a drone platform. First of all, the drone platform has usually multiple rotor blades providing necessary lift, thrust and control of the aircraft. These rotor blades will exert certain vibration on the optical sensor system. There are ways to attenuate vibrations, for
23
NLR-CR-2020-223 | May 2021
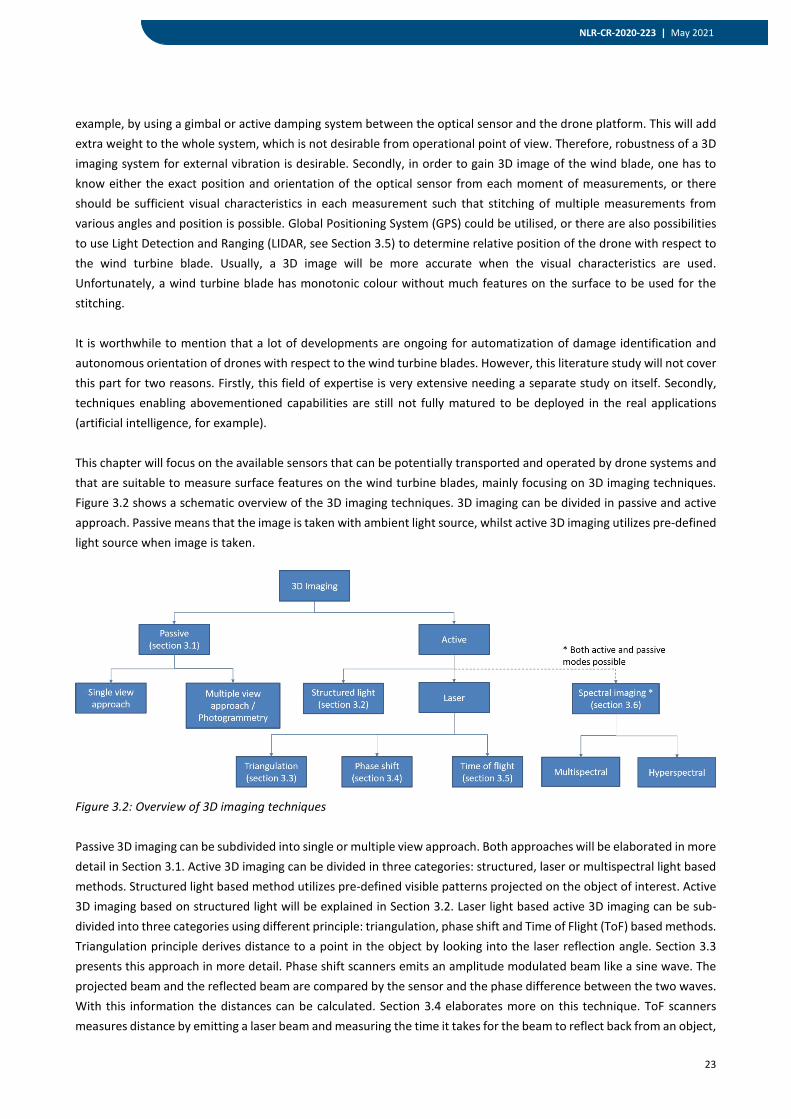
example, by using a gimbal or active damping system between the optical sensor and the drone platform. This will add extra weight to the whole system, which is not desirable from operational point of view. Therefore, robustness of a 3D imaging system for external vibration is desirable. Secondly, in order to gain 3D image of the wind blade, one has to know either the exact position and orientation of the optical sensor from each moment of measurements, or there should be sufficient visual characteristics in each measurement such that stitching of multiple measurements from various angles and position is possible. Global Positioning System (GPS) could be utilised, or there are also possibilities to use Light Detection and Ranging (LIDAR, see Section 3.5) to determine relative position of the drone with respect to the wind turbine blade. Usually, a 3D image will be more accurate when the visual characteristics are used. Unfortunately, a wind turbine blade has monotonic colour without much features on the surface to be used for the stitching. It is worthwhile to mention that a lot of developments are ongoing for automatization of damage identification and autonomous orientation of drones with respect to the wind turbine blades. However, this literature study will not cover this part for two reasons. Firstly, this field of expertise is very extensive needing a separate study on itself. Secondly, techniques enabling abovementioned capabilities are still not fully matured to be deployed in the real applications (artificial intelligence, for example). This chapter will focus on the available sensors that can be potentially transported and operated by drone systems and that are suitable to measure surface features on the wind turbine blades, mainly focusing on 3D imaging techniques. Figure 3.2 shows a schematic overview of the 3D imaging techniques. 3D imaging can be divided in passive and active approach. Passive means that the image is taken with ambient light source, whilst active 3D imaging utilizes pre-defined light source when image is taken.
Figure 3.2: Overview of 3D imaging techniques Passive 3D imaging can be subdivided into single or multiple view approach. Both approaches will be elaborated in more detail in Section 3.1. Active 3D imaging can be divided in three categories: structured, laser or multispectral light based methods. Structured light based method utilizes pre-defined visible patterns projected on the object of interest. Active 3D imaging based on structured light will be explained in Section 3.2. Laser light based active 3D imaging can be sub-divided into three categories using different principle: triangulation, phase shift and Time of Flight (ToF) based methods. Triangulation principle derives distance to a point in the object by looking into the laser reflection angle. Section 3.3 presents this approach in more detail. Phase shift scanners emits an amplitude modulated beam like a sine wave. The projected beam and the reflected beam are compared by the sensor and the phase difference between the two waves. With this information the distances can be calculated. Section 3.4 elaborates more on this technique. ToF scanners measures distance by emitting a laser beam and measuring the time it takes for the beam to reflect back from an object,
24
NLR-CR-2020-223 | May 2021
as the speed of the light is known it is possible to calculate the distance. Section 3.5 gives more information on this approach. Spectral light methods uses a light source with broad band of frequency. Depending on the steps in frequency that the camera is able to use, this method is called multi- or hyperspectral imaging method. By looking into the reflection of this broad light source, more detail on the surface can be observed. Section 3.6 will give an overview of spectral imaging developments. After the 3D imaging techniques are surveyed, Finally, Section 3.7 will consider these findings and discuss them in light of AIRTuB project.
3.1 Passive 3D Imaging
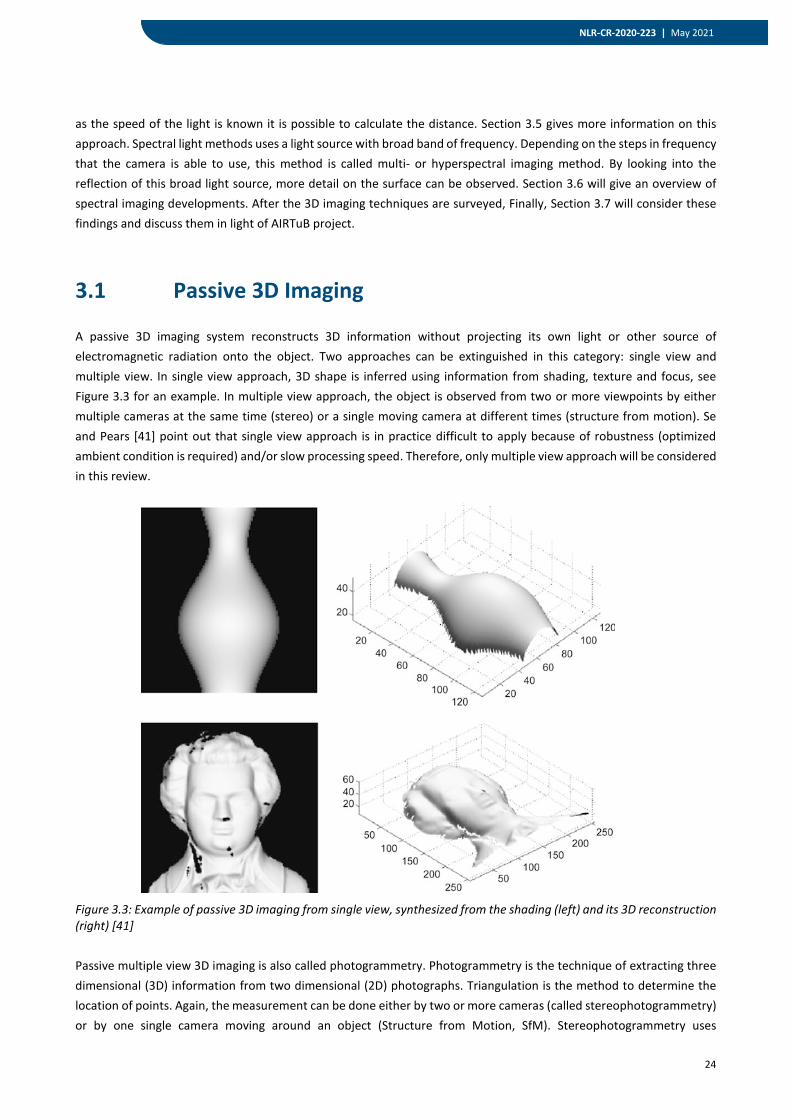
A passive 3D imaging system reconstructs 3D information without projecting its own light or other source of electromagnetic radiation onto the object. Two approaches can be extinguished in this category: single view and multiple view. In single view approach, 3D shape is inferred using information from shading, texture and focus, see Figure 3.3 for an example. In multiple view approach, the object is observed from two or more viewpoints by either multiple cameras at the same time (stereo) or a single moving camera at different times (structure from motion). Se and Pears [41] point out that single view approach is in practice difficult to apply because of robustness (optimized ambient condition is required) and/or slow processing speed. Therefore, only multiple view approach will be considered in this review.
Figure 3.3: Example of passive 3D imaging from single view, synthesized from the shading (left) and its 3D reconstruction (right) [41] Passive multiple view 3D imaging is also called photogrammetry. Photogrammetry is the technique of extracting three dimensional (3D) information from two dimensional (2D) photographs. Triangulation is the method to determine the location of points. Again, the measurement can be done either by two or more cameras (called stereophotogrammetry) or by one single camera moving around an object (Structure from Motion, SfM). Stereophotogrammetry uses
25
NLR-CR-2020-223 | May 2021
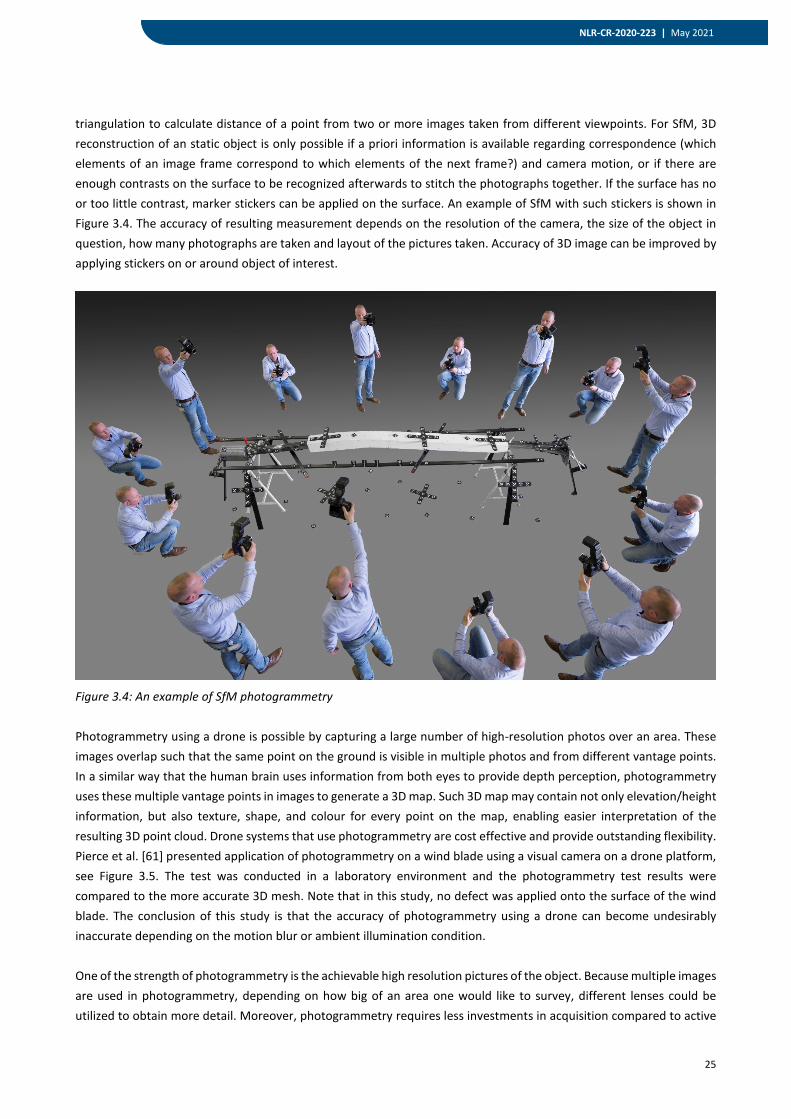
triangulation to calculate distance of a point from two or more images taken from different viewpoints. For SfM, 3D reconstruction of an static object is only possible if a priori information is available regarding correspondence (which elements of an image frame correspond to which elements of the next frame?) and camera motion, or if there are enough contrasts on the surface to be recognized afterwards to stitch the photographs together. If the surface has no or too little contrast, marker stickers can be applied on the surface. An example of SfM with such stickers is shown in Figure 3.4. The accuracy of resulting measurement depends on the resolution of the camera, the size of the object in question, how many photographs are taken and layout of the pictures taken. Accuracy of 3D image can be improved by applying stickers on or around object of interest.
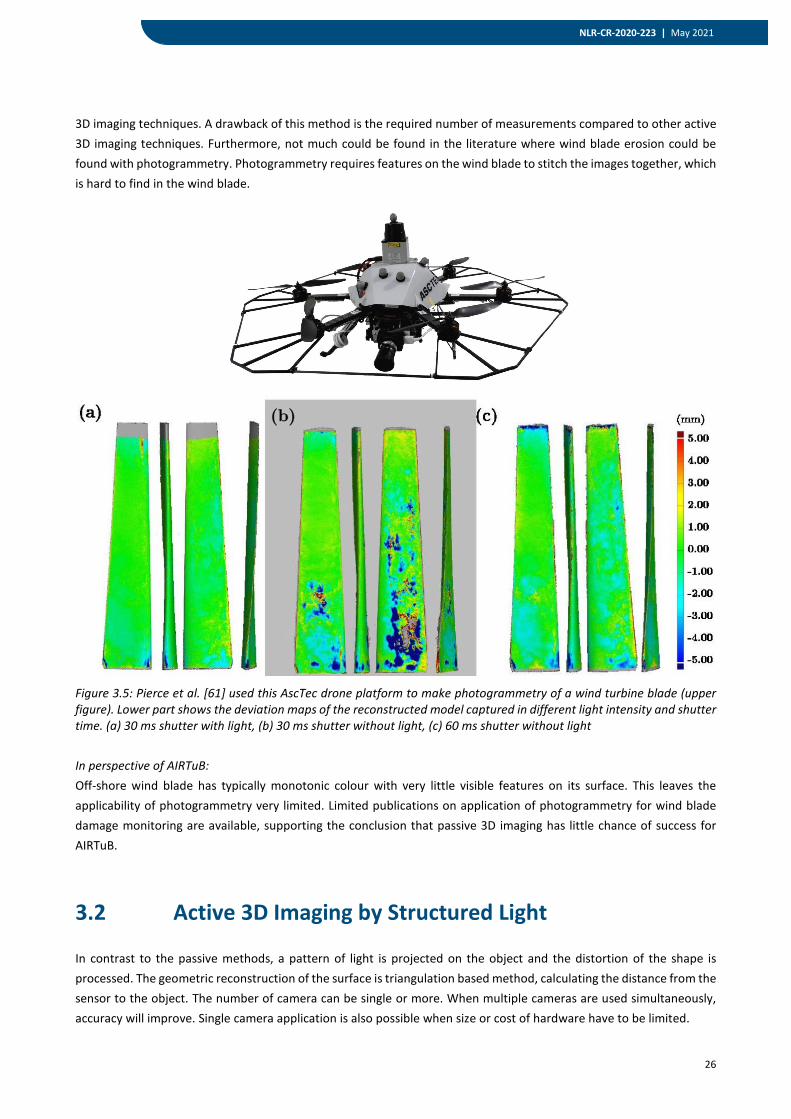
Figure 3.4: An example of SfM photogrammetry Photogrammetry using a drone is possible by capturing a large number of high-resolution photos over an area. These images overlap such that the same point on the ground is visible in multiple photos and from different vantage points. In a similar way that the human brain uses information from both eyes to provide depth perception, photogrammetry uses these multiple vantage points in images to generate a 3D map. Such 3D map may contain not only elevation/height information, but also texture, shape, and colour for every point on the map, enabling easier interpretation of the resulting 3D point cloud. Drone systems that use photogrammetry are cost effective and provide outstanding flexibility. Pierce et al. [61] presented application of photogrammetry on a wind blade using a visual camera on a drone platform, see Figure 3.5. The test was conducted in a laboratory environment and the photogrammetry test results were compared to the more accurate 3D mesh. Note that in this study, no defect was applied onto the surface of the wind blade. The conclusion of this study is that the accuracy of photogrammetry using a drone can become undesirably inaccurate depending on the motion blur or ambient illumination condition. One of the strength of photogrammetry is the achievable high resolution pictures of the object. Because multiple images are used in photogrammetry, depending on how big of an area one would like to survey, different lenses could be utilized to obtain more detail. Moreover, photogrammetry requires less investments in acquisition compared to active
26
NLR-CR-2020-223 | May 2021
3D imaging techniques. A drawback of this method is the required number of measurements compared to other active 3D imaging techniques. Furthermore, not much could be found in the literature where wind blade erosion could be found with photogrammetry. Photogrammetry requires features on the wind blade to stitch the images together, which is hard to find in the wind blade.
Figure 3.5: Pierce et al. [61] used this AscTec drone platform to make photogrammetry of a wind turbine blade (upper figure). Lower part shows the deviation maps of the reconstructed model captured in different light intensity and shutter time. (a) 30 ms shutter with light, (b) 30 ms shutter without light, (c) 60 ms shutter without light In perspective of AIRTuB: Off-shore wind blade has typically monotonic colour with very little visible features on its surface. This leaves the applicability of photogrammetry very limited. Limited publications on application of photogrammetry for wind blade damage monitoring are available, supporting the conclusion that passive 3D imaging has little chance of success for AIRTuB.
3.2 Active 3D Imaging by Structured Light
In contrast to the passive methods, a pattern of light is projected on the object and the distortion of the shape is processed. The geometric reconstruction of the surface is triangulation based method, calculating the distance from the sensor to the object. The number of camera can be single or more. When multiple cameras are used simultaneously, accuracy will improve. Single camera application is also possible when size or cost of hardware have to be limited.
27
NLR-CR-2020-223 | May 2021
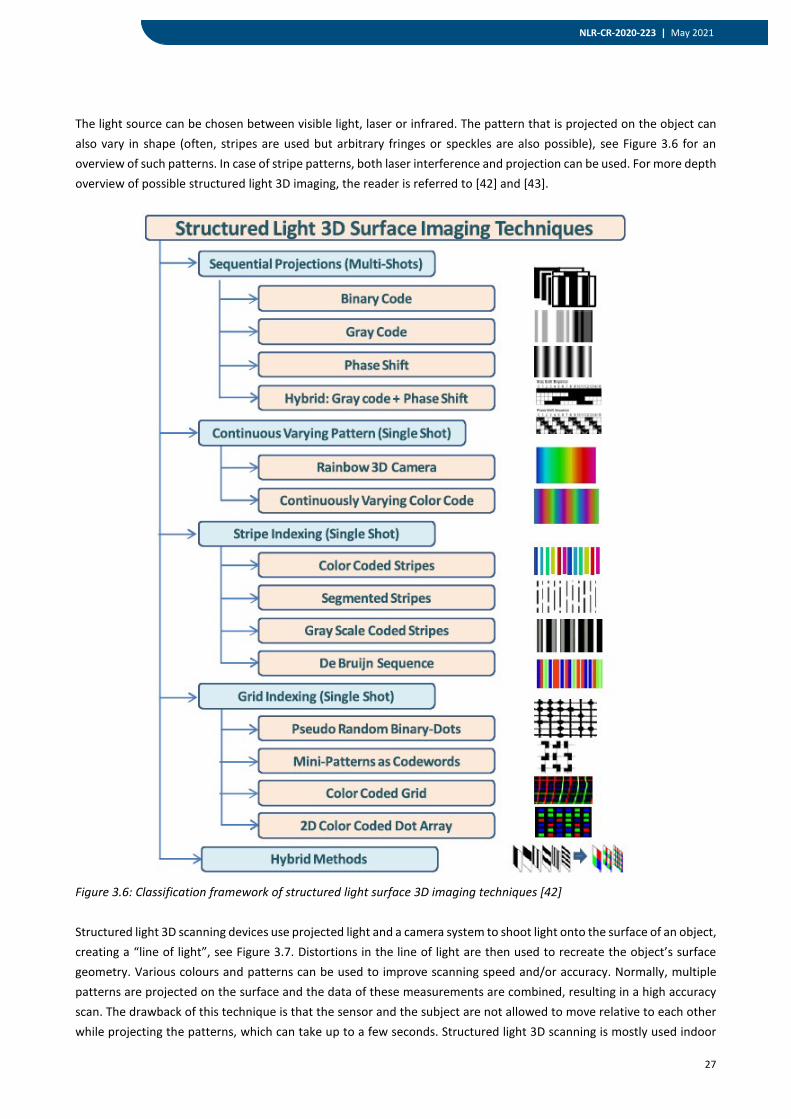
The light source can be chosen between visible light, laser or infrared. The pattern that is projected on the object can also vary in shape (often, stripes are used but arbitrary fringes or speckles are also possible), see Figure 3.6 for an overview of such patterns. In case of stripe patterns, both laser interference and projection can be used. For more depth overview of possible structured light 3D imaging, the reader is referred to [42] and [43].
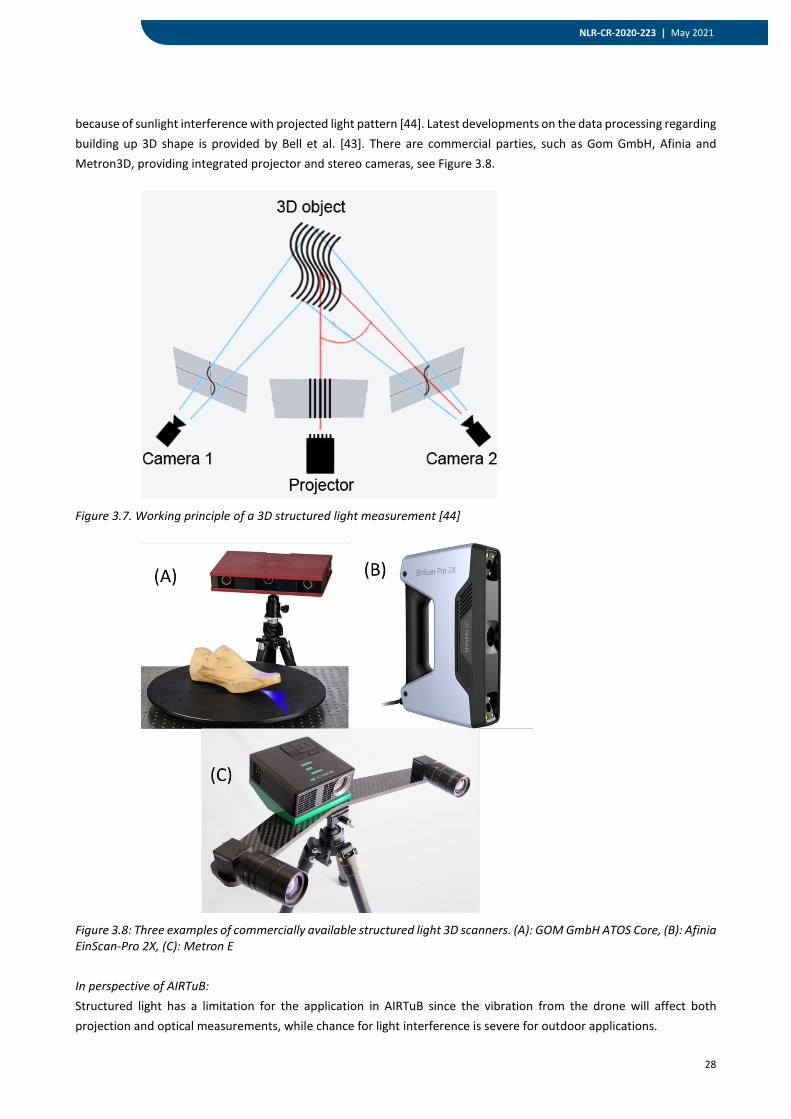
Figure 3.6: Classification framework of structured light surface 3D imaging techniques [42] Structured light 3D scanning devices use projected light and a camera system to shoot light onto the surface of an object, creating a “line of light”, see Figure 3.7. Distortions in the line of light are then used to recreate the object’s surface geometry. Various colours and patterns can be used to improve scanning speed and/or accuracy. Normally, multiple patterns are projected on the surface and the data of these measurements are combined, resulting in a high accuracy scan. The drawback of this technique is that the sensor and the subject are not allowed to move relative to each other while projecting the patterns, which can take up to a few seconds. Structured light 3D scanning is mostly used indoor
28
NLR-CR-2020-223 | May 2021
because of sunlight interference with projected light pattern [44]. Latest developments on the data processing regarding building up 3D shape is provided by Bell et al. [43]. There are commercial parties, such as Gom GmbH, Afinia and Metron3D, providing integrated projector and stereo cameras, see Figure 3.8.
Figure 3.7. Working principle of a 3D structured light measurement [44]
Figure 3.8: Three examples of commercially available structured light 3D scanners. (A): GOM GmbH ATOS Core, (B): Afinia EinScan-Pro 2X, (C): Metron E In perspective of AIRTuB: Structured light has a limitation for the application in AIRTuB since the vibration from the drone will affect both projection and optical measurements, while chance for light interference is severe for outdoor applications.
29
NLR-CR-2020-223 | May 2021
3.3 Triangulation based Laser Scanner
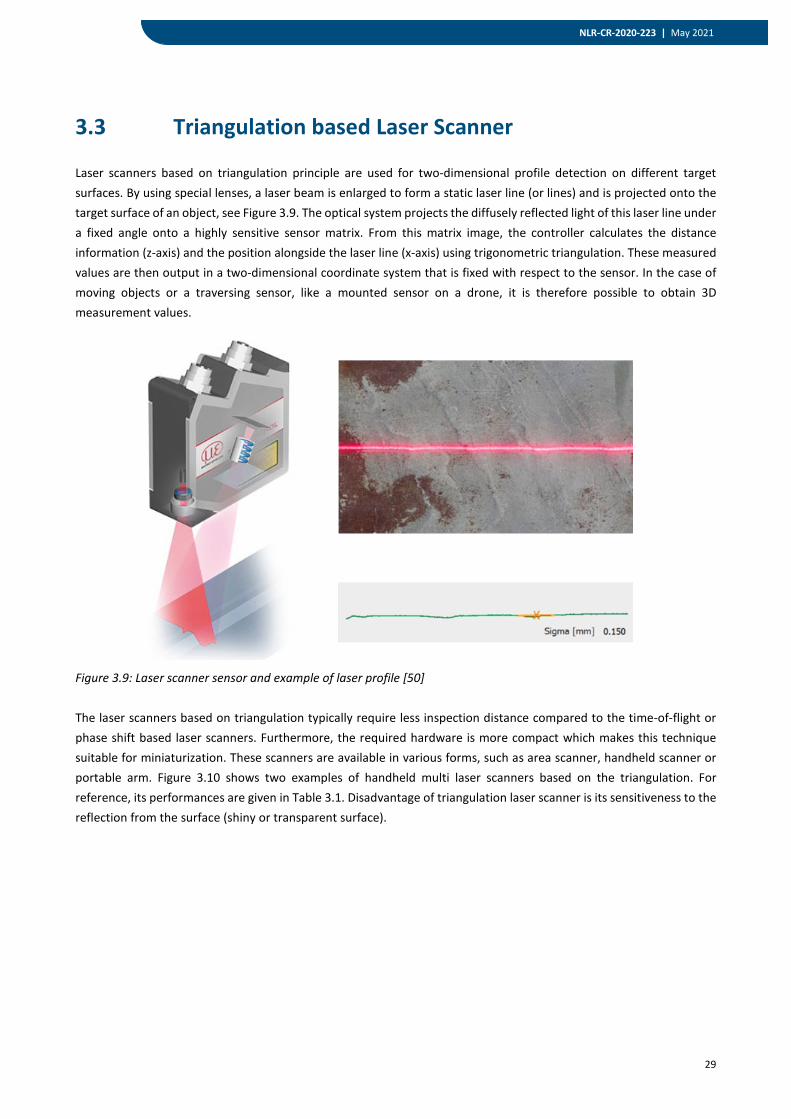
Laser scanners based on triangulation principle are used for two-dimensional profile detection on different target surfaces. By using special lenses, a laser beam is enlarged to form a static laser line (or lines) and is projected onto the target surface of an object, see Figure 3.9. The optical system projects the diffusely reflected light of this laser line under a fixed angle onto a highly sensitive sensor matrix. From this matrix image, the controller calculates the distance information (z-axis) and the position alongside the laser line (x-axis) using trigonometric triangulation. These measured values are then output in a two-dimensional coordinate system that is fixed with respect to the sensor. In the case of moving objects or a traversing sensor, like a mounted sensor on a drone, it is therefore possible to obtain 3D measurement values.
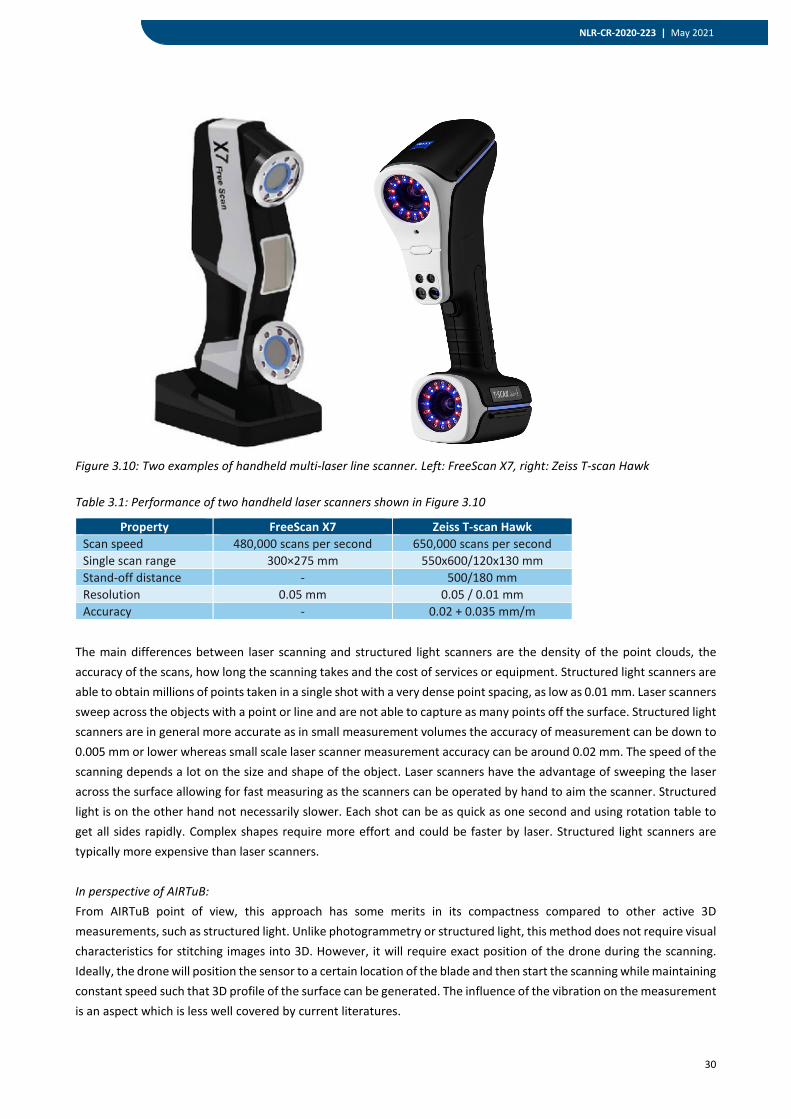
Figure 3.9: Laser scanner sensor and example of laser profile [50] The laser scanners based on triangulation typically require less inspection distance compared to the time-of-flight or phase shift based laser scanners. Furthermore, the required hardware is more compact which makes this technique suitable for miniaturization. These scanners are available in various forms, such as area scanner, handheld scanner or portable arm. Figure 3.10 shows two examples of handheld multi laser scanners based on the triangulation. For reference, its performances are given in Table 3.1. Disadvantage of triangulation laser scanner is its sensitiveness to the reflection from the surface (shiny or transparent surface).
30
NLR-CR-2020-223 | May 2021
Figure 3.10: Two examples of handheld multi-laser line scanner. Left: FreeScan X7, right: Zeiss T-scan Hawk Table 3.1: Performance of two handheld laser scanners shown in Figure 3.10
Property FreeScan X7 Zeiss T-scan Hawk Scan speed 480,000 scans per second 650,000 scans per second Single scan range 300×275 mm 550x600/120x130 mm Stand-off distance - 500/180 mm Resolution 0.05 mm 0.05 / 0.01 mm Accuracy - 0.02 + 0.035 mm/m
The main differences between laser scanning and structured light scanners are the density of the point clouds, the accuracy of the scans, how long the scanning takes and the cost of services or equipment. Structured light scanners are able to obtain millions of points taken in a single shot with a very dense point spacing, as low as 0.01 mm. Laser scanners sweep across the objects with a point or line and are not able to capture as many points off the surface. Structured light scanners are in general more accurate as in small measurement volumes the accuracy of measurement can be down to 0.005 mm or lower whereas small scale laser scanner measurement accuracy can be around 0.02 mm. The speed of the scanning depends a lot on the size and shape of the object. Laser scanners have the advantage of sweeping the laser across the surface allowing for fast measuring as the scanners can be operated by hand to aim the scanner. Structured light is on the other hand not necessarily slower. Each shot can be as quick as one second and using rotation table to get all sides rapidly. Complex shapes require more effort and could be faster by laser. Structured light scanners are typically more expensive than laser scanners. In perspective of AIRTuB: From AIRTuB point of view, this approach has some merits in its compactness compared to other active 3D measurements, such as structured light. Unlike photogrammetry or structured light, this method does not require visual characteristics for stitching images into 3D. However, it will require exact position of the drone during the scanning. Ideally, the drone will position the sensor to a certain location of the blade and then start the scanning while maintaining constant speed such that 3D profile of the surface can be generated. The influence of the vibration on the measurement is an aspect which is less well covered by current literatures.
31
NLR-CR-2020-223 | May 2021
3.4 Phase Shift Based Laser Scanner
Laser phase shift scanner emits an amplitude modulated beam like a sine wave. The projected beam and the reflected beam are compared by the sensor and the phase difference between the two waves shows the time of the delay. These scanners modulates the laser in phase domain (interferometry) to determine the distance to the object. Such method results in a very accurate measurement of the distance to single point of an object. There is a comparison study between time-of-flight and phase shift based laser scanner for the diagnostics of buildings available by Suchocki (see [49]). One of the conclusion of this comparison is that the phase shift based scanner performs better in terms of sensitivity to the damage compared to the Time-of-Flight based method (more elaborated in Section 3.5). In literature, there are not many applications found of phase shift based scanner for off-shore wind blade. A reason for this might be sensitivity of such method for external vibration. Biro and Kinnell [48] showed that interferometry based 3D scanner can experience reduced performance when the stability of industrial robot arm is not safeguarded during its operation. In perspective of AIRTuB: Phase shift based laser scanner is more applied for large static objects. Possibility to miniaturize this method seems to be limited. Furthermore, phase shift based laser scanner requires large distance to the object. Wind turbine blade in off-shore environment may sway in windy condition. When the measurement distance has to be large, this movement of object will impact more. Therefore, this method seems to be very limited within AIRTuB project.
3.5 Time of Flight based Laser Scanner
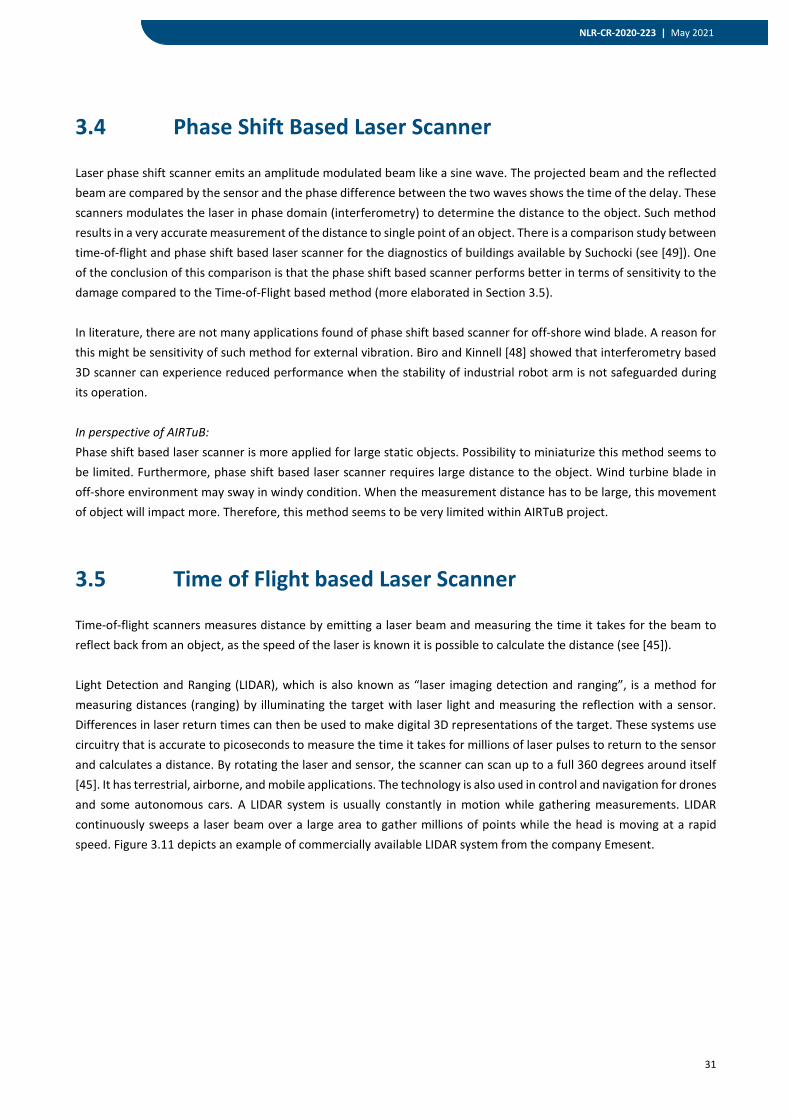
Time-of-flight scanners measures distance by emitting a laser beam and measuring the time it takes for the beam to reflect back from an object, as the speed of the laser is known it is possible to calculate the distance (see [45]). Light Detection and Ranging (LIDAR), which is also known as “laser imaging detection and ranging”, is a method for measuring distances (ranging) by illuminating the target with laser light and measuring the reflection with a sensor. Differences in laser return times can then be used to make digital 3D representations of the target. These systems use circuitry that is accurate to picoseconds to measure the time it takes for millions of laser pulses to return to the sensor and calculates a distance. By rotating the laser and sensor, the scanner can scan up to a full 360 degrees around itself [45]. It has terrestrial, airborne, and mobile applications. The technology is also used in control and navigation for drones and some autonomous cars. A LIDAR system is usually constantly in motion while gathering measurements. LIDAR continuously sweeps a laser beam over a large area to gather millions of points while the head is moving at a rapid speed. Figure 3.11 depicts an example of commercially available LIDAR system from the company Emesent.
32
NLR-CR-2020-223 | May 2021
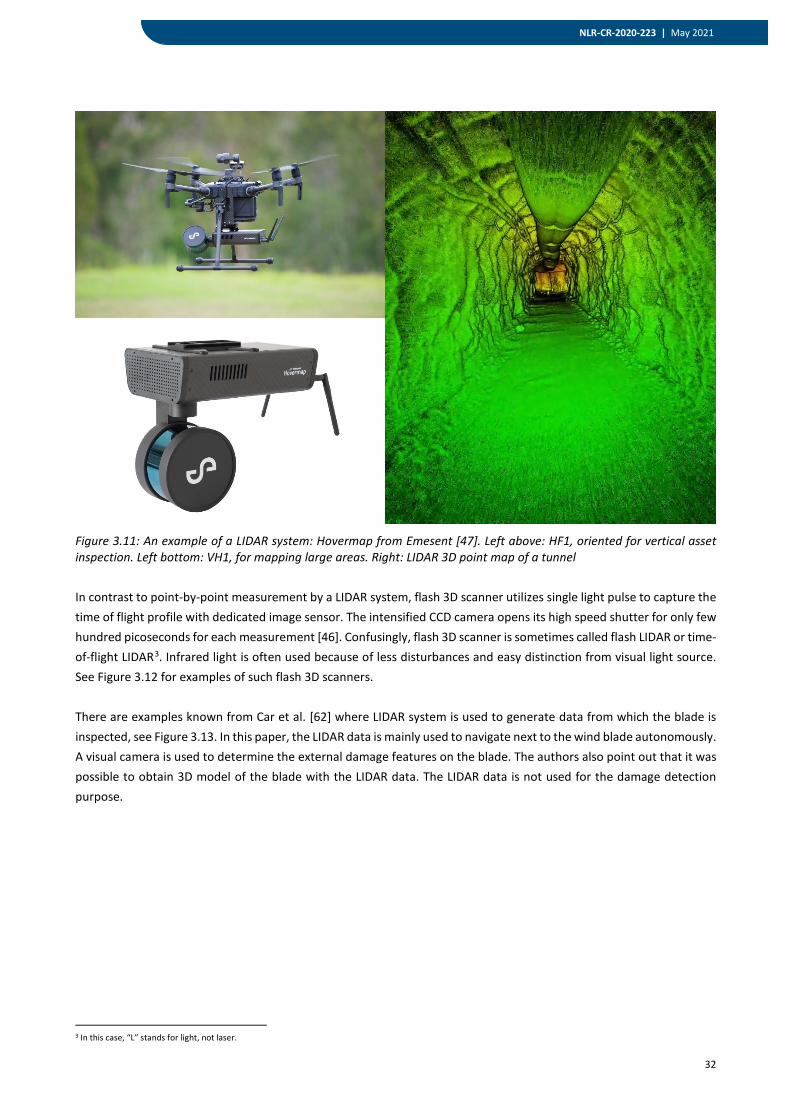
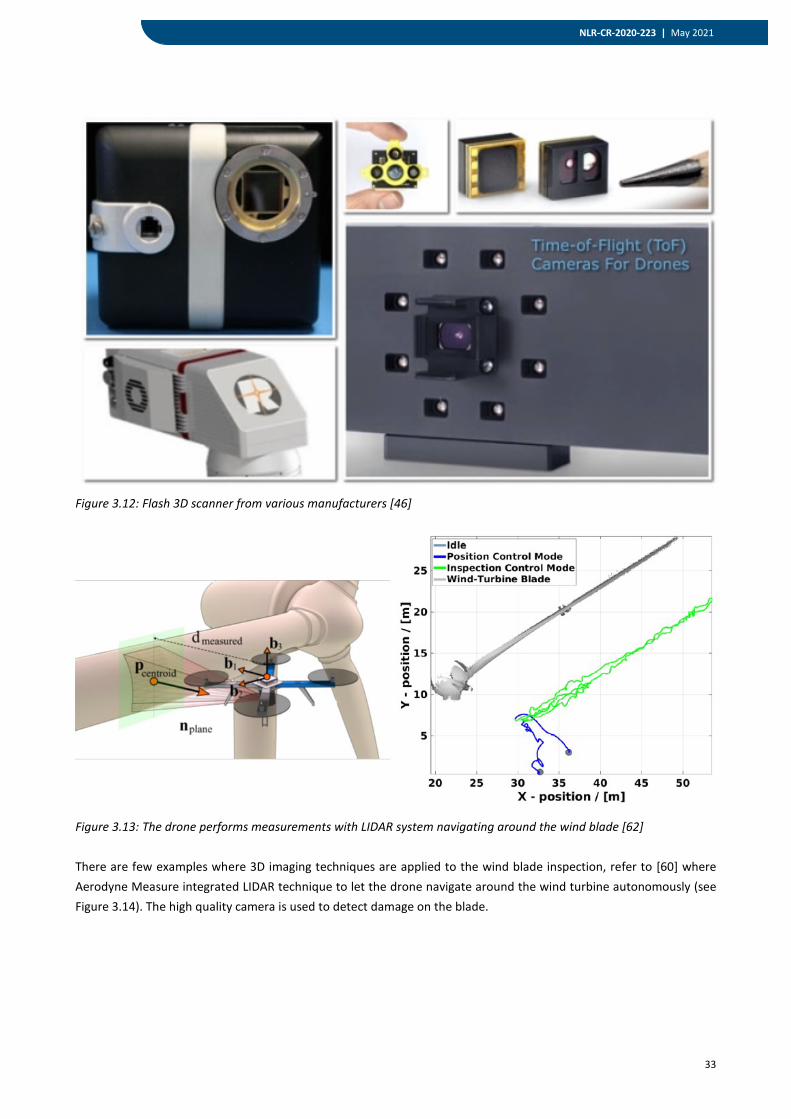
Figure 3.11: An example of a LIDAR system: Hovermap from Emesent [47]. Left above: HF1, oriented for vertical asset inspection. Left bottom: VH1, for mapping large areas. Right: LIDAR 3D point map of a tunnel In contrast to point-by-point measurement by a LIDAR system, flash 3D scanner utilizes single light pulse to capture the time of flight profile with dedicated image sensor. The intensified CCD camera opens its high speed shutter for only few hundred picoseconds for each measurement [46]. Confusingly, flash 3D scanner is sometimes called flash LIDAR or time-of-flight LIDAR3. Infrared light is often used because of less disturbances and easy distinction from visual light source. See Figure 3.12 for examples of such flash 3D scanners. There are examples known from Car et al. [62] where LIDAR system is used to generate data from which the blade is inspected, see Figure 3.13. In this paper, the LIDAR data is mainly used to navigate next to the wind blade autonomously. A visual camera is used to determine the external damage features on the blade. The authors also point out that it was possible to obtain 3D model of the blade with the LIDAR data. The LIDAR data is not used for the damage detection purpose.
3 In this case, “L” stands for light, not laser.
33
NLR-CR-2020-223 | May 2021
Figure 3.12: Flash 3D scanner from various manufacturers [46]
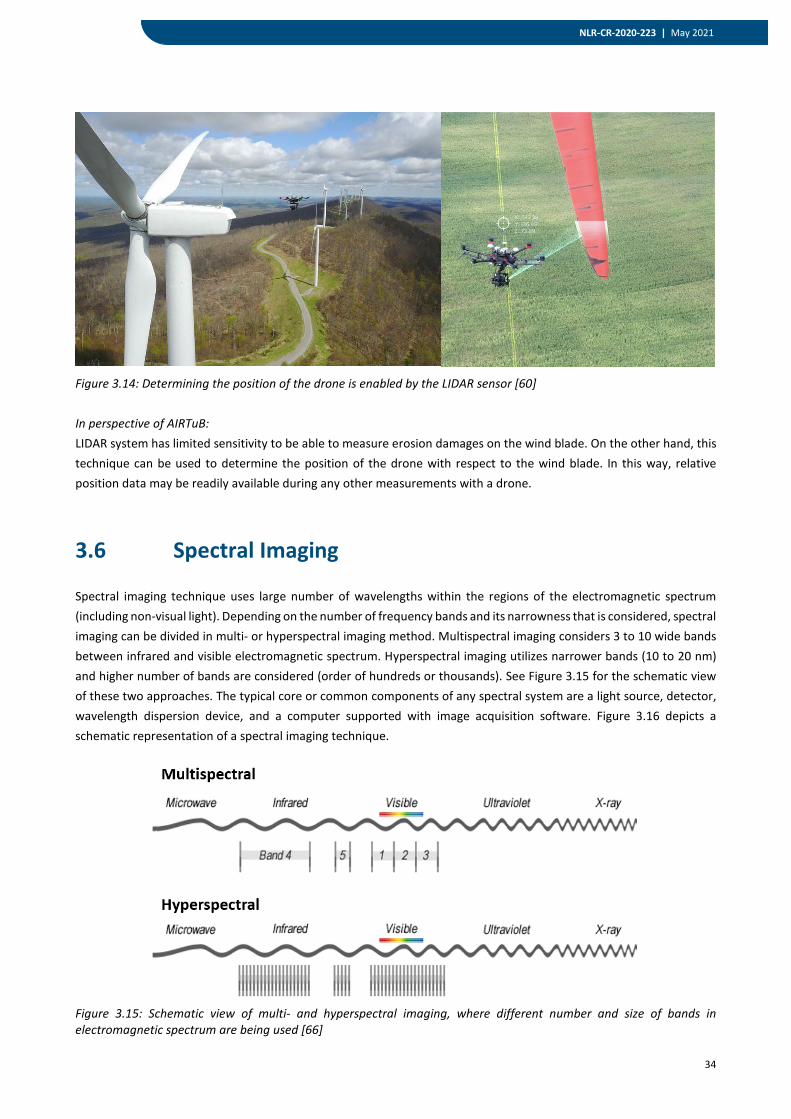
Figure 3.13: The drone performs measurements with LIDAR system navigating around the wind blade [62] There are few examples where 3D imaging techniques are applied to the wind blade inspection, refer to [60] where Aerodyne Measure integrated LIDAR technique to let the drone navigate around the wind turbine autonomously (see Figure 3.14). The high quality camera is used to detect damage on the blade.
34
NLR-CR-2020-223 | May 2021
Figure 3.14: Determining the position of the drone is enabled by the LIDAR sensor [60] In perspective of AIRTuB: LIDAR system has limited sensitivity to be able to measure erosion damages on the wind blade. On the other hand, this technique can be used to determine the position of the drone with respect to the wind blade. In this way, relative position data may be readily available during any other measurements with a drone.
3.6 Spectral Imaging
Spectral imaging technique uses large number of wavelengths within the regions of the electromagnetic spectrum (including non-visual light). Depending on the number of frequency bands and its narrowness that is considered, spectral imaging can be divided in multi- or hyperspectral imaging method. Multispectral imaging considers 3 to 10 wide bands between infrared and visible electromagnetic spectrum. Hyperspectral imaging utilizes narrower bands (10 to 20 nm) and higher number of bands are considered (order of hundreds or thousands). See Figure 3.15 for the schematic view of these two approaches. The typical core or common components of any spectral system are a light source, detector, wavelength dispersion device, and a computer supported with image acquisition software. Figure 3.16 depicts a schematic representation of a spectral imaging technique.
Figure 3.15: Schematic view of multi- and hyperspectral imaging, where different number and size of bands in electromagnetic spectrum are being used [66]
35
NLR-CR-2020-223 | May 2021
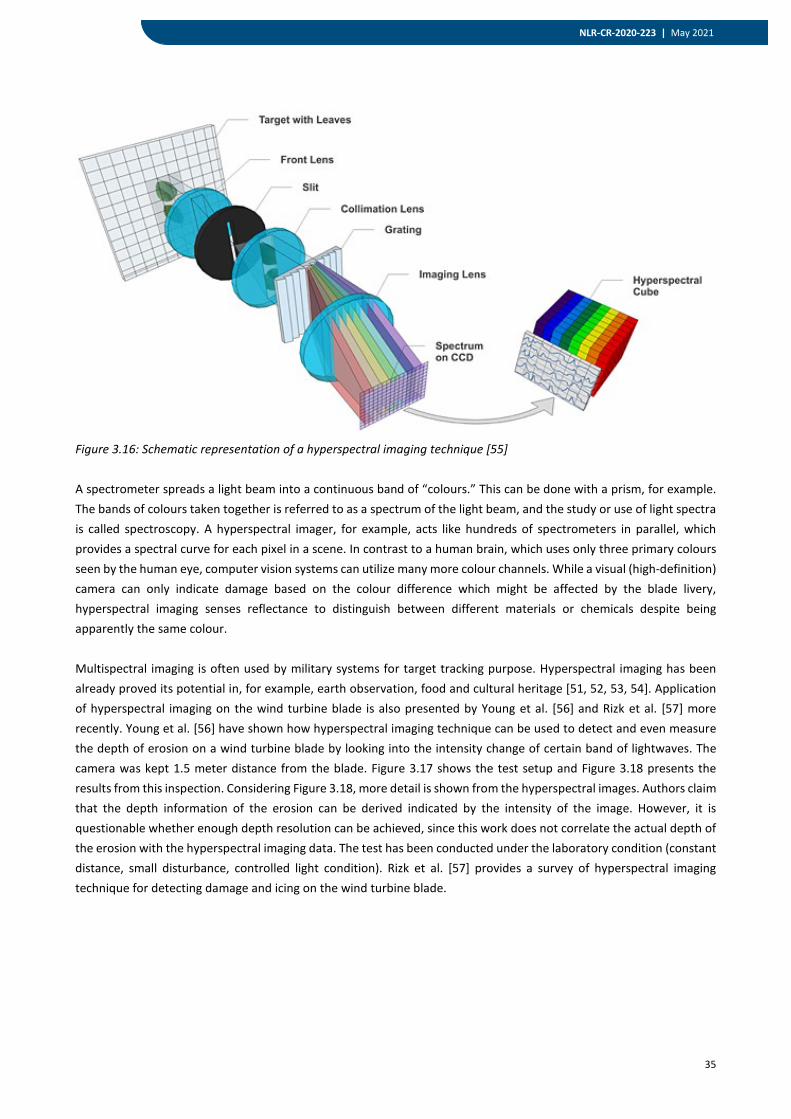
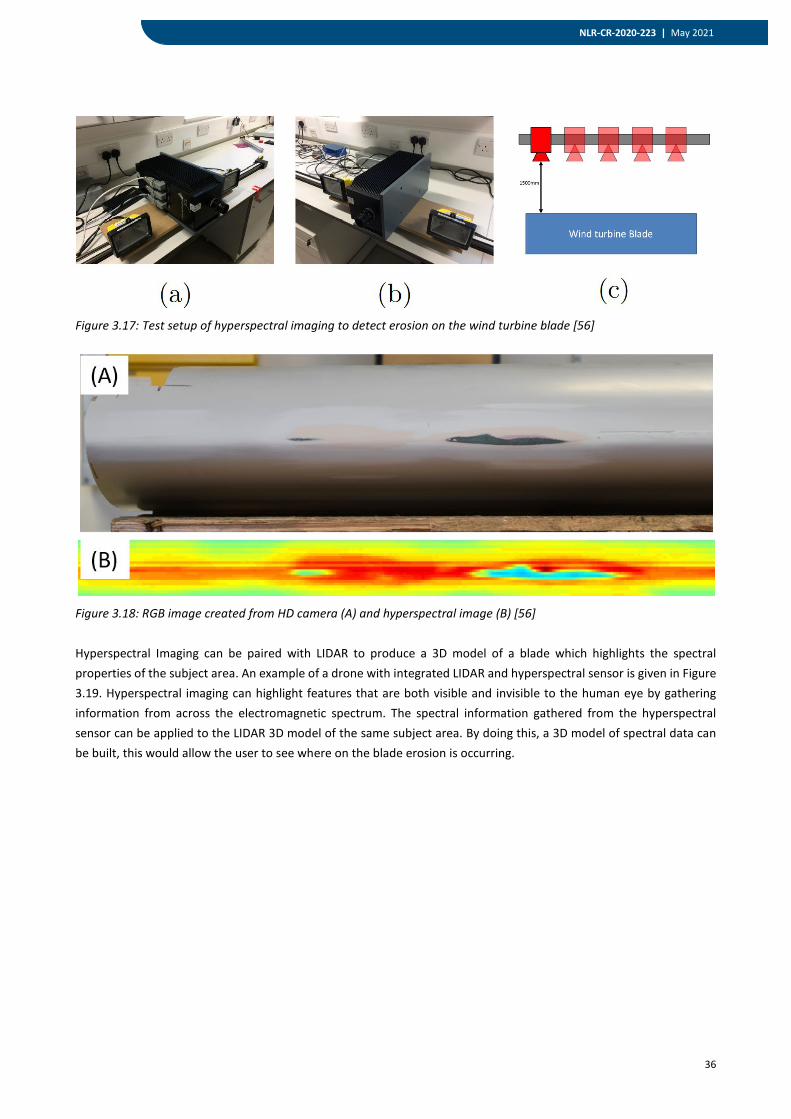
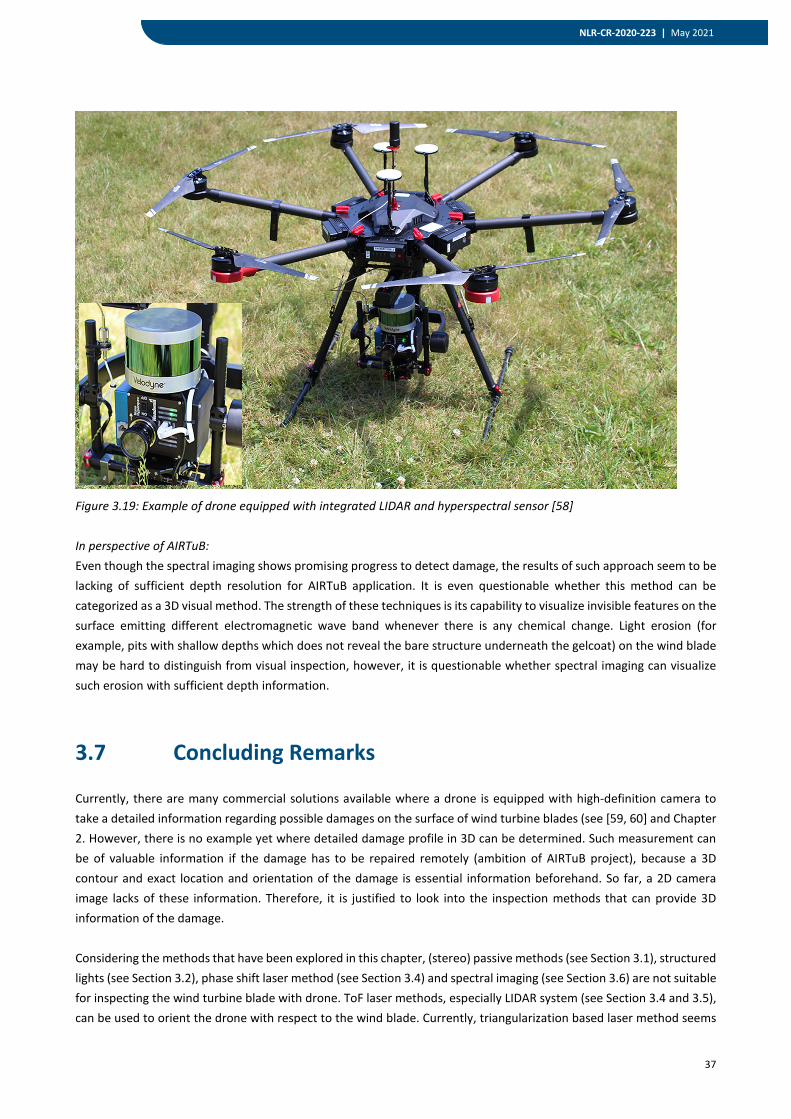
Figure 3.16: Schematic representation of a hyperspectral imaging technique [55] A spectrometer spreads a light beam into a continuous band of “colours.” This can be done with a prism, for example. The bands of colours taken together is referred to as a spectrum of the light beam, and the study or use of light spectra is called spectroscopy. A hyperspectral imager, for example, acts like hundreds of spectrometers in parallel, which provides a spectral curve for each pixel in a scene. In contrast to a human brain, which uses only three primary colours seen by the human eye, computer vision systems can utilize many more colour channels. While a visual (high-definition) camera can only indicate damage based on the colour difference which might be affected by the blade livery, hyperspectral imaging senses reflectance to distinguish between different materials or chemicals despite being apparently the same colour. Multispectral imaging is often used by military systems for target tracking purpose. Hyperspectral imaging has been already proved its potential in, for example, earth observation, food and cultural heritage [51, 52, 53, 54]. Application of hyperspectral imaging on the wind turbine blade is also presented by Young et al. [56] and Rizk et al. [57] more recently. Young et al. [56] have shown how hyperspectral imaging technique can be used to detect and even measure the depth of erosion on a wind turbine blade by looking into the intensity change of certain band of lightwaves. The camera was kept 1.5 meter distance from the blade. Figure 3.17 shows the test setup and Figure 3.18 presents the results from this inspection. Considering Figure 3.18, more detail is shown from the hyperspectral images. Authors claim that the depth information of the erosion can be derived indicated by the intensity of the image. However, it is questionable whether enough depth resolution can be achieved, since this work does not correlate the actual depth of the erosion with the hyperspectral imaging data. The test has been conducted under the laboratory condition (constant distance, small disturbance, controlled light condition). Rizk et al. [57] provides a survey of hyperspectral imaging technique for detecting damage and icing on the wind turbine blade.
36
NLR-CR-2020-223 | May 2021
Figure 3.17: Test setup of hyperspectral imaging to detect erosion on the wind turbine blade [56]
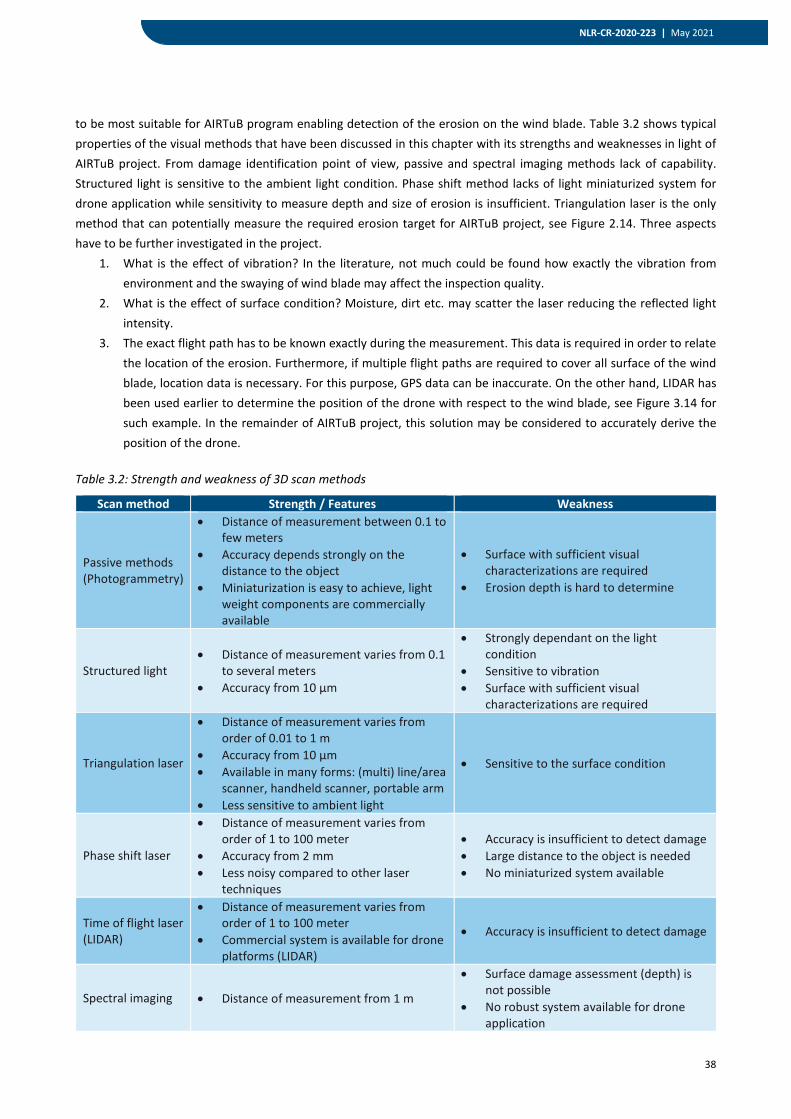
Figure 3.18: RGB image created from HD camera (A) and hyperspectral image (B) [56] Hyperspectral Imaging can be paired with LIDAR to produce a 3D model of a blade which highlights the spectral properties of the subject area. An example of a drone with integrated LIDAR and hyperspectral sensor is given in Figure 3.19. Hyperspectral imaging can highlight features that are both visible and invisible to the human eye by gathering information from across the electromagnetic spectrum. The spectral information gathered from the hyperspectral sensor can be applied to the LIDAR 3D model of the same subject area. By doing this, a 3D model of spectral data can be built, this would allow the user to see where on the blade erosion is occurring.
37
NLR-CR-2020-223 | May 2021
Figure 3.19: Example of drone equipped with integrated LIDAR and hyperspectral sensor [58] In perspective of AIRTuB: Even though the spectral imaging shows promising progress to detect damage, the results of such approach seem to be lacking of sufficient depth resolution for AIRTuB application. It is even questionable whether this method can be categorized as a 3D visual method. The strength of these techniques is its capability to visualize invisible features on the surface emitting different electromagnetic wave band whenever there is any chemical change. Light erosion (for example, pits with shallow depths which does not reveal the bare structure underneath the gelcoat) on the wind blade may be hard to distinguish from visual inspection, however, it is questionable whether spectral imaging can visualize such erosion with sufficient depth information.
3.7 Concluding Remarks
Currently, there are many commercial solutions available where a drone is equipped with high-definition camera to take a detailed information regarding possible damages on the surface of wind turbine blades (see [59, 60] and Chapter 2. However, there is no example yet where detailed damage profile in 3D can be determined. Such measurement can be of valuable information if the damage has to be repaired remotely (ambition of AIRTuB project), because a 3D contour and exact location and orientation of the damage is essential information beforehand. So far, a 2D camera image lacks of these information. Therefore, it is justified to look into the inspection methods that can provide 3D information of the damage. Considering the methods that have been explored in this chapter, (stereo) passive methods (see Section 3.1), structured lights (see Section 3.2), phase shift laser method (see Section 3.4) and spectral imaging (see Section 3.6) are not suitable for inspecting the wind turbine blade with drone. ToF laser methods, especially LIDAR system (see Section 3.4 and 3.5), can be used to orient the drone with respect to the wind blade. Currently, triangularization based laser method seems
38
NLR-CR-2020-223 | May 2021
to be most suitable for AIRTuB program enabling detection of the erosion on the wind blade. Table 3.2 shows typical properties of the visual methods that have been discussed in this chapter with its strengths and weaknesses in light of AIRTuB project. From damage identification point of view, passive and spectral imaging methods lack of capability. Structured light is sensitive to the ambient light condition. Phase shift method lacks of light miniaturized system for drone application while sensitivity to measure depth and size of erosion is insufficient. Triangulation laser is the only method that can potentially measure the required erosion target for AIRTuB project, see Figure 2.14. Three aspects have to be further investigated in the project.
1. What is the effect of vibration? In the literature, not much could be found how exactly the vibration from environment and the swaying of wind blade may affect the inspection quality.
2. What is the effect of surface condition? Moisture, dirt etc. may scatter the laser reducing the reflected light intensity.
3. The exact flight path has to be known exactly during the measurement. This data is required in order to relate the location of the erosion. Furthermore, if multiple flight paths are required to cover all surface of the wind blade, location data is necessary. For this purpose, GPS data can be inaccurate. On the other hand, LIDAR has been used earlier to determine the position of the drone with respect to the wind blade, see Figure 3.14 for such example. In the remainder of AIRTuB project, this solution may be considered to accurately derive the position of the drone.
Table 3.2: Strength and weakness of 3D scan methods
Scan method Strength / Features Weakness
Passive methods (Photogrammetry)
• Distance of measurement between 0.1 to few meters
• Accuracy depends strongly on the distance to the object
• Miniaturization is easy to achieve, light weight components are commercially available
• Surface with sufficient visual characterizations are required
• Erosion depth is hard to determine
Structured light • Distance of measurement varies from 0.1
to several meters • Accuracy from 10 µm
• Strongly dependant on the light condition
• Sensitive to vibration • Surface with sufficient visual
characterizations are required
Triangulation laser
• Distance of measurement varies from order of 0.01 to 1 m
• Accuracy from 10 µm • Available in many forms: (multi) line/area
scanner, handheld scanner, portable arm • Less sensitive to ambient light
• Sensitive to the surface condition
Phase shift laser
• Distance of measurement varies from order of 1 to 100 meter
• Accuracy from 2 mm • Less noisy compared to other laser
techniques
• Accuracy is insufficient to detect damage • Large distance to the object is needed • No miniaturized system available
Time of flight laser (LIDAR)
• Distance of measurement varies from order of 1 to 100 meter
• Commercial system is available for drone platforms (LIDAR)
• Accuracy is insufficient to detect damage
Spectral imaging • Distance of measurement from 1 m
• Surface damage assessment (depth) is not possible
• No robust system available for drone application
39
NLR-CR-2020-223 | May 2021
4 Internal Damage Detection Techniques
This chapter elaborates on the NDI methods suitable to detect typical damage modes for (off-shore) wind blades based on the literature survey. Chapter 2 provides an overview of the material, configurations and damage modes of the wind blades. The objective of this chapter is to provide an overview of promising, mobile inspection techniques for glass composite wind turbine blade structures. NDI methods should be able to inspect thick composite laminates and subsurface bond lines. There are wide group of techniques available to detect production and in-service faults in the structure. However, the challenge is to choose NDI methods that have sufficient sensitivity for the damage modes of interest whilst there is room for miniaturization in order to be carried to the wind turbine blade. This section will focus on literature studies which may fulfil these needs. The following two applications can be distinguished in the AIRTuB programme:
• Rapid survey methods for the inspection of the large wind turbine blade. This rapid survey must be performed by cameras or other sensing systems in combination with a drone. The inspection must lead to the indication of suspect areas worthy of closer attention, and to provide a general statement of yes-or-no acceptance.
• Localised inspection methods for close inspection of the internal structure with sensitive equipment. This localised inspection must be performed by a crawler system which will be put on the blade with a drone. The method must be capable to detect, size and locate the defects in plane and depth. It should also be capable to characterise the type of the damage.
This chapter is organized as follows: Section 4.1 presents summary of the NLR project “Evaluation of non-destructive inspection methods”. Section 4.2 summarizes findings from the project “Development and Assessment of Advanced Inspection Methods for Wind Turbine Blades”. Finally, Section 4.3 elaborates on the novel phased array methods. Each subsection draws a short conclusion to reflect the literature study to the AIRTuB application.
4.1 NLR Project “Evaluation of Non-Destructive Inspection Methods”
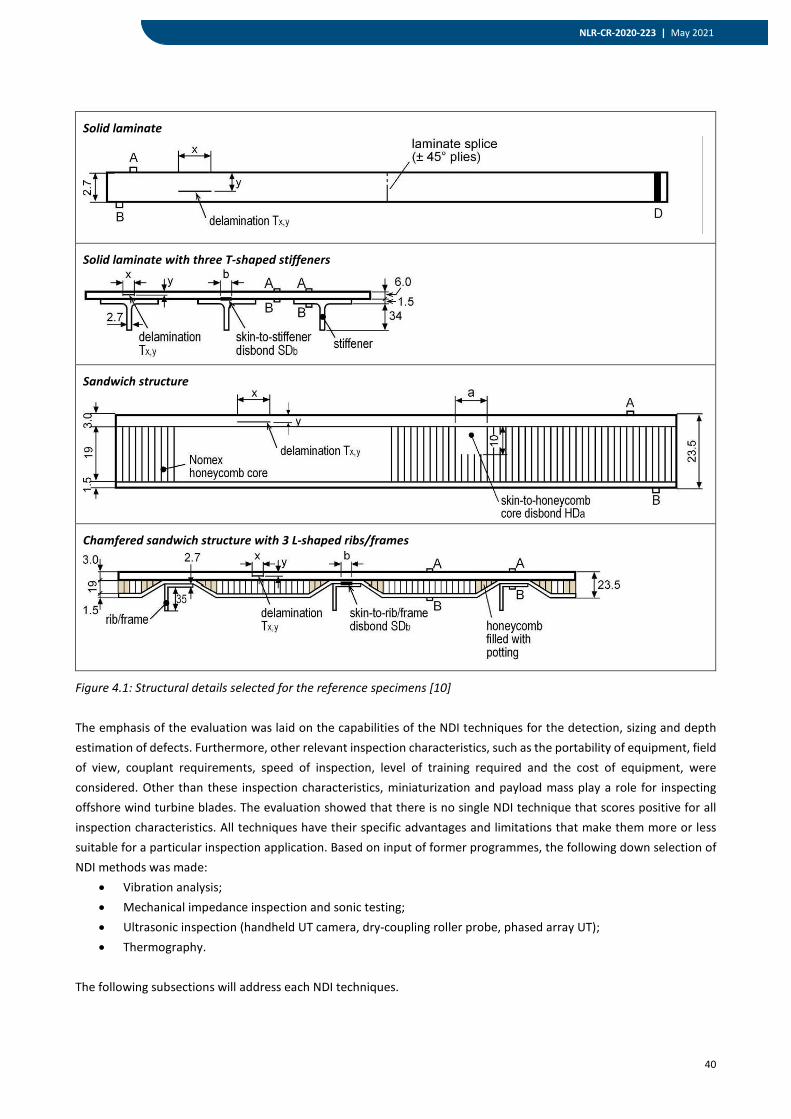
All information of this chapter is retrieved from the project “Evaluation of non-destructive inspection methods”, performed by NLR, see Heida et al. [10]. At the end of the chapter, a short statement is made about the pros and cons of the NDI method in relation with the AIRTuB programme. The used test components (carbon fibre reinforced specimens) are representative for the primary structures of the aircraft/helicopter vehicles, and comprise solid laminates and sandwich structures with or without stiffeners. The damage types in the test components included impact damage, interply delaminations and disbonds which are also relevant damages types for wind turbine blades. Figure 4.1 shows the structural details of the used reference specimens.
40
NLR-CR-2020-223 | May 2021
Solid laminate
Solid laminate with three T-shaped stiffeners
Sandwich structure
Chamfered sandwich structure with 3 L-shaped ribs/frames
Figure 4.1: Structural details selected for the reference specimens [10] The emphasis of the evaluation was laid on the capabilities of the NDI techniques for the detection, sizing and depth estimation of defects. Furthermore, other relevant inspection characteristics, such as the portability of equipment, field of view, couplant requirements, speed of inspection, level of training required and the cost of equipment, were considered. Other than these inspection characteristics, miniaturization and payload mass play a role for inspecting offshore wind turbine blades. The evaluation showed that there is no single NDI technique that scores positive for all inspection characteristics. All techniques have their specific advantages and limitations that make them more or less suitable for a particular inspection application. Based on input of former programmes, the following down selection of NDI methods was made:
• Vibration analysis; • Mechanical impedance inspection and sonic testing; • Ultrasonic inspection (handheld UT camera, dry-coupling roller probe, phased array UT); • Thermography.
The following subsections will address each NDI techniques.
41
NLR-CR-2020-223 | May 2021
4.1.1 Vibration Analysis
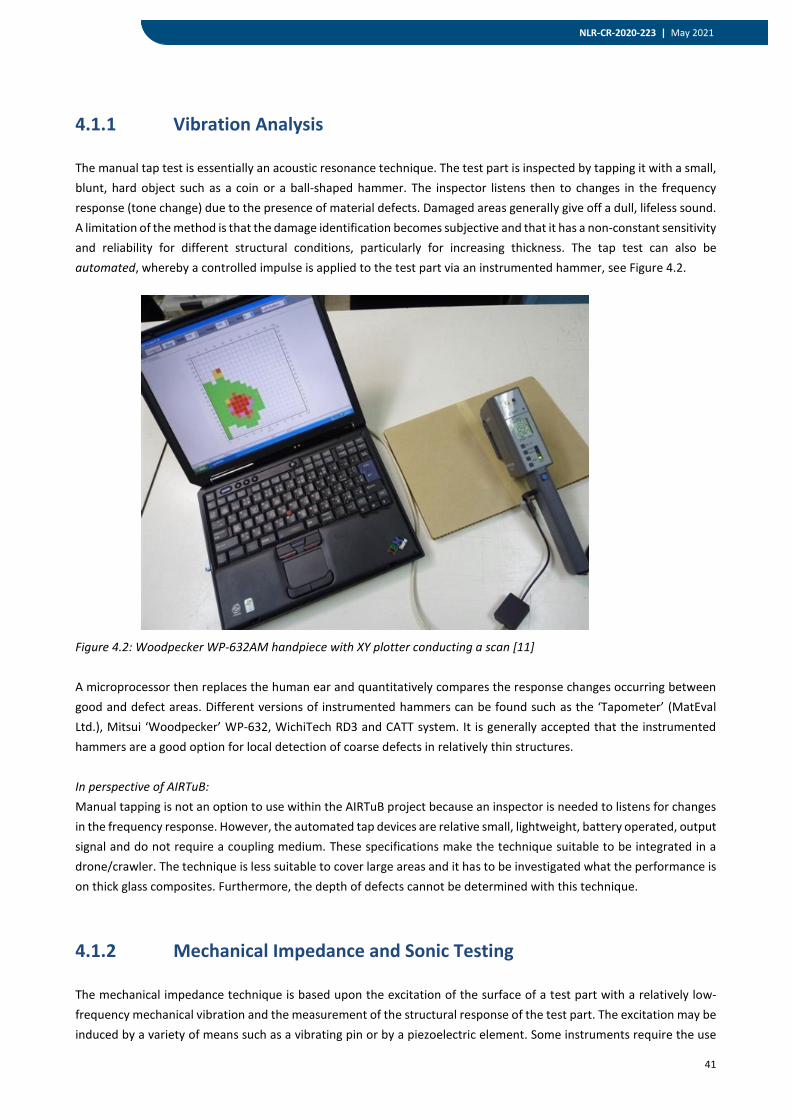
The manual tap test is essentially an acoustic resonance technique. The test part is inspected by tapping it with a small, blunt, hard object such as a coin or a ball-shaped hammer. The inspector listens then to changes in the frequency response (tone change) due to the presence of material defects. Damaged areas generally give off a dull, lifeless sound. A limitation of the method is that the damage identification becomes subjective and that it has a non-constant sensitivity and reliability for different structural conditions, particularly for increasing thickness. The tap test can also be automated, whereby a controlled impulse is applied to the test part via an instrumented hammer, see Figure 4.2.
Figure 4.2: Woodpecker WP-632AM handpiece with XY plotter conducting a scan [11] A microprocessor then replaces the human ear and quantitatively compares the response changes occurring between good and defect areas. Different versions of instrumented hammers can be found such as the ‘Tapometer’ (MatEval Ltd.), Mitsui ‘Woodpecker’ WP-632, WichiTech RD3 and CATT system. It is generally accepted that the instrumented hammers are a good option for local detection of coarse defects in relatively thin structures. In perspective of AIRTuB: Manual tapping is not an option to use within the AIRTuB project because an inspector is needed to listens for changes in the frequency response. However, the automated tap devices are relative small, lightweight, battery operated, output signal and do not require a coupling medium. These specifications make the technique suitable to be integrated in a drone/crawler. The technique is less suitable to cover large areas and it has to be investigated what the performance is on thick glass composites. Furthermore, the depth of defects cannot be determined with this technique.
4.1.2 Mechanical Impedance and Sonic Testing
The mechanical impedance technique is based upon the excitation of the surface of a test part with a relatively low-frequency mechanical vibration and the measurement of the structural response of the test part. The excitation may be induced by a variety of means such as a vibrating pin or by a piezoelectric element. Some instruments require the use
42
NLR-CR-2020-223 | May 2021
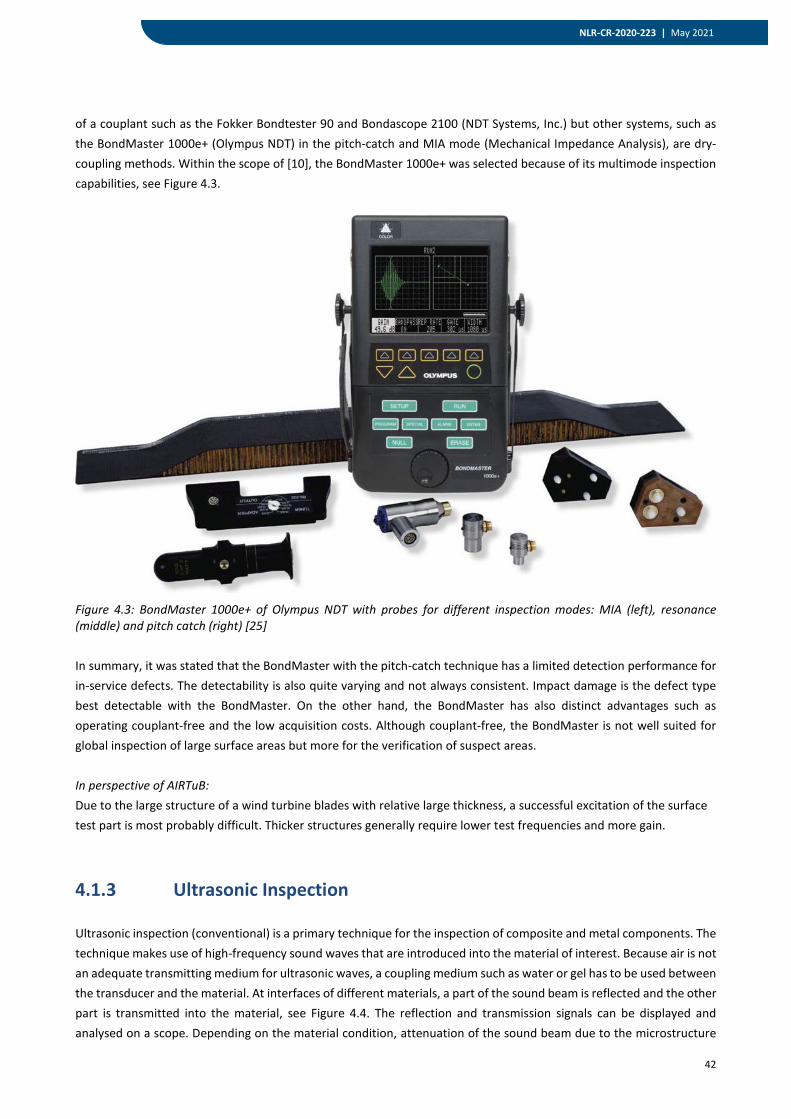
of a couplant such as the Fokker Bondtester 90 and Bondascope 2100 (NDT Systems, Inc.) but other systems, such as the BondMaster 1000e+ (Olympus NDT) in the pitch-catch and MIA mode (Mechanical Impedance Analysis), are dry-coupling methods. Within the scope of [10], the BondMaster 1000e+ was selected because of its multimode inspection capabilities, see Figure 4.3.
Figure 4.3: BondMaster 1000e+ of Olympus NDT with probes for different inspection modes: MIA (left), resonance (middle) and pitch catch (right) [25] In summary, it was stated that the BondMaster with the pitch-catch technique has a limited detection performance for in-service defects. The detectability is also quite varying and not always consistent. Impact damage is the defect type best detectable with the BondMaster. On the other hand, the BondMaster has also distinct advantages such as operating couplant-free and the low acquisition costs. Although couplant-free, the BondMaster is not well suited for global inspection of large surface areas but more for the verification of suspect areas. In perspective of AIRTuB: Due to the large structure of a wind turbine blades with relative large thickness, a successful excitation of the surface test part is most probably difficult. Thicker structures generally require lower test frequencies and more gain.
4.1.3 Ultrasonic Inspection
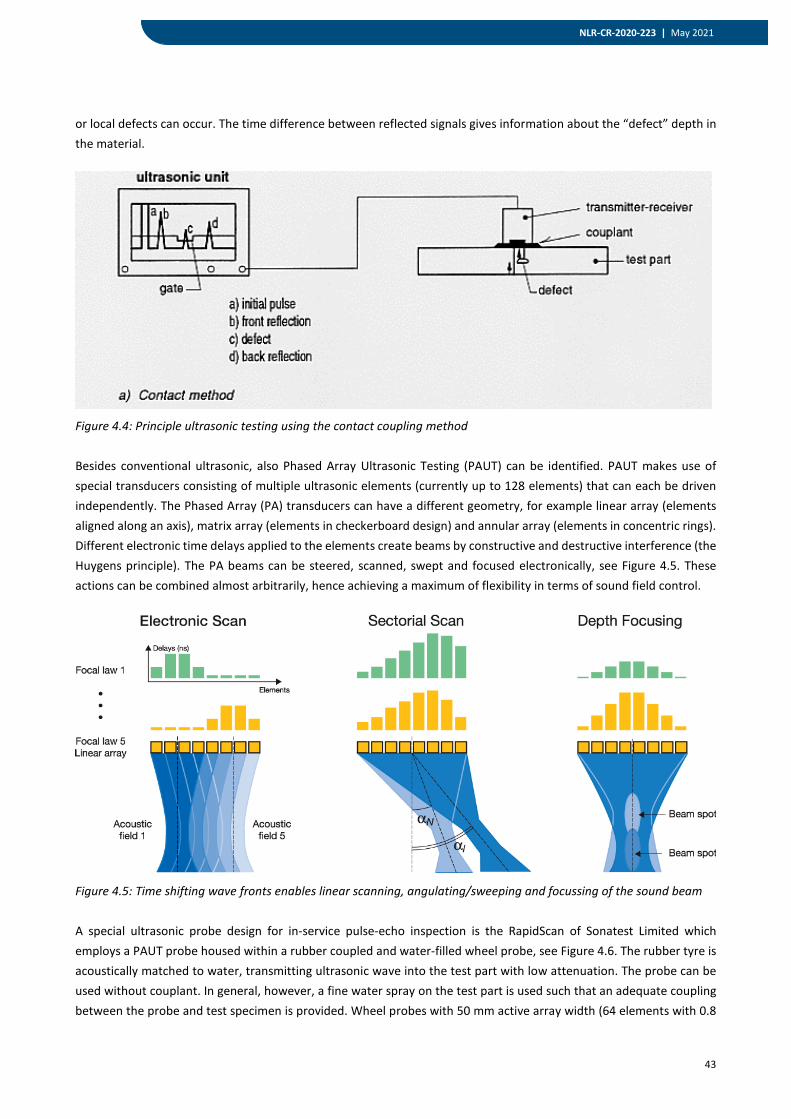
Ultrasonic inspection (conventional) is a primary technique for the inspection of composite and metal components. The technique makes use of high-frequency sound waves that are introduced into the material of interest. Because air is not an adequate transmitting medium for ultrasonic waves, a coupling medium such as water or gel has to be used between the transducer and the material. At interfaces of different materials, a part of the sound beam is reflected and the other part is transmitted into the material, see Figure 4.4. The reflection and transmission signals can be displayed and analysed on a scope. Depending on the material condition, attenuation of the sound beam due to the microstructure
43
NLR-CR-2020-223 | May 2021
or local defects can occur. The time difference between reflected signals gives information about the “defect” depth in the material.
Figure 4.4: Principle ultrasonic testing using the contact coupling method Besides conventional ultrasonic, also Phased Array Ultrasonic Testing (PAUT) can be identified. PAUT makes use of special transducers consisting of multiple ultrasonic elements (currently up to 128 elements) that can each be driven independently. The Phased Array (PA) transducers can have a different geometry, for example linear array (elements aligned along an axis), matrix array (elements in checkerboard design) and annular array (elements in concentric rings). Different electronic time delays applied to the elements create beams by constructive and destructive interference (the Huygens principle). The PA beams can be steered, scanned, swept and focused electronically, see Figure 4.5. These actions can be combined almost arbitrarily, hence achieving a maximum of flexibility in terms of sound field control.
Figure 4.5: Time shifting wave fronts enables linear scanning, angulating/sweeping and focussing of the sound beam A special ultrasonic probe design for in-service pulse-echo inspection is the RapidScan of Sonatest Limited which employs a PAUT probe housed within a rubber coupled and water-filled wheel probe, see Figure 4.6. The rubber tyre is acoustically matched to water, transmitting ultrasonic wave into the test part with low attenuation. The probe can be used without couplant. In general, however, a fine water spray on the test part is used such that an adequate coupling between the probe and test specimen is provided. Wheel probes with 50 mm active array width (64 elements with 0.8
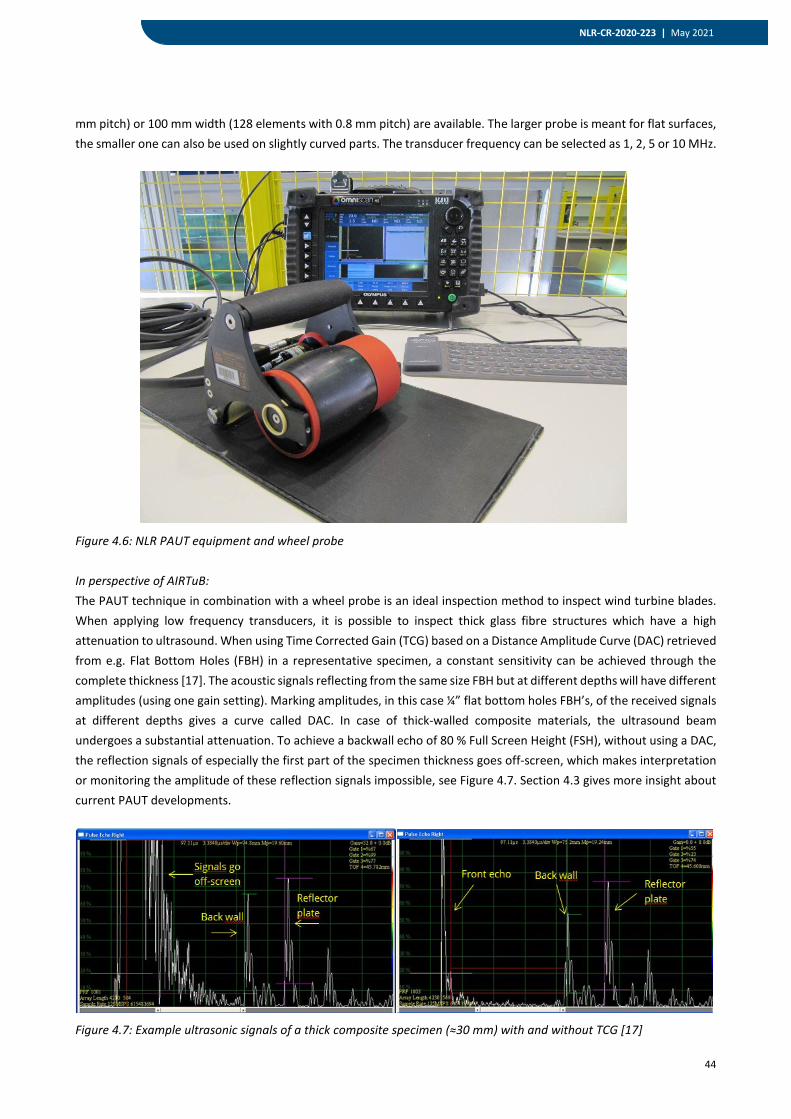
44
NLR-CR-2020-223 | May 2021
mm pitch) or 100 mm width (128 elements with 0.8 mm pitch) are available. The larger probe is meant for flat surfaces, the smaller one can also be used on slightly curved parts. The transducer frequency can be selected as 1, 2, 5 or 10 MHz.
Figure 4.6: NLR PAUT equipment and wheel probe In perspective of AIRTuB: The PAUT technique in combination with a wheel probe is an ideal inspection method to inspect wind turbine blades. When applying low frequency transducers, it is possible to inspect thick glass fibre structures which have a high attenuation to ultrasound. When using Time Corrected Gain (TCG) based on a Distance Amplitude Curve (DAC) retrieved from e.g. Flat Bottom Holes (FBH) in a representative specimen, a constant sensitivity can be achieved through the complete thickness [17]. The acoustic signals reflecting from the same size FBH but at different depths will have different amplitudes (using one gain setting). Marking amplitudes, in this case ¼” flat bottom holes FBH’s, of the received signals at different depths gives a curve called DAC. In case of thick-walled composite materials, the ultrasound beam undergoes a substantial attenuation. To achieve a backwall echo of 80 % Full Screen Height (FSH), without using a DAC, the reflection signals of especially the first part of the specimen thickness goes off-screen, which makes interpretation or monitoring the amplitude of these reflection signals impossible, see Figure 4.7. Section 4.3 gives more insight about current PAUT developments.
Figure 4.7: Example ultrasonic signals of a thick composite specimen (≈30 mm) with and without TCG [17]
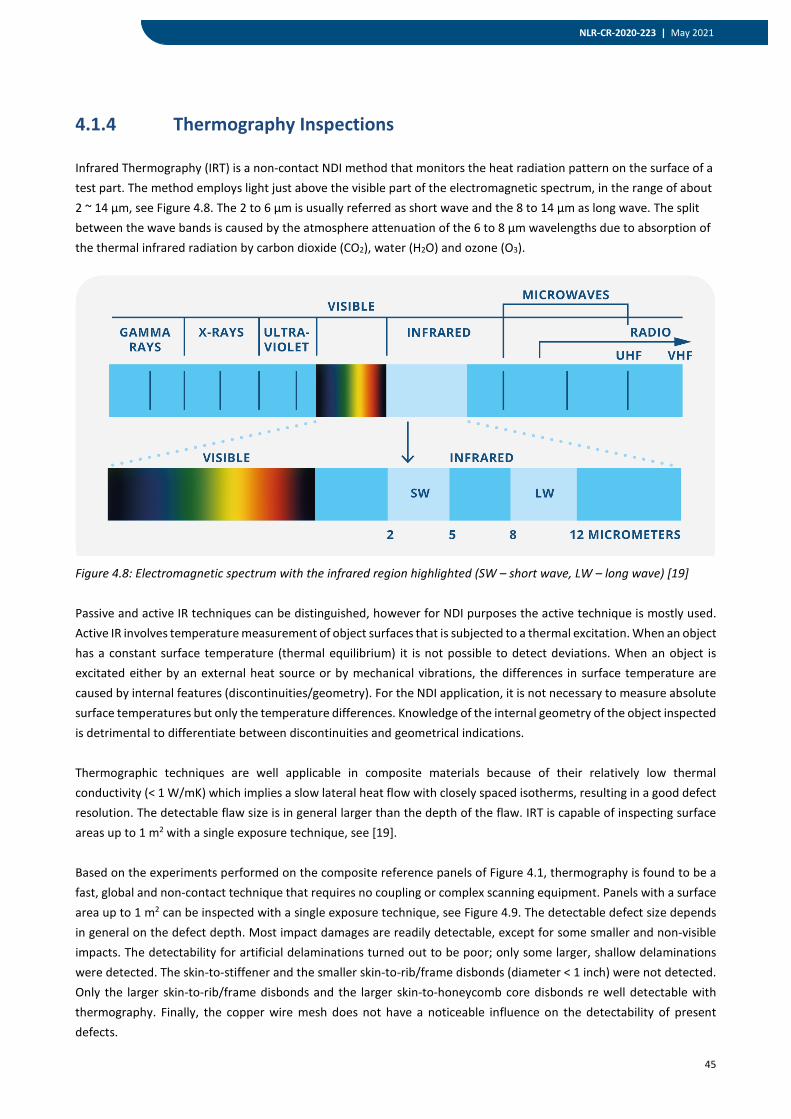
45
NLR-CR-2020-223 | May 2021
4.1.4 Thermography Inspections
Infrared Thermography (IRT) is a non-contact NDI method that monitors the heat radiation pattern on the surface of a test part. The method employs light just above the visible part of the electromagnetic spectrum, in the range of about 2 ~ 14 μm, see Figure 4.8. The 2 to 6 μm is usually referred as short wave and the 8 to 14 μm as long wave. The split between the wave bands is caused by the atmosphere attenuation of the 6 to 8 μm wavelengths due to absorption of the thermal infrared radiation by carbon dioxide (CO2), water (H2O) and ozone (O3).
Figure 4.8: Electromagnetic spectrum with the infrared region highlighted (SW – short wave, LW – long wave) [19] Passive and active IR techniques can be distinguished, however for NDI purposes the active technique is mostly used. Active IR involves temperature measurement of object surfaces that is subjected to a thermal excitation. When an object has a constant surface temperature (thermal equilibrium) it is not possible to detect deviations. When an object is excitated either by an external heat source or by mechanical vibrations, the differences in surface temperature are caused by internal features (discontinuities/geometry). For the NDI application, it is not necessary to measure absolute surface temperatures but only the temperature differences. Knowledge of the internal geometry of the object inspected is detrimental to differentiate between discontinuities and geometrical indications. Thermographic techniques are well applicable in composite materials because of their relatively low thermal conductivity (< 1 W/mK) which implies a slow lateral heat flow with closely spaced isotherms, resulting in a good defect resolution. The detectable flaw size is in general larger than the depth of the flaw. IRT is capable of inspecting surface areas up to 1 m2 with a single exposure technique, see [19]. Based on the experiments performed on the composite reference panels of Figure 4.1, thermography is found to be a fast, global and non-contact technique that requires no coupling or complex scanning equipment. Panels with a surface area up to 1 m2 can be inspected with a single exposure technique, see Figure 4.9. The detectable defect size depends in general on the defect depth. Most impact damages are readily detectable, except for some smaller and non-visible impacts. The detectability for artificial delaminations turned out to be poor; only some larger, shallow delaminations were detected. The skin-to-stiffener and the smaller skin-to-rib/frame disbonds (diameter < 1 inch) were not detected. Only the larger skin-to-rib/frame disbonds and the larger skin-to-honeycomb core disbonds re well detectable with thermography. Finally, the copper wire mesh does not have a noticeable influence on the detectability of present defects.
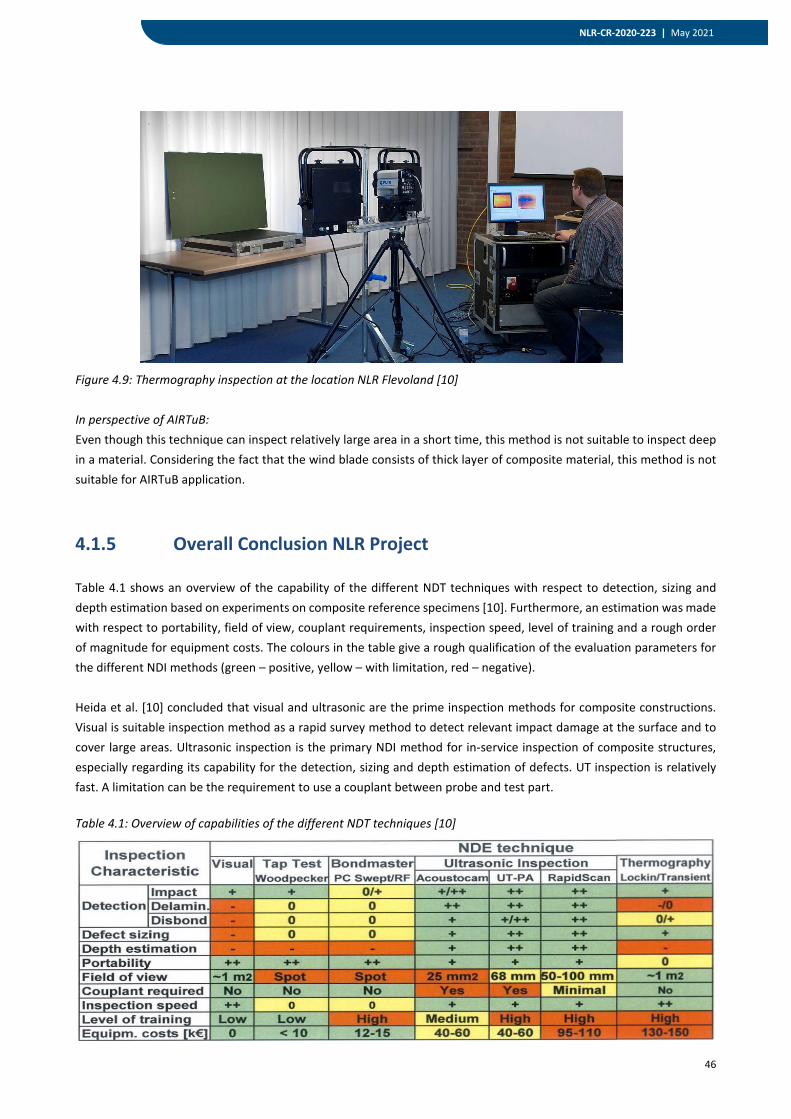
46
NLR-CR-2020-223 | May 2021
Figure 4.9: Thermography inspection at the location NLR Flevoland [10] In perspective of AIRTuB: Even though this technique can inspect relatively large area in a short time, this method is not suitable to inspect deep in a material. Considering the fact that the wind blade consists of thick layer of composite material, this method is not suitable for AIRTuB application.
4.1.5 Overall Conclusion NLR Project
Table 4.1 shows an overview of the capability of the different NDT techniques with respect to detection, sizing and depth estimation based on experiments on composite reference specimens [10]. Furthermore, an estimation was made with respect to portability, field of view, couplant requirements, inspection speed, level of training and a rough order of magnitude for equipment costs. The colours in the table give a rough qualification of the evaluation parameters for the different NDI methods (green – positive, yellow – with limitation, red – negative). Heida et al. [10] concluded that visual and ultrasonic are the prime inspection methods for composite constructions. Visual is suitable inspection method as a rapid survey method to detect relevant impact damage at the surface and to cover large areas. Ultrasonic inspection is the primary NDI method for in-service inspection of composite structures, especially regarding its capability for the detection, sizing and depth estimation of defects. UT inspection is relatively fast. A limitation can be the requirement to use a couplant between probe and test part. Table 4.1: Overview of capabilities of the different NDT techniques [10]
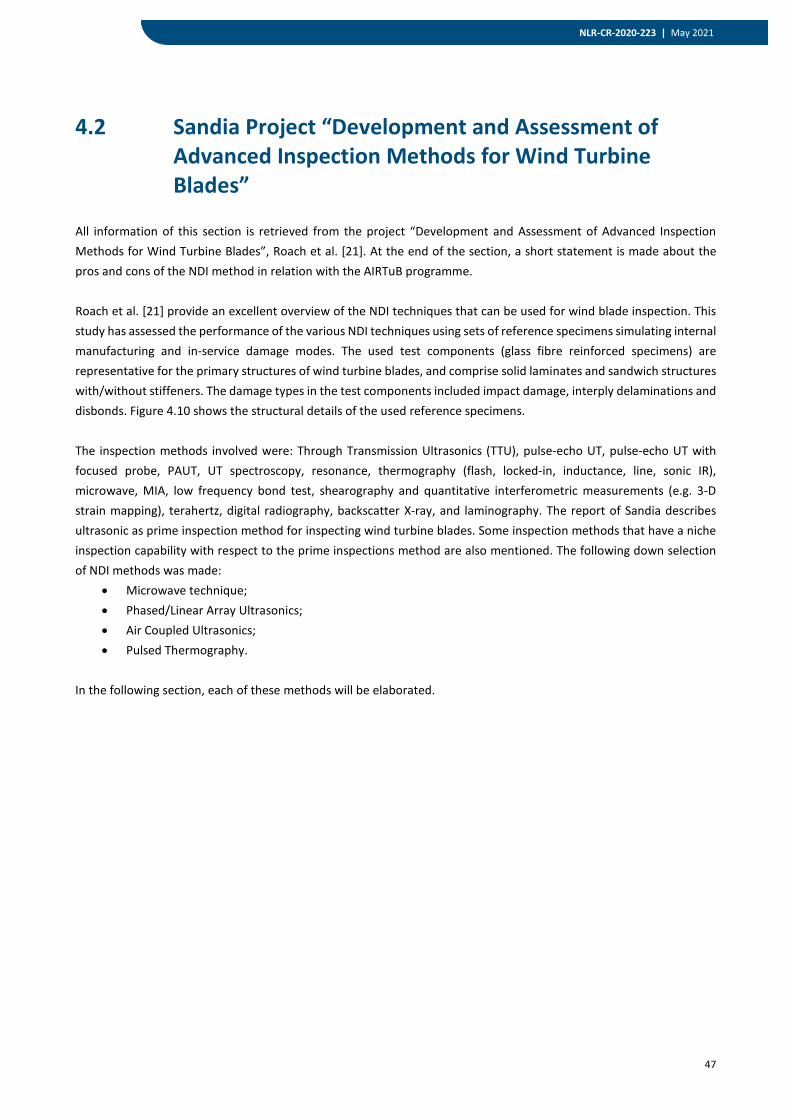
47
NLR-CR-2020-223 | May 2021
4.2 Sandia Project “Development and Assessment of Advanced Inspection Methods for Wind Turbine Blades”
All information of this section is retrieved from the project “Development and Assessment of Advanced Inspection Methods for Wind Turbine Blades”, Roach et al. [21]. At the end of the section, a short statement is made about the pros and cons of the NDI method in relation with the AIRTuB programme. Roach et al. [21] provide an excellent overview of the NDI techniques that can be used for wind blade inspection. This study has assessed the performance of the various NDI techniques using sets of reference specimens simulating internal manufacturing and in-service damage modes. The used test components (glass fibre reinforced specimens) are representative for the primary structures of wind turbine blades, and comprise solid laminates and sandwich structures with/without stiffeners. The damage types in the test components included impact damage, interply delaminations and disbonds. Figure 4.10 shows the structural details of the used reference specimens. The inspection methods involved were: Through Transmission Ultrasonics (TTU), pulse-echo UT, pulse-echo UT with focused probe, PAUT, UT spectroscopy, resonance, thermography (flash, locked-in, inductance, line, sonic IR), microwave, MIA, low frequency bond test, shearography and quantitative interferometric measurements (e.g. 3-D strain mapping), terahertz, digital radiography, backscatter X-ray, and laminography. The report of Sandia describes ultrasonic as prime inspection method for inspecting wind turbine blades. Some inspection methods that have a niche inspection capability with respect to the prime inspections method are also mentioned. The following down selection of NDI methods was made:
• Microwave technique; • Phased/Linear Array Ultrasonics; • Air Coupled Ultrasonics; • Pulsed Thermography.
In the following section, each of these methods will be elaborated.
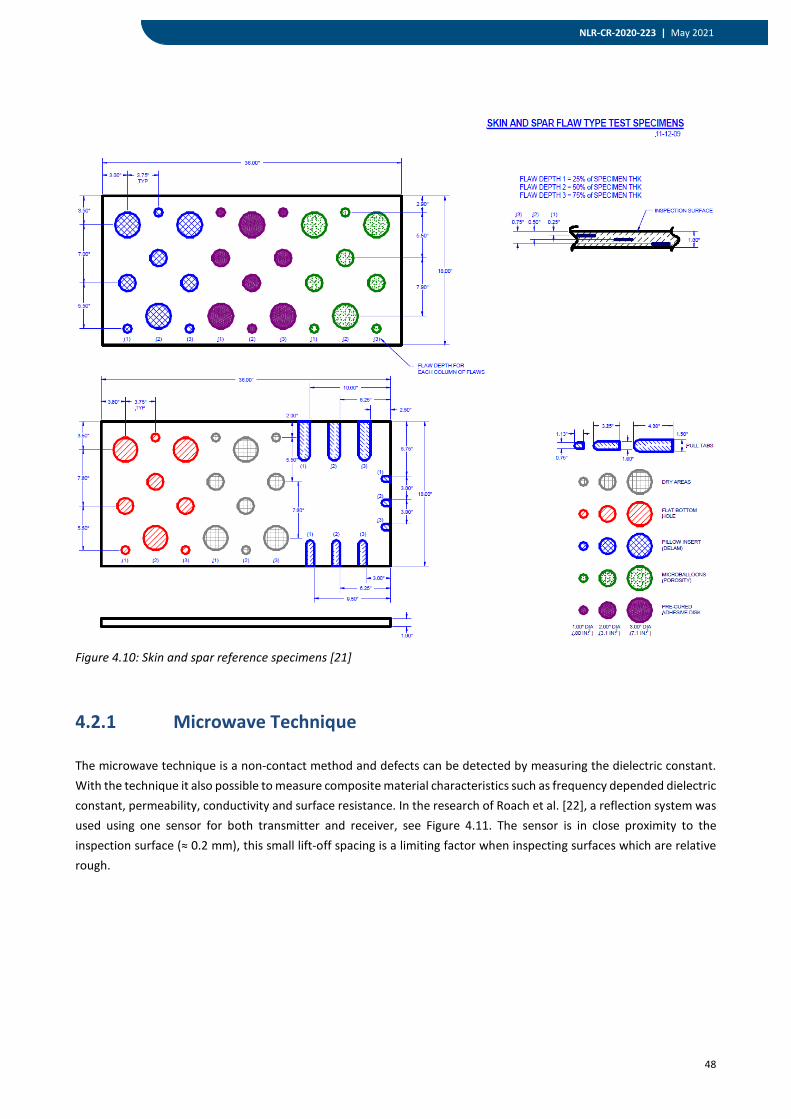
48
NLR-CR-2020-223 | May 2021
Figure 4.10: Skin and spar reference specimens [21]
4.2.1 Microwave Technique
The microwave technique is a non-contact method and defects can be detected by measuring the dielectric constant. With the technique it also possible to measure composite material characteristics such as frequency depended dielectric constant, permeability, conductivity and surface resistance. In the research of Roach et al. [22], a reflection system was used using one sensor for both transmitter and receiver, see Figure 4.11. The sensor is in close proximity to the inspection surface (≈ 0.2 mm), this small lift-off spacing is a limiting factor when inspecting surfaces which are relative rough.
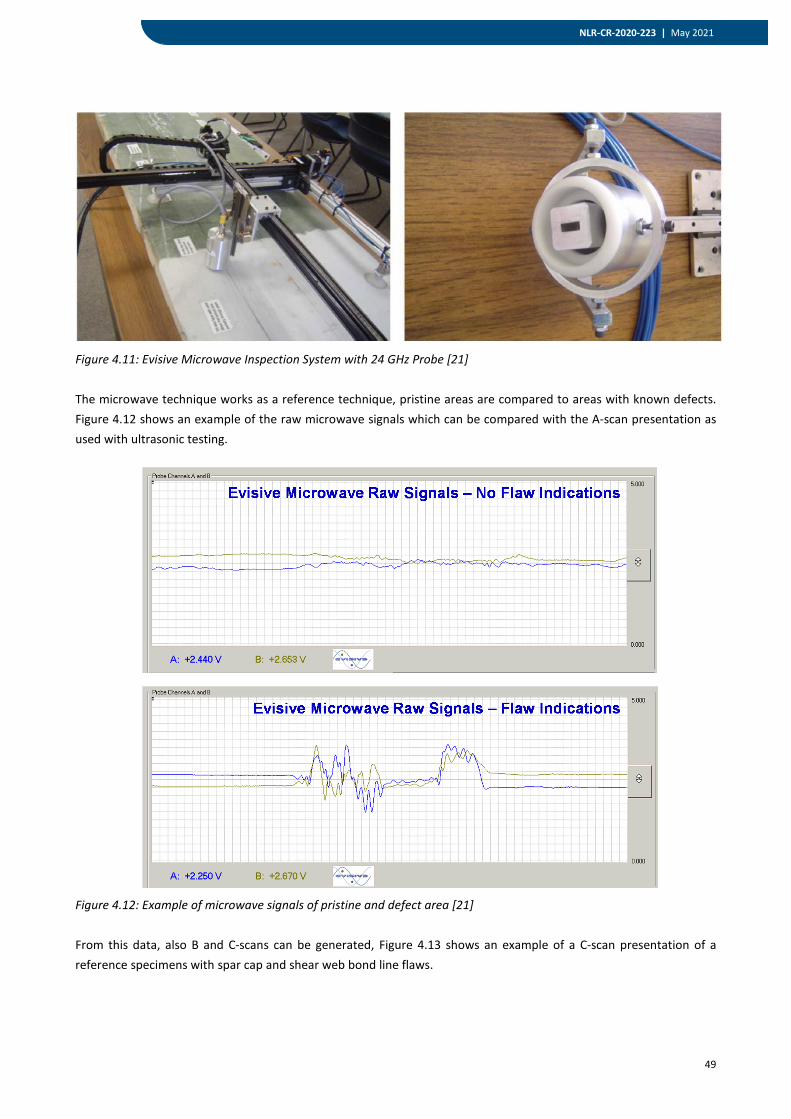
49
NLR-CR-2020-223 | May 2021
Figure 4.11: Evisive Microwave Inspection System with 24 GHz Probe [21] The microwave technique works as a reference technique, pristine areas are compared to areas with known defects. Figure 4.12 shows an example of the raw microwave signals which can be compared with the A-scan presentation as used with ultrasonic testing.
Figure 4.12: Example of microwave signals of pristine and defect area [21] From this data, also B and C-scans can be generated, Figure 4.13 shows an example of a C-scan presentation of a reference specimens with spar cap and shear web bond line flaws.
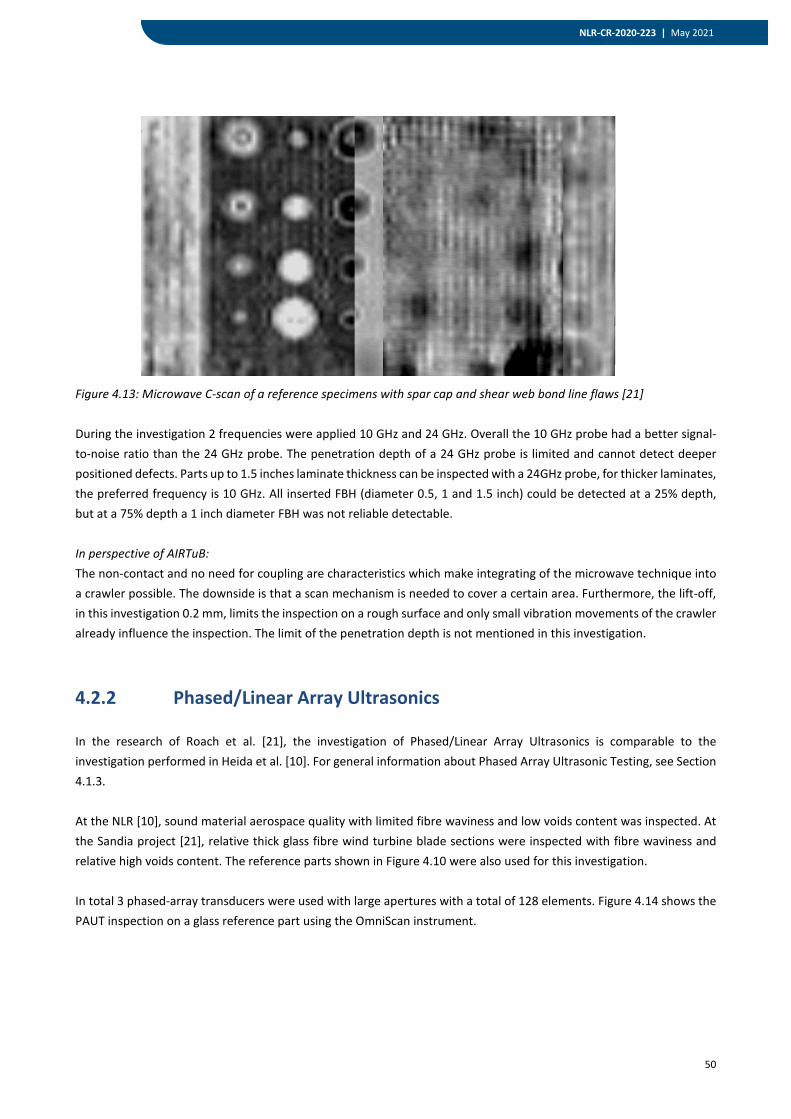
50
NLR-CR-2020-223 | May 2021
Figure 4.13: Microwave C-scan of a reference specimens with spar cap and shear web bond line flaws [21] During the investigation 2 frequencies were applied 10 GHz and 24 GHz. Overall the 10 GHz probe had a better signal-to-noise ratio than the 24 GHz probe. The penetration depth of a 24 GHz probe is limited and cannot detect deeper positioned defects. Parts up to 1.5 inches laminate thickness can be inspected with a 24GHz probe, for thicker laminates, the preferred frequency is 10 GHz. All inserted FBH (diameter 0.5, 1 and 1.5 inch) could be detected at a 25% depth, but at a 75% depth a 1 inch diameter FBH was not reliable detectable. In perspective of AIRTuB: The non-contact and no need for coupling are characteristics which make integrating of the microwave technique into a crawler possible. The downside is that a scan mechanism is needed to cover a certain area. Furthermore, the lift-off, in this investigation 0.2 mm, limits the inspection on a rough surface and only small vibration movements of the crawler already influence the inspection. The limit of the penetration depth is not mentioned in this investigation.
4.2.2 Phased/Linear Array Ultrasonics
In the research of Roach et al. [21], the investigation of Phased/Linear Array Ultrasonics is comparable to the investigation performed in Heida et al. [10]. For general information about Phased Array Ultrasonic Testing, see Section 4.1.3. At the NLR [10], sound material aerospace quality with limited fibre waviness and low voids content was inspected. At the Sandia project [21], relative thick glass fibre wind turbine blade sections were inspected with fibre waviness and relative high voids content. The reference parts shown in Figure 4.10 were also used for this investigation. In total 3 phased-array transducers were used with large apertures with a total of 128 elements. Figure 4.14 shows the PAUT inspection on a glass reference part using the OmniScan instrument.
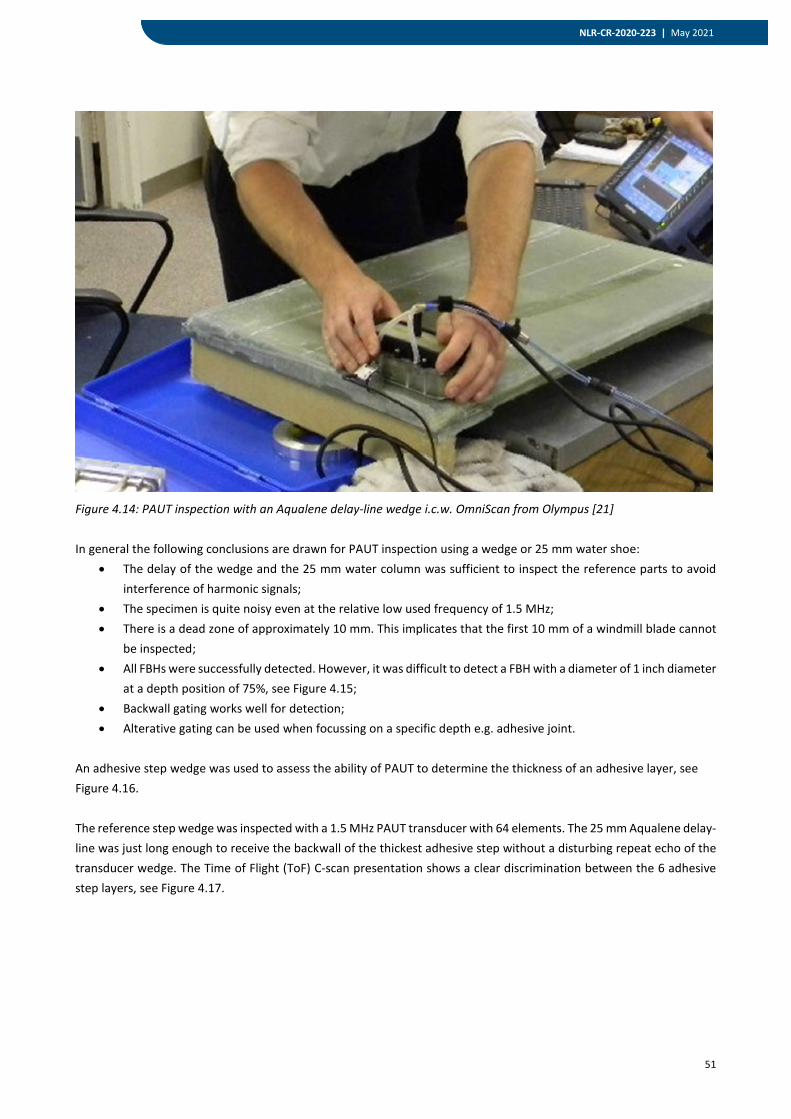
51
NLR-CR-2020-223 | May 2021
Figure 4.14: PAUT inspection with an Aqualene delay-line wedge i.c.w. OmniScan from Olympus [21] In general the following conclusions are drawn for PAUT inspection using a wedge or 25 mm water shoe:
• The delay of the wedge and the 25 mm water column was sufficient to inspect the reference parts to avoid interference of harmonic signals;
• The specimen is quite noisy even at the relative low used frequency of 1.5 MHz; • There is a dead zone of approximately 10 mm. This implicates that the first 10 mm of a windmill blade cannot
be inspected; • All FBHs were successfully detected. However, it was difficult to detect a FBH with a diameter of 1 inch diameter
at a depth position of 75%, see Figure 4.15; • Backwall gating works well for detection; • Alterative gating can be used when focussing on a specific depth e.g. adhesive joint.
An adhesive step wedge was used to assess the ability of PAUT to determine the thickness of an adhesive layer, see Figure 4.16. The reference step wedge was inspected with a 1.5 MHz PAUT transducer with 64 elements. The 25 mm Aqualene delay-line was just long enough to receive the backwall of the thickest adhesive step without a disturbing repeat echo of the transducer wedge. The Time of Flight (ToF) C-scan presentation shows a clear discrimination between the 6 adhesive step layers, see Figure 4.17.
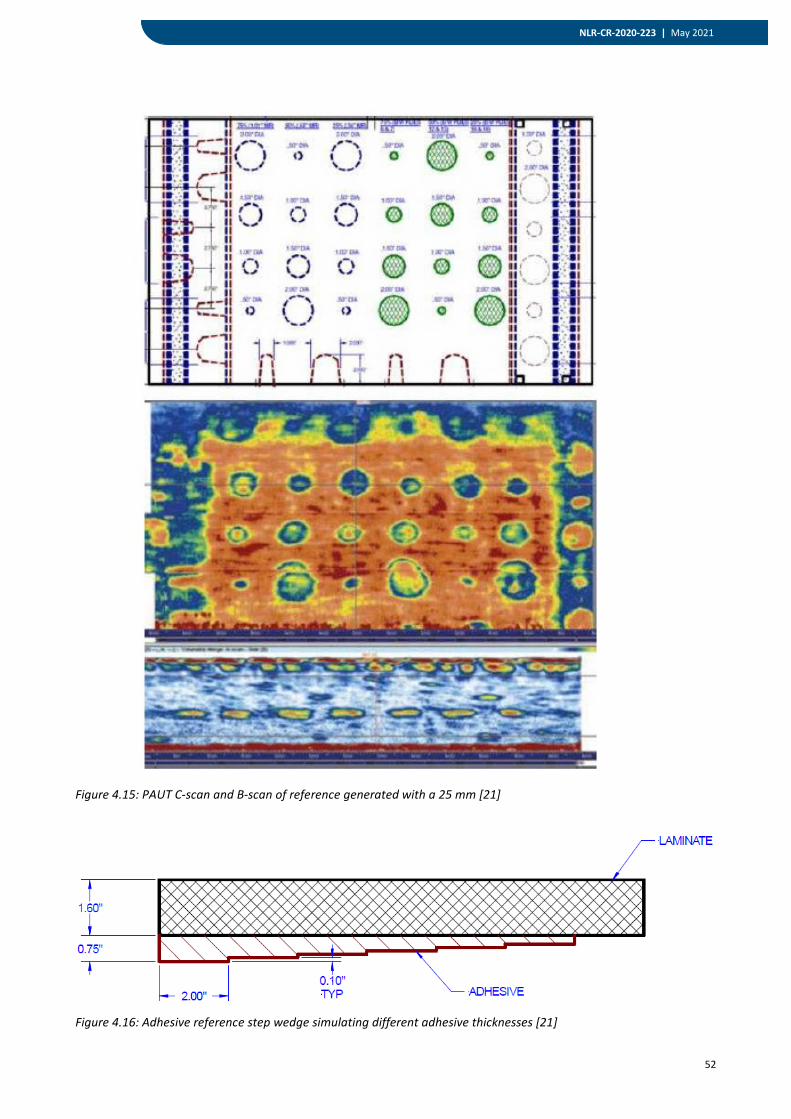
52
NLR-CR-2020-223 | May 2021
Figure 4.15: PAUT C-scan and B-scan of reference generated with a 25 mm [21]
Figure 4.16: Adhesive reference step wedge simulating different adhesive thicknesses [21]
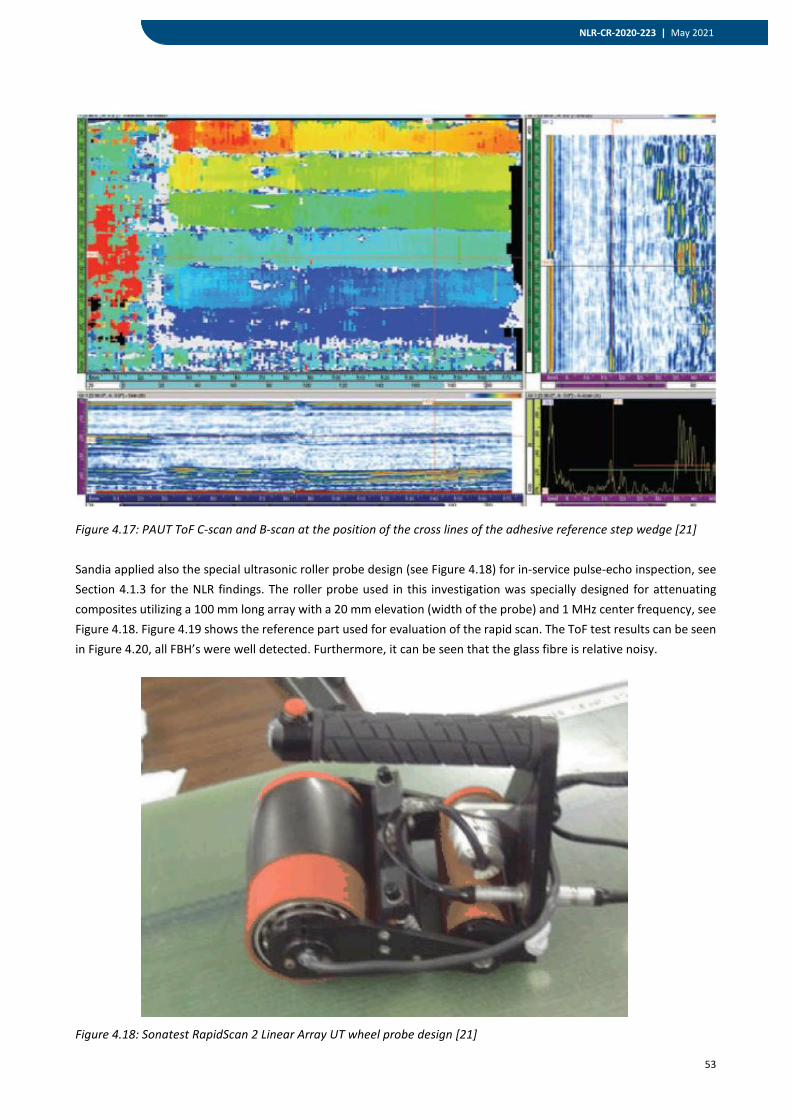
53
NLR-CR-2020-223 | May 2021
Figure 4.17: PAUT ToF C-scan and B-scan at the position of the cross lines of the adhesive reference step wedge [21] Sandia applied also the special ultrasonic roller probe design (see Figure 4.18) for in-service pulse-echo inspection, see Section 4.1.3 for the NLR findings. The roller probe used in this investigation was specially designed for attenuating composites utilizing a 100 mm long array with a 20 mm elevation (width of the probe) and 1 MHz center frequency, see Figure 4.18. Figure 4.19 shows the reference part used for evaluation of the rapid scan. The ToF test results can be seen in Figure 4.20, all FBH’s were well detected. Furthermore, it can be seen that the glass fibre is relative noisy.
Figure 4.18: Sonatest RapidScan 2 Linear Array UT wheel probe design [21]
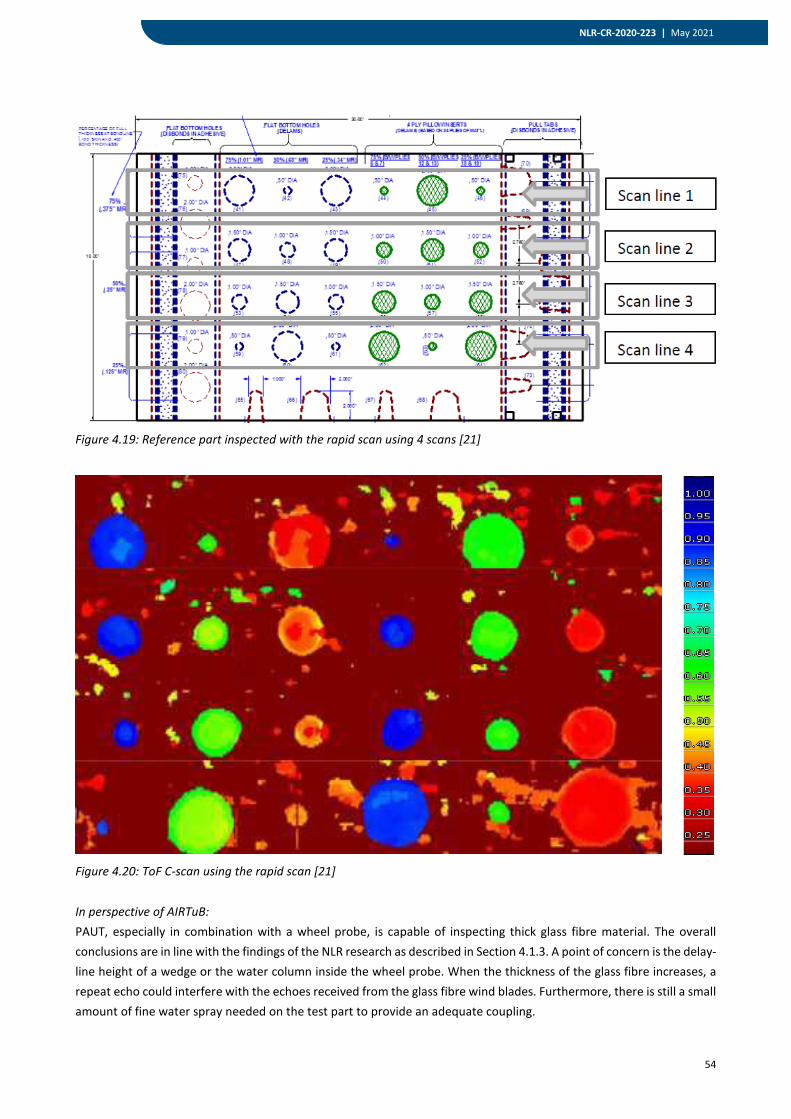
54
NLR-CR-2020-223 | May 2021
Figure 4.19: Reference part inspected with the rapid scan using 4 scans [21]
Figure 4.20: ToF C-scan using the rapid scan [21]
In perspective of AIRTuB: PAUT, especially in combination with a wheel probe, is capable of inspecting thick glass fibre material. The overall conclusions are in line with the findings of the NLR research as described in Section 4.1.3. A point of concern is the delay-line height of a wedge or the water column inside the wheel probe. When the thickness of the glass fibre increases, a repeat echo could interfere with the echoes received from the glass fibre wind blades. Furthermore, there is still a small amount of fine water spray needed on the test part to provide an adequate coupling.
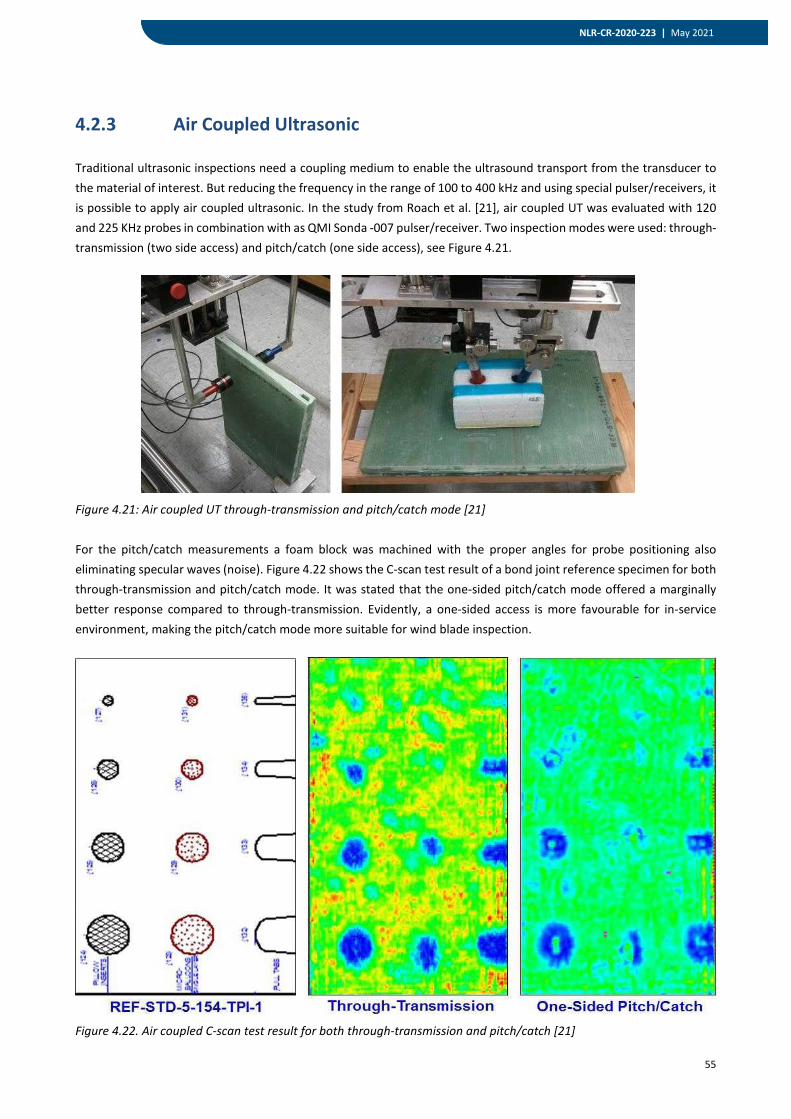
55
NLR-CR-2020-223 | May 2021
4.2.3 Air Coupled Ultrasonic
Traditional ultrasonic inspections need a coupling medium to enable the ultrasound transport from the transducer to the material of interest. But reducing the frequency in the range of 100 to 400 kHz and using special pulser/receivers, it is possible to apply air coupled ultrasonic. In the study from Roach et al. [21], air coupled UT was evaluated with 120 and 225 KHz probes in combination with as QMI Sonda -007 pulser/receiver. Two inspection modes were used: through-transmission (two side access) and pitch/catch (one side access), see Figure 4.21.
Figure 4.21: Air coupled UT through-transmission and pitch/catch mode [21] For the pitch/catch measurements a foam block was machined with the proper angles for probe positioning also eliminating specular waves (noise). Figure 4.22 shows the C-scan test result of a bond joint reference specimen for both through-transmission and pitch/catch mode. It was stated that the one-sided pitch/catch mode offered a marginally better response compared to through-transmission. Evidently, a one-sided access is more favourable for in-service environment, making the pitch/catch mode more suitable for wind blade inspection.
Figure 4.22. Air coupled C-scan test result for both through-transmission and pitch/catch [21]
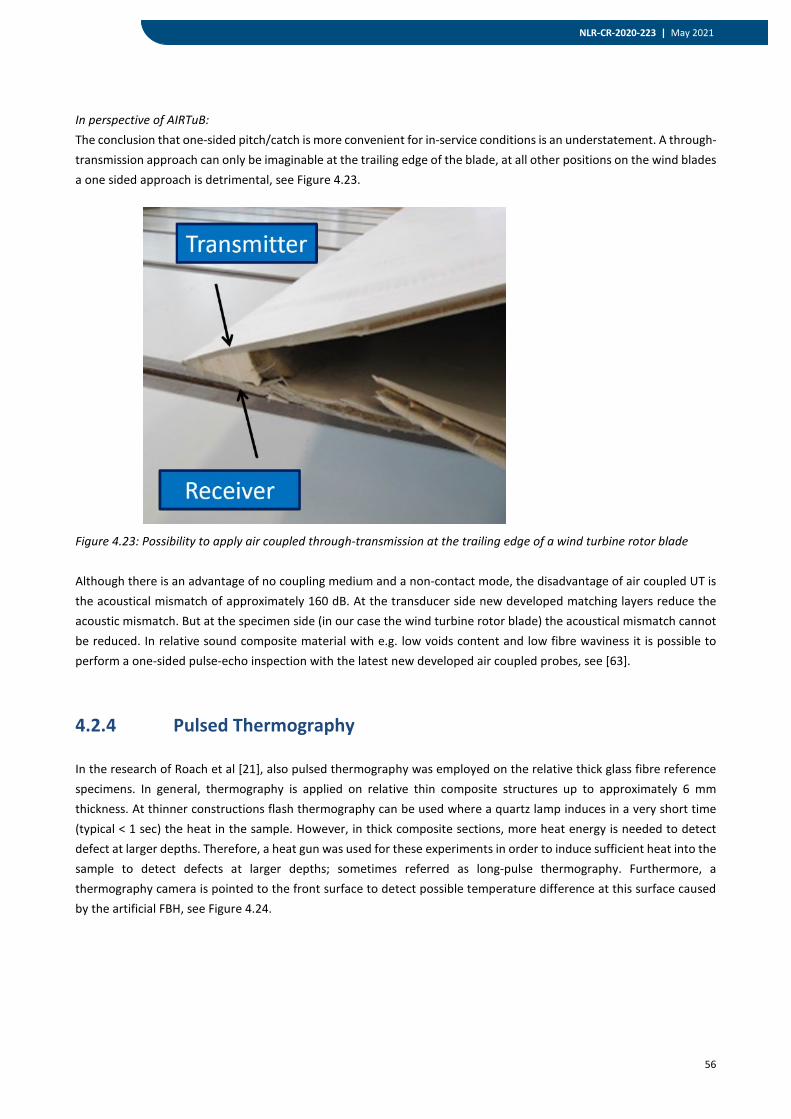
56
NLR-CR-2020-223 | May 2021
In perspective of AIRTuB: The conclusion that one-sided pitch/catch is more convenient for in-service conditions is an understatement. A through-transmission approach can only be imaginable at the trailing edge of the blade, at all other positions on the wind blades a one sided approach is detrimental, see Figure 4.23.
Figure 4.23: Possibility to apply air coupled through-transmission at the trailing edge of a wind turbine rotor blade Although there is an advantage of no coupling medium and a non-contact mode, the disadvantage of air coupled UT is the acoustical mismatch of approximately 160 dB. At the transducer side new developed matching layers reduce the acoustic mismatch. But at the specimen side (in our case the wind turbine rotor blade) the acoustical mismatch cannot be reduced. In relative sound composite material with e.g. low voids content and low fibre waviness it is possible to perform a one-sided pulse-echo inspection with the latest new developed air coupled probes, see [63].
4.2.4 Pulsed Thermography
In the research of Roach et al [21], also pulsed thermography was employed on the relative thick glass fibre reference specimens. In general, thermography is applied on relative thin composite structures up to approximately 6 mm thickness. At thinner constructions flash thermography can be used where a quartz lamp induces in a very short time (typical < 1 sec) the heat in the sample. However, in thick composite sections, more heat energy is needed to detect defect at larger depths. Therefore, a heat gun was used for these experiments in order to induce sufficient heat into the sample to detect defects at larger depths; sometimes referred as long-pulse thermography. Furthermore, a thermography camera is pointed to the front surface to detect possible temperature difference at this surface caused by the artificial FBH, see Figure 4.24.
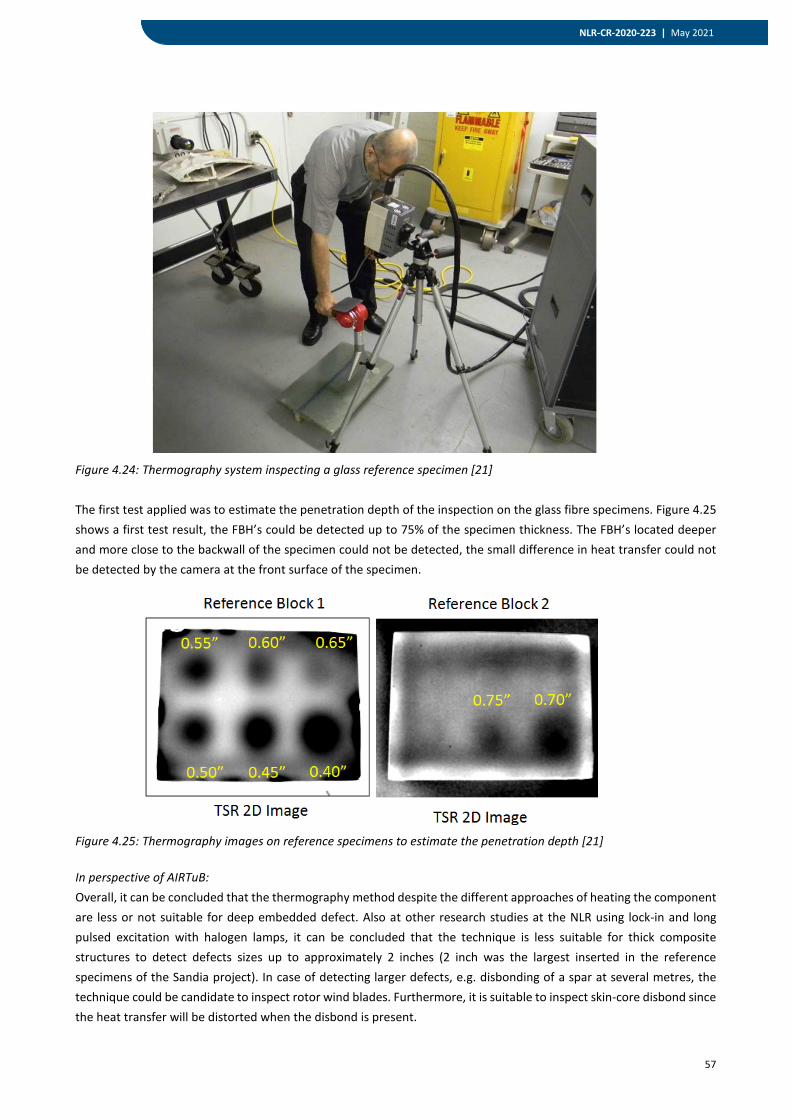
57
NLR-CR-2020-223 | May 2021
Figure 4.24: Thermography system inspecting a glass reference specimen [21] The first test applied was to estimate the penetration depth of the inspection on the glass fibre specimens. Figure 4.25 shows a first test result, the FBH’s could be detected up to 75% of the specimen thickness. The FBH’s located deeper and more close to the backwall of the specimen could not be detected, the small difference in heat transfer could not be detected by the camera at the front surface of the specimen.
Figure 4.25: Thermography images on reference specimens to estimate the penetration depth [21] In perspective of AIRTuB: Overall, it can be concluded that the thermography method despite the different approaches of heating the component are less or not suitable for deep embedded defect. Also at other research studies at the NLR using lock-in and long pulsed excitation with halogen lamps, it can be concluded that the technique is less suitable for thick composite structures to detect defects sizes up to approximately 2 inches (2 inch was the largest inserted in the reference specimens of the Sandia project). In case of detecting larger defects, e.g. disbonding of a spar at several metres, the technique could be candidate to inspect rotor wind blades. Furthermore, it is suitable to inspect skin-core disbond since the heat transfer will be distorted when the disbond is present.
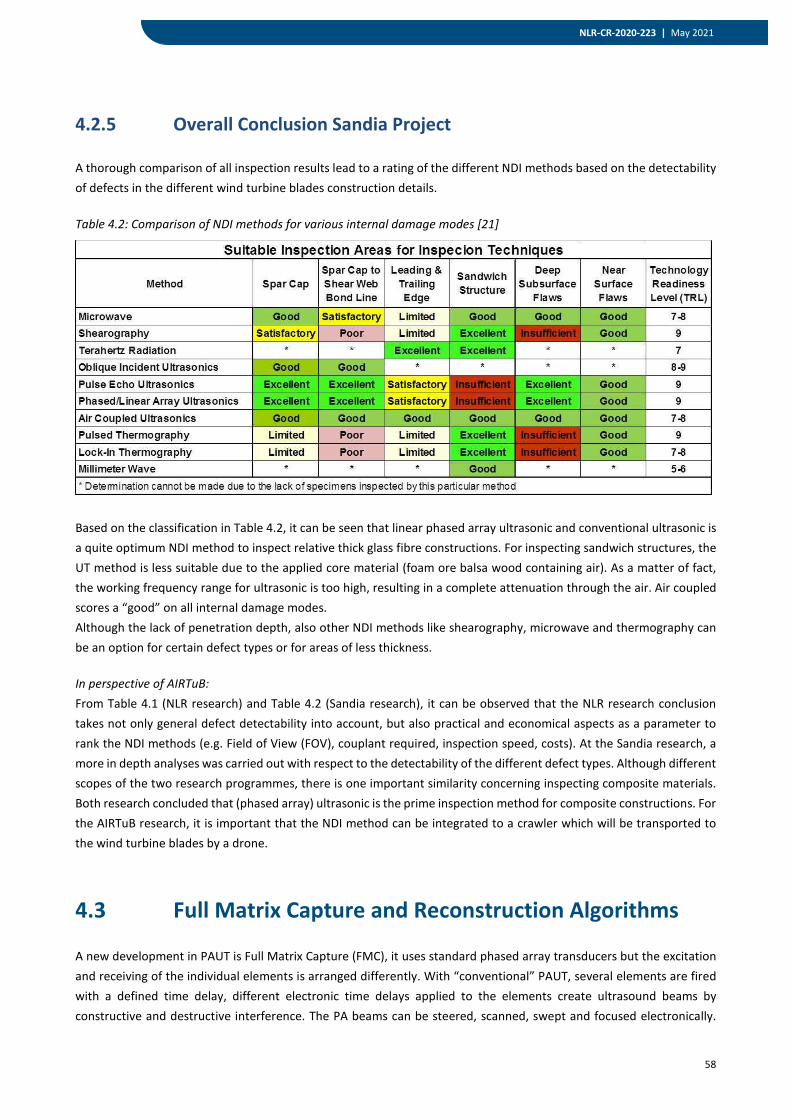
58
NLR-CR-2020-223 | May 2021
4.2.5 Overall Conclusion Sandia Project
A thorough comparison of all inspection results lead to a rating of the different NDI methods based on the detectability of defects in the different wind turbine blades construction details. Table 4.2: Comparison of NDI methods for various internal damage modes [21]
Based on the classification in Table 4.2, it can be seen that linear phased array ultrasonic and conventional ultrasonic is a quite optimum NDI method to inspect relative thick glass fibre constructions. For inspecting sandwich structures, the UT method is less suitable due to the applied core material (foam ore balsa wood containing air). As a matter of fact, the working frequency range for ultrasonic is too high, resulting in a complete attenuation through the air. Air coupled scores a “good” on all internal damage modes. Although the lack of penetration depth, also other NDI methods like shearography, microwave and thermography can be an option for certain defect types or for areas of less thickness. In perspective of AIRTuB: From Table 4.1 (NLR research) and Table 4.2 (Sandia research), it can be observed that the NLR research conclusion takes not only general defect detectability into account, but also practical and economical aspects as a parameter to rank the NDI methods (e.g. Field of View (FOV), couplant required, inspection speed, costs). At the Sandia research, a more in depth analyses was carried out with respect to the detectability of the different defect types. Although different scopes of the two research programmes, there is one important similarity concerning inspecting composite materials. Both research concluded that (phased array) ultrasonic is the prime inspection method for composite constructions. For the AIRTuB research, it is important that the NDI method can be integrated to a crawler which will be transported to the wind turbine blades by a drone.
4.3 Full Matrix Capture and Reconstruction Algorithms
A new development in PAUT is Full Matrix Capture (FMC), it uses standard phased array transducers but the excitation and receiving of the individual elements is arranged differently. With “conventional” PAUT, several elements are fired with a defined time delay, different electronic time delays applied to the elements create ultrasound beams by constructive and destructive interference. The PA beams can be steered, scanned, swept and focused electronically.
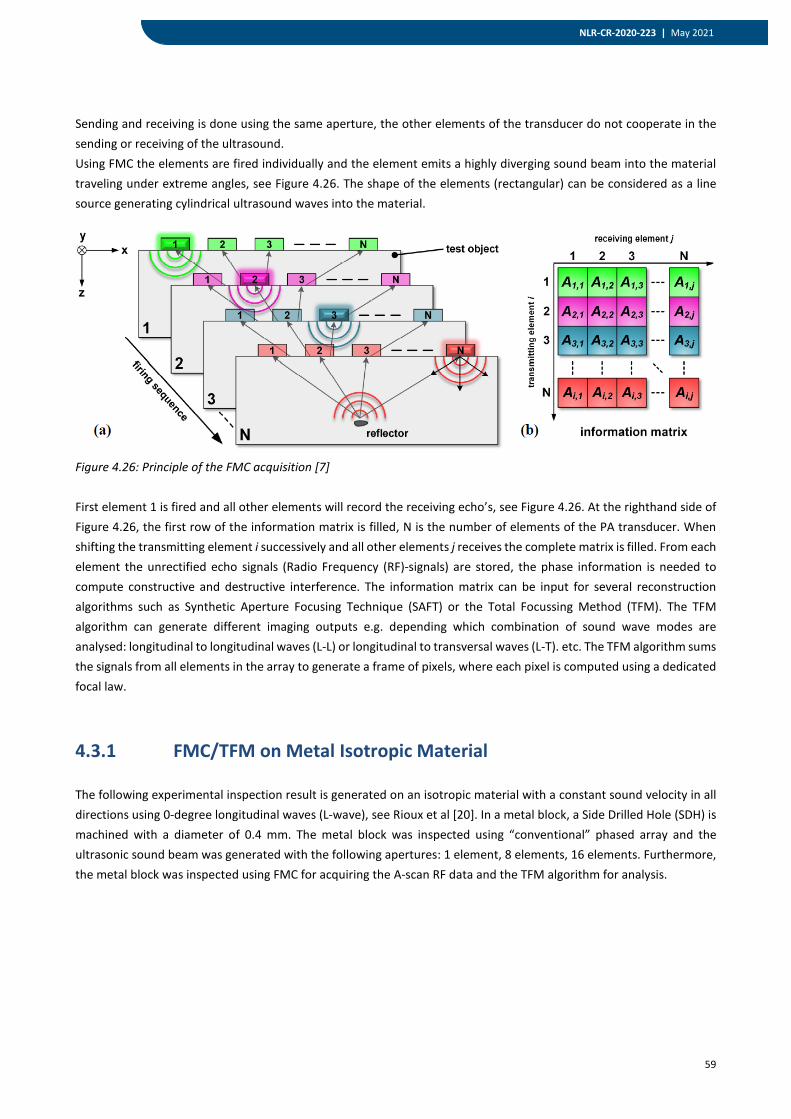
59
NLR-CR-2020-223 | May 2021
Sending and receiving is done using the same aperture, the other elements of the transducer do not cooperate in the sending or receiving of the ultrasound. Using FMC the elements are fired individually and the element emits a highly diverging sound beam into the material traveling under extreme angles, see Figure 4.26. The shape of the elements (rectangular) can be considered as a line source generating cylindrical ultrasound waves into the material.
Figure 4.26: Principle of the FMC acquisition [7] First element 1 is fired and all other elements will record the receiving echo’s, see Figure 4.26. At the righthand side of Figure 4.26, the first row of the information matrix is filled, N is the number of elements of the PA transducer. When shifting the transmitting element i successively and all other elements j receives the complete matrix is filled. From each element the unrectified echo signals (Radio Frequency (RF)-signals) are stored, the phase information is needed to compute constructive and destructive interference. The information matrix can be input for several reconstruction algorithms such as Synthetic Aperture Focusing Technique (SAFT) or the Total Focussing Method (TFM). The TFM algorithm can generate different imaging outputs e.g. depending which combination of sound wave modes are analysed: longitudinal to longitudinal waves (L-L) or longitudinal to transversal waves (L-T). etc. The TFM algorithm sums the signals from all elements in the array to generate a frame of pixels, where each pixel is computed using a dedicated focal law.
4.3.1 FMC/TFM on Metal Isotropic Material
The following experimental inspection result is generated on an isotropic material with a constant sound velocity in all directions using 0-degree longitudinal waves (L-wave), see Rioux et al [20]. In a metal block, a Side Drilled Hole (SDH) is machined with a diameter of 0.4 mm. The metal block was inspected using “conventional” phased array and the ultrasonic sound beam was generated with the following apertures: 1 element, 8 elements, 16 elements. Furthermore, the metal block was inspected using FMC for acquiring the A-scan RF data and the TFM algorithm for analysis.
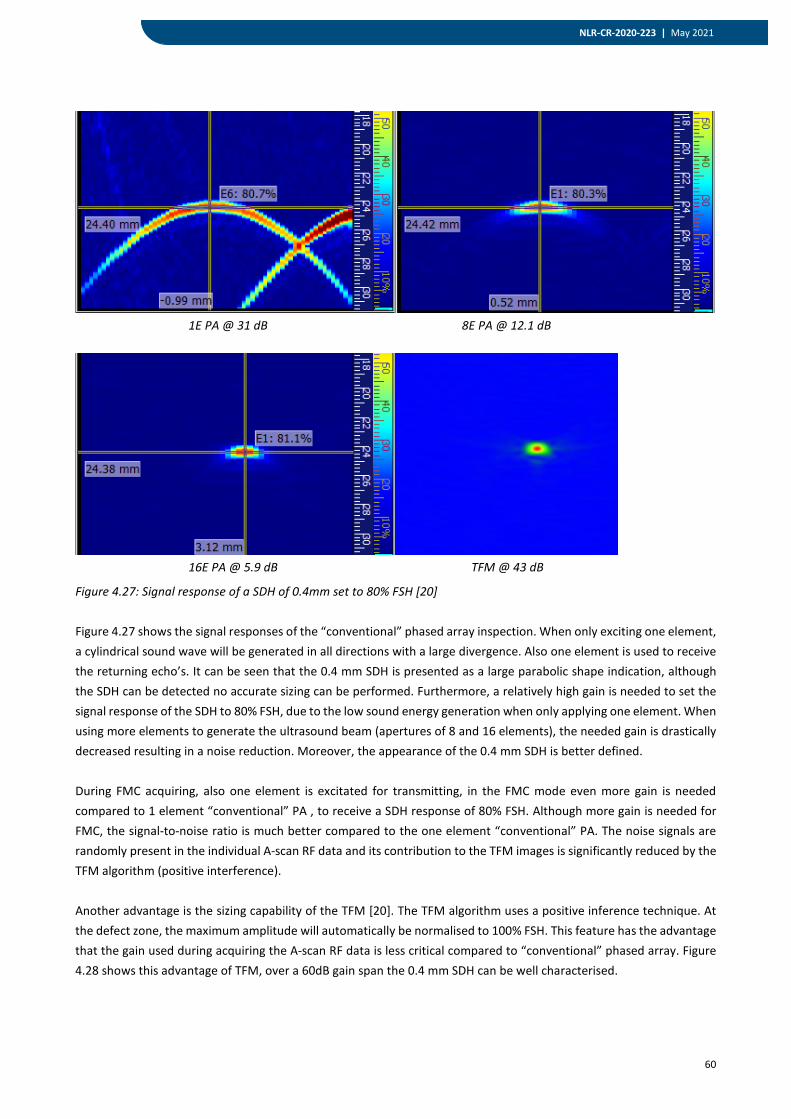
60
NLR-CR-2020-223 | May 2021
1E PA @ 31 dB 8E PA @ 12.1 dB
16E PA @ 5.9 dB TFM @ 43 dB
Figure 4.27: Signal response of a SDH of 0.4mm set to 80% FSH [20] Figure 4.27 shows the signal responses of the “conventional” phased array inspection. When only exciting one element, a cylindrical sound wave will be generated in all directions with a large divergence. Also one element is used to receive the returning echo’s. It can be seen that the 0.4 mm SDH is presented as a large parabolic shape indication, although the SDH can be detected no accurate sizing can be performed. Furthermore, a relatively high gain is needed to set the signal response of the SDH to 80% FSH, due to the low sound energy generation when only applying one element. When using more elements to generate the ultrasound beam (apertures of 8 and 16 elements), the needed gain is drastically decreased resulting in a noise reduction. Moreover, the appearance of the 0.4 mm SDH is better defined. During FMC acquiring, also one element is excitated for transmitting, in the FMC mode even more gain is needed compared to 1 element “conventional” PA , to receive a SDH response of 80% FSH. Although more gain is needed for FMC, the signal-to-noise ratio is much better compared to the one element “conventional” PA. The noise signals are randomly present in the individual A-scan RF data and its contribution to the TFM images is significantly reduced by the TFM algorithm (positive interference). Another advantage is the sizing capability of the TFM [20]. The TFM algorithm uses a positive inference technique. At the defect zone, the maximum amplitude will automatically be normalised to 100% FSH. This feature has the advantage that the gain used during acquiring the A-scan RF data is less critical compared to “conventional” phased array. Figure 4.28 shows this advantage of TFM, over a 60dB gain span the 0.4 mm SDH can be well characterised.
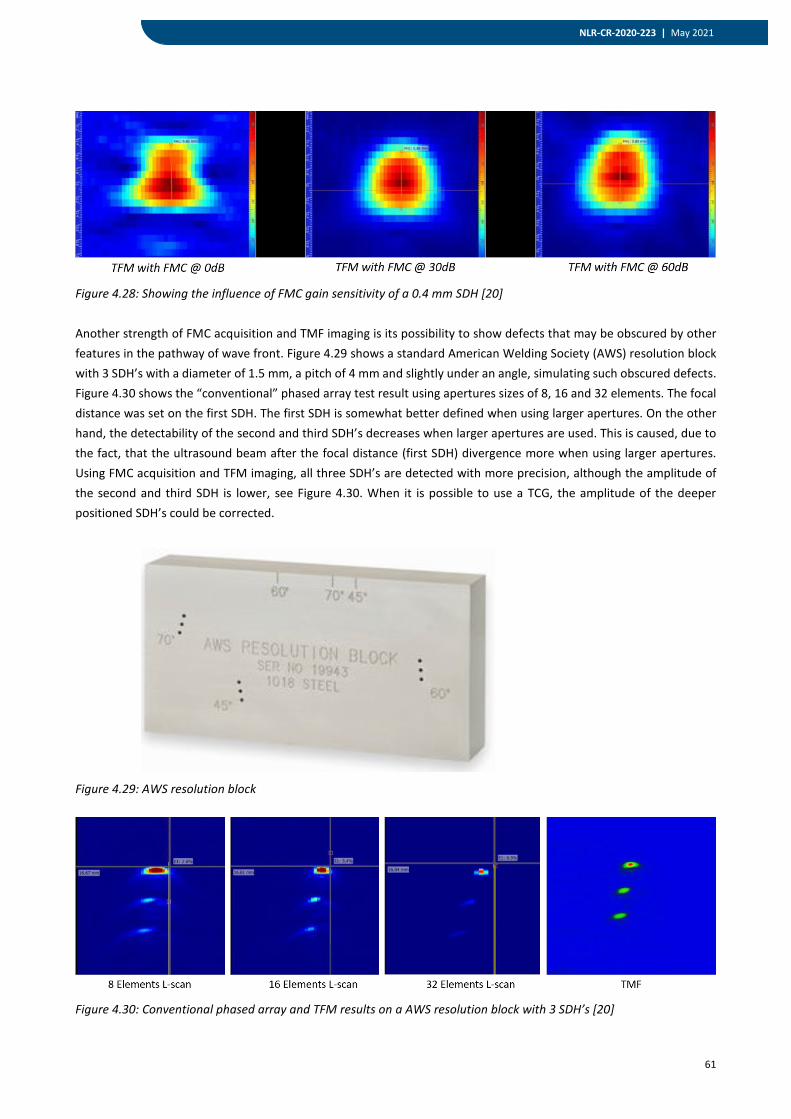
61
NLR-CR-2020-223 | May 2021
Figure 4.28: Showing the influence of FMC gain sensitivity of a 0.4 mm SDH [20] Another strength of FMC acquisition and TMF imaging is its possibility to show defects that may be obscured by other features in the pathway of wave front. Figure 4.29 shows a standard American Welding Society (AWS) resolution block with 3 SDH’s with a diameter of 1.5 mm, a pitch of 4 mm and slightly under an angle, simulating such obscured defects. Figure 4.30 shows the “conventional” phased array test result using apertures sizes of 8, 16 and 32 elements. The focal distance was set on the first SDH. The first SDH is somewhat better defined when using larger apertures. On the other hand, the detectability of the second and third SDH’s decreases when larger apertures are used. This is caused, due to the fact, that the ultrasound beam after the focal distance (first SDH) divergence more when using larger apertures. Using FMC acquisition and TFM imaging, all three SDH’s are detected with more precision, although the amplitude of the second and third SDH is lower, see Figure 4.30. When it is possible to use a TCG, the amplitude of the deeper positioned SDH’s could be corrected.
Figure 4.29: AWS resolution block
Figure 4.30: Conventional phased array and TFM results on a AWS resolution block with 3 SDH’s [20]
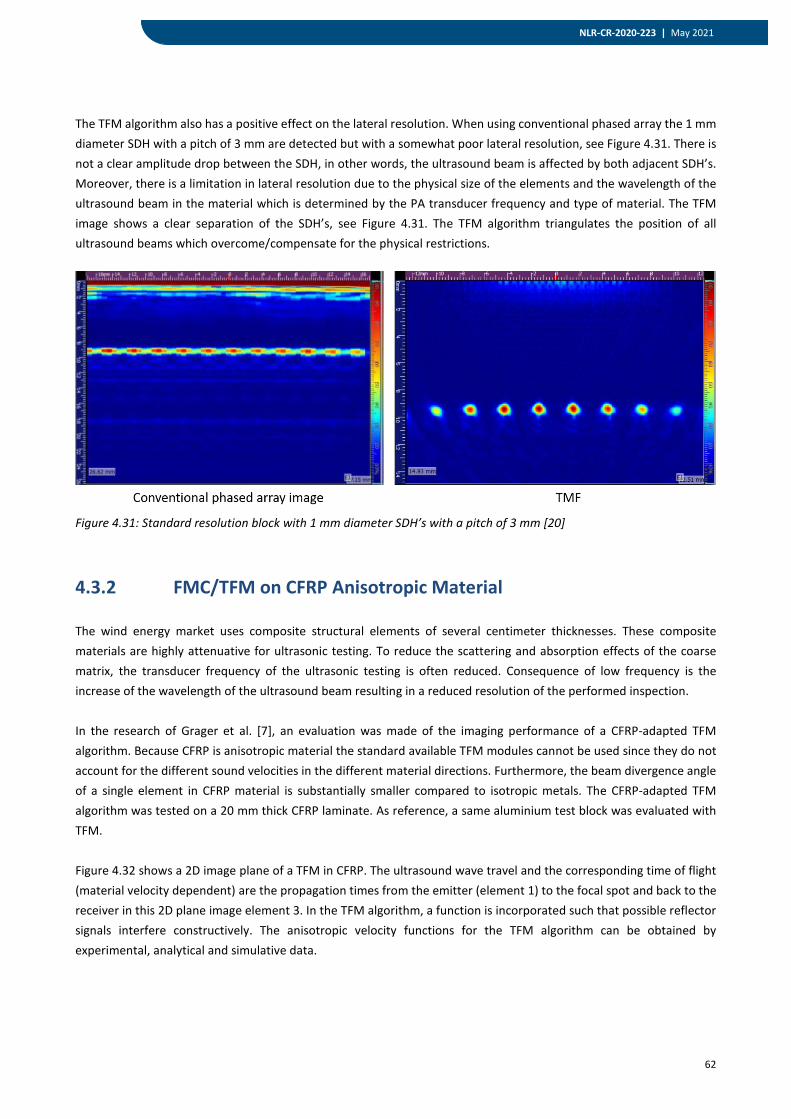
62
NLR-CR-2020-223 | May 2021
The TFM algorithm also has a positive effect on the lateral resolution. When using conventional phased array the 1 mm diameter SDH with a pitch of 3 mm are detected but with a somewhat poor lateral resolution, see Figure 4.31. There is not a clear amplitude drop between the SDH, in other words, the ultrasound beam is affected by both adjacent SDH’s. Moreover, there is a limitation in lateral resolution due to the physical size of the elements and the wavelength of the ultrasound beam in the material which is determined by the PA transducer frequency and type of material. The TFM image shows a clear separation of the SDH’s, see Figure 4.31. The TFM algorithm triangulates the position of all ultrasound beams which overcome/compensate for the physical restrictions.
Figure 4.31: Standard resolution block with 1 mm diameter SDH’s with a pitch of 3 mm [20]
4.3.2 FMC/TFM on CFRP Anisotropic Material
The wind energy market uses composite structural elements of several centimeter thicknesses. These composite materials are highly attenuative for ultrasonic testing. To reduce the scattering and absorption effects of the coarse matrix, the transducer frequency of the ultrasonic testing is often reduced. Consequence of low frequency is the increase of the wavelength of the ultrasound beam resulting in a reduced resolution of the performed inspection. In the research of Grager et al. [7], an evaluation was made of the imaging performance of a CFRP-adapted TFM algorithm. Because CFRP is anisotropic material the standard available TFM modules cannot be used since they do not account for the different sound velocities in the different material directions. Furthermore, the beam divergence angle of a single element in CFRP material is substantially smaller compared to isotropic metals. The CFRP-adapted TFM algorithm was tested on a 20 mm thick CFRP laminate. As reference, a same aluminium test block was evaluated with TFM. Figure 4.32 shows a 2D image plane of a TFM in CFRP. The ultrasound wave travel and the corresponding time of flight (material velocity dependent) are the propagation times from the emitter (element 1) to the focal spot and back to the receiver in this 2D plane image element 3. In the TFM algorithm, a function is incorporated such that possible reflector signals interfere constructively. The anisotropic velocity functions for the TFM algorithm can be obtained by experimental, analytical and simulative data.
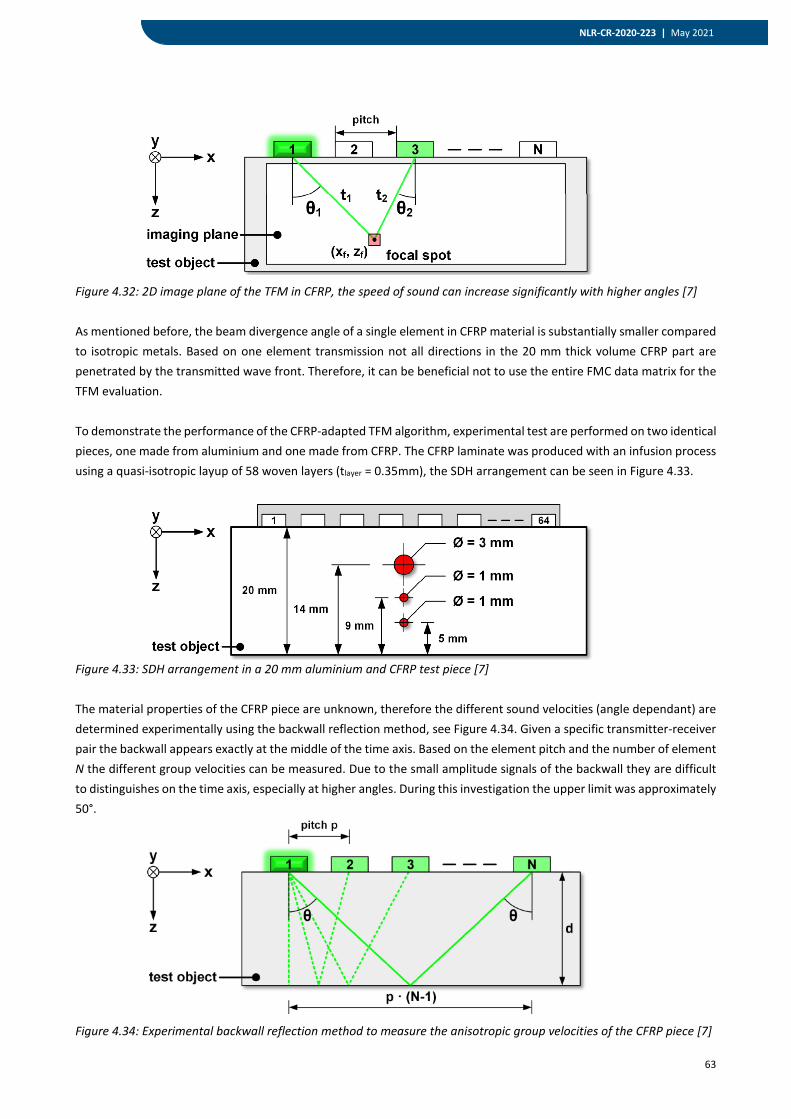
63
NLR-CR-2020-223 | May 2021
Figure 4.32: 2D image plane of the TFM in CFRP, the speed of sound can increase significantly with higher angles [7] As mentioned before, the beam divergence angle of a single element in CFRP material is substantially smaller compared to isotropic metals. Based on one element transmission not all directions in the 20 mm thick volume CFRP part are penetrated by the transmitted wave front. Therefore, it can be beneficial not to use the entire FMC data matrix for the TFM evaluation. To demonstrate the performance of the CFRP-adapted TFM algorithm, experimental test are performed on two identical pieces, one made from aluminium and one made from CFRP. The CFRP laminate was produced with an infusion process using a quasi-isotropic layup of 58 woven layers (tlayer = 0.35mm), the SDH arrangement can be seen in Figure 4.33.
Figure 4.33: SDH arrangement in a 20 mm aluminium and CFRP test piece [7] The material properties of the CFRP piece are unknown, therefore the different sound velocities (angle dependant) are determined experimentally using the backwall reflection method, see Figure 4.34. Given a specific transmitter-receiver pair the backwall appears exactly at the middle of the time axis. Based on the element pitch and the number of element N the different group velocities can be measured. Due to the small amplitude signals of the backwall they are difficult to distinguishes on the time axis, especially at higher angles. During this investigation the upper limit was approximately 50°.
Figure 4.34: Experimental backwall reflection method to measure the anisotropic group velocities of the CFRP piece [7]
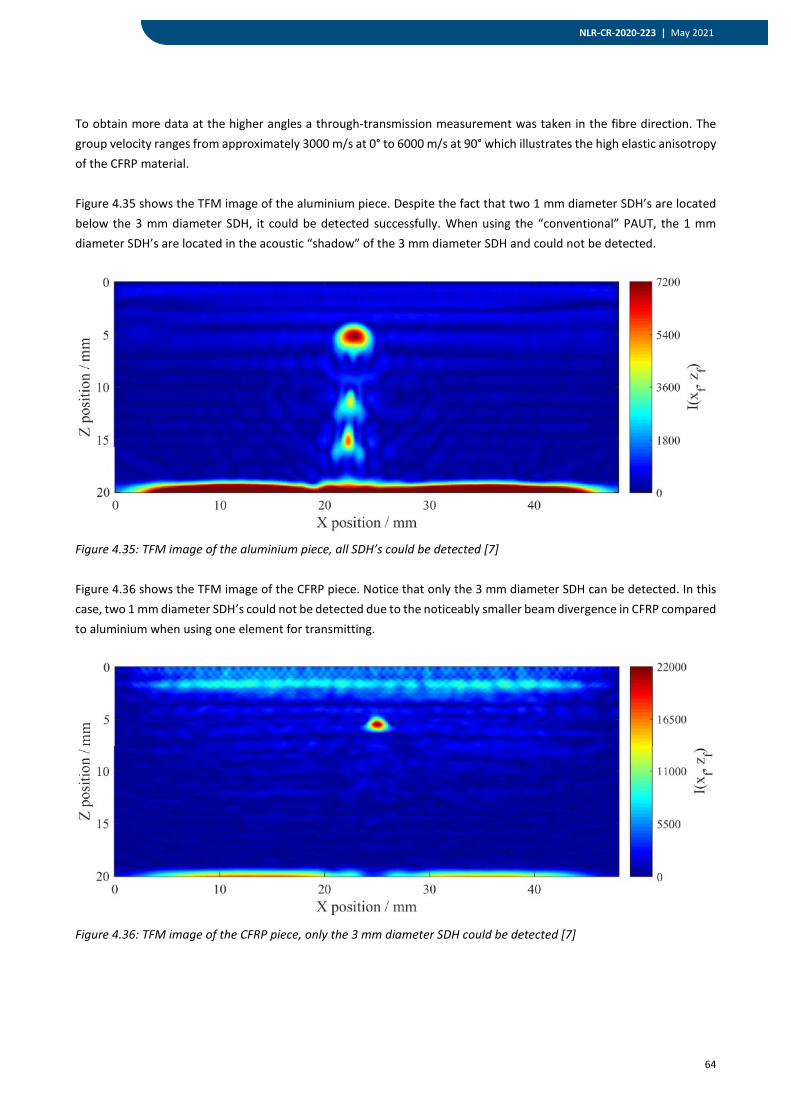
64
NLR-CR-2020-223 | May 2021
To obtain more data at the higher angles a through-transmission measurement was taken in the fibre direction. The group velocity ranges from approximately 3000 m/s at 0° to 6000 m/s at 90° which illustrates the high elastic anisotropy of the CFRP material. Figure 4.35 shows the TFM image of the aluminium piece. Despite the fact that two 1 mm diameter SDH’s are located below the 3 mm diameter SDH, it could be detected successfully. When using the “conventional” PAUT, the 1 mm diameter SDH’s are located in the acoustic “shadow” of the 3 mm diameter SDH and could not be detected.
Figure 4.35: TFM image of the aluminium piece, all SDH’s could be detected [7] Figure 4.36 shows the TFM image of the CFRP piece. Notice that only the 3 mm diameter SDH can be detected. In this case, two 1 mm diameter SDH’s could not be detected due to the noticeably smaller beam divergence in CFRP compared to aluminium when using one element for transmitting.
Figure 4.36: TFM image of the CFRP piece, only the 3 mm diameter SDH could be detected [7]
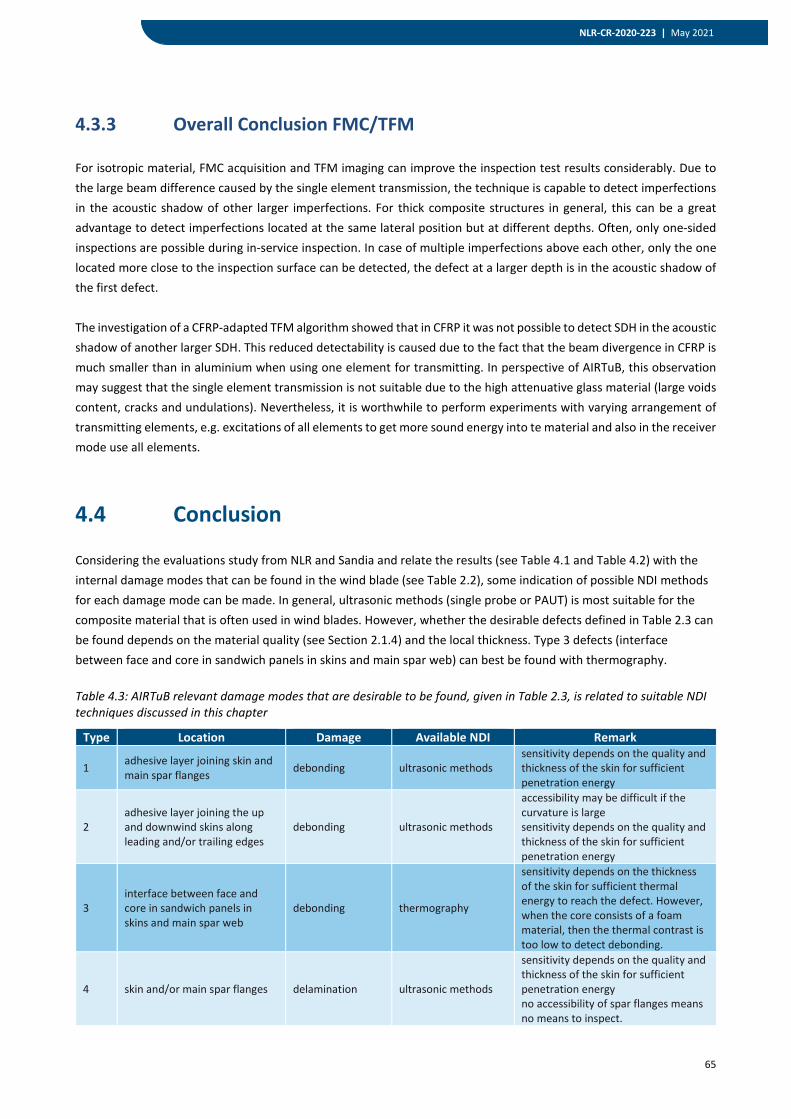
65
NLR-CR-2020-223 | May 2021
4.3.3 Overall Conclusion FMC/TFM
For isotropic material, FMC acquisition and TFM imaging can improve the inspection test results considerably. Due to the large beam difference caused by the single element transmission, the technique is capable to detect imperfections in the acoustic shadow of other larger imperfections. For thick composite structures in general, this can be a great advantage to detect imperfections located at the same lateral position but at different depths. Often, only one-sided inspections are possible during in-service inspection. In case of multiple imperfections above each other, only the one located more close to the inspection surface can be detected, the defect at a larger depth is in the acoustic shadow of the first defect. The investigation of a CFRP-adapted TFM algorithm showed that in CFRP it was not possible to detect SDH in the acoustic shadow of another larger SDH. This reduced detectability is caused due to the fact that the beam divergence in CFRP is much smaller than in aluminium when using one element for transmitting. In perspective of AIRTuB, this observation may suggest that the single element transmission is not suitable due to the high attenuative glass material (large voids content, cracks and undulations). Nevertheless, it is worthwhile to perform experiments with varying arrangement of transmitting elements, e.g. excitations of all elements to get more sound energy into te material and also in the receiver mode use all elements.
4.4 Conclusion
Considering the evaluations study from NLR and Sandia and relate the results (see Table 4.1 and Table 4.2) with the internal damage modes that can be found in the wind blade (see Table 2.2), some indication of possible NDI methods for each damage mode can be made. In general, ultrasonic methods (single probe or PAUT) is most suitable for the composite material that is often used in wind blades. However, whether the desirable defects defined in Table 2.3 can be found depends on the material quality (see Section 2.1.4) and the local thickness. Type 3 defects (interface between face and core in sandwich panels in skins and main spar web) can best be found with thermography. Table 4.3: AIRTuB relevant damage modes that are desirable to be found, given in Table 2.3, is related to suitable NDI techniques discussed in this chapter
Type Location Damage Available NDI Remark
1 adhesive layer joining skin and main spar flanges debonding ultrasonic methods
sensitivity depends on the quality and thickness of the skin for sufficient penetration energy
2 adhesive layer joining the up and downwind skins along leading and/or trailing edges
debonding ultrasonic methods
accessibility may be difficult if the curvature is large sensitivity depends on the quality and thickness of the skin for sufficient penetration energy
3 interface between face and core in sandwich panels in skins and main spar web
debonding thermography
sensitivity depends on the thickness of the skin for sufficient thermal energy to reach the defect. However, when the core consists of a foam material, then the thermal contrast is too low to detect debonding.
4 skin and/or main spar flanges delamination ultrasonic methods
sensitivity depends on the quality and thickness of the skin for sufficient penetration energy no accessibility of spar flanges means no means to inspect.
66
NLR-CR-2020-223 | May 2021
For the defects type 1, 2 and 4, the ultrasonic based methods are best suitable. In general, portability of ultrasonic systems are light enough for a drone system. One challenge to overcome is the fact that a couplant medium is required by these methods. Air-coupled ultrasonic may be a solution, but since the sensitivity of such systems are too low, this approach is determined to be unsuitable. A phased array method using the wheel probe can contain some liquid in its wheel, while vapor of water sprayed on the surface may be sufficient. Defect type 2 may be also a challenge due to its location at the end of leading and trailing edge with large curvature. This can lead to bad contact between the probe and the skin of the wind blade. Defect type 3 can best be found with thermography, however, such system is often heavy and consumes lot of power requiring large battery capacity. It is anticipated that a crawler system can have its limitation in its movement. In order to operate on a large wind blade with slippery surface condition and wind gusts, crawler can be inflexible in its manoeuvrability. A roller probe may be a practical solution, which can cover large surface in a smooth rolling motion. Roller may also be forgiving for dirt on the surface or slight curvature. Conventional PAUT probe or single probe may get jammed when some irregularities may be present on the surface.
67
NLR-CR-2020-223 | May 2021
5 Conclusions
The objective of this literature study is to gain insight on the latest developments in drone-based inspection for the (off-shore) wind turbine blades. The focus was laid on both external (coating erosion, for example) and internal (spar cap disbond, for example) damage on the wind blade structure. The external damages on the wind blade surface can have deteriorating effect on the efficiency. External damage mode in this context is erosion on the outer surface of the wind blade on the coating. Even though some commercially available drone solutions are available designed to detect external defects on the blade surface, these systems are limited to high-definition camera providing no information on depth or location. One of the ambition in AIRTuB project is to be able to repair damages on the wind blade remotely and autonomously. Therefore, information about the location, severity and shape of the erosion is essential. 3D imaging solution can provide that information. Considering the methods that have been explored in this study, such as photogrammetry, structured light and multispectral imaging, the triangulation based laser 3D shape sensing seems best suitable method. This conclusion is made based on the fact that this method is less dependent on the visually recognizable features on the wind blades to stitch the data together. However, this can only be achieved if the position and orientation of the sensor has to be known for each measurement points. Assuming that the drone will perform steady and linear flight along the spanwise direction of a wind blade with a fixed distance from, it may suffice to know the exact position of the drone from an initial measurement point and to record velocity of the drone. Other approach may be to have a LIDAR system onboard, which can be used to determine relative position of the drone with respect to the wind blade at each measurement. Internal structural damage modes in a wind turbine blade caused by in-service events (e.g. bird strikes or overspeed) can be categorized into seven different groups (for example: adhesive joint failure between skins and sandwich panel face/core debonding). Especially if the damage has occurred in a primary structure, it is important to evaluate and repair the damage if necessary. Moreover, the efficiency of a wind turbine can even be optimized if the design philosophy transitions from safe-life (currently used design philosophy) towards damage-tolerance design principle (aerospace design philosophy). In order to realize this transition, non-destructive inspection is a key to this. From the literature study, few potential NDI techniques are determined that can find one or more damage modes. However, there is no one NDI technique that can cover all damage modes. The ultrasonic-based NDI methods is found to be most suitable because of its miniaturization possibility, maneuvrability and damage detection capability for thick composite material. Phased array ultrasonic inspection method, especially in the form of array integrated in a wheel, may provide practical solution. Wheel probe can cover large area in a rolling motion, suitable to a large area of wind turbine blade. Furthermore, there are many developments in the field of data processing and presenting from the phased array inspection, such as full matrix capture and total focusing methods, which can be added value to take into account in the further developments in the AIRTuB project.
68
NLR-CR-2020-223 | May 2021
6 References
1. Bureau of Ocean Energy Management. "Renewable Energy on the Outer Continental Shelf", Offshore Wind Energy,
www.boem.gov/renewable-energy/renewable-energy-program-overview (accessed: 05-February-2020).
2. Braga, D.F.O., Tavares, S.M.O., Silva, L.F.M., Moreira, P.M.G.P. and Castro, P.M.S.T. (2014). "Advanced Design for
Lightweight Structures: Review and Prospects", Progress in Aerospace Sciences; 69: 29-39.
3. Ciang, C.C., Lee, J.R. and Bang, H.J. (2008). "Structural Health Monitoring for a Wind Turbine System: A Review of Damage
Detection Methods", Measurement Science & Technology; 19:122001.
4. DURABLE (2019). www.durableproject.eu/technologies, (accessed 11-March-2020).
5. European Union (2016). "Future Energy Industry Trends", Interreg North Sea Region, northsearegion.eu/northsee/e-
energy/future-energy-industry-trends, (accessed: 27-March-2020).
6. Gaudern, N. (2014). "A Practical Study of the Aerodynamical Impact of Wind Turbine Blade Leading Edge Erosion", Journal
of Physics: Conference Series; 524: 012031.
7. Grager Jan-Carl, Mooshofer Hubert and U Grosse Christian “Evaluation of imaging performance of a CFRP-adapted TFM
algorithm, 12th ECNDT Gothenburg 2018.
8. Haselbach, P.U. and Branner, K. (2015). "Effect of Trailing Edge Damage on Full-Scale Wind Turbine Blade Failure", 20th Int.
Conf. on Composite Materials, Copenhagen, Denmark, 19-24th July 2015.
9. Hede Linde, C. (2019). " DARWIN: Drone Application for Reporting in Wind Power Inspections", DTU Wind Energy,
https://www.vindenergi.dtu.dk/english/research/research-projects/darwin, (accessed: 12-June-2020).
10. Heida J.H., Platenkamp D.J. (2010) “Evaluation of non-destructive inspection methods”, NLR-CR-2010-076.
11. JR Technology Limited; Woodpecker Technical Report 2 VI, 28 April 2010.
12. Katnam, K.B., Comer, A.J., Ray, D. Silva, L.F.M. and Young, T. (2014). "Composite Repair in Wind Turbine Blades: An
Overview", Journal of Adhesion; 91.
13. Keegan, M.H., Nash, D.H. and Stack, M. (2013). "On Erosion Issues Associated with the Leading Edge of Wind Turbine
Blades", Journal of Physics D: Applied Physics; 46(38).
14. LM Wind Power (2015) "On The Leading Edge: Innovative Solutions to Reduce Rain Erosion", lmwindpower.com/stories-
and-press/stories/innovation/on-the-leading-edge, (accessed: 13-February-2020).
15. McGugan, M., Pereira, G., Sørensen, B.F., Toftegaard, H. and Branner, K. (2015). "Damage Tolerance and Structural
Monitoring for Wind Turbine Blades", Phil. Trans. R. Soc. A 373:20140077.
16. Mishnaevsky, L., Branner, K., Petersen, H.N., Beauson, J., McGugan, M., and Sørensen, B.F. (2017). "Materials for Wind
Turbine Blades: An Overview", Materials; 10(11).
17. Platenkamp D.J. “Impact damage assessment for thick composites using Non-Destructive Techniques”, NLR-CR-2013-257.
18. Platenkamp D.J., Bosch A.F. “Ultrasonic phased aeery inspection of complex structures (Thick RTM components),
NLR-CR-2010-615-PT-1.
19. Platenkamp D.J “Evaluation of in-service active thermography for composite structures” NLR-CR-2018-365.
69
NLR-CR-2020-223 | May 2021
20. P. Rioux, F. Lachance, D. Giguére and J. Turcotte “Novel Imaging Techniques for Defects Characterization in Phased Array
Inspection”, 12th ECNDT Gothenburg 2018.
21. Roach, D., Neidigk, S., Rice, T., Duvall, R. and Paquette, J. (2015). "Development and Assessment of Advanced Inspection
Methods for Wind Turbine Blades Using a Focused WINDIE Experiment", Proceedings of 33rd Wind Energy Symposium, 5-9
January 2015, Kissimmee, FL.
22. Roach, D., Rice, T., Neidigk, S. and Duvall, R. (2015). "Non-Destructive Inspection of Blades", Sandia National Laboratory
Presentation, SAND2015-2005C.
23. Roach, D., Rice, T. and Paquette, J. (2016). "Quantifying the Reliability of Inspection Practices to Allow Wind Blades to Reach
Their Design Lifetime", Sandia National Laboratory Presentation, SAND2016-12550C.
24. Roach, D., Rice, T. and Paquette, J. (2017). "Probability of Detection Study to Assess the Performance of Nondestructive
Inspection Methods for Wind Turbine Blades", Sandia National Laboratory report SAND2017-8032X, August 2017.
25. Rouff, L.; BondMaster presentation, Olympus, November 2008.
26. Sareen, A., Sapre, C.A. and Selig, M.S. (2014). "Effects of Leading Edge Erosion on Wind Turbine Blade Performance", Wind
Energy 2014; 17: 1531-1542.
27. Selig, M.S. and Tangler, J.L. (1995). " Development and Application of a Multipoint Inverse Design Method for Horizontal
Axis Wind Turbines", Wind Engineering; 19(2): 91-105.
28. Shihavuddin, A., Chen, X., Fedorov, V., Christensen, A., Riis, N., Branner, K., Dahl, A. and Paulsen,R. (2019). "Wind Turbine
Surface Damage Detection by Deep Learning Aided Drone Inspection Analysis", Energies; 12, February 2019.
29. Shohag, M.A., Hammel, E.C., Olawale, D. and Okoli, O.I. (2017) "Damage Mitigation Techniques in Wind Turbine Blades: A
Review", Wind Engineering; 41(3): 185-210.
30. Slot, H.M., Gelinck, E.R.M., Rentrop, C. and Van der Heide, E. (2015). "Leading Edge Erosion of Coated Wind Turbine Blades:
Review of Coating Life Models", Renewable Energy; 80: 837-848.
31. Sørensen, B.F., Jørgensen, E., Debel, C.P., Jensen, F.M., Jensen, H.M., Jacobsen, T.K. and Halling, K.M. (2004) "Improved
Design of Large Wind Turbine Blade of Fibre Composites Based on Studies of Scale Effects" Phase 1 summary report, Risø-R-
1390(EN), Risø National Laboratory, Denmark, September 2004.
32. Sørensen, B.F., Holmes, J.W., Brøndsted, P. and Branner, K. (2010). "Blade Materials, Testing Methods and Structural
Design", WIT Transactions on State of the Art in Science and Engineering; 44.
33. Sørensen, B.F., Toftegaard, H., McGugan, M., Pereira, G.F. and Branner, K. (2015). "Very Large Wind Turbine Rotor Blades
Require Damage Tolerance and Damage Monitoring", Poster session presented at EWEA Offshore 2015 Conference,
Copenhagen, Denmark.
34. Sundaresan, M.J., Schultz, M.J. and Ghoshal, A. (2002) "Structural Health Monitoring Static Test of a Wind Turbine Blade",
Subcontractor report, NREL/SR-500-28719, National Renewable Energy Laboratory, Golden, CO, March 2002.
35. Quispitupa, A., Vestergaard, B. and Sieradzan, T. (2013). "Certification of Wind Turbine Blades - The DNV Procedure",
European Wind Energy Conference and Exhibition, EWEC 2013, p.103-112.
36. USA Department of Defense; Composite materials handbook, Volume 3: Polymer matrix composites materials usage,
design, and analysis, MIL-HDBK-17-3F, 17 June 2002.
37. Volynets, I. (2001). "Diameter of a raindrop", An Encyclopedia of Scientific Essays, hypertextbook.com/facts/2001/
IgorVolynets.shtml (accessed: 03-March-2020).
70
NLR-CR-2020-223 | May 2021
38. Wind Systems (2019). "Blade Leading-Edge Coating Protects Against Rain Erosion", Wind Systems magazine, August 2019,
p.48-49.
39. Fauteux, L. and Jolin, N. (2018). "Drone Solution for Wind Turbine Inspections: Overview of Cutting-edge Solution for Wind
Farm O&M Industry", Nergica, December 2018.
40. Anderson, J. (2016). “A Closer Look at 3D Imaging”, Quality Magazine, 1-Sep-2016.
41. Se, S. and Pears, N. (2012). “Passive 3D Imaging”, 3D Imaging, Analysis and Applications, Chapter 2, ISBN 978-1-4471-4062-
7, 2012.
42. Geng, J. (2011). “Structured-Light 3D Surface Imaging: A Tutorial”, Advances in Optics and Photonics, 3, pp. 128-160, doi:
10.1364/AOP.3.000128.
43. Bell, T., Li, B. and Zhang, S. (2016). “Structured Light Techniques and Applications”, Wiley Encyclopedia of Electrical and
Electronics Engineering, John Wiley & Sons, Inc., DOI: 10.1002/047134608X.W8298.
44. Revopoint 3D (2019). “Comparing Three Prevalent 3D Imaging Technologies”, https://www.revopoint3d.com/comparing-
three-prevalent-3d-imaging-technologies-tof-structured-light-and-binocular-stereo-vision/, 20-Sep-2019 (accessed: 23-Dec-
20).
45. 3D Systems (2020). “3D Scanners – A Guide to 3D Scanner Technology”, www.3dsystems.com/3d-scanner/scanner-guide
(accessed: 16-Dec-20).
46. Corrigan, F. (2020). “Flash Lidar Time of Flight (ToF) Camera Sensors on Drones and 10 Terrific Uses”, DroneZon,
www.dronezon.com/learn-about-drones-quadcopters/best-uses-for-time-of-flight-tof-camera-depth-sensor-technology-in-
drones-or-ground-based/ (accessed: 16-Dec-20).
47. Daly, S. (2019). “Australia’s Emesent launches Hovermap drone payload at International LiDAR Mapping Forum”, The C-
Drone Review, 4-Feb-2019, c-drone-review.news/en/2019/02/04/australias-emesent-launches-hovermap-drone-payload-
at-international-lidar-mapping-forum/ (accessed: 16-Dec-20).
48. Biro, I. and Kinnell, P (2020). “Performance Evaluation of a Robot-Mounted Interferometer for an Industrial Environment”,
Sensors 2020, 20(1), 257, doi: 10.3390/s20010257.
49. Suchocki, C. (2020). “Comparison of Time-of-Flight and Phase-Shift TLS Intensity Data for the Diagnostics Measurements of
Buildings”, Materials 2020, 13, 353, doi: 10.3390/ma13020353.
50. Micro-Epsilon (2020). “Applications for 2D/3D Laser Scanners”, https://www.micro-epsilon.com/2D_3D/laser-
scanner/applications/ (accessed: 17-dec-20).
51. Jia, J., Wang, Y., Chen, J., Guo, R., Shu, R. and Wang, J. (2020). “Status and Application of Advanced Airborne Hyperspectral
Imaging Technology: A Review”, Infrared Physics & Technology, 104, 103115, doi: 10.1016/j.infrared.2019.103115.
52. Lu, B., Dao, P.D., Liu, J., He, Y. and Shang, J. (2020). “Recent Advances of Hyperspectral Imaging Technology and Applications
in Agriculture”, Remote Sensing, 12(16), 2659, doi: 10.3390/rs12162659.
53. Adao, T., Hruska, J., Padua, L., Bessa, J., Peres, E., Morais, R. and Joao Sousa, J. (2017). “Hyperspectral Imaging: A Review on
UAV-Based Sensors, Data Processing and Applications for Agriculture and Forestry”, Remote Sensing, 9(11), 1110, doi:
10.3390/rs9111110.
54. Dingemans, L.M., Papadakis, V.M., Liu, P., Adam, A.J.L. and Groves, R.M. (2015). “Optical Coherence Tomography
Complemented by Hyperspectral Imaging for the Study of Protective Wood Coatings”, Optics for Arts, Architecture, and
Archaeology, 9527, 952708, doi: 10.1117/12.2184716.
71
NLR-CR-2020-223 | May 2021
55. Korvink, J.G., Badilita, V. and Abdo, M. (2018). “Hyperspectral Imaging”, Institute of Microstructure Technology, Karlsruhe
Institute of Technology, www.imt.kit.edu/hyper-spectral-imaging.php (accessed 08-Jan-21).
56. Young, A., Kay, A., Marshall, S., Torr, R. and Gray, A. (2016). “Hyperspectral Imaging for Erosion Detection in Wind Turbine
Blades”, Proceedings of HSI 2016, 12-13 October 2016, UK.
57. Rizk, P., Al Saleh, N., Younes, R., Ilinca, A. and Khoder, J. (2020). “Hyperspectral Imaging Applied for the Detection of Wind
Turbine Blade Damage and Icing”, Remote Sensing Applications: Society and Environment, 18, April 2020, doi:
10.1016/j.rsase.2020.100291.
58. Headwall Photonics, “Hyperspectral Sensor Drone Integration”, www.headwallphotonics.com/uav-integration, (accessed
11-jan-21).
59. Ray Ely, G., Roach, D.P., Rice, T.M., Nelson, G.D. and Paquette, J. (2018). “Development and Evaluation of a Drone-Deployed
Wind Turbine Blade Nondestructive Inspection System”, Sandia National Laboratories report, SAND2018-3116.
60. Aerodyne Measure (2019). “LiDAR Technology Guided Measure’s Automated, High Definition Wind Turbine Inspections”,
www.measure.com/news-insights/lidar-automated-high-def-wind-turbine-inspection, (accessed 11-jan-21).
61. Pierce, S.G., Burnham, K., McDonald, L., MacLeod, C.N., Dobie, G., Summan, R. and McMahon, D. (2018). “Quantitative
Inspection of Wind Turbine Blades Using UAV Deployed Photogrammetry”, 9th European Workshop on Structural Health
Monitoring (EWHM 2018), July 10-13 2018, Manchester, UK.
62. Car, M., Markovic, L., Ivanovic, A., Orsag, M. and Bogdan, S. (2020). “Autonomous Wind-Turbine Blade Inspection Using
LiDAR-Equipped Unmanned Aerial Vehicle”, IEEE Access, 8, 131380-131387, doi: 10.1109/ACCESS.2020.3009738.
63. Gaal, M., Daschewski, M., Bartusch, J., Schadow, F., Dohse, E., Kreutzbruck, M., Weise, M. and Beck, U. (2016). “Novel air-
coupled ultrasonic transducer combining the thermoacoustic with the piezoelectric effect”, 19th World Conference on Non-
Destructive Testing WCNDT 2016, 13-17 June 2016, München, Germany.
64. Cortes, E., Sanchez, F., O’Carroll, A., Madramany, B., Hardiman, M. and Young, T.M. “On the Material Characterisation of
Wind Turbine Blade Coatings: The Effect of Interphase Coating-Laminate Adhesion on Rain Erosion Performance”, Materials
2017, vol. 10, 1146, doi: 10.3390/ma10101146.
65. Nijssen, R. and Manrique, E. “Literature Review of Structural and Non-Structural Wind Turbine Blade Damage”, TNO report,
August 2020.
66. GIS Geography. “Multispectral vs Hyperspectral Imagery Explained”, https://gisgeography.com/multispectral-vs-
hyperspectral-imagery-explained, (accessed 23-apr-21).

Postal address PO Box 90502 1006 BM Amsterdam, The Netherlands e ) [email protected] i ) www.nlr.org
Royal NLR Anthony Fokkerweg 2 1059 CM Amsterdam, The Netherlands p ) +31 88 511 3113
Voorsterweg 31 8316 PR Marknesse, The Netherlands p ) +31 88 511 4444
Royal NLR - Netherlands Aerospace Centre Chamber of Commerce No. 41150373. VAT No. NL002760551B01
Royal NLR - Netherlands Aerospace Centre
NLR operates as an objective and independent research centre,
working with its partners towards a better world tomorrow. As part
of that, NLR offers innovative solutions and technical expertise,
creating a strong competitive position for the commercial sector.
For more information visit: www.nlr.org
NLR has been a centre of expertise for over a century now,
with a deep-seated desire to keep innovating. It is an
organisation that works to achieve sustainable, safe,
efficient and effective aerospace operations.
The combination of in-depth insights into customers’ needs,
multidisciplinary expertise and state-of-the-art research
facilities makes rapid innovation possible. Both domestically
and abroad, NLR plays a pivotal role between science, the
commercial sector and governmental authorities, bridging
the gap between fundamental research and practical
applications. Additionally, NLR is one of the large
technological institutes (GTIs) that have been collaborating
over a decade in the Netherlands on applied research
united in the TO2 federation.
From its main offices in Amsterdam and Marknesse plus
two satellite offices, NLR helps to create a safe and
sustainable society. It works with partners on numerous
programmes in both civil aviation and defence, including
work on complex composite structures for commercial
aircraft and on goal-oriented use of the F-35 fighter.
Additionally, NLR helps to achieve both Dutch and European
goals and climate objectives in line with the Luchtvaartnota
(Aviation Policy Document), the European Green Deal and
Flightpath 2050, and by participating in programs such as
Clean Sky and SESAR.