Embed Size (px)
Citation preview

Master’s Thesis 2021 30 ECTS
Faculty of Biosciences
Study of the soil macrofauna in
tropical cacao-based agroforestry
systems in the Dominican Republic
Marie Guittonneau
MSc Agroecology

Acknowledgments
I would like to thank my CIRAD supervisors. Olivier Deheuvels for helping me formulate the research
objective and the methodology, for his support in the Dominican Republic and his unerring assistance.
Raphaël Marichal for guiding me with such consistency during the last period, for helping me structure and
organize my work. Both, for giving me the invaluable opportunity to realize this study and guiding me
through it, for sharing their expertise as researchers and their time, for their insightful feedbacks and
precious advices.
I would also like to thank all the people and institutions without who this study would not have been
possible, in no order of importance.
Tor Arvid Breland for his former teaching that gave me a stronger understanding of the agroecological
ecosystem of this study and its context, and for his corrections and advices.
Christophe David for being my tutor.
Janina Segura for hosting me at the CEDAF as intern, and at her house as guest. I am sincerely grateful and
would like to thank her whole family for their warm welcome and the time spent together.
The staff members of the CEDAF and Cacao Forest who all welcomed me with such kindness, for the
interesting discussions, for sharing their books and their knowledge with me.
Rosina Taveras Macarrulla for her incredible commitment in the identification process, for teaching me so
much, for cancelling her vacation and staying with us so late in the evening, for believing so strongly in
this project, for organizing the conservation of the samples and linking us to specialists. For the motivation,
the laugh, the moral support, the rides home, and of course, for bringing mangoes every single day.
Ruth Bastardo and Candy Pérez, for their contribution to the identification of the soil macrofauna.
Dijael Sosa and Jesus Aybar Suarez for completing the identification of the Formicidae at species level.
Rodrigo Salvador Bouzan for completing the identification of the Diplopoda at order level
Soranyi Severino La Paez, Deymer Hidalgo Jiménez and Jean Romer D. Alexis for the priceless help in the
field and for the identification process. We formed an great team.
Alberto Piña for his support on the field, for finding the parcels, for the botanical and technical teaching,
and for the moto rides between the plantations.
The sampling team who I was delighted to gather with so early in the morning to go sweat in the plantations,
for their great job, for their patience and commitment.
All the farmers who accepted to include their plantation in this study, for sharing their space, time and
knowledge.

Albert Flory for the statistical support, for his detailed explanations, for sharing his precious knowledge
with so much pedagogy, for the whole afternoon spent with me and for answering my questions even on
Saturday.
Karim Barkaoui for his advices in statistics and for helping me to gain perspective.
Martin Notaro for his thesis work and for being such an inspiration.
Sandrine Renoir, for organizing my trip and her reactivity in solving any administrative problem.
Bénédicte Ohl, for sharing her computer and for her contagious good mood.
Agata Garsia, for her moral support, her cheering, the discussions in all languages.
I also want to thank my Dad, for transmitting me the love, respect and care for Nature.

Preface
The present document does not include all the data collected during the training period. Several data were
collected in view of treating additional research questions that will be addressed in the frame of a scientific
publication to be submitted by the end of 2021.
These data are presented in Appendix 1.

Table of content 1 Introduction .................................................................................................................................... 1
2 Literature review ............................................................................................................................. 3
3 Material and methods ...................................................................................................................... 5
Choice of the study site ............................................................................................................ 5
3.1.1 The Dominican Republic ................................................................................................. 5
3.1.2 San Cristóbal province ..................................................................................................... 7
3.1.3 Criteria for selecting cacao plantations ............................................................................. 8
3.1.4 Sampling plots in cocoa plantations.................................................................................. 9
3.1.5 Sampling points in the sampling plots .............................................................................. 9
Processing the macrofauna samples ........................................................................................11
3.2.1 Identification ..................................................................................................................11
3.2.2 Density and diversity determination. ...............................................................................13
Plant inventories .....................................................................................................................14
3.3.1 Density ...........................................................................................................................14
3.3.2 Diversity .........................................................................................................................14
Soil analysis ...........................................................................................................................14
Statistical analysis ..................................................................................................................15
3.5.1 Data exploration by descriptive analysis ..........................................................................15
3.5.2 Explicative analysis ........................................................................................................16
4 Results ...........................................................................................................................................18
Data exploration by descriptive analysis .................................................................................18
4.1.1 Exploration of the macrofauna dataset .............................................................................18
1.1.1 Exploration of the soil dataset .........................................................................................24
1.1.2 Interactions between the soil quality and the soil macrofauna ..........................................26
Explicative univariate analysis ................................................................................................28
4.2.1 Evolution of the plant density and diversity at plot scale during the production cycle
(hypothesis 2).................................................................................................................................28
4.2.2 Influence of the plant density and diversity on the soil macrofauna (hypothesis 2) ...........29
Explicative multivariate analysis .............................................................................................30
4.3.1 Modeling the macrofauna parameters according to the age of the plantation and the presence
of cacao pods (hypotheses 1, 3 and 4) .............................................................................................30
1.1.3 Modeling the soil parameters according to the age of the plantation and the presence of cacao
pods (hypotheses 1, 3 and 4) ...........................................................................................................32
5 Discussion......................................................................................................................................33
Supporting and questioning the hypotheses .............................................................................33
5.1.1 The temporal heterogeneity did not influence the soil quality (hypothesis 1). ...................34
5.1.2 The temporal heterogeneity influenced only one taxon abundance (hypothesis 1) ............34
5.1.3 The plant composition and distribution at plot scale evolved during the production cycle of
the cacao plantation (hypothesis 2) .................................................................................................35
5.1.4 The plants heterogeneity did not influence the soil macrofauna (hypothesis 2) .................35
5.1.5 The decomposition of cacao pod husks influenced the soil physical properties (hypothesis
3) …………………………………………………………………………………………….36
5.1.6 The decomposition of cacao pod husks influenced the soil macrofauna density and diversity
(hypothesis 3).................................................................................................................................37
5.1.7 The interactions between the temporal heterogeneity and the decomposition of cacao pod
husks influenced the soil quality and the soil macrofauna (hypothesis 4). ........................................39
5.1.8 The soil quality and the soil macrofauna influenced each other. .......................................39
Limits of the experimental protocol ........................................................................................40
Limits of the identification process .........................................................................................42
Unconsidered variation factors ................................................................................................43
6 Conclusion .....................................................................................................................................45
7 References .....................................................................................................................................47
8 Appendices ....................................................................................................................................54
9 Abstract .........................................................................................................................................65

List of tables
Table 1 – Distribution of the sample of 24 cacao-based agroforestry plantations into four age-classes…….9
Table 2 – Contingency table of the experimental plan……………………………………………………………10
Table 3 – Functional classification used for soil macrofauna…………………………………………………...14
Table 4 – Predictive variables included in the different models…………………………………………………17
Table 5 – Sampled macrofauna data by functional groups………………………………………………………22

List of figures
Figure 1 - Location of the Dominican Republic in the Caribbean…………………………………………..…….6
Figure 2 - Location (red dots) of San Cristóbal province and study area in the Dominican Republic…..…...7
Figure 3 - PCA of the taxa abundances(per plots)…………………………………………………………….…..18
Figure 4 - Plot clustering according to the first two axes of the PCA……………………………….……….....19
Figure 5 - Plots grouped by age class according to the first two axes of the PCA…………………..........…...19
Figure 6 - PCA of the taxa abundances (per sampling unit)……………………………………………..………20
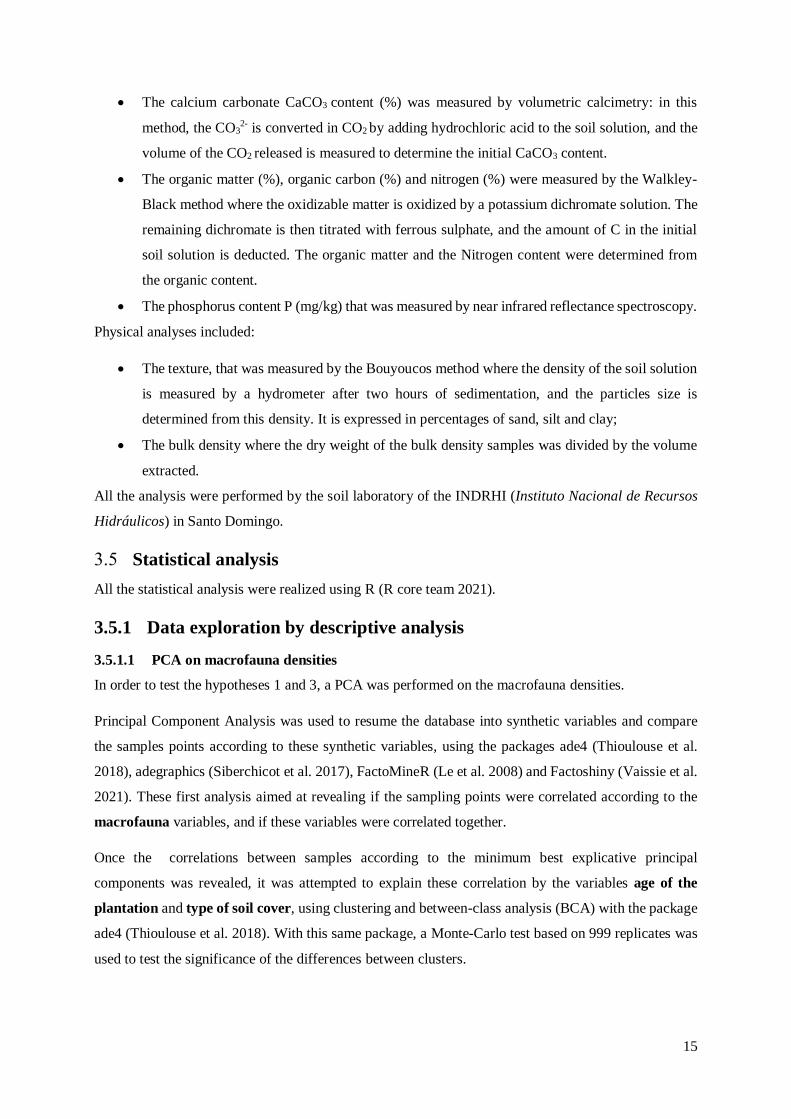
Figure 7 - Sampling units clustering according to the first two axes of the PCA………………………………21
Figure 8 - Sampling units grouped by age class and by type of soil cover according to the first two axes of the PCA………………………………………………………………………….…………………………………..…21
Figure 9 - PCA of the functional groups abundances……………………………………………………………..22
Figure 10 - Sampling units clustering according to the first two axes of the PCA…………………………..…23
Figure 11 - Sampling units grouped by age class and by type of soil cover according to the first two axes of the PCA……………………………………………………………………………………………………………...24
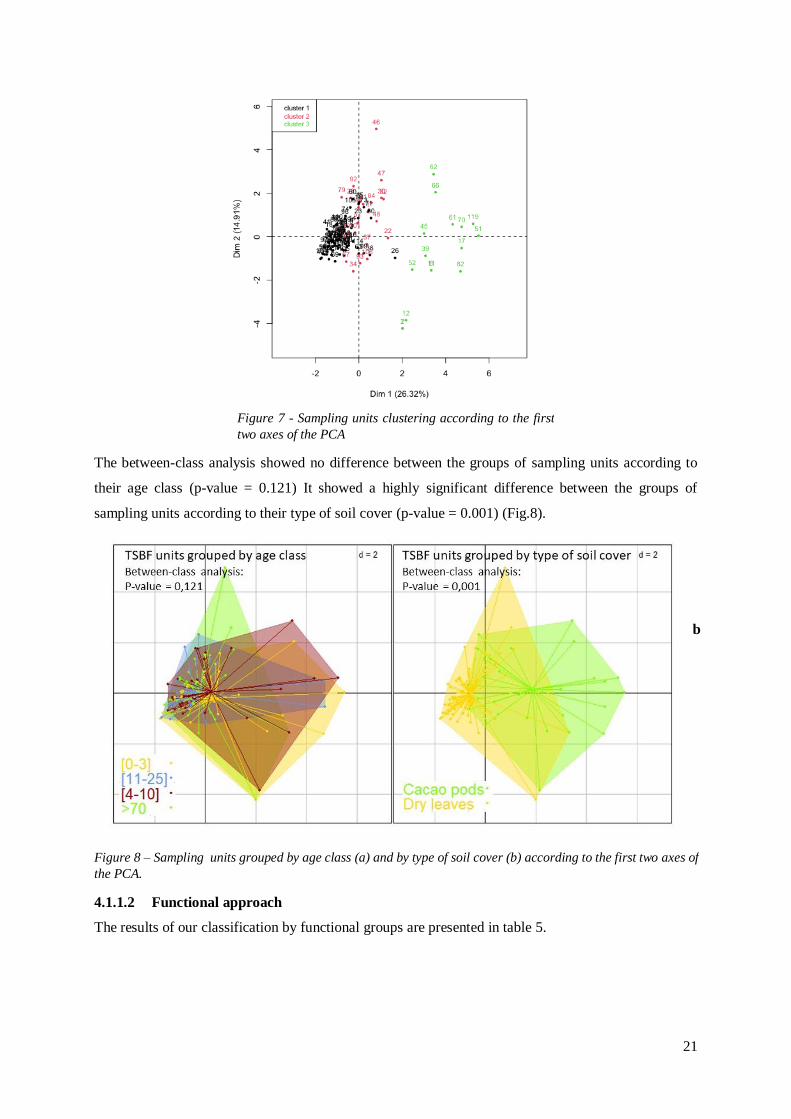
Figure 12 - PCA of the soil chemical and physical parameters………………………………………………….25
Figure 13 - Composite samples clustering according to the first two axes of the PCA………………………..25
Figure 14 - Composite samples grouped by degree of slope, type of soil cover and by age class according
to the first two axes of the PCA………………………………………………………………………………………26
Figure 15 - Co-inertia analysis between the PCA on soil chemical and physical parameters and the PCA
on macrofauna taxa abundances……………………………………………………………………………………27
Figure 16 - Correlations between macrofauna densities and soil chemical and physical parameters……...28
Figure 17 - Diversity of the cultivated vegetation for each age class……………………………………………28
Figure 18 - Density of the cultivated vegetation in each age class………………………………………………28
Figure 19 - Macrofauna density and diversity as functions of tree density and diversity……………………..29
Figure 20 - Total abundance of macrofauna under each type of soil cover in each age class………………..30
Figure 21 - Total abundance of Dermaptera in each age class and under each type of soil cover…………..30
Figure 22 - Total abundance of the different taxa under each type of soil cover……………………………....31
Figure 23 - Specific richness under each type of soil cover………………………………………………………31

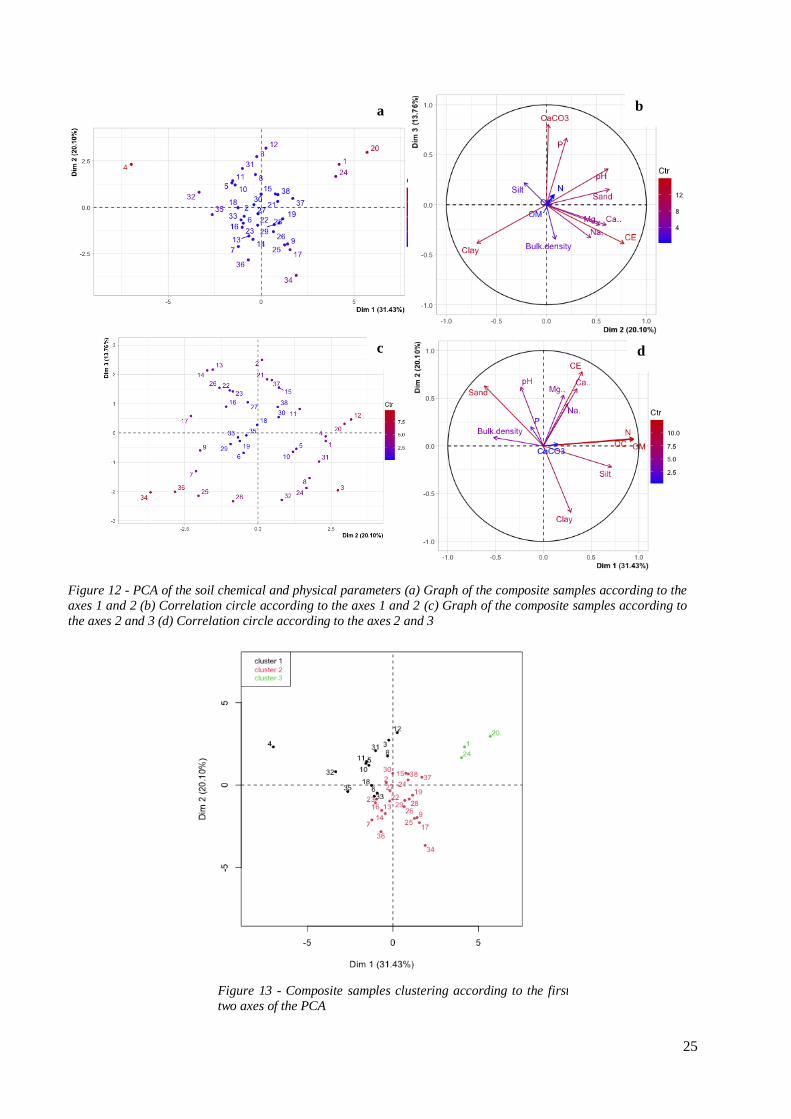
Figure 24 - Shannon index in each age class and under each type of soil cover……………………………….32
Figure 25 - Earthworms mean individual length in each age class and under each type of soil cover………32
Figure 26 - Phosphorus content, sand content and silt content in each age class and under each type of soil
cover. Bulk density under each type of soil cover………………………………………………………………….33

List of Appendices
Appendix 1 – Variables collected and not used in this study……………………………………………………51
Appendix 2 - Table summarizing the data collected during the study………………………………………….52
Appendix 3 – Schematization of the experimental plan…………………………………..……………………….53
Appendix 4 – Schematization of the transect walk process………………………………………..……………..54
Appendix 5 – Method used for delineation of the plots……………………………………………………………55
Appendix 6 - Mean abundances and diversity of soil macrofauna in the four age classes and two types of
soil cover of the study…………………………………………………………………………………………………57
Appendix 7– Total abundance, species richness and abundance of each taxon according to the type of soil
cover and to the age class…………………………………………………………………………………………….58
Appendix 8 – Earthworms functional traits according to the age class and to the type of soil cover………..59
Appendix 9 - Soil chemical parameters according to the age class and to the type of soil cover………..…60
Appendix 10 - Soil physical parameters according to the age class and to the type of soil cover……………………………………………………………………………………………………………………61
Appendix 11 - Alternative age classification for the plantations………………………………………………..61

1
1 Introduction
Agroecology is “the application of ecological concepts and principles to the design and management of
sustainable agroecosystems” (Gliessman at el. 1998). Francis et al. (2003) defined agroecology as “the
integrative study of the ecology of the entire food systems, encompassing ecological, economic and
social dimensions”. It goes beyond the study of the immediate impacts of agriculture on the environment
and requires a complete understanding of the agroecosystems as part of the food systems, and the
consideration of their complex and countless interactions. Agroforestry is a practice coherent with the
current agroecological knowledge. It is an agricultural land use combining at least one perennial
ligneous, with crops and/or cattle, in a spatial and temporal arrangement that often aims at optimizing
ecological and economical interactions between the components (Young 1989, Somarriba 1992). It
encompasses highly contrasted agroecosystems, from input-intensive and mechanized plantations
intercropping only two species to family grown, highly diverse and ecologically intensive
agroecosystems. Agroforestry takes many forms around the world. Each agroforestry system is the fruit
of a different history and culture, and answers specific needs by using the natural resources and
possibilities of the place where it emerges. For instance, it goes from the association of oak trees,
grassland and pigs in Spain for a specific high-quality meat market (Smith 2010), to the family gardens
of Maya population in México compound of multistrata annuals and perennial crops for the family’s
consumption (Diaz-Santana 2012). It takes place from cold areas like Scandinavia, where silvo
pastoralism is practiced with fodder pollards inside meadows (Smith 2010), to tropical areas like the
Caribbean region where cacao trees are grown in association with a number of cultivated plants (Sánchez
2019).
Agroforestry is generally acknowledged a sustainable agricultural practice, in term of productivity and
environmental conservation (Young 1989, Nair 1993, Scroth and Harvey 2007). Agroforestry practices
bring economical resilience by diversifying the production, and reduce erosion compared to annual
monocrops (Estrada 2000). Plant and root litter enhanced in agroforestry systems compared to annual
monocrop systems may increase the activity of soil fauna (Akinnifesi et al. 1999). Cacao-based AFS
have a better environmental impact than monospecific systems (Vaast and Somarriba 2014).
The soil macrofauna provides crucial ecosystem services, it fosters the functioning of the overall
ecosystems through the soil ecosystems. “Soils are a key reservoir of global biodiversity, which ranges
from microorganisms to flora and fauna. This biodiversity has a fundamental role in supporting soil
functions and therefore ecosystem goods and services associated with soils” (FAO et al. 2020).
Similarly, Wagg et al. (2014) showed that the soil biodiversity is a key factor in regulating ecosystem
services. More specifically, Marichal et al. (2014) found positive correlations between ecosystem
services and soil macrofauna density.

2
As expressed earlier, the soil macrofauna provides ecosystem services that allow food production, but
inversely, some food production systems such as organic cacao-based AFS play a huge role in preserving
soil macrofauna, by creating ecological corridors for many species.
Cacao-based AFS are known for preserving both wild and cultivated biodiversity (Suárez et al. 2021).
Organic cacao-based AFS play a huge role in preserving soil macrofauna and create ecological corridors
for many species. They allow their soil macrofauna to provide ecosystem services that ensure the
sustainability of food production. Several studies reveal that agroforestry systems have higher
abundance and diversity of soil invertebrates than annual crop systems (Mujeeb Rahman et al. 2012,
Pauli et al. 2011, Marsden et al. 2020). Indeed, agroforestry systems are generally constructed on a
higher density and diversity of plants than annual crop systems, so they offer more ecological niches for
macrofauna, as well as for microorganisms and fauna, which in turn foster the development of
macrofauna.
The cacao-based agroforestry systems of this study are managed without agrochemicals, without tillage
and with more cultivated and wild diversity than monocrop systems (Deheuvels et al. 2020).
In order to understand the effects of agroforestry practices on macrofauna, it is important to investigate
the relationships between soils’ chemicals and physical properties, and below-ground biodiversity,
which for the moment has not been much studied (Marsden et al. 2020, FAO et al. 2020). Several studies
focus on specific groups of soil macrofauna, especially earthworms, beetles, ants and termites (De Bruyn
and Conacher 1990, Diamé et al. 2018, Conceição et al. 2019, Gongalsky et al. 2021), comparing their
diversity in different land uses (Lal 1988, Marasas et al. 2001, Delabie et al. 2007, Mujeeb Rahman et
al. 2011, Marsden et al. 2020). AFS, in terms of influences on biodiversity, are often compared with
forests, pastures or monocrop systems, and even other contrasted AFS (Mujeeb Rahman et al. 2012, De
Beenhouwer et al. 2013, Suárez et al. 2021). However, few studies compare agricultural practices inside
the same type of AFS. The influences of crop residues application on the soil macrofauna has been
studied in annual cultures (Lavelle et al. 2001, Ayuke et al. 2004, De Aquino et al. 2008) but seldom in
agroforestry systems. García-Tejero and Taboada (2016) studied the effect of different microhabitat,
including pruning residues, on the soil macrofauna. Few studies have tested the influence of cacao husks
on the soil macrofauna. Prastowo (2020) tested the influence of cacao husks and cacao leaf on the
earthworms populations, but not on the whole soil macrofauna. Other studies focused on ants population
living in cacao pods, without link to the soil (Fowler 1993, Castaño-Meneses et al. 2015). The influence
of the ageing of the plantation has been studied by Kamau et al. (2017) in Kenya. They assessed the
spatial influence of trees in maize-based AFS at different ages of cultivation. They showed that the
content of lignin in the litter varied with the age of the plantation. The influence of trees density and
diversity on the soil macrofauna is more documented (Pauli et al. 2010, Suárez et al. 2021) .

3
Applied research aims at answering problems with practical solutions. Understanding the effects of
agricultural practices on the plants, the soil and its macrofauna in cacao-based agroforestry systems will
enable to design and manage agroecosystems that are environmentally, socially, culturally and
economically sustainable.
These are the reasons why the objective of this study is to assess the influence of temporal
heterogeneity and agricultural practices on the soil and its macrofauna in tropical cacao-based
agroforestry systems. This objective raises four hypotheses:
1- The temporal heterogeneity caused by the ageing of the cacao plantation influences the soil
quality and the abundancy and diversity of the soil macrofauna.
2- The heterogeneity of plant composition and distribution at plot scale evolves during the
production cycle of the cacao plantation, and influences the abundancy and diversity of the soil
macrofauna.
3- Crops residues, and in particular cacao pod husks, influence the soil quality and the diversity
and abundancy of the soil macrofauna
4- The interactions between the temporal heterogeneity and the presence of crop residues influence
the soil quality and the abundancy and diversity of the soil macrofauna.
We offer here to test these 4 hypotheses in the manner described below.
2 Literature review
Microorganisms, mesofauna and macrofauna all depend on each other through complex food webs
interactions (Sofo et al. 2020). Each population of a community has a different functionality in the
ecosystem, and some have been more studied than others: the roles of microorganisms have been
extensively highlighted, conversely to the roles of macrofauna (Sofo et al, 2020). Among macrofauna,
the role of earthworms, ants and termites have been more studied than other taxa (De Bruyn and
Conacher 1990, Jouquet et al. 2011, Lang and Russell 2020). These three taxa are recognized as
ecosystem engineers (Jones et al. 1994) that modify the soil structure and increase the circulation of
nutrients, gases, water and energy, influencing their availability for other organisms (Jouquet et al. 2006,
FAO et al. 2020). Earthworms have been particularly studied. Their bioturbation services depend on
their functional traits (Blouin et al. 2013, Tsiafouli et al. 2015, Pelosi et al. 2015). Their abundance and
functional groups composition are positively correlated with water infiltration rates (Spurgeon et al.
2013). In the tropics, earthworms increase the growth of cultivated plants, especially the shoot growth
of perennial plants (Brown et al. 2004, Van Groenigen et al. 2014). However, the influence of
agroforestry systems on soil fauna has been more studied for macrofauna than for micro and mesofauna.
Among macrofauna, most studies have focused on earthworms, beetles, ants, termites and spiders
(Marsden et al. 2020)

4
The ant’s family is often recognized as the best bioindicator to evaluate the degree of health and
degradation of an ecosystem (Brown, 1991), because they are very sensitive to ecological changes. It is
the group that most impacts its habitat and community (Delabie et al. 2007). Sanabria et al. (2014)
identified ant species that can be used as bioindicators of different soil-based ecosystem services. They
also regulate crop-damaging insects, including some cacao pests (Diamé et al. 2018, Delabie et al. 2007).
Termites, as social insects, also greatly contribute to ecosystem services (Elizalde et al. 2020), especially
in the tropics. They create biostructures that impact the soil physical properties and they influence the
distribution of natural resources on which the whole biota depends (Jouquet et al. 2011). Among other
taxa that have been studied in connection with ecosystem services are the predators Araneae, which
highly contribute to pest control (Rousseau et al. 2013)
Macrofauna abundance and diversity first depend on geography. Specific richness decreases with
latitude: soil fauna density and diversity are higher in tropical areas, and when getting closer to the
equator (Gaston 2000, Decaëns 2010). Species richness is generally lower on islands, where it decreases
when the distance from the continent increases (Marcon 2015). This is especially true for the ants
(Decaëns 2010). Diversity and abundance also depend on habitat fragmentation (Decaëns 2010),
topography (Liu and Li 2008), climate and microclimate, season (Rozen et al. 2013) humidity and
distance to the sea (Zheng et al. 2020). Flora density and diversity are other important biological factors
affecting soil macrofauna (Gholami et al. 2016, González and Zou 1999).
It is as well affected by physical factors like soil’s texture, especially percentage of silt (Gholami et al.
2016), density and compaction (Radford et al. 2001). For example, a significant negative correlation
between bulk density and abundance of ants was proven (Nanganoa et al. 2019).
It has been demonstrated that the percentage of nitrogen in the soil, modified by fertilizers application
(Edwards and Lofty 1982), as well as the percentage of organic matter and nutrients (Lavelle et al. 2001,
Decaëns 2010), alter the diversity and abundance of soil organisms. Influences of the content of
potassium, calcium and magnesium (Rousseau et al. 2012), pH (Decaëns 2010) and cations exchange
capacity (Bradham et al. 2006) on the density and diversity of soil macrofauna has also been proven.
Pesticides drastically decrease the abundance and diversity of soil macrofauna (Nare et al. 2017).
Insecticides have a large effect on soil organisms, but earthworms are the most sensitive (Pelosi et al.
2014). They are also sensitive to fungicides, especially copper-based fungicides that causes long-term
reduction of their populations, and to herbicides, as some products directly kill them (FAO and ITPS
2015).
In summary, soil organisms and the soil chemical and physical parameters influence each other through
complex interactions (Devine et al. 2014)
Agroforestry as a practice is an alternative to the agricultural intensification based on agrochemicals and
mechanization (Tubenchlak et al. 2021). This last type of agriculture reduces abundance and functional

5
diversity of soil biota, especially of larger-sized organisms such as earthworms and macroinvertebrates
(Postma-Blaauw 2010). It also reduces the diversity of soil fauna and the complexity of soil food webs.
Especially, drastic losses of native earthworm species have been observed in highly disturbed
agricultural systems (Feijoo et al 2011). Agricultural intensification also reduces the mean body mass
of soil invertebrates, and shrinks the functional and taxonomical diversity of earthworms (Tsiafouli et
al. 2015). The mean body mass (corresponding to the mean individual weight) is an important functional
traits of earthworms, as their effect on some soil physical parameters, like the bulk density, depends on
their body mass (Lang and Russel 2020). Conversely, Agroforestry improves the soil physical qualities
on which macrofauna relies (Cherubin et al. 2019). The complementarity in root structure between the
different species constituting an agroforestry system may prevent soil compaction and then preserve
macrofauna habitats. As an example, cacao AFS have lower bulk density than pastures (Suárez et al.
2021) and their contribution to ant’s species conservation has been proven by Delabie et al. (2007)
Cacao-based agroforestry systems in the DR show similarities with cacao producing countries of Central
America and Africa in terms of associated plant’s diversity and density. In one parcel around 10
associated species are usually grown, the cacao density ranges from 658 to 880 trees per hectare and the
associated plant density from 100 to 281 trees per hectare (Deheuvels et al. 2020). The cacao tree is
native from the Amazon rainforest, where it has adapted to the shade of higher trees. It does not require
full sunlight to reach its maximum photosynthetic capacity. When not fertilized, cacao reaches its
maximum yield at 50% full daylight transmitted (Wood and Lass 2008). Young cocoa trees under 3
years old even do better under shade, which impacts the light intensity reaching the leaves, but also
creates a microclimate that prevents moisture stress (Wood and Lass 2008).
3 Material and methods
Choice of the study site
3.1.1 The Dominican Republic
The Dominican Republic was chosen as a study site because an opportunity was offered by the Cacao
Forest Project for accessing agroforestry cacao-based plantations. Its location makes it adequate to study
tropical macrofauna. The country is the first organic cacao producer worldwide and 48% of the
national production comes from organic agroforestry systems (Notaro 2019).
The Cacao Forest Project is working in the Dominican Republic since 2016. It has been conceptualizing
and implementing four innovative cacao-based agroforestry systems (AFS) for improving farmer’s
revenue. Cacao Forest also wants to complete its assessment of the system’s sustainability by evaluating
their ecological impacts.

6
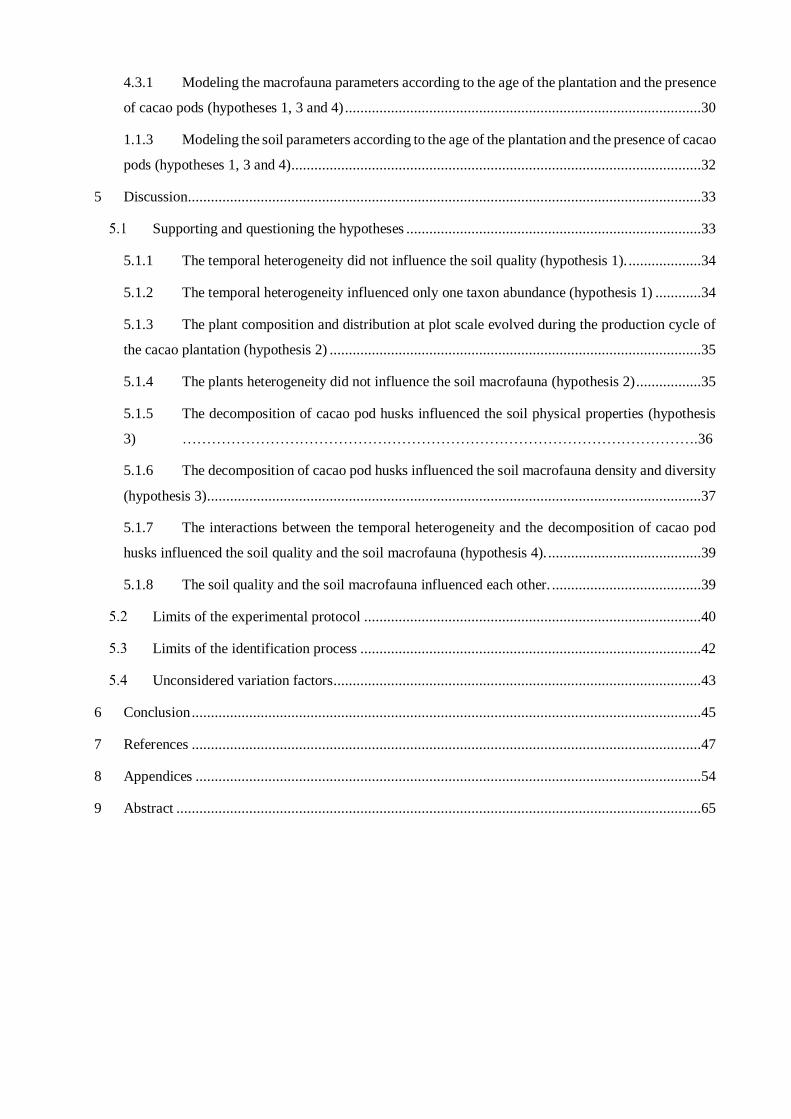
The Dominican Republic (Fig.1) occupies the eastern two-thirds of the Hispaniola island, in the
Caribbean area. It is bounded to the north and east by the Atlantic Ocean, to the south by the Caribbean
Sea, and to the west by the land border with Haiti. It is located 70.16 West and 18.74 North.
In the Dominican Republic, agrochemicals use and mechanization are mostly limited to landed estates
or latifundia, for rice and exportations crops like sugarcane. Smallholders, who represent the majority
of the agricultural land in the country, generally do not rely on such techniques inducing large
investments (Republica Dominicana 2021). Cacao represents a significant part of the agricultural land
with 25% of the cultivated area, where only rice cultivation (30%) occupies a larger area (Gobierno de
la República Dominicana, 2020). In the Dominican Republic, cacao is almost exclusively grown under
agroforestry systems (AFS), often in environmentally sensitive regions (Siegel and Alwang 2004). The
regions where cacao is grown have a relative dry winter that reduces the incidence of pests and diseases,
making them adapted for organic cacao production (Siegel and Alwang 2004). Plus, the country has
been preserved from common cacao diseases in tropical areas like Moniliophthora, thanks to its insular
position (Notaro 2019). Cacao-based agroforestry systems often present lower densities of cacao trees
than in cacao monocrops. They also present several interactions with a number of associated crops. As
a consequence, the cocoa yield is often lower but is also compensated by a wide range of products either
sold or self-consumed. In the Dominican Republic, more than 60 plant species have been found
cultivated in association with cocoa trees (Deheuvels et al. 2020).
The diversity of associated crops, their densities and the cacao trees’ density vary among plots and also
inside the plots. This heterogeneity reflects farmer’s strategies. Moreover, cacao farmers adapt their
practices during the cacao trees’ growing cycle and production dynamics. During the first 3 to 4
Figure 1 - Location of the Dominican Republic in the Caribbean. Adapted from Google maps, 2021. Caribbean,
License Map data, available through <https://www.google.fr/maps/place/Caribbean/@18.4335985,-
81.3317603,5z/data=!3m1!4b1!4m5!3m4!1s0x8eb9e309d5a
Figure 2 - Location of the Dominican Republic in the Caribbean.
Figure 3 - Location of the Dominican Republic in the Caribbean.
Figure 4 - Location of the Dominican Republic in the Caribbean.

7
unproductive years after the plantation of the cacao trees, farmers usually intercrop annual or short-cycle
crops such as plantain, pineapple or yam, to feed their families and/or to generate revenue. Those crops
tend to be eliminated as the cacao trees close their canopies and other perennial associated crops grow
taller and enter productive phase.
In the smallholders’ cacao-based AFS of the Dominican Republic, the harvest of cocoa and associated
crops are often performed by the farmer himself or by a family member. The cacao pods are tumbled
down from the trees. They are gathered on the ground at an opening site almost always located inside
the plantation and beans are often extracted on the same site, for commodity reasons. The remaining
cacao husks are often left decomposing in heaps where the extraction of the beans was realized.
3.1.2 San Cristóbal province
Cacao Forest established experimental plantations in two areas of the Dominican Republic. Among
them, we chose San Cristóbal, situated 70°10' West and 18°42' North (Fig. 2)
This province has a winter dry equatorial climate (Aw in the Köppen classification) (Kottek et al. 2006).
Average annual temperatures and precipitations range from 19°C (minimum monthly average) to 32 °C
(maximum monthly average), and from 1600 mm (minimum annual average) to 1800 mm (maximum
annual average), respectively . The average soil conditions are 3.2% organic matter, pH 6.9, 0.3 meq
K/100 mL, 18 ppm Ca, 4.3 ppm Mg and 10 ppm P (Deheuvels et al. 2020).
This province accounts for 1.7% of the national cacao production (Notaro 2019). The cacao-based AFS
of San Cristóbal have a lower density of cacao trees and a higher density of associated plants than in
Figure 2 - Location (red dots) of San Cristóbal province and study area in the Dominican Republic. Adapted
from Google maps, 2021. Dominican Republic, License Map data, available through
<https://www.google.fr/maps/place/Dominican+Republic/@18.6691753,-
71.251424,8z/data=!3m1!4b1!4m5!3m4!1s0x8eaf8
Figure 5 - Location of the Dominican Republic in the Caribbean.
Figure 6 - Location of the Dominican Republic in the Caribbean.

8
other main cacao producing areas of the Dominican Republic (Deheuvels and Notaro 2017). It presents
concentrated cacao plantations areas, and the cacao-based AFS are similar enough to form a same
agroecosystem, but still present internal variations. This study was carried out in a restricted area around
the village Loma Verde in San Cristóbal (Fig.2).
3.1.3 Criteria for selecting cacao plantations
Our experimental design was an adaptation of a split-plot (Jones and Nachtsheim 2009), using purposing
sampling (Ritchie et al. 2003). The final experimental plan is presented in appendix 3 and relies on a
total sample of 24 cacao-based agroforestry plantations managed organically and without tillage, and
accessible by road in a 1 hour radius from Loma Verde.
The criteria used to select our 24 cacao plantations were:
- The age of the plantation
- An area greater than 1000m2
- The presence of cacao pods heaps
The selection of the cacao plantations, delineation of the plots, selection of the sampling points and
macrofauna sampling were realized from April, the 19th to June, the 2nd.
The agricultural practices evolve during the production cycle of cocoa plantations, especially in term of
plant composition and distribution. In order to test the hypotheses 1, 2 and 4, cacao plantations were
sampled among four age classes shown in Table 1.
Table 1 - Distribution of the sample of 24 cacao-based agroforestry plantations into four age-classes.
The age of each plantation is the number of years since its creation and was given by the owner.
We chose to leave a wide gap of 45 years between age classes 3 and 4, in order to maximize our chances
to register any effect of aging on soil macrofauna and physico-chemical properties
Age class Description Number of
parcels
[0-3] Initial stage, the trees are young and unproductive. 6
[4-10] Transition stage, the trees are growing and some, including cacao trees, start
their production.
6
[11-25] Stabilized stage, the fruit trees are productive. 6
>70 Senescent stage, the production is reduced. 6

9
3.1.4 Sampling plots in cocoa plantations
In each cocoa plantation, a 1000 m² plot was materialized following Rousseau et al. (2012), with stakes
and strings and located in the best possible manner to avoid contact with the borders of the plantation.
For this purpose, a transect walk was performed on each cocoa plantation, following Francis et al. (2012)
and as shown in appendix 4.
San Cristobal cacao AFS are small and irregular in shape (Notaro 2019). For this reason, we had to adapt
the shape of our sampling plots. Plots were square shaped, their dimensions were 20m x 50m or 25m x
40m, accordingly to the shape of the plantation and always in order to avoid contact with the borders.
The sampling plot delimitation was performed with stakes and strings, the day before macrofauna
sampling for minimizing disturbance. Strings were removed just after macrofauna samplings in order
not to interfere with farmer’s work. The stakes were left standing until soil sampling
3.1.5 Sampling points in the sampling plots
The microtopography, low canopies and high tree densities made a reliable delineation method
necessary to ensure a similar distance among sampling points in each plot. The first corner of the
sampling plot was established following the Pythagorean theorem. Then, a stake was placed each 10
meters by a person visually guided by a second person to ensure linearity. If the last side of the plot did
not have the expected length, the distance between each facing stake was measured for rectification
(appendix 5).
On each plot, five sampling points were established at least five meters apart following the TSBF
macrofauna sampling method (Anderson and Ingram 1989) (See paragraph 3.1.5.3) and using a
purposing sampling method (Ritchie et al. 2003). This method allowed us to split plots between two
alternate situations: (i) “soil covered with leaf litter” and (ii) “soil covered with cacao pod husks”. The
experimental plan was unbalanced (Table 2) because there were no pods husks in unproductive cacao
plantations aged [0-3] and because we found less cacao pods heaps than expected in young and very old
cacao plantations.
3.1.5.1 Presence/Absence of cacao husk heaps
In order to test the hypotheses 3 and 4, we selected cacao plantations where at least one heap of
decomposing cacao husk was found, except for the parcels of the age class [0-3] because no cacao was
produced at this stage. The cacao husk too recent (less than two weeks after harvest) where excluded
and no cacao husk heaps was older than two month. The information was provided by the owner or, in
few cases, it was estimated visually.

10
Type of soil cover
Age class
Soil covered with
heaps od cacao pod
husks (repetitions)
Soil covered with leaf
litter (repetitions) Total
[0-3] 0 30 30
[4-10] 6 24 30
[11-25] 14 16 30
>70 10 20 30
Total 30 90 120
3.1.5.2 Sampling points for plant inventory
In order to test the hypotheses 2 and 4, the cultivated vegetation’s density and diversity were measured.
From the stake marking the sampling point, a disc of 4 meter radius (50.27m2) was established with
measuring tape. Each plant higher than 1 meter inside this disc was inventoried following Deheuvels
and Notaro (2017). However, in the age class [0-3], this heigh limit was reduced to 40cm, because most
of the cultivated vegetation in this initial stage was smaller than 1m, and keeping this limit would have
led to underestimate the actual vegetation density and diversity. There was few vegetation between 40cm
and 1m in the other age classes.
3.1.5.3 Sampling points for macrofauna
The components of soil biodiversity are classified in three groups following their size: microorganisms,
mesofauna and macrofauna. Microorganisms are from 20 to 200 µm long. It is the most abundant and
diverse group, reasons why its study is complex. Besides, due to their size, the sampling and
identification methods require advanced equipment. Mesofauna includes all organisms from 200 µm to
10 mm long. They have limited burrowing capacity (Ruiz and Lavelle 2008). Conversely, macrofauna
includes animals from 2mm to 2cm long (DeLuca et al. 2019) which generally have an important
burrowing activity. The study focuses on soil macrofauna.
The macrofauna sampling was carried out following an adaptation of the TSBF method (Anderson and
Ingram 1989) : a 25cm x 25cm x 10 cm (6.25 dm3) metal frame was used to extract separately the litter,
the 0 to 10 cm soil layer and the 10 to 20 cm soil layer. The litter and the soil layers were separated to
reduce the time required for soil extraction. It also reduced the time laps between soil extraction and
macrofauna extraction. The adaptation from the original method was also made to limit the escape of
macrofauna during the extraction. We sampled the 20 to 30 cm subsoil horizon in the first six plots, and
then discarded these samples because (i) this horizon was the most time consuming and (ii) these first
samples represented less than 5% of the total macrofauna found.
Table 2 – Contingency table of the experimental plan
Table 3 - Number of repetitions (sample units) under
each type of soil cover in each age class
Table 4 - Number of repetitions (sample units) under
each type of soil cover in each age class
Table 5 - Number of repetitions (sample units) under
each type of soil cover in each age class
Table 6 - Number of repetitions (sample units) under
each type of soil cover in each age class
Table 7 - Number of repetitions (sample units) under
each type of soil cover in each age class
Table 8 - Number of repetitions (sample units) under
each type of soil cover in each age class
Table 9 - Number of repetitions (sample units) under
each type of soil cover in each age class
Table 10 - Number of repetitions (sample units) under
each type of soil cover in each age class
Table 11 - Number of repetitions (sample units) under
each type of soil cover in each age class
Table 12 - Number of repetitions (sample units) under
each type of soil cover in each age class
Table 13 - Number of repetitions (sample units) under
each type of soil cover in each age class
Table 14 - Number of repetitions (sample units) under
each type of soil cover in each age class

11
First, the metal frame was systematically placed on each sampling point, and the litter found inside the
metal frame was rapidly placed in a closed plastic box. Then, the metal frame was driven 10 cm down
into the soil with a heavy hammer until its top reached the surface. The entire soil inside the frame was
extracted with a shovel and placed into a different closed plastic box. The same process was executed
for the second and last soil horizon.
After each monolith extraction, the macrofauna was hand-sorted with tweezers from each plastic box
and placed inside referenced flasks filled with 70% alcohol. Each earthworm was photographed on site
for color and pigmentation information.
A team of 5 young local volunteers was trained and hired to help with the sampling. They were trained
to the adapted TSBF extraction method and received thorough and repeated explanations and
instructions. Two of them helped extracting the monoliths and the whole team participated to the hand-
sorting of invertebrates. The sampling was always realized during the morning
3.1.5.4 Sampling points for soil quality assessment
In order to test the hypothesis 1, 2, 3 and 4, soil was sampled following Mahler and Tindall (1994). In
the plots without cacao husk heaps, a composite soil sample was produced out of 3 points randomly
selected among the 5 macrofauna sampling points. In the plots with cacao husk heaps, one composite
sample was made out of the sampling points covered with leaf litter, and a second one was made out of
the sampling points covered with cacao husks. At each point, after removing the leaf litter layer, the first
20 cm of the soil were extracted with a spade. Subsamples were mixed together in a box and an
approximative weight of 400g was extracted. A total of 38 composite soil samples was obtained.
In addition, bulk density was determined using the small cylinders method described in Baize (2018):
The first 20 cm of the soil were extracted with a sampling cylinder of known volume. In the plots without
cacao husks, the sampling was realized at a point randomly selected among the 5 sampling points. In
the plots with cacao husk heaps, one was randomly selected among the sampling points under cacao pod
husks, and a second one was randomly selected among the sampling points covered with leaf litter.
Processing the macrofauna samples
3.2.1 Identification
The macrofauna identification was carried out at the biological control laboratory of the UASD
(Universidad Autónoma de Santo Domingo), under binocular loupes and by using several books and
identification keys (Chu 1949, Fernández and Sharkey 2006, McGavin et al. 2002, Triplehorn and
Johnson 2018). Macrofauna originally refers to individuals sized from 2mm to 20mm (DeLuca et al.
2019). In our study the invertebrates bigger than 20mm, belonging to taxonomical groups considered as
macrofauna, were included. The taxon Entognatha, Collembola, Diplura and Acari which are

12
sometimes considered as mesofauna (Gongalsky 2021) were included in the study because collected
individuals entered the chosen size range of 2 to 20mm.
3.2.1.1 Taxonomic approach
Each invertebrate was identified at taxon level, and classified by morphotype (usually, one morphotype
corresponds to one species), except from the earthworms. The first morphotype identified in a taxon was
registered as the morphotype 1 of this taxon and so forth for each new morphotype. Each morphotype
was photographed with the binocular loupe, and conserved in 70% alcohol in an individual 1.5mL flask.
Taxa were generally Orders, with some exceptions: earthworms formed one taxon, Hemiptera was
considered as an Order, even if some taxonomists consider Hemiptera as a superorder that includes
Homoptera and Heteroptera. This choice was made for the sake of consistency, because it was the
systematic used in the books and determination keys that were used for identification. Moreover,
Hemiptera is a monophyletic group clearly identifiable based on its mouthparts and this classification is
used by many entomologists (Forero 2008, Entomological Society of America 2021). The termites were
classified following the old systematic as Isoptera. Indeed, they became Blattodea in 2018 for
phylogenetic evidence (Inward et al. 2007, Milius 2018) but it was important to separate them from the
other morphotypes of the order Blattodea as they have different functions, principally due to their social
organization and bioturbation services.
3.2.1.2 Functional approach
An exclusively taxonomic approach of the diversity would not provide a full understanding of how soil
macrofauna diversity can be influenced. We chose to include in our study an assessment of the functional
diversity (Postma-Blaauw et al. 2010). Some species have similar functions and can replace one another
in their ecosystem, they form the same functional group (Brussaard 1998). The balance between
functional groups is a condition to sustainable agroecosystems (Marasas et al. 2001). Macrofauna
species influence each other especially through competition for food and habitat (Decaëns 2010).
The taxa were organized in four functional groups according to their trophic and rheagogic function:
predators, phytophagous, detritivores and ecosystem engineers (Arditi et al. 2005). The rheagogic group
“ecosystem engineers” gathered the earthworms, Isoptera and Hymenoptera (Table 3). They could have
been grouped according to the three trophic categories (predator, phytophagous or detritivore), but this
classification was chosen because the ecosystem engineers have strong impacts on their environment,
that are not directly linked to their trophic role. It seemed important to adopt this second approach
because “The functional importance of invertebrate activities is often disproportionate to their actual
abundance” (Anderson 1988, cited in Lavelle 1996).
The principal functional traits of earthworms were measured. The earthworms of each sample were
individually weighted with a balance of a 0.1 mg accuracy to obtain their body mass (mg) and calculate

13
their total biomass (mg.m-2). We considered that the fresh body weight was measured, as the alcohol
used for conservation approximately replace the body water. They were measured with a ruler of 1 mm
accuracy to get their average body length (mm). The body mass and the body length are commonly used
functional traits for soil invertebrates (BETSI 2021). The adult specimens were photographed with the
binocular loupe for further identification.
Table 3 - Functional classification used for soil macrofauna
Predators Phytophagous Detritivore Engineer
Acari Coleoptera (larvae) Blattodea Earthworms
Araneae Dermaptera Collembola Hymenoptera
Coleoptera (adult) Diptera (adult) Diplopoda Isoptera
Diplura Stylommatophora Diptera (larvae)
Pseudoscorpionida Pulmonata Embioptera
Schizomida Hemiptera Isopoda
Scolopendrida Lepidoptera Psocoptera
Scorpiones Neuroptera
Uropygi Orthoptera
Thysanoptera
3.2.2 Density and diversity determination.
3.2.2.1 Density
The number of individuals of each morphotype in each one of the three layers (litter, 0-10 cm layer, 10-
20 cm layer) was recorded during the identification.
However, litter and both horizons were gathered for the statistical analysis because we considered them
as a whole system, in which macrofauna is constantly moving. It is especially true for anecic earthworms
that feed on the litter but live in vertical galleries (Blouin et al. 2013), or ants that forage in the litter and
nest underground (Fowler 1993).
For each sampling point, the density of each taxon and the density of each functional group was
calculated, using the software Excel and its interface for VBA programming. The abundance by
sampling point was multiplied by 16 to get the density (ind.m-2).
3.2.2.2 Diversity
The soil macrofauna diversity was also calculated by sampling point. Three classical diversity indices
were calculated (Marcon et al. 2015) with Excel’s interface for VBA programming and with the package
vegan (Oksanen et al. 2020) in R:
1. The specific richness (S), which is the number of species (here morphotypes) that were found
at a given sampling point.

14
2. The Shannon index (H), which combines species richness and species evenness (the relative
proportions of each species encountered), is expressed as:
Where S is the number of species or morphotypes encountered, and ps is the proportion of species s.
3. The Simpson index (E), which is an evenness index, that slightly varies with S. It goes from 0
to 1 and can be interpreted as the probability that two individuals randomly selected belong to
the same species. It decreases with the regularity of the distribution of the taxa and is expressed
as:
Where S is the number of species or morphotypes encountered, and ps is the proportion of species s.
Plant inventories
3.3.1 Density
The number of plants inventoried in the 4 meters radium disc around the sampling point was divided by
the area of this disc (50.27m2), to get a density measure comparable with other studies (ind.m-2)
3.3.2 Diversity
The same 3 classical diversity indices presented in paragraph 2.8.2.2 were calculated for the vegetation.
Soil analysis
In order to test the hypotheses 1, 2, 3 and 4, the 38 composite soil samples were sent to the laboratory
less than 24h after sampling, for chemical and physical analysis.
Chemical analyses included:
The pH, measured by a potentiometric pH-meter. It determines the voltage difference between
two electrodes disposed in the soil solution.
The exchangeable cations Ca2+, Mg2+, Na+ (meq/L) were measured by the ammonium acetate
method. It consists in mixing the soil solution with an excess of ammonium solution, which
exchanges its cations with the soil exchangeable cations, and then measuring the difference
between the initial and the remaining ammonium content.
The electrical conductivity (mS/cm), was determined by measuring the conductance of the soil
solution with a conductivity meter.
15
The calcium carbonate CaCO3 content (%) was measured by volumetric calcimetry: in this
method, the CO32- is converted in CO2 by adding hydrochloric acid to the soil solution, and the
volume of the CO2 released is measured to determine the initial CaCO3 content.
The organic matter (%), organic carbon (%) and nitrogen (%) were measured by the Walkley-
Black method where the oxidizable matter is oxidized by a potassium dichromate solution. The
remaining dichromate is then titrated with ferrous sulphate, and the amount of C in the initial
soil solution is deducted. The organic matter and the Nitrogen content were determined from
the organic content.
The phosphorus content P (mg/kg) that was measured by near infrared reflectance spectroscopy.
Physical analyses included:
The texture, that was measured by the Bouyoucos method where the density of the soil solution
is measured by a hydrometer after two hours of sedimentation, and the particles size is
determined from this density. It is expressed in percentages of sand, silt and clay;
The bulk density where the dry weight of the bulk density samples was divided by the volume
extracted.
All the analysis were performed by the soil laboratory of the INDRHI (Instituto Nacional de Recursos
Hidráulicos) in Santo Domingo.
Statistical analysis
All the statistical analysis were realized using R (R core team 2021).
3.5.1 Data exploration by descriptive analysis
3.5.1.1 PCA on macrofauna densities
In order to test the hypotheses 1 and 3, a PCA was performed on the macrofauna densities.
Principal Component Analysis was used to resume the database into synthetic variables and compare
the samples points according to these synthetic variables, using the packages ade4 (Thioulouse et al.
2018), adegraphics (Siberchicot et al. 2017), FactoMineR (Le et al. 2008) and Factoshiny (Vaissie et al.
2021). These first analysis aimed at revealing if the sampling points were correlated according to the
macrofauna variables, and if these variables were correlated together.
Once the correlations between samples according to the minimum best explicative principal
components was revealed, it was attempted to explain these correlation by the variables age of the
plantation and type of soil cover, using clustering and between-class analysis (BCA) with the package
ade4 (Thioulouse et al. 2018). With this same package, a Monte-Carlo test based on 999 replicates was
used to test the significance of the differences between clusters.

16
3.5.1.2 PCA on soil parameters
In order to test the hypotheses 1 and 3, the same analysis as presented in the paragraph 3.5.1.1 were
performed with the database of soil chemical and physical parameters.
3.5.1.3 Complementary descriptive analysis
The hypotheses 1 and 3 question the responses of the soil quality and its macrofauna to two independent
variables. As it is known that soil organisms and soil quality influence each other, it is interesting to
explore the correlations between them in the frame of this study, in order to get a better understanding
of the results. For this purpose, a co-inertia analysis was performed between the PCA on macrofauna
densities and the PCA on soil parameters, to reveal covariations between both datasets. A Monte-Carlo
test based on 999 replicates on the sum of eigenvalues of this co-inertia analysis was performed to test
the significance of the covariation. The package ade4 was used for both analysis. A correlation test based
on Pearson coefficient was performed to reveal correlations between the variables of each dataset.
3.5.2 Explicative analysis
3.5.2.1 Univariate analysis
The hypothesis 2 was tested in two stages.
The first stage aimed at testing the evolution of the agricultural practices, in terms of plants density and
diversity, during the different phases of the production cycle of the cacao plantation. This was part of
the hypothesis 2. For this purpose, two one-way ANOVAs were performed to compare the means of
Simpson index and density of the vegetation between the 4 age classes. Linear models were established
with, as response variables (i) the density of plants, and (ii) the Simpson index of plants, and as
explanatory variable the age of the plantation. The assumption of normality and homoscedasticity were
graphically verified. The model was tested by calculating the F-test and its p-value with the function
aov of the package stats (R core team 2021). The significance of the differences between the means of
the levels of the independent variable was tested with the Tukey test, with the function TukeyHSD of
the package stats.
The second stage aimed at testing the influence of the heterogeneity of plant composition and
distribution on the soil macrofauna abundancy and diversity. For this purpose, four two-by-two
Pearson’s correlation tests were performed between (i) the total density of macrofauna and the density
of vegetation (ii) the total density of macrofauna and the diversity (Simpson index) of vegetation (iii)
the diversity of macrofauna and the density of vegetation (iv) the diversity of macrofauna and the
diversity of vegetation.
3.5.2.2 Multivariate analysis
In order to test the hypotheses 1, 3 and 4, several models were created and compared to test the effect
of the age class and the cacao pods on the soil parameters and on the macrofauna density and diversity,

17
using the packages lmerTest (Kuznetsova et al 2017) and emmeans (Russel 2021). The assumption of
normality of the residuals was verified graphically, and with the Shapiro-Wilk test. When the residuals
did not follow a normal distribution, the response variable was transformed by the function logarithm.
When the normal distribution could not be reached, we realized generalized linear models (GLMs).
GLMs allow the residuals of the response variable to follow a different distribution than the normal
distribution (Poisson, binomial, binomial negative, Gamma). The law to which the residuals best fitted
was searched visually and with the Chi-squared test. The homoscedasticity was checked visually.
For each response variable, the 6 models presented in table 4 were compared.
Model
1
Model
2
Model
3
Model
4
Model
5
Model
6
Fixed
parameters
Type of soil cover x x x
Age class x x x
Interaction of the
type of soil cover
and the age class
x
Random
parameter Plot x x x x x
Models were compared with the Akaike Information Criterion (AIC). Its expression is AIC = -2 * log(L)
+ 2*k. L is the likelihood of the model and measures its goodness of fit to the data. K is the number of
parameters in the model (Burnham et al. 2011). For each response variable, a complete model with the
fixed effects of the age class, the type of soil cover, their interaction and the random effect of the plot
(Model 1) was created. For this model, the distribution law best fitting to the residuals was searched.
Then, all nested models, including the null model, were established (Models 2 to 6). The AIC of the
models were calculated and compared together to select the best fitting model. For this model, the
marginal means of the predictive factors were calculated. The significance of the difference between the
marginal means was determined by calculation of the standard error. If the standard errors of the
marginal means of two modalities did not intercept, they were considered as significantly different. The
packages that were used allow for analysis on unbalanced dataset. However, when the full model with
interaction was the best fitting model, the analysis was performed again with a different dataset from
which all the plots of the age class [0-3] were excluded. It improved the understanding and interpretation
of the results.
Table 4 - Predictive variables included in the different models
Table 34 - Predictive variables included in the different models
Table 35 - Predictive variables included in the different models
Table 36 - Predictive variables included in the different models
Table 37 - Predictive variables included in the different models
Table 38 - Predictive variables included in the different models
Table 39 - Predictive variables included in the different models
Table 40 - Predictive variables included in the different models
Table 41 - Predictive variables included in the different models
Table 42 - Predictive variables included in the different models
Table 43 - Predictive variables included in the different models
Table 44 - Predictive variables included in the different models
Table 45 - Predictive variables included in the different models

18
4 Results
12 413 individuals of 608 morphotypes and 27 taxa were identified. The most abundant taxa were
Hymenoptera (43.2%), Isoptera (22.7%) and earthworms (11.8%). The most diverse taxa were
Coleoptera (123 morphotypes), Araneae (114 morphotypes), Hemiptera (53 morphotypes) and
Hymenoptera (44 morphotypes). A table summarizing all the data collected is presented in appendix 2
Data exploration by descriptive analysis
The mean abundances and diversity of soil macrofauna in the four age classes and two types of soil
cover are presented in appendix 6.
4.1.1 Exploration of the macrofauna dataset
4.1.1.1 Taxonomic approach
Plot level
In this first PCA, the statistical units were the plots and the variables used to create the hyperspace were
the taxa (Fig.3).
a
a
a
a
a
a
a
a
b
b
b
b
b
b
b
b
c
c
c
c
c
d
d
d
d
d
Figure 3 - PCA of the taxa abundances(per plots). (a) Graph of the plots according to the axes 1 and 2 (b)
Correlation circle according to the axes 1 and 2 (c) Graph of the plots according to the axes 2 and 3 (d)
Correlation circle according to the axes 2 and 3

19
The first three axes of the PCA accounted for 65.02 % of the variance. The first axis (eigenvalue =
30.59%) represented a positive gradient of Others, Coleoptera and Dermaptera abundances. The second
axis (eigenvalue = 18.91%) represented a positive gradient of earthworms, Hymenoptera and
Scolopendrida abundances. The third axis (eigenvalue = 15.53%) represented a positive gradient for
Isopoda and Hymenoptera abundances.
Plots were separated into 5 clusters along the first two axis.
PC 1 was negatively correlated with the cluster 1 and positively correlated to the cluster 4 (Fig. 4). PC
2 was positively correlated with cluster 2 and 3, and negatively correlated to the cluster 5. The cluster 5
grouped plots that all belonged to different age classes, but they were geographically very close to each
other. The cluster 2 grouped plots 7 and 10 from the same age and slope classes, and geographically
close to each other. The cluster 1, 3 and 4 grouped plots from different age classes and not geographically
close to each other.
The between-class analysis showed that the groups of plots according to their age class were not
significantly different from each other in the hyperspace created by the taxa densities (p-value= 0.094)
(Fig. 5).
Sampling unit level
The statistical units of the second PCA are the sampling units (Fig.6).
Figure 4 - Plot clustering according to the first two axes of the
PCA
Figure 5 - Plots grouped by age class according to the
first two axes of the PCA.

20
The first three axis of the PCA accounted for 53.83 % of the variance. The first axis (eigenvalue =
26.32%) represented a positive gradient for Dermaptera, Others, Coleoptera and Hemiptera
abundances. The second axis (eigenvalue = 14.91%) represented a positive gradient for Scolopendrida
and Isopoda. The third axis (eigenvalue = 12.61%) represented a positive gradient for Hymenoptera
abundance.
Sampling units were separated into 3 cluster along the first two axis (Fig.7). The cluster 2 was slightly
positively correlated with the second axis and the cluster 3 was positively correlated with the first axis.
All the sampling units in the cluster 3 have a soil cover of cocoa pods.
a
a
a
a
a
a
a
a
a
a
a
b
b
b
b
b
b
b
b
b
b
b
c
c
c
c
c
c
d
d
d
d
d
d
d
a
a
a
a
a
Figure 6-PCA of the taxa abundances (per sampling unit). (a) Graph of sampling units according to the axes 1
and 2 (b) Correlation circle according to the axes 1 and 2 (c) Graph of sampling units according to the axes 2
and 3 (d) Correlation circle according to the axes 2 and 3
c
c
c
c
c
c
c
d
d
d
d
d
d
d
21
The between-class analysis showed no difference between the groups of sampling units according to
their age class (p-value = 0.121) It showed a highly significant difference between the groups of
sampling units according to their type of soil cover (p-value = 0.001) (Fig.8).
4.1.1.2 Functional approach
The results of our classification by functional groups are presented in table 5.
b
b
b
b
b
b
b
Figure 7 - Sampling units clustering according to the first
two axes of the PCA
Figure 8 – Sampling units grouped by age class (a) and by type of soil cover (b) according to the first two axes of
the PCA.

22
Predators Phytophagous Detritivores Engineers
Relative abundance (%) 15.1 7.8 2.7 74.4
Min (ind.m-2) 0 0 0 0
Max (ind.m-2) 1584 1296 736 9232
Mean (ind.m-2) 265.3 135.2 43.1 1338.5
Standard error (ind.m-2) 22.4 19.4 7.5 166.6
A PCA was performed on the functional groups. The first three axes of the PCA accounted for 88,6 %
of the variance (Fig.9). The first axis (eigenvalue = 47.95%) represented a positive gradient for
Phytophagous and Predator abundance. The second axis (eigenvalue = 23.67%) represented a positive
gradient for Ecosystem Engineers abundance. The third axis (16.98%) represented a negative gradient
for Detritivore abundance.
a b
c d
Figure 9 - PCA of the functional groups abundances. (a) Graph of sampling points according to the axes 1 and
2 (b) Correlation circle according to the axes 1 and 2 (c) Graph of sampling points according to the axes 2 and
3 (d) Correlation circle according to the axes 2 and 3
Table 5 – Sampled macrofauna data by functional groups
Table 65 - Predictive variables included in the different models
Table 66 - Predictive variables included in the different models
Table 67 - Predictive variables included in the different models
Table 68 - Predictive variables included in the different models
Table 69 - Predictive variables included in the different models
Table 70 - Predictive variables included in the different models
Table 71 - Predictive variables included in the different models
Table 72 - Predictive variables included in the different models
Table 73 - Predictive variables included in the different models
Table 74 - Predictive variables included in the different models
Table 75 - Predictive variables included in the different models
Table 76 - Predictive variables included in the different models
Table 77 - Predictive variables included in the different models
Table 78 - Predictive variables included in the different models
Table 79 - Predictive variables included in the different models

23
Sampling points were separated into 3 cluster along the two first axis (Fig.10). The cluster 2 was
positively correlated with the second axis and the cluster 3 was positively correlated with the first axis.
All the sampling points grouped in the cluster 3 had a soil cover of cocoa pods.
The between-class analysis showed no significant difference between the age classes (p-value = 0.071).
However, it revealed a highly significant difference between the type of soil cover (p-value = 0.001)
(Fig.11)..
Figure 10 - Sampling units clustering according to the first two
axes of the PCA

24
1.1.1 Exploration of the soil dataset
A PCA was performed on the soil parameters dataset (Fig.12). The 38 individuals of the PCA (statistical
units) were the soil composite samples. The first three axis accounted for 65.3% of the variance. The
first axis (eigenvalue = 31.43%) represented a positive gradient for OC, OM and N contents. The second
axis (eigenvalue = 20.1%) represented a positive gradient of conductivity opposed to clay content. The
third axis (eigenvalue = 13.76%) represented a positive gradient of CaCO3 and P content.
Composite samples were separated into three cluster along the first two axis (Fig. 15). The cluster 1 was
negatively correlated to the first axis. It had high values of sand, bulk density and pH and low values of
silt, clay, OC, OM and N. It. The cluster 2 had low values of CE, Sand, Ca2+ and Na+ and high values
of clay and silt. The cluster 3 was positively correlated with the first axis. The three composite samples
of this cluster all have a soil cover of cocoa pods.
a b
Figure 11 – Sampling units grouped by age class (a) and by type of soil cover (b) according to the first two
axes of the PCA
25
a
a
a
a
a
a
a
a
a
a
a
a
a
a
a
Figure 12 - PCA of the soil chemical and physical parameters (a) Graph of the composite samples according to the
axes 1 and 2 (b) Correlation circle according to the axes 1 and 2 (c) Graph of the composite samples according to
the axes 2 and 3 (d) Correlation circle according to the axes 2 and 3
Figure 13 - Composite samples clustering according to the first
two axes of the PCA
b
b
b
b
b
b
b
b
b
b
b
b
b
b
b
c
c
c
c
c
c
c
c
c
c
c
d
d
d
d
d
d
d
d
d
d
d

26
The between-class analysis did not show significant differences neither between the age classes (p-value
= 0.166) nor between the type of soil cover (p-value = 0.126). However, it revealed a very significant
difference between the degree of slope (p-value = 0.006) (Fig.14).
1.1.2 Interactions between the soil quality and the soil macrofauna
In this section, the interactions between the soil quality and the soil macrofauna were tested.
A PCA of the macrofauna with the composite soil samples was performed preliminary to the co-inertia
analysis. The co-inertia analysis (Fig. 15) revealed significant covariations between the macrofauna
dataset and the soil physical and chemical properties dataset. The first two axis of the co-inertia
accounted for 77.99% of the variance. The RV coefficient was 0.26 and a permutation test revealed its
significatively (p-value=0.049). It means that there was a significant correlation with the macrofauna
dataset and the soil dataset.
Figure 14 - Composite samples grouped by degree of slope (a), type of soil cover (b) and by age class (c) according to
the first two axes of the PCA.
b
b
b
b
b
b
b
b
a
a
a
a
a
a
a
a
c
c
c
c
c
c
c
c

27
The correlation analysis based on Pearson coefficient (Fig.16) revealed which variables were correlated
together. The density of Isoptera was positively correlated with the sand content (r2=0.57, p-value
<0.001) and negatively correlated with the silt and clay content (r2= -0.44 and p-value < 0.01 for both).
It was also negatively correlated with the organic carbon (OC), organic matter (OM) and Nitrogen (N)
contents (r2= -0.45 and p-value <0.01 for all).
b
b
b
b
b
b
b
b
b
b
a
a
a
a
a
a
a
a
a
a
a
a
e
e
e
e
e
e
e
e
d
d
d
d
d
d
d
d
d
d
d
d
c
c
c
c
c
c
c
c
c
Figure 15 - Co-inertia analysis between the PCA on soil chemical and physical parameters and the PCA on
macrofauna taxa abundances. (a) Projection of the soil PCA axes into the axes of the co-inertia analysis. (b)
Projection of the macrofauna PCA axes into the axes of the co-inertia analysis. (c) Contribution of the variables
to the co-inertia analysis. (d) Position of each composite sample described by the soil dataset (beginning of the
arrow) and by the macrofauna dataset (end of the arrow). (e) eigenvalues.
Figure 70 - Co-inertia analysis between the PCA on soil chemical and physical parameters and the PCA on
macrofauna taxa abundances. (a) Projection of the soil PCA axes into the axes of the co-inertia analysis. (b)
Projection of the macrofauna PCA axes into the axes of the co-inertia analysis. (c) Contribution of the variables
to the co-inertia analysis. (d) Position of each composite sample described by the soil dataset (beginning of the
arrow) and by the macrofauna dataset (end of the arrow). € eigenvalues.
Figure 71 - Co-inertia analysis between the PCA on soil chemical and physical parameters and the PCA on
macrofauna taxa abundances. (a) Projection of the soil PCA axes into the axes of the co-inertia analysis. (b)
Projection of the macrofauna PCA axes into the axes of the co-inertia analysis. (c) Contribution of the variables
to the co-inertia analysis. (d) Position of each composite sample described by the soil dataset (beginning of the
arrow) and by the macrofauna dataset (end of the arrow). € eigenvalues.

28
On the contrary, the density of Scolopendrida and Araneae were positively correlated with the organic
carbon, organic matter (r2=0.53 and r2=0.39 for both, respectively) and Nitrogen contents (r2=0.52 and
r2=0.40, respectively), with p-values < 0.05 for all correlations with Araneae and p-values <0.001 for
all correlations with Scolopendrida.
Explicative univariate analysis
4.2.1 Evolution of the plant density and diversity at plot scale during the
production cycle (hypothesis 2)
The age class [11-25] had the lowest limit (D = 0.253) and the lowest mean (D = 0.0331) of diversity
index (Fig. 17), while the age class [0-3] has the highest value (D = 0.674) and the highest mean (D =
0.597). The model of response variable “Diversity of the cultivated vegetation (Simpson index)” and
independent variable “age of the plantation” was statistically significant (F-value=9.9, p-value= 7.28e-
Figure 16 - Correlations between macrofauna densities and soil chemical and physical parameters
Figure 101 - Correlations between macrofauna densities and soil chemical and physical parameters
Figure 102 - Correlations between macrofauna densities and soil chemical and physical parameters
Figure 103 - Correlations between macrofauna densities and soil chemical and physical parameters
Figure 104 - Correlations between macrofauna densities and soil chemical and physical parameters
Figure 105 - Correlations between macrofauna densities and soil chemical and physical parameters
Figure 17 - Diversity of the cultivated vegetation
for each age class
Figure 132 - Density of the cultivated vegetation in
each age class.

29
06). The diversity was highly significantly higher in the age class [0-3] than in the age classes [11-25]
(p-value = 0.00003) and >70 (p-value = 0.0002). It was significantly higher in the age class [4-10] than
in the age class [11-25] (p-value = 0.021). The age class >70 had the lowest limit (0.103 ind.m-2)and the
lowest mean (0.130 ind.m-2) of density (Fig. 18), while the age class [0-3] had the highest limit (0.216
ind.m-2) and the highest mean (0.191 ind.m-2). The model of response variable “density of the cultivated
vegetation” and independent variable “age of the plantation” was statistically significant (F-value=5.4,
p-value= 0.00154). The density of trees at the sampling unit level was significantly higher in the age
class [0-3] than in the age class >70 (p-value = 0.008). There was no difference between the other age
classes.
4.2.2 Influence of the plant density and diversity on the soil macrofauna
(hypothesis 2)
No effect of the vegetation diversity or density was revealed, neither on the macrofauna diversity nor
on the macrofauna density (Fig.19). (i) Total density of macrofauna and density of vegetation:
coefficient of correlation = 0.10, p-value = 0.27 (ii) Total density of macrofauna and diversity (Simpson
index) of vegetation: correlation coefficient = -0.02, p-value = 0.83 (iii) Diversity of macrofauna and
density of vegetation: coefficient of correlation = -0.09, p-value = 0.29 (iv) Diversity of macrofauna and
diversity of vegetation: coefficient of correlation = -0.10, p-value = 0.27.
Figure 19 - Macrofauna density and diversity as functions of tree density and diversity

30
Explicative multivariate analysis
4.3.1 Modeling the macrofauna parameters according to the age of the
plantation and the presence of cacao pods (hypotheses 1, 3 and 4)
In this section the hypotheses 1, 3 and 4 were tested. The influence on the soil macrofauna abundancy
and diversity of the age of the plantation (hypothesis 1), the presence of cacao pods husks (hypothesis
3) and the interactions between the age of the plantation, and the presence of cacao pods husk
(hypothesis 4) were tested.
The total abundance, the abundance of each taxon and the species richness are presented in appendix 7.
The best fitted model for the total abundance was the
full model. The total abundance was significantly
higher in all age classes under cacao pods than in all
age classes except from the age class [0-3] under leaf
litter Under leaf litter, the total abundance was
significantly higher in the age class [0-3] than in the
age class >70 (Fig. 20). The best fitted model for
Dermaptera was the model with “Age class” and
“type of soil cover” as factors, but without their
interaction. The marginal mean for Dermaptera
abundance of the age class [0-3] was significantly
higher than in the age classes [4-10] and >70, and
under cacao pods (Fig.21).
The best fitted model for earthworms, Hymenoptera, Coleoptera and Hemiptera abundances was the
model with only the fixed parameter “type of soil cover”. For all, the marginal mean was significantly
a b
Figure 21 - Total abundance of Dermaptera in each age class (a) and under each type of soil cover
(b). The circles represents the marginal means, the arrow represents the standard erros and the light
green line indicates the lower and upper limits
Figure 20 - Total abundance of macrofauna
under each type of soil cover in each age class.
The circle represents the marginal mean, the arrow represents the standard errors and the
light green line indicates the lower and upper
limits

31
higher under cacao pods (Fig.22). The best fitted models for Araneae and Scolopendrida were the null
models (with the plot as random effect).
The best fitted model to predict the specific richness (S) was the model with only the fixed parameter
“type of soil cover”. The specific richness was significantly higher under cacao pods than under leaf
litter (Fig.23). The best fitted model to predict the Shannon index was the model including both the
factor “age class” and “type of soil cover”, and their interaction. The Shannon index was significantly
higher under leaf litter in the age class [11-25] (Fig.24). The best fitted model for the Simpson index
was the null model, without the random effect of the plot.
Figure 22 - Total abundance of the different taxa under each type of soil cover. The circle represents
the marginal means, the arrow represents the standard errors and the light green line indicates the
lower and upper limits
Figure 23 - Specific richness under each type
of soil cover. The circle represents the
marginal mean, the arrow represents the
standard errors and the light green line
indicates the lower and upper limits
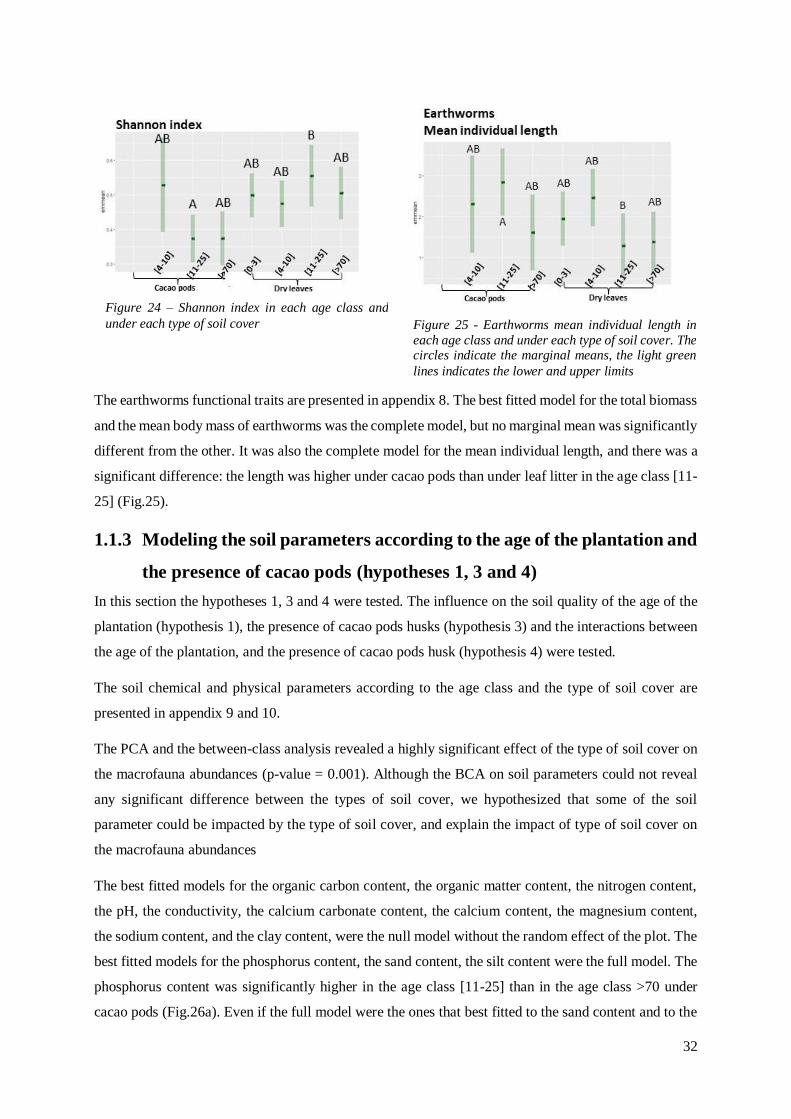
32
The earthworms functional traits are presented in appendix 8. The best fitted model for the total biomass
and the mean body mass of earthworms was the complete model, but no marginal mean was significantly
different from the other. It was also the complete model for the mean individual length, and there was a
significant difference: the length was higher under cacao pods than under leaf litter in the age class [11-
25] (Fig.25).
1.1.3 Modeling the soil parameters according to the age of the plantation and
the presence of cacao pods (hypotheses 1, 3 and 4)
In this section the hypotheses 1, 3 and 4 were tested. The influence on the soil quality of the age of the
plantation (hypothesis 1), the presence of cacao pods husks (hypothesis 3) and the interactions between
the age of the plantation, and the presence of cacao pods husk (hypothesis 4) were tested.
The soil chemical and physical parameters according to the age class and the type of soil cover are
presented in appendix 9 and 10.
The PCA and the between-class analysis revealed a highly significant effect of the type of soil cover on
the macrofauna abundances (p-value = 0.001). Although the BCA on soil parameters could not reveal
any significant difference between the types of soil cover, we hypothesized that some of the soil
parameter could be impacted by the type of soil cover, and explain the impact of type of soil cover on
the macrofauna abundances
The best fitted models for the organic carbon content, the organic matter content, the nitrogen content,
the pH, the conductivity, the calcium carbonate content, the calcium content, the magnesium content,
the sodium content, and the clay content, were the null model without the random effect of the plot. The
best fitted models for the phosphorus content, the sand content, the silt content were the full model. The
phosphorus content was significantly higher in the age class [11-25] than in the age class >70 under
cacao pods (Fig.26a). Even if the full model were the ones that best fitted to the sand content and to the
Figure 25 - Earthworms mean individual length in
each age class and under each type of soil cover. The circles indicate the marginal means, the light green
lines indicates the lower and upper limits
Figure 24 – Shannon index in each age class and
under each type of soil cover

33
silt content data, they did not reveal any significant effect (Fig26c and d). For the bulk density, it was
hard to choose between the model with only the plot as random effect, and the model with the type of
soil cover as fixed effect and the plot as random effect. In the second one, the bulk density was
significantly lower under cacao pods (Fig 26b).
5 Discussion
Supporting and questioning the hypotheses
The average density of total macrofauna at the sampling points (1655.1 ind.m-2) was half lower (3368
ind.m-2) than under diverse cacao-based AFS in the Colombian Amazon (Suárez et al. 2021). However
it was similar to the total density of macrofauna found in soils characterized by high bases (1620 ind.m-
2) and high carbon levels (1626 ind.m-2) in cacao-based AFS in the Talamanca region of Costa Rica
(Rousseau et al. 2012). The average Shannon index ( H= 2.13) was lower than in all types of soils
sampled in this same study, but the average Simpson index (D = 0.77) was higher. The overall species
richness (27 taxa) was higher in our study than in the study of Suárez et al. (2021) who found 12 taxa,
including the pasture and forest plots.
Figure 26 - Phosphorus content (a), sand content (c) and silt content (d) in each age class and under
each type of soil cover. Bulk density (b) under each type of soil cover. The circles represent the
marginal mean, the arrows represent the standard errors and the light green line indicates the lower
and upper limits
a b
c d
d
d
d

34
5.1.1 The temporal heterogeneity did not influence the soil quality
(hypothesis 1).
This study could not reveal any effect of the age class on most of the soil parameters. In a different
environment (Kenya) and in different AFS, Kamau et al. (2017) revealed significant effects of the age
of the plantation on soil nutrient levels. Thus, we could expect that different age classes could have led
to different results (Appendix 11).
5.1.2 The temporal heterogeneity influenced only one taxon abundance
(hypothesis 1)
No diversity index of the macrofauna was influenced by the age of the plantation alone. Dermaptera
was the unique taxon whose density was affected by the age class. It was higher in the age class
corresponding to the initial stage compared to two other age classes. It is in accordance with the study
of Pauli et al. (2011) which could not reveal any difference in soil macrofauna density and diversity in
2 years old AFS compared with 10 years old AFS in Honduras. However, it does not concord with
Kamau et al. (2017) who found that soil macrofauna total abundance was influenced by the age of the
plantation, in maize-based agroforestry systems in Kenya.
The age classes corresponded to the mean age of the cacao trees population, but in almost each parcel
there was some heterogeneity due to conservation of some old trees and to replanting, especially after
hurricanes episodes (Siegel and Alwang 2004), This increased the variance of the mean age of the cacao
trees population.
The analysis revealed few effect of the age on the macrofauna, but a rearrangement of age classes could
lead to different results. The limits of the age classes were very close to each other and one plot could
have more age difference with a plot of the same age class than with a plot of another age class. It would
be interesting to repeat the experiment with age classes of narrow range and more spaced from each
other (Appendix 11). Different results could be obtained through assessing more thoroughly the
diversity. We calculated the Shannon and Simpson indices, which are indices of the alpha-diversity. The
alpha-diversity is the local diversity, measured independently from any reference outside the community
(here, the sampling unit). We did not calculate the gamma and beta-diversity. The gamma diversity is a
measure of the overall diversity of a large region including different ecosystems (here, the soil
macrofauna of the Dominican Republic). The beta diversity is the difference between gamma and alpha
diversity, it compares the diversity of the local ecosystem to the diversity of the larger ecosystem that
include it (Marcon 2014). It would allow to estimate the level of diversity of each sampling unit,
compared to a regional reference.
Furthermore, the comparison of marginal means for the abundance of Isoptera according to the age of
the plantation and the type of soil cover (corresponding to the model with the lowest AIC) provided

35
obviously erroneous results. This may be due to the high occurrence of 0, but no certain explanation
could be found at the date.
5.1.3 The plant composition and distribution at plot scale evolved during the
production cycle of the cacao plantation (hypothesis 2)
A significant effect of the age class on the density and diversity of the vegetation was revealed. It is in
accordance with Notaro (2019) who found that there were less associated plants in older plantations.
The inventory of the plot was realized by the intern, with the help of the producers, the Cacao Forest
Project’s technician, and the local sampling team. It was not realized by a professional botanist, and the
trees were identified by their local common names. Although producers and local inhabitant have a good
knowledge of the trees grown in the cacao-based AFS, they often use different common names to refer
to the same species. To limit this, the scientific name of each identified tree was searched on the
following databases: Abbott and Leakey (2006), Orwa et el. (2009), Kern (2014), and Food plants
international (2021). The same species named by several common names were grouped together. Local
people may also use the same common name for actually different species, so it is important to bear in
mind that different species could have be named the same, underestimating the diversity.
The criteria to include a plant in the census has weaknesses because it was chosen before seeing all the
plantations. A strict compliance to this criterion would have led to the exclusion of the majority of the
plants in the age class [0-3] years old. Indeed, the cacao trees and associated crops were seldom above
the height limit of 1m and it was reduced to 40cm in this age class. Even if most of the plots in the three
other age class had almost no plant under 1 m, it would have been more coherent to include all plants
above 40cm in all plots.
Several agricultural practices evolve during the production cycle of the cacao plantation, and the
modification of composition and disposition of cultivated plants is only one among them. Moreover, the
pruning practices evolve during the production cycle of the cacao plantation, influencing the architecture
of the canopies. This evolution might influence the soil quality and the soil macrofauna, but could not
be addressed in this study.
5.1.4 The plants heterogeneity did not influence the soil macrofauna
(hypothesis 2)
Our study could not reveal any effect of the intra-plot vegetation density and diversity on the density
and diversity of soil macrofauna. This is not in accordance with Brussaard (1998) who suggest that a
higher density of trees induces a denser rhizosphere, producing more food for the detritivore soil
macrofauna organisms. Similarly, Tsufac et al. (2020) who found that the tree diversity in cacao-based
AFS positively influenced the soil fertility, and explained it by the fact that diverse tree species attract
diverse soil fauna. Similarly, Suárez et al. (2021) showed that the diversity and density of soil

36
macrofauna was influenced by the diversity of trees in cacao-based AFS, and Pauli et al. (2010)
suggested that a higher diversity of trees induced a higher activity of earthworms. However, these studies
compared different agroforestry systems, while we tested the intra-plot heterogeneity, at the sampling
unit level. It may reveal that the macrofauna density and diversity are impacted by the inter plot
heterogeneity but not by the intra-plot heterogeneity. Still, other studies revealed direct relations
between the specific richness of the vegetation and the specific richness of soil organisms (Decaëns
2010). Bisseleua et al. (2009) found that ant species richness was positively related to tree species
richness and densities, in cacao-based AFS in Cameroon. Among cacao-based AFS, animal diversity is
generally higher in the more diversified systems (Schroth and Harvey 2007)
Nevertheless, different experimentations could have highlighted some effects of the vegetation on the
macrofauna. The permanence of the plants was not taken into account, while they may have different
short-term and long-term effects on the macrofauna. Effects may be revealed taking into account only
the individuals above an age limit. It would require information about the planting date of each
individual, which may be difficult in plots that are not dedicated to experimentations. Beyond the cost
advantage, conducting experiments in farmer’s parcels offers real conditions and enables to test factors
that are not always rapidly reproductible (i.e. the age class of plantation above 70 years old), but it is
not as controllable as an experimental plot.
The influence of the vegetation density and diversity at the sampling point level was only tested with
correlation tests, which could not reveal any effect. It would have been more appropriate to include these
variables into linear models together with the other variables, in order to test if they improved the
models. However, generalized linear models only allows for fixed factors that are categorial variables.
The influence of plants heterogeneity on the soil quality was not tested, because the experimental plan
did not allow for it. Indeed, the soil data were collected for composite samples made of different
sampling points (see paragraph 3.1.5.4) while the plant density and diversity data were collected at each
sampling point (see paragraph 3.1.5.2). In order to test the correlations between both dataset, it would
have been necessary to use the means of plant density and diversity of the sampling points used to realize
the composite soil samples. Such distortion of the data would have generated inaccuracy in the results.
5.1.5 The decomposition of cacao pod husks influenced the soil physical
properties (hypothesis 3)
The bulk density was the unique soil parameter influenced by the heaps of decomposing cacao pod
husks. It was lower under cacao pod husks than under leaf litter. We may hypothesize that this was due
to the significantly higher densities of ants and earthworms, and the larger length of earthworms, under
cacao pods. Indeed, it has been proven that earthworms are “important actors in the regeneration of
compacted soils” (Capowiez et al. 2012) and that ants decrease the bulk density of agricultural soils (De
Bruyn and Conacher 1990, Cerdà and Jurgensen 2008). Also, longer earthworms may have a greater

37
influence on the soil structure due to a higher burrowing capacity. The soil sampling method used to
determine the bulk density has some weaknesses: the small cylinders method induces risk of
compression by hammering on the edges of the cylinder, and it is time consuming, as one must realize
the sample again when a big element (stone, root) interferes. Plus, the small volume sampled implies
high relative errors (Baize 2018).
The absence of influence of cacao pod husks on the soil chemical parameters in this study is surprising,
knowing that cacao pods are mainly made of organic carbon (Brito-Vega et al. 2018), thus may increase
the organic carbon content of the soil. High variances of organic carbon, organic matter and nitrogen
contents in the soil were observed, that may be explained by the kinetic of nutrient leaching from the
cacao pods. Indeed, all cacao pods heaps were selected at the same decomposition level, but their age
varied between three weeks and two months. Hougni et al (2021) found that cacao pods lose most of
their dry weight after 30 days of decomposition, followed by a phase of slower weight loss and lower
decomposition rates. Assuming that the organic carbon of decomposed cacao pods is included in the soil
after a duration d, it would imply that the carbon content is higher in soils under cacao pods less than 30
days + d old, compared to soil under more decomposed cacao pods. These variances could also be
explained by the recurrence of cacao pods heaps at the same place. It can vary between 2 weeks (interval
between two harvests during the main producing period) and several years, according to the choices of
the producers. A complementary study could test the effects of the frequency of cacao pods application
on the soil and the soil macrofauna. It would require a control of these applications over several years.
The high variances observed could also be due to other factors that were not measured, like local
temperature and humidity.
Moreover, some impacts of the cacao pods on the soil parameters could have been revealed with more
exhaustive soil analysis. More specifically, the potassium content could not be measured because the
measuring equipment of the INDRHI laboratory was damaged when we delivered the samples. This
missing data could have contributed to reveal a link between the cacao pods cover and the soil chemical
parameters, as cacao pods have a high potassium content (Sodré et al. 2012, Lu et al. 2018, Tsai et al.
2018), that can reach 86.45 % of the mineral elements (Ofori and Awudza 2017). In a cacao agroforestry
system in Costa Rica, the K harvest in pods was 28.4 kg/ha-1.yr-1, which was higher than Ca (5.3kg/ ha-
1.yr-1) and Mg (4.3kg/ ha-1.yr-1) (Fassbender et al. 1988). It was estimated that for 1000 kg of dry cacao
beans, 34,5 kg of potassium,11.5 kg of N and 1.8 kg of P were removed from the agroecosystem through
the pods, in a cacao-based AFS in Costa Rica (Hartemink 2005).
5.1.6 The decomposition of cacao pod husks influenced the soil macrofauna
density and diversity (hypothesis 3)
The specific richness (S) was higher under cacao pods. The other diversity indices (Simpson and
Shannon indices) were not impacted by the cacao pods alone.

38
The total abundance was generally larger under cacao pods than under leaf litter. The abundance of the
taxa earthworms, Hymenoptera, Hemiptera, Dermaptera and Coleoptera were higher under cacao pods.
Regarding the earthworms taxon, it is coherent with a recent study (Prastowo 2020) that compared
earthworms abundances under cacao pods, cacao leaves and another type of amendment at different
quantity levels and found out that the earthworms abundance was higher under the highest quantity of
cacao pods, compared to the other treatments. The earthworms length was higher under the cacao pods.
Our results regarding the ants abundance (the order Hymenoptera being almost only represented by the
family Formicidae in our study) are also coherent with the study of Fowler (1993) who showed that ants
use decomposing cacao pods for nesting and foraging. Later, Castaño-Meneses et al. (2015), revealed
a high richness of species in decomposing fallen cacao pods: up to 10 different ant species and 37
different other taxa inhabited them. The most abundant ant species reported in the fallen cacao pods
were Wasmania auropunctata and Solenopsis spp. Even if the study referred above focused on
decomposing fallen cacao pods and not on empty cacao pods heaps as harvest wastes, it is interesting to
note that the two ant species mentioned were also the most abundant in our study.
Similar findings occurred in different agroecosystems, under different types of pruning or crops
residues. Lavelle et al. (2001) stated that returning crop residues to the soil maintain high level of soil
invertebrates activity. De Aquino et al. (2008) showed that no-till agroecosystems where the residues of
the previous crop are left on place have the more diverse soil macrofauna communities, compared to
conventional tillage systems. García-Tejero and Taboada (2016) found that litter-trapping microhabitats,
including piles of pruning residues, increased the density and diversity of soil detritivores and predators
communities.
We chose to gather the macrofauna from the litter, the 0-10 cm layer and the 10-20 cm layer together,
because we wanted to test the effect of the variables on the soil system as a whole. Our research question
did not imply to separate the litter and the different horizons from each other. Further, the soil analysis
by horizon would not have been affordable, and the same approach needed to be adopted for the soil
physical and chemical parameters and for the macrofauna. However, the macrofauna was sampled and
identified by horizon, so it would be possible to perform new analyses in order to answer different
research questions. For the sake of coherence with this approach of the soil as an undivided system, the
volume and the biomass of the litter were not measured. It could have been done to relativize the
macrofauna density, as there might be a positive correlation between the volume and biomass of the
litter and the density of the macrofauna. Chemical analysis of the leaf litter and of the cacao pod husks
would have brought insight about the impact of cacao pods on the soil macrofauna independently from
the soil belowground. These impacts could have been tested by modeling the macrofauna from the litter
layer (leaves and cacao pod husks) as function of the litter layer chemical parameters and of the litter
layer biomass.

39
5.1.7 The interactions between the temporal heterogeneity and the
decomposition of cacao pod husks influenced the soil quality and the
soil macrofauna (hypothesis 4).
Regarding the results on the soil macrofauna, the Shannon diversity index was higher under leaf litter
in the age class corresponding to the stabilized stage. The species richness being higher under cacao
pods in all age classes, may suggest that the species evenness was higher under leaf litter in the stabilized
stage. It would be coherent with the highly significantly higher densities of some taxa (Coleoptera and
Dermaptera) under cacao pods, and with the nesting of ants inside decomposing cacao pods (Fowler
1993). If one species nests in the cacao pods, it will reduce the evenness. However, it is not in accordance
with Castaño-Meneses et al. (2015) who revealed a high richness of species in decomposing fallen cacao
pods. It would be necessary to calculate the Pielou evenness index, in order to confirm this assumption.
Still, it is not easily interpretable why the species evenness was higher under leaf litter only in one age
class.
The interaction of both factors had a significant effect on the total abundance of soil macrofauna. The
abundance of macrofauna in all age classes under cacao pods was larger than the abundance of all age
classes except from the age class [0-3] under leaf litter. It must be remembered that no data could be
collected in the age class [0-3] under cacao pods. The study should be done again with a previous
preparation of the plots from this age class by application of cacao pods at known frequencies.
Regarding the results on the soil parameters, the phosphorus content was higher in the age class
corresponding to the stabilized stage compared to the age class corresponding to the senescent stage,
only under cacao pods. The average P content of our study site is substantially lower than the P content
of cacao agroforestry soils in Brazil (that have not received P fertilization for 10 years) (Zaia et al. 2012).
Aleixo et al. (2019) found that the phosphorus content in the soils of cacao-based AFS in Brazil was
impacted by the tree species and density. As there is no significant difference of density between the
age classes [11-25] and >70, it could be assumed that cacao pods release phosphorus, but that the species
in the age class [11-25] do not absorb much phosphorus. We would need to characterize the species
found in each age class and realize a literature review on the phosphorus requirements of each species.
This result could also be due to sampling errors.
5.1.8 The soil quality and the soil macrofauna influenced each other.
The co-inertia analysis and the correlation test revealed significant correlations between the soil
parameters and the macrofauna. The texture cannot (or very slightly) be modified by the macrofauna.
Hence, it might be assumed that a correlation between the density of a taxon and a soil texture parameter
reveals a strict cause-effect impact of the soil on the macrofauna. For example, it might be assumed that
the soil sand content affected positively the density of Isoptera. The test also revealed a negative

40
correlation between the soil OM, OC and N contents and the density of Isoptera. It might be assumed
that sandy soil are less rich in OM, OC and N, as these elements are stabilized by silt and clay particles
(Six et al. 2002). These soils may be less favorable to soil macrofauna taxa which have high requirements
of OM, OC and N, and favor more adaptable taxa, such as the Isoptera. Isoptera form the basis of the
food web, they convert nitrogen-poor material into nitrogen-rich bodies, on which other taxa of the soil
macrofauna feed, such as spiders and ants (Takuya and Masahiko 2001)
However, there were interactions between the OM, OC and N content of the soil and the macrofauna,
and the correlation, therefore, cannot be strictly interpreted as a cause-effect relationship.
The positive correlation between the predators Scolopendrida and Araneae abundances and the OM,
OC and N contents may have different explanations. It may be another factor that covary with both
elements, without direct relation between them. For example, a thicker litter would increase the OM,
OC and N content of the soil and it would also provide more habitats for Araneae and Scolopendrida. It
is unlikely that these taxa would increase the OM, OC and N content of the soil, as they do not feed on
litter.
Explaining the correlations between the soil quality and its macrofauna is particularly delicate, because
strong interactions between both have already been proven (Rousseau et al. 2013) and it is known that
the macrofauna also impacts the soil (Jouquet et al. 2006). Besides, the soil parameters were measured
for the 0-20cm soil layer, while the macrofauna was recorded for the whole soil system (litter + 0-20cm
soil layer). The litter influences the soil macrofauna directly as shelter and food source, and indirectly
through the modifications it causes on the soil quality. This study could not consider these effect
separately. For this purpose, it would have been necessary to perform the tests only with the macrofauna
from the soil layers 0-10cm and 10-20cm, but it would not even have ensure to separate the direct and
indirect effects of the litter, as some organisms live, feed or move in the litter and in the soil below-
ground.
The functional traits of earthworms (length and body mass) were only analyzed as response factors of
the type of soil cover and the age class. It would be interesting to make multivariate descriptive analysis
of the bulk density (as a response factor) depending on the length of earthworms and other fixed and
random factors. Indeed, it is well known that earthworms affects the soil porosity through their
burrowing activities (Brown et al. 2004). Furthermore, it would have been interesting to measure other
functional traits on earthworms, such as their diameter and musculature, to link them with soil
parameters, but we could not access the necessary equipment.
Limits of the experimental protocol
The attempt at constituting a control set of plots failed. Only one forest plot could be sampled out of the
six planned in the time and space limits of this study. Moreover, the delimitation and inventory of a

41
forest plot required much more time and plant knowledge than a cacao-based AFS plot. This forest
control set is missing to the study, as well as a second control set of plots in conucos, the other land use
that generally precedes the plantation of cacao trees. According to the owners, the land use before cacao
plantations was generally a conuco, which is a parcel of annual crops for family consumption. However,
no certain information could be obtained for the oldest plantations (over seventy years old). Those
control plots would have represented the age class <0 in the chronosequence. The five TSBF sample
points realized in the forest plot were excluded from the statistical analysis because the number of
samples was not sufficient. We could still use the macrofauna and soil data to establish a qualitative
comparison, but it would not be statistically valid. Moreover, the analysis adapted to unbalanced
experimental designs accept more probably the null hypothesis when the factor actually has an effect,
because it does not take the risk of attributing variance to one factor when it could be attributed to the
other factor. Plus, the initial experimental protocol planned on the sampling of 48 plots equally
distributed in two areas, to have a sample of sufficient size and to test the effect of the area. Indeed, an
effect of the area on the density and on the diversity of the macrofauna can be expected as it depends on
topography (Liu and Li 2008), microclimate, (Rozen et al. 2013) and distance to the sea (Zheng et al.
2020). Plus, 48 plots would have resulted in 240 sampling points, a number that would have allowed to
30 repetitions of each treatment (in the case of a balanced experimental plan) Unfortunately, the
sampling in the second area could not be done due to time constraints.
The macrofauna sampling method that was adopted has weaknesses : The TSBF extraction method is
“time-consuming, laborious and prone to researchers bias” (Gongalsky 2021). The time and labor
required have been reduced by our adaptation, but there is inevitably a bias due to the sampling team,
when comparing with other studies’ results. However, efforts have been made to keep the same sampling
team with the same motivation level the whole time, and to keep every one’s role in the sampling
process. For example, the same two persons have been extracting the monolith together, as different
persons would have taken more or less time. Only two persons have been replaced because they lost
motivation and meticulousness. There is finally low heterogeneity due to the sampling team inside the
study, and it is included in the error of the statistical models. Moreover, hand-sorting is well adapted for
earthworms, but it may lead to omit not easily visible species from the smaller macrofauna. Other
sampling methods leading to different results can be used for macrofauna sampling, like
thermoextractors (Gongalsky 2021). The TSBF hand-sorting method may still be more exact than other
methods as pitfall traps that were discarded for their low precision: in a study in Indonesian tropical
agroforests, 50% more species were found with the TSBF hand sorting method than with the pitfall
method on the same sampling point (Prayogo et al. 2019).
The results of the soil chemical and physical analysis may not be totally reliable. Indeed, the INDRHI
is not specialized in soil analysis and is not part of the Global Soil Laboratory Network (GLOSOLAN).
GLOSOLAN is an international partnership that fosters harmonization of methods, units, data and
42
information. It trains its member to quality control, standard operating procedures, use and maintenance
of equipment. We could have obtained more reliable results from one of the soil laboratory which are
part of this partnership in the Dominican Republic: the private Laboratorio Agroempresarial
Dominicano and the Laboratorio De Suelos, LABOAGRO of the Universidad Autómona De Santo
Domingo.
Limits of the identification process
All the morphotypes were identified at the order level, and it was decided to rather take the risk of
separating the same species into two different morphotype, than to take the risk of grouping together
two different species in the same morphotype. This issue was quite strong due to sexual dimorphism,
cast polymorphism, and heterometaboles orders. Sexual dimorphism occurs for Coleoptera (body size
and shape), Arachnida (males are usually smaller and brighter than females, with differences in buccal
pieces), more than half the known Myriapoda (body size), and to a lesser extent Diptera (wings and
eyes size) (Mori et al. 2017). Ants and termites populations have different casts: ants can be queen,
worker or male and termites can be reproductive or sterile, and among sterile, soldier, presoldier or
workers. Each cast have a different morphology. Furthermore, the few male ants could not be identified
by the specialists, so they were classed alone in one morphotype. The heterometaboles, such as
Dermaptera, Isoptera and Orthoptera, do not perform total metamorphosis and their nymph resemble
the adult. It was sometimes difficult to find out if a morphotype was the nymph of another one, or if it
was a different species. Also, larvae and adults of the same species may have been separated into two
different morphotypes. This would lead to overestimation with the taxonomical approach, but this
separation is necessary for an adequate functional approach. Indeed, the different ontogenetic levels of
the same species may have different functions. “On the one hand, adults and larvae of the same species
are taxonomically undivided since they form a continuous life cycle. On the other, they do play different
roles in a soil ecosystem at different life stages. For example, predatory larvae of cantharid beetles
become phytophagous as adult” (Gongalsky 2021). In the present work, the species richness and
diversity indices may be overestimated. Identification to the species level would be necessary. Two
entomologists already identified the ant morphotypes at species level, and one identified the Diplopoda
at order level. However, he could only communicate his identification after all the statistical analysis
were done, so the Diplopoda were still considered as one big taxon in this study. It induced
underestimation of the species richness and of the diversity index, because this taxa actually included 6
different orders. However it did not modify the classification according to both taxonomic and functional
approach. Indeed, the taxa Diplopoda only represented 0.8% of the total abundance (earthworms
excluded), so it was not included in the PCA, and it made sense to group them in the other analysis.
Plus, all Diplopoda belong to the detritivores. Collaborations with specialists for further identification
still need to be done. There are several obstacles to such completion of the study: the number of soil
taxonomists for all groups is decreasing worldwide due to the development of molecular disciplines

43
(Eisenhauer et al. 2017, cited in Gongalsky 2021) and there is a clear lack of entomologists in the
Dominican Republic, Rosina Taveras Macarrulla estimates that they are less than 10 in the whole
country. Plus, we may have sampled species that are not taxonomically identified yet. Thanks to the
contribution of specialized entomologists, we also expect to discover new species. It would be
interesting to perform further analysis to test if the factors of the study influence the proportion of native
vs exotic ant species, and so on with all orders after the species identification. Once all the morphotypes
will be identified at the species level, a more precise and sure functional classification will be possible:
“The attribution to a functional group require genus or even species level identification” (Marsden et al.
2020). The functional classification realized in this study is unperfect because one order can actually
include species with different alimentation strategies. The orders were attributed to the functional groups
to which most of its species belonged. The Hymenoptera were attributed to the group “engineer”, while
only the family Formicidae of this order actually belong to the engineers group. The Dermaptera were
attributed to the group “phytophagous” when most of them are omnivorous, and some are predators
(Ren et al. 2019). The Thysanoptera were also attributed to the group “phytophagous”, to which most
belong, but some are palynivore, mycophagous and few are even predators (INRAE 2021). Lastly,
Psocoptera were excluded from the functional classification, as they are totally omnivore and
represented only 0.2% of the total abundance of macrofauna in the study.
We will participate to the international project GlobalSoilMacrofauna through sharing the data obtained
on the soil macrofauna. Among several goals, this project aims at creating a “large-scale synthesis of
the effects of human activity on soil macrofauna and to explore the links to ecosystem services delivery,
especially primary productivity” (Mathieu et al. 2021).
Beside the possible overestimation of the macrofauna diversity and underestimation of the plot plants
diversity, the indices that were calculated have their own limits. The Shannon and Simpson indices were
selected because they estimate both the richness and the evenness of the species. They are the most
commonly calculated and enable to compare the results with other studies. The Shannon index has a
smaller relative root-mean-square error, and the Simpson index is less biased than the Camargo evenness
index. However, the Shannon index is sensitive to changes in species abundance pattern, and has a bias
for small sample size of less than 1000 individuals (Mouillot and Lepretre 1999). Simpson index is more
reliable for small samples.
Unconsidered variation factors
The delineation of the plots had to be adapted to the constraints of the small area and irregular shapes
of the parcels. It was not possible to ensure a consistent distance from the edges. Hence, border effects
and influences of the neighboring ecosystems may have influenced the results.
The slope factor was only included in the descriptive analysis, that revealed a very significant effect of
the slope on the soil physical and chemical parameters. It was not tested by explicative analysis, nor
included in the predictive models, due to time constraints. It would be necessary to include the slope as
44
a random factor in the GLMMs to predict the macrofauna density and diversity, and not as a fixed factor,
because this study did not aim at testing this factor. However it would have been necessary to have it as
a second random factor, because it may impact the response variables. Though, a random factor must
have at least 10 modalities to be statistically valid and the slope was only categorized in 3 class. We
should have measured the exact slope of each plot in order to be able to include it as a random effect of
24 modalities in the GLMMs. The slope factor may be included as a fixed parameter in the GLMMs to
predict the soil chemical and physical parameters, because it has been proven that the slope has an effect
on them: slope is positively correlated with erosion in cacao plantations, and the erosion reduces the
litter thickness and the nutrient storage capacity of the soil (Munir et al. 2019). Even if there is usually
few erosion in cacao-based AFS, it can be observed on steep slope and when the cacao is young
(Hartemink 2005). We may hypothesize that the differences in soil parameters according to the slope
revealed by the PCA were due to lower OM, OC, N and minerals content in steeper slope classes. In
this study, we can consider that the slope is taken into account as a random effect, nested into the random
effect of the plot. Some other factors that may be sources of variation could be neither controlled nor
measured, like the proximity to water sources and the eventual presence of hens on the plot, the local
temperature and the local humidity. These factors are the reason why it was necessary to include a
random effect of the plot in the predictive models.

45
6 Conclusion
This study revealed no influence of the temporal heterogeneity on the soil quality, and a limited
influence on the soil macrofauna (only one taxon density was influenced). It revealed an evolution
of the agricultural practices in terms of plant composition and disposition during the production
cycle of the cacao plantation, but no influence of this evolution on the soil macrofauna density and
diversity. This study revealed positive influences of the agricultural practice of making post-
harvest heaps of cacao husks inside the plantation, on the soil physical properties and on the soil
macrofauna density and diversity.
It would be hazardous to affirm the genericity of the results to other contexts of tropical diversified
cacao-based AFS of Central America and Africa. Even in similar contexts in equatorial, organically
grown with no tillage cacao-based AFS, it would depend on the nature of the parent material and of the
soils. However, as exposed above, many studies in different agroecosystems already revealed the
positive effect of crop residues application on the density and/or diversity of the soil macrofauna. Thus,
the part of the results of this study relative to the influence of the crop residues on the soil macrofauna,
integrated in the larger body of literature on the subject, could be generalizable to other agroecosystems.
It would be interesting to realize similar studies in these contexts and perform meta-analysis to confirm
the genericity of our results, or to reveal higher effects of the variables dependent on the context
(geography, geology, pedology, microclimate, cultivated species).
As mentioned above, a complementary study on the effects of frequency of cacao pods application
would be necessary. Then, the producers should be advised to distribute the cacao pods inside the
plantation throughout the successive harvests, at a set frequency, in order to stimulate the soil
macrofauna in the whole plantation. Besides, it would be interesting to set an experimentation to test the
effects of cacao pods in an adaptation of the Bio-Organic Fertilization (FBO) method. The FBO method
is a need-based and location-specific fertilization method for tree plantations: trenches are dug between
trees and filled-up with organic material (in this case, it would be decomposing cacao pods),
vermicompost and inoculated with earthworms in order to locally enhance the ecological functionality
of the soil (Lavelle et al. 2014). The FBO method showed a positive influence on yields but it also has
potential for soil conservation (Senapati et al. 2002) that could be tested in the context of cacao-based
AFS with decomposing cacao-pods. However, the decomposing cacao pods heaps can host the fungus
Phytophtora palmivora that is responsible for the black pod rot, causing from 20% to 30% of cacao
yield loss worldwide (Lu et al. 2018, Cedeño Moreira et al. 2020, Hougni et al. 2021). This is the unique
disease that affect the Dominican caco-based SAF (Notaro 2019). Therefore, the managed use of
decomposing cacao pods should be associated to the health monitoring of the plantations, focused on
this disease. It would include the exclusion of host species from the AFS, and management of shade, as

46
excessive shade favors the development of Phytophtora, but a high level of shade favors cacao
endophytes that are antogonists of the black pod rot (Mortimer et al. 2018).
The results of this study are not agroecologically directly applicable in the field. It is necessary to
integrate them into a transdisciplinary approach of the whole food system in which the study site and
actors belong. The results of this ecological study must be put into perspective with the social, economic,
cultural and political issues of the cacao production, before to take action.

47
7 References
Abbott, I.A., Leakey, R.R., 2006. Traditional trees of Pacific Islands: their culture, environment, and use.
Par. https://agroforestry.org/projects/traditional-tree-initiative (retrieved April 2021)
Akinnifesi, F.K., Smucker, A.J.M. and Kang, B.T., 1999. Below-ground dynamics in agroforestry systems. Annals of Arid Zone, 38(3/4), pp.239-274.
Aleixo, S., Gama-Rodrigues, A.C., Gama-Rodrigues, E.F., Schripsema, J., 2019. Organic phosphorus of soils
under cacao agroforests in the Atlantic coast of Brazil. Geoderma Regional, 17, p.e00220.
Anderson, J. M., 1988. Invertebrate-mediated transport processes in soils. Agriculture, ecosystems & environment, 24(1-3), 5-19.
Anderson, J. M., Ingram, J. S. I., 1989. Tropical soil biology and fertility. CAB international, Wallingford,
221 p. Arditi, R., Michalski, J., Hirzel, A. H., 2005. Rheagogies: modelling non-trophic effects in food webs.
Ecological Complexity, 2(3), 249-258.
Ayuke, F.O., Rao, M.R., Swift, M.J. and Opondo-Mbai, M.L., 2004. Assessment of biomass transfer from green manure to soil macrofauna in agroecosystem-Soil macrofauna biomass. Managing nutrient cycles
to sustain soil fertility in sub-Saharan Africa. Academy Science Publishers, Nairobi, pp.411-422.
Baize, D., 2018. Guide des analyses en pédologie. Editions Quae, Versailles, France. 325 p.
Barrios, E., Bayala, J., Diby, L., Donovan, J., Graudal, L., Gyau, A., Xu, J., 2014. Agroforestry: Realizing the promise of an agroecological approach. In: Agroecology for food Security And nutrition.
Proceedings of the FAO international symposium. Rome, Italy.
BETSI, 2021. Thesaurus for Soil Invetebrates Trait-based Approaches [WWW Document]. URL https://t-
sita.betsi.cnrs.fr/BETSI_vizIndex.jsp (accessed 9.21.21).
Blouin, M., Hodson, M. E., Delgado, E. A., Baker, G., Brussaard, L., Butt, K. R., Brun, J. J., 2013. A
review of earthworm impact on soil function and ecosystem services. European Journal of Soil
Science, 64(2), 161-182.
Bradham, K.D., Dayton, E.A., Basta, N.T., Schroder, J., Payton, M. and Lanno, R.P., 2006. Effect of soil
properties on lead bioavailability and toxicity to earthworms. Environmental Toxicology and Chemistry: An International Journal, 25(3), pp.769-775
Brito-Vega, H., Salaya-Domínguez, J.M., Gómez-Méndez, E., Gómez-Vázquez, A. and Antele-Gómez, J.B.,
2018. Physico-chemical properties of soil and pods (Theobroma cacao L.) in cocoa agroforestry systems. Journal of Agronomy, 17(1), pp.48-55.
Brown, K.S., 1991. Conservation of neotropical environments: insects as indicators. In: Collins, N.M.,
Thomas, J.A. (Eds.), The Conservation of Insects and their Habitats. Academic Press, London, pp.
349±404. Brown, G.G., Edwards, C.A. and Brussaard, L., 2004. How earthworms affect plant growth: burrowing into
the mechanisms. Earthworm ecology, 2, pp.13-49.
Brussaard, L., 1998. Soil fauna, guilds, functional groups and ecosystem processes. Applied soil ecology, 9(1-3), 123-135.
Bünemann, E. K., Schwenke, G. D., Van Zwieten, L., 2006. Impact of agricultural inputs on soil organisms—
a review. Soil Research, 44(4), 379-406. Burnham, K.P., Anderson, D.R. and Huyvaert, K.P., 2011. AIC model selection and multimodel inference in
behavioral ecology: some background, observations, and comparisons. Behavioral ecology and
sociobiology, 65(1), pp.23-35.
Capowiez, Y., Stéphane, S., Stéphane, C., Pierre, B., Richard, G., Hubert, B., 2012. Role of earthworms in regenerating soil structure after compaction in reduced tillage systems. Soil Biology and Biochemistry,
55, 93-103.
Castaño-Meneses, G., Mariano, C. F., Rocha, P., Melo, T., Tavares, B., Almeida, E., Delabie, J. H., 2015.
The ant community and their accompanying arthropods in cacao dry pods: an unexplored diverse habitat.
Dugesiana, 22(1), 29-35.
48
Cedeño Moreira, Á.V., Romero Meza, R.F., Auhing Arcos, J.A., Mendoza León, A.F., Abasolo Pacheco, F.,
Canchignia Martínez, H.F., 2020. Characterization of Phytophthora spp. and application of rhizobacteria with biocontrol potential in black pod disease in Theobroma cacao variety CCN-51. Scientia
Agropecuaria 11, 503–512.. doi:10.17268/sci.agropecu.2020.04.05
Cerdà, A., Jurgensen, M. F., 2008. The influence of ants on soil and water losses from an orange orchard in eastern Spain. Journal of Applied Entomology, 132(4), 306-314.
Cherubin, M.R., Chavarro-Bermeo, J.P., Silva-Olaya, A.M., 2019. Agroforestry systems improve soil
physical quality in northwestern Colombian Amazon. Agroforest Syst 93, 1741–1753.
Chu, H. F., 1949. How to know the immature insects. Wm. C. Brown Company, Dubuque, Iowa. Cocoa Life., 2021. Cocoa Supply In The Dominican Republic. Cocoa Life. URL
https://www.cocoalife.org/progress/cocoa-supply-in-the-dominican-republic (accessed 9.3.21)
Conceição, E.S., Della Lucia, T.M.C., Costa-Neto, A.O., Araujo, E.S., Koch, E.B.A. and Delabie, J.H.C., 2019. Ant Community Evolution According to Aging in Brazilian Cocoa Tree Plantations
De Aquino, A.M., da Silva, R.F., Mercante, F.M., Correia, M.E.F., de Fátima Guimarães, M. and Lavelle, P.,
2008. Invertebrate soil macrofauna under different ground cover plants in the no-till system in the Cerrado. European journal of soil biology, 44(2), pp.191-197.
De Beenhouwer, M., Aerts, R. and Honnay, O., 2013. A global meta-analysis of the biodiversity and
ecosystem service benefits of coffee and cacao agroforestry. Agriculture, ecosystems & environment,
175, pp.1-7. De Bruyn, L. L., Conacher, A. J., 1990. The role of termites and ants in soil modification-a review. Soil
research, 28(1), 55-93.
Decaëns, T., 2010. Macroecological patterns in soil communities. Global Ecology and Biogeography, 19(3), pp.287-302.
Deheuvels, O., Notaro, M., 2017 Typologie des systèmes de culture du cacaoyer sur les 4 régions
d’intervention du projet Cacao Forest (El Seibo, Hato Mayor, Duarte et San Cristobal). Cacao Forest, 9
p. Deheuvels, O., Notaro, M., Gary, C., 2020. Plant diversity and density in cocoa-based agroforestry systems:
how farmers’ income is affected in the Dominican Republic. Agroforestry Systems volume 94, pages
1071–1084. Delabie, J., Jahyny, B., Cardoso do Nascimento, I., Mariano, C., Lacau, S., Campiolo, S., Philpott, S.,
Leponce, M., 2007. Contribution of cocoa plantations to the conservation of native ants (Insecta:
Hymenoptera: Formicidae) with a special emphasis on the Atlantic Forest fauna of southern Bahia, Brazil. Biodiversity and Conservation, 16(8), 2359-2384.
DeLuca, T.H., Pingree, M.R.A., Gao, S., 2019. Chapter 16 - Assessing soil biological health in forest soils,
Developments in Soil Science, Elsevier, Volume 36, 97-426.
Devine, S., Markewitz, D., Hendrix, P. and Coleman, D., 2014. Soil aggregates and associated organic matter under conventional tillage, no-tillage, and forest succession after three decades. PloS one, 9(1), p.e84988
Diamé, L., Rey, J. Y., Vayssières, J. F., Grechi, I., Chailleux, A., Diarra, K., 2018. Ants: Major functional
elements in fruit agro-ecosystems and biological control agents. Sustainability, 10(1), 23. Diaz-Santana, P.T., Alvarez-Solis, J.D., Nahed-Toral, J., Leon-Martinez, N.S. and Mariaca-Méndez, R.,
2012. Sustainability of Home Gardens in the Community Tziscao, La Trinitaria, Chiapas, Mexico.
Research Journal of Biological Sciences, 7(2), pp.52-63. DRILObase taxo, 2021. Macrofauna. http://taxo.drilobase.org/index.php?title=Website:Databases (Retrieved
august 2021)
Edwards, C.A., Lofty, J.R., 1982. Nitrogenous fertilizers and earthworm populations in agricultural soils. Soil
Biol. Biochem. Vol. 14, pp. 515 to 521 Eisenhauer, N., Antunes, P. M., Bennett, A. E., Birkhofer, K., Bissett, A., Bowker, M. A., Powell, J. R., 2017.
Priorities for research in soil ecology. Pedobiologia, 63, 1-7.
Elizalde, L., Arbetman, M., Arnan, X., Eggleton, P., Leal, I. R., Lescano, M. N., Pirk, G. I., 2020. The ecosystem services provided by social insects: traits, management tools and knowledge gaps. Biological
Reviews, 95(5), 1418-1441.
Entomological Society of America, 2021.
https://www.entsoc.org/commonames?title=&field_scientific_name_value=&tid=HEMIPTERA&tid_1=&tid_2=&tid_3=&tid_4= (Retrieved august 2021).
Estrada, J. F. N., 2000. Agroforestería. Centro para el Desarrollo Agropecuario y Forestal.

49
FAO., ITPS., 2015 Status of the world’s soil resources (SWSR)–main report. Food and agriculture
organization of the United Nations and intergovernmental technical panel on soils, Rome, Italy, vol. 650 FAO, ITPS, GSBI, SCBD, and EC. 2020. State of knowledge of soil biodiversity - Status, challenges and
potentialities, Report 2020. Rome, FAO.
https://doi.org/10.4060/cb1928en Fassbender, H. W., Alpizar, L., Heuveldop, J., Fölster, H., Enriquez, G., 1988. Modelling agroforestry
systems of cacao (Theobroma cacao) with laurel (Cordia alliodora) and poro (Erythrina poeppigiana) in
Costa Rica III. Cycles of organic matter and nutrients. Agroforestry systems, 6(1), 49-62.
Fern, K. 2014. Useful tropical plants database. https://tropical.theferns.info/ (retrieved April 2021) Fernández, F., Sharkey, M. J., 2006. Introducción a Los Hymenoptera de la Región Neotropical. Sociedad
Colombiana de Entomología y Universidad Nacional de Colombia, Bogotá, Colombia, 894p.
Food plants international, 2021. Edible plants of the world. https://fms.cmsvr.com/fmi/webd/Food_Plants_World (retrieved April 2021)
Fowler, H., 1993. Use of Fallen Cocoa Pods by Ants (Hymenoptera: Formicidae) in Southeastern Brazil.
Journal of the Kansas Entomological Society, 66(4), 444-446. Retrieved August 27, 2021, http://www.jstor.org/stable/25085477
Fox, J., Weisberg, S., 2019. An {R} Companion to Applied Regression, Third Edition. Thousand Oaks CA:
Sage. URL: https://socialsciences.mcmaster.ca/jfox/Books/Companion/
Francis, C., Lieblein, G., Gliessman, S., Breland, T. A., Creamer, N., Harwood, R., Poincelot, R., 2003. Agroecology: The ecology of food systems. Journal of sustainable agriculture, 22(3), 99-118
Francis, C., Morse, S., Breland, T. A., Lieblein, G., 2012. Transect walks across farms and landscapes.
NACTA Journal, 56(1), 92 Gaston, K. J., 2000. Global patterns in biodiversity. Nature, 405(6783), 220-227.
Gholami, S., Sayad, E., Gebbers, R., Schirrmann, M., Joschko, M., Timmer, J., 2016. Spatial analysis of
riparian forest soil macrofauna and its relation to abiotic soil properties. Pedobiologia, 59(1-2), 27-36.
Gliessman, S.R., Engles, E. and Krieger, R., 1998. Agroecology: ecological processes in sustainable agriculture. CRC press.
Gobierno de la República Dominicana, 2020. Estadísticas agropecuarias.
https://agricultura.gob.do/category/estadisticas-agropecuarias/ (retrieved august 2021) Gongalsky, K. B., 2003. Impact of pollution caused by uranium production on soil macrofauna.
Environmental monitoring and assessment, 89(2), 197-219.
Gongalsky, K. B., 2021. Soil macrofauna: Study problems and perspectives. Soil Biology and Biochemistry, 159, 108281.
Hoeffner, K., Monard, C., Santonja, M., Cluzeau, D., 2018. Feeding behaviour of epi-anecic earthworm
species and their impacts on soil microbial communities. Soil Biology and Biochemistry, 125.
Hougni, D. G., Schut, A. G. T., Woittiez, L. S., Vanlauwe, B., Giller, K. E., 2021. How nutrient rich are decaying cocoa pod husks? The kinetics of nutrient leaching.
ICCO, 2020. https://www.icco.org/ (retrieved august 2021)
INRAE, 2021. Info-Insectes - THYSANOPTERA http://ephytia.inra.fr/fr/C/7519/Info-Insectes-THYSANOPTERA (accessed 8.28.21).
Inward, D., Beccaloni, G., Eggleton, P., 2007. Death of an order: a comprehensive molecular phylogenetic
study confirms that termites are eusocial cockroaches. Biology Letters. Vol. 3, p. 331. doi: 10.1098/rsbl.2007.0102.
Jinxia, L., Mei, H., Xiuqin, Y. I. N., Jiliang, L. I. U., 2010. Effects of the accumulation of the rare earth
elements on soil macrofauna community. Journal of Rare Earths, 28(6), 957-964.
Jones, C. G., Lawton, J. H., Shachak, M., 1994. Organisms as ecosystem engineers. In Ecosystem management (pp. 130-147). Springer, New York, NY.
Jones, B., Nachtsheim, C. J., 2009. Split-plot designs: What, why, and how. Journal of quality technology,
41(4), 340-361 Jouquet, P., Dauber, J., Lagerlöf, J., Lavelle, P., Lepage, M., 2006. Soil invertebrates as ecosystem engineers:
intended and accidental effects on soil and feedback loops. Applied soil ecology, 32(2), 153-164.
Jouquet, P., Traoré, S., Choosai, C., Hartmann, C. and Bignell, D., 2011. Influence of termites on ecosystem
functioning. Ecosystem services provided by termites. European Journal of Soil Biology, 47(4), pp.215-222.

50
Kamau, S., Barrios, E., Karanja, N. K., Ayuke, F. O., Lehmann, J., 2017. Soil macrofauna abundance under
dominant tree species increases along a soil degradation gradient. Soil Biology & Biochemistry, 112, 35e46.
Kleiber, C., Zeileis, A., 2008. Applied Econometrics with R. New York: Springer-Verlag. ISBN 978-0-387-
77316-2. URL https://CRAN.R-project.org/package=AER Kottek, M., J. Grieser, C. Beck, B. Rudolf, and F. Rubel, 2006: World Map of the Köppen-Geiger climate
classification updated.
Kuznetsova, A., Brockhoff, P.B., Christensen, R.H.B., 2017. “lmerTest Package: Tests in Linear Mixed
Effects Models.” _Journal of Statistical Software_, *82*(13), 1-26. doi: 10.18637/jss.v082.i13. https://doi.org/10.18637/jss.v082.i13.
Lal., R., 1988. Effects of macrofauna on soil properties in tropical ecosystems. Agriculture, Ecosystems &
Environment.Volume 24, Issues 1–3, 101-116. Lang, B., Russell, D. J., 2020. Effects of earthworms on bulk density: A meta‐analysis. European Journal of
Soil Science, 71(1), 80-83.
Lavelle, P., Barros, E., Blanchart, E., Brown, G., Desjardins, T., Mariani, L., Rossi, J. P., 2001. SOM management in the tropics: Why feeding the soil macrofauna?. In Managing Organic Matter in Tropical
Soils: Scope and Limitations (pp. 53-61). Springer, Dordrecht.
Lavelle, P., Velasquez, E., Chagüezá Villarreal, Y., Londoño, A., 2014. Méthode FBO : Comment procéder ?
INRA Antilles-Guyane, 2p. Le, S., Josse, J., Husson, F., 2008. FactoMineR: An R Package for Multivariate Analysis. Journal of Statistical
Software, 25(1), 1-18.10.18637/jss.v025.i01
Liu, J. L., Li, F. R., 2008. Slope direction and topographic position interact to shape spatial distribution of soil macro fauna in a temperate, secondary forest, China. Journal of Desert Research, 6, 1104-1112.
Lu, F., Rodriguez-Garcia, J., Van Damme, I., Westwood, N. J., Shaw, L., Robinson, J. S., Charalampopoulos,
D., 2018. Valorisation strategies for cocoa pod husk and its fractions. Current Opinion in Green and
Sustainable Chemistry, 14, 80-88. Mahler, R. L., Tindall, T. A., 1994. Soil sampling. Cooperative Extension Service, University of Idaho,
College of Agriculture.
Marasas, M.E., Sarandón, S.J., Cicchino, A.C., 2001. Changes in soil arthropod functional group in a wheat crop under conventional and no tillage systems in Argentina. Appl.Soil Ecol. 18, 61–68.
Marichal, R., Grimaldi, M., Feijoo, A., Oszwald, J., Praxedes, C., Cobo, D.H.R., del Pilar Hurtado, M.,
Desjardins, T., da Silva Junior, M.L., da Silva Costa, L.G., Miranda, I.S., 2014. Soil macroinvertebrate communities and ecosystem services in deforested landscapes of Amazonia. Applied Soil Ecology, 83,
pp.177-185.
Marcon, E., 2015. Mesures de la Biodiversité. Doctoral dissertation, AgroParisTech, France, 112p.
Marsden, C., Martin-Chave, A., Cortet, J., Hedde, M., Capowiez, Y., 2020. How agroforestry systems influence soil fauna and their functions-a review. Plant and Soil, 453(1), 29-44.
McGavin, G. C., Sorkin, L. N., Gorton, S., 2002. Smithsonian Handbooks Insects Spiders and Other
Terrestrial Arthropods. New York, New York. Pp, 166. Mathieu, J., Lavelle, P., Brown, G., 2021. #GlobalSoilMacroFauna | Official template to report Data of Soil
Macro Fauna abundance from TSBF Method (1.3). Zenodo. https://doi.org/10.5281/zenodo.4586044
Milius, S., 2018. It’s official: Termites are just cockroaches with a fancy social life. Science News, Vol 193, No 6.
Mori, E., Mazza, G., Lovari, S., 2017. Sexual dimorphism. Encyclopedia of Animal Cognition and Behavior
(J. Vonk, and T. Shakelford, Eds). Springer International Publishing, Switzerland, 1-7.
Mortimer, R., Saj, S. and David, C., 2018. Supporting and regulating ecosystem services in cacao agroforestry systems. Agroforestry Systems, 92(6), pp.1639-1657.
Mouillot, D., Lepretre, A., 1999. A comparison of species diversity estimators. Researches on Population
Ecology, 41(2), 203-215. Mujeeb Rahman, P., Varma, R.V., Sileshi, G.W., 2012. Abundance and diversity of soil invertebrates in
annual crops, agroforestry and forest ecosystems in the Nilgiri biosphere reserve of Western Ghats,
India. Agroforest Syst 85, 165–177.
Munir, A., Faridah, S. N., Waris, A., Sapsal, M. T., 2019. Use of The Zero Run-Off System to Minimaze of Surface Run Off on Cacao Land. In IOP Conference Series: Earth and Environmental Science (Vol. 355,
No. 1, p. 012104). IOP Publishing

51
Nanganoa, L. T., Okolle, J. N., Missi, V., Tueche, J. R., Levai, L. D., Njukeng, J. N., 2019. Impact of
Different Land-Use Systems on Soil Physicochemical Properties and Macrofauna Abundance in the Humid Tropics of Cameroon.
Nair, P.R., 1993. An introduction to agroforestry. Springer Science & Business Media.
Nare, R. W. A., Savadogo, P. W., Traore, M., Gountan, A., Nacro, H. B., Sedogo, M. P., 2017. Soil macrofauna behaviour in the presence of pesticides and organic amendments. Journal of Geoscience and
Environment Protection, 5(03), 202.
Ofori, P., Awudza, J. A., 2017. Production of potassium hydroxide (KOH) from plant biomass: the case of
cocoa pod husks and plantain peels. Thesis, University of Kunasi, Ghana. 54p. Oksanen, F.J, Blanchet, G., Friendly, M., Kindt, R., Legendre, P., McGlinn, D., Minchin, P.R, O'Hara, R.B.,
Simpson, G., Solymos, P., Stevens, H.H, Szoecs, E., Wagner, H., 2020. vegan: Community Ecology
Package. R package version 2.5-7. https://CRAN.R-project.org/package=vegan Orwa, C., Mutua, A., Kindt, R., Jamnadass, R., Simons, A., 2009. Agroforestree Database: a tree reference
and selection guide version 4.0. World Agroforestry Centre, Kenya.
http://apps.worldagroforestry.org/treedb2/ (retrieved April 2021) Pauli, N., Barrios, E., Conacher, A. J., Oberthür, T., 2011. Soil macrofauna in agricultural landscapes
dominated by the Quesungual Slash-and-Mulch Agroforestry System, western Honduras. Applied Soil
Ecology, 47(2), 119-132.
Pelosi, C., Barot, S., Capowiez, Y., Hedde, M., Vandenbulcke, F., 2014. Pesticides and earthworms. A review. Agronomy for Sustainable Development, 34(1), 199-228.
Pelosi, C., Bertrand, M., Thénard, J., Mougin, C., 2015. Earthworms in a 15 years agricultural trial. Applied
Soil Ecology, 88, 1-8. Postma-Blaauw MB, de Goede RG, Bloem J, Faber JH, Brussaard L., 2010 Soil biota community structure
and abundance under agricultural intensification and extensification. Ecology. 91(2):460-73. doi:
10.1890/09-0666.1. PMID: 20392011.
Prayogo, C., Sholehuddin, N., Putra, E. Z. H. S., Rachmawati, R., 2019. Soil macrofauna diversity and structure under different management of pine-coffee agroforestry system. Journal of Degraded and
Mining Lands Management, 6(3), 1727.
Radford, B. J., Wilson-Rummenie, A. C., Simpson, G. B., Bell, K. L., & Ferguson, M. A., 2001. Compacted soil affects soil macrofauna populations in a semi-arid environment in central Queensland. Soil Biology
and Biochemistry, 33(12-13), 1869-1872.
R Core Team, 2021. R: A language and environment for statistical computing. R Foundation for Statistical Computing, Vienna, Austria.URL https://www.R-project.org/
Ren, M., Shih, C., Xing, C., Ren, D., 2019. Dermaptera–Earwigs. Rhythms of Insect Evolution: Evidence
from the Jurassic and Cretaceous in Northern China, 149-156.
Ritchie, J., Lewis, J., Elam, G., 2013. Designing and selecting samples. In: Ritchie, J., Lewis, J., Nicholls, C. M., Ormston, R. (Eds.). Qualitative research practice: A guide for social science students and
researchers. Sage, pp 77-108.
Rousseau, G.X., Deheuvels, O., Rodriguez Arias, I., Somarriba, E., 2012. Indicating soil quality in cacao-based agroforestry systems and old-growth forests: The potential of soil macrofauna assemblage,
Ecological Indicators, Volume 23, Pages 535-543, ISSN 1470-160X.
Rousseau, L., Fonte, S.J., Téllez, O., Van der Hoek, R., Lavelle, P., 2013. Soil macrofauna as indicators of soil quality and land use impacts in smallholder agroecosystems of western Nicaragua. Ecological
indicators, 27, pp.71-82.
Rożen, A., Mysłajek, R. W., Sobczyk, Ł., 2013. Altitude versus vegetation as the factors influencing the
diversity and abundance of earthworms and other soil macrofauna in montane habitat (Silesian Beskid Mts, Western Carpatians). Pol. J. Ecol, 61(1), 145-156.
Russell, V.L., 2021. emmeans: Estimated Marginal Means, aka Least-Squares Means. R package version
1.6.3. https://CRAN.R-project.org/package=emmeans Saitoh, S., Mizuta, H., Hishi, T., Tsukamoto, J., Kaneko, N., Takeda, H., 2008. Impacts of deer overabundance
on soil macro-invertebrates in a cool temperate forest in Japan: a long-term study. 森林研究77:63~
75 200
Sanabria, C., Lavelle, P. and Fonte, S.J., 2014. Ants as indicators of soil-based ecosystem services in
agroecosystems of the Colombian Llanos. Applied Soil Ecology, 84, pp.24-30.

52
Sánchez, V., Zambrano, J. and Iglesias, C., 2019. La cadena de valor del cacao en América Latina y el Caribe.
Forero, D., 2008. The systematics of the Hemiptera. Revista colombiana de entomología. 34 (1): 1-21. Schroth, G. and Harvey, C.A., 2007. Biodiversity conservation in cocoa production landscapes: an overview.
Biodiversity and Conservation, 16(8), pp.2237-2244.
Senapati, B.K., Lavelle, P., Panigrahi, P.K., Giri, S. and Brown, G.G., 2002, June. Restoring soil fertility and enhancing productivity in Indian tea plantations with earthworms and organic fertilizers. In Program,
Abstracts and Related Documents of the International Technical Workshop on Biological Management
of Soil Ecosystems for Sustainable Agriculture, Série Documentos (Vol. 182, pp. 172-190).
Shmida, A., 1984. Whittaker's plant diversity sampling method. Israel Journal of Botany, 33(1), 41-46. Siberchicot, A., Julien-Laferrière, A., Dufour, A.B., Thioulouse, J., Dray, S., 2017. adegraphics: An S4
Lattice-Based Package for the Representation of Multivariate Data. The R Journal. 9:2. 198--212.
https://journal.r-project.org/archive/2017/RJ-2017-042/index.html Siegel, P., Alwang, J. R., 2004. Export commodity production and broad-based rural development: coffee and
cocoa in the Dominican Republic (Vol. 3306). World Bank Publications.
Six, J., Conant, R.T., Paul, E.A. and Paustian, K., 2002. Stabilization mechanisms of soil organic matter: implications for C-saturation of soils. Plant and soil, 241(2), pp.155-176
Smith, J., 2010. The history of temperate agroforestry.
Sodré, G. A., Venturini, M. T., Ribeiro, D. O., Marrocos, P. C. L., 2012. Extract from the bark of cocoa fruit
as potassium fertilizer on growth of cocoa seedlings. Revista Brasileira de Fruticultura, 34(3), 881-887 Sofo, A., Mininni, A. N., Ricciuti, P. , 2020. Soil macrofauna: A key factor for increasing soil fertility and
promoting sustainable soil use in fruit orchard agrosystems. Agronomy, 10(4), 456.
Somarriba, E., 1992. Revisiting the past: an essay on agroforestry definition. Agroforestry systems, 19(3), 233-240.
Suárez, L. R., Salazar, J. C. S., Casanoves, F., Bieng, M. A. N., 2021. Cacao agroforestry systems improve
soil fertility: Comparison of soil properties between forest, cacao agroforestry systems, and pasture in
the Colombian Amazon. Agriculture, Ecosystems & Environment, 314, 107349. Takuya, A., Masahiko, H., 2001. Isoptera, in Encyclopedia of Biodiversity (Second Edition), Editor(s): Simon
A Levin, Academic Press, p. 408-433, ISBN 9780123847201, https://doi.org/10.1016/B978-0-12-
384719-5.00200-8. Thioulouse, J., Dray, S., Dufour, A., Siberchicot, A., Jombart, T., Pavoine, S., 2018. Multivariate Analysis of
Ecological Data with ade4_. Springer. doi: 10.1007/978-1-4939-8850-1 (URL:
https://doi.org/10.1007/978-1-4939-8850-1). Triplehorn, C.A., Johnson, N.F., 2018. Borror and delong’s introduction to the study of insects, seventh
edition. The Ohio State University, Brooks/cole, Belmont, USA, 864 p.
Tsai, C. H., Tsai, W. T., Liu, S. C., & Lin, Y. Q., 2018. Thermochemical characterization of biochar from
cocoa pod husk prepared at low pyrolysis temperature. Biomass Conversion and Biorefinery, 8(2), 237-243.
Tsiafouli, M.A., Thébault, E., Sgardelis, S.P., De Ruiter, P.C., Van Der Putten, W.H., Birkhofer, K., Hemerik,
L., De Vries, F.T., Bardgett, R.D., Brady, M.V. and Bjornlund, L., 2015. Intensive agriculture reduces soil biodiversity across Europe. Global change biology, 21(2), pp.973-985.
Tubenchlak, F., Badari, C.G., de Freitas Strauch, G. and de Moraes, L.F.D., 2021. Changing the agriculture
paradigm in the Brazilian Atlantic Forest: the importance of agroforestry. In The Atlantic Forest (pp. 369-388). Springer, Cham.
Vaast, P., Somarriba, E., 2014. Trade-offs between crop intensification and ecosystem services: the role of
agroforestry in cocoa cultivation. Agroforestry systems, 88(6), 947-956.
Vaissie, P., Monge, A., Husson, F., 2021. Factoshiny: Perform Factorial Analysis from 'FactoMineR' with a Shiny Application. R package version 2.4. https://CRAN.R-project.org/package=Factoshiny
Van Groenigen, J.W., Lubbers, I.M., Vos, H.M., Brown, G.G., De Deyn, G.B. and van Groenigen, K.J., 2014.
Earthworms increase plant production: a meta-analysis. Scientific reports, 4(1), pp.1-7. Wood, G. A. R., Lass, R. A., 2008. Cocoa. John Wiley & Sons.
Young, A., 1989. Agroforestry for soil conservation. International Council for Research in Agroforestry
Zaia, F.C., Gama-Rodrigues, A.C., Gama-Rodrigues, E.F., Moço, M.S., Fontes, A.G., Machado, R.C.R.,
Baligar, V.C., 2012. Carbon, nitrogen, organic phosphorus, microbial biomass and N mineralization in soils under cacao agroforestry systems in Bahia, Brazil. Agroforestry systems, 86(2), pp.197-212.

53
Zheng, X., Tao, Y., Wang, Z., Ma, C., He, H., Yin, X., 2020. Soil macro-fauna respond to environmental
variations along a coastal-inland gradient. PeerJ 8:e9532

54
8 Appendices
Appendix 1 – Variables collected and not used in this study. N
umber
Var
iable
M
ean
Sta
ndar
d d
evia
tion
Min
M
axU
nit
Met
hod
1V
eget
atio
n den
sity
of
the
plo
t0,1
25
0,0
39
0,0
61
0,2
08
ind.m
-2In
ven
tory
2V
eget
atio
n sp
ecif
ic r
ichn
ess
of
the
plo
t10,6
4,1
520
Num
ber
of
spec
ies
Inven
tory
3V
eget
atio
n div
ersi
ty o
f th
e plo
t1,2
74
0,3
43
0,6
61,8
93
Sha
nnon
index
Inven
tory
4S
lope
Nak
ed e
ye a
ppre
ciat
ion
5P
roxi
mit
y to
a P
erse
a A
mer
icana
Boole
an y
es/n
oM
easu
ring
tap
e
6P
roxi
mit
y to
a C
itru
sB
oole
an y
es/n
oM
easu
ring
tap
e
3 c
ateg
ori
es:
flat,
sli
ght
slope
and
ste
ep s
lope
All
the
data
cou
ld n
ot
be
analy
zed
yet
. T
he
exp
erim
ent
pro
tocol
inclu
ded
tw
o
bin
ary
fact
ors
of
pro
xim
ity t
o t
he
spec
ies
Per
sea A
mer
icana a
nd t
o t
he
gen
us
Cit
rus.
It
was
hyp
oth
esiz
ed t
hat
the
spec
ies
wou
ld i
nfl
uen
ce
the
abundance
and
the
div
ersi
ty o
f th
e so
il
macr
ofa
una,
base
d
on oth
er st
udie
s th
at
revea
led
dif
fere
nt
ab
undances
of
eart
hw
orm
s, b
eetl
es,
term
ites
and c
enti
ped
es a
ccord
ing
to t
he
close
st t
ree
spec
ies,
wit
h a
n i
nte
ract
ion e
ffec
t of
the
tree
’s a
ge
(Kam
au
et
al.
2017).
The
lite
ratu
re r
evie
w p
reli
min
ary
to t
his
stu
dy en
lighte
ned
m
any
evid
ences
for
the
effe
ct o
f sp
ecif
ic t
ree
spec
ies
on t
he
soil
macr
ofa
una,
even
if
no s
tudy w
as
fou
nd a
bout
the
spec
ific
eff
ect
of
the
spec
ies
Per
sea
Am
eric
an
a
and t
he
gen
us
Cit
rus
in c
aca
o-b
ase
d a
gro
fore
stry
. T
hes
e hyp
oth
esis
wil
l be
test
ed l
ate
r in
th
e fr
am
e of
a s
cien
tifi
c publi
cati
on w
ith C
aca
o F
ore
st
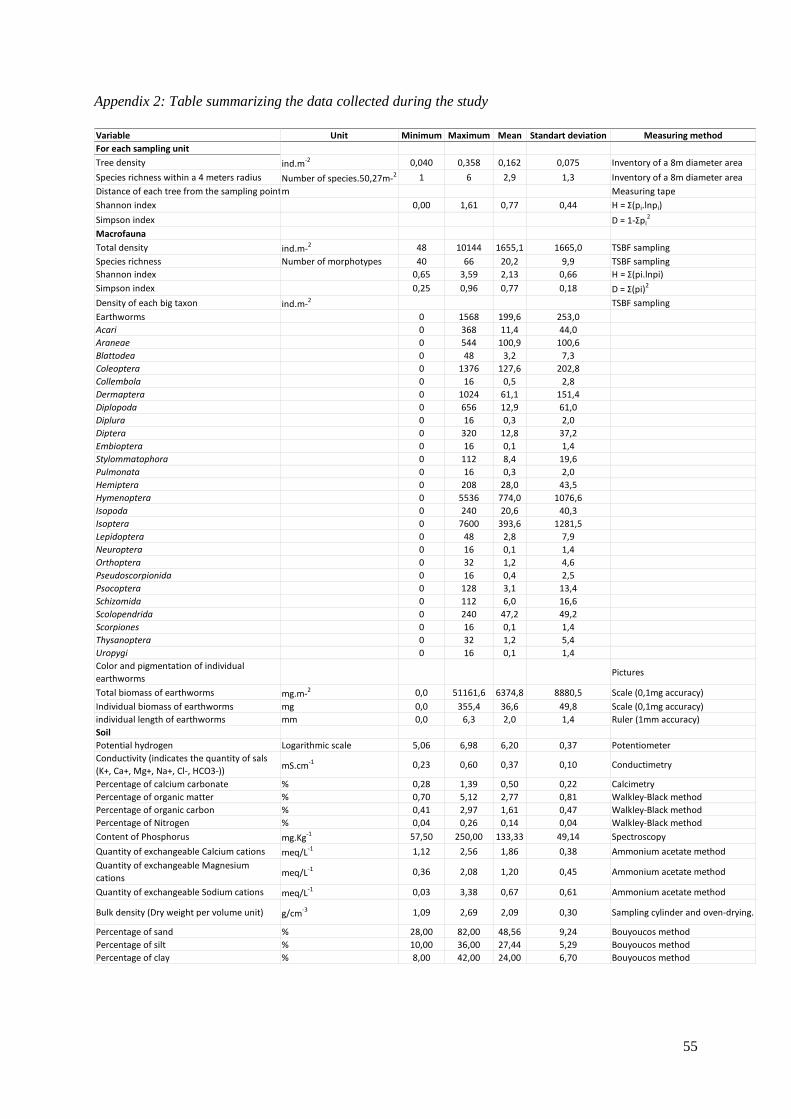
55
Appendix 2: Table summarizing the data collected during the study
Variable Unit Minimum Maximum Mean Standart deviation Measuring method
For each sampling unit
Tree density ind.m-2 0,040 0,358 0,162 0,075 Inventory of a 8m diameter area
Species richness within a 4 meters radius Number of species.50,27m-2 1 6 2,9 1,3 Inventory of a 8m diameter area
Distance of each tree from the sampling pointm Measuring tape
Shannon index 0,00 1,61 0,77 0,44 H = Σ(pi.lnpi)
Simpson index D = 1-Σpi2
Macrofauna
Total density ind.m-2 48 10144 1655,1 1665,0 TSBF sampling
Species richness Number of morphotypes 40 66 20,2 9,9 TSBF sampling
Shannon index 0,65 3,59 2,13 0,66 H = Σ(pi.lnpi)
Simpson index 0,25 0,96 0,77 0,18 D = Σ(pi)2
Density of each big taxon ind.m-2 TSBF sampling
Earthworms 0 1568 199,6 253,0
Acari 0 368 11,4 44,0
Araneae 0 544 100,9 100,6
Blattodea 0 48 3,2 7,3
Coleoptera 0 1376 127,6 202,8
Collembola 0 16 0,5 2,8
Dermaptera 0 1024 61,1 151,4
Diplopoda 0 656 12,9 61,0
Diplura 0 16 0,3 2,0
Diptera 0 320 12,8 37,2
Embioptera 0 16 0,1 1,4
Stylommatophora 0 112 8,4 19,6
Pulmonata 0 16 0,3 2,0
Hemiptera 0 208 28,0 43,5
Hymenoptera 0 5536 774,0 1076,6
Isopoda 0 240 20,6 40,3
Isoptera 0 7600 393,6 1281,5
Lepidoptera 0 48 2,8 7,9
Neuroptera 0 16 0,1 1,4
Orthoptera 0 32 1,2 4,6
Pseudoscorpionida 0 16 0,4 2,5
Psocoptera 0 128 3,1 13,4
Schizomida 0 112 6,0 16,6
Scolopendrida 0 240 47,2 49,2
Scorpiones 0 16 0,1 1,4
Thysanoptera 0 32 1,2 5,4
Uropygi 0 16 0,1 1,4
Color and pigmentation of individual
earthwormsPictures
Total biomass of earthworms mg.m-2 0,0 51161,6 6374,8 8880,5 Scale (0,1mg accuracy)
Individual biomass of earthworms mg 0,0 355,4 36,6 49,8 Scale (0,1mg accuracy)
individual length of earthworms mm 0,0 6,3 2,0 1,4 Ruler (1mm accuracy)
Soil
Potential hydrogen Logarithmic scale 5,06 6,98 6,20 0,37 Potentiometer
Conductivity (indicates the quantity of sals
(K+, Ca+, Mg+, Na+, Cl-, HCO3-))mS.cm-1 0,23 0,60 0,37 0,10 Conductimetry
Percentage of calcium carbonate % 0,28 1,39 0,50 0,22 Calcimetry
Percentage of organic matter % 0,70 5,12 2,77 0,81 Walkley-Black method
Percentage of organic carbon % 0,41 2,97 1,61 0,47 Walkley-Black method
Percentage of Nitrogen % 0,04 0,26 0,14 0,04 Walkley-Black method
Content of Phosphorus mg.Kg-1 57,50 250,00 133,33 49,14 Spectroscopy
Quantity of exchangeable Calcium cations meq/L-1 1,12 2,56 1,86 0,38 Ammonium acetate method
Quantity of exchangeable Magnesium
cationsmeq/L-1 0,36 2,08 1,20 0,45 Ammonium acetate method
Quantity of exchangeable Sodium cations meq/L-1 0,03 3,38 0,67 0,61 Ammonium acetate method
Bulk density (Dry weight per volume unit) g/cm-3 1,09 2,69 2,09 0,30 Sampling cylinder and oven-drying.
Percentage of sand % 28,00 82,00 48,56 9,24 Bouyoucos method
Percentage of silt % 10,00 36,00 27,44 5,29 Bouyoucos method
Percentage of clay % 8,00 42,00 24,00 6,70 Bouyoucos method

56
Appendix 3 – Schematization of the experimental plan.
Legend :

57
Appendix 4 – Schematization of the transect walk process
Legend:

58
Appendix 5 – Method used for delineation of the plots. (A) Establishment of perpendicularity with the
Pythagorean theorem. (B) Establishment of linearity. (C) Correction.
Legend :
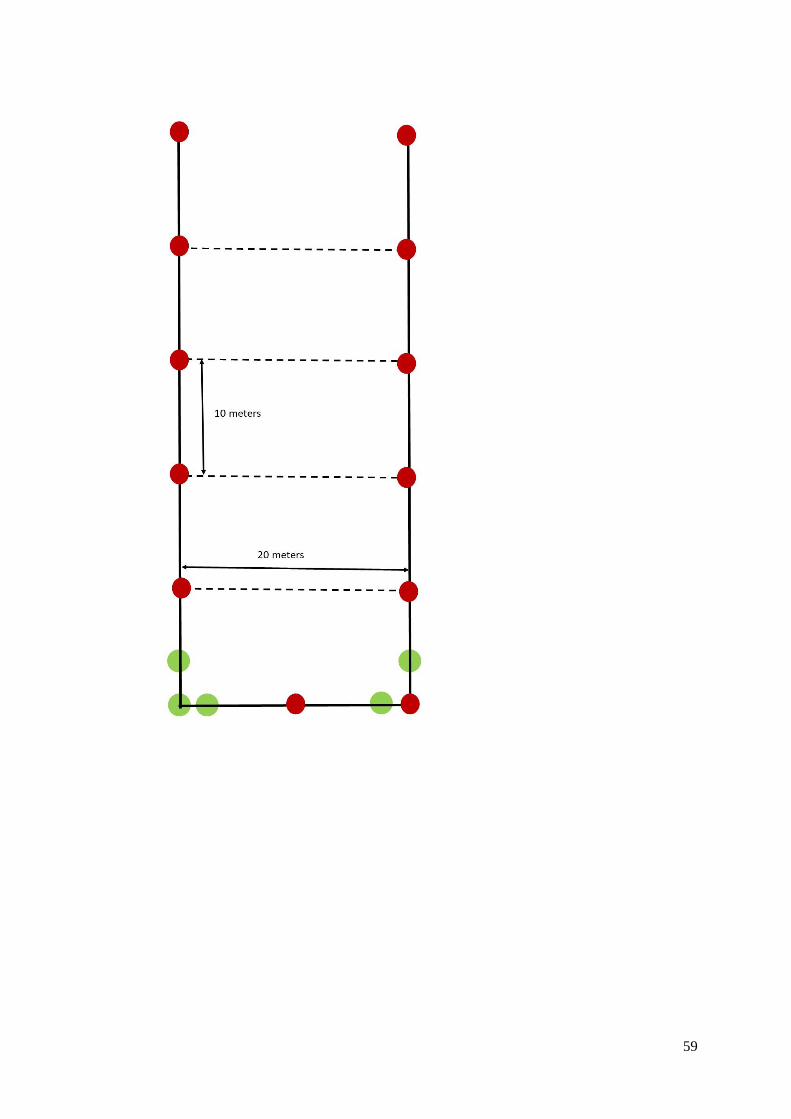
59
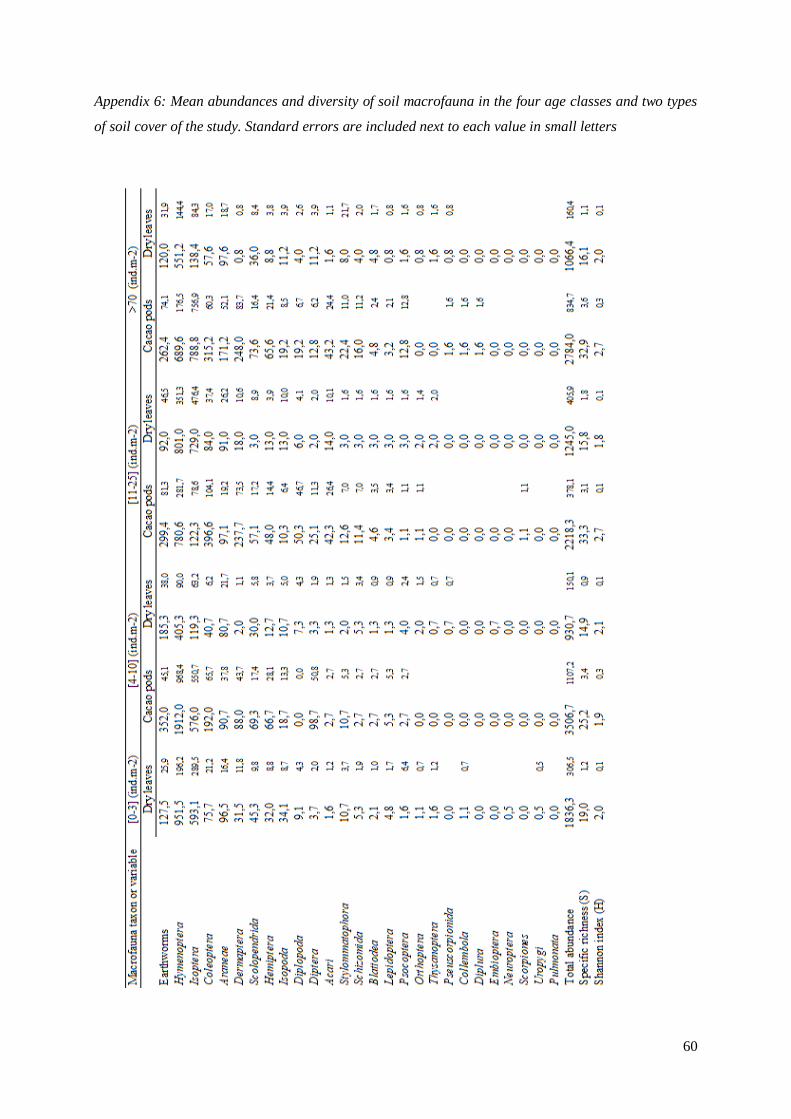
60
Appendix 6: Mean abundances and diversity of soil macrofauna in the four age classes and two types
of soil cover of the study. Standard errors are included next to each value in small letters

61
Appendix 7 – Total abundance, species richness and abundance of each taxon according to the type of
soil cover and to the age class
a
c
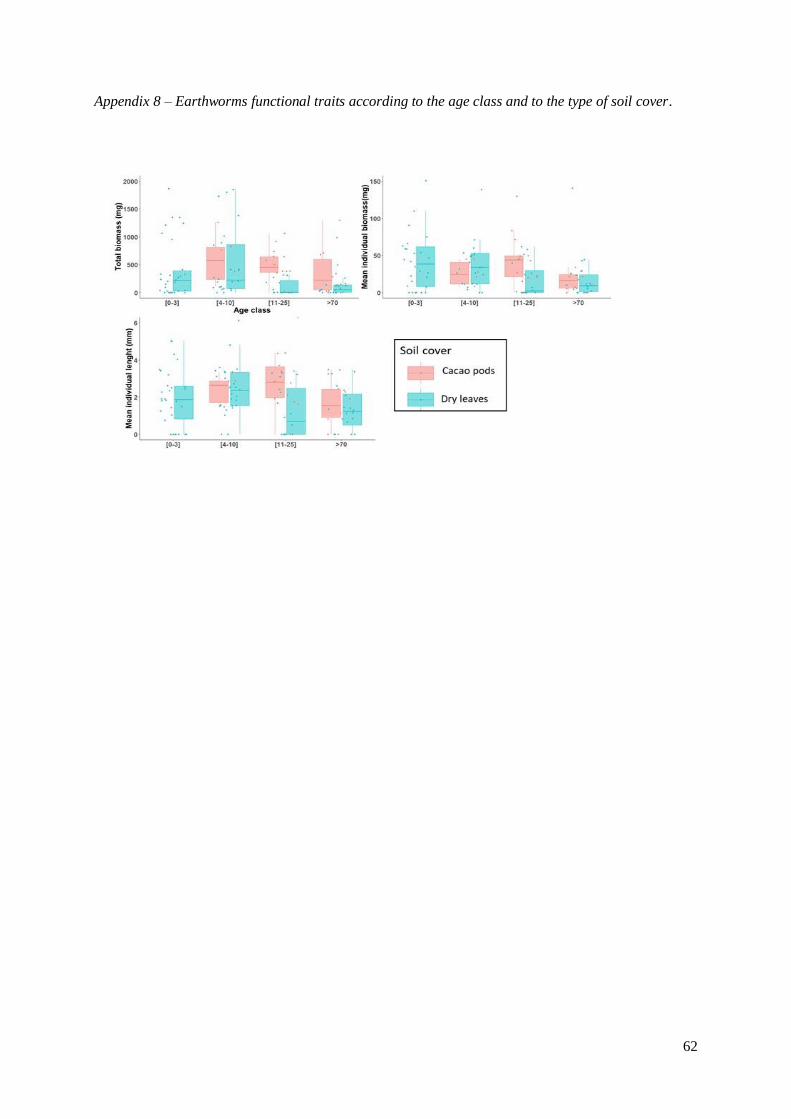
62
Appendix 8 – Earthworms functional traits according to the age class and to the type of soil cover.

63
Appendix 9: Soil chemical parameters according to the age class and to the type of soil cover

64
Appendix 10: Soil physical parameters according to the age class and to the type of soil cover
Appendix 11: Alternative age classification for the plantations
Age class Description
[0-2] Initial stage, the trees are young and unproductive
[5-7] Transition stage, the trees are growing, and some are already producing
[20-22] Stabilized stage, the fruit trees are productive
>70 Snescent stage, the production is reduced

65
9 Abstract
Diversified tropical cacao-based agroforestry systems are part of the agroecological movement aiming,
inter alia, at creating food systems that do not undermine the ecosystem services. However, the temporal
and intra-system practices heterogeneity and their effects on the soil and soil macrofauna as ecosystem
services providers still remain unclear. This study aims at exploring relationships between temporal
heterogeneity, agricultural practices that generate spatial heterogeneity at plot level, and the soil quality
and its macrofauna density and diversity. This study was led in cacao-based diversified AFS in the
Dominican Republic. 120 macrofauna samples under leaf litter or cacao pod husks were conducted in
24 plots of 4 age classes. The intra-plot density and diversity was measured and soil analysis were
realized. The macrofauna was identified at order level. Statistical analysis were performed to explain
the influences of the age of the plantation and the agricultural practices (type of soil cover, tree density
and diversity), on the soil chemical and physical parameters, and the macrofauna abundance and
diversity. A limited effect of the age of the plantation and no effect of the evolution of tree density and
diversity were revealed. Under cacao pods, the macrofauna density and specific richness were higher
and the bulk density was lower. Therefore, a managed use of decomposing cacao pods in cacao-based
tropical SAF of the Dominican Republic could enhance soil health and secure ecosystem services

66