Embed Size (px)
Citation preview
Euphytica 57: 275-283, 1991. © 1991 Kluwer Academic Publishers. Printed in the Netherlands.
Study of stomatal parameters for selection of drought resistant varieties in Triticum durum DESF
Gianfranco Venora & Fortunato Calcagno Stazione Sperimentale di Granicoltura per la Sicilia, Caltagirone, Via Rossini n. 1, 95041 Caltagirone (CT), Italy
Received 11 March 1991; accepted 24 October 1991
Key words: water stress, selection traits, stomata, Triticum durum, varietal differences, durum wheat
Summary
An analysis was made of the stomatal apparatus of the leaves of five Italian durum wheat varieties, grown under different natural rainfall regimes.
Rainfall had a significant influence on both development of the leaves and frequency and size of the stomata. Results were examined with respect to yield stability. Correlations between examined traits were calculated.
The contribution of each plant character to water stress tolerance was assessed, and suitability for selecting higher yielding genotypes in stress conditions was determined.
On examining the results it emerged that: a) due to water stress, the transpiring/photosynthesizing area ratio increased; b) cultivars which are able to mantain open stomata during water stress are more stable in terms of yield; c) the dimension of stomatal aperture on the lower surface in plants grown under water stress is a useful trait for screening drought tolerant genotypes.
Abbreviations: LA - leaf area (mm2), N - number of stomata/mm 2, SA - stomatal area (mmZ), TA - transpiring area (mm2), TA % - percentage of transpiring area
Introduction
Low rainfall reduces potential crop yield. Utiliza- tion of water stress tolerant cultivars would con- tribute to a minimization of yield losses in the Med- iterranean region, which is characterized by low rainfall in many places (Blum, 1985).
Blum (1981) observed that genotypes which are able to maintain high water potential without sto- matal closure are suitable for arid conditions. Sto- matal closure, according to Planchon (1987), is not a water storage process, but a passive phenomenon related to the loss of turgor by guard cells and it
shows the plant's incapacity to react against drought. Shimshi (1975) found that plants with open stomata gave higher yields without greater water consumption. Begg & Turner (1976) under- lined the fact that leaf transpiration is the most powerful conductor of water and nutrient absorp- tion from the soil, because it creates a lower water potential in the plant than the soil.
Another aspect to be considered is temperature. In fact, stomatal closure makes leaf temperature increase by about 5-6 ° C, due to the amplification of the difference of vapour pressure between leaf and atmosphere, followed by higher cuticlar tran-
276
spiration and consequent loss of part of the water retained by stomatal closure (Rawson et al., 1981). Moreover, Jones (1981) observed that the closure of stomata for a long time can cause the destruction of the chloroplast thylakoids.
The aim of the research was to identify cultivars with a better transpiration capacity, and use stoma- tal parameters for screening new water stress toler- ant genotypes.
Material and methods
In the cropping season 1988-89 five cultivars of durum wheat, included in the annually conducted Italian National trials (Boggini et al., 1989), were evaluated at two locations in East Sicily, viz. Mineo Lat. 37015 ' Long. 2°15 ' (province of Catania) and Gela Lat. 37000 ' Long. 1°45 ' (province of Caltanis- setta). Sowing was carried out on 5-12-88 and 6-12- 88 at Mineo and Gela respectively.
At flowering (Mineo 13-4-89 and Gela 3-4-89), flag leaves of 10 plants per cultivar were detached (Sapra et al., 1975). Leaf areas were measured with a Leaf Area Meter (Hayashi Denkoh), and the width of each leaf at the middle was recorded.
In the middle part of each flag leaf surface, prints of adaxial and abaxial surfaces were made by means of silicon resin. After drying at room tem- perature, the film of resin was peeled off and mounted on a slide by means of adhesive film (Mis- kin et al., 1970; Roselli & Venora, 1989). Of each sample, the number of rows of stomata per leaf and number of stomata on six microscopic fields be- tween the midrib and middle bundle were recorded (Ledent, 1978).
Of 60 stomata per flag leaf, (30 stomata per leaf surface, 600 per cultivar), stomatal area, perim- eter, length and width were measured by the image analyser IBAS 2000 Kontron-Zeiss connected to the microscope.
The transpiring area per leaf was computed as:
TA= N x S A x LA
where N = number of stomata/mm 2, SA = mean
stomatal area (mm2), LA = leaf area (mm2), TA = transpiring area (mm2).
Percentage of transpiring area was calculated as:
TA% = (TA/LA)x 100
where TA = transpiring area (mm2), LA = leaf area (mm2), TA% = percentage of transpiring ar- ea.
Data were analysed by analysis of variance, and differences among cultivars and locations were evi- denced by cluster analysis (Scott & Knott, 1974).
Correlation coefficients among stomatal and leaf parameters were calculated, in order to identify useful traits for plant breeding.
Results and discussion
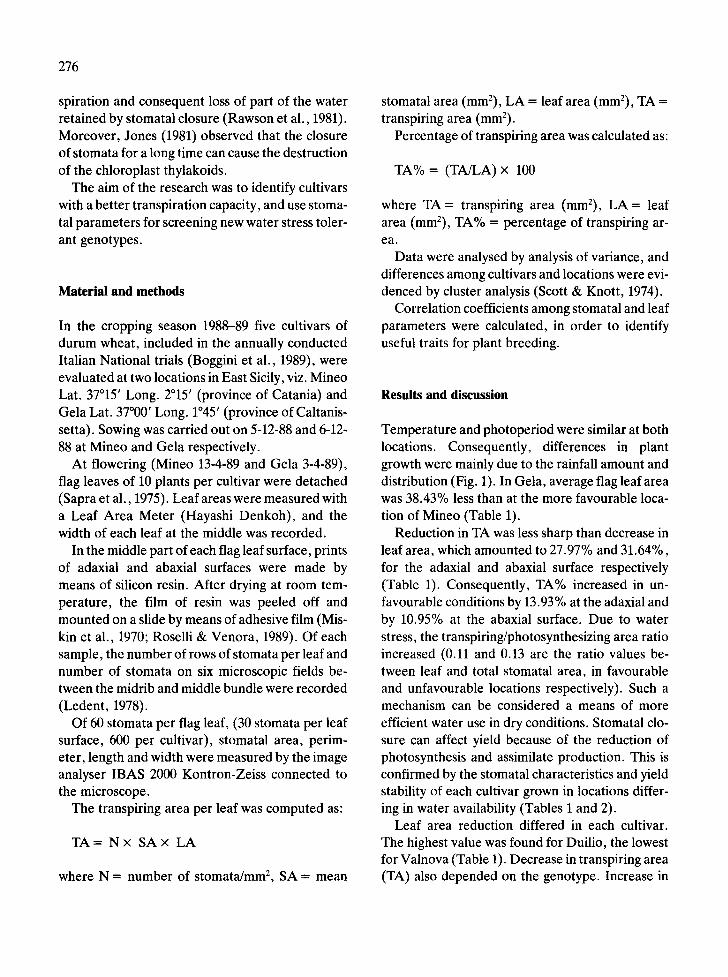
Temperature and photoperiod were similar at both locations. Consequently, differences in plant growth were mainly due to the rainfall amount and distribution (Fig. 1). In Gela, average flag leaf area was 38.43% less than at the more favourable loca- tion of Mineo (Table 1).
Reduction in TA was less sharp than decrease in leaf area, which amounted to 27.97% and 31.64%, for the adaxial and abaxial surface respectively (Table 1). Consequently, TA% increased in un- favourable conditions by 13.93% at the adaxial and by 10.95% at the abaxial surface. Due to water stress, the transpiring/photosynthesizing area ratio increased (0.11 and 0.13 are the ratio values be- tween leaf and total stomatal area, in favourable and unfavourable locations respectively). Such a mechanism can be considered a means of more efficient water use in dry conditions. Stomatal clo- sure can affect yield because of the reduction of photosynthesis and assimilate production. This is confirmed by the stomatal characteristics and yield stability of each cultivar grown in locations differ- ing in water availability (Tables 1 and 2).
Leaf area reduction differed in each cultivar. The highest value was found for Duilio, the lowest for Valnova (Table 1). Decrease in transpiring area (TA) also depended on the genotype. Increase in
Decaday ralnfall (~m)
50
40
30
20
10
0
MINEO 1988-89
NIN
o c
40
- 3 0
2 0
1 0
-0
PRE - SOW] NG
lime (months)
277
Oecaday ra~nfa 11 ( m . )
50
GELA 1988-89
MAX
MIN
o C
40
30
20
L0
0
40
30
20
10
0
Time (~onths)
PRE-SOWI NG
Fig. 1. Temperature and rainfall patterns recorded at Mineo (favourable) and Gela (unfavourable).
TA% was greatest in Duilio and Simeto, about zero in Trinakria and Vespro, and negative in Valnova.
In Table 2, yield indexes of the same 5 cultivars grown at seven different locations in Sicily (Boggini et al., 1989) have been presented. The locations were very different in rainfall and the mean yields were extremely diverse (from 0.97 to 4.09 t/ha). To evaluate the adaptability of cultivars to the differ-
ent rainfall conditions, the standard deviation over all locations was computed.
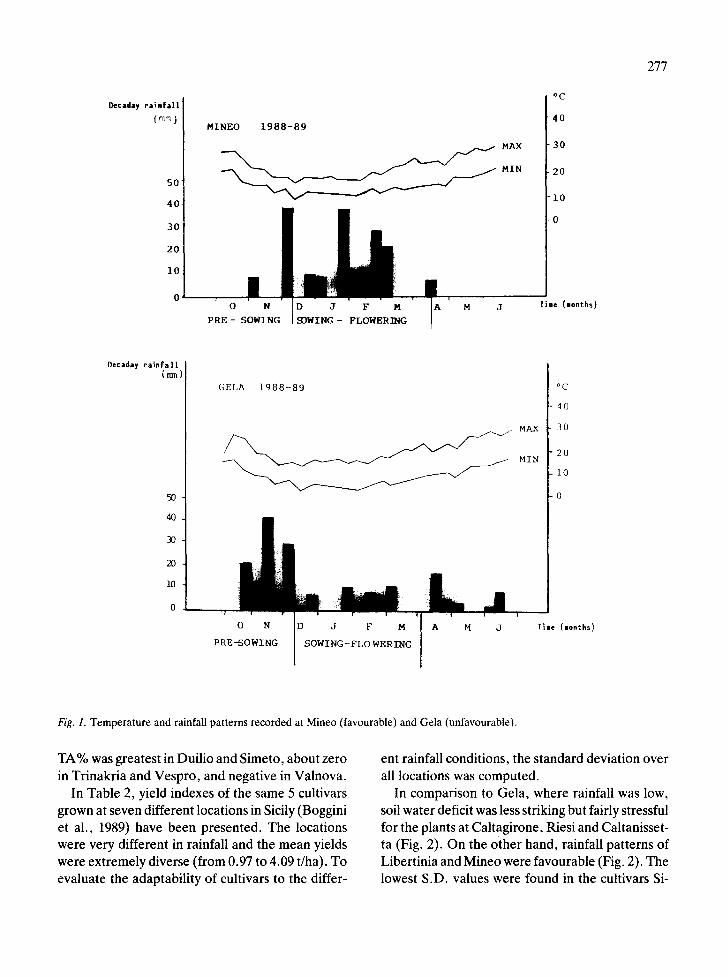
In comparison to Gela, where rainfall was low, soil water deficit was less striking but fairly stressful for the plants at Caltagirone, Riesi and Caltanisset- ta (Fig. 2). On the other hand, rainfall patterns of Libertinia and Mineo were favourable (Fig. 2). The lowest S.D. values were found in the cultivars Si-
278
Table I. Values of the flag leaf area (mm2) and the transpiring area (mm’) of flag leaf of the 5 cultivars at Mineo (favourable) and Gela (unfavourable) locations
Leaf Area Transpiring Area upper surface Transpiring Area lower surface
Mineo Gela Difference Mineo Gela Difference Mineo Gela Difference % % %
Duilio 2599.9 a 1166.8 b 55.12 164.94 a 99.46 a 39.70 123.14 a 67.09 b 45.52 Simeto 2697.8 a 1854.7 a 31.25 171.12 a 150.33 a 12.15 138.16 a 103.34 a 25.20 Trinakria 2425.5 a 1350.3 b 44.33 171.16 a 108.29 a 36.73 116.03 a 72.67 b 37.37 Valnova 2559.9 a 1846.0 a 27.89 183.66 a 147.63 a 19.62 138.41 a 106.62 a 16.97 Vespro 3244.7 a 2111.9 a 34.91 201.92 a 145.38 a 28.00 143.19 a 100.74 a 29.63
Mean 2705.6 Aa 1665.9 Bb - 38.43 178.56 Aa 130.22 Bb - 27.07 131.79 Aa 90.09 Bb - 31.64
Transpiring Area % upper surface
Mineo Gela Difference %
Transpiring Area % lower surface
Mineo Gela Difference %
Mean difference of percentage (upper + lower/2)
Duilio 6.31 Bb 8.44 Aa 25.24 4.75 b 5.85 Aa 18.8 22.02 Simeto 6.32 Bb 8.14 Aa 22.36 5.11 a 5.60 Aa 8.75 15.55 Trinakria 7.09 Aa 7.89 Aa - 10.93 4.76 b 5.37 Aa 11.36 0.21 Valnova 7.16 Aa 7.93 Aa - 9.71 5.44 a 5.82 Aa 6.53 - 1.59 Vespro 6.18 Bb 6.85 Bb 9.78 4.34 b 4.76 Bb -8.82 0.48
Mean 6.61 Bb 7.86 Aa 13.93 4.88 b 5.48 a 10.95 12.44
Means in a column and row (mean) not sharing a common letter are significantly different at the 0.01 probability level (capital letters) and at the 0.05 probability level (small letters) according to cluster analysis of Scott-Knott (1974).
meto and Duilio, which also showed the highest stomata open during stress, so that it receives bet- yield indexes. In these two cultivars, the relative ter water and nutrient absorption from the soil. In increase in percentage of transpiring area in dry this case, such genotypes can be considered conditions was the highest (Table 1). drought resistant.
On the basis of the above discussed data, the decrease in the transpiring area can be considered a survival mechanism in dry conditions (Planchon, 1987). To optimize yield, the plant must keep its
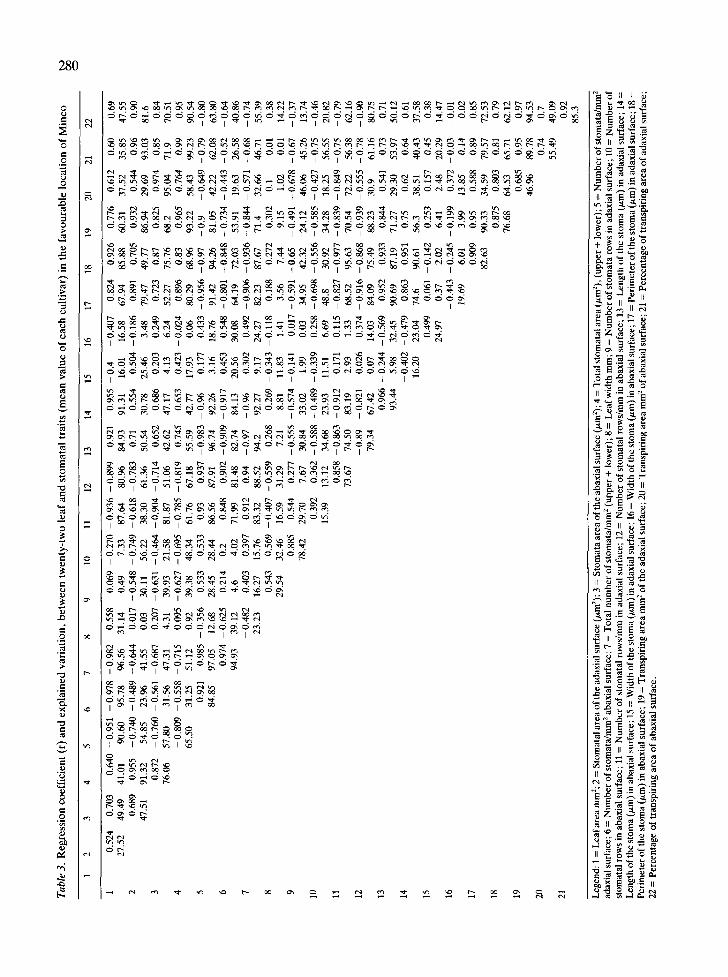
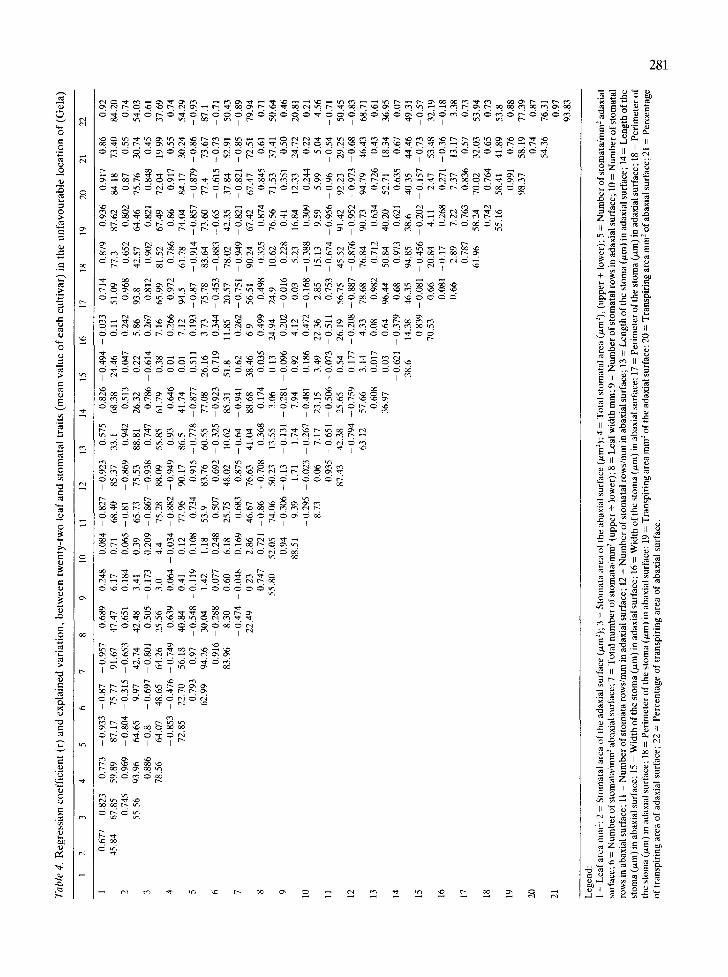
The correlation coefficients among all traits are showed in Tables 3 and 4. Transpiring area and percentage of transpiring area at both locations were positively correlated with flag leaf area and
Table 2. Yield indexes (field mean = 100) of 5 cultivars grown in 7 locations of Sicily, in 1988-89 (Boggini et al., 1989)
Cuhivar Location
Caltagirone Caltanissetta Corleone Gela Libertinia Mineo Riesi Mean SD.
Simeto 136 115 109 123 127 117 135 123 9.45 Duilio 122 93 94 108 93 117 108 105 11.08 Trinakria 95 107 109 130 107 90 95 105 12.38 Vespro 81 112 106 76 75 94 101 92 13.87 Valnova 66 73 81 62 99 82 61 75 12.60
Mean yield t/ha 1.71 2.16 1.49 0.96 4.09 3.04 1.86
279
60
50
40
30
20
10
0 .,l..- L
" O ' N ' D ' J ' F M'A'M" J '
C A L T A G I I{ONE
tara
150
140
130
120
]I0
i00
90
80
70
60
50
40
30
~0
[0
0 N D J F M A M O
C A L T A N I S S E T T A
70
r, 6 0
50 50
I 0 4 0
30 3 0
_~0 2 0
[0 10
0 0 O N 0 J F M A M ,I O N D J F M A M J
C OR L E ONE LIB E R T IN IA
ran
90
70
60
50
40
30
20
I
N D J F M A M J
RI E S I
Fig. 2. Rainfall pattern at Caltagirone, Caltanissetta, Corleone, Libertinia and Riesi in 1988-89.
stomata area, and negatively with number and den- sity of stomata rows. In agreement with others (Austin, 1982; Kutik, 1973; Maximov, 1929; Mis- kin, 1970; Salisbury, 1927; Sapra, 1975; Weaver, 1938), area, length and perimeter of stomata were
found negatively correlated with stomata frequen- cy. The increase in transpiring area in stress condi- tions cannot be obtained by selecting for high fre- quency and high density of stomata rows, because of the negative correlations between these param-
Ta
ble
3.
Re
gre
ssio
n
co
eff
icie
nt
(r)
an
d
ex
pla
ine
d
va
ria
tio
n,
be
twe
en
tw
en
ty-t
wo
le
af
an
d
sto
ma
tal
tra
its
(me
an
v
alu
e o
f e
ac
h
cu
ltiv
ar)
in
th
e f
av
ou
rab
le
loc
ati
on
of
Min
eo
1 2
3 4
5 6
7 8
9 lO
11
12
13
14
15
16
17
18
19
20
21
22
6 7 8 9 10
11
12
13
14
15
16
17
18
19
20
21
0.5
24
0
.70
3
0.6
40
-
0.9
51
-
0.9
78
-
0.9
82
0
.55
8
0.0
69
-
0.2
70
-
0.9
36
-
0.8
99
0.
921
0.95
5 -
0.4
-
0.4
07
0
.82
4
0.9
26
0
.77
6
0.6
12
0
.60
0
.69
27
.52
49
.49
41
.01
90
.60
9
5.7
8
96
.56
3
1.1
4
0.4
9
7.3
3
87
.64
8
0.9
6
84
.93
91
.31
16.0
1 16
.58
67
.94
8
5.8
8
60.3
1 3
7.5
2
35
.85
47
.55
0.6
89
0.
955
- 0
.74
0
- 0
,48
9
- 0
,64
4
0.0
17
-
0.5
48
-
0.7
49
-
0.6
18
-
0.7
83
0.
71
0.5
54
0
.50
4
- 0
.18
6
0.89
1 0
.70
5
0.9
32
0
.54
4
0.9
6
0.9
0
47.5
1 9
1.3
2
54
.85
2
3.9
6
41.5
5 0
.03
30
.11
56
.22
3
8.3
0
61
.36
5
0.5
4
30
.78
2
5.4
6
3.4
8
79
.47
4
9.7
7
86
.94
2
9.6
9
93
.03
8
1.6
0
.87
2
- 0
.76
0
- 0,
561
- 0
.68
7
0.2
07
-
0.63
1 -
0.4
64
-
0.9
04
-
0.7
14
0
.65
2
0.6
86
0
.20
3
0.2
49
0.
723
0.8
7
0.8
25
0
,97
4
0.8
5
0.8
4
76
.06
5
7.8
0
31
.56
47
.31
4.3
1
39
.93
2
1.5
8
81
.87
5
1.0
6
42
.62
4
7.1
7
4.1
3
6.2
4
52
.27
7
5.7
6
68
.2
95
.04
7
1.9
70
.51
- 0
.80
9
- 0
.55
8
- 0
.71
5
0.0
95
-
0.6
27
-
0.6
95
-
0.7
85
-
0.8
19
0
.74
5
0.6
53
0
.42
3
- 0
.02
4
0.8
96
0
,83
0
.96
5
0.7
64
0
.99
0
.95
6
5.5
0
31.2
5 5
1.1
2
0.9
2
39
.38
4
8.3
4
61
.76
6
7.1
8
55
.59
4
2.7
7
17.9
3 0
.06
8
0.2
9
68
.96
9
3.2
2
58
.43
9
9.2
3
90
.54
0.
921
0.9
85
-
0.3
56
0
.53
3
0.5
33
0
.93
0
.93
7
- 0
.98
3
- 0
.96
0
.17
7
0.4
33
-
0.9
56
-
0,9
7
- 0
.9
- 0
.64
9
- 0
.79
-
0.8
0
84
.85
9
7.0
5
12.6
8 28
.45
28
.44
8
6.5
6
87.9
1 96
.74
92.2
6 3
,16
18
.76
91
.42
9
4.2
6
81
.05
42
.22
62.0
8 6
3.8
0
0.9
74
-
0.6
25
0
.21
4
0.2
0
.84
8
0.9
02
-
0.9
09
-
0.9
17
0.
453
0.5
48
-
0.80
1 -
0.8
48
-
0.7
34
-
0.4
43
-
0.5
2
- 0
.64
94
.93
39
.12
4
.6
4.0
2
71
.99
8
1.4
8
82
.74
8
4.1
3
20
.56
3
0.0
8
64.1
9 7
2.0
3
53.9
1 19
.63
26
.58
4
0.8
6
-0.4
82
0
.40
3
0.3
97
0.
912
0.9
4
-0.9
7
-0.9
6
0.3
02
0.
492
-0.9
06
-0
,93
6
- 0
,84
4
-0,5
71
-0
,68
-0
,74
2
3.2
3
16.2
7 15
.76
83
.32
8
8.5
2
94
.2
92
.27
9
.17
2
4.2
7
82.2
3 8
7.6
7
71
.4
32
.66
46
.71
55
.39
0
.54
3
0,5
69
-0
.40
7
-0.5
59
0
,26
8
0.2
69
-0
.34
3
-0.1
18
0
.18
8
0.2
72
0
.30
2
0,1
0.01
0
.38
2
9.5
4
32
.46
16
.59
31
,29
7,
21
8.81
11
,83
1.41
3
.56
7
.44
9
.15
1,
02
0.01
14
.22
0.88
5 0
.54
4
0.2
77
-
0,5
55
-
0.5
74
-
0.14
1 0
.01
7
- 0.
591
- 0
.65
-
0.49
1 -
0.6
78
-
0.6
7
- 0
.37
7
8.4
2
29
.70
7
.67
3
0.8
4
33
.02
1.
99
0.0
3
34.9
5 4
2.3
2
24
.12
4
6.0
6
45
.26
13
.74
0.3
92
0
.36
2
- 0
.58
8
- 0
.48
9
- 0
.33
9
0.2
58
-
0.6
98
-
0.5
56
-
0.5
85
-
0,4
27
-
0.7
5
- 0
.46
15
.39
13.1
2 3
4.6
8
23
.93
11
.51
6.6
9
48
.8
30
.92
3
4.2
8
18.2
5 56
.55
20
.82
0
.85
8
- 0
.86
3
- 0
.91
2
0.17
1 0
.11
5
- 0
.82
7
- 0
.97
7
- 0
.83
9
- 0
.84
9
- 0
.75
-
0.7
9
73
.67
7
4.5
0
83
.19
2
.93
1.
33
68
,52
9
5.6
3
70
.54
7
2.2
2
56
.38
6
2.1
6
- 0
.89
-
0.82
1 0
,02
6
0.3
74
-
0.9
16
-0
.86
8
- 0
.93
9
- 0
.55
5
- 0
.78
-
0.9
0
79
.34
6
7.4
2
0.0
7
14.0
3 84
.09
75
.49
8
8.2
3
30
.9
61
.16
8
0.7
5
0.9
66
-
0.2
44
-
0.5
69
0
.95
2
0,9
33
0
.84
4
0.5
41
0
.73
0.
71
93
.44
5
.98
3
2.4
5
90
.69
8
7.1
9
71
.27
2
9.3
0
53
.97
5
0.1
2
- 0
.40
2
- 0
.47
9
0.8
63
0.
951
0.7
5
0.6
2
0.6
4
0.61
16
.20
23
.04
7
4.6
90
.61
56
.3
38.5
1 4
0.4
3
37
.58
0
.49
9
0.06
1 -
0.1
42
0
.25
3
0.1
57
0.
45
0.38
2
4.9
7
0.3
7
2.0
2
6.41
2
.48
2
0.2
9
14.4
7 -
0.4
43
-
0,2
45
-
0.1
99
0
.37
2
- 0
.03
-
0.01
19
.69
6.01
3
.99
13
.85
0.1
4
0.02
0
.90
9
0.9
5
0.5
88
0
.89
0
.85
82
.63
90
.33
3
4.5
9
79
.57
7
2.5
3
0.8
75
0
.80
3
0,81
0
.79
7
6.6
8
64
.53
65
.71
62
.12
0
.68
5
0.9
5
0.9
7
46
.96
8
9.7
8
94
.53
0
.74
0
.7
55
.49
4
9.0
9
0,9
2
85
.3
Leg
end
: 1
= L
eaf
area
ram
2; 2
= S
tom
atal
are
a o
f th
e ad
axia
l su
rfac
e (/
~m
2);
3 =
Sto
mat
a ar
ea o
f th
e ab
axia
l su
rfac
e (p
,m 2)
; 4
= T
ota
l st
om
atal
are
a 0
tm2
), (
up
per
+ l
ow
er);
5 =
Nu
mb
er
of
sto
mat
a/m
m 2
adax
ial
surf
ace;
6 =
N
um
ber
of
sto
mat
a/m
m 2
ab
axia
l su
rfac
e; 7
= T
ota
l n
um
be
r o
f st
om
ata/
mm
2 (
up
per
4-
low
er);
8 =
L
eaf
wid
th m
m;
9 =
Nu
mb
er
of
sto
mat
a ro
ws
in a
dax
ial
surf
ace;
10
=
Nu
mb
er
of
sto
mat
al r
ow
s in
ab
axia
l su
rfac
e; 1
1 =
N
um
be
r o
f st
om
atal
ro
ws/
mm
in
ad
axia
l su
rfac
e; 1
2 =
N
um
ber
of
sto
mat
al r
ow
s/m
m i
n a
bax
ial
surf
ace;
13
=
Len
gth
of
the
sto
ma
(/.t
m)
in a
dax
ial
surf
ace;
14
=
Len
gth
of
the
sto
ma
(p,m
) in
ab
axia
l su
rfac
e 15
= W
idth
of
the
sto
ma
(/tm
) in
ad
axia
l su
rfac
e; 1
6 =
Wid
th o
f th
e st
om
a (/
zm)
in a
bax
ial
surf
ace;
17
= P
erim
eter
of
the
sto
ma
(ttm
) in
ad
axia
l su
rfac
e; 1
8 =
P
erim
eter
of
the
sto
ma
(t~
m)
in a
bax
ial
surf
ace;
19
= T
ran
spir
ing
are
a m
m 2
of
the
adax
ial
surf
ace;
20
= T
ran
spir
ing
are
a m
m
of
abax
ial
surf
ace;
21
= P
erce
nta
ge
of
tran
spir
ing
are
a o
f ad
axia
l su
rfac
e;
22 =
P
erce
nta
ge
of
tran
spir
ing
are
a o
f ab
axia
l su
rfac
e.
Tab
le 4
. R
egre
ssio
n c
oeff
icie
nt (
r) a
nd
ex
pla
ined
var
iati
on
, b
etw
een
tw
enty
-tw
o l
eaf
an
d s
tom
atal
tra
its
(mea
n v
alu
e o
f ea
ch c
ult
ivar
) in
th
e u
nfa
vo
ura
ble
lo
cati
on
of
(Gel
a)
12
3
4 5
6 7
8 9
10
11
12
13
14
15
16
17
18
19
20
21
22
1 0.
677
0.82
3 0.
773
- 0
.933
- 0
.87
- 0
.957
0.
689
0.24
8 0.
084 - 0
.827
-0
.923
0.
575
0.82
6 - 0
.494
-0
.033
0.
714
0.87
9 0.
936
0.91
7 0.
86
0.92
45
.84
67.8
5 59
.89
87.1
7 75
.77
91.6
7 47
.47
6.17
0.
71
68.4
0 85
.37
33.1
68
.38
24.4
6 0.
11
51.0
9 77
.3
87.6
2 84
.18
73.4
0 84
.20
2 0.
745
0.96
9 - 0
.804
- 0
.315
- 0
.653
0.
651
0.18
4 0.
065
-0.8
1
-0.8
69
0.94
2 0.
513
0.04
7 0.
242
0.96
8 0.
652
0.80
2 0.
87
0.55
0.
74
55.5
6 93
.96
64.6
5 9.
97
42.7
4 42
.48
3.41
0.
39
65.7
3 75
.53
88.8
1 26
.32
0.22
5.
86
93.8
42
.57
64.4
6 75
.76
30.7
4 54
.03
3 0.
886
- 0
.8
- 0
.697
- 0
.801
0.
505 - 0
.173
- 0
.209
- 0
.867
-0
.938
0.
747
0.78
6 - 0
.614
0.
267
0.81
2 0.
902
0.82
1 0.
848
0.45
0.
61
78.5
6 64
.07
48.6
5 64
.26
25.5
6 3.
0 4.
4 75
.28
88.0
9 55
.85
61.7
9 0.
38
7.16
65
.99
81.5
2 67
.49
72.0
4 19
.99
37.6
9 4
-0.8
53 - 0
.476
-0
.749
0.
639
0.06
4 - 0
.034
- 0.
882
- 0
.949
0.
93
0.64
6 0.
01
0.26
6 0.
972
0.78
6 0.
86
0.91
7 0.
55
0.74
72
.85
22.7
0 56
.18
40.8
4 0.
41
0.12
77
.96
90.1
7 86
.5
41.7
4 0.
01
7.12
94
.5
61.7
8 74
.04
84.1
7 30
.24
54.2
9 5
0.79
3 0.
97
- 0
.548
- 0
.119
0.
108
0.73
4 0.
915 - 0.
778 - 0
.877
0.
511
0.19
3 - 0.
87
- 0
.914
- 0
.857
-0
.879
- 0
.86
-0.9
3 62
.99
94.2
6 30
.04
1.42
1.
18
53.9
83
.76
60.5
5 77
.08
26.1
6 3.
73
75.7
8 83
.64
73.6
0 77
.4
73.6
7 87
.1
6 0.
916 - 0
.288
0.
077
0.24
8 0.
507
0.69
2 - 0
.325
-0
.923
0.
719
0.34
4 -0
.453
- 0
.883
- 0
.65
- 0
.615
- 0.
73
- 0
.71
83.9
6 8.
30
0.60
6.
18
25.7
5 48
.02
10.6
2 85
.31
51.8
11
.85
20.5
7 78
.02
42.3
5 37
.84
52.9
1 50
.43
7 -0
.474
- 0
.048
0.
169
0.68
3 0.
875
- 0
.64
-0.9
41
0.62
0.
262
-0.7
51
- 0
.949
-0
.821
- 0
.821
-0
.85
- 0
.89
22.4
9 0.
23
2.86
46
.67
76.6
3 41
.04
88.6
8 38
.46
6.9
56.5
1 90
.24
67.4
2 67
.47
72.5
1 79
.94
8 0.
747
0.72
1 -0
.86
-0
.708
0.
368
0.17
4 0.
035
0.49
9 0.
498
0.32
5 0.
874
0.84
5 0.
61
0.71
55
.80
52.0
5 74
.06
50.2
3 13
.55
3.06
0.
13
24.9
4 24
.9
10.6
2 76
.56
71.5
3 37
.41
50.6
4 9
0.94
- 0
.306
- 0
.13
- 0
.131
- 0
.281
-0.
096
0.20
2 - 0
.016
-0
.228
0.
41
0.35
1 0.
50
0.46
88
.51
9.39
1.
71
1.74
7.
94
0.92
4.
12
0.03
5.
23
16.8
4 12
.33
24.7
2 20
.81
10
- 0
.295
- 0
.023
- 0
.267
- 0
.481
0.
186
0.47
2 - 0
.168
-0
.388
0.
309
0.24
4 0.
22
0.21
8.
73
0.06
7.
17
23.1
5 3.
49
22.3
6 2.
85
15.1
3 9.
59
5.99
5.
04
4.56
11
0.
935 - 0
.651
- 0
.506
- 0.
073
- 0
.511
-0
.753
- 0
.674
- 0
.956
- 0
.96
-0.5
4 - 0
.71
87.4
3 42
.38
25.6
5 0.
54
26.1
9 56
.75
45.5
2 91
.42
92.2
3 29
.25
50.4
5 12
- 0
.794
- 0
.759
0.
177 - 0
.208
-0
.887
- 0
.876
- 0
.952
- 0.
973
-0.6
8 - 0
.83
63.1
2 57
.66
3.14
4.
33
78.6
8 76
.84
Y0.
73
94.7
9 46
.43
68.7
1 13
0.
608
0.01
7 0.
08
0.98
2 0.
712
0.63
4 0.
726
0.43
0.
61
36.9
7 0.
03
0.64
96
.44
50.8
4 40
.20
52.7
1 18
.34
36.9
5 14
-0
.62
1-0
.37
9
0.68
0.
973
0.62
1 0.
635
0.67
0.
07
38.6
14
.38
46.3
5 94
.85
38.6
40
.35
44.4
6 49
.31
15
0.83
9 -0
.081
-0
.45
6
-0.2
02
-0.1
57
-0.7
3 -0
.57
70.5
3 0.
66
20.8
4 4.
11
2.47
53
.48
32.1
9 16
0.
081
-0.1
7 0.
268
0.27
1 -0
.36
-0
.18
0.
66
2.89
7.
22
7.37
13
.17
3.38
17
0.
787
0.76
3 0.
836
0.57
0.
73
61.9
6 58
.24
70.0
2 32
.03
53.9
4 18
0.
742
0.76
4 0.
65
0.73
55
.16
58.4
1 41
.89
53.8
19
0.
991
0.76
0.
88
98.3
7 58
.19
77.3
9 20
0.
74
0.87
54
.36
76.3
1 21
0.
97
93.8
3
Leg
end:
1 =
Lea
f ar
ea m
m';
2 =
Sto
mat
a1 a
rea
of t
he a
daxi
al s
urfa
ce (
pm
Z);
3 =
Sto
mat
a ar
ea o
f th
e ab
axia
l sur
face
(pm
2); 4
= T
otal
sto
mat
al a
rea
(pm
2), (
uppe
r +
low
er);
5 =
Num
ber
of s
tom
atai
mm
'ada
xial
su
rfac
e; 6
= N
umbe
r of
sto
mat
aim
m2 a
baxi
al s
urfa
ce; 7
= T
otal
num
ber
of s
tom
atai
mm
Z (u
pper
+ lo
wer
); 8
= L
eaf w
idth
mm
; 9 =
Num
ber
of s
tom
atal
row
s in
ada
xial
sur
face
; 10
= N
umbe
r of
sto
mat
al
row
s in
aba
xial
sur
face
; 11 =
Num
ber o
f st
omat
a ro
wsl
mm
in
adax
ial s
urfa
ce; 1
2 =
Num
ber
of s
tom
atal
row
slm
m in
aba
xial
sur
face
; 13 =
Len
gth
of th
e st
oma
(pm
) in
adax
ial s
urfa
ce; 1
4 =
Len
gth
of th
e st
oma
(pm
) in
abax
ial s
urfa
ce;
15 =
Wid
th o
f the
sto
ma
(pm
) in
adax
ial s
urfa
ce; 1
6 =
Wid
th o
f th
e st
oma
(pm
) in
abax
ial s
urfa
ce; 1
7 =
Per
imet
er o
f th
e st
oma
(pn
) in
ada
xial
sur
face
; 18 =
Per
imet
er o
f th
e st
oma
(pm
) in
adax
ial s
urfa
ce; 1
8 =
Per
imet
er o
f th
e st
oma
(pm
) in
abax
ial s
urfa
ce; 1
9 =
Tra
nspi
ring
are
a m
m2 o
f the
ada
xial
sur
face
; 20
= T
rans
piri
ng a
rea
mm
2 of
abax
ial s
urfa
ce; 2
1 =
Per
cent
age
of t
rans
piri
ng a
rea
of a
daxi
al s
urfa
ce; 2
2 =
Per
cent
age
of t
rans
piri
ng a
rea
of a
baxi
al s
urfa
ce.
h,
E
282
eters and flag leaf area, length and perimeter, and transpiring area. These parameters can be useful for negative selection.
The leaf area, also positively correlated to the transpiring area, but very negatively influenced by water status, and other factors, cannot be a reliable selection trait. The stomatal area can be utilized as a selection parameter to increase the transpiring area. It is directly dependent on the stomatal pe- rimeter.
The stomatal area measurements can be utilized to screen genotypes with a high transpiring area. In combination with an efficient photosynthetic appa- ratus, such genotypes can achieve high yields.
Such screening for high transpiring area, how- ever, does not guarantee selection of drought toler- ant germplasm: a characteristic of drought resistant plants is the capacity to maintain the stomata open during prolonged drought, and therefore, the sto- matal opening is the most useful trait. However, it is not sufficiently closely correlated with stomatal area (r = 0.42 at Mineo and 0.01 at Gela) (Tables 3 and 4). This seems to be quite contradictory, be- cause both stomatal opening and stomatal area are dimensional parameters of the same object (sto- ma), and should be (more closely) correlated.
Considering that the correlation coefficient was computed on the mean of all 5 cultivars, varying greatly in their responses to stress, it is possible to understand why there was no correlation. Table 5 presents measurements of stomatal aperture re- corded for each cultivar in the unfavourable loca- tion of Gela. The highest value of stomatal opening can be found in Simeto and Duilio, followed by Valnova, Trinakria and Vespro, in decreasing or- der. Such a trend is similar to that shown for yield
Table 5. Stomatal aperture (txm) of 5 durum wheat cultivars recorded at the unfavourable location of Gela
Adaxial Abaxial Mean
Simeto 24.85 24.13 24.49 Duilio 25.37 23.34 24.35 Valnova 24.60 23.17 23.88 Trinakria 23.46 22.15 22.80 Vespro 22.58 22.13 22.36
stability (Table 2) and for the transpiring area un- der stress (Table 1).
The data of stomatal aperture recorded on the abaxial surface reflect this trend more accurately (Table 5).
Therefore the dimension of stomatal aperture of the lower surface in plants grown under dry condi- tions is a useful trait for screening drought tolerant genotypes.
References
Austin, R.B., C.L. Morgan & M.A. Ford, 1982. Flag leaf photosynthesis of Triticum aestivum and related diploid and tetraploid species. Annals of Botany 49: 177-189.
Boggini, G., F. Caicagno, G. Di Prima & G.M. Lombardo, 1989. Scelta varietale frumento duro Sicilia. Informatore Agrario XLV (37) suppl.: 18-23.
Begg, ,I.E. & N.C. Turner, 1976. Crop water deficits. Adv. Agron. 28: 161-217.
Blum, A., G. Gozlan & ,i. Mayer, 1981. The manifestation of dehydration avoidance in wheat breeding germplasm. Crop Sci. 21: 495-499.
Blum, A., 1985. Breeding crop varieties for stress environ- ments. CRC Review in Plant Science 2: 199-238.
Jones, M.N., N.C. Turner & C.B. Osmond, 1981. Mechanisms of drought resistance. In: L.G. Paleg & A. Aspinal (Eds.) The physiology and biochemistry of drought resistance in plants, (Academic Press, Sydney): 15-35.
Kutik, J., 1973. The relationships between quantitative charac- teristics of stomata and epidermal cells of leaf epidermis. Biologia Plantarum 15: 324-328.
Ledent, ,I.F. & M.F. ,iouret, 1978. Relationship between stoma- tal frequencies, yield components and morphological charac- ters in collections of winter wheat cultivars. Biologia Planta- rum (Praha) 20: 287-292.
Maximov, N.A., 1929. The Plant in Relation to Water. Allen and Unwin Ltd., London. 451 pp.
Miskin, K.E. & D.C. Rasmusson, 1970. Frequency and distri- bution of stomata in Barley. Crop Sci. 10: 575-578.
Planchon, C., 1987. Drought avoidance and drought tolerance in crop plants inter and intraspecific variability. In: L. Monti & E. Porceddu (Eds.) Drought resistance in plants. Physiolo- gy and genetic aspects, (CEC): 79-94.
Rawson, J.M., N.C. Turner & .I.E. Begg, 1978. Agronomic and physiological responses of soybean and sorghum crops to water deficits. 4. Photosynthesis, transpiration and water use efficiency in leaves. Aust. ,i. P1. Phys. 5: 195-209.
Roselli, G. & G. Venora, 1990. Relationship between stomatal size and winter hardiness in the olive. International Symposi- um on olive growing, Cordoba, Spain, 26-29/9/1989.
Salisbury, E., 1927. On the causes and ecological significance of
stomatal frequency, with special reference to the woodland flora. Phil. Trans. Roy. Soc., London, 216B: 1-65.
Sapra, V.T., J.L. Hughes & G.C. Sharma, 1975. Frequency, size, and distribution of stomata in triticale leaves. Crop Sci. 15: 356-358.
Scott, A.J. & M. Knott, 1974. A cluster method for grouping means in the analysis of variance. Biometrics~ 30: 505-512.
283
Shimshi, D. & J. Ephrat, 1975. Stomatal behavior of wheat cultivars in relation to their transpiration, photosynthesis, and yield. Agronomy Journal 67: 326-331.
Weaver, E.J. & E.F. Clements, 1938. Plant Ecology. McGraw- Hill Book Company Inc., New York. 359 pp.

![Stomatal Biology of CAM Plants1[CC-BY] - Plant … on Stomatal Biology Stomatal Biology of CAM Plants1[CC-BY] Jamie Males* and Howard Griffiths Department of Plant Sciences, University](https://img.pdfslide.us/doc/110x75/5ae808d37f8b9a08778f24b1/stomatal-biology-of-cam-plants1cc-by-plant-on-stomatal-biology-stomatal.jpg)
![Evolution of the Stomatal Regulation of Plant Water ...Update on Stomatal Evolution Evolution of the Stomatal Regulation of Plant Water Content[OPEN] Timothy J. Brodribb* and Scott](https://img.pdfslide.us/doc/110x75/5e87e202c27a1d71d24f112b/evolution-of-the-stomatal-regulation-of-plant-water-update-on-stomatal-evolution.jpg)
![Stomatal Defense a Decade Later1[OPEN] - Plant Physiology · Update on Stomatal Defense Stomatal Defense a Decade Later1[OPEN] Maeli Melotto*, Li Zhang, Paula R. Oblessuc, and Sheng](https://img.pdfslide.us/doc/110x75/5eddc0a3ad6a402d6668efaa/stomatal-defense-a-decade-later1open-plant-update-on-stomatal-defense-stomatal.jpg)