Embed Size (px)
Citation preview
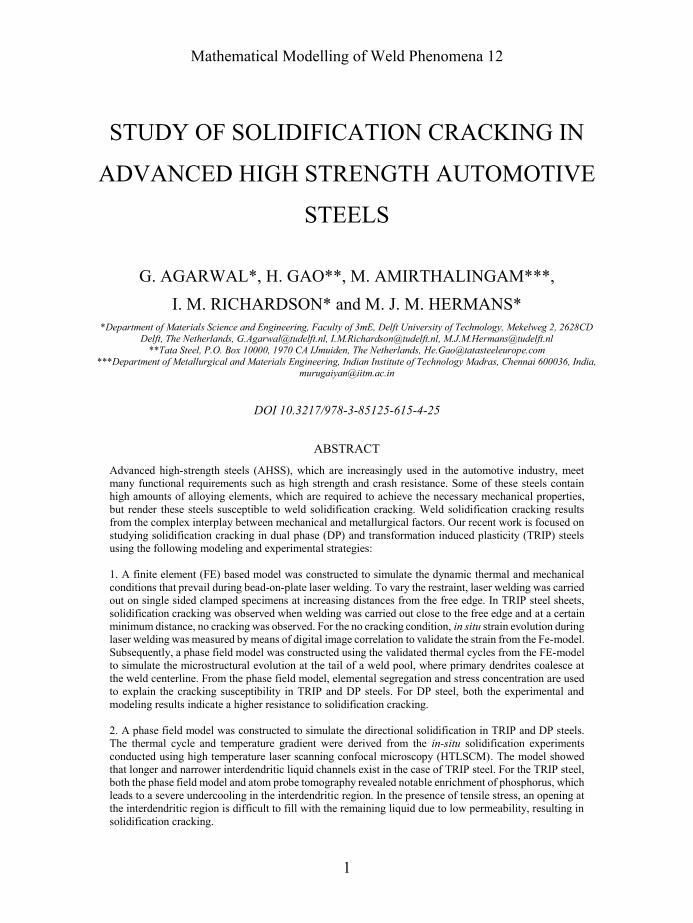
Mathematical Modelling of Weld Phenomena 12
1
STUDY OF SOLIDIFICATION CRACKING IN
ADVANCED HIGH STRENGTH AUTOMOTIVE
STEELS
G. AGARWAL*, H. GAO**, M. AMIRTHALINGAM***,
I. M. RICHARDSON* and M. J. M. HERMANS*
*Department of Materials Science and Engineering, Faculty of 3mE, Delft University of Technology, Mekelweg 2, 2628CD
Delft, The Netherlands, [email protected], [email protected], [email protected]
**Tata Steel, P.O. Box 10000, 1970 CA IJmuiden, The Netherlands, [email protected]
***Department of Metallurgical and Materials Engineering, Indian Institute of Technology Madras, Chennai 600036, India,
DOI 10.3217/978-3-85125-615-4-25
ABSTRACT
Advanced high-strength steels (AHSS), which are increasingly used in the automotive industry, meet
many functional requirements such as high strength and crash resistance. Some of these steels contain
high amounts of alloying elements, which are required to achieve the necessary mechanical properties,
but render these steels susceptible to weld solidification cracking. Weld solidification cracking results
from the complex interplay between mechanical and metallurgical factors. Our recent work is focused on
studying solidification cracking in dual phase (DP) and transformation induced plasticity (TRIP) steels
using the following modeling and experimental strategies:
1. A finite element (FE) based model was constructed to simulate the dynamic thermal and mechanical
conditions that prevail during bead-on-plate laser welding. To vary the restraint, laser welding was carried
out on single sided clamped specimens at increasing distances from the free edge. In TRIP steel sheets,
solidification cracking was observed when welding was carried out close to the free edge and at a certain
minimum distance, no cracking was observed. For the no cracking condition, in situ strain evolution during
laser welding was measured by means of digital image correlation to validate the strain from the Fe-model.
Subsequently, a phase field model was constructed using the validated thermal cycles from the FE-model
to simulate the microstructural evolution at the tail of a weld pool, where primary dendrites coalesce at
the weld centerline. From the phase field model, elemental segregation and stress concentration are used
to explain the cracking susceptibility in TRIP and DP steels. For DP steel, both the experimental and
modeling results indicate a higher resistance to solidification cracking.
2. A phase field model was constructed to simulate the directional solidification in TRIP and DP steels.
The thermal cycle and temperature gradient were derived from the in-situ solidification experiments
conducted using high temperature laser scanning confocal microscopy (HTLSCM). The model showed
that longer and narrower interdendritic liquid channels exist in the case of TRIP steel. For the TRIP steel,
both the phase field model and atom probe tomography revealed notable enrichment of phosphorus, which
leads to a severe undercooling in the interdendritic region. In the presence of tensile stress, an opening at
the interdendritic region is difficult to fill with the remaining liquid due to low permeability, resulting in
solidification cracking.
Mathematical Modelling of Weld Phenomena 12
2
The overall study shows that a combination of factors is responsible for the susceptibility of a material to
solidification cracking. These include particularly mechanical restraint, solidification temperature range,
solidification morphology, solute segregation and liquid feeding capability.
Keywords: Solidification Cracking, Hot Cracking, Steel, Laser Welding, Automotive, Advanced high
strength steels (AHSS)
INTRODUCTION
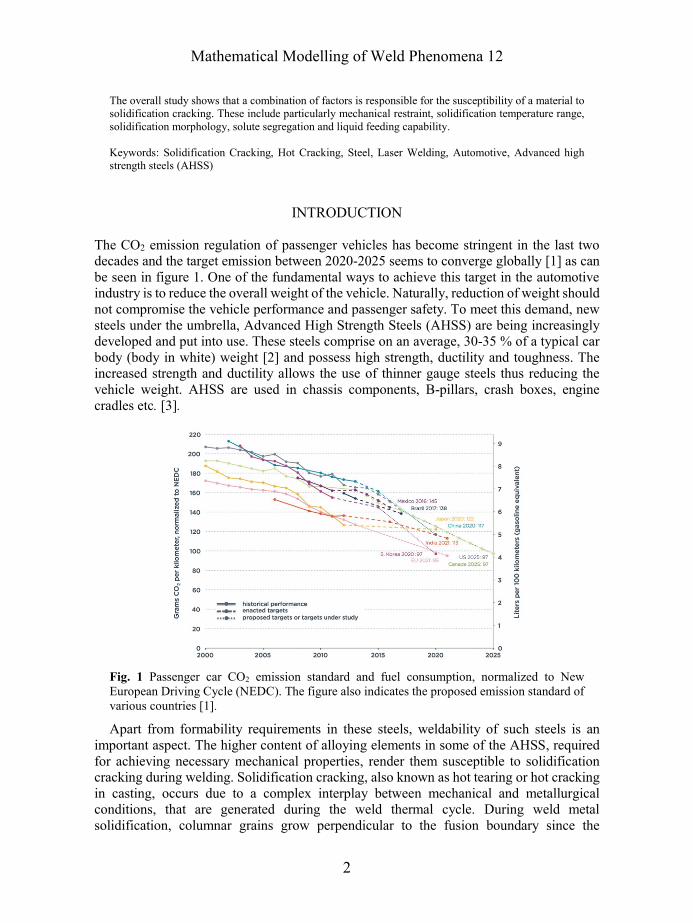
The CO2 emission regulation of passenger vehicles has become stringent in the last two
decades and the target emission between 2020-2025 seems to converge globally [1] as can
be seen in figure 1. One of the fundamental ways to achieve this target in the automotive
industry is to reduce the overall weight of the vehicle. Naturally, reduction of weight should
not compromise the vehicle performance and passenger safety. To meet this demand, new
steels under the umbrella, Advanced High Strength Steels (AHSS) are being increasingly
developed and put into use. These steels comprise on an average, 30-35 % of a typical car
body (body in white) weight [2] and possess high strength, ductility and toughness. The
increased strength and ductility allows the use of thinner gauge steels thus reducing the
vehicle weight. AHSS are used in chassis components, B-pillars, crash boxes, engine
cradles etc. [3].
Fig. 1 Passenger car CO2 emission standard and fuel consumption, normalized to New
European Driving Cycle (NEDC). The figure also indicates the proposed emission standard of
various countries [1].
Apart from formability requirements in these steels, weldability of such steels is an
important aspect. The higher content of alloying elements in some of the AHSS, required
for achieving necessary mechanical properties, render them susceptible to solidification
cracking during welding. Solidification cracking, also known as hot tearing or hot cracking
in casting, occurs due to a complex interplay between mechanical and metallurgical
conditions, that are generated during the weld thermal cycle. During weld metal
solidification, columnar grains grow perpendicular to the fusion boundary since the
Mathematical Modelling of Weld Phenomena 12
3
temperature gradient here is at its steepest and accordingly the heat extraction is maximised.
The solidifying dendrites meet at the weld centreline. The solidifying weld metal shrinks
due to solidification shrinkage and thermal contraction. As solidification progresses, the
solid in the mushy zone begins to form a rigid network, i.e., tensile strain is induced. If the
deformation exceeds a certain threshold, separation of the dendrites at the grain boundary
can occur. At the terminal stage of solidification, such an opening cannot be compensated
by the remaining liquid due to both low permeability and high solid fraction [3–4]. As a
result, solidification cracking occurs. Eskin et al. [6] in their review paper, elaborated
existing hot tearing theories and models. These models are based on the existence of a
critical stress, critical strain or critical strain rate criterion that leads to cracking. Katgerman
[7] in his mathematical model considered stresses and insufficient feeding in the vulnerable
temperature range to be the cause of hot cracking. Recent physical models from Rappaz et
al. [8] and Kou [9] indicate that in the presence of local deformation, insufficient liquid
feeding in the interdendritic or intergranular region results in cracking. Experiments by
Coniglio et al. [10] also indicate that the presence of a critical strain rate is responsible for
cracking. The mechanism of solidification cracking is still not properly understood [11],
particularly experiments or models focussing on determining the physical mechanism
leading to the separation of grains are lacking.
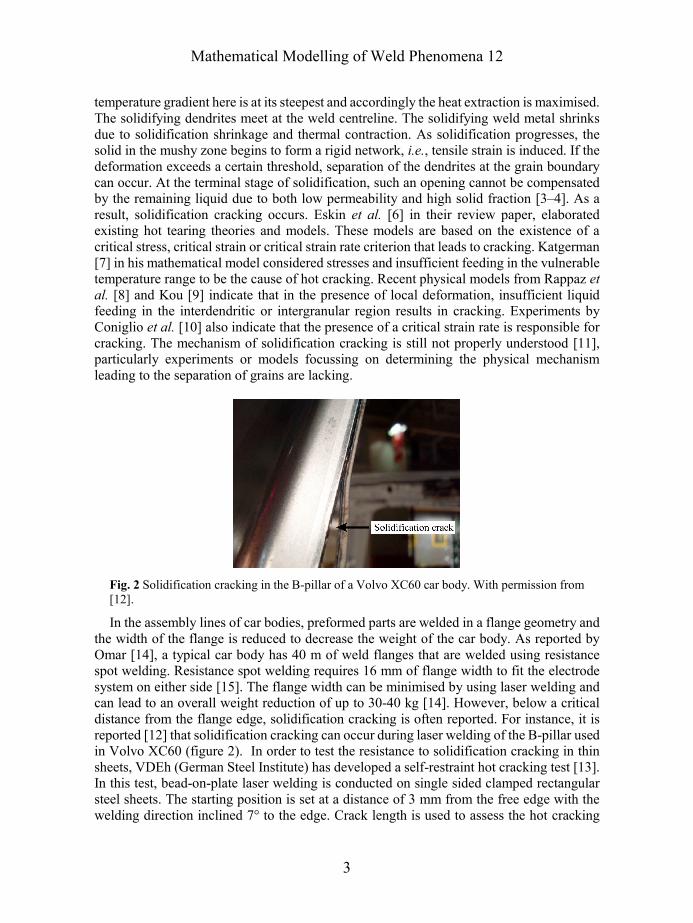
Fig. 2 Solidification cracking in the B-pillar of a Volvo XC60 car body. With permission from
[12].
In the assembly lines of car bodies, preformed parts are welded in a flange geometry and
the width of the flange is reduced to decrease the weight of the car body. As reported by
Omar [14], a typical car body has 40 m of weld flanges that are welded using resistance
spot welding. Resistance spot welding requires 16 mm of flange width to fit the electrode
system on either side [15]. The flange width can be minimised by using laser welding and
can lead to an overall weight reduction of up to 30-40 kg [14]. However, below a critical
distance from the flange edge, solidification cracking is often reported. For instance, it is
reported [12] that solidification cracking can occur during laser welding of the B-pillar used
in Volvo XC60 (figure 2). In order to test the resistance to solidification cracking in thin
sheets, VDEh (German Steel Institute) has developed a self-restraint hot cracking test [13].
In this test, bead-on-plate laser welding is conducted on single sided clamped rectangular
steel sheets. The starting position is set at a distance of 3 mm from the free edge with the
welding direction inclined 7° to the edge. Crack length is used to assess the hot cracking
Mathematical Modelling of Weld Phenomena 12
4
susceptibility of various alloys. The test is of practical importance for overlap and flange
welding geometries in order to minimise the flange width.
In the present work, solidification cracking was studied in two commercial automotive
AHSS, i.e., transformation induced plasticity (TRIP) and dual phase (DP) steels. These
steels are extensively used in automotive car bodies [16] and hence make a good case for
the present study. The following two approaches were implemented:
• Laser bead-on-plate welding experiments were carried out on single sided clamped
rectangular sheets, similar to the VDEh standard test. However, the welding
direction was kept parallel to the free edge. In TRIP steel, solidification cracking
was observed when welding was carried out close to the free edge and beyond a
certain distance from the free edge, solidification cracking was not observed. A 3D
finite-element (FE) sequential thermal-mechanical model of the laser welding was
created. The thermal model was validated by the experiments using both the
temperature measurements and weld bead size. The mechanical model was further
validated using the experimentally measured transverse strain by the digital image
correlation (DIC) technique [17]. Subsequently, a phase field model for
solidification under laser welding conditions was created for both TRIP and DP
steels. The boundary conditions were adopted from the FE-model. A pre-described
global strain of 0.1 % magnitude was applied perpendicular to the weld centreline.
The focus was on the solidification behaviour at the weld centreline behind the
weld pool and particularly on the conditions that lead to the separation of grains.
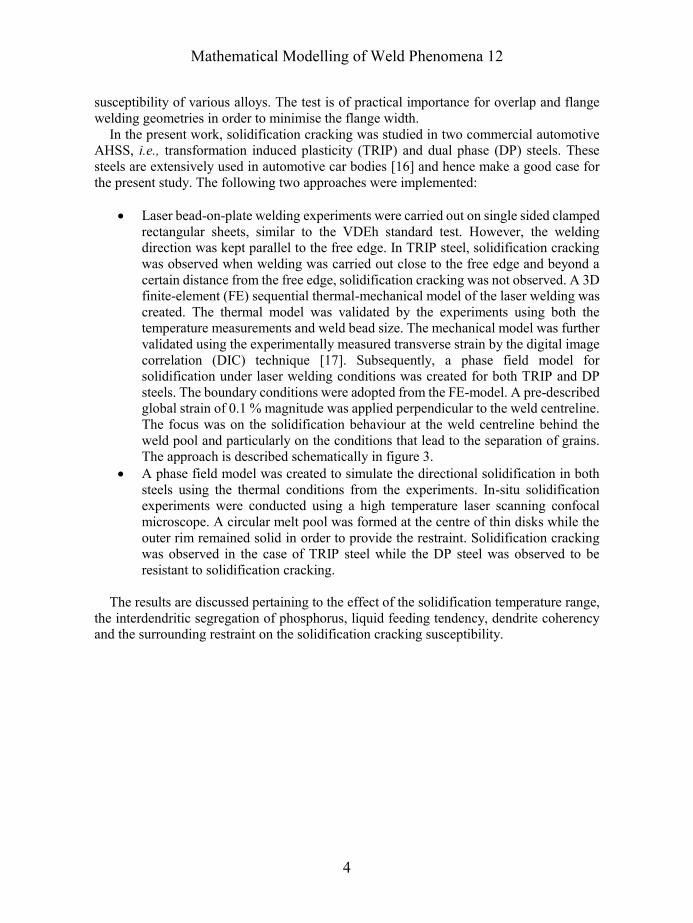
The approach is described schematically in figure 3.
• A phase field model was created to simulate the directional solidification in both
steels using the thermal conditions from the experiments. In-situ solidification
experiments were conducted using a high temperature laser scanning confocal
microscope. A circular melt pool was formed at the centre of thin disks while the
outer rim remained solid in order to provide the restraint. Solidification cracking
was observed in the case of TRIP steel while the DP steel was observed to be
resistant to solidification cracking.
The results are discussed pertaining to the effect of the solidification temperature range,
the interdendritic segregation of phosphorus, liquid feeding tendency, dendrite coherency
and the surrounding restraint on the solidification cracking susceptibility.
Mathematical Modelling of Weld Phenomena 12
5
Fig. 3 Schematic of the approach adopted in the present work. At first, a FE-thermal model of
laser welding was created. The local thermal gradient behind the weld pool (from the FE-
thermal model) along with the thermodynamic and mobility data from Thermo-CalcTM were
used in the phase field model of solidification.
EXPERIMENTAL SETUP
The composition of the steels used in this work is listed in Table 1. The experimental
arrangement for the laser welding experiments is shown in figure 4. Laser bead-on-plate
welding experiments were conducted using a 3 kW Nd:YAG laser in the keyhole mode.
Specimens were kept at the focal point of the optical system and the laser spot size was 0.6
mm. A laser power of 1100 W and a welding speed of 10 mm s-1 were used. Rectangular
steel sheets with dimensions of 90 × 45 mm2 and thickness of 1.25 mm were used. The
starting position of the laser (Y ordinate) was varied from 5 mm to 13 mm with each
increment being 2 mm. Each experiment was repeated five times. For the 13 mm case,
temperature was measured at three locations (figure 4) using spot welded K-type
thermocouples. Also, the displacement field during welding was measured using the digital
image correlation (DIC) method. More details on the method can be found in our previous
work [16–17].
The weld surface and cross section were prepared for optical microscopy using standard
procedures. Etching was carried out using 4 % Picral and 2 % aqueous sodium metabisulfite
[19]. The fracture surface was observed using a scanning electron microscope.
Mathematical Modelling of Weld Phenomena 12
6
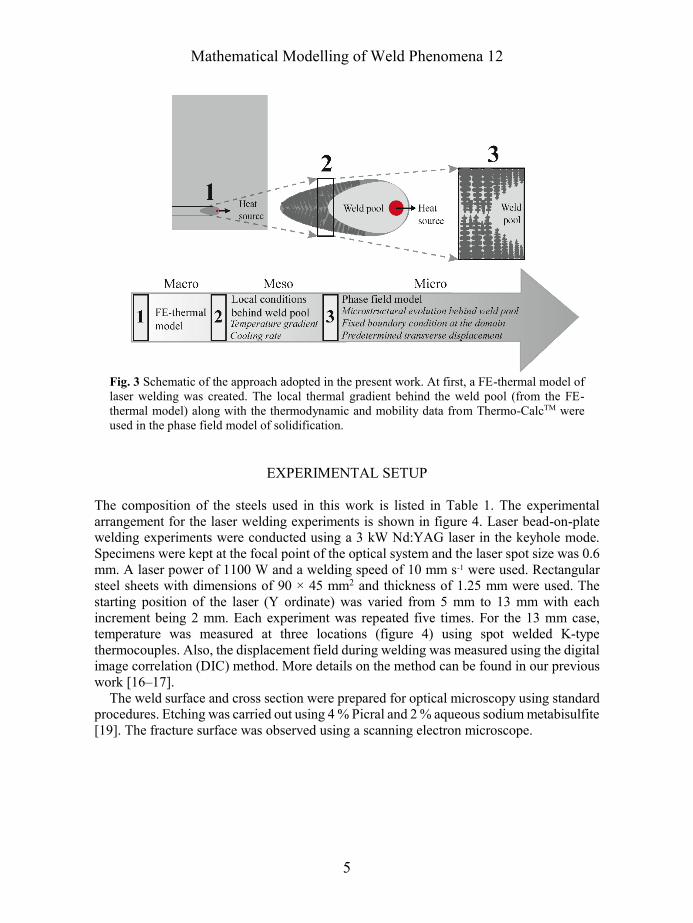
Fig. 4 Schematic of the hot cracking test setup. The thermocouple positions are also indicated.
P1 is 3 mm from the weld centreline (towards the free edge) and P2, P3 are 3 mm and 4.5 mm
from the weld centreline (towards the constrained edge). Adapted from [17].
Table 1 Composition of the steels used in this work.
In-situ solidification experiments were conducted using high temperature laser scanning
confocal microscopy. Circular disk-shaped specimens with a diameter 10 mm and a
thickness 250 μm were prepared. The sample was placed in an alumina crucible and was
held by ceramic protrusions at the periphery of the crucible. The crucible was held in a
platinum holder with a thermocouple spot-welded to it. The sample was placed at the upper
focal point of a gold-plated ellipsoidal cavity and was heated by radiation using a 1.5 kW
halogen lamp placed at the lower focal point. An inert atmosphere was maintained using
high purity argon gas. A stable melt pool with a diameter of 3-3.5 mm was formed at the
centre of the specimen while the outer rim remained solid. A cooling rate of 10 K s-1 was
applied until 1623 K using a PID controller, which controls the lamp power appropriately.
The temperature at the platinum holder was recorded and concurrently images were
acquired at a rate of 30 frames per second. More information on the technique and the setup
can be found in references [3], [19–22].
FINITE-ELEMENT (FE) MODEL
A 3D finite element (FE) sequential thermal mechanical model for the welding process was
created using a commercial software, COMSOLTM. The heat balance during welding was
simulated including the heat input, heat transfer and heat loss. A 3D conical Gaussian heat
source as used by [24]–[26] was adopted to describe the laser beam heat input. The thermal
history, i.e., temperatures (T) at (x, y, z) were obtained by solving the following Fourier
heat transfer equation using the temperature-dependent thermal properties of the material,
Fixed
45 mm
90 mm
Welding direction (X)
20 mm
X
Y
P1
P2P3
Distance from the
free edge (Y)
: Weld line
P1, P2, P3 : Thermocouple
positions
Clamp
Elements, wt.% C Mn Al Si Cr P Fe
TRIP 0.19 1.63 1.1 0.35 0.019 0.089 bal.
DP 0.15 2.3 0.03 0.10 0.56 0.01 bal.
Mathematical Modelling of Weld Phenomena 12
7
(1))
Here, k(T) is the temperature dependent thermal conductivity, Qv is the net volumetric
heat flux from the heat source, ρ(T) is the temperature dependent density and Cp(T) is the
temperature dependent specific heat.
The temperature dependent thermal and mechanical properties of the steel used in the
present work were taken from the reference [18]. Latent heat, absorbed or released during
melting (or solidification) is incorporated in the temperature dependent specific heat
capacity. The latent heat absorbed during melting was related to the temperature-phase
fraction data, obtained using Scheil-Gulliver solidification approximation. The thermal
expansion coefficient during solidification is considered to be dependent on the amount of
solid and liquid phases. The solidification temperature range, solid and liquid phase fraction
data of the steel composition were obtained from a commercial thermodynamic software,
Thermo-CalcTM. Quadratic elements with a minimum mesh size of 0.3 × 0.3 mm2 and a
thickness of 1 mm were used. The process efficiency of laser welding was assumed to be
40 % based on previous work of [27] on the same experimental arrangement. It is thus
assumed that the heat losses due to convection and radiation in the keyhole are taken into
account.
PHASE-FIELD (PF) MODEL
The phase field modelling approach applied in this study is based on our recent work [23],
[28]. Figure 3 shows schematic of the methodology adopted in this work. The emphasis
was on the microstructural evolution during solidification at the tail of the weld pool. For
this, the local conditions like transient temperature profiles and thermal gradient were taken
from the FE-model of laser welding. A commercial software, MICRESSTM based on the
phase field approach for multiphase systems was employed. It utilises the thermodynamic
(TCFE6) and mobility database (MOB2) from Thermo-CalcTM. A two dimensional grid of
200 × 300 μm with a grid size of 1 μm was defined. The energy parameters for the phase
interaction used in this simulation were taken from reference [29] and are listed in table 2.
The initial concentration of the components was set to be the bulk composition in the liquid
phase. One nucleus of δ-ferrite was placed at the bottom and the top left corner of the
computational domain. The radius of the nucleus was set to 0.5 μm. During solidification,
the system underwent a liquid to solid reaction based on the local thermodynamic and
chemical conditions. Only the cooling cycle behind the weld pool was considered.
For the thermal conditions, transient temperature profiles at the fusion boundaries from
the FE model were applied to both edges of the domain. A thermal gradient was defined
according to the temperature difference from the fusion to the weld centre line. The initial
temperature at the bottom edge was given as the liquidus temperature. The boundary
conditions for the phase and concentration were set to be symmetrical. The interface
thickness was assumed to be 3 μm. The time evolution is calculated by a set of phase field
equations deduced by the minimization of the free energy functional,
¶xk(T)
¶T
¶x
æ
èç
ö
ø÷+
¶yk(T)
¶T
¶y
æ
èç
ö
ø÷+
¶zk(T)
¶T
¶z
æ
èç
ö
ø÷+Qv = r(T)C
p(T)
¶T
¶t
æ
èç
ö
ø÷
Mathematical Modelling of Weld Phenomena 12
8
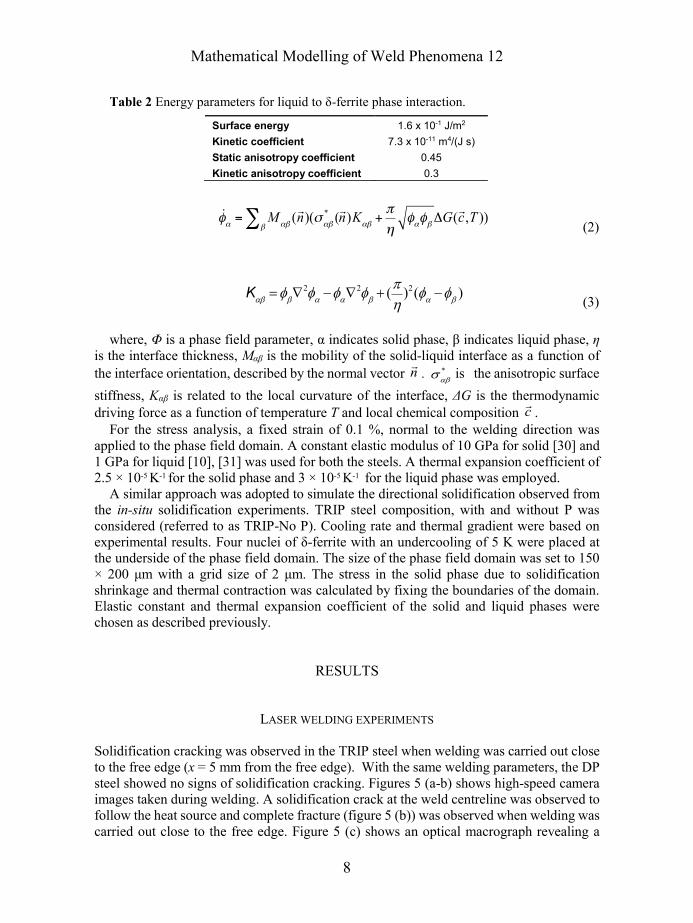
Table 2 Energy parameters for liquid to δ-ferrite phase interaction.
(2))
(3))
where, Φ is a phase field parameter, α indicates solid phase, β indicates liquid phase, η
is the interface thickness, Mαβ is the mobility of the solid-liquid interface as a function of
the interface orientation, described by the normal vector . is the anisotropic surface
stiffness, Kαβ is related to the local curvature of the interface, ΔG is the thermodynamic
driving force as a function of temperature T and local chemical composition .
For the stress analysis, a fixed strain of 0.1 %, normal to the welding direction was
applied to the phase field domain. A constant elastic modulus of 10 GPa for solid [30] and
1 GPa for liquid [10], [31] was used for both the steels. A thermal expansion coefficient of
2.5 × 10⁻⁵ K-1 for the solid phase and 3 × 10⁻⁵ K-1 for the liquid phase was employed.
A similar approach was adopted to simulate the directional solidification observed from
the in-situ solidification experiments. TRIP steel composition, with and without P was
considered (referred to as TRIP-No P). Cooling rate and thermal gradient were based on
experimental results. Four nuclei of δ-ferrite with an undercooling of 5 K were placed at
the underside of the phase field domain. The size of the phase field domain was set to 150
× 200 μm with a grid size of 2 μm. The stress in the solid phase due to solidification
shrinkage and thermal contraction was calculated by fixing the boundaries of the domain.
Elastic constant and thermal expansion coefficient of the solid and liquid phases were
chosen as described previously.
RESULTS
LASER WELDING EXPERIMENTS
Solidification cracking was observed in the TRIP steel when welding was carried out close
to the free edge (x = 5 mm from the free edge). With the same welding parameters, the DP
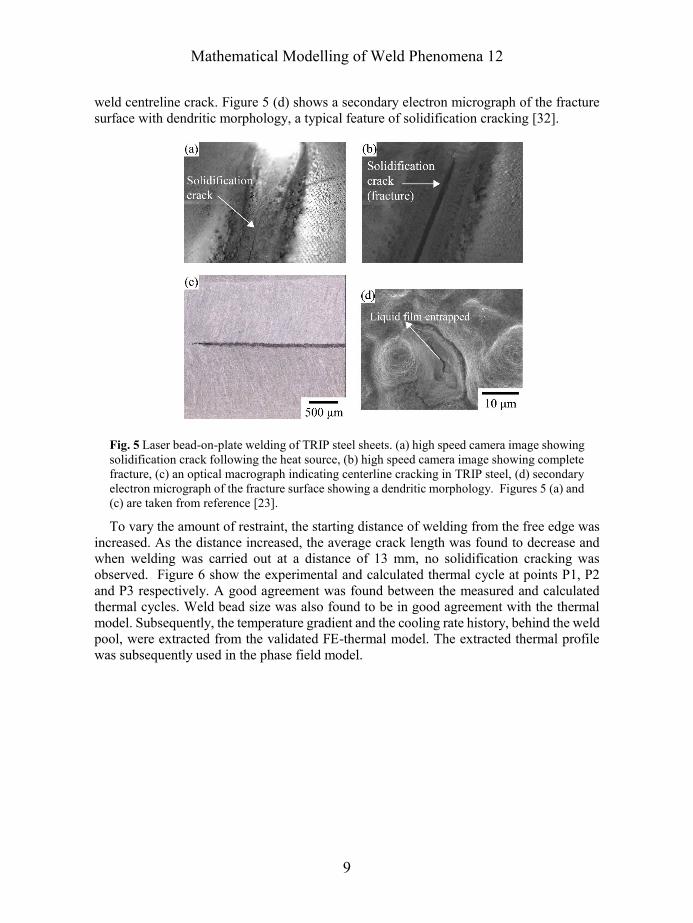
steel showed no signs of solidification cracking. Figures 5 (a-b) shows high-speed camera images taken during welding. A solidification crack at the weld centreline was observed to
follow the heat source and complete fracture (figure 5 (b)) was observed when welding was
carried out close to the free edge. Figure 5 (c) shows an optical macrograph revealing a
Kab=f
bÑ2f
a-f
aÑ2f
b+ (p
h)2(f
a-f
b)
sab
*
Surface energy 1.6 x 10⁻¹ J/m2
Kinetic coefficient 7.3 x 10⁻¹¹ m4/(J s)
Static anisotropy coefficient 0.45
Kinetic anisotropy coefficient 0.3
Mathematical Modelling of Weld Phenomena 12
9
weld centreline crack. Figure 5 (d) shows a secondary electron micrograph of the fracture
surface with dendritic morphology, a typical feature of solidification cracking [32].
Fig. 5 Laser bead-on-plate welding of TRIP steel sheets. (a) high speed camera image showing
solidification crack following the heat source, (b) high speed camera image showing complete
fracture, (c) an optical macrograph indicating centerline cracking in TRIP steel, (d) secondary
electron micrograph of the fracture surface showing a dendritic morphology. Figures 5 (a) and
(c) are taken from reference [23].
To vary the amount of restraint, the starting distance of welding from the free edge was
increased. As the distance increased, the average crack length was found to decrease and
when welding was carried out at a distance of 13 mm, no solidification cracking was
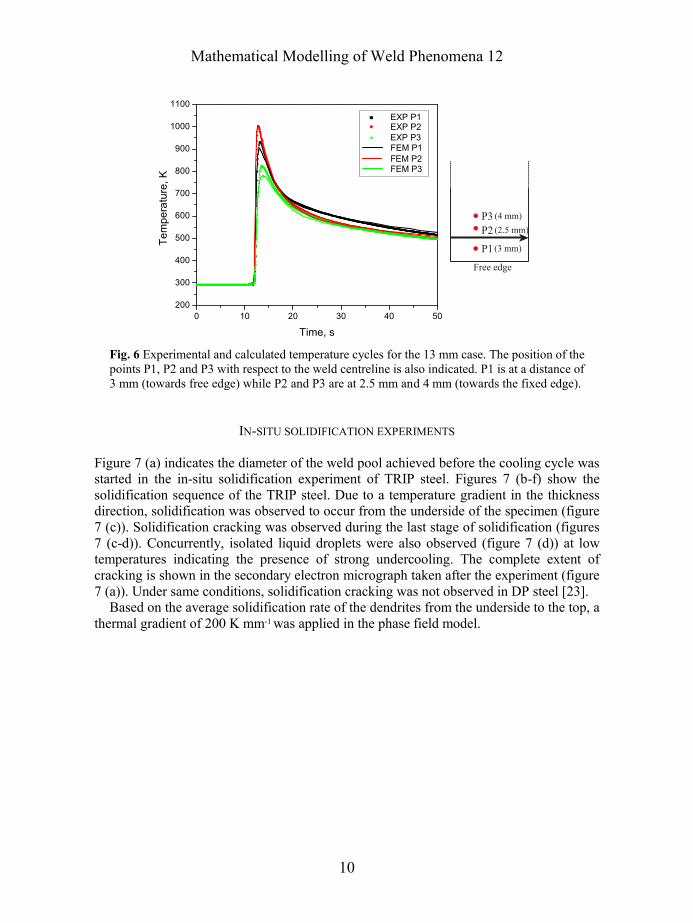
observed. Figure 6 show the experimental and calculated thermal cycle at points P1, P2
and P3 respectively. A good agreement was found between the measured and calculated
thermal cycles. Weld bead size was also found to be in good agreement with the thermal
model. Subsequently, the temperature gradient and the cooling rate history, behind the weld
pool, were extracted from the validated FE-thermal model. The extracted thermal profile
was subsequently used in the phase field model.
Mathematical Modelling of Weld Phenomena 12
10
Fig. 6 Experimental and calculated temperature cycles for the 13 mm case. The position of the
points P1, P2 and P3 with respect to the weld centreline is also indicated. P1 is at a distance of
3 mm (towards free edge) while P2 and P3 are at 2.5 mm and 4 mm (towards the fixed edge).
IN-SITU SOLIDIFICATION EXPERIMENTS
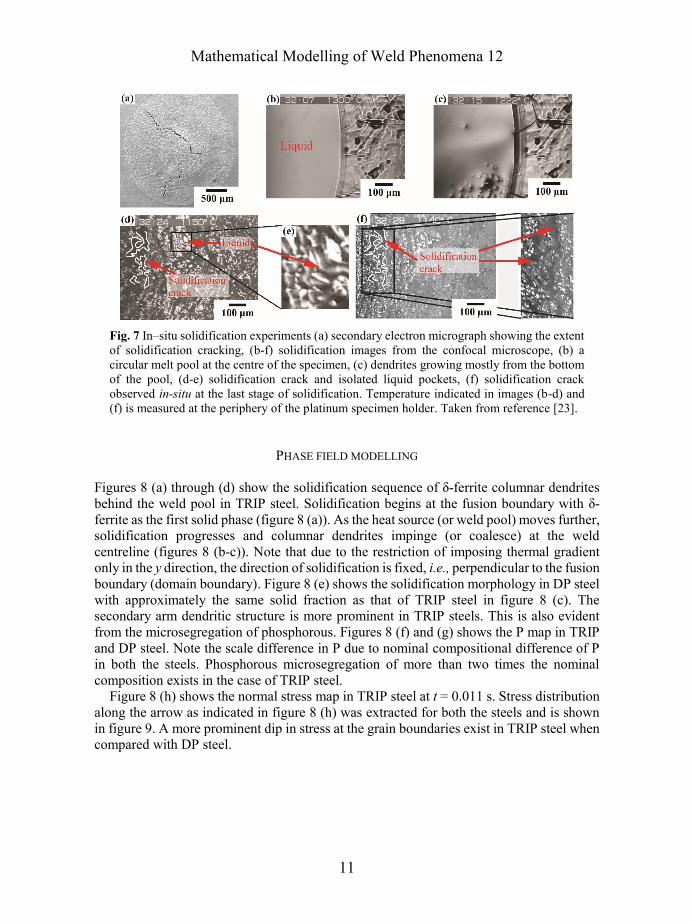
Figure 7 (a) indicates the diameter of the weld pool achieved before the cooling cycle was
started in the in-situ solidification experiment of TRIP steel. Figures 7 (b-f) show the
solidification sequence of the TRIP steel. Due to a temperature gradient in the thickness
direction, solidification was observed to occur from the underside of the specimen (figure
7 (c)). Solidification cracking was observed during the last stage of solidification (figures
7 (c-d)). Concurrently, isolated liquid droplets were also observed (figure 7 (d)) at low
temperatures indicating the presence of strong undercooling. The complete extent of
cracking is shown in the secondary electron micrograph taken after the experiment (figure
7 (a)). Under same conditions, solidification cracking was not observed in DP steel [23].
Based on the average solidification rate of the dendrites from the underside to the top, a
thermal gradient of 200 K mm-1 was applied in the phase field model.
Free edge
P1
P2
P3
(3 mm)
(2.5 mm)
(4 mm)
0 10 20 30 40 50
200
300
400
500
600
700
800
900
1000
1100
Temperature,K
Time, s
EXP P1EXP P2
EXP P3FEM P1
FEM P2FEM P3
Mathematical Modelling of Weld Phenomena 12
11
Fig. 7 In–situ solidification experiments (a) secondary electron micrograph showing the extent
of solidification cracking, (b-f) solidification images from the confocal microscope, (b) a
circular melt pool at the centre of the specimen, (c) dendrites growing mostly from the bottom
of the pool, (d-e) solidification crack and isolated liquid pockets, (f) solidification crack
observed in-situ at the last stage of solidification. Temperature indicated in images (b-d) and
(f) is measured at the periphery of the platinum specimen holder. Taken from reference [23].
PHASE FIELD MODELLING
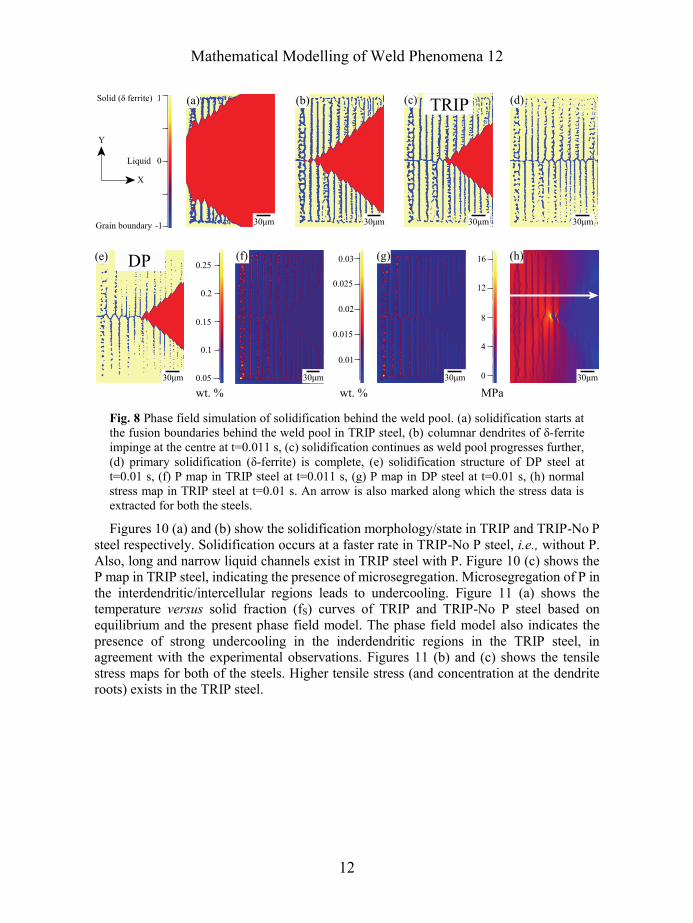
Figures 8 (a) through (d) show the solidification sequence of δ-ferrite columnar dendrites
behind the weld pool in TRIP steel. Solidification begins at the fusion boundary with δ-
ferrite as the first solid phase (figure 8 (a)). As the heat source (or weld pool) moves further,
solidification progresses and columnar dendrites impinge (or coalesce) at the weld
centreline (figures 8 (b-c)). Note that due to the restriction of imposing thermal gradient
only in the y direction, the direction of solidification is fixed, i.e., perpendicular to the fusion
boundary (domain boundary). Figure 8 (e) shows the solidification morphology in DP steel
with approximately the same solid fraction as that of TRIP steel in figure 8 (c). The
secondary arm dendritic structure is more prominent in TRIP steels. This is also evident
from the microsegregation of phosphorous. Figures 8 (f) and (g) shows the P map in TRIP
and DP steel. Note the scale difference in P due to nominal compositional difference of P
in both the steels. Phosphorous microsegregation of more than two times the nominal
composition exists in the case of TRIP steel.
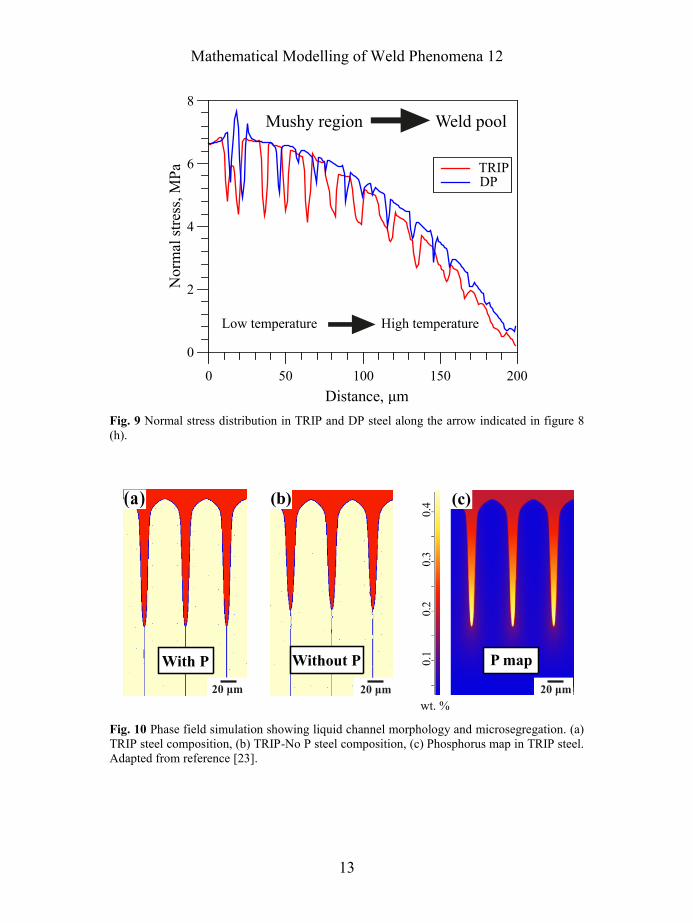
Figure 8 (h) shows the normal stress map in TRIP steel at t = 0.011 s. Stress distribution
along the arrow as indicated in figure 8 (h) was extracted for both the steels and is shown
in figure 9. A more prominent dip in stress at the grain boundaries exist in TRIP steel when
compared with DP steel.
Mathematical Modelling of Weld Phenomena 12
12
Fig. 8 Phase field simulation of solidification behind the weld pool. (a) solidification starts at
the fusion boundaries behind the weld pool in TRIP steel, (b) columnar dendrites of δ-ferrite
impinge at the centre at t=0.011 s, (c) solidification continues as weld pool progresses further,
(d) primary solidification (δ-ferrite) is complete, (e) solidification structure of DP steel at
t=0.01 s, (f) P map in TRIP steel at t=0.011 s, (g) P map in DP steel at t=0.01 s, (h) normal
stress map in TRIP steel at t=0.01 s. An arrow is also marked along which the stress data is
extracted for both the steels.
Figures 10 (a) and (b) show the solidification morphology/state in TRIP and TRIP-No P
steel respectively. Solidification occurs at a faster rate in TRIP-No P steel, i.e., without P.
Also, long and narrow liquid channels exist in TRIP steel with P. Figure 10 (c) shows the
P map in TRIP steel, indicating the presence of microsegregation. Microsegregation of P in
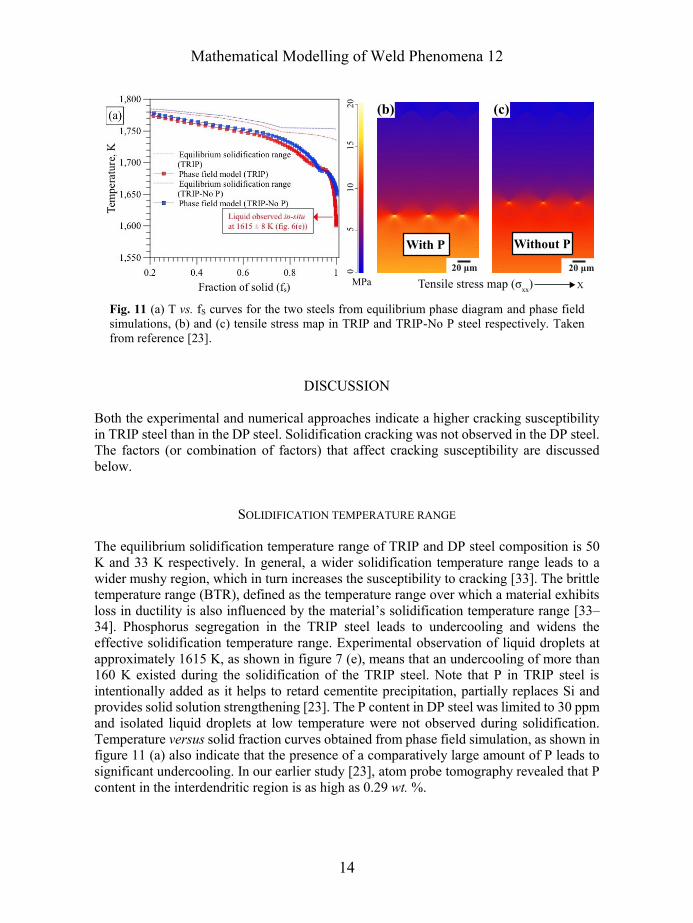
the interdendritic/intercellular regions leads to undercooling. Figure 11 (a) shows the
temperature versus solid fraction (fS) curves of TRIP and TRIP-No P steel based on
equilibrium and the present phase field model. The phase field model also indicates the
presence of strong undercooling in the inderdendritic regions in the TRIP steel, in
agreement with the experimental observations. Figures 11 (b) and (c) shows the tensile
stress maps for both of the steels. Higher tensile stress (and concentration at the dendrite
roots) exists in the TRIP steel.
-1
0
1Solid (δ ferrite)
Liquid
Grain boundary
0
4
8
12
16
0.015
0.01
0.02
0.025
0.03
0.05
0.1
0.15
0.2
0.25
30μm 30μm 30μm 30μm
30μm30μm30μm30μm
(a) (b) (c) (d)
(e) (f) (g) (h)
TRIP
DP
wt. % wt. % MPa
X
Y
Mathematical Modelling of Weld Phenomena 12
13
Fig. 9 Normal stress distribution in TRIP and DP steel along the arrow indicated in figure 8
(h).
Fig. 10 Phase field simulation showing liquid channel morphology and microsegregation. (a)
TRIP steel composition, (b) TRIP-No P steel composition, (c) Phosphorus map in TRIP steel.
Adapted from reference [23].
No
rmal
str
ess,
MP
a
0
2
4
6
8
Distance, m
0 50 100 150 200
TRIPDP
Mushy region Weld pool
High temperatureLow temperature
20 μm
With P
20 μm
P map
(a) (c)
20 μm
Without P
0.4
0.1
0.2
0.3
wt. %
(b)
Mathematical Modelling of Weld Phenomena 12
14
Fig. 11 (a) T vs. fS curves for the two steels from equilibrium phase diagram and phase field
simulations, (b) and (c) tensile stress map in TRIP and TRIP-No P steel respectively. Taken
from reference [23].
DISCUSSION
Both the experimental and numerical approaches indicate a higher cracking susceptibility
in TRIP steel than in the DP steel. Solidification cracking was not observed in the DP steel.
The factors (or combination of factors) that affect cracking susceptibility are discussed
below.
SOLIDIFICATION TEMPERATURE RANGE
The equilibrium solidification temperature range of TRIP and DP steel composition is 50
K and 33 K respectively. In general, a wider solidification temperature range leads to a
wider mushy region, which in turn increases the susceptibility to cracking [33]. The brittle
temperature range (BTR), defined as the temperature range over which a material exhibits
loss in ductility is also influenced by the material’s solidification temperature range [33–
34]. Phosphorus segregation in the TRIP steel leads to undercooling and widens the
effective solidification temperature range. Experimental observation of liquid droplets at
approximately 1615 K, as shown in figure 7 (e), means that an undercooling of more than
160 K existed during the solidification of the TRIP steel. Note that P in TRIP steel is
intentionally added as it helps to retard cementite precipitation, partially replaces Si and
provides solid solution strengthening [23]. The P content in DP steel was limited to 30 ppm
and isolated liquid droplets at low temperature were not observed during solidification.
Temperature versus solid fraction curves obtained from phase field simulation, as shown in
figure 11 (a) also indicate that the presence of a comparatively large amount of P leads to
significant undercooling. In our earlier study [23], atom probe tomography revealed that P
content in the interdendritic region is as high as 0.29 wt. %.
20 μm 20 μm
With P Without P
05
10
15
20
MPa Tensile stress map (σxx
)
(b) (c)
X
Mathematical Modelling of Weld Phenomena 12
15
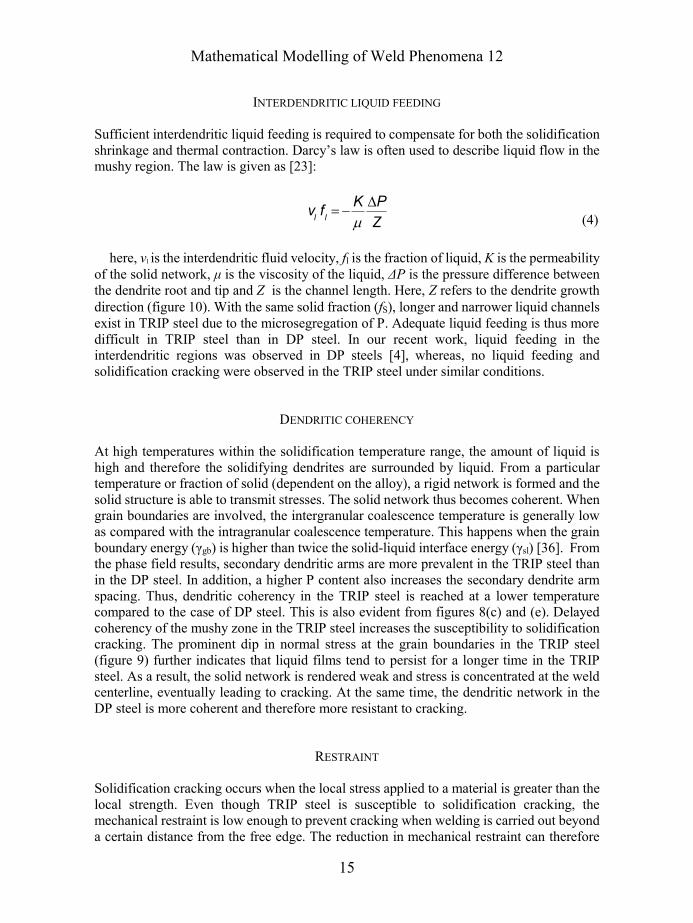
INTERDENDRITIC LIQUID FEEDING
Sufficient interdendritic liquid feeding is required to compensate for both the solidification
shrinkage and thermal contraction. Darcy’s law is often used to describe liquid flow in the
mushy region. The law is given as [23]:
(4)))
here, vl is the interdendritic fluid velocity, fl is the fraction of liquid, K is the permeability
of the solid network, μ is the viscosity of the liquid, ΔP is the pressure difference between
the dendrite root and tip and Z is the channel length. Here, Z refers to the dendrite growth
direction (figure 10). With the same solid fraction (fS), longer and narrower liquid channels
exist in TRIP steel due to the microsegregation of P. Adequate liquid feeding is thus more
difficult in TRIP steel than in DP steel. In our recent work, liquid feeding in the
interdendritic regions was observed in DP steels [4], whereas, no liquid feeding and
solidification cracking were observed in the TRIP steel under similar conditions.
DENDRITIC COHERENCY
At high temperatures within the solidification temperature range, the amount of liquid is
high and therefore the solidifying dendrites are surrounded by liquid. From a particular
temperature or fraction of solid (dependent on the alloy), a rigid network is formed and the
solid structure is able to transmit stresses. The solid network thus becomes coherent. When
grain boundaries are involved, the intergranular coalescence temperature is generally low
as compared with the intragranular coalescence temperature. This happens when the grain
boundary energy (γgb) is higher than twice the solid-liquid interface energy (γsl) [36]. From
the phase field results, secondary dendritic arms are more prevalent in the TRIP steel than
in the DP steel. In addition, a higher P content also increases the secondary dendrite arm
spacing. Thus, dendritic coherency in the TRIP steel is reached at a lower temperature
compared to the case of DP steel. This is also evident from figures 8(c) and (e). Delayed
coherency of the mushy zone in the TRIP steel increases the susceptibility to solidification
cracking. The prominent dip in normal stress at the grain boundaries in the TRIP steel
(figure 9) further indicates that liquid films tend to persist for a longer time in the TRIP
steel. As a result, the solid network is rendered weak and stress is concentrated at the weld
centerline, eventually leading to cracking. At the same time, the dendritic network in the
DP steel is more coherent and therefore more resistant to cracking.
RESTRAINT
Solidification cracking occurs when the local stress applied to a material is greater than the
local strength. Even though TRIP steel is susceptible to solidification cracking, the
mechanical restraint is low enough to prevent cracking when welding is carried out beyond
a certain distance from the free edge. The reduction in mechanical restraint can therefore
vlfl= -K
m
DP
Z
Mathematical Modelling of Weld Phenomena 12
16
improve the weldability of steels that are otherwise prone to solidification cracking. For
example, in our recent work [18], a decrease in heat input led to a decrease in the critical
distance beyond which no solidification cracking was observed.
PRESENT WORK IN RELATION WITH EXISTING PHYSCIAL MODELS ON HOT CRACKING
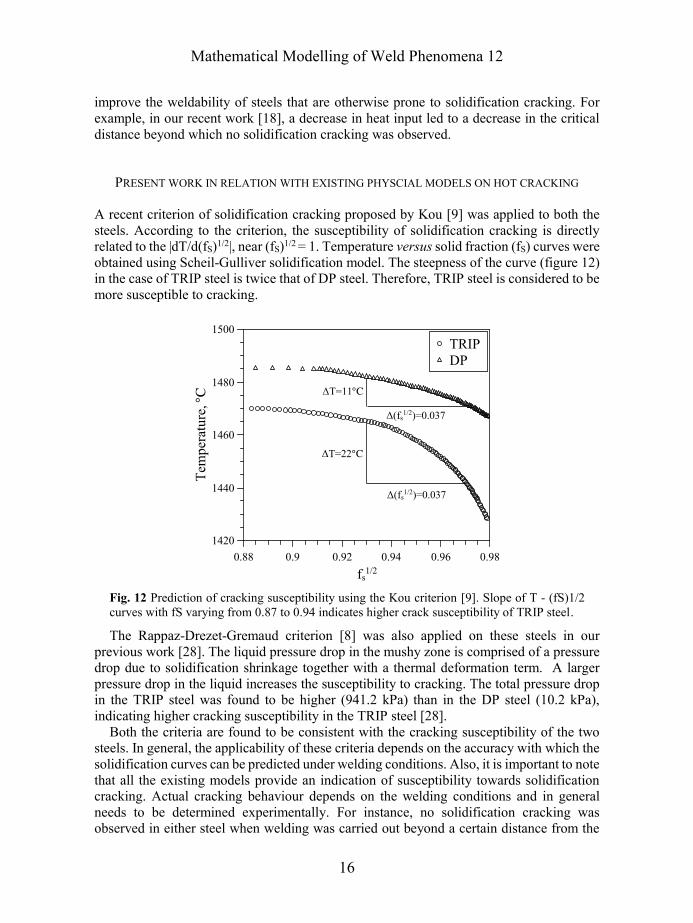
A recent criterion of solidification cracking proposed by Kou [9] was applied to both the
steels. According to the criterion, the susceptibility of solidification cracking is directly
related to the |dT/d(fS)1/2|, near (fS)1/2 = 1. Temperature versus solid fraction (fS) curves were
obtained using Scheil-Gulliver solidification model. The steepness of the curve (figure 12)
in the case of TRIP steel is twice that of DP steel. Therefore, TRIP steel is considered to be
more susceptible to cracking.
Fig. 12 Prediction of cracking susceptibility using the Kou criterion [9]. Slope of T - (fS)1/2
curves with fS varying from 0.87 to 0.94 indicates higher crack susceptibility of TRIP steel.
The Rappaz-Drezet-Gremaud criterion [8] was also applied on these steels in our
previous work [28]. The liquid pressure drop in the mushy zone is comprised of a pressure
drop due to solidification shrinkage together with a thermal deformation term. A larger
pressure drop in the liquid increases the susceptibility to cracking. The total pressure drop
in the TRIP steel was found to be higher (941.2 kPa) than in the DP steel (10.2 kPa),
indicating higher cracking susceptibility in the TRIP steel [28].
Both the criteria are found to be consistent with the cracking susceptibility of the two
steels. In general, the applicability of these criteria depends on the accuracy with which the
solidification curves can be predicted under welding conditions. Also, it is important to note
that all the existing models provide an indication of susceptibility towards solidification cracking. Actual cracking behaviour depends on the welding conditions and in general
needs to be determined experimentally. For instance, no solidification cracking was
observed in either steel when welding was carried out beyond a certain distance from the
Tem
per
atu
re,
1420
1440
1460
1480
1500
fs1/2
0.88 0.9 0.92 0.94 0.96 0.98
TRIP
DP
T=11
T=22
fs1/2)=0.037
fs1/2)=0.037
Mathematical Modelling of Weld Phenomena 12
17
free edge, i.e., restraint effect. The present work was focussed on the (local)
governing/contributing factors that affect the solidification cracking susceptibility, using
both experimental and modelling approaches. For instance, interdendritic liquid feeding
was observed and quantified experimentally [4] and later on studied in relation to
solidification cracking susceptibility using phase field solidification models [23], [28].
Solidification models also provided insights into the influence of dendritic coherency and
solute segregation on solidification cracking, which is difficult to obtain experimentally.
CONCLUSIONS
A detailed investigation of solidification cracking susceptibility in two common automotive
AHSS was carried out by means of both experimental and numerical methods. A novel
approach was adopted in which the dynamic thermal conditions behind the moving heat
source were extracted from a validated FE-model and applied to a phase field solidification
model. Solidification behaviour behind the weld pool was further studied pertaining to the
factors, which affect cracking susceptibility. Solidification behaviour during in-situ
experiments was also studied by means of a phase field model.
The observations from both the laser welding experiments and in-situ solidification
experiments corroborate the results of phase field modelling. The following conclusions
are drawn from the present study:
• The actual solidification temperature range is widened significantly by
undercooling in the TRIP steel due to P segregation. A wider solidification
temperature range leads to increased susceptibility towards solidification cracking.
The solidification rate is faster in the DP steel than in the TRIP steel. In addition,
a narrower solidification temperature range in the DP steel entails that the mushy
regions spends less time in the crack vulnerable regime.
• Phosphorous microsegregation leads to longer and narrower liquid channels in the
TRIP steel. Inadequate liquid feeding thus increases the likelihood of cracking in
the TRIP steel.
• In the DP steel, the solid in the mushy region forms a coherent network at an early
stage. As a result, it can effectively withstand transverse tensile strains. In the TRIP
steel, a continuous network of liquid films persists at the grain boundaries until the
latter stages of solidification. As a consequence, tensile strain is concentrated at
the weld centreline, eventually leading to cracking.
• Cracking occurs if the threshold strength of a crack susceptible material is
exceeded by the mechanical restraint. The amount of restraint affects the local
strain and can lead to different cracking behaviour.
In future, solidification models considering interdendritic liquid feeding under welding
conditions will be employed. These models will enable further understanding of the
solidification cracking phenomena.
Mathematical Modelling of Weld Phenomena 12
18
ACKNOWLEDGEMENTS
This research was carried out under project numbers F22.8.13485a and F22.8.13485b in
the framework of the Partnership Program of the Materials innovation institute M2i
(www.m2i.nl) and the Foundation for Fundamental Research on Matter (FOM)
(www.fom.nl), which is part of the Netherlands Organisation for Scientific Research
(www.nwo.nl). The authors would like to thank the industrial partner in this project ‘Tata
Steel Nederland B.V.’ for the financial support.
REFERENCES
[1] International Council on Clean Transportation. 'Global passenger vehicle standards (2014)'.
Retrieved from http://theicct.org/info-tools/global-passenger-vehicle-standards.
[2] S. KEELER, M. KIMCHI AND P. J. MCONEY: 'Advanced High-Strength Steels Application
Guidelines', 2017.
[3] C. LESCH, N. KWIATON AND F. B. KLOSE: 'Advanced High Strength Steels (AHSS) for
Automotive Applications − Tailored Properties by Smart Microstructural Adjustments', steel
research international, Vol. 88, No. 10, p. 1700210.
[4] G. AGARWAL, M. AMIRTHALINGAM, S. C. MOON, R. J. DIPPENAAR, I. M. RICHARDSON AND M.
J. M. HERMANS: 'Experimental evidence of liquid feeding during solidification of a steel',
Scripta Materialia, Vol. 146, pp. 105–109, 2018.
[5] M. RAPPAZ AND J. A. DANTZIG: Solidification, 1st ed. EFPL Press, 2009.
[6] D. G. ESKIN AND L. KATGERMAN: 'A Quest for a New Hot Tearing Criterion', Metallurgical
and Materials Transactions A, Vol. 38, No. 7, pp. 1511–1519, 2007.
[7] L. KATGERMAN: 'A Mathematical Model for Hot Cracking of Aluminum Alloys During D.C.
Casting', JOM, Vol. 34, No. 2, pp. 46–49, 1982.
[8] M. RAPPAZ, J.-M. DREZET AND M. GREMAUD: 'A new hot-tearing criterion', Metallurgical and
Materials Transactions A: Physical Metallurgy and Materials Science, Vol. 30, No. 2, pp. 449–
455, 1999.
[9] S. KOU: 'A criterion for cracking during solidification', Acta Materialia, Vol. 88, pp. 366–374,
2015.
[10] N. CONIGLIO AND C. E. CROSS: 'Mechanisms for Solidification Crack Initiation and Growth in
Aluminum Welding', Metallurgical and Materials Transactions A, Vol. 40, No. 11, pp. 2718–
2728, 2009.
[11] N. CONIGLIO AND C. E. CROSS: 'Initiation and growth mechanisms for weld solidification
cracking', International Materials Reviews, Vol. 58, No. 7, pp. 375–397, 2013.
[12] J. K. LARSSON: 'Avoidance of crack inducement when laser welding hot-formed car body
components --- a variable analysis', Physics Procedia, Vol. 5, pp. 115–124, 2010.
[13] VDEH: SEP 1220-3 :Testing and Documentation Guideline for the Joinability of thin sheet of
steel - Part 3: Laser beam welding. 2011.
[14] M. A. OMAR: 'Automotive Joining', in The Automotive Body Manufacturing Systems and
Processes, Wiley-Blackwell, 2011, pp. 107–176.
[15] K.-M. HONG AND Y. C. SHIN: 'Prospects of laser welding technology in the automotive industry:
A review', Journal of Materials Processing Technology, Vol. 245, pp. 46–69, 2017.
[16] T. B. HILDITCH, T. DE SOUZA AND P. D. HODGSON: 'Properties and automotive applications of
advanced high-strength steels (AHSS)', in Welding and Joining of Advanced High Strength
Steels (AHSS), M. Shome and M. Tumuluru, Eds. Woodhead Publishing, 2015, pp. 9–28.
[17] G. AGARWAL, H. GAO, M. AMIRTHALINGAM AND M. J. M. HERMANS: 'In-situ strain
investigation during laser welding using digital image correlation and finite element based
Mathematical Modelling of Weld Phenomena 12
19
numerical simulation', Science and Technology of Welding and Joining, Vol. 23, No. 2, pp.
134–139, 2018.
[18] H. GAO, G. AGARWAL, M. AMIRTHALINGAM, M. J. M. HERMANS AND I. M. RICHARDSON:
'Investigation on hot cracking during laser welding by means of experimental and numerical
methods', Welding in the World, Vol. 62, No. 1, pp. 71–78, 2018.
[19] A. K. DE, J. G. SPEER AND D. K. MATLOCK: 'Color tint-etching for multiphase steels', Advanced
Materials and Processes, Vol. 161, No. 2, pp. 27–30, 2003.
[20] M. REID, D. PHELAN AND R. DIPPENAAR: 'Concentric solidification for high temperature laser
scanning confocal microscopy', ISIJ International, Vol. 44, No. 3, pp. 565–572, 2004.
[21] S. GRIESSER AND R. DIPPENAAR: 'Enhanced Concentric Solidification Technique for High-
Temperature Laser-Scanning Confocal Microscopy', ISIJ Int., Vol. 54, No. 3, pp. 533–535,
2014.
[22] S. GRIESSER, R. PIERER, M. REID AND R. DIPPENAAR: 'SolTrack: An automatic video processing
software for in situ interface tracking', Journal of Microscopy, Vol. 248, No. 1, pp. 42–48,
2012.
[23] G. AGARWAL, A. KUMAR, H. GAO, M. AMIRTHALINGAM, S. C. MOON, R. J. DIPPENAAR, I. M.
RICHARDSON AND M. J. M. HERMANS: 'Study of Solidification Cracking in a Transformation-
Induced Plasticity-Aided Steel', Metallurgical and Materials Transactions A: Physical
Metallurgy and Materials Science, Vol. 49, No. 4, 2018.
[24] N. SHANMUGAM, G. BUVANASHEKARAN, K. SANKARANARAYANASAMY AND S. R. KUMAR: 'A
transient finite element simulation of the temperature and bead profiles of T-joint laser welds',
Materials and Design, Vol. 31, No. 9, pp. 4528–4542, 2010.
[25] J. MA, F. KONG AND R. KOVACEVIC: 'Finite-element thermal analysis of laser welding of
galvanized high-strength steel in a zero-gap lap joint configuration and its experimental
verification', Materials and Design, Vol. 36, pp. 348–358, 2012.
[26] M. ZAIN-UL-ABDEIN, D. NELIAS, J.-F. JULLIEN AND D. DELOISON: 'Prediction of laser beam
welding-induced distortions and residual stresses by numerical simulation for aeronautic
application', J. Mater. Process. Technol., Vol. 209, No. 6, pp. 2907–2917, 2009.
[27] Y. PAN: Laser welding of Zinc coated steel without pre-set gap, TU Delft, 2011.
[28] H. GAO, G. AGARWAL, M. AMIRTHALINGAM AND M. J. M. HERMANS: 'Hot cracking
investigation during laser welding of high-strength steels with multi-scale modelling approach',
Science and Technology of Welding and Joining, Vol. 23, No. 4, pp. 287–294, 2018.
[29] M. AMIRTHALINGAM, E. M. VAN DER AA, C. KWAKERNAAK, M. J. M. HERMANS AND I. M.
RICHARDSON: 'Elemental segregation during resistance spot welding of boron containing
advanced high strength steels', Weld. World, Vol. 59, No. 5, pp. 743–755, 2015.
[30] W.-Y. WANG, B. LIU AND V. KODUR: 'Effect of temperature on strength and elastic modulus of
high-strength steel', Journal of Materials in Civil Engineering, Vol. 25, No. 2, pp. 174–182,
2013.
[31] C. BORDREUIL AND A. NIEL: 'Modelling of hot cracking in welding with a cellular automaton
combined with an intergranular fluid flow model', Computational Materials Science, Vol. 82,
No. Supplement C, pp. 442–450, 2014.
[32] T. SOYSAL AND S. KOU: 'A simple test for assessing solidification cracking susceptibility and
checking validity of susceptibility prediction', Acta Materialia, Vol. 143, pp. 181–197, 2018.
[33] S. KOU: 'Welding Metallurgy', in Welding Metallurgy, John Wiley & Sons, Inc., 2003.
[34] C. E. CROSS: 'On the Origin of Weld Solidification Cracking', in Hot Cracking Phenomena in
Welds, T. Böllinghaus and H. Herold, Eds. Springer Berlin Heidelberg, 2005, pp. 3–18.
[35] J. C. LIPPOLD: Welding Metallurgy and Weldability. John Wiley & Sons, 2014.
[36] N. WANG, S. MOKADEM, M. RAPPAZ AND W. KURZ: 'Solidification cracking of superalloy
single- and bi-crystals', Acta Materialia, Vol. 52, No. 11, pp. 3173–3182, 2004.