Embed Size (px)
Citation preview
International Journal of Advancements in Research & Technology, Volume 2, Issue3, March-2013 1 ISSN 2278-7763
Copyright © 2013 SciResPub.
Study of sensory and textural properties of protein based edible coated paneer using Response surface methodology
Reeta* , Kumar. A Department of Food Science and Technology, G.B. Pant University of Agriculture and Technology,
Pantnagar 263145, India Email: [email protected],[email protected]
Abstract
The important of milk and milk product has been recognized since Vedic time. Paneer is one of
the traditional dairy products of India which is analogous to the western cottage cheese. Paneer is a heat
and acid coagulated with permitted organic acid and subsequent drainage of whey followed by pressing.
Short life of paneer is one of the most serious problems faced in marketing. Use of edible films on the
food products could also be utilized as a protective coating to extend the shelf life. Whey protein based
films and coatings are generally flavorless, tasteless, and flexible and source of protein. In preservation of
paneer edible coating with antimicrobial agents could be best alternative. The application of edible
coatings and films can reduce particle clustering and improve physical strength, visual and tactile feature
on product surface. Mechanical strength increased as the protein plasticizer ratio increase.
Edible films and coatings may control adhesion, cohesion and durability, and improve the
appearance of coated foods. They could enhance the organoleptic, mechanical or
nutritional properties of food. . To prepare edible coating using whey protein concentrate (WPC),
glycerol, potassium sorbate and nisin used as anti microbial agent. To optimization of level of edible
coating ingredients were designed using Response Surface Methodology (RSM) based on hypothesis that
the response of the product. Design of experiment was carried out by the software: DESIGN EXPERT,
Central Composite Rotatable Design (CCRD) was chosen
Keywords: Paneer, edible coating, Response Surface Methodology (RSM) Introduction
Milk and its products are an excellent source of vital nutrients and functional constituents. It is
described as nature’s nearly perfect food and some leading experts recognize milk and its product as
important constituents of a well balanced, nutritionally adequate diet. Indigenous dairy products have
played an important role in the socioeconomic life of our people since time immemorial. India is
emerging as the largest milk producing country in the world with the milk production of about 94.60
International Journal of Advancements in Research & Technology, Volume 2, Issue3, March-2013 2 ISSN 2278-7763
Copyright © 2013 SciResPub.
million tones in 2008 (Bhasin, 2008). Paneer is one of the popular indigenous dairy products in which the
technique of acid coagulation of milk at high temperature is used to conserve wholesome and unique
nutrients of milk. Paneer is a heat and acid coagulated traditional milk product, mainly consisting
of milk solids obtained from the coagulation of hot milk with permitted organic acid and
subsequent drainage of whey followed by pressing The phenomenon of precipitation involves the
formation of large structural aggregates of protein in which milk fat and other colloidal and soluble solid
are entrained with whey. It is estimated that about five percent of the total milk produced in India is
converted into paneer (Makhal and Sen, 2001) which accounts for about 3, 00,000 tones of paneer
annually valued at rupees 1050 crores. It is estimated that Annual production of paneer was 4,496 MT in
year 2003-04 (Dairy India, 2007). Paneer has a fairly high level of fat and protein, low level of sugar and
contains some important minerals (e.g. calcium) and vitamins. In general paneer contains 55-70 percent
moisture, 22-27 percent fat , 17-18 percent protein , 2.0-2.5 percent lactose , and 1.5- 2.0 percent minerals
(Kanawjia et al, 1990). According to Prevention of Food Adulteration Act (PFA) (1976), paneer should
contain not more than 70 percent moisture and its fat content should not be less than 50 percent of dry
matter where as skim milk paneer should contain not more than 70 percent moisture and the fat content
should not be more than 13 percent of dry matter (Kanawjia et al., 1990). Paneer should contain not more
than 50,000 total bacterial counts, not more than 90 coliform counts and 250 yeast and mould count per
gram of paneer (ISO: 1084, 1983). Paneer is recommended for diabetic patients, dental carries, growing
children and pregnant women due to high calcium and protein (Chopra and Mamtani, 1995). However,
short shelf life is one of the most serious problems faced in marketing and distribution of paneer to the
restaurants and fast food centers, which consume a huge quantity of this product as a base material for
patties, sandwiches, culinary dishes, etc. Paneer has a good market value, but it is not able to find its
rightful place in Indian market due to its short life of about a week under refrigeration and one day at
room temperature. Various chemical preservatives were tried by different scientists singly or in
combination for the preservation of paneer and they succeeded in extending the shelf life to some extent.
Apart from various chemical preservatives natural preservatives are also having promising results in
improvement of shelf life of various dairy products e.g. nisin has been successfully used in a variety of
dairy products. On the other hand use of edible films on the food products could also be utilized as a
protective coating to extend the shelf life. An edible coating/film simply is defined as a thin continuous
layer of edible material formed on or placed between food and food components (Torres, 1994). The most
important functionalities of an edible film or coating include control of mass transfer, mechanical
protection and better sensory appeal. Whey protein based films and coatings are generally flavorless,
International Journal of Advancements in Research & Technology, Volume 2, Issue3, March-2013 3 ISSN 2278-7763
Copyright © 2013 SciResPub.
tasteless and flexible materials, water based, and the films varies from transparent to translucent
depending on formulation, purity of protein sources and composition. In the preservation of paneer edible
coating with antimicrobial agents could be best alternative because this technique is successfully applied
in some dairy products (e.g. Cheese) and other food products (like fruits, confectionary products, and
chocolate etc). The application of edible films and coatings can readily improve the physical strength of
food products, reduce particle clustering and improve visual and tactile feature on product surface (Cuq et
al., 1995). It can protect food products from moisture migration, microbial growth on the surface, light
induced chemical changes, oxidation of nutrients, etc. (Kester and Fennema, 1986).
Objective
1. To improve sensory parameter of paneer
2. To improve textural properties of paneer
Material and methods
Materials
Commercially cow milk was (Livestock Research Center, G.B. Pant University of Agriculture and
Technology, Pantnagar, Distt. Udham Singh Nagar, Uttarakhand) used for preparation of paneer. Coating
material (Whey protein concentrate (DARS specific, Tansen Road, Gwalior, M.P) Glycerol and potassium
sorbate (Himedia Laboraties. Private Limited, 23, Vadhani Mumbai India. Estate) were used in
preparatuion of edibe coating and nisin (Shree Additives Pharma and Food Ltd, Ahemdabad, Gujrat) was
used as a antimicrobial agent.
Preparation of paneer
Milk was first filtered through double layered muslin cloth in order to remove dust and dirt
particles and then separated by centrifugal cream separator (Modern Cream Separator, Dairy Appliances
Corporation, India) for standardization purpose. Buffalo milk was standardized to 6 percent fat and 8.5
percent solid-not-fat (SNF) using buffalo skim milk and cream. The standardized buffalo milk was heated
up to 900C followed by cooling to 700C for coagulation. Heat treatment aids in co-precipitating casein and
whey proteins and also proved to increase the yield of paneer to some extent. Milk samples were
coagulated at 700C + 10C by adding 1 percent citric acid solution slowly to the milk with continuous and
gentle stirring till a complete coagulation occurred and transparent greenish yellow whey separated out
from coagulated mass. After coagulation of milk, the contents were left undisturbed for about five
International Journal of Advancements in Research & Technology, Volume 2, Issue3, March-2013 4 ISSN 2278-7763
Copyright © 2013 SciResPub.
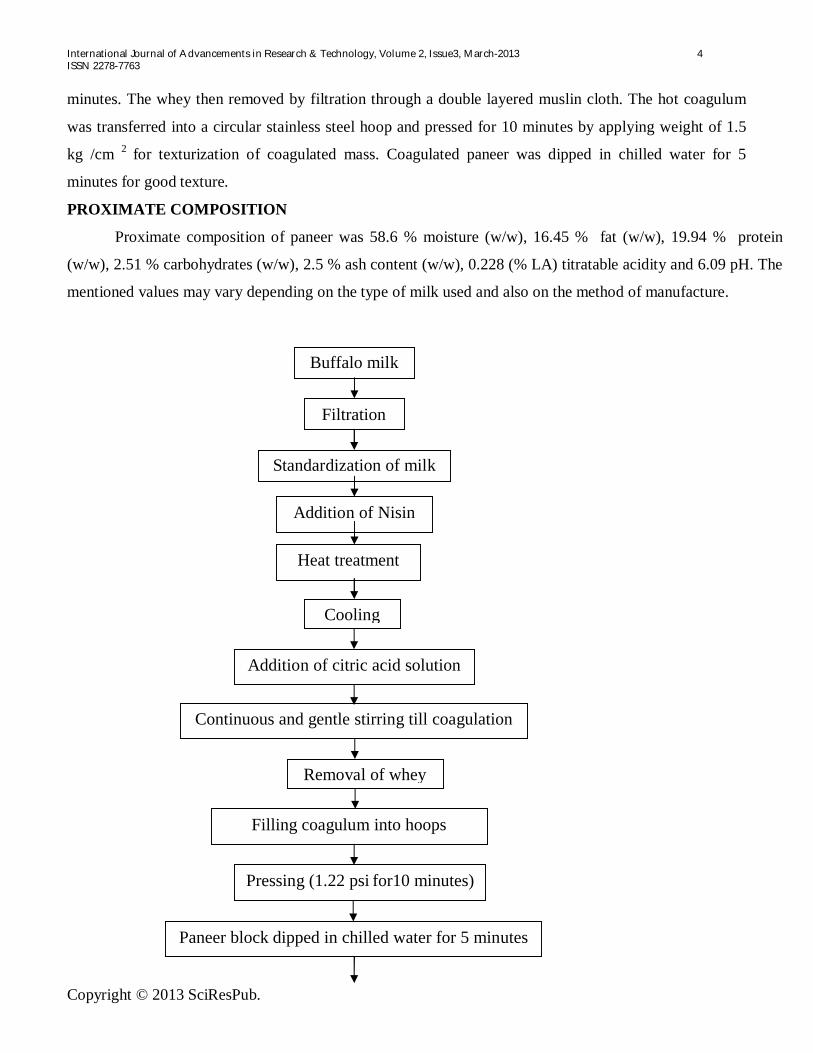
minutes. The whey then removed by filtration through a double layered muslin cloth. The hot coagulum
was transferred into a circular stainless steel hoop and pressed for 10 minutes by applying weight of 1.5
kg /cm 2 for texturization of coagulated mass. Coagulated paneer was dipped in chilled water for 5
minutes for good texture.
PROXIMATE COMPOSITION
Proximate composition of paneer was 58.6 % moisture (w/w), 16.45 % fat (w/w), 19.94 % protein
(w/w), 2.51 % carbohydrates (w/w), 2.5 % ash content (w/w), 0.228 (% LA) titratable acidity and 6.09 pH. The
mentioned values may vary depending on the type of milk used and also on the method of manufacture.
Buffalo milk
Filtration
Standardization of milk
Addition of Nisin
Addition of citric acid solution
Continuous and gentle stirring till coagulation
Pressing (1.22 psi for10 minutes)
Filling coagulum into hoops
Cooling
Removal of whey
Paneer block dipped in chilled water for 5 minutes
Heat treatment
International Journal of Advancements in Research & Technology, Volume 2, Issue3, March-2013 5 ISSN 2278-7763
Copyright © 2013 SciResPub.
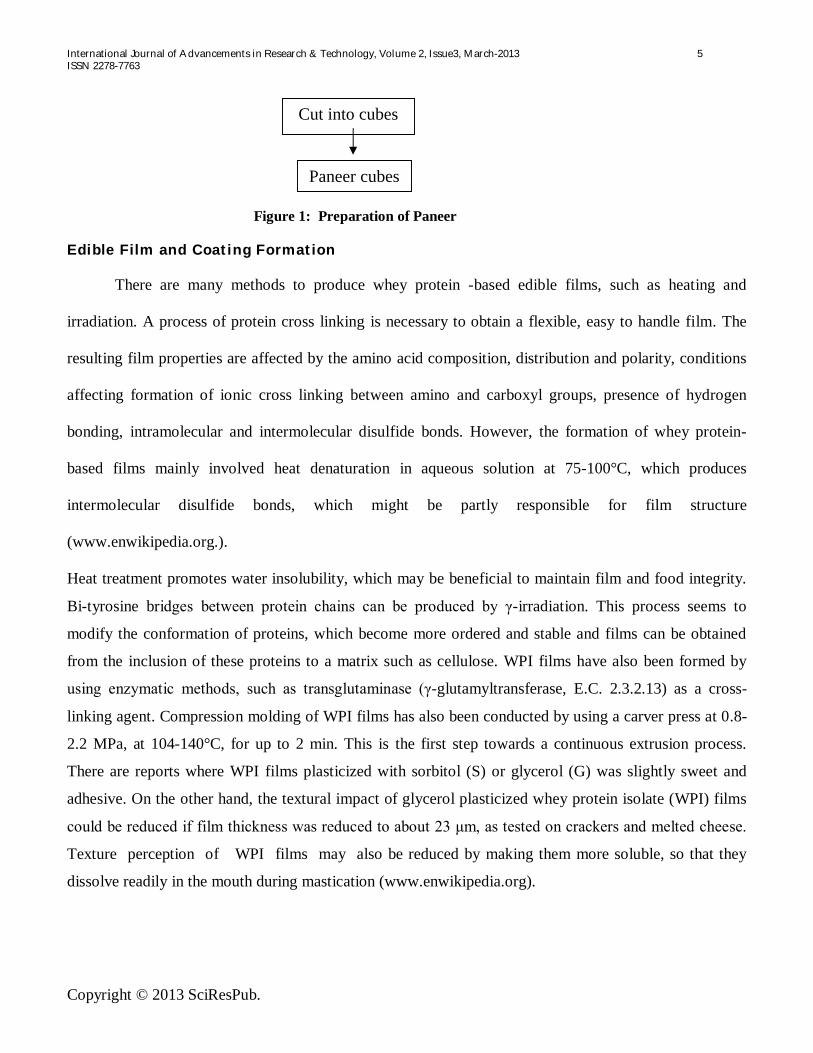
Figure 1: Preparation of Paneer
Edible Film and Coating Formation
There are many methods to produce whey protein -based edible films, such as heating and
irradiation. A process of protein cross linking is necessary to obtain a flexible, easy to handle film. The
resulting film properties are affected by the amino acid composition, distribution and polarity, conditions
affecting formation of ionic cross linking between amino and carboxyl groups, presence of hydrogen
bonding, intramolecular and intermolecular disulfide bonds. However, the formation of whey protein-
based films mainly involved heat denaturation in aqueous solution at 75-100°C, which produces
intermolecular disulfide bonds, which might be partly responsible for film structure
(www.enwikipedia.org.).
Heat treatment promotes water insolubility, which may be beneficial to maintain film and food integrity.
Bi-tyrosine bridges between protein chains can be produced by γ-irradiation. This process seems to
modify the conformation of proteins, which become more ordered and stable and films can be obtained
from the inclusion of these proteins to a matrix such as cellulose. WPI films have also been formed by
using enzymatic methods, such as transglutaminase (γ-glutamyltransferase, E.C. 2.3.2.13) as a cross-
linking agent. Compression molding of WPI films has also been conducted by using a carver press at 0.8-
2.2 MPa, at 104-140°C, for up to 2 min. This is the first step towards a continuous extrusion process.
There are reports where WPI films plasticized with sorbitol (S) or glycerol (G) was slightly sweet and
adhesive. On the other hand, the textural impact of glycerol plasticized whey protein isolate (WPI) films
could be reduced if film thickness was reduced to about 23 μm, as tested on crackers and melted cheese.
Texture perception of WPI films may also be reduced by making them more soluble, so that they
dissolve readily in the mouth during mastication (www.enwikipedia.org).
Cut into cubes
Paneer cubes
International Journal of Advancements in Research & Technology, Volume 2, Issue3, March-2013 6 ISSN 2278-7763
Copyright © 2013 SciResPub.
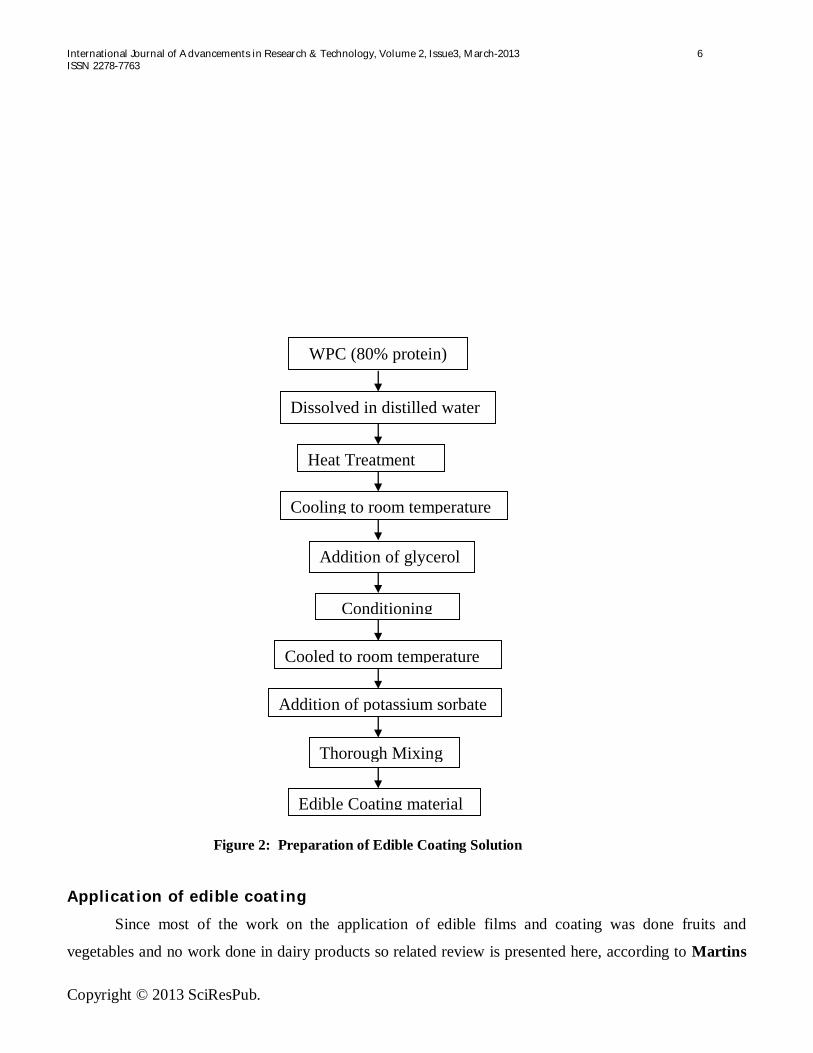
Figure 2: Preparation of Edible Coating Solution Application of edible coating
Since most of the work on the application of edible films and coating was done fruits and
vegetables and no work done in dairy products so related review is presented here, according to Martins
WPC (80% protein)
Dissolved in distilled water
Heat Treatment
Cooling to room temperature
Addition of glycerol
Conditioning
Cooled to room temperature
Addition of potassium sorbate
Thorough Mixing
Edible Coating material
International Journal of Advancements in Research & Technology, Volume 2, Issue3, March-2013 7 ISSN 2278-7763
Copyright © 2013 SciResPub.
et al., (2003), alginate and gelatin coating at different concentrations with plasticizers such as glycerol and
carboxymethyl-cellulose (CMC) and sucroesters coating plasticized with mono/diglycerides were tested.
The effects of those coating on the storage stability were followed by measurements of peel and pulp
firmness. The 2 percent alginate and 5 percent gelatin coating significantly reduced weight loss, thus
maintaining fruit firmness and thereby preserving fruit freshness. The effect of these coatings includes the
improving appearance and imparting an attractive natural looking sheen to the fruit.
Dangaran et al., (2006) worked on whey protein-sucrose coating and reported that whey protein coating
protects foods from deterioration and can extend product shelf life. Whey protein coatings may also
undergo change over a period of time if not properly formulated. Whey protein isolates sucrose, high
gloss coatings, with and without crystallization inhibitors, were formed on chocolate covered
peanuts. WPI coating containing raffinose had significantly higher gloss values. Edible coating of WPI
can be used to improve the effectiveness of water based high gloss edible coatings.
Han and Krochta (2007) studied physical properties of whey protein coating solution and films
containing antioxidants. Antioxidants (ascorbyl palmitate and alfa- tocopherol) were incorporated into 10
percent of whey protein isolate (WPI) (w/w) and coating solution containing 6.67 percent (w/w) glycerol
(WPI:glycerol= 6:4) were studied. The antioxidants mixture was incorporated into heat denatured whey
protein solution and viscosity and turbidity to determine transparency and oxygen barrier properties
(permeability, diffusivity, and solubility). WPI film and antioxidant containing WPI film had very low
oxygen permeability and solubility.
According to Kim (2002) the shelf life of grape by edible coating material such as methyl
cellulose (MC) which antimicrobial substances such as n- capric acid isopropyl ester (Ci) and sodium
nitrate (sn) added and coating applied on grapes by spraying method. The quality changes of packaged
grapes with wrapping PE film on EPS tray were investigated for 16 days at 30oC. The reduction in rate
of firmness of grape, MCsn and MCCi after 16 days at 30oC were 42.2, 26.5 and 23.2 percent
respectively. The addition of Ci and Sn had much affected the reduction of bacteria and yeast counts
especially at early stage of storage.
According to Bravin et al., (2006), edible coating of polysaccharide- lipid film composed of corn starch,
methylcellulose (MC) and soybean oil had effective moisture transfer control in moisture sensitive
products. It was evaluated by coating crackers, a low water activity type cereal food. Spread film gave
better water vapour barrier and mechanical properties than sprayed film. Coated crackers had longer shelf
life and higher reference at all storage conditions.
International Journal of Advancements in Research & Technology, Volume 2, Issue3, March-2013 8 ISSN 2278-7763
Copyright © 2013 SciResPub.
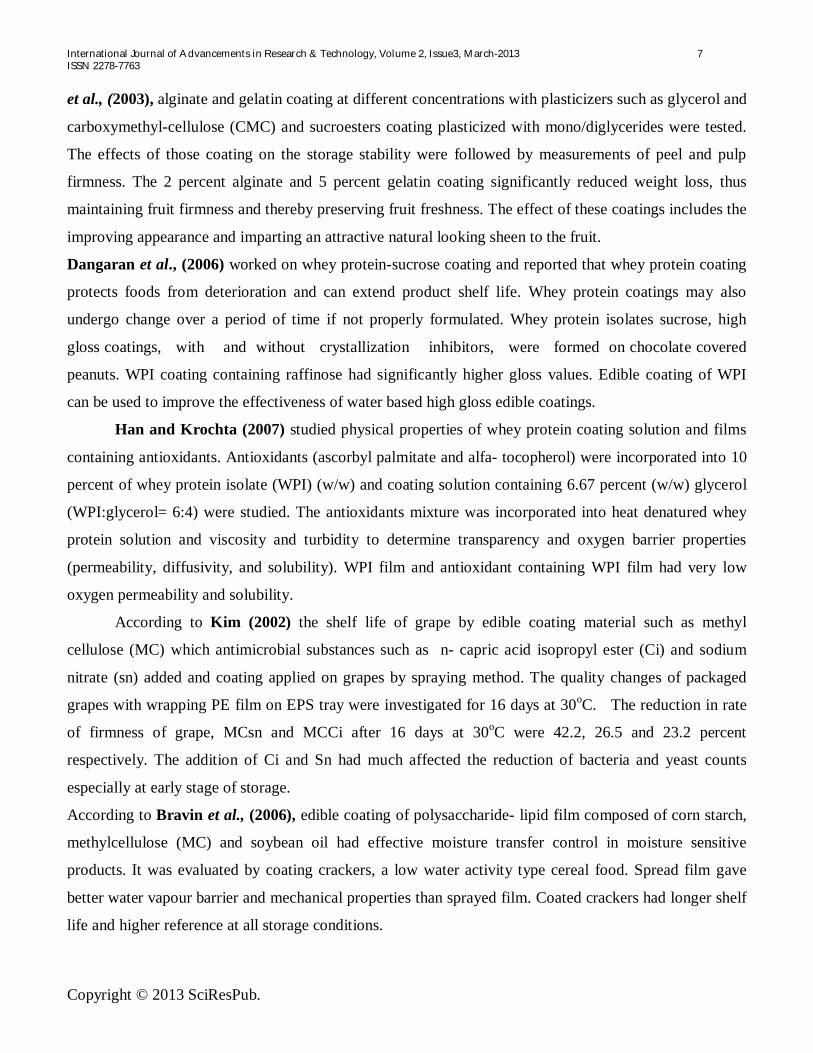
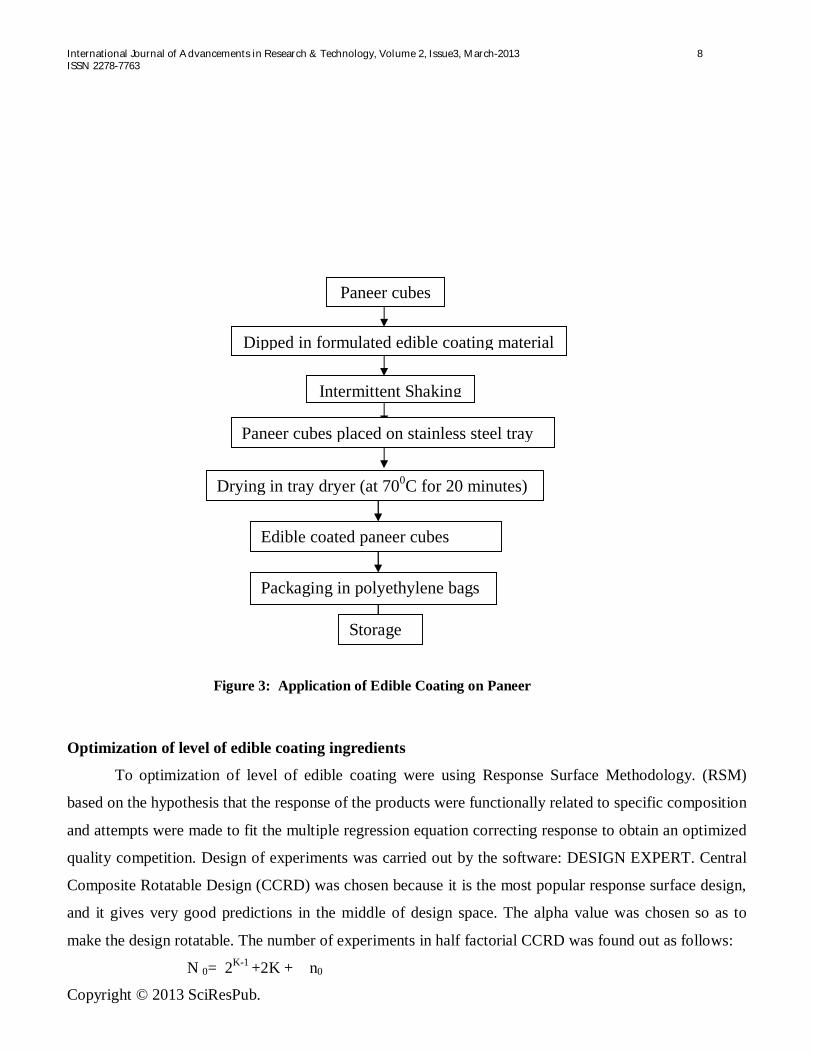
Figure 3: Application of Edible Coating on Paneer
Optimization of level of edible coating ingredients
To optimization of level of edible coating were using Response Surface Methodology. (RSM)
based on the hypothesis that the response of the products were functionally related to specific composition
and attempts were made to fit the multiple regression equation correcting response to obtain an optimized
quality competition. Design of experiments was carried out by the software: DESIGN EXPERT. Central
Composite Rotatable Design (CCRD) was chosen because it is the most popular response surface design,
and it gives very good predictions in the middle of design space. The alpha value was chosen so as to
make the design rotatable. The number of experiments in half factorial CCRD was found out as follows:
N 0= 2K-1 +2K + n0
Paneer cubes
Dipped in formulated edible coating material
Paneer cubes placed on stainless steel tray
Drying in tray dryer (at 700C for 20 minutes)
Edible coated paneer cubes
Packaging in polyethylene bags
Intermittent Shaking
Storage
International Journal of Advancements in Research & Technology, Volume 2, Issue3, March-2013 9 ISSN 2278-7763
Copyright © 2013 SciResPub.
where,
K = Number of independent variables
N 0= Number of experiment design
n0 = Number of center point replicates, which in this design is 6
The experimental plan consists of 30 experiments (Table 3.1). The first sixteen experiments were in first
order. The next eight experiments were in second order, and the last 6 experiments were centre point
replicates. All the 30 experiments were carried out in a random order.
Analysis of paneer
Sensory evaluation
The paneer samples with edible coating were evaluated for its acceptability, during the process of
optimization and storage studies. For sensory evaluation paneer samples were served to a panel of five
semi-trained panelists consisting of faculty from the department of Food Science and Technology in the
University. The panelists were asked to evaluate the sensory quality of paneer samples as per sensory
score card (Appendix-I). Panel members were directed to judge each samples on the basis appearance,
flavor, body and texture and overall acceptability, and indicate their degree of liking on a 9-point Hedonic
Scale (Lawless and Hayman, 1998).
Evaluation of texture
Textural profile analysis was conducted for paneer samples for all experiments to obtain textural
responses viz, hardness, springiness, adhesiveness, cohesiveness, gumminess and chewiness.
Statistical analysis
Results obtained were statistically analyzed in completely randomized design (CRD) and
ANOVA technique on four factors simple CRD according to methods described by Cochran (1980) and
Snedecor and Cochran (1967), respectively.
Data Analysis
RSM was used to determine the effect of the independent variables statistically. A full second
order mathematical model of the following form was fitted to all the response data.
For statistical analysis of the experiments designed by the RSM , it was assumed that n mathematical
functions, fk (k= 1,2,3,…………..n), existed for each response variable, Yk in terms of m independents
processing factors Xi (i= 1,2,3………….m).
Yk = fk (X1, X2, X3........................... Xm)
International Journal of Advancements in Research & Technology, Volume 2, Issue3, March-2013 10 ISSN 2278-7763
Copyright © 2013 SciResPub.
In this case n= 15 and m = 4. The function was assumed to be approximated by a second degree
polynomial equation.
K K K-1 K Yk = βk0 + ∑ β1 X1 + ∑ βii Xi
2 + ∑ ∑ βij Xi Xj………………………..
i=1 i=1 i=1 j=i+1
Where, bk0 is the value of the fitted response at the center point of the design, i.e. point (0,0,0,0)
and bk0, bkii, and bkij, are the linear, quadratic and cross product regression terms, respectively. Data were
analyzed using the statistical package DESIGN EXPERT 7.0.
Results and discussion
The fat: solid not fat content of the buffalo milk used for preparing paneer (1:1.65). The levels of
variable were optimization of paneer with edible coating on the basis of coefficient of determination (R2).
Optimization of ingredient levels for pH, acidity, and water activity, sensory and textural parameters of
paneer. The software “DESIGN EXPERT used for getting the optimum combination of ingredients.
Optimization of ingredient levels on cost of product, characteristics, legal obligation and shelf life of the
product. The parameter optimized using the response surface methodology were pH, acidity water
activity, appearance, flavour, body and texture and overall acceptability and textural parameter
(hardness, adhesiveness, springiness, cohesiveness, gumminess and chewiness).
Sensory analysis
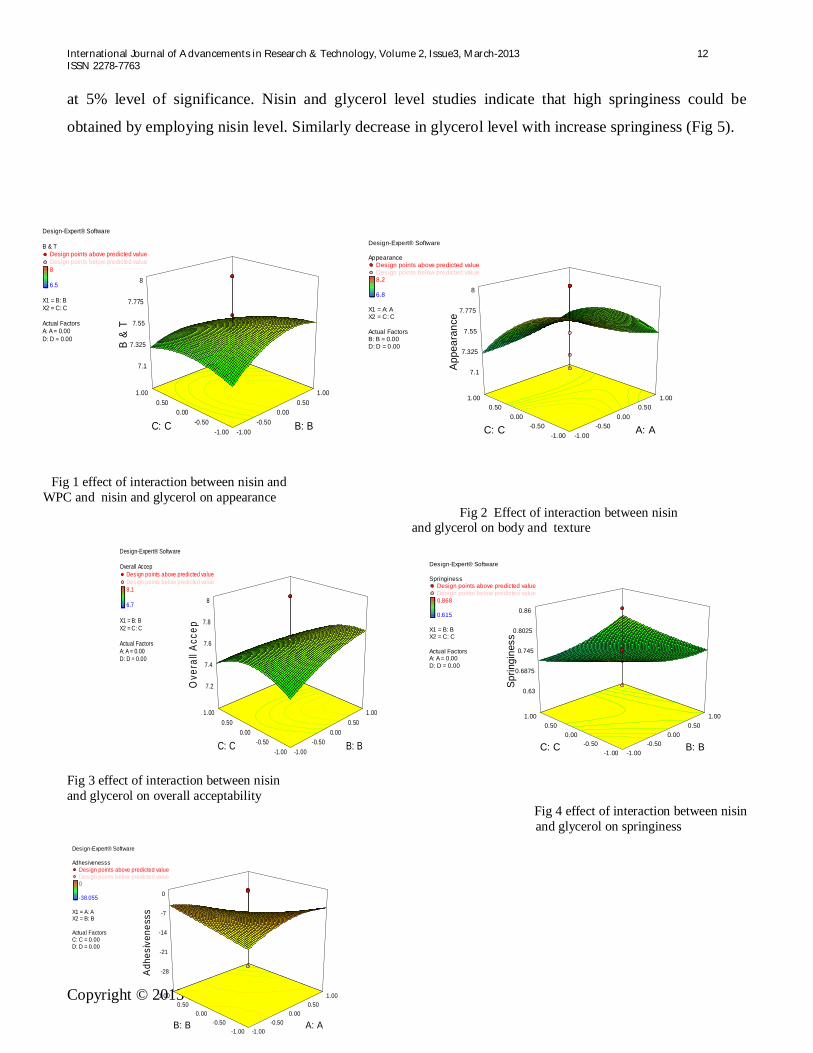
Appearance
The color and appearance score of paneer range from 6.8 to 8.2 which had levels of 8 percent to 6
percent whey protein concentrate. 6 percent whey protein concentrate showed better sensory appearance
score than at 8 percent levels of whey protein concentrate. The coefficient of determination (R2) for the
regression modal for appearance was 59.2 percent. The representation of the response surface is given in
Fig 1. The expression of the model permitted the evaluation of the factors. The increase in nisin level
decrease appearance. Similarly the increase in WPC level decrease appearance. The increase in WPC
level with decrease appearance resulted yellowish appearance. Interactive effect of nisin and glycerol
level increase in glycerol level increase appearance.
Flavour
The average flavour score of paneer varied from 6.9 to 8. The level of WPC, glycerol, and
potassium sorbate and nice were 6, 7, 1.3 percent and 10 ppm respectively. The coefficient of
International Journal of Advancements in Research & Technology, Volume 2, Issue3, March-2013 11 ISSN 2278-7763
Copyright © 2013 SciResPub.
determination (R2) for the regression modal for flavour was 41.3 percent.
Body & texture
Body and texture score varied from 6.5 to 8. Data was showing that whey protein concentrates not
much affect the body and texture. But level of glycerol affects the body and texture. 5 percent and 7
percent level of glycerol give better sensory score than 1 percent level of glycerol. The coefficient of
determination (R2) for regression model for body and texture was 55.27 percent. The representation of the
response surface is given in Fig 2. The increase in nisin increase body and texture first and then decrease
and most significant. The decrease body and texture with increase level of nisin resulted more hard
texture. Similarly the increase in glycerol level increase body and texture first and then decrease.
Overall acceptability
The overall acceptability score for paneer ranged between 6.7 to 8 percent. Decrease level of nisin
and potassium sorbate give better sensory score than the upper level. The coefficient of determination (R2)
for regression model for overall acceptability was 48.14. Fig: 3 shows that the response surface of nisin
and glycerol on overall acceptability. An addition of nisin affects OA significantly and increase nisin
level increase OA first then decreases. Similarly the increase in glycerol level increase OA.
Textural Profile Analysis (TPA)
Adhesiveness
The adhesiveness of paneer was range between -0.048 to -0.38.05). The combination of
ingredients level of whey protein concentrate, glycerol, potassium sorbate and nisin are 10, 3, 0.7% and 5
ppm respectively. The coefficient of determination (R2) for the regression model for adhesiveness was
36.93%, which implies that the model could account for 36.93%, data. Lack of fit was non-significant for
the adhesiveness. Interaction of whey protein concentrate with glycerol was significant at 10% level of
significance. Fig 4 show that the response surface of nisin and glycerol on adhesiveness. The maximum
adhesiveness occurred with increased level of glycerol and similarly effect, increase WPC level increase
adhesiveness first then decrease. Increase level of WPC made high concentrated coating solution.
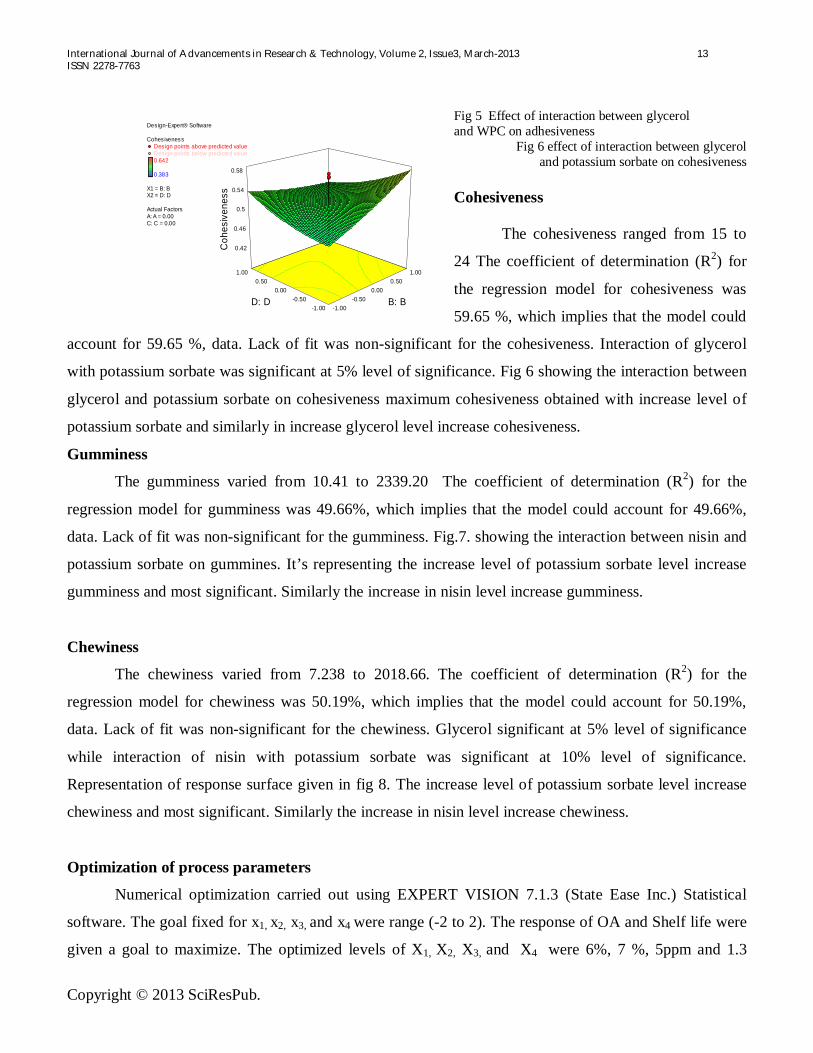
Springiness
The springiness of paneer varied from 0.615 to 0.868. The coefficient of determination (R2) for the
regression model for springiness was 48.81%, which implies that the model could account for 48.81%,
data. Lack of fit was non-significant for the sprinsiness. Interaction of potassium sorbate was significant
International Journal of Advancements in Research & Technology, Volume 2, Issue3, March-2013 12 ISSN 2278-7763
Copyright © 2013 SciResPub.
at 5% level of significance. Nisin and glycerol level studies indicate that high springiness could be
obtained by employing nisin level. Similarly decrease in glycerol level with increase springiness (Fig 5).
Design-Expert® Software
AppearanceDesign points above predicted valueDesign points below predicted value8.2
6.8
X1 = A: AX2 = C: C
Actual FactorsB: B = 0.00D: D = 0.00
-1.00 -0.50
0.00 0.50
1.00
-1.00 -0.50
0.00 0.50
1.00
7.1
7.325
7.55
7.775
8
App
eara
nce
A: A C: C
Fig 1 effect of interaction between nisin and WPC and nisin and glycerol on appearance
Fig 2 Effect of interaction between nisin and glycerol on body and texture
Design-Expert® Software
Overall AccepDesign points above predicted valueDesign points below predicted value8.1
6.7
X1 = B: BX2 = C: C
Actual FactorsA: A = 0.00D: D = 0.00
-1.00 -0.50
0.00 0.50
1.00
-1.00 -0.50
0.00 0.50
1.00
7.2
7.4
7.6
7.8
8
Ove
rall
Acce
p
B: B C: C
Design-Expert® Software
SpringinessDesign points above predicted valueDesign points below predicted value0.868
0.615
X1 = B: BX2 = C: C
Actual FactorsA: A = 0.00D: D = 0.00
-1.00 -0.50
0.00 0.50
1.00
-1.00 -0.50
0.00 0.50
1.00
0.63
0.6875
0.745
0.8025
0.86
Spr
ingi
ness
B: B C: C
Fig 3 effect of interaction between nisin and glycerol on overall acceptability
Fig 4 effect of interaction between nisin and glycerol on springiness
Design-Expert® Software
B & TDesign points above predicted valueDesign points below predicted value8
6.5
X1 = B: BX2 = C: C
Actual FactorsA: A = 0.00D: D = 0.00
-1.00 -0.50
0.00 0.50
1.00
-1.00 -0.50
0.00 0.50
1.00
7.1
7.325
7.55
7.775
8
B &
T
B: B C: C
Design-Expert® Software
AdhesivenesssDesign points above predicted valueDesign points below predicted value0
-38.055
X1 = A: AX2 = B: B
Actual FactorsC: C = 0.00D: D = 0.00
-1.00 -0.50
0.00 0.50
1.00
-1.00 -0.50
0.00 0.50
1.00
-28
-21
-14
-7
0
Adh
esiv
enes
ss
A: A B: B
International Journal of Advancements in Research & Technology, Volume 2, Issue3, March-2013 13 ISSN 2278-7763
Copyright © 2013 SciResPub.
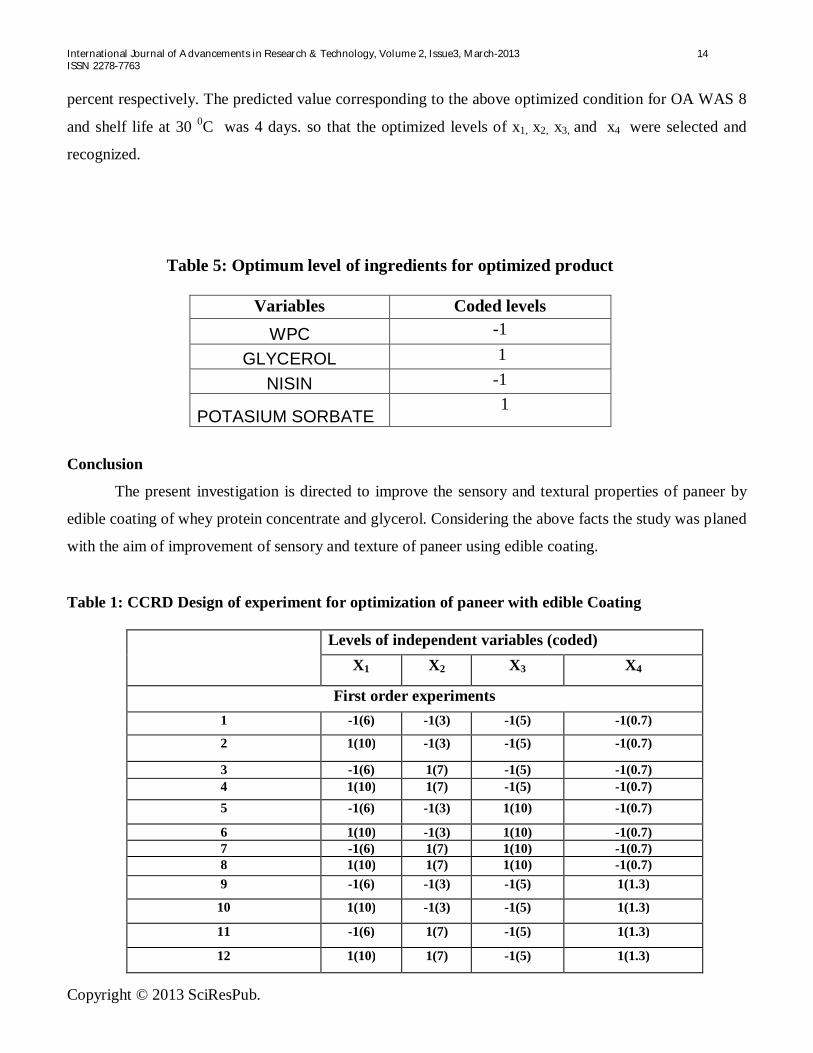
Fig 5 Effect of interaction between glycerol and WPC on adhesiveness
Fig 6 effect of interaction between glycerol and potassium sorbate on cohesiveness
Cohesiveness
The cohesiveness ranged from 15 to
24 The coefficient of determination (R2) for
the regression model for cohesiveness was
59.65 %, which implies that the model could
account for 59.65 %, data. Lack of fit was non-significant for the cohesiveness. Interaction of glycerol
with potassium sorbate was significant at 5% level of significance. Fig 6 showing the interaction between
glycerol and potassium sorbate on cohesiveness maximum cohesiveness obtained with increase level of
potassium sorbate and similarly in increase glycerol level increase cohesiveness.
Gumminess
The gumminess varied from 10.41 to 2339.20 The coefficient of determination (R2) for the
regression model for gumminess was 49.66%, which implies that the model could account for 49.66%,
data. Lack of fit was non-significant for the gumminess. Fig.7. showing the interaction between nisin and
potassium sorbate on gummines. It’s representing the increase level of potassium sorbate level increase
gumminess and most significant. Similarly the increase in nisin level increase gumminess.
Chewiness
The chewiness varied from 7.238 to 2018.66. The coefficient of determination (R2) for the
regression model for chewiness was 50.19%, which implies that the model could account for 50.19%,
data. Lack of fit was non-significant for the chewiness. Glycerol significant at 5% level of significance
while interaction of nisin with potassium sorbate was significant at 10% level of significance.
Representation of response surface given in fig 8. The increase level of potassium sorbate level increase
chewiness and most significant. Similarly the increase in nisin level increase chewiness.
Optimization of process parameters
Numerical optimization carried out using EXPERT VISION 7.1.3 (State Ease Inc.) Statistical
software. The goal fixed for x1, x2, x3, and x4 were range (-2 to 2). The response of OA and Shelf life were
given a goal to maximize. The optimized levels of X1, X2, X3, and X4 were 6%, 7 %, 5ppm and 1.3
Design-Expert® Software
Cohes ivenessDesign points above predicted valueDesign points below predicted value0.642
0.383
X1 = B: BX2 = D: D
Actual FactorsA: A = 0.00C: C = 0.00
-1.00 -0.50
0.00 0.50
1.00
-1.00 -0.50
0.00 0.50
1.00
0.42
0.46
0.5
0.54
0.58
Coh
esiv
enes
s
B: B D: D
International Journal of Advancements in Research & Technology, Volume 2, Issue3, March-2013 14 ISSN 2278-7763
Copyright © 2013 SciResPub.
percent respectively. The predicted value corresponding to the above optimized condition for OA WAS 8
and shelf life at 30 0C was 4 days. so that the optimized levels of x1, x2, x3, and x4 were selected and
recognized.
Table 5: Optimum level of ingredients for optimized product
Variables Coded levels WPC -1
GLYCEROL 1
NISIN -1
POTASIUM SORBATE 1
Conclusion
The present investigation is directed to improve the sensory and textural properties of paneer by
edible coating of whey protein concentrate and glycerol. Considering the above facts the study was planed
with the aim of improvement of sensory and texture of paneer using edible coating.
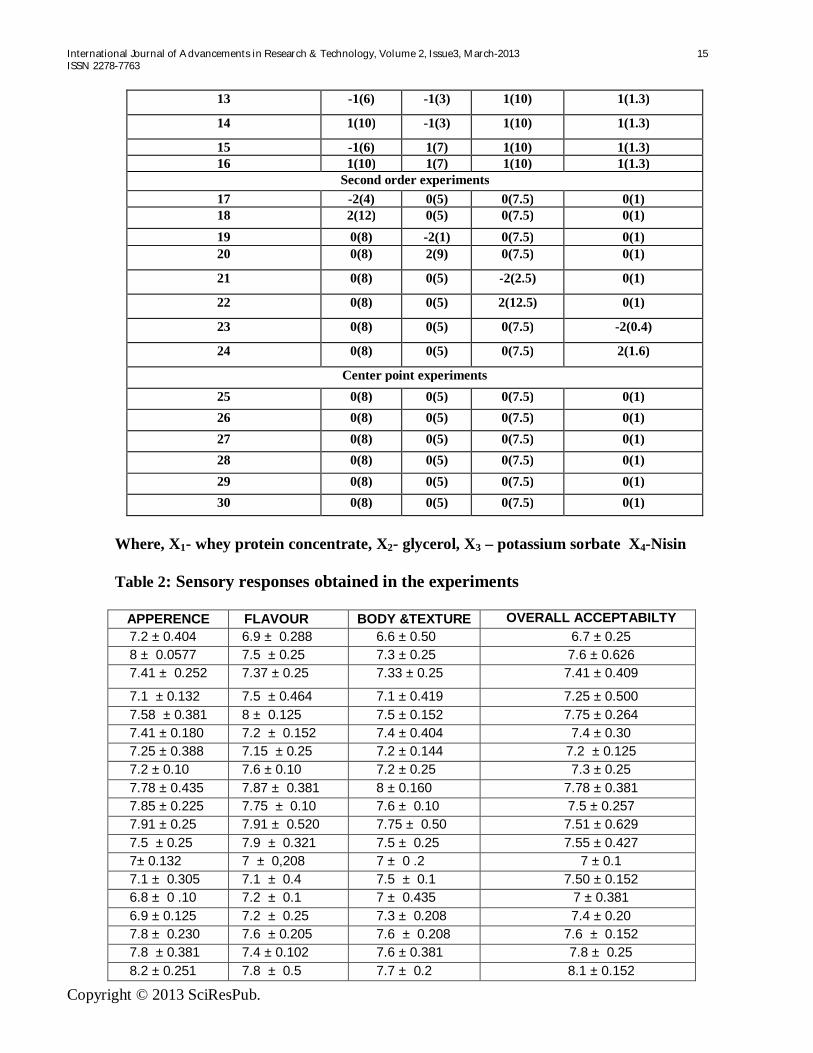
Table 1: CCRD Design of experiment for optimization of paneer with edible Coating
Levels of independent variables (coded) X1 X2 X3 X4
First order experiments 1 -1(6) -1(3) -1(5) -1(0.7)
2 1(10) -1(3) -1(5) -1(0.7)
3 -1(6) 1(7) -1(5) -1(0.7) 4 1(10) 1(7) -1(5) -1(0.7) 5 -1(6) -1(3) 1(10) -1(0.7)
6 1(10) -1(3) 1(10) -1(0.7) 7 -1(6) 1(7) 1(10) -1(0.7) 8 1(10) 1(7) 1(10) -1(0.7) 9 -1(6) -1(3) -1(5) 1(1.3)
10 1(10) -1(3) -1(5) 1(1.3)
11 -1(6) 1(7) -1(5) 1(1.3)
12 1(10) 1(7) -1(5) 1(1.3)
International Journal of Advancements in Research & Technology, Volume 2, Issue3, March-2013 15 ISSN 2278-7763
Copyright © 2013 SciResPub.
13 -1(6) -1(3) 1(10) 1(1.3)
14 1(10) -1(3) 1(10) 1(1.3)
15 -1(6) 1(7) 1(10) 1(1.3) 16 1(10) 1(7) 1(10) 1(1.3)
Second order experiments 17 -2(4) 0(5) 0(7.5) 0(1) 18 2(12) 0(5) 0(7.5) 0(1) 19 0(8) -2(1) 0(7.5) 0(1) 20 0(8) 2(9) 0(7.5) 0(1)
21 0(8) 0(5) -2(2.5) 0(1)
22 0(8) 0(5) 2(12.5) 0(1)
23 0(8) 0(5) 0(7.5) -2(0.4)
24 0(8) 0(5) 0(7.5) 2(1.6)
Center point experiments 25 0(8) 0(5) 0(7.5) 0(1) 26 0(8) 0(5) 0(7.5) 0(1) 27 0(8) 0(5) 0(7.5) 0(1) 28 0(8) 0(5) 0(7.5) 0(1) 29 0(8) 0(5) 0(7.5) 0(1) 30 0(8) 0(5) 0(7.5) 0(1)
Where, X1- whey protein concentrate, X2- glycerol, X3 – potassium sorbate X4-Nisin Table 2: Sensory responses obtained in the experiments
APPERENCE FLAVOUR BODY &TEXTURE OVERALL ACCEPTABILTY 7.2 ± 0.404 6.9 ± 0.288 6.6 ± 0.50 6.7 ± 0.25 8 ± 0.0577 7.5 ± 0.25 7.3 ± 0.25 7.6 ± 0.626 7.41 ± 0.252 7.37 ± 0.25 7.33 ± 0.25 7.41 ± 0.409
7.1 ± 0.132 7.5 ± 0.464 7.1 ± 0.419 7.25 ± 0.500 7.58 ± 0.381 8 ± 0.125 7.5 ± 0.152 7.75 ± 0.264 7.41 ± 0.180 7.2 ± 0.152 7.4 ± 0.404 7.4 ± 0.30 7.25 ± 0.388 7.15 ± 0.25 7.2 ± 0.144 7.2 ± 0.125 7.2 ± 0.10 7.6 ± 0.10 7.2 ± 0.25 7.3 ± 0.25 7.78 ± 0.435 7.87 ± 0.381 8 ± 0.160 7.78 ± 0.381 7.85 ± 0.225 7.75 ± 0.10 7.6 ± 0.10 7.5 ± 0.257 7.91 ± 0.25 7.91 ± 0.520 7.75 ± 0.50 7.51 ± 0.629 7.5 ± 0.25 7.9 ± 0.321 7.5 ± 0.25 7.55 ± 0.427 7± 0.132 7 ± 0,208 7 ± 0 .2 7 ± 0.1 7.1 ± 0.305 7.1 ± 0.4 7.5 ± 0.1 7.50 ± 0.152 6.8 ± 0 .10 7.2 ± 0.1 7 ± 0.435 7 ± 0.381 6.9 ± 0.125 7.2 ± 0.25 7.3 ± 0.208 7.4 ± 0.20 7.8 ± 0.230 7.6 ± 0.205 7.6 ± 0.208 7.6 ± 0.152 7.8 ± 0.381 7.4 ± 0.102 7.6 ± 0.381 7.8 ± 0.25 8.2 ± 0.251 7.8 ± 0.5 7.7 ± 0.2 8.1 ± 0.152
International Journal of Advancements in Research & Technology, Volume 2, Issue3, March-2013 16 ISSN 2278-7763
Copyright © 2013 SciResPub.
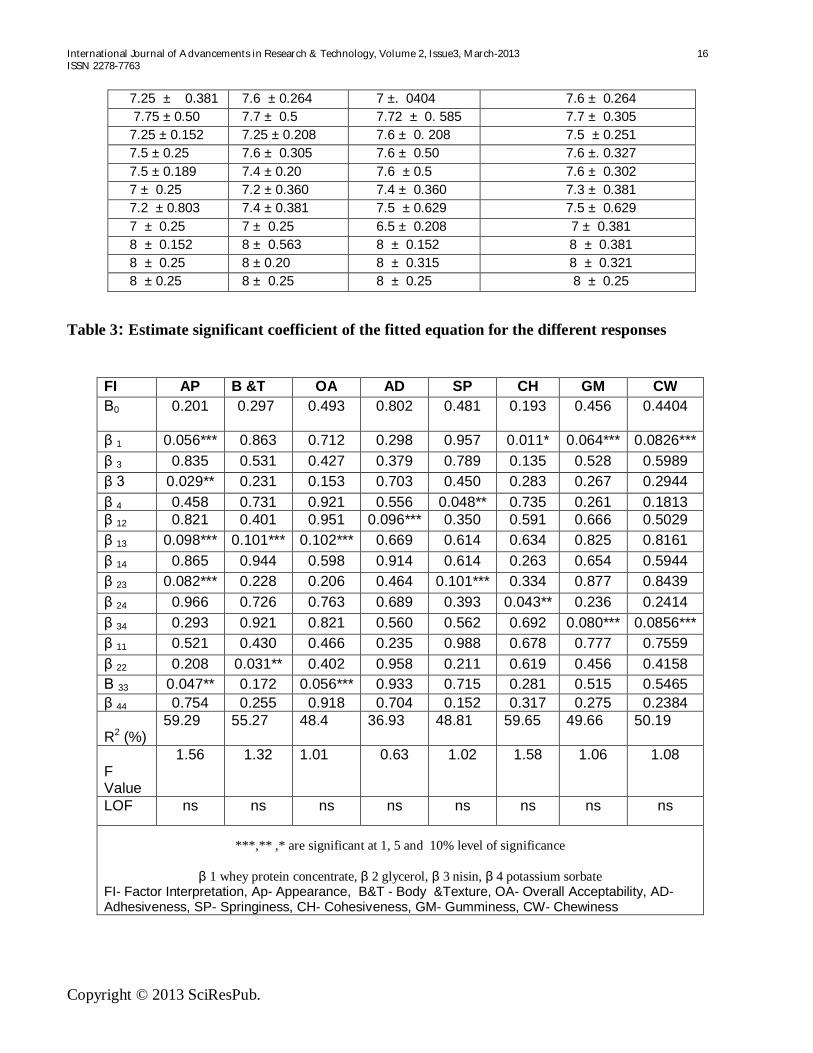
7.25 ± 0.381 7.6 ± 0.264 7 ±. 0404 7.6 ± 0.264 7.75 ± 0.50 7.7 ± 0.5 7.72 ± 0. 585 7.7 ± 0.305 7.25 ± 0.152 7.25 ± 0.208 7.6 ± 0. 208 7.5 ± 0.251 7.5 ± 0.25 7.6 ± 0.305 7.6 ± 0.50 7.6 ±. 0.327 7.5 ± 0.189 7.4 ± 0.20 7.6 ± 0.5 7.6 ± 0.302 7 ± 0.25 7.2 ± 0.360 7.4 ± 0.360 7.3 ± 0.381 7.2 ± 0.803 7.4 ± 0.381 7.5 ± 0.629 7.5 ± 0.629 7 ± 0.25 7 ± 0.25 6.5 ± 0.208 7 ± 0.381 8 ± 0.152 8 ± 0.563 8 ± 0.152 8 ± 0.381 8 ± 0.25 8 ± 0.20 8 ± 0.315 8 ± 0.321 8 ± 0.25 8 ± 0.25 8 ± 0.25 8 ± 0.25
Table 3: Estimate significant coefficient of the fitted equation for the different responses
FI AP B &T OA AD SP CH GM CW Β0
0.201 0.297 0.493 0.802 0.481 0.193 0.456 0.4404
β 1 0.056*** 0.863 0.712 0.298 0.957 0.011* 0.064*** 0.0826*** β 3 0.835 0.531 0.427 0.379 0.789 0.135 0.528 0.5989 β 3 0.029** 0.231 0.153 0.703 0.450 0.283 0.267 0.2944 β 4 0.458 0.731 0.921 0.556 0.048** 0.735 0.261 0.1813 β 12 0.821 0.401 0.951 0.096*** 0.350 0.591 0.666 0.5029 β 13 0.098*** 0.101*** 0.102*** 0.669 0.614 0.634 0.825 0.8161 β 14 0.865 0.944 0.598 0.914 0.614 0.263 0.654 0.5944 β 23 0.082*** 0.228 0.206 0.464 0.101*** 0.334 0.877 0.8439 β 24 0.966 0.726 0.763 0.689 0.393 0.043** 0.236 0.2414 β 34 0.293 0.921 0.821 0.560 0.562 0.692 0.080*** 0.0856*** β 11 0.521 0.430 0.466 0.235 0.988 0.678 0.777 0.7559 β 22 0.208 0.031** 0.402 0.958 0.211 0.619 0.456 0.4158 Β 33 0.047** 0.172 0.056*** 0.933 0.715 0.281 0.515 0.5465 β 44 0.754 0.255 0.918 0.704 0.152 0.317 0.275 0.2384 R2 (%)
59.29 55.27 48.4 36.93 48.81 59.65 49.66 50.19
F Value
1.56 1.32 1.01 0.63 1.02 1.58 1.06 1.08
LOF ns ns ns ns ns ns ns ns
***,** ,* are significant at 1, 5 and 10% level of significance
β 1 whey protein concentrate, β 2 glycerol, β 3 nisin, β 4 potassium sorbate
FI- Factor Interpretation, Ap- Appearance, B&T - Body &Texture, OA- Overall Acceptability, AD- Adhesiveness, SP- Springiness, CH- Cohesiveness, GM- Gumminess, CW- Chewiness
International Journal of Advancements in Research & Technology, Volume 2, Issue3, March-2013 17 ISSN 2278-7763
Copyright © 2013 SciResPub.
Literature Cited
Bhasin, N.R. 2008. Presidents desk. Indian Dairyman. 60 (12):3.
Chopra, S. and Mamtani, R. 1995. Soy Paneer or Paneer. Indian Dairyman. 47 (8): 27-29.
Cuq, B., Gontard, N. and Guilbert, S. 1995. Edible films and coating as active layers. In: Active packaging (M. Rooney, ed.), Blackie, Glasgow, U.K. pp. 111-142.
Dairy India. 2007. 6th Edition. Thompson Press, New Delhi. pp 25-28.
FDA. 1988. Nisin preparation: affirmation of GRAS status as direct human food ingredient. Food and Drug Admin. Fed. Reg., 53:11-47.
Indian Standards. 1983. Indian standards specification, IS:10484. Indian standards Institution, Manak Bhavan, New Delhi.
Kanawjia, S.K., Roy, S.K. and Singh, S.K. 1990. Paneer technology and its diversification. Indian Dairyman, 42 (9): 390-393.
Kester, J.J and Fennema, O. R. 1986. Edible Film and Coating: A Review. Indian J. Dairy Sci., 40(8): 42-49.
Lawless, H.T. and Haymann, H. 1998. Consumer field tests and questionnaire design. Sensory evaluation of food (Lawless, H.T. and Haymann, fields.). Chapmann and Hall New York, pp 480-518.
Makhal, S. and Sen, D.C. 2001. Exploration of attributes influencing the quality of paneer- A review. J. Dairying Foods and Home Science, 20 (2):71-79.
PFA. 1976. Prevention of Food Adulteration rules. Delhi International Law Book Company.
International Journal of Advancements in Research & Technology, Volume 2, Issue3, March-2013 18 ISSN 2278-7763
Copyright © 2013 SciResPub.
Torres J. A. 1994. Edible film and coating from protein. In protein functionality in food system. pp. 467-507.