Embed Size (px)
Citation preview
1
Author: Filbrandt, Katelyn R.
Title: Effect of Pumpkin Seed Oil Cake on the Textural and Sensory Properties of White Wheat
Bread
The accompanying research report is submitted to the University of Wisconsin-Stout, Graduate School
in partial completion of the requirements for the
Graduate Degree/ Major: MS Food & Nutritional Sciences
Research Adviser: Hans Zoerb, Ph.D.
Submission Term/Year: Spring, 2012
Number of Pages: 70
Style Manual Used: American Psychological Association, 6th
edition
I understand that this research report must be officially approved by the Graduate
School and that an electronic copy of the approved version will be made available through
the University Library website
I attest that the research report is my original work (that any copyrightable materials
have been used with the permission of the original authors), and as such, it is automatically
protected by the laws, rules, and regulations of the U.S. Copyright Office.
My research adviser has approved the content and quality of this paper.
STUDENT:
NAME Katelyn R. Filbrandt DATE: 02/22/12
ADVISER: (Committee Chair if MS Plan A or EdS Thesis or Field Project/Problem):
NAME Hans Zoerb, PhD DATE: 2/22/12
---------------------------------------------------------------------------------------------------------------------
This section for MS Plan A Thesis or EdS Thesis/Field Project papers only
Committee members (other than your adviser who is listed in the section above)
1. CMTE MEMBER’S NAME: DATE:
2. CMTE MEMBER’S NAME: DATE:
3. CMTE MEMBER’S NAME: DATE:
This section to be completed by the Graduate School
This final research report has been approved by the Graduate School.
Director, Office of Graduate Studies: DATE:
2
Filbrandt, Katelyn R. Effect of Pumpkin Seed Oil Cake on the Textural and Sensory
Properties of White Wheat Bread
Abstract
Pumpkin seed cake (PSC) is an underutilized by-product from pumpkin seed oil
extraction. It is mainly used for an addition to animal feed. It could be a potential ingredient for
increasing the antioxidant, protein and unsaturated fatty acid content in food products, such as
bread. The pumpkin seed cake bread was made in an attempt to match a control wheat bread.
The PSC bread dough had a water/flour absorption ratio of 90/120 to reach 550 PUs
(promylograph units) and the control had a water/flour absorption ratio of 79/120 to reach 530
PUs. A significant difference was found between the heights of the PSC bread (54.65mm) and
control bread (77.07mm) indicating that the control bread had better gas holding properties than
did the PSC bread. Results for the texture analysis for the control were a modulus of
1.093millapascals (mPa) and a maximum compressive stress of 0.242mPa. The results for the
PSC bread indicated that it had a firmer crumb than the control, with a modulus of 2.733mPa and
a maximum compressive stress of 0.796mPa. Over 100 panelists participated in a sensory test
and evaluated both a piece of the control bread and a piece of PSC bread. There was no
significant difference in the sensory test for the perceived aftertaste rating (p<.5). However,
there was a significant difference for the nutty flavor, overall flavor, overall texture, and overall
acceptance ratings (p < 0.05). Therefore, bread can be made with PSC, but may need
reformulation to improve consumer preference acceptability.

3
Acknowledgments
I would like to thank God, Dr. Hans Zoerb, Dr. Lamin Kassama, Dr. Carolyn Barnhart,
Dr. Renee Howarton, Dr. Cynthia Rohrer, Connie Galep, Ken Seguine and Jay Gilbertson from
Hay River Foods, Menomonie Market Food Co-op, parents, family, and friends.

4
Table of Contents
.................................................................................................................................................... Page
Abstract ............................................................................................................................................2
List of Tables ...................................................................................................................................7
List of Figures ..................................................................................................................................8
Chapter I: Introduction .....................................................................................................................9
Statement of the Problem ...................................................................................................10
Research Objectives ...........................................................................................................10
Assumptions of the Study ..................................................................................................11
Definition of Terms............................................................................................................11
Limitations of the Study ....................................................................................................11
Methodology .......................................................................................................................11
Chapter II: Literature Review ........................................................................................................12
History of Pumpkin and Pumpkin Species ........................................................................12
Oil Pumpkin Cultivation Factors .......................................................................................13
Processing of Pumpkin Seed and Oil Extraction ...............................................................14
Physiochemical Characteristics of Pumpkin Seed Oil .......................................................16
Chemical Properties of Pumpkin Seed Oil ........................................................................17
Oxidative Stability .............................................................................................................18
Composition of Pumpkin Seeds and PSC ..........................................................................27
Health Claims of Pumpkin Seed Oil ..................................................................................28
Bread ..................................................................................................................................28
Dough Rheology ................................................................................................................29
5
Pumpkin Seed Cake in Bread ............................................................................................32
Bread Rheology .................................................................................................................32
Sensory Analysis of Bread .................................................................................................33
Chapter III: Methodology ..............................................................................................................35
Flour Water Absorption .....................................................................................................35
Development of the Control Dough/Bread ........................................................................36
Bench Top Bread Manufacture ..........................................................................................37
Data Collection ..................................................................................................................41
Data Collection Procedures ................................................................................................46
Chapter IV: Results and Discussion ..............................................................................................47
PSC Proximate Analysis ....................................................................................................47
Flour Moisture Absorption ................................................................................................47
Final Dough Formulae .......................................................................................................49
Bread Volume and Dimensions .........................................................................................51
Bread Texture Data ............................................................................................................52
Sensory Analysis ................................................................................................................52
Appearance ........................................................................................................................55
Moisture Content ...............................................................................................................55
Fat Analysis .......................................................................................................................56
Chapter V: Conclusion ...................................................................................................................57
Volume and Texture Relationship .....................................................................................57
Sensory ...............................................................................................................................58
Sensory and Texture Relationship .....................................................................................59

6
Economic Value .................................................................................................................59
Recommendations ..............................................................................................................59
References ......................................................................................................................................61
Appendix A: Bread Sensory Analysis Scorecard ..........................................................................69
Appendix B: Institutional Review Board Approval ......................................................................70

7
List of Tables
Table 1: Fatty Acid Profile of Selected Oils…………..………………………………………....18
Table 2: Tocopherols in Pumpkin Seed Oil…………..…………………………………….…....25
Table 3: Carotenoids in Pumpkin Seed Oil………………………………………………………25
Table 4: Antioxidants in Pumpkin Seed Oil……………………………………………………..26
Table 5: Pumpkin Seed Composition……………………………………………………………27
Table 6: Final Formulae for Control Bread and PSC Bread …………………………………….39
Table 7: Estimates of Proximate Composition of Macro Ingredients in PSC…………………...47
Table 8: Farinograph Data from Flour/Water Absorption , Control Bread Dough and PSC
Bread Dough………………..………………………………………………………......49
Table 9: Final Benchtop Formulae for Control Bread and PSC Bread………………………….50
Table 10: Dimensions of Bread Loaves for Control and PSC…………………………………...51
Table 11: Rheology (Modulus and Maximum Compressive Stress Values) from the Instron®
exture Analyzer for the Control Bread Samples and with PSC Samples……………...52
Table 12: Sensory Evaluation Results of Control and PSC Bread………………………………54
8
List of Figures
Figure 1: Lipid Oxidation for Linoleic Acid in the Initiation Step…………………….………..20
Figure 2: Lipid Oxidation for Linoleic Acid in the Propagation Step…………………………...21
Figure 3: Example of Lipid Oxidation in the Termination Step………………………..............22
Figure 4: Phenol Ring, Tyrosol, Vanillic Acid, Caffeic Acid, Vanillin, Luteolin and
Sinapic Acid…………………………………………………………………………..24
Figure 5: Antioxidant Capacities of Styrian Pumpkin Seed Oils and Other Edible Oils………..26
Figure 6: Farinogram of Hard Wheat and Parameters…………………………………………...31
Figure 7: Farinograms of Three Flours and Their Mixing Characteristics………………………31
Figure 8: Bread Dough Mixing in Promylograph Box…………………………………………..37
Figure 9: Control Dough Proofing Stages……………………………………………………….40
Figure 10: PSC Dough Proofing Stages…………………………………………………………40
Figure 11: A Single Column, Table Top Load Frame Texture Analyzer……………………….42
Figure 12: A 0.5” Steel Probe Forced into the Center Crumb of the Bread…………………….43
Figure 13: Tray Setup of bread Samples Given to Each Panelist for Evaluation………………44
Figure 14: Accelerated Solvent Extractor……………………………………………………….45
Figure 15: Farinograph of Flour/Water Absorption……………………………………………..48
Figure 16: Farinograph of Control Bread Dough………………………………………………..48
Figure 17: Farinograph of PSC Bread Dough…………………………………………………...49
Figure 18: Flavor and After Taste Sensory Results for Control and PSC Bread………………..53
Figure 19: Texture and Acceptance Sensory Results for Control and PSC Bread………………54
Figure 20: Middle Vertical Cross Section of Control Bread Crumb…………………………….55
Figure 21: Middle Vertical Cross Section of PSC Bread Crumb………………………………..55
Figure 22: Pumpkin Seed Oil Form PSC by the ASE…………………………………………...56
9
Chapter I: Introduction
The components of pumpkin seeds (oil and cake) can be valuable as additives in bread,
because they provide a good source of protein, are rich in antioxidants, and are high in
monounsaturated and polyunsaturated fatty acids. When pumpkin seed oil is expelled from the
seed, a byproduct, pumpkin seed cake, is produced (Peričin, Krimer, Trivić, & Radulović, 2009;
El-Soukkary, 2001). Pumpkin seeds primarily consist of protein and fat providing a
concentrated energy source (Caili, Huan, & Quanhong, 2006).
Protein from food is one of the main components needed to be consumed each day for a
healthy diet. Pumpkin seed proteins contain a high amount of tryptophan (Zdunczyk,
Minakowski, Frejnagel & Flis, 1999). With the addition of pumpkin seed cake and oil to bread,
the nutritional content of bread could be increased and the disposal of the cake (PSC) minimized
at the same time (El-Soukkary, 2001).
Antioxidants are found in many foods, especially green plants and highly colored fruit. A
network of antioxidants, possessing different chemical properties, from food may provide proper
protection against stress oxidation. Taking antioxidant supplements like ascorbic acid does not
protect against oxidative stress-related diseases as well as antioxidants that come from food
(Halvorsen, Carlsen, Phillips, Bøhn, Holte, Jacobs Jr., & Blomhoff, 2006). Research has shown
that consuming foods rich in antioxidants can increase cognitive and behavioral abilities
especially as people age (Willis, Shukitt-Hale, & Joseph, 2009). Therefore, consuming foods
rich in antioxidants may provide an increased value to human nutrition than do supplements.
Since pumpkin seed oil and cake are rich in antioxidants like tocopherols and carotenoids, they
offer the opportunity to create a new kind of specialty bread that contains this ingredient.

10
Unsaturated fats including monounsaturated and polyunsaturated fatty acids are
recommended for a healthy daily diet rather than the consumption of saturated fats. Pumpkin
seed oil contains high amounts of unsaturated fats including Omega 3 (linolenic) and Omega 6
(linoleic) essential fatty acids (Murkovic, & Pfannhauser, 2000).
Statement of the Problem
Pumpkin seed oil cake (PSC), a byproduct of pumpkin seed oil processing, is currently
only used for an addition to animal feed. The nutritional properties of PSC provide a significant
rationale to use it as an alternate ingredient in a food product application. Rather than disposing
of a byproduct, an alternative is to capture its value by adding PSC to bread to fortify protein
content for a more nutritious white bread (Vaštag, Popović, Popović, Krimer, & Peričin, 2010).
This study was designed to formulate a new bread product with PSC. After characterizing
the material properties of the two breads (control and PSC), the PSC bread may present different
characteristics than control bread. Using PSC in bread may serve as a healthy substitute for
vegetable shortening and/or a protein enhancement. In addition, it may result in solutions for
alleviating the waste disposing cost of the byproduct.
Research Objectives
The primary research objective is to make quality bread using pumpkin seed cake as a
source of antioxidants, protein, and monounsaturated and polyunsaturated fats. The second
objective is to characterize bread for a material test on the texture analyzer and correlate those
with the sensory properties of the bread. Finally, it will be important to quantify standard white
wheat bread, the control, and bread with pumpkin seed cake in order to compare the two breads.

11
Assumptions of the Study
The PSC came from the species Cucurbita pepo and the variety is a variation of the
Styrian oil pumpkin.
Definition of Terms
Farinograph. A type of recording mixer that measures and records the resistance over
time by a dough against mixing blades operating at a constant speed (rpm) and a constant
temperature; a promylograph is a smaller version of the farinograph (Delcour & Hoseney, 2001).
Rheology. The study of how materials deform, flow, or fail when force is applied
(Delcour & Hoseney, 2010).
Limitations of the Study
The oil pumpkin variety is unknown because this is proprietary information of the Hay
River Pumpkin Oil Foods. An untrained sensory panel was used for the sensory analysis
evaluation.
Methodology
An acceptable control dough/bread will be formulated and produced. The control dough
will be characterized using a promylograph. An attempt will be made to formulate and produce
a PSC dough with similar characteristics that mimic the control dough. A dough and bread will
be designed with PSC. Following baking of the breads, the control and the PSC bread will be
compared for their rheological and sensory properties. The rheological properties will be
quantified using compression testing. The sensory properties will be measured through a
randomized subjective sensory test.
12
Chapter II: Literature Review
There are many underutilized agricultural byproducts with high nutritional value that can
be used in food products or other industrial applications. Currently, only a small fraction of
agricultural byproducts are used in food (Nyam, Long, & Che Man, 2009). Pumpkin seed cake
(PSC), the material remaining after pumpkin seed oil has been removed from the seed is
typically sold for incorporation into animal feed or spread on land as fertilizer (Vaštag et al.,
2010). As a good source of antioxidants, protein and unsaturated fatty acids, PSC can be used to
fortify food products, such as bread, cereals, and cereal bars that promote healthy nutrition.
(Xanthopoulou, Nomikos, Fragopoulou, & Antonopoulous, 2009).
History of Pumpkins and Pumpkin Species
The pumpkin is a pepo type fruit - berries with a hard, thick rind - in the Cucurbitaceae
family that includes cucumbers and squash. Pumpkins are traditionally defined as round in
shape and orange in color, and like other winter squash, have long vines and a flowering stage.
Other members of the Cucurbitaceae family include muskmelon, watermelon, cucumbers, and
gourds (Marr, Schaplowsky, Carey, & Ted, 2004). Cucurbita pepo (common field pumpkins),
C. maxima (many of the large-fruited winter squashes and pumpkins), C. moschata (winter
squash and some types of pumpkins), and C. mixta (green-striped cushaw) are all different
pumpkin species in the genus Cucurbita (Kemble, Sikora, Zehnder, & Bauske, 2000). The
pumpkin most commonly used for pies, puddings, casseroles and decoration is C. pepo.
Pumpkins are thought to have originated in southern Mexico and were introduced to
Europe along with maize and chocolate by Spanish explorers (Fruhwirth & Hermetter, 2008). It
has been cultivated in Europe and Asia for centuries. A particular variety of pumpkin, C. pepo
subspecies pepo var. Styriaca, was developed in Styria, Austria and is used exclusively for the
13
production of green pumpkin seed oil (Nakić, Rade, Škevin, Štrucelj, Mokrovčak, & Bartolić,
2006). These pumpkins originated from a series of mutations that resulted in green colored seeds
with stunted outer hulls and are now known as C. pepo var. styriaca (Fruhwirth & Hermetter,
2008). The Styrian pumpkin is used almost exclusively for the production and export of
pumpkin seed oil (Nakić et al., 2006). Compared to the seeds with a lignified seed coat from
conventional pumpkins, the seeds from the Styrian pumpkin have a thin membranous seed coat,
are completely edible and are becoming a popular snack in many countries (Cucurbit Network
News, 2004). The lack of a traditional hull also makes extracting oil from the Styrian pumpkin
seed much simpler and more economical.
The Styrian oil pumpkin is one of the few oil seed crops grown in Austria and remains
the third most important field fruit in Styria (Fruhwirth & Hermetter, 2008; Ruckenbauer, 1999).
In 2006, there were 12,500 hectares used for growing oil seed pumpkins in Austria located in the
Styrian region with a total of 11,110 tons of pumpkin produced. One liter of Styrian pumpkin
seed oil requires 2.5kg pumpkin seeds, equivalent to 30-40 Styrian oil pumpkins (Fruhwirth &
Hermetter, 2008).
Oil Pumpkin Cultivation Factors
Styrian oil pumpkins are harvested in mid autumn, and it takes 5.5 lbs of dried pumpkin
seeds to make 1 liter of pumpkin seed oil (Fruhwirth & Hermetter, 2008). Light sandy loam soil
appears to be the best growth medium. Soil rich in humus and organic compounds are most
suitable. Rotating pumpkin crops with legumes or clover results in better production than
cucumbers since pumpkins share diseases with them. Various diseases can be controlled by
organic fertilizing. Careful sowing of nongerminated seeds or germinated seeds or transplants

14
for optimal yield can be achieved either with a pneumatic corn seeder or manually (Bavec,
Mlakar, Rozman, & Bavec, 2007). Growing conditions can affect the phenolic content in plants.
Pumpkin Seeds
Styrian oil pumpkin seeds contain 35% protein, primarily albumin and globulin proteins.
They also contain between 35-55% oil (Deimel, 2007). The oil is also high in phenolic acids,
phytosterols, Vitamins E and A, and mixed carotenoids.
Processing of Pumpkin Seed Oil Extraction
The oil from C. pepo var. styriaca pumpkins is used in culinary preparations such as
salad dressings, as a replacement for other oils in meal preparations, and in neutraceutical and
supplement preparations (Applequist, Avula, Schaneberg,Wang, & Khan, 2006). Unlike the
Cucurbita pepo from South Eastern Europe, Africa, and Asia, which produce a light yellow or
clear seed oil, Styrian pumpkin seed oil is dark green (Fruhwirth & Hermetter, 2008). The oil is
green with a hint of red because the seeds contain tocopherols like protochlorophyll and
protopheophytin (Fruhwirth, & Hermetter, 2007). Pumpkin seed oil has a high amount of
unsaturated essential fatty acids that oxidize quickly with the addition of heat (Murkovic &
Pfannhauser, 2000). Unsaturated fatty acids reduce the oxidative stability, cause foaming, and
reduce the smoke point (Damodaran, Parkin, & Fennema, 2007).
Pumpkin seed oil is generally extracted by expelling the oil from the seeds mechanically.
Both hulled and hull-less pumpkin seeds can be used for oil production. The oil from the hull-
less seeds is much easier to extract and more commonly processed. The hull surrounding
common pumpkin seeds has been replaced by a membranous seed coat as in the Styrian pumpkin
seeds making the oil easier to remove mechanically. The oil from Styrian pumpkin seeds is dark
green compared to the lighter colored oils from C pepo.
15
The traditional method of expelling oil from pumpkin seeds is accomplished by roasting
the seed pulp prior to mechanically expelling the oil (Nakić, et al., 2006). After seeds are
removed from the pumpkin, they are dried down to 5-7% moisture. The dried seeds are ground
and steeped in a salt brine (Fruhwirth & Hermetter, 2008). The increased moisture from the salt
brine protects the flavor of the oil during the roasting step (Fischerauer, 1996). The ground seed
pulp is roasted at 212-248°F for 60 minutes (Fruhwirth & Hermetter, 2008). During the roasting
process, proteins are denatured to facilitate liberation of the oil. Oil is pressed out of the seeds at
temperatures above 120°F and between 4,351 psi to 8,702 psi. At this point oil is cooled and
packaged for sale. Optimal packaging for pumpkin seed oil is a dark colored bottle, to retain the
beneficial components that can be lost to heat, light, and oxygen (Fruhwirth & Hermetter, 2007).
While natural, Styrian pumpkin seed oil processed by the traditional method is not
considered virgin oil because of the roasting step (Fruhwirth & Hermetter, 2008). This statement
reflects the German Society of Fat Science (DGF) definition of virgin oils (Matthäus & Spener,
2008). Pumpkin seed oil is classified somewhere between a virgin oil and a refined oil
(Fruhwirth & Hermetter, 2008). The Food and Agriculture Organization (FAO) (1999) defines
virgin oils and cold pressed oils as the following:
Virgin oils are obtained, without altering the nature of the oil, by mechanical procedures,
e.g. expelling or pressing, and the application of heat only. They may have been purified
by washing with water, settling, filtering and centrifuging only.
Cold pressed oils are obtained, without altering the oil, by mechanical procedures
only, e.g. expelling or pressing, without the application of heat. They may have been
purified by washing with water, settling, filtering and centrifuging only.
16
Pumpkin seed oil is also produced using a simple cold press without roasting or chemical
solvents (Bavec et al., 2007). The pumpkin seeds are ground in a screw press at temperatures
less than 120°F. The oil is expelled under pressure. While this produces a more pristine oil,
extraction efficiency is reduced and much of the oil remains in the seed pulp, a byproduct of the
process (Gorjanović, Rabrenović, Novaković, Dimić, Basić, & Sužnjević, 2011). Botantical Oil
Innovations (Spooner, Wisconsin) manufactures pumpkin seed oil using a cold press expelling
technology called NatureFRESH-Cold Press™. Because the oil is extracted from the seed once,
the pumpkin seed oil produced by this method can be classified as extra virgin oil. The solid
material remaining after expelling the pumpkin seed oil is pumpkin seed cake (PSC). Pumpkin
seed cake has a dark musty green color with a texture typical of almond paste and still contains
significant amounts of oil. It has generally been used as fertilizer or hog feed. A second
pressing of the seed cake can extract additional oil, but generally results in lower quality salad
oils (Fruhwirth & Hermetter, 2008). Hay River Foods (Prairie Farm, Wisconsin) is a producer of
organic pumpkin seed oil and is seeking alternative food applications for the remaining PSC.
Physiochemical Characteristics of the Pumpkin Seed Oil
Physical Properties.
Color. Pumpkin seed oil is not suitable for cooking because of its dark greenish color and
foaming characteristics (Murkovic & Pfannhauser, 2000). This oil has a nutlike, toasty aroma
resulting from pyrazine formation during the roasting of the pumpkin seeds (Joebstl,
Bandoniene, Meisel, & Chatzistathis, 2010; Murkovic & Pfannhauser, 2000). However, these
flavors are absent from pumpkin seed oil produced by the cold press method. Styrian pumpkin
seed oil is dark green with tints of red, but the color deteriorates by exposure to sunlight and
oxygen. The pumpkin seed oil is best stored in dark colored bottles in a cool area. The green

17
and red pigments in Styrian pumpkin seed oil are due to tetrapyrrol compounds like
protochlorophyll and protopheophytin located in the pumpkin seed’s inner seed-coat tissues
(Fruhwirth & Hermetter, 2007). The other three families of pigments are carotenoids,
polyphenolic compounds, and alkaloids (Fruhwirth & Hermetter, 2008). The dark green color is
indicative of antioxidants in the oil (Gorjanović et al., 2011). Animals and humans are unable to
synthesize these pigments; therefore, the pigments need to come from food including a variety of
different colored fruits and vegetables (Ruckenbauer, 1999). In addition to the pigments that
give the oil its color, there are compounds that provide aroma of the Styrian pumpkin seed oil
that include the oxidation products of polyunsaturated fatty acids. Pyrazene derivatives are
responsible for the flavor in the oil (Fruhwirth & Hermetter, 2007).
Chemical Properties of Pumpkin Seed Oil
Fatty Acids. Typical pumpkin seed oil is comprised of mostly unsaturated fatty acids,
primarily linoleic acid, with lesser amounts of oleic acid. Its fatty acid profile is similar to that of
soy bean oil with the exception of linolenic acid, which is very low in pumpkin seed oil (Table
1). (Fruhwirth & Hermetter, 2007; Murkovic, Piironen, Lampi, Kraushofer, Sontag, 2004;
Murkovic & Pfannhaus , 2000).
18
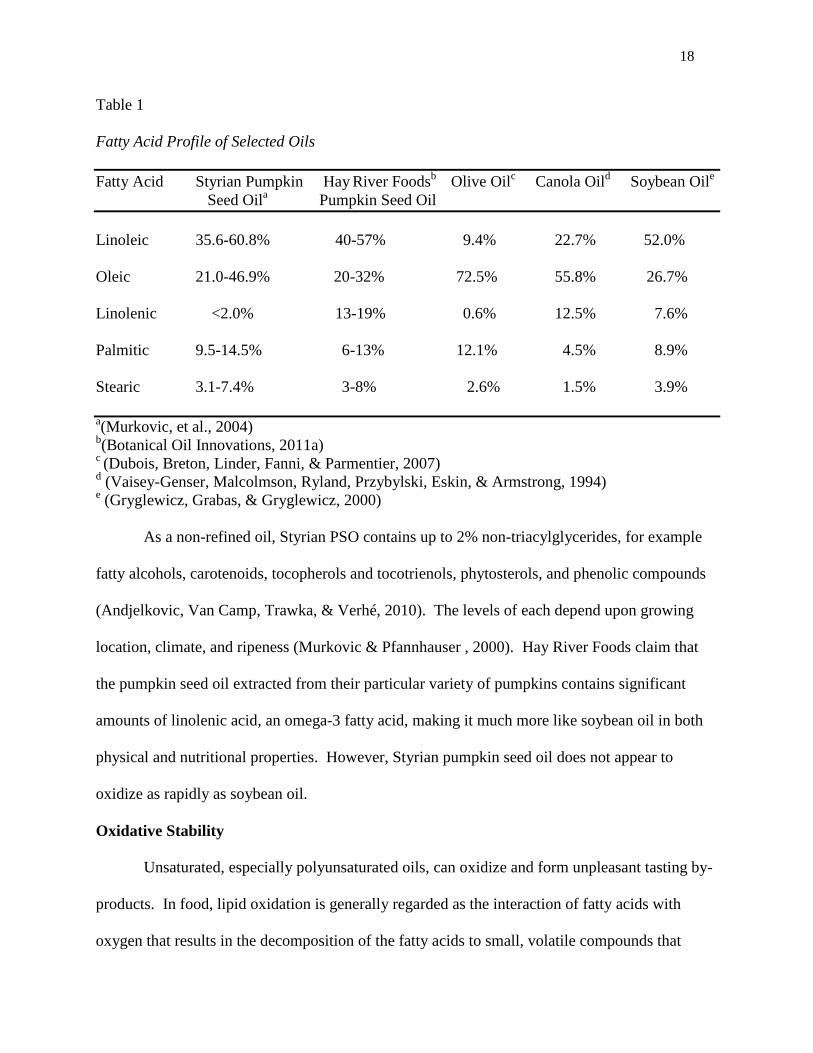
Table 1
Fatty Acid Profile of Selected Oils
Fatty Acid Styrian Pumpkin Hay River Foods
b Olive Oil
c Canola Oil
d Soybean Oil
e
Seed Oila Pumpkin Seed Oil
Linoleic 35.6-60.8% 40-57% 9.4% 22.7% 52.0%
Oleic 21.0-46.9% 20-32% 72.5% 55.8% 26.7%
Linolenic <2.0% 13-19% 0.6% 12.5% 7.6%
Palmitic 9.5-14.5% 6-13% 12.1% 4.5% 8.9%
Stearic 3.1-7.4% 3-8% 2.6% 1.5% 3.9%
a(Murkovic, et al., 2004)
b(Botanical Oil Innovations, 2011a)
c (Dubois, Breton, Linder, Fanni, & Parmentier, 2007)
d (Vaisey-Genser, Malcolmson, Ryland, Przybylski, Eskin, & Armstrong, 1994)
e (Gryglewicz, Grabas, & Gryglewicz, 2000)
As a non-refined oil, Styrian PSO contains up to 2% non-triacylglycerides, for example
fatty alcohols, carotenoids, tocopherols and tocotrienols, phytosterols, and phenolic compounds
(Andjelkovic, Van Camp, Trawka, & Verhé, 2010). The levels of each depend upon growing
location, climate, and ripeness (Murkovic & Pfannhauser , 2000). Hay River Foods claim that
the pumpkin seed oil extracted from their particular variety of pumpkins contains significant
amounts of linolenic acid, an omega-3 fatty acid, making it much more like soybean oil in both
physical and nutritional properties. However, Styrian pumpkin seed oil does not appear to
oxidize as rapidly as soybean oil.
Oxidative Stability
Unsaturated, especially polyunsaturated oils, can oxidize and form unpleasant tasting by-
products. In food, lipid oxidation is generally regarded as the interaction of fatty acids with
oxygen that results in the decomposition of the fatty acids to small, volatile compounds that

19
produce unpleasant flavors. The result is known as oxidative rancidity. Lipid oxidation occurs
through the following steps.
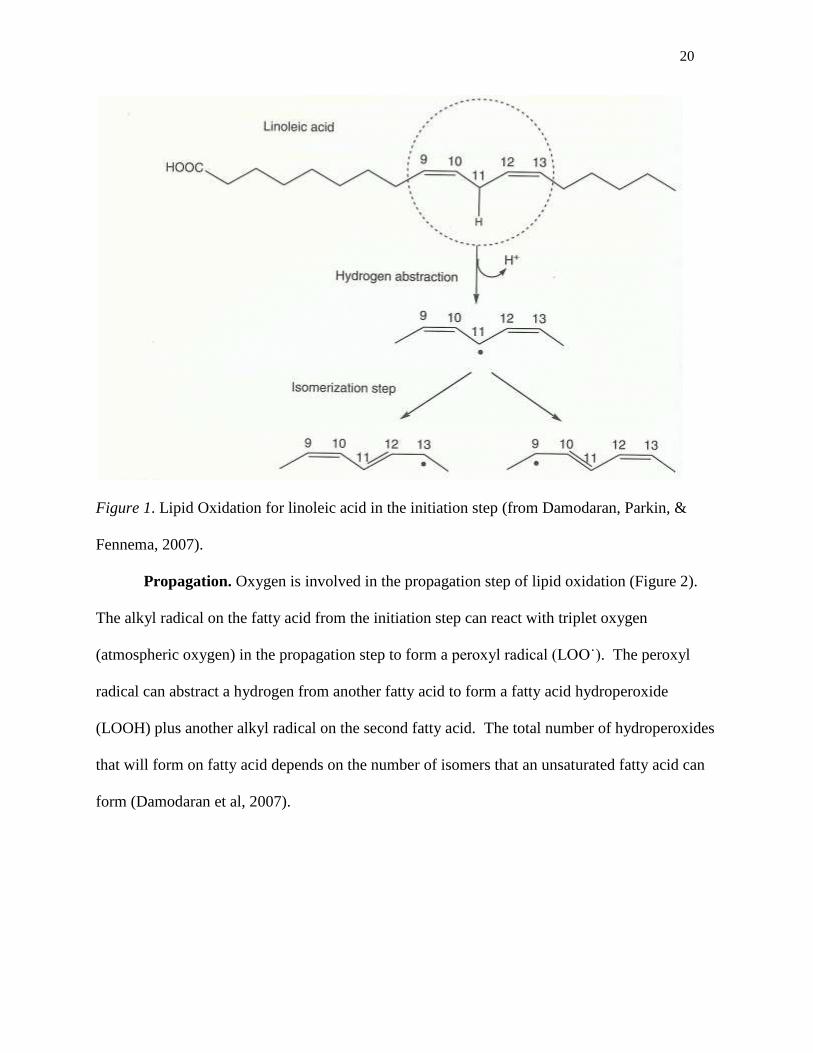
Initiation. A hydrogen is abstracted from a methylene group that is located between
double bonds in a polyunsaturated fatty acid chain or one methylene group to either side of the
double bond in a monounsaturated fatty acid chain (Figure 1). What remains is the carbon from
the methylene group with only one hydrogen, forming an alkyl radical (L˙). This is the point at
which the double bond(s) shift because the radical delocalizes on the chain. Formation of
conjugated double bonds occurs in polyunsaturated fatty acids because there are two or more
double bonds in the chain. The formation of radicals during lipid oxidation in the initiation step
occurs at a higher rate for polyunsaturated than monounsaturated fatty acids because of the
higher number of double bonds in the chain. The carbon-hydrogen bond is weaker on the
methylene carbon than those on the adjacent carbons making the hydrogen easier to abstract
(Damodaran, Parkin, & Fennema, 2007).
20
Figure 1. Lipid Oxidation for linoleic acid in the initiation step (from Damodaran, Parkin, &
Fennema, 2007).
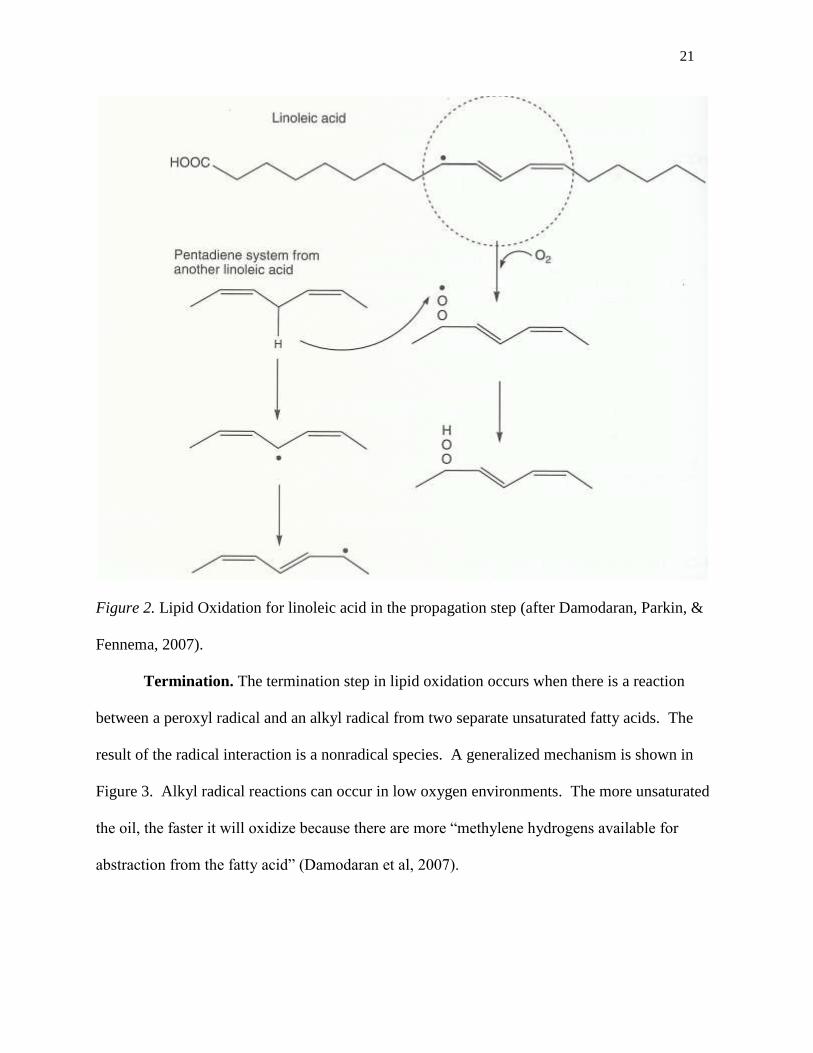
Propagation. Oxygen is involved in the propagation step of lipid oxidation (Figure 2).
The alkyl radical on the fatty acid from the initiation step can react with triplet oxygen
(atmospheric oxygen) in the propagation step to form a peroxyl radical (LOO˙). The peroxyl
radical can abstract a hydrogen from another fatty acid to form a fatty acid hydroperoxide
(LOOH) plus another alkyl radical on the second fatty acid. The total number of hydroperoxides
that will form on fatty acid depends on the number of isomers that an unsaturated fatty acid can
form (Damodaran et al, 2007).
21
Figure 2. Lipid Oxidation for linoleic acid in the propagation step (after Damodaran, Parkin, &
Fennema, 2007).
Termination. The termination step in lipid oxidation occurs when there is a reaction
between a peroxyl radical and an alkyl radical from two separate unsaturated fatty acids. The
result of the radical interaction is a nonradical species. A generalized mechanism is shown in
Figure 3. Alkyl radical reactions can occur in low oxygen environments. The more unsaturated
the oil, the faster it will oxidize because there are more “methylene hydrogens available for
abstraction from the fatty acid” (Damodaran et al, 2007).

22
Figure 3. An example of lipid oxidation in the termination step under conditions of low oxygen
concentrations (after Damodaran, Parkin, & Fennema, 2007).
Oxidation of fatty acids is measured by the amount of peroxides or the amount of ketones
and aldehydes present in the oil. Peroxides are formed early in the oxidative process and do not
present any off-flavors. Ketones and aldehydes occur later in oxidation and are the volatile
chemicals responsible for the unpleasant flavors. There are two widely recognized methods used
to test the oxidative stability of oils, the Schaal Oven test and the Active Oxygen Method (AOM)
(Tan, Man, Selamat, &Yusoff, 2002). Both subject the fat or oil to conditions that favor rapid
oxidation followed by analysis to quantify the formation of either peroxides or ketones and
aldehydes. Other more rapid measurements include conductivity or spectrophotometric analysis.
The composition of the oil is one of the most important factors influencing stability of the
oil to oxidation. Since unsaturated lipids are the first fats to oxidize, and pumpkin seed oil is
similar to soybean oil with its oleic, linoleic, and linolenic fatty acid content, one could assume
that pumpkin seed oil would be similar in its oxidative stability. However, pumpkin seed oil has

23
a higher oxidative stability than its fatty acid profile would indicate and has a higher oxidative
stability than refined rapeseed oil, crude linseed oil, crude Camelina sativa oil, crude primrose
oil, crude borage oil, and crude amaranth oil (Szterk, Roszko, Sosińska, Derewiaka, & Lewicki,
2010). Given the fact that the fatty acid profile of the pumpkin seed oil predicted that the oil
would have a low oxidative stability, other factors or components in the oil inhibit oxidation.
Cold pressed oils have higher phenolic content than oils that are chemically extracted, or result
from processes using roasting (Robbins, 2003; Andjelkovic, Van Camp, Trawka, & Verhé,
2010). Higher phenolic acid content increases the oxidative stability of unsaturated fatty acids.
The high level of phenolic acids also contributes to the sensory properties (flavor and color) and
nutrition of pumpkin seed oil (Robbins, 2003).
Phenolic Acids. Phenolic acids are a subclass of phenolics and classified as phenols with
one carboxylic acid function. Polyphenols and simple phenols are two classes of phenolics.
Flavonoids have at least two phenol subunits and tannins contain three or more phenol subunits,
both of which are polyphenols. The distribution of phenolics in most plant food consists of two-
thirds flavonoids and most of the remaining portion as phenolic acids. The phenolic acids in
food contribute to color, sensory qualities, and nutritional and antioxidant properties in food
(Robbins, 2003).
Phenolics function as antioxidants by scavenging free radicals (Robbins, 2003). Phenols
may reduce free radical-mediated cellular damage (Parry, Hao, Luther, Su, Zhou, & Yu, 2006).
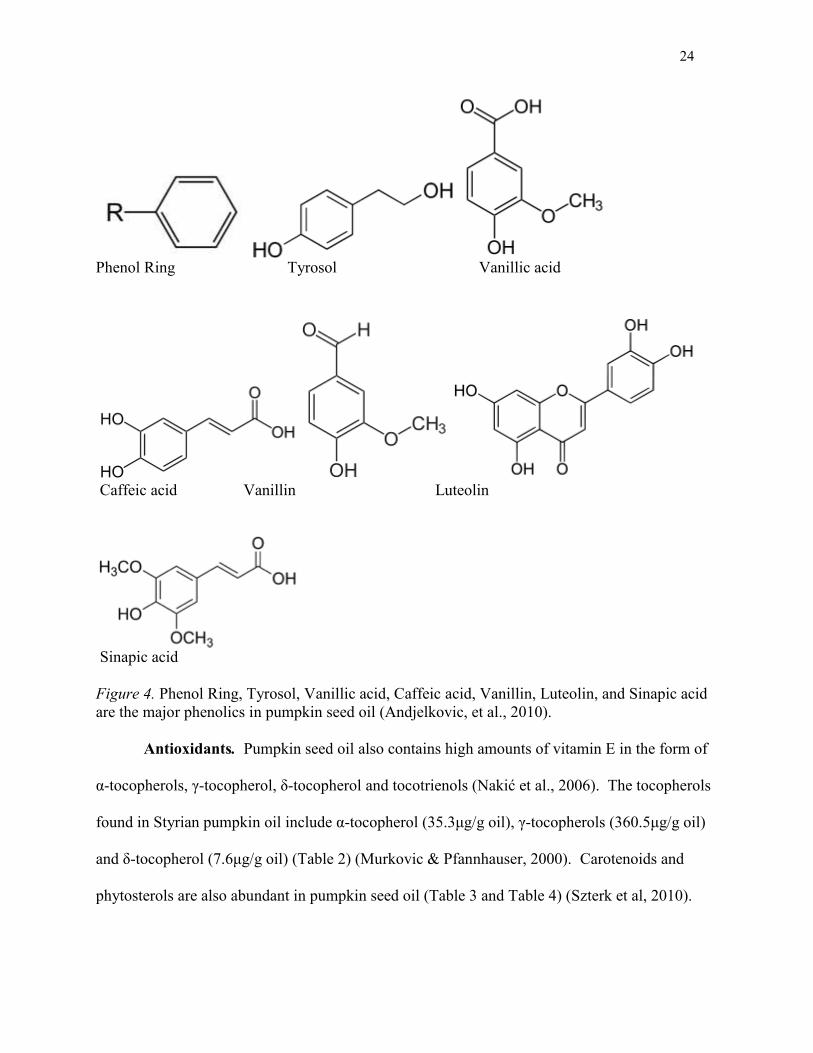
The majority of the phenolics that are present in pumpkin seed oil include tyrosol, vanillic acid,
caffeic acid, vanillin, luteolin, and sinapic acid (Figure 4) (Andjelkovic, et al., 2010). Peričin,
Krimer, Trivić, & Radulovi (2009) found that there is a higher concentration of phenolic acids in
the oil cake meal than in the seed.

24
Phenol Ring Tyrosol Vanillic acid
Caffeic acid Vanillin Luteolin
Sinapic acid
Figure 4. Phenol Ring, Tyrosol, Vanillic acid, Caffeic acid, Vanillin, Luteolin, and Sinapic acid
are the major phenolics in pumpkin seed oil (Andjelkovic, et al., 2010).
Antioxidants. Pumpkin seed oil also contains high amounts of vitamin E in the form of
α-tocopherols, γ-tocopherol, δ-tocopherol and tocotrienols (Nakić et al., 2006). The tocopherols
found in Styrian pumpkin oil include α-tocopherol (35.3μg/g oil), γ-tocopherols (360.5μg/g oil)
and δ-tocopherol (7.6μg/g oil) (Table 2) (Murkovic & Pfannhauser, 2000). Carotenoids and
phytosterols are also abundant in pumpkin seed oil (Table 3 and Table 4) (Szterk et al, 2010).
24
Phenol Ring Tyrosol Vanillic acid
Caffeic acid Vanillin Luteolin
Sinapic acid Figure 4. Phenol Ring, Tyrosol, Vanillic acid, Caffeic acid, Vanillin, Luteolin, and Sinapic acid are the major phenolics in pumpkin seed oil (Andjelkovic, et al., 2010).
Antioxidants. Pumpkin seed oil also contains high amounts of vitamin E in the form of
α-tocopherols, γ-tocopherol, δ-tocopherol and tocotrienols (Nakić et al., 2006). The tocopherols
found in Styrian pumpkin oil include α-tocopherol (35.3μg/g oil), γ-tocopherols (360.5μg/g oil)
and δ-tocopherol (7.6μg/g oil) (Table 2) (Murkovic & Pfannhauser, 2000). Carotenoids and
phytosterols are also abundant in pumpkin seed oil (Table 3 and Table 4) (Szterk et al, 2010).

25
Table 2
Tocopherols in Pumpkin Seed Oil
Tocopherol μg/g of oila
mg/kg oilb μmol/kg
α-tocopherols 35.3 26.8 ± 0.9
γ-tocopherol 360.5 216.3 ± 2.4
δ-tocopherol 7.6 19.2 ± 0.0
Total Tocopherols 625.6
a(Murkovic & Pfannhauser, 2000).
b(Botanical Oil Innovations, 2011b)
Table 3
Carotenoids in Pumpkin Seed Oil
Carotenoids μg/kg of oila
Beta Carotene 981
Lutein 272
Zeaxanthin 28.6
Cryptoxanthin 4917
a (
Botanical Oil Innovations, 2011)

26
Table 4
Antioxidants in Pumpkin Seed Oil
Antioxidant mg/100g of pumpkin seed oil
Phytosterols & Stanols 349.0 mgb
Δ7-sterols 70.4 mgb (as part of total phytosterols and stanols)
b(Szterk et al, 2010)
The antioxidant capacity in Styrian pumpkin seed oil exceeds that of olive oil, extra
virgin olive oil, sunflower oil, sunflower oil (high oleic), hemp seed oil, poppy seed oil (gray),
poppy seed oil (white), thistle oil, and walnut oil (Figure 5) (Fruhwirth & Hermetter, 2007). The
ORAC (Oxygen Radical Absorbance Activity) value is used as a measurement of antioxidants in
foods (United States Department of Agriculture, 2010). The ORAC value for pumpkin seed oil
is 110 μmoles Trolox equivalents/100g (Botanical Oil Innovations, 2011b).
Figure 5.Antioxidant levels of Styrian pumpkin seed oils compared to olive oil, extra virgin olive
oil, sunflower oil, sunflower oil, high oleic, hemp seed oil, poppy seed oil, poppy seed oil
(white), thistleoil, and walnut oil (Fruhwirth, & Hermetter, 2007).
27
Since pumpkin seed oil is extracted in a handcrafted, small scale process it is difficult to
produce a standardized oil or seed cake. This may be the reason why proximate analysis of fats
and proteins differ between publications (Fruhwirth & Hermetter, 2008).
Composition of Pumpkin Seeds and PSC
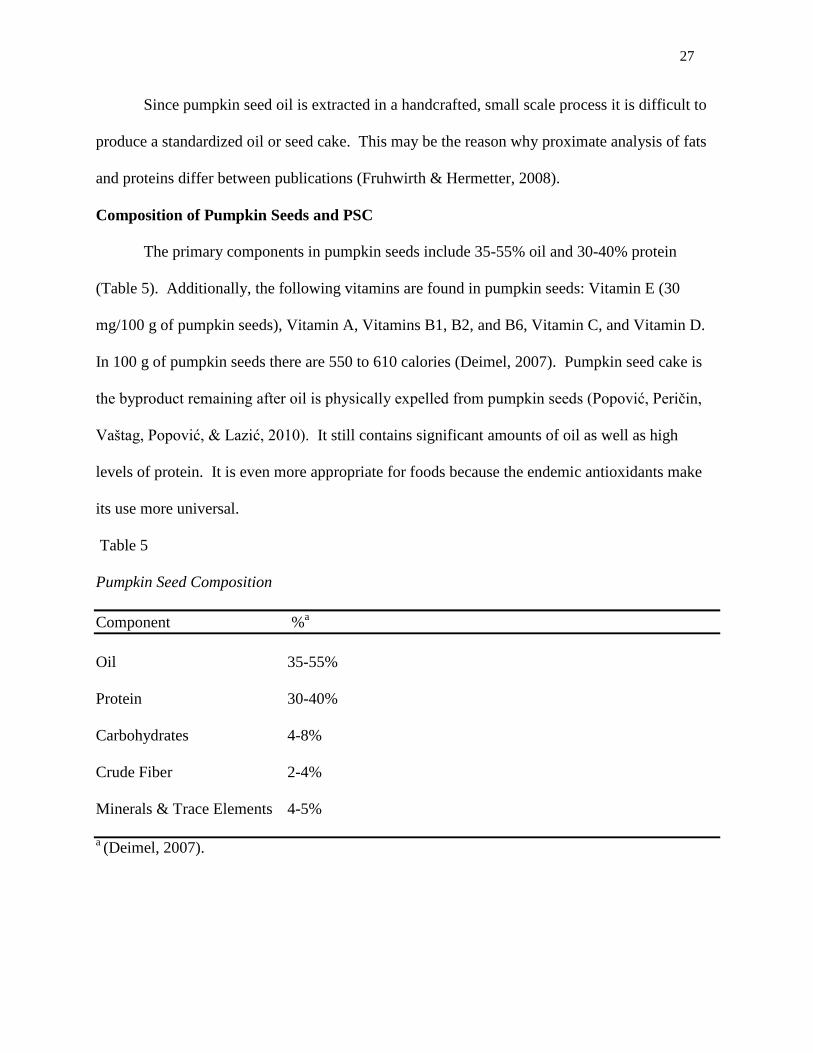
The primary components in pumpkin seeds include 35-55% oil and 30-40% protein
(Table 5). Additionally, the following vitamins are found in pumpkin seeds: Vitamin E (30
mg/100 g of pumpkin seeds), Vitamin A, Vitamins B1, B2, and B6, Vitamin C, and Vitamin D.
In 100 g of pumpkin seeds there are 550 to 610 calories (Deimel, 2007). Pumpkin seed cake is
the byproduct remaining after oil is physically expelled from pumpkin seeds (Popović, Peričin,
Vaštag, Popović, & Lazić, 2010). It still contains significant amounts of oil as well as high
levels of protein. It is even more appropriate for foods because the endemic antioxidants make
its use more universal.
Table 5
Pumpkin Seed Composition
Component %a
Oil 35-55%
Protein 30-40%
Carbohydrates 4-8%
Crude Fiber 2-4%
Minerals & Trace Elements 4-5%
a (Deimel, 2007).
28
Health Claims of Pumpkin Seed Oil
Since pumpkin seed oil is high in antioxidants, (Botanical Oil Innovations, 2011b) many
health claims accompany the consumption of this oil (Peričin, et al., 2009). Reports claim
consumption of pumpkin seed oil can help in the prevention and therapy of cardiovascular
disease, prostate cancer (benign prostatic hyperplasia-BPH), dysuria, urinary tract infections, and
digestive problems. Consumption of pumpkin oil contributes to smoothed skin and increased
energy (Botanical Oil Innovations, 2011b).
Tocopherols, hydrocarbons including squalene, sterols, alcohols, and phospholipids are
found in pumpkin seed oil and when the oil is consumed it can contribute to good health and
prevention of other diseases. It is the Δ7-sterols in pumpkin seed oil that are reported to support
health of the prostrate gland and bladder. Similar components in olive oil are also found in
pumpkin seed oil and may help protect against breast cancer (Nakić et al., 2006). Pumpkin seeds
and pumpkin oil have also shown to be antidiabetic, antifungal, antibacterial, anthelmintic,
antihypercholesterolemic, and anti-inflammatory (Caili, Huan, & Quanhong, 2006).
Bread
Bread by definition and standard of identity is made from wheat flour, water, yeast, and
sodium chloride. It may contain other ingredients including shortening, dough
oxidizing/reducing agents, emulsifiers, sugar, and other types of flour. Flour is the key to a
quality bread dough, and it is characterized by the amount and quality of protein in the flour. A
typical bread flour contains 71% carbohydrates, 13% protein, 1% lipids, and 14% water (Scanlon
& Zghal, 2001). The primary proteins in wheat flour are gliadin and glutenin, which make up
the gluten complex, the unique proteins that form the gas holding structure in bread dough.
During mixing the two proteins interact with each other through hydrophobic interactions and
29
disulfide links to form large polymeric sheets. The unique physical properties of the gluten
polymers result from a combination of the elastic properties of glutenin and the extensible
character of gliadin when they are hydrated during dough mixing. The result is a viscoelastic
quality in dough that allows dough to expand during leavening (proofing) and baking while
retaining the necessary pressure to hold the CO2 gas bubbles and build volume. Gliadin is also
responsible for the cohesiveness in dough (Delcour & Hoseney, Proteins of Cereals, 2010). The
carbohydrates in flour are starch and hemicellulose. Starch is compartmentalized in starch
granules that minimally hydrate during mixing but gelatinize during baking to support the final
structure. Wheat starch is about 25% amylose and 75% amylopectin (Miyazaki, Maeda, &
Morita, 2004).
The bread making process begins with mixing where the ingredients are blended and
hydrated and the gluten developed. Mixing also introduces air into the dough mass. The trapped
air becomes initiation sites for gas cell formation. When completely developed during mixing,
dough is a continuous, hydrated protein matrix surrounding starch granules and dispersed air
cells (Gallagher, Gormley, Arendt, 2003). After mixing, dough is proofed, and CO2 produced by
yeast migrates to the air cells causing them to expand, increasing the dough volume and
producing a foam. Gluten development is critical during the mixing of bread dough, because it
determines the volume of the baked bread, and is an important determinant of the crumb
structure in bread (Scanlon & Zghal, 2001).
Dough Rheology
As a viscoelastic material, the rheology of dough exhibits both solid or elastic properties
and liquid or flow characteristics (Tanner, Qi, & Dai, 2008; Weipert, 2008). Dough rheology
determines final bread quality. Because the rheological properties of dough are developed
30
during mixing when glutenin and gliadin interact to form the gluten matrix, measuring the
development as mixing progresses is important in optimizing dough texture. During mixing,
ingredients in dough hydrate and react with one another and the dough begins to increase in
viscosity. As viscosity increases, the resistance to mixing increases (Delcour & Hoseney, 2010).
While viscoelastic properties of a material are classically described by stress and strain
measurements, the baking industry has adopted empirical methods to define the rate at which
flour absorbs water and the amount of water it absorbs to reach a designated dough viscosity.
The most commonly used instrument is the farinograph (C.W. Brabender Instruments),
which simulates a mixer and measures the resistance or consistency (a function of viscosity) of
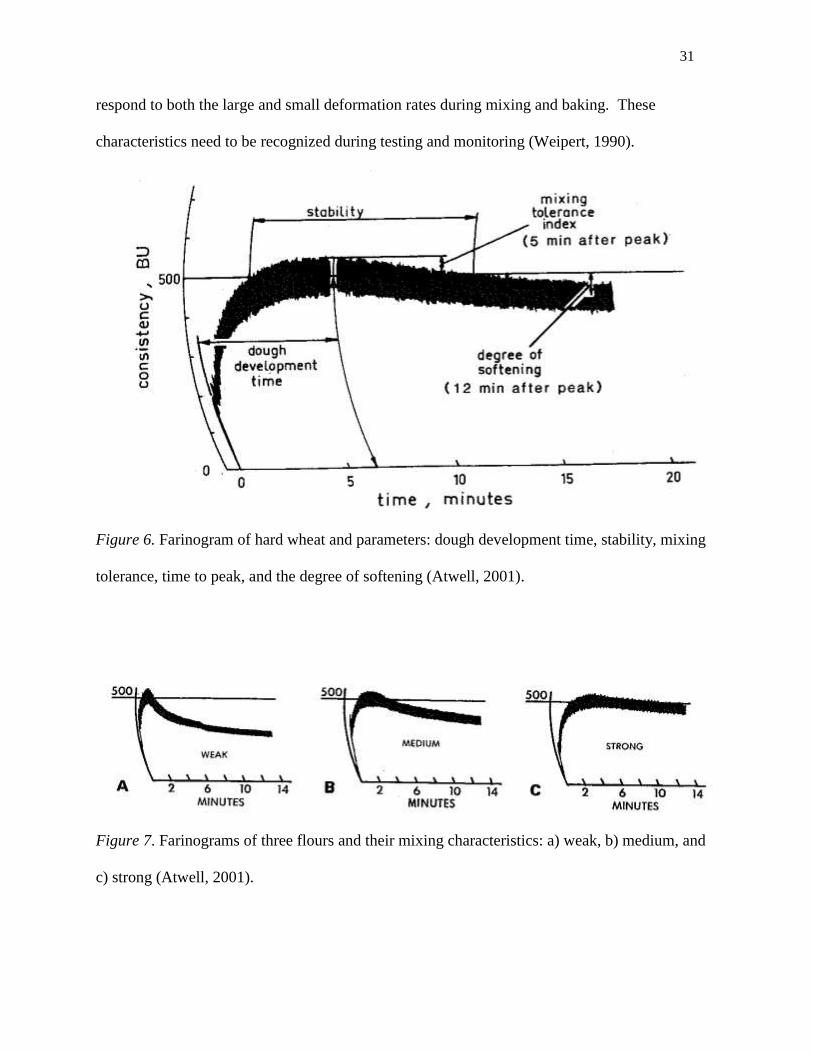
the dough as mixing proceeds. A resistance curve versus time is generated (Figure 6). The
curve describes a number of properties critical to processing dough and baking bread: the time to
reach maximum viscosity (hydration and development time), peak height (maximum viscosity),
stability of the dough (how the dough resists mixing), mixing tolerance and softening (how the
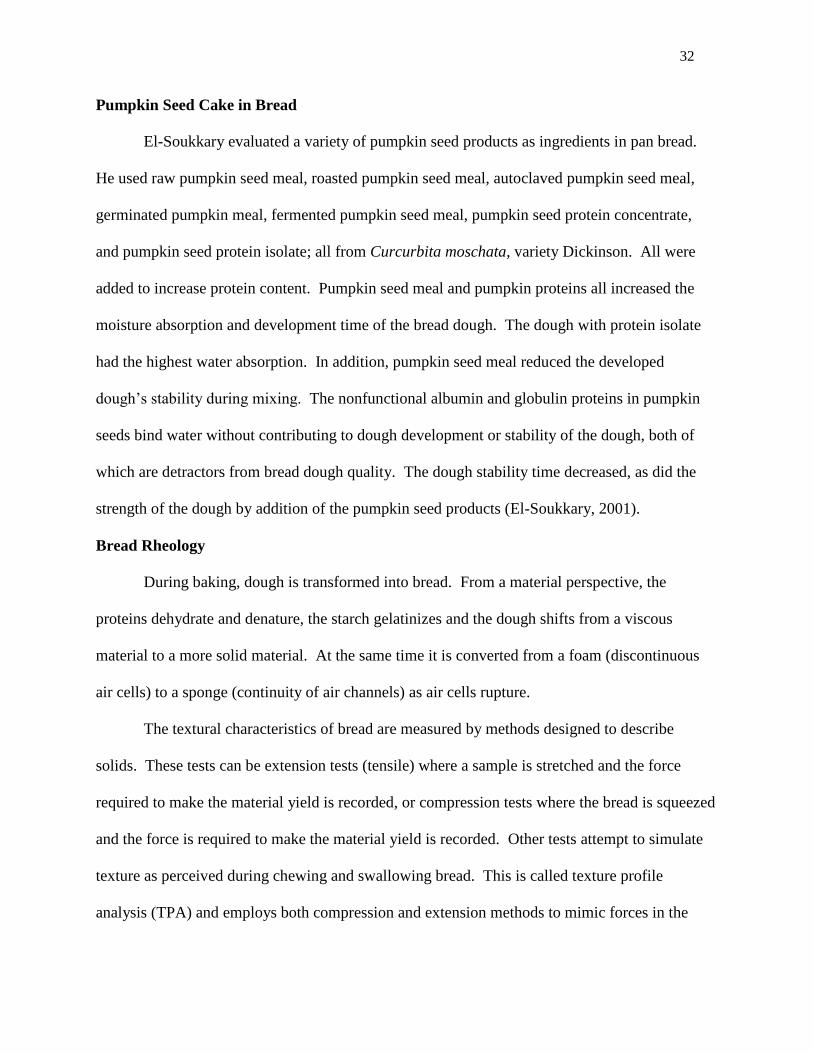
dough tolerated processing). The longer the stability time of the dough, the stronger the dough
(Figure 7), (Atwell, 2001). Dough rheology measurements are important because they are a
function of protein quality and amount, starch content, ash content and moisture. They also
quantify changes in dough as other ingredients like protein supplements, shortening and dough
conditioners are added to dough. They also allow quantification of flour differences and the
optimization of dough during baking (Tanner, Qi, & Dai, 2008).
Bread dough reacts to different strains and forces during processing. Mixing is a
relatively large force while dough proofing and rising in the oven is a small force, but both are
important in producing quality bread. To produce quality bread, dough must be developed to
31
respond to both the large and small deformation rates during mixing and baking. These
characteristics need to be recognized during testing and monitoring (Weipert, 1990).
Figure 6. Farinogram of hard wheat and parameters: dough development time, stability, mixing
tolerance, time to peak, and the degree of softening (Atwell, 2001).
Figure 7. Farinograms of three flours and their mixing characteristics: a) weak, b) medium, and
c) strong (Atwell, 2001).
32
Pumpkin Seed Cake in Bread
El-Soukkary evaluated a variety of pumpkin seed products as ingredients in pan bread.
He used raw pumpkin seed meal, roasted pumpkin seed meal, autoclaved pumpkin seed meal,
germinated pumpkin meal, fermented pumpkin seed meal, pumpkin seed protein concentrate,
and pumpkin seed protein isolate; all from Curcurbita moschata, variety Dickinson. All were
added to increase protein content. Pumpkin seed meal and pumpkin proteins all increased the
moisture absorption and development time of the bread dough. The dough with protein isolate
had the highest water absorption. In addition, pumpkin seed meal reduced the developed
dough’s stability during mixing. The nonfunctional albumin and globulin proteins in pumpkin
seeds bind water without contributing to dough development or stability of the dough, both of
which are detractors from bread dough quality. The dough stability time decreased, as did the
strength of the dough by addition of the pumpkin seed products (El-Soukkary, 2001).
Bread Rheology
During baking, dough is transformed into bread. From a material perspective, the
proteins dehydrate and denature, the starch gelatinizes and the dough shifts from a viscous
material to a more solid material. At the same time it is converted from a foam (discontinuous
air cells) to a sponge (continuity of air channels) as air cells rupture.
The textural characteristics of bread are measured by methods designed to describe
solids. These tests can be extension tests (tensile) where a sample is stretched and the force
required to make the material yield is recorded, or compression tests where the bread is squeezed
and the force is required to make the material yield is recorded. Other tests attempt to simulate
texture as perceived during chewing and swallowing bread. This is called texture profile
analysis (TPA) and employs both compression and extension methods to mimic forces in the
33
mouth. A simpler technique is a probe compression test where a probe with known diameter is
pushed into the bread at a constant rate to a defined distance. The maximum force necessary to
push the probe into the bread is a measure of bread firmness. One can also determine the
modulus relating to the stiffness of the bread. It is defined as the applied force per unit of area
(stress) to the relative deformation (strain) (Delcour & Hoseney, 2010).
Describing the mechanical behavior using the stress strain curve for bread is difficult as
the bread has a porous structure and lacks of homogeneity in the distribution of cells within the
bread. Bread has been analyzed for texture by compressive loading test (indentation), tensile
tests (extension), and small angle deformation tests (shear). The compressive loading test is
preferred over tensile tests in bread because of its simplicity, small sample size and validity in
evaluation of mechanical properties. Disadvantages of the tensile test in bread texture include
difficulty gripping the sample and adherence to sample size, shape and stiffness. An advantage
to tensile testing over the compression testing is the ease of interpreting results and determining
mechanical properties (Scanlon & Zghal, 2001).
Relative density is the “density of the cellular material, divided by the density of the solid
material” (Zghal, Scanlon, & Sapirstein, 2002). The relationship between relative density and
mechanical properties can be applied to bread. The density has a large impact on the mechanical
properties of the bread crumb.
Sensory Analysis of Bread
The following order of sensory attributes is how a consumer perceives a food product:
appearance, aroma, texture, and flavor. The relationship between the ingredients and the
characteristics of the baked bread are important to understand for formulators in order to meet
consumer preferences (Kihlberg, Öström, Johansson, & Risvik, 2006). In addition, the objective
34
instrumental measurements of bread firmness can be correlated to the subjective sensory
properties (Scanlon & Zghal, 2001). The gluten protein matrix in wheat flour is important to the
quality of the bread. Recipe modifications are necessary when the wheat flour is not ideal
(Kihlberg et al, 2006) or when potentially non functional ingredients are added like pumpkin
seed cake.
The objective of this study is to baseline the effects of pumpkin seed cake (PSC) as a
partial replacement for shortening and as a protein supplement in bread. The effect of PSC on
dough development and consistency, and on the final quality and texture of bread will be
evaluated. Pumpkin seed cake will be added to white wheat bread to magnify the effects that this
ingredient may have in bread compared to the control bread. A baseline bread formula for
control bread and bread with PSC will be developed. A comparison between the control and
PSC breads will be measured using sensory analysis, texture analysis, bread measurements, and
crumb structure. The rheology of control bread dough and the PSC bread dough will be
analyzed for development time, stability, and mixing time.

35
Chapter III: Methodology
The objectives of this research were to determine if a novel bread could be developed
using pumpkin seed cake (PSC), a by-product from the extraction of pumpkin seed oil, as a
source of shortening and other bioactive ingredients. To develop an acceptable bread containing
PSC, it was necessary to understand how the addition of PSC affected the moisture absorption
and development of the dough, what formula adjustments to the PSC-containing dough were
necessary to match a control dough, and how PSC impacted the final flavor and texture of the
bread. The experimental design used the following approach:
1. Determine the moisture absorption of the bread flour to be used in the study as a baseline
for comparison with PSC-containing dough.
2. Establish a “control dough” using typical ingredients: flour, water, yeast, salt and
shortening.
3. Determine the moisture absorption of flour containing PSC so that formula adjustments
could be made to mimic the control dough.
4. Use the Promylograph to establish dough rheology and to determine optimum mix times
and flour/water ratios for the control dough and dough containing PSC.
5. Scale up the Promylograph mix parameters to a bench top mixer.
6. Make bread with and without PSC on a bench top scale for laboratory texture
analysis and sensory evaluation.
Flour Water Absorption
Water absorption in flour is defined as the amount of water (expressed as a percent, w/w
of the flour) necessary to balance the farinograph curve on the 500 BU line (Atwell, 2001). In
this study, water absorption was determined using a Promylograph (measured in PU’s) according
to a method modified from the one described by AACC Method 54-21(2000). The
36
Promylograph (measured in PU’s) has similar units to the Brabender farinograph. Flour (120g)
was placed in the Promylograph mixing bowl and water (~60ml) was added to the bowl using a
burette. Water was added until the resistance curve reached the 500PU line. This process
required two to three iterations to accurately determine the amount of water necessary. If the
rheology curve exceeded 500 BU, the amount of water was increased in the next run. If the
rheology curve was less than 500 BU, the amount of water was decreased in the following run.
The volume of water needed to reach 500 BU was recorded and calculated as a percent of the
flour. This result became the starting point for the flour/water ratio used to formulate the control
dough in the following experiments.
Development of the Control Dough/Bread
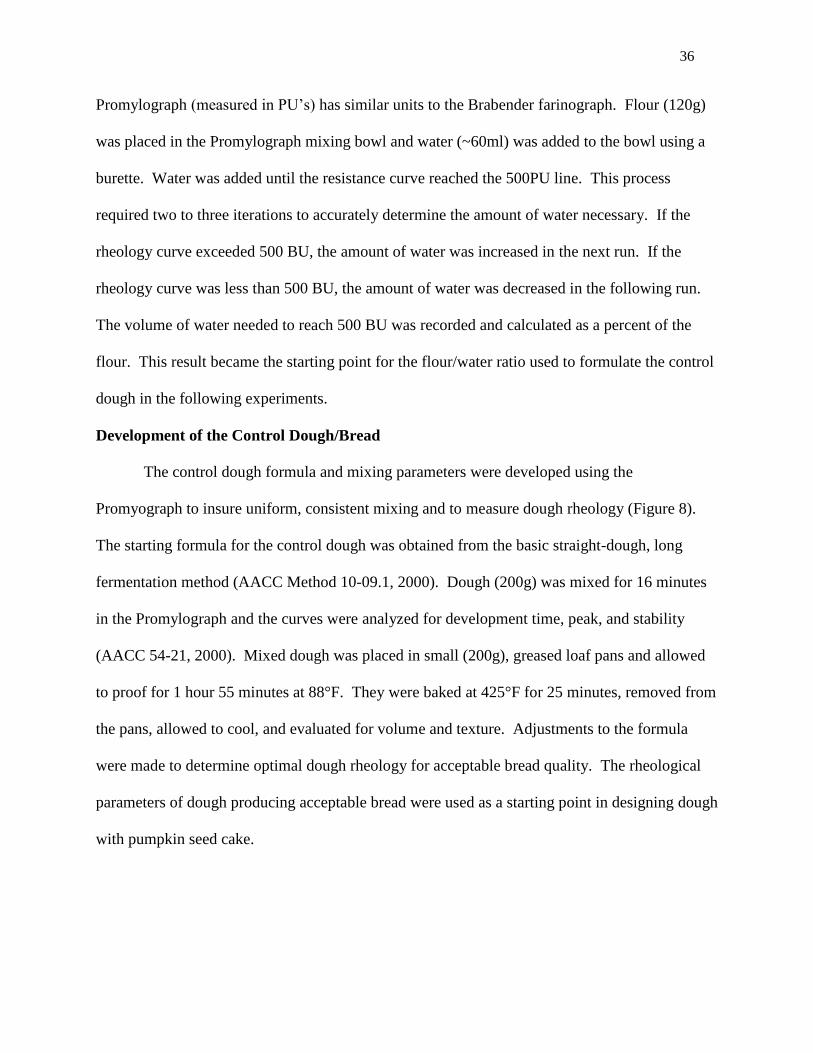
The control dough formula and mixing parameters were developed using the
Promyograph to insure uniform, consistent mixing and to measure dough rheology (Figure 8).
The starting formula for the control dough was obtained from the basic straight-dough, long
fermentation method (AACC Method 10-09.1, 2000). Dough (200g) was mixed for 16 minutes
in the Promylograph and the curves were analyzed for development time, peak, and stability
(AACC 54-21, 2000). Mixed dough was placed in small (200g), greased loaf pans and allowed
to proof for 1 hour 55 minutes at 88°F. They were baked at 425°F for 25 minutes, removed from
the pans, allowed to cool, and evaluated for volume and texture. Adjustments to the formula
were made to determine optimal dough rheology for acceptable bread quality. The rheological
parameters of dough producing acceptable bread were used as a starting point in designing dough
with pumpkin seed cake.
37
Figure 8. Bread dough mixing in Promylograph box.
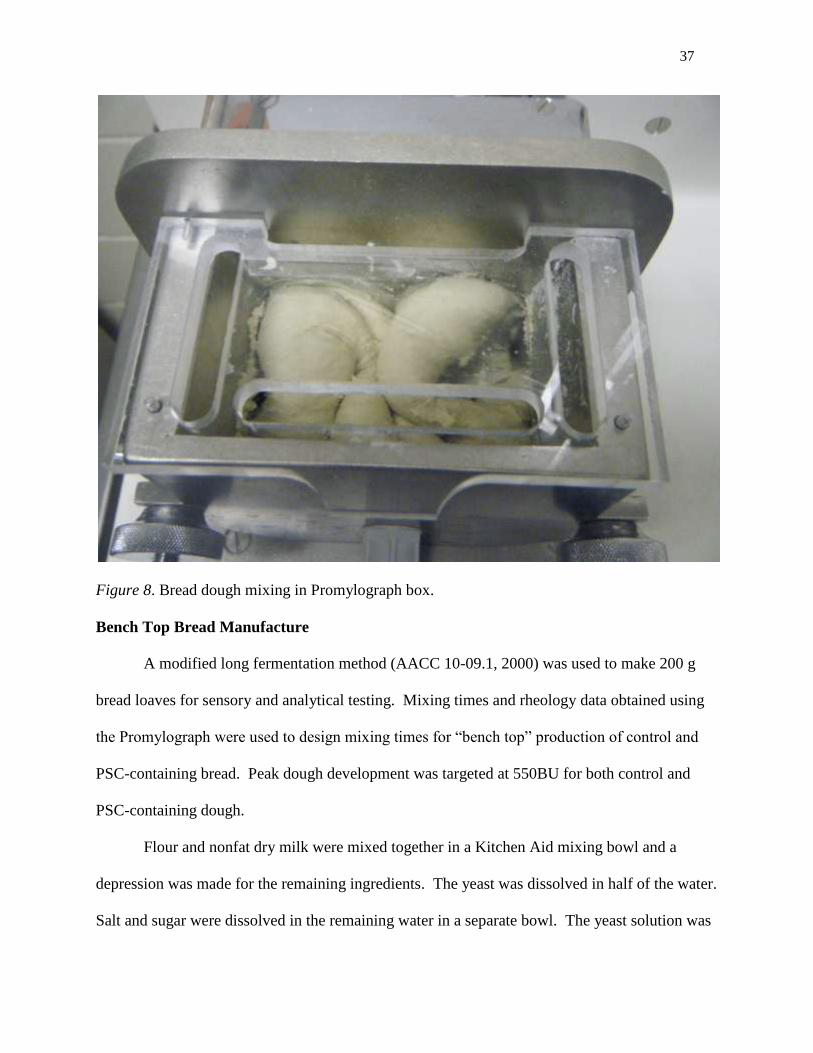
Bench Top Bread Manufacture
A modified long fermentation method (AACC 10-09.1, 2000) was used to make 200 g
bread loaves for sensory and analytical testing. Mixing times and rheology data obtained using
the Promylograph were used to design mixing times for “bench top” production of control and
PSC-containing bread. Peak dough development was targeted at 550BU for both control and
PSC-containing dough.
Flour and nonfat dry milk were mixed together in a Kitchen Aid mixing bowl and a
depression was made for the remaining ingredients. The yeast was dissolved in half of the water.
Salt and sugar were dissolved in the remaining water in a separate bowl. The yeast solution was

38
added to the flour/nonfat milk mixture followed by the salt and sugar solution. The shortening
(or the PSC) was added last. The ingredients were mixed slowly (speed 2) using a dough hook
for 45 seconds to blend and incorporate the liquids into the dry ingredients to form a dough mass.
The bowl was scraped to insure all ingredients were incorporated and the dough was mixed at
high speed the remaining mixing time. The mixer was stopped at 1 min. 30 seconds, 3 minutes,
and 4 minutes to scrape the bowl. The total mixing time was 20 minutes for each batch. After
mixing, 200g of dough were placed into the promylograph mixing bowl to determine mix
rheology. If the reading was above 550 PU, another batch was made with additional water. If
the reading was below 550 PUs, water in the subsequent batch was decreased. Following this
series of experiments, the flour/water ratio and mix times for the bench top bread were
established.
The same procedure was carried out for the PSC bread. Pumpkin seed cake and pumpkin
seed oil were added to the formula to replace the vegetable shortening. The two pumpkin seed
ingredients were added last, before the mixing began. The formulae for the two breads listed in
Table 6.
39
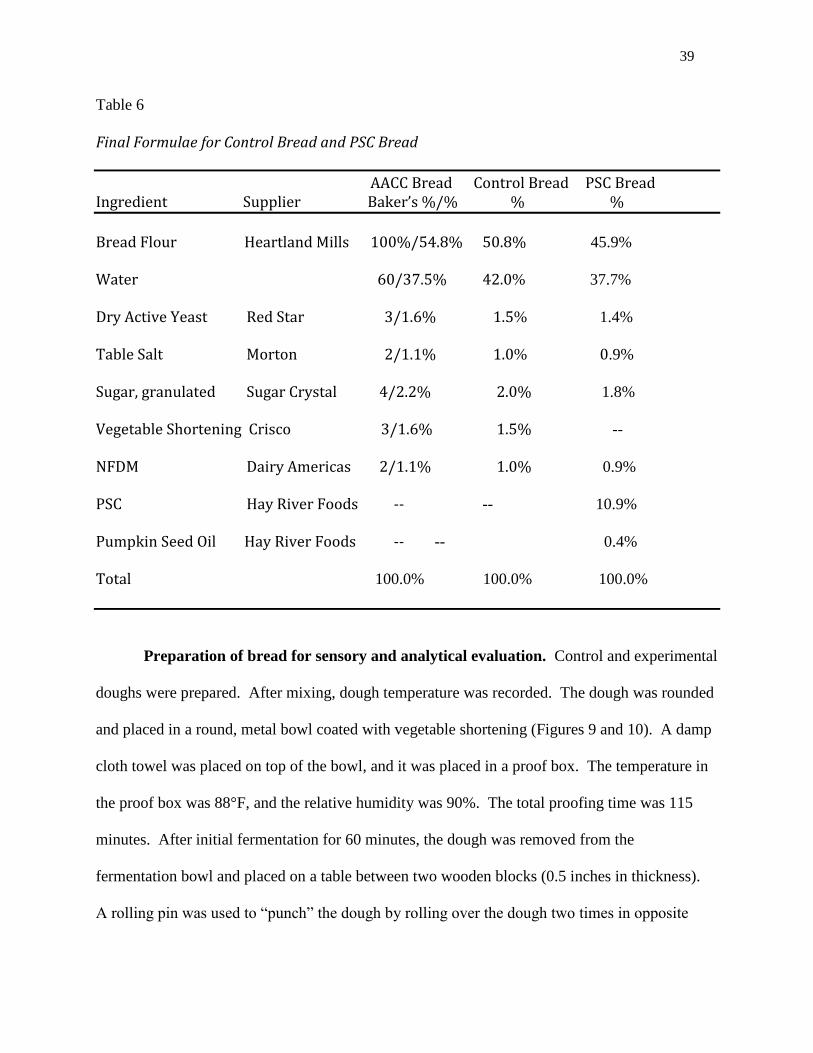
Table 6
Final Formulae for Control Bread and PSC Bread
AACC Bread Control Bread PSC Bread Ingredient Supplier Baker’s %/% % %
Bread Flour Heartland Mills 100%/54.8% 50.8% 45.9% Water 60/37.5% 42.0% 37.7% Dry Active Yeast Red Star 3/1.6% 1.5% 1.4% Table Salt Morton 2/1.1% 1.0% 0.9% Sugar, granulated Sugar Crystal 4/2.2% 2.0% 1.8% Vegetable Shortening Crisco 3/1.6% 1.5% -- NFDM Dairy Americas 2/1.1% 1.0% 0.9% PSC Hay River Foods -- -- 10.9% Pumpkin Seed Oil Hay River Foods -- -- 0.4% Total 100.0% 100.0% 100.0%
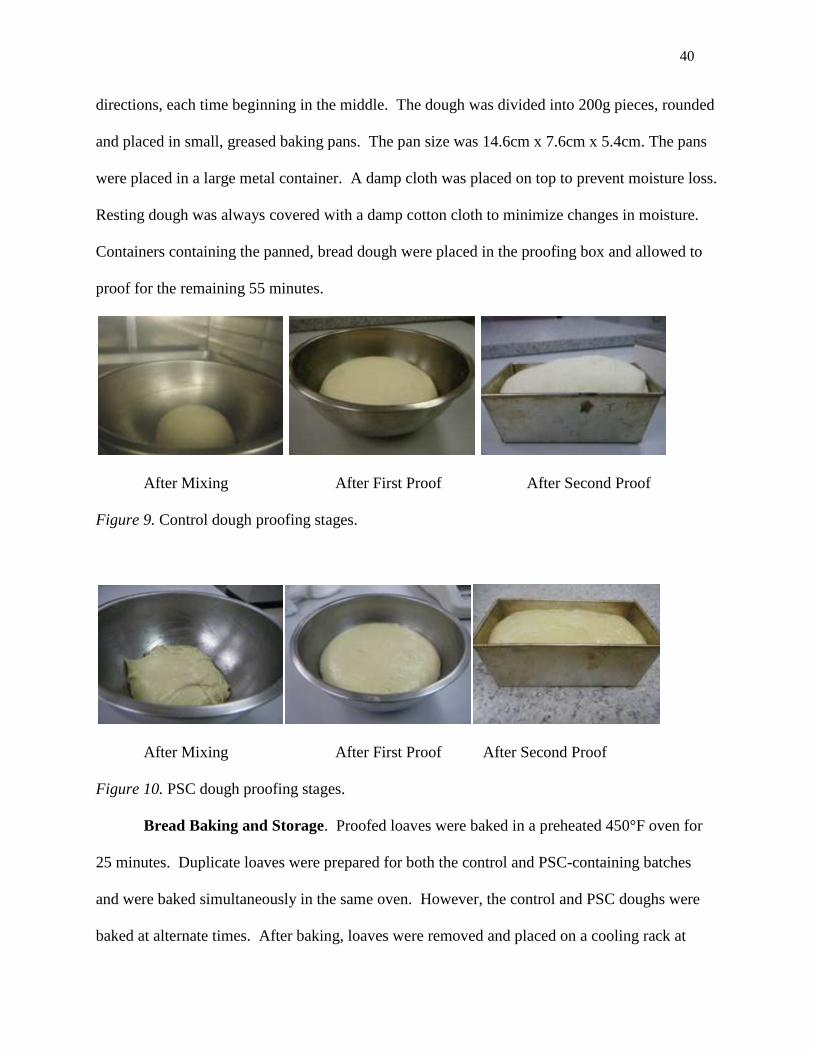
Preparation of bread for sensory and analytical evaluation. Control and experimental
doughs were prepared. After mixing, dough temperature was recorded. The dough was rounded
and placed in a round, metal bowl coated with vegetable shortening (Figures 9 and 10). A damp
cloth towel was placed on top of the bowl, and it was placed in a proof box. The temperature in
the proof box was 88°F, and the relative humidity was 90%. The total proofing time was 115
minutes. After initial fermentation for 60 minutes, the dough was removed from the
fermentation bowl and placed on a table between two wooden blocks (0.5 inches in thickness).
A rolling pin was used to “punch” the dough by rolling over the dough two times in opposite
40
directions, each time beginning in the middle. The dough was divided into 200g pieces, rounded
and placed in small, greased baking pans. The pan size was 14.6cm x 7.6cm x 5.4cm. The pans
were placed in a large metal container. A damp cloth was placed on top to prevent moisture loss.
Resting dough was always covered with a damp cotton cloth to minimize changes in moisture.
Containers containing the panned, bread dough were placed in the proofing box and allowed to
proof for the remaining 55 minutes.
After Mixing After First Proof After Second Proof
Figure 9. Control dough proofing stages.
After Mixing After First Proof After Second Proof
Figure 10. PSC dough proofing stages.
Bread Baking and Storage. Proofed loaves were baked in a preheated 450°F oven for
25 minutes. Duplicate loaves were prepared for both the control and PSC-containing batches
and were baked simultaneously in the same oven. However, the control and PSC doughs were
baked at alternate times. After baking, loaves were removed and placed on a cooling rack at
41
room temperature for two hours. After two hours of cooling, each loaf was placed in a plastic
bag and sealed.
Data Collection
Bread Measurements. The height, width, and length of each loaf of bread were
measured using an electronic 6” digital caliper (Cen-Tech) 30 minutes after baking. Height and
width were measured at three different points on each loaf; the middle, 30mm from the right
edge, and 30mm from the left edge of the loaf. Only one measurement was taken for the length
of each loaf of bread.
Crumb Structure. The crumb structure was evaluated using a photo copier to generate a
black and white image of a vertical slice from the loaf. The loaf was cut vertically in the middle
with a serrated bread knife and a “photograph” was made of the exposed side by placing it face
down on a copy machine. Digital photos were also taken of the cross section and a side of each
loaf.
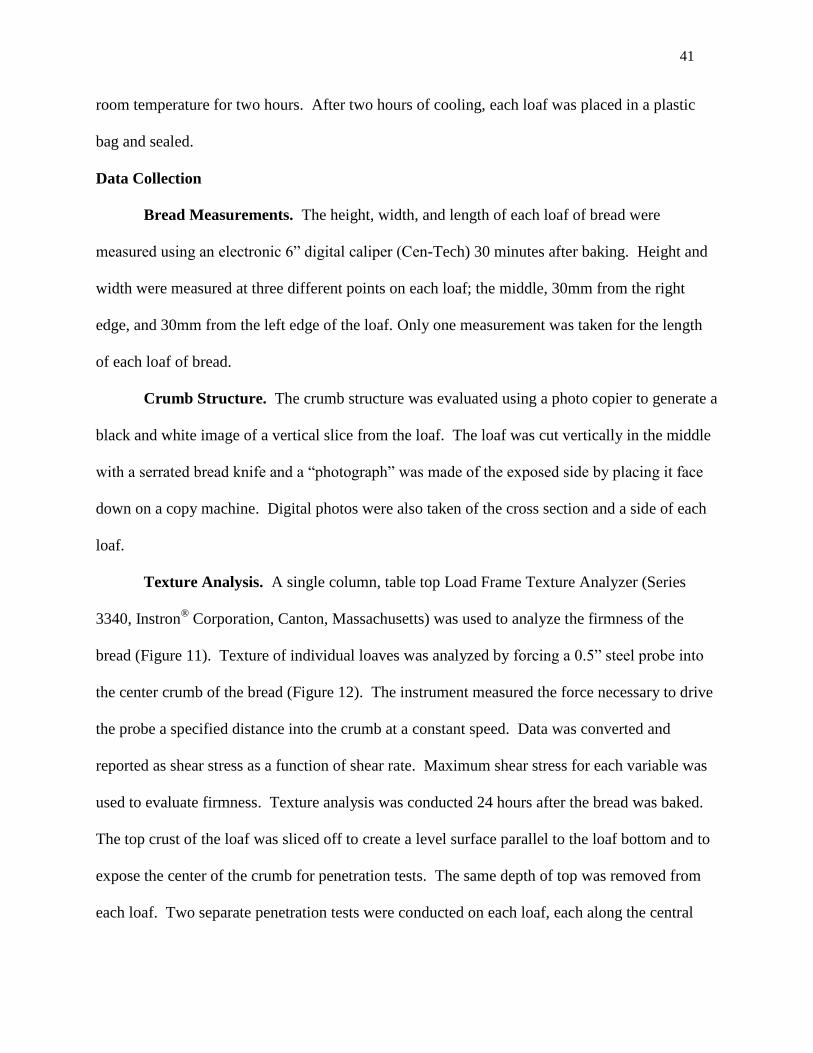
Texture Analysis. A single column, table top Load Frame Texture Analyzer (Series
3340, Instron® Corporation, Canton, Massachusetts) was used to analyze the firmness of the
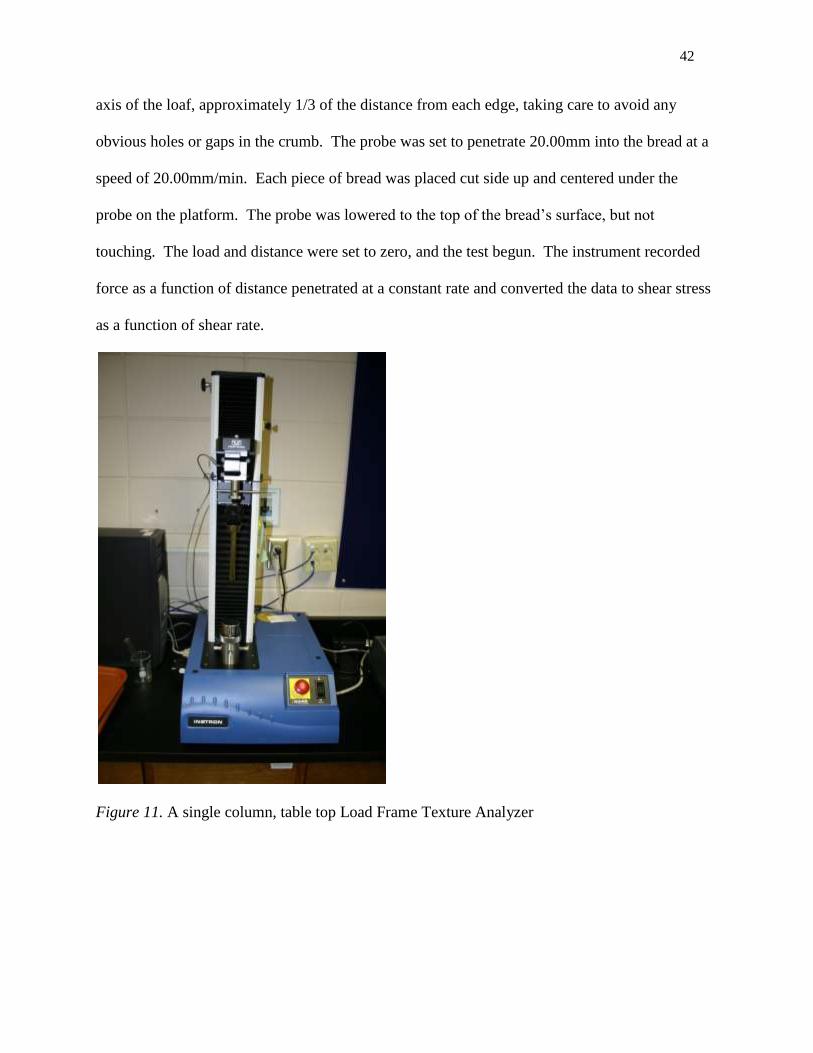
bread (Figure 11). Texture of individual loaves was analyzed by forcing a 0.5” steel probe into
the center crumb of the bread (Figure 12). The instrument measured the force necessary to drive
the probe a specified distance into the crumb at a constant speed. Data was converted and
reported as shear stress as a function of shear rate. Maximum shear stress for each variable was
used to evaluate firmness. Texture analysis was conducted 24 hours after the bread was baked.
The top crust of the loaf was sliced off to create a level surface parallel to the loaf bottom and to
expose the center of the crumb for penetration tests. The same depth of top was removed from
each loaf. Two separate penetration tests were conducted on each loaf, each along the central
42
axis of the loaf, approximately 1/3 of the distance from each edge, taking care to avoid any
obvious holes or gaps in the crumb. The probe was set to penetrate 20.00mm into the bread at a
speed of 20.00mm/min. Each piece of bread was placed cut side up and centered under the
probe on the platform. The probe was lowered to the top of the bread’s surface, but not
touching. The load and distance were set to zero, and the test begun. The instrument recorded
force as a function of distance penetrated at a constant rate and converted the data to shear stress
as a function of shear rate.
Figure 11. A single column, table top Load Frame Texture Analyzer
43
Figure 12. A 0.5” steel probe forced into the center crumb of the bread
Sensory Evaluation. Three replicate batches of the control and PSC bread were made
for sensory analysis. Bread was prepared 24 hours prior to testing. The sensory panel was
comprised of 104 students and faculty members randomly recruited through class
announcements, e-mails, and fliers posted on campus. Each participant signed a consent form
informing them of the dietary restrictions, time commitment and payment, risks and benefits of
the study, confidentiality and his/her voluntary participation rights. Panelists evaluated the
control and PSC bread for overall texture, nutty flavor, overall flavor, overall acceptance and
aftertaste.
Samples for sensory analysis were produced identically to those used for texture analysis.
The ends of the loaves of bread were cut off and the bread was cut into slices. Each slice was cut
in half so that each piece had a crust on three of the four edges. Random sample codes were
assigned to each sample.
44
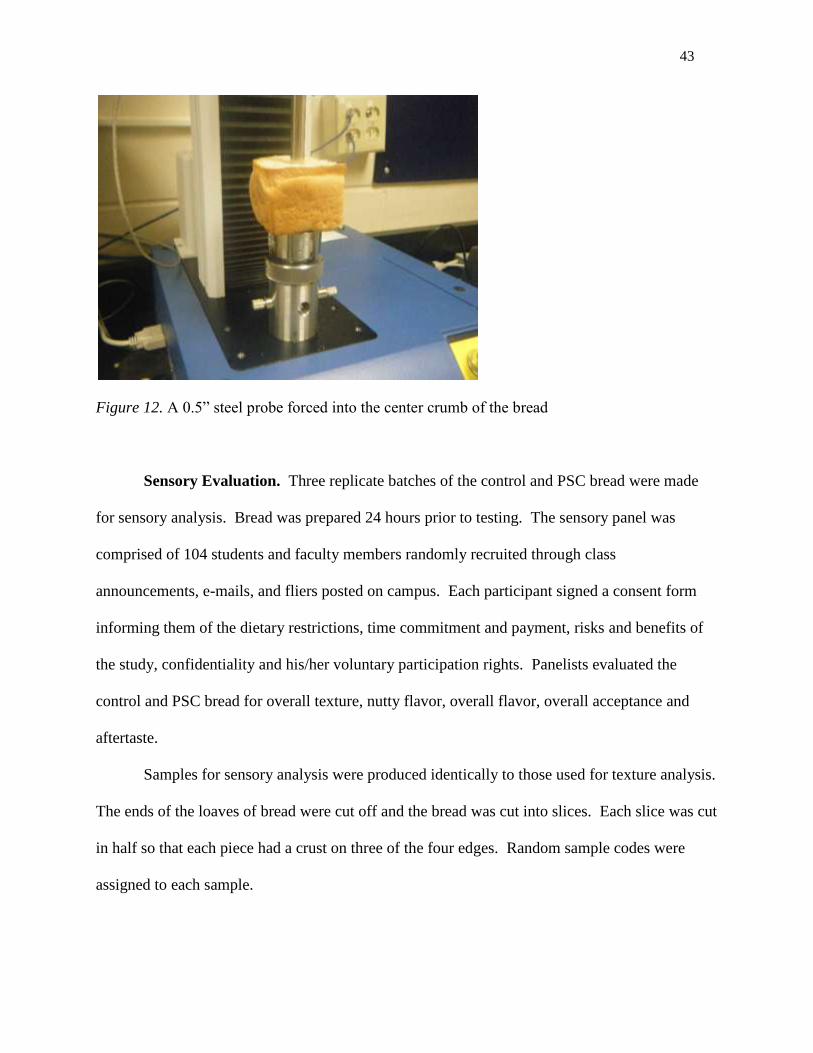
Each panelist received one control and one PSC piece of bread simultaneously on a single
tray (Figure 13). Samples were ordered randomly for each panelist. Panelists evaluated each
sample for intensity of nutty flavor, overall flavor, and aftertaste using a 1-5 hedonic scale. They
then evaluated each sample for liking of texture and overall acceptance using a 1-9 hedonic
scale. Each panelist was instructed to rate aftertaste by waiting 30 seconds after tasting each
sample. Compusense Sensory Software (Guelph, Ontario) was used to collect and analyze the
data. A bread sensory analysis scorecard is in Appendix A.
Figure 13. Tray setup of bread samples given to each panelist for evaluation.
45
Moisture Content. Moisture content of the pumpkin seed cake was determined by oven
drying and weight difference according to AACC Method 44-15A (2000). Triplicate samples of
PSC were weighed and placed in a convection oven (Model MO1450A/SA, Lindberg/Blue,
Asheville, North Carolina) for 24 hours at 103°C. Dried samples were weighed and weight loss
was calculated as percent moisture.
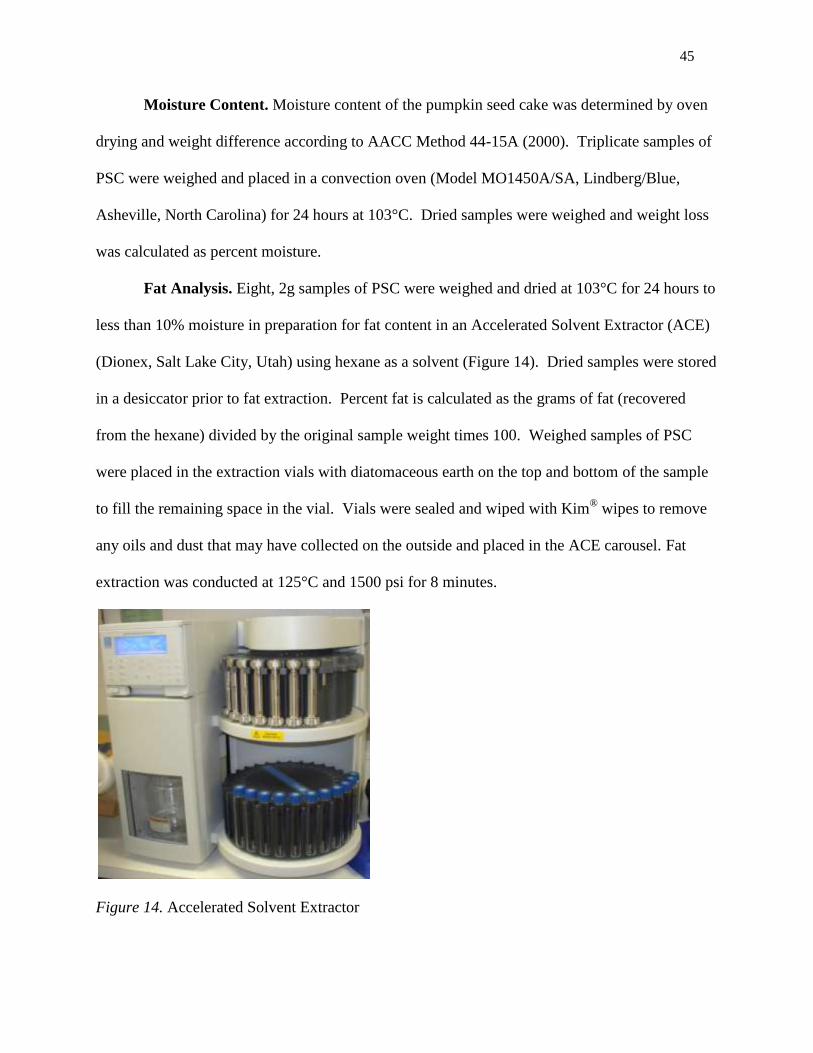
Fat Analysis. Eight, 2g samples of PSC were weighed and dried at 103°C for 24 hours to
less than 10% moisture in preparation for fat content in an Accelerated Solvent Extractor (ACE)
(Dionex, Salt Lake City, Utah) using hexane as a solvent (Figure 14). Dried samples were stored
in a desiccator prior to fat extraction. Percent fat is calculated as the grams of fat (recovered
from the hexane) divided by the original sample weight times 100. Weighed samples of PSC
were placed in the extraction vials with diatomaceous earth on the top and bottom of the sample
to fill the remaining space in the vial. Vials were sealed and wiped with Kim® wipes to remove
any oils and dust that may have collected on the outside and placed in the ACE carousel. Fat
extraction was conducted at 125°C and 1500 psi for 8 minutes.
Figure 14. Accelerated Solvent Extractor
46
Data Collection Procedures
The Statistical Program for Social Sciences (SPSS) version 17.0 (SPSS, 2010) was used
for the data analysis. Data for bread measurements, fat analysis, and moisture content was
analyzed by an independent sample t-test in SPSS. Compusense Sensory Software version 4.6
(Guelph, Ontario) was used to collect data for the sensory evaluation tests and computed
statistics on the data using the Tukeys HSD test. All tests were evaluated at a statistical
significance of p<0.05. A stress at maximum force was produced from the data collected by the
Instron®. The modulus (initial slope of the stress/strain curve), and maximum stress data were
analyzed in SPSS through an independent sample t-test.
47
Chapter IV: Results and Discussion
This research was designed to evaluate the effects of PSC on the texture of bread and to
determine if acceptable quality bread can be made using PSC. Bread was made with and without
PSC. It was analyzed for firmness using compression tests and specific sensory attributes using
an untrained sensory panel.
PSC Proximate Analysis
Data analysis gave a moisture content of 6% and a fat content of 37% in the PSC. The
protein (45%), carbohydrates (5%), and crude fiber (2.5%) were calculated by difference using
literature values (Table 7).
Table 7
Estimates of Proximate Composition of Macro Ingredients in PSC
Compound %
Moisture 6%
Protein 45%*
Fat 37%
Carbohydrates 5%*
Crude Fiber 2.5%*
*Calculated by difference using literature values (Deimel, 2007)
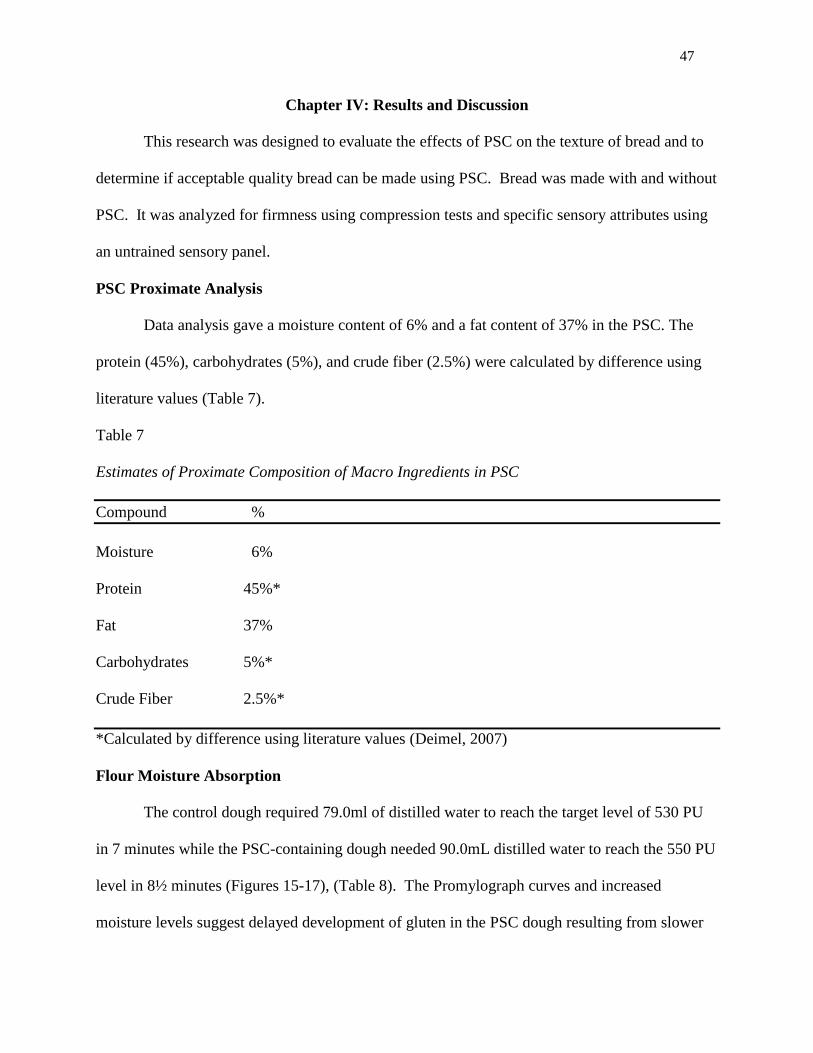
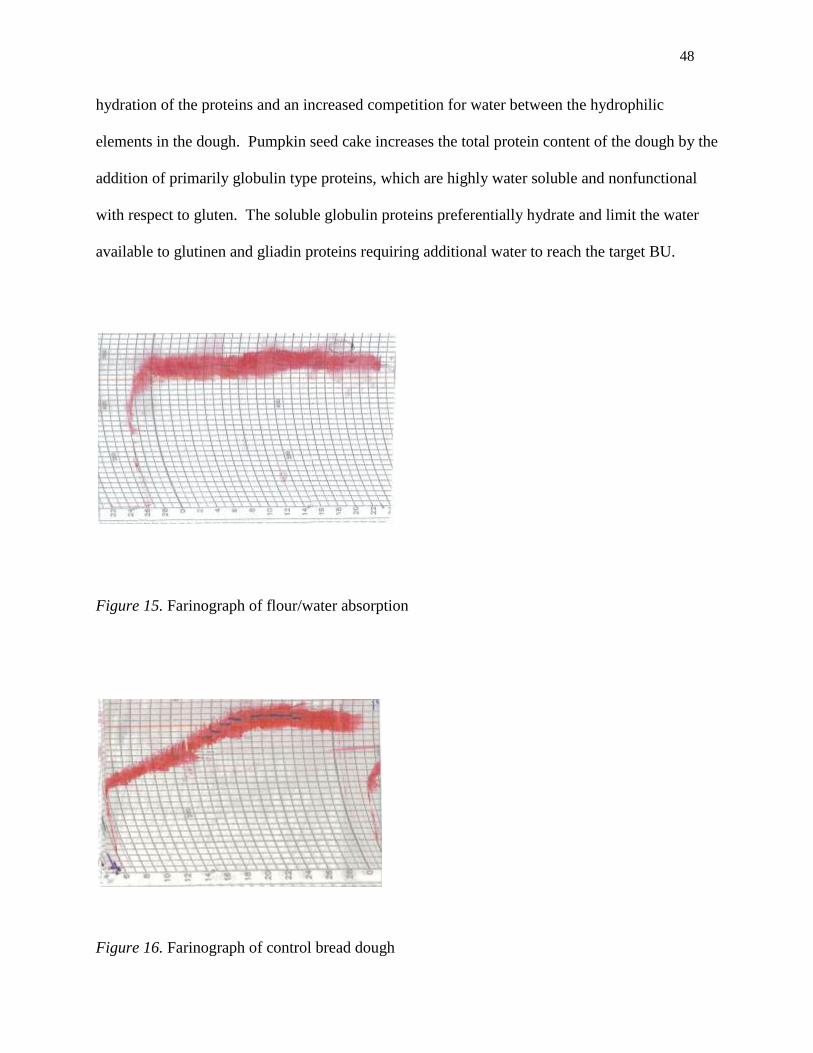
Flour Moisture Absorption
The control dough required 79.0ml of distilled water to reach the target level of 530 PU
in 7 minutes while the PSC-containing dough needed 90.0mL distilled water to reach the 550 PU
level in 8½ minutes (Figures 15-17), (Table 8). The Promylograph curves and increased
moisture levels suggest delayed development of gluten in the PSC dough resulting from slower
48
hydration of the proteins and an increased competition for water between the hydrophilic
elements in the dough. Pumpkin seed cake increases the total protein content of the dough by the
addition of primarily globulin type proteins, which are highly water soluble and nonfunctional
with respect to gluten. The soluble globulin proteins preferentially hydrate and limit the water
available to glutinen and gliadin proteins requiring additional water to reach the target BU.
Figure 15. Farinograph of flour/water absorption
Figure 16. Farinograph of control bread dough
49
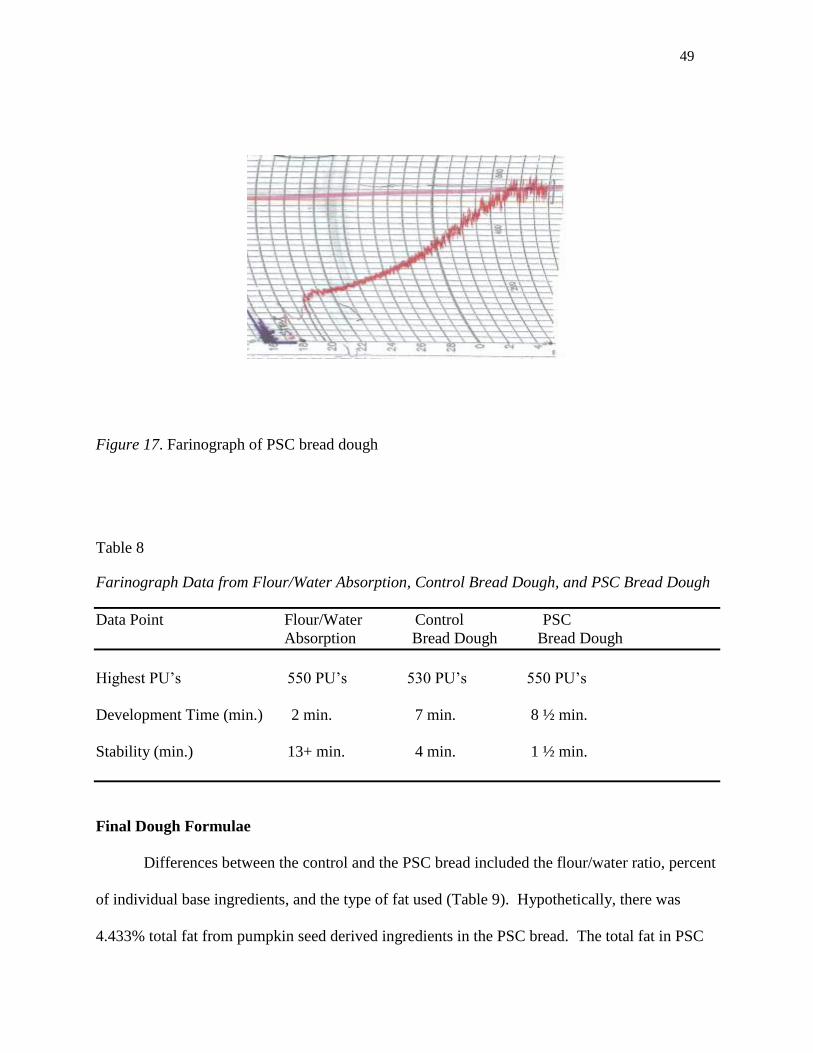
Figure 17. Farinograph of PSC bread dough
Table 8
Farinograph Data from Flour/Water Absorption, Control Bread Dough, and PSC Bread Dough
Data Point Flour/Water Control PSC
Absorption Bread Dough Bread Dough
Highest PU’s 550 PU’s 530 PU’s 550 PU’s
Development Time (min.) 2 min. 7 min. 8 ½ min.
Stability (min.) 13+ min. 4 min. 1 ½ min.
Final Dough Formulae
Differences between the control and the PSC bread included the flour/water ratio, percent
of individual base ingredients, and the type of fat used (Table 9). Hypothetically, there was
4.433% total fat from pumpkin seed derived ingredients in the PSC bread. The total fat in PSC
50
was unknown before bread formulation. Vegetable shortening was added to the control and PSC
and pumpkin seed oil were added to the PSC bread. The dough development time or time to
peak and the stability time differed between the control and PSC bread. The control bread dough
had a 7 minute development time and a 4 minute stability time. The PSC bread dough had an 8.5
minute development time and a 1.5 minute stability time. The height thickness of the ink line on
the PSC bread dough farinograph was very short compared to the control bread dough
farinograph. These differences can account for the addition of an oil and the type of proteins in
PSC in the PSC bread dough.
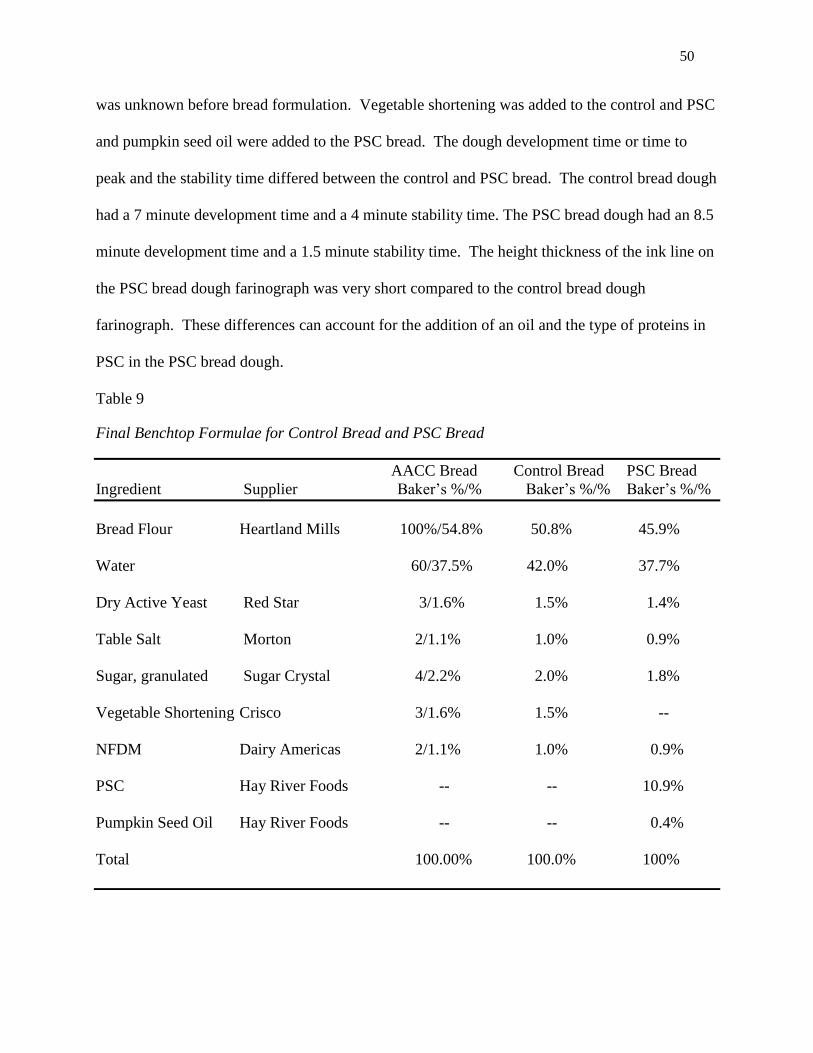
Table 9
Final Benchtop Formulae for Control Bread and PSC Bread
AACC Bread Control Bread PSC Bread
Ingredient Supplier Baker’s %/% Baker’s %/% Baker’s %/%
Bread Flour Heartland Mills 100%/54.8% 50.8% 45.9%
Water 60/37.5% 42.0% 37.7%
Dry Active Yeast Red Star 3/1.6% 1.5% 1.4%
Table Salt Morton 2/1.1% 1.0% 0.9%
Sugar, granulated Sugar Crystal 4/2.2% 2.0% 1.8%
Vegetable Shortening Crisco 3/1.6% 1.5% --
NFDM Dairy Americas 2/1.1% 1.0% 0.9%
PSC Hay River Foods -- -- 10.9%
Pumpkin Seed Oil Hay River Foods -- -- 0.4%
Total 100.00% 100.0% 100%
51
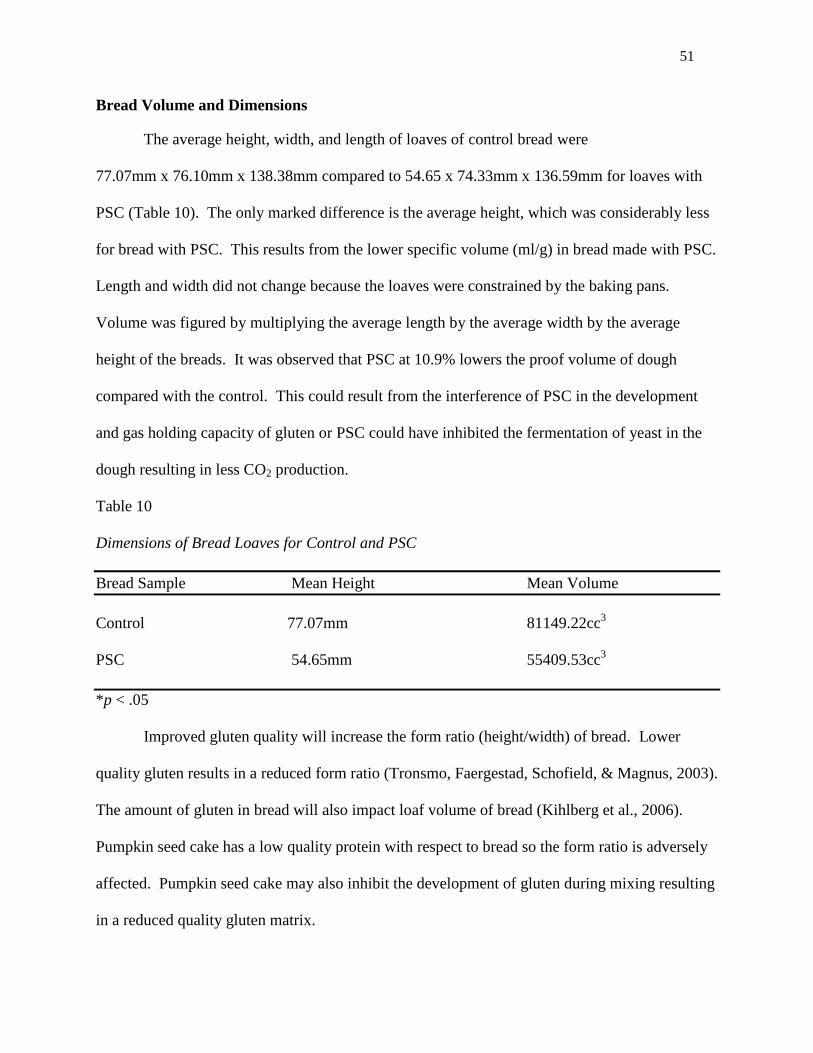
Bread Volume and Dimensions
The average height, width, and length of loaves of control bread were
77.07mm x 76.10mm x 138.38mm compared to 54.65 x 74.33mm x 136.59mm for loaves with
PSC (Table 10). The only marked difference is the average height, which was considerably less
for bread with PSC. This results from the lower specific volume (ml/g) in bread made with PSC.
Length and width did not change because the loaves were constrained by the baking pans.
Volume was figured by multiplying the average length by the average width by the average
height of the breads. It was observed that PSC at 10.9% lowers the proof volume of dough
compared with the control. This could result from the interference of PSC in the development
and gas holding capacity of gluten or PSC could have inhibited the fermentation of yeast in the
dough resulting in less CO2 production.
Table 10
Dimensions of Bread Loaves for Control and PSC
Bread Sample Mean Height Mean Volume
Control 77.07mm 81149.22cc3
PSC 54.65mm 55409.53cc3
*p < .05
Improved gluten quality will increase the form ratio (height/width) of bread. Lower
quality gluten results in a reduced form ratio (Tronsmo, Faergestad, Schofield, & Magnus, 2003).
The amount of gluten in bread will also impact loaf volume of bread (Kihlberg et al., 2006).
Pumpkin seed cake has a low quality protein with respect to bread so the form ratio is adversely
affected. Pumpkin seed cake may also inhibit the development of gluten during mixing resulting
in a reduced quality gluten matrix.
52
Changes to consider for improvement of volume and dense crumb in the PSC bread may
be to adjust the mix time or the addition of ingredients to increase gas-holding properties such as
an oxidant, dough strengthener, or vital wheat gluten (Atwell, 2001).
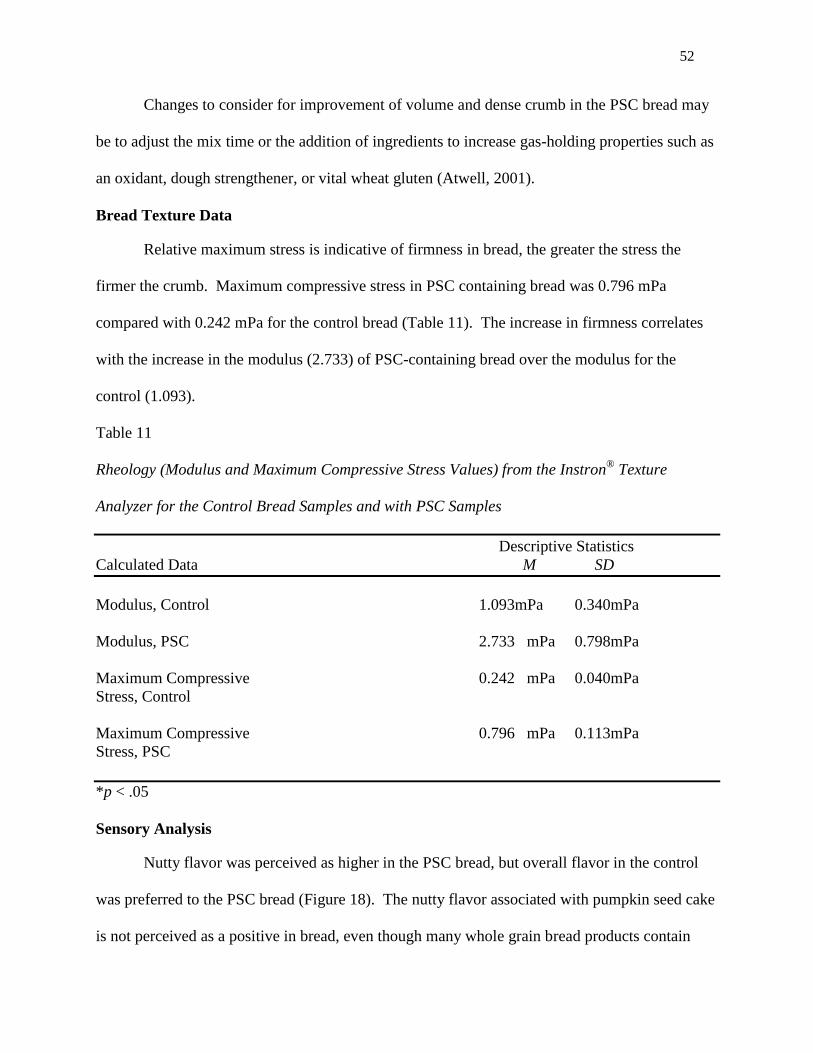
Bread Texture Data
Relative maximum stress is indicative of firmness in bread, the greater the stress the
firmer the crumb. Maximum compressive stress in PSC containing bread was 0.796 mPa
compared with 0.242 mPa for the control bread (Table 11). The increase in firmness correlates
with the increase in the modulus (2.733) of PSC-containing bread over the modulus for the
control (1.093).
Table 11
Rheology (Modulus and Maximum Compressive Stress Values) from the Instron®
Texture
Analyzer for the Control Bread Samples and with PSC Samples
Descriptive Statistics
Calculated Data M SD
Modulus, Control 1.093mPa 0.340mPa
Modulus, PSC 2.733 mPa 0.798mPa
Maximum Compressive 0.242 mPa 0.040mPa
Stress, Control
Maximum Compressive 0.796 mPa 0.113mPa
Stress, PSC
*p < .05
Sensory Analysis
Nutty flavor was perceived as higher in the PSC bread, but overall flavor in the control
was preferred to the PSC bread (Figure 18). The nutty flavor associated with pumpkin seed cake
is not perceived as a positive in bread, even though many whole grain bread products contain
53
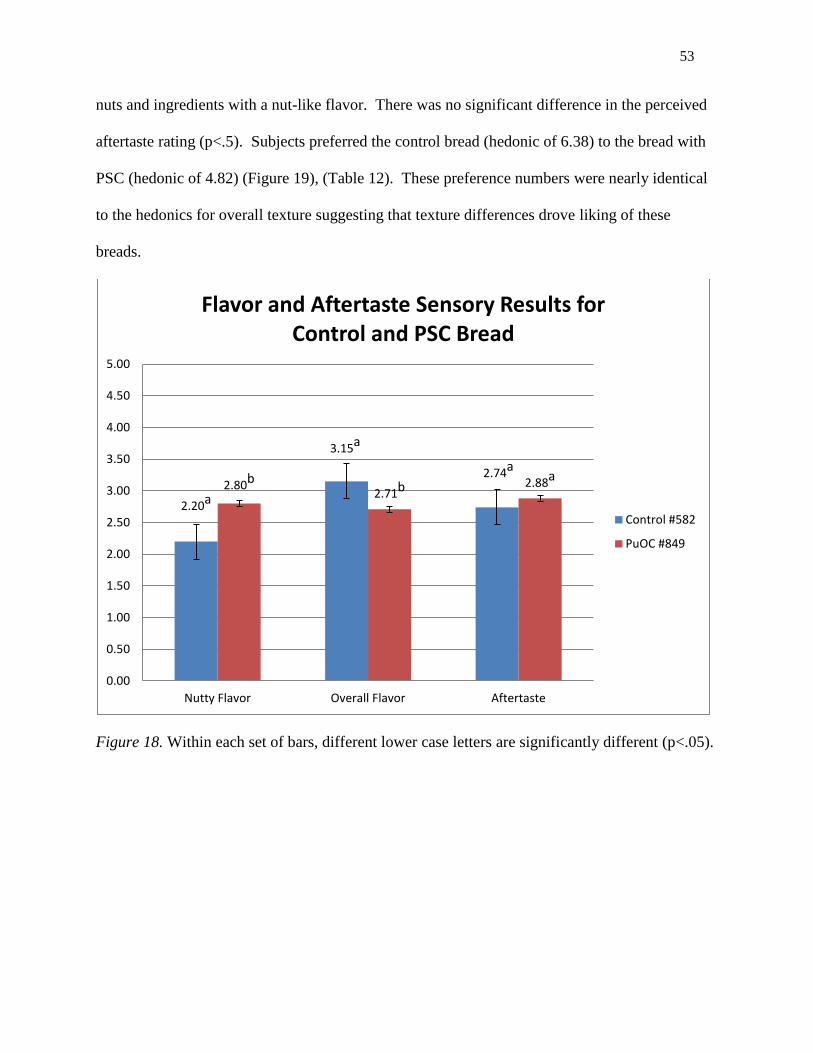
nuts and ingredients with a nut-like flavor. There was no significant difference in the perceived
aftertaste rating (p<.5). Subjects preferred the control bread (hedonic of 6.38) to the bread with
PSC (hedonic of 4.82) (Figure 19), (Table 12). These preference numbers were nearly identical
to the hedonics for overall texture suggesting that texture differences drove liking of these
breads.
Figure 18. Within each set of bars, different lower case letters are significantly different (p<.05).
2.20a
3.15a
2.74a
2.80b 2.71b 2.88a
0.00
0.50
1.00
1.50
2.00
2.50
3.00
3.50
4.00
4.50
5.00
Nutty Flavor Overall Flavor Aftertaste
Flavor and Aftertaste Sensory Results for Control and PSC Bread
Control #582
PuOC #849

54
Figure 19. Within each set of bars, different lower case letters are significantly different (p<.05).
Table 12
Sensory Evaluation Results of Control and PSC Bread
Descriptive Statistics
Attribute M SD
Nutty Flavor, Control 2.20 1.18
Nutty Flavor, PSC 2.80 1.12
Aftertaste, Control 2.74 1.21
Aftertaste, PSC 2.88 1.23
Overall Texture, Control 6.30 1.59
Overall Texture, PSC 4.66 1.91
Overall Flavor, Control 3.15 1.13
Overall Flavor, PSC 2.71 1.10
Overall Acceptance, Control 6.38 1.57
Overall Acceptance, PSC 4.82 2.03
*p < .05
6.30a 6.38a
4.66b 4.82b
0.00
1.00
2.00
3.00
4.00
5.00
6.00
7.00
8.00
9.00
Overall Texture Overall Acceptance
Texture and Acceptance Sensory Results for Control and PSC Bread
Control #582
PuOC #849
55
Appearance
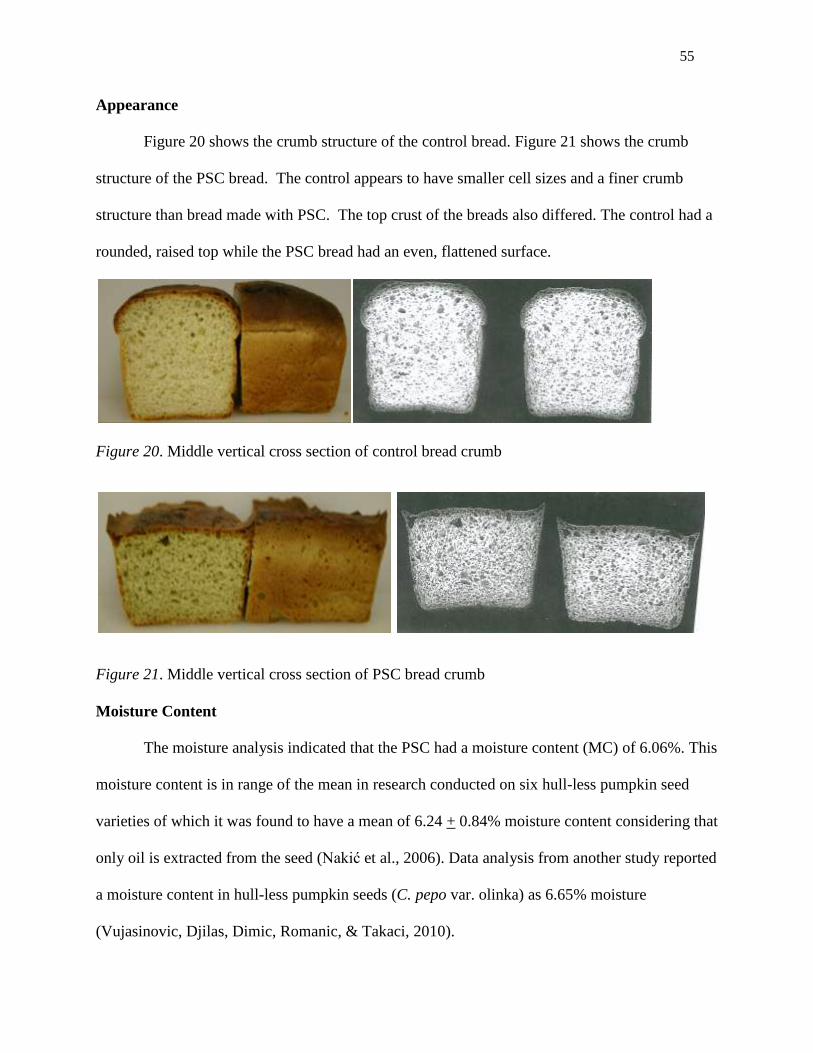
Figure 20 shows the crumb structure of the control bread. Figure 21 shows the crumb
structure of the PSC bread. The control appears to have smaller cell sizes and a finer crumb
structure than bread made with PSC. The top crust of the breads also differed. The control had a
rounded, raised top while the PSC bread had an even, flattened surface.
Figure 20. Middle vertical cross section of control bread crumb
Figure 21. Middle vertical cross section of PSC bread crumb
Moisture Content
The moisture analysis indicated that the PSC had a moisture content (MC) of 6.06%. This
moisture content is in range of the mean in research conducted on six hull-less pumpkin seed
varieties of which it was found to have a mean of 6.24 + 0.84% moisture content considering that
only oil is extracted from the seed (Nakić et al., 2006). Data analysis from another study reported
a moisture content in hull-less pumpkin seeds (C. pepo var. olinka) as 6.65% moisture
(Vujasinovic, Djilas, Dimic, Romanic, & Takaci, 2010).
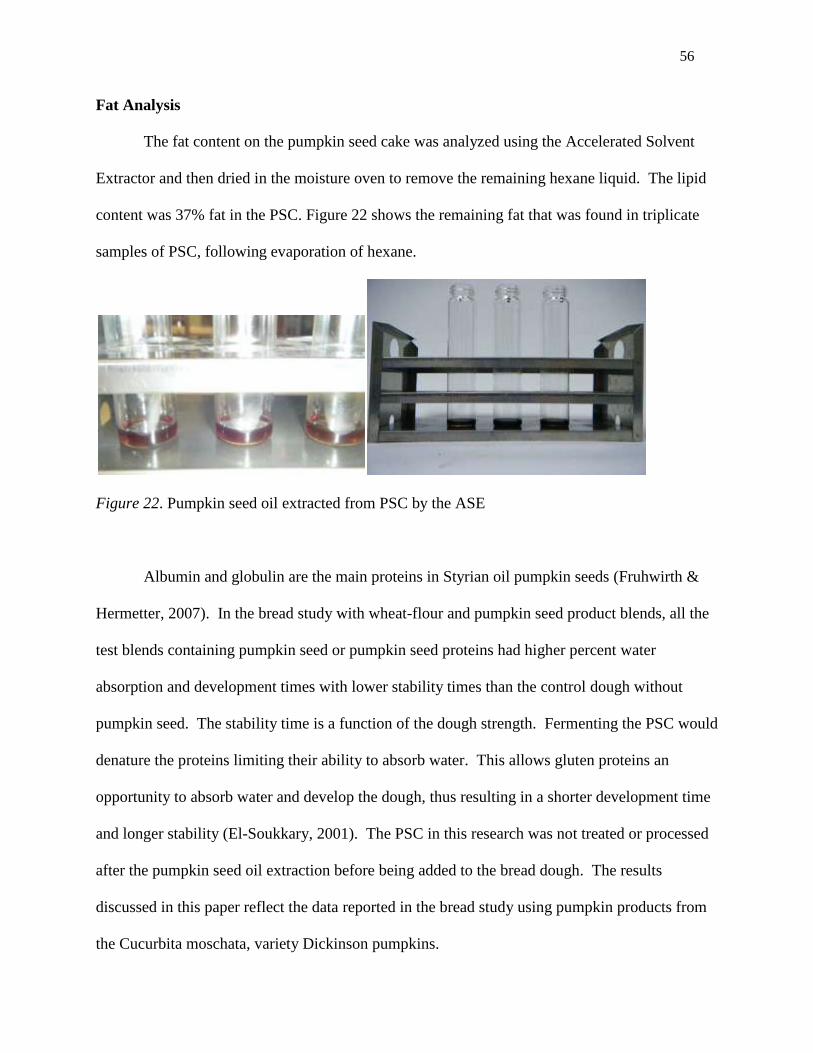
56
Fat Analysis
The fat content on the pumpkin seed cake was analyzed using the Accelerated Solvent
Extractor and then dried in the moisture oven to remove the remaining hexane liquid. The lipid
content was 37% fat in the PSC. Figure 22 shows the remaining fat that was found in triplicate
samples of PSC, following evaporation of hexane.
Figure 22. Pumpkin seed oil extracted from PSC by the ASE
Albumin and globulin are the main proteins in Styrian oil pumpkin seeds (Fruhwirth &
Hermetter, 2007). In the bread study with wheat-flour and pumpkin seed product blends, all the
test blends containing pumpkin seed or pumpkin seed proteins had higher percent water
absorption and development times with lower stability times than the control dough without
pumpkin seed. The stability time is a function of the dough strength. Fermenting the PSC would
denature the proteins limiting their ability to absorb water. This allows gluten proteins an
opportunity to absorb water and develop the dough, thus resulting in a shorter development time
and longer stability (El-Soukkary, 2001). The PSC in this research was not treated or processed
after the pumpkin seed oil extraction before being added to the bread dough. The results
discussed in this paper reflect the data reported in the bread study using pumpkin products from
the Cucurbita moschata, variety Dickinson pumpkins.

57
Chapter V: Conclusion
An attempt was made to produce quality bread using pumpkin seed cake as a source of
antioxidants, protein, and monounsaturated and polyunsaturated fatty acids. The data from the
material properties and sensory analysis (except in overall aftertaste) was significantly different
between the control bread and the PSC bread. This research was conducted as a baseline to
determine if PSC could be used to make good quality bread. It was determined that further bread
formulation with the PSC to improve consumer acceptability is recommended. Utilizing PSC, a
by-product of expelling pumpkin seed oil, in food products needs further investigation to
determine if its nutritional properties offer an economical alternative to disposing PSC as
fertilizer on crop fields or mixing into animal feed.
The PSC inhibits gluten development by interfering with the interaction of glutenin and
gliadin during mixing. This interference was shown in the low proof height of the PSC dough
and the low bread loaf height in the PSC bread. Pumpkin seed cake becomes a non-functional
nutritional additive disrupting gas-holding capacity of gluten in bread. Pumpkin seed cake
affects the height, volume, crumb structure, textural properties, and sensory properties when
added to a yeast leavened white wheat bread.
Pumpkin seed cake still contains about 37% oil after expelling oil the first time. Oil
breaks down foams. Bread dough is a foam and this additional oil in the PSC may be
contributing to the final bread structure.
Volume and Texture Relationship
Even though the control and the PSC bread contained the same amount of wheat flour,
there was a higher percent of gluten in the control compared to the PSC bread. This resulted in
size differences between PSC bread and control bread. The PSC bread could not tolerate the
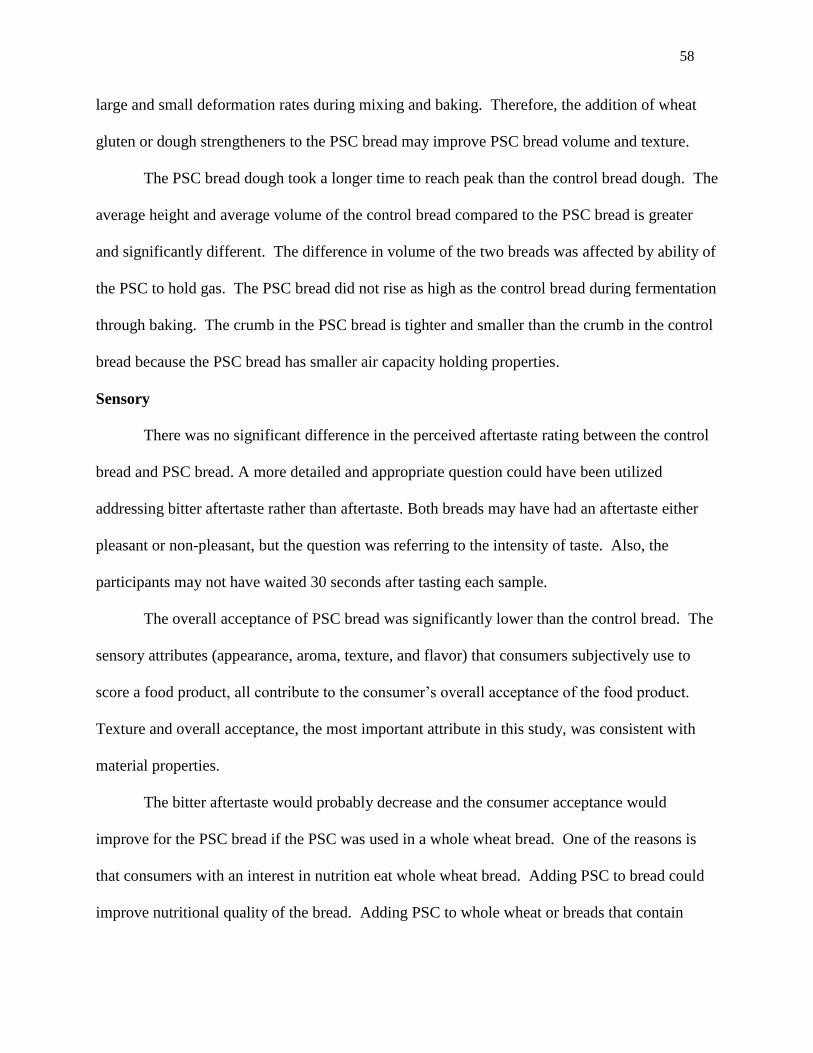
58
large and small deformation rates during mixing and baking. Therefore, the addition of wheat
gluten or dough strengtheners to the PSC bread may improve PSC bread volume and texture.
The PSC bread dough took a longer time to reach peak than the control bread dough. The
average height and average volume of the control bread compared to the PSC bread is greater
and significantly different. The difference in volume of the two breads was affected by ability of
the PSC to hold gas. The PSC bread did not rise as high as the control bread during fermentation
through baking. The crumb in the PSC bread is tighter and smaller than the crumb in the control
bread because the PSC bread has smaller air capacity holding properties.
Sensory
There was no significant difference in the perceived aftertaste rating between the control
bread and PSC bread. A more detailed and appropriate question could have been utilized
addressing bitter aftertaste rather than aftertaste. Both breads may have had an aftertaste either
pleasant or non-pleasant, but the question was referring to the intensity of taste. Also, the
participants may not have waited 30 seconds after tasting each sample.
The overall acceptance of PSC bread was significantly lower than the control bread. The
sensory attributes (appearance, aroma, texture, and flavor) that consumers subjectively use to
score a food product, all contribute to the consumer’s overall acceptance of the food product.
Texture and overall acceptance, the most important attribute in this study, was consistent with
material properties.
The bitter aftertaste would probably decrease and the consumer acceptance would
improve for the PSC bread if the PSC was used in a whole wheat bread. One of the reasons is
that consumers with an interest in nutrition eat whole wheat bread. Adding PSC to bread could
improve nutritional quality of the bread. Adding PSC to whole wheat or breads that contain
59
whole grains and seeds, could mask the taste and texture issues outlined in this study. Pumpkin
seed cake was added to a white wheat bread to magnify the differences between the PSC bread
and control bread. Future research could include adding pumpkin seed cake to a whole wheat
bread that contains other adjuncts like pumpkin seeds, nuts, raisins, etc. to disguise the bitterness
of PSC.
Sensory and Texture Relationship
The control bread and PSC bread were characterized using compression analysis. The
texture data was consistent with the sensory properties of the bread. The sensory and texture
relationship was negatively correlated; the higher the maximum stress, the lower the texture
preference in the sensory test. In the sensory test, texture drove the overall acceptance. Based
upon an average consumer acceptance, the PSC bread scored lower than the control bread in the
sensory test.
Economic Value
If an acceptable consumer bread product with PSC can be made, PSC can become a value
generating ingredient rather than a liability. Even if bread is not the best target food product for
PSC, this study suggests that PSC could be used in other more flavorful food applications such
as nutrition bars, pesto, or a products with whole grains.
Recommendations
Pumpkin seed meal (pumpkin seed cake with remaining oil removed) may work better in
the PSC bread and could replace some of the flour. Experimentation with the addition of wheat
gluten may enhance the texture, sensory, and volume properties. A new formula or a change in
the process may improve the gas holding capacity to increase the volume and improve the
consumer acceptability of the PSC bread texture. This would have a positive effect on the PSC

60
bread, because the height of the bread would increase. The pumpkin seed products could be
fermented before being added into the dough. This would result in a higher protein bread than
standard wheat bread. Ideally, the fermentation step would break down the proteins and decrease
the competition for water between the functional and non-functional proteins in dough
development.

61
References
American Association of Cereal Chemists (AACC). Approved Methods Committee. (2000).
(10th
Ed.), St. Paul, MN: AACC
Andjelkovic, M., Van Camp, J., Trawka, A., & Verhé,R., (2010). Phenolic compounds
and some quality parameters of pumpkin seed oil. European Journal of Lipid
Science and Technology. 112(2), 208-217. doi: 10.1002/ejlt.200900021
Applequist, W., Avula, B., Schaneberg, B., Wang, Y., & Khan, I. (2006). Comparative
fatty acid content of seeds of four Curcurbita species grown in a common
(shared) garden. Journal of Food Composition and Analysis, 19(6-7), 606-611.
doi: 10.1016/j.jfca.2006.01.001
Atwell, B. (2001). Wheat and flour testing: Wheat flour. (pp. 53-55). American Association of
Cereal Chemists. St. Paul, MN: AACC International, Inc.
Bavec, F., Mlakar, S., Rozman, C., & Bavec, M. (2007). Oil pumpkins: Niche for organic
producers. Reprinted from: Issues in new crops and new uses. 2007. J. Janick &
A. Whipkey (eds.). ASHS Press, Alexandria, VA. Retrieved from
http://www.hort.purdue.edu/newcrop/ncnu07/pdfs/bavec185-189.pdf
Botanical Oil Innovations. (2011a). NatureFRESH cold-press.™ Retrieved from
http://www.botanicoil.com/research/cold_press_process.htm
Botanical Oil Innovations. (2011b). Pumpkin seed oil from certified organic pumpkin seed.
Retrieved from http://www.botanicoil.com/datasheets/pumpkin%20seed%20oil.pdf
Caili, F., Huan S., & Quanhong, L. (2006). A review on pharmacological activities and
utilization technologies of pumpkin. Plant Foods for Human Nutrition, 61(2), 73-80. doi:
10.1007/s11130-006-0016-6
62
Cucurbit network news. (2004). Retrieved from http://www.cucurbit.org/oilpages/backgr.html
Damodaran, S., Parkin, K., & Fennema, O. (2007) Lipids. (4th
Ed.), Fennema’s Food Chemistry
(186-191). Boca Raton, FL: CRC Press.
Deimel, T. (2007). Important facts about award-winning styrian pumpkin seed oil and
your health. Retrieved from: www.deimel.biz/_biz/info/pumpkinoil.htm
Delcour, A., & Hoseney, R. (2010a). Proteins of cereals. (3rd
Ed.), Principles of Cereal Science
and Technology (pp. 58-59). American Association of Cereal Chemists. St. Paul, MN:
AACC International, Inc.
Delcour, A., & Hoseney, R. (2010b). Rheology of doughs and batters. (3rd Ed.), Principles of
Cereal Science and Technology (pp. 87-88). American Association of Cereal Chemists.
St. Paul, MN: AACC International, Inc.
Dubois, V., Breton. S., Linder, M., Fanni, J., & Parmentier, M. (2007). Fatty acid profile
of 80 vegetable oils with regard to their nutritional potential. European Journal of
Lipid Science and Technology, 109(7), 710-732. doi:10.1002/ejlt.200700040
El-Soukkary, F. (2001). Evaluation of pumpkin seed products for bread fortification.
Plant Foods for Human Nutrition, 56(4), 365-384.
FAO Corporate Document Repository. (1999) SECTION 1. Codex general standard for
fats and oils. Codex standard for edible fats and oils not covered by individual
standards. Retrieved from
http://www.fao.org/DOCREP/004/Y2774E/y2774e03.htm
Fischerauer, A. (1996). All about pumpkin seed oil. Retrieved from
www.pumpkinseedoil.com/procedure
63
Fruhwirth, G., & Hermetter, A. (2007). Seeds and oil of the Styrian oil pumpkin:
Components and biological activities. European Journal of Lipid Science and
Technology, 109(11), 1128-1140. doi:10.1002/ejlt.200700105
Fruhwirth, G., & Hermetter, A. (2008). Production technology and characteristics of
Styrian pumpkin seed oil. European Journal of Lipid Science and Technology,
110(7), 637-644. doi: 10.1002/ejlt.200700257
Gallagher, E., Gormley, T., & Arendt, E. (2003). Crust and crumb characteristics of gluten free
breads. Journal of Food Engineering. 56(2-3), 153-161. doi:10.1016/S0260-
8774(02)00244-3
Gorjanović, S., Rabrenović, B., Novaković, M., Dimić, E., Basić, Z., & Sužnjević.
(2011). Cold-pressed pumpkin seed oil antioxidant activity as determined by a DC
polarographic assay based on hydrogen peroxide scavenge. Journal of the
American Oil Chemists’ Society, 88(12), 1875-1882. doi:10.1007/s11746-011-
1863-3
Gryglewicz, S., Grabas, K., & Gryglewicz, G. (2000). Use of vegetable oils and fatty acid
methyl esters in the production of spherical activated carbons. Bioresource
Technology, 75(3), 213-218. doi:10.1016/S0960-8524(00)00054-7
Halvorsen, B., Carlsen, M., Phillips, K., Bøhn, S., Holte, K., Jacobs Jr., D., & Blomhoff, R.
(2006). Content of redox-active compounds (ie, antioxidants) in foods consumed in the
United States. The American Journal of Clincial Nutrition, 84(1), 95-135. Retrieved from
www.ajcn.org
64
Joebstl, D., Bandoniene, D., Meisel, T., & Chatzistathis, S. (2010). Identification of the
geographical origin of pumpkin seed oil by the use of rare earth elements and
discriminant analysis. Food Chemistry, 123(4), 1303-1309.
doi:10.1016/j.foodchem.2010.06.009
Kemble, J., Sikora, E., Zehnder, G., & Bauske, E. (2000). Guide to commercial pumpkin and
winter squash production. Alabama Cooperative Extension System. ANR-1041
http://www.aces.edu/pubs/docs/A/ANR-1041/ANR-1041.pdfF
Kihlberg, I., Öström, Ǻ., Johansson, L., & Risvik, E. (2006). Sensory qualities of plain white pan
bread: Influence of farming system, year of harvest and baking technique. Journal of
Cereal Science, 43(1), 15-30. doi:10.1016/j.jcs.2005.04.008
Marr, C., Schaplowsky, T., & Carey, T. (2004). Commercial vegetable production: Pumpkins.
Kansas State University Agricultural Experiment Station and Cooperative Extension
Service. Retrieved from www.oznet.ksu.edu
Matthäus, B., & Spener, F. (2008). What we know and what we should know about
virgin oils – a general introduction. European Journal of Lipid Science and
Technology, 110(7), 597-601.
Miyazaki, M., Maeda, T., & Morita, N. (2004). Effect of various dextrin substitutes for wheat
flour on dough properties and bread qualities. Food Research International, 37(1), 59-64.
doi:10.1016/j.foodres.2003.08.007
Murkovic, M., & Pfannhauser W. (2000). Stability of pumpkin seed oil. European
Journal of Lipid Science and Technology, 102(10), 607-611.
doi: 10.1002/1438-9312(200010)

65
Murkovic, M., Piironen, V., Lampi, A., Kraushofer, T., & Sontag, G. (2004). Changes in
chemical composition of pumpkin seeds during the roasting process for
production of pumpkin seed oil (Part 1: non-volatile compounds), Food
Chemistry, 84(3) 359-365. doi:10.1016/S0308-8146(03)00240-1
Nakić, S., Rade, D., Škevin, D., Štrucelj, D., Mokrovčak, Ž., & Bartolić, M. (2006).
Chemical characteristics of oils from naked and husk seeds of Cucurbita pepo L.
European Journal of Lipid Science and Technology, 108(11), 963-943. doi:
10.1002/ejlt.200600161
Nyam, K., Tan, C. Lai, O., Long, K., & Che Man, Y. (2009). Physicochemical properties and
bioactive compounds of selected seed oils. LWT - Food Science and Technology, 42(8),
1396-1403. doi:10.1016/j.lwt.2009.03.006
Parry, J., Hao, Z., Luther, M., Su, L., Zhou, K., & Yu, L. (2006). Characterization of cold-
pressed onion, parsley, cardamom, mullein, roasted pumpkin, and milk thistle seed oils.
Journal of the American Oil Chemists' Society, 83(10), 847-854. doi:10.1007/s11746-
006-5036-8
Peričin, D., Krimer, V., Trivić, S., & Radulović, L. (2009). The distribution of phenolic
acids in pumpkin’s hull-less seed, skin, oil cake meal, dehulled kernel and hull.
Food Chemistry, 113(2), 450-456. doi:10.1016/j.foodchem.2008.08.079
Popović, S., Peričin, D., Vaštag, Ž., Popović, L., & Lazić,V. (2010). Evaluation of edible
film-forming ability of pumpkin oil cake; effect of pH and temperature. Food
Hydrocolloids, 25(3), 470-476. doi:10.1016/j.foodhyd.2010.07.022
66
Robbins, R. (2003). Phenolic acids in foods: An overview of analytical methodology. Journal of
Agricultural and Food Chemistry, 51(10), 2866–2887.
doi: 10.1021/jf026182t
Ruckenbauer, P. (1999). Forming part of the IENICA project. Retrieved from University
of Agricultural Sciences Vienna, Institute of Agronomy and Plant Breeding
website www.ienica.net/reports/austria.pdf
Scanlon, M., & Zghal, M. (2001). Bread properties and crumb structure. Food
Research International, 34(10), 841–864. doi:10.1016/S0963-9969(01)00109-0
Szterk, A., Roszko, M., Sosińska, E., Derewiaka, D., & Lewicki, P., (2010). Chemical
composition and oxidative stability of selected plant oils. Journal of the American Oil
Chemists' Society, 87(6), 637–645. doi:10.1007/s11746-009-1539-4
Tan, C., Man, C., Selamat, J., & Yusoff, M., (2002) Comparative studies of oxidative
stability of edible oils by differential scanning calorimetry and oxidative stability
index methods. Food Chemistry, 76(3) 385-389.
doi:10.1016/S0308-8146(01)00272-2
Tanner, R., Qi, F., & Dai, S. (2008). Bread dough rheology and recoil I. Rheology. Journal of
Non-Newtonian Fluid Mechanics, 148(1-3), 33-40. doi:10.1016/j.jnnfm.2007.04.006
Tronsmo, K., Faergestad, E., Schofield, J., & Magnus, E. (2003). Wheat protein quality
in relation to baking performance evaluated by the Chorleywood bread process
and a hearth bread baking test. Journal of Cereal Science, 38(2), 205-215. doi:
10.1016/S0733-5210(03)00027-4
USDA (United States Department of Agriculture) Agricultural Research Service. (2010).
USDA database for the oxygen radical absorbance capacity (ORAC) of selected

67
foods, Release 2. Retrieved from
http://www.ars.usda.gov/SP2UserFiles/Place/12354500/Data/ORAC/ORAC_R2.p
df
Vaisey-Genser, M., Malcolmson, L., Ryland, D., Przybylski, R., Eskin, A., & Armstrong, L.
(1994). Consumer acceptance of canola oils during temperature-accelerated storage.
Food Quality and Preference, 5(4), 237-243.
Vaštag, Z, Popović, L., Popović, S., Krimer, V., & Peričin, D. (2010). Hydrolysis of
pumpkin oil cake protein isolate and free radical scavenging activity of
hydrolysates: Influence of temperature, enzyme/substrate ratio and time. Food
and Bioproducts Processing, 88(2-3), 277-282. doi:10.1016/j.fbp.2009.12.003
Vujasinovic, V., Djilas, S., Dimic, E. Romanic, R., & Takaci, A. (2010). Shelf life of
cold-pressed pumpkin (Cucurbita pepo L.) seed oil obtained with a screw press.
Journal of the American Oil Chemists’ Society, 87(12), 1497-1505. doi:
10.1007/s11746-011-1863-3
Weipert, D. (1990). The benefits of basic rheometry in studying dough rheology. Cereal
Chemsitry, 67(4), 311-317.
Willis, L. M., Shukitt-Hale, B., & Joseph, J. A. (2009). Modulation of cognition and
behavior in aged animals: role for antioxidant- and essential fatty acid-rich plant
foods. The American Journal of Clincial Nutrition, 89(5), 1602S-1606S.
Retrieved from www.ajcn.org
Xanthopoulou, M., Nomikos, T., Fragopoulou, E., & Antonopoulou,S. (2009). Antioxidant and
lipoxygenase inhibitory activities of pumpkin seed extracts. Food Research International,
42(5-6), 641-646. doi:10.1016/j.foodres.2009.02.003
68
Zdunczyk, Z., Minakowski, D., Frejnagel S., & Flis M. (1999). Comparative study of the
chemical composition and nutritional value of pumpkin seed cake, soybean meal and
casein. Food/Nahrung, 43(6), 392-395. doi:10.1002/(SICI)1521-
3803(19991201)43:6<392::AID-FOOD392>3.0.CO;2-2
Zghal, M., Scanlon, M., & Sapirstein, H. (2002). Cellular structure of bread crumbs and
its influence on mechanical properties. Journal of Cereal Science, 36(2), 167-176.
doi:10.1006/jcrs.2001.0445
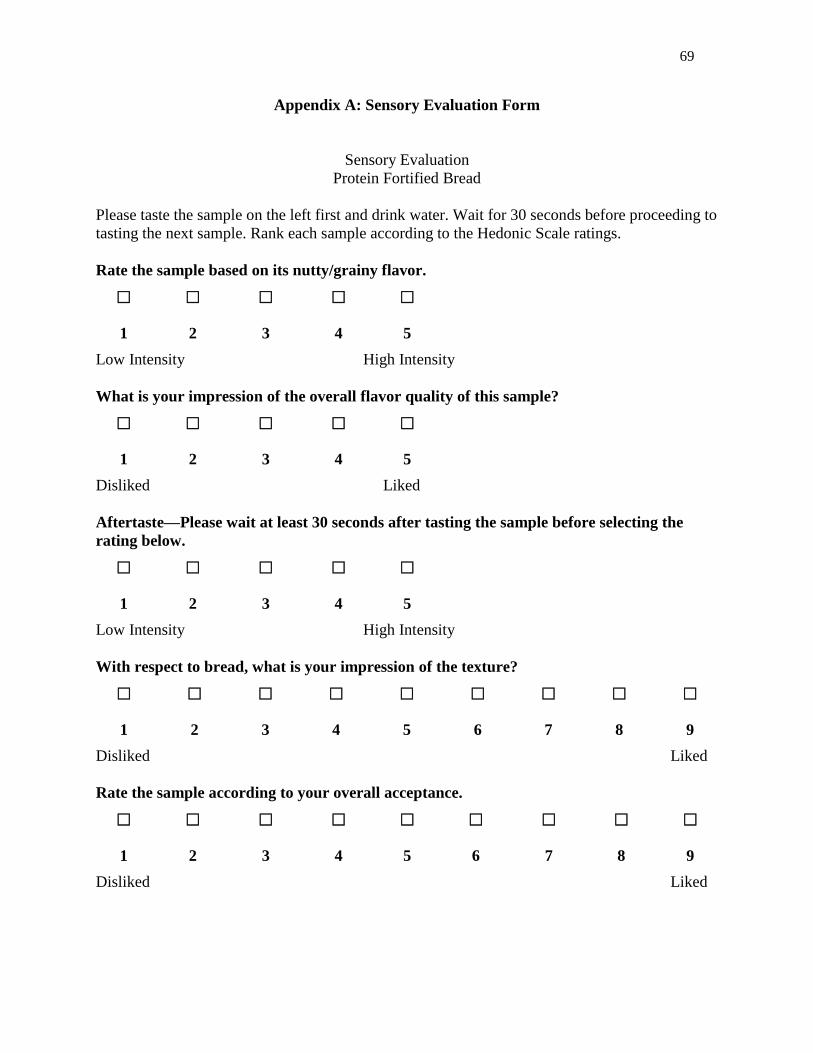
69
Appendix A: Sensory Evaluation Form
Sensory Evaluation
Protein Fortified Bread
Please taste the sample on the left first and drink water. Wait for 30 seconds before proceeding to
tasting the next sample. Rank each sample according to the Hedonic Scale ratings.
Rate the sample based on its nutty/grainy flavor.
☐ ☐ ☐ ☐ ☐
1 2 3 4 5
Low Intensity High Intensity
What is your impression of the overall flavor quality of this sample?
☐ ☐ ☐ ☐ ☐
1 2 3 4 5
Disliked Liked
Aftertaste—Please wait at least 30 seconds after tasting the sample before selecting the
rating below.
☐ ☐ ☐ ☐ ☐
1 2 3 4 5
Low Intensity High Intensity
With respect to bread, what is your impression of the texture?
☐ ☐ ☐ ☐ ☐ ☐ ☐ ☐ ☐
1 2 3 4 5 6 7 8 9
Disliked Liked
Rate the sample according to your overall acceptance.
☐ ☐ ☐ ☐ ☐ ☐ ☐ ☐ ☐
1 2 3 4 5 6 7 8 9
Disliked Liked
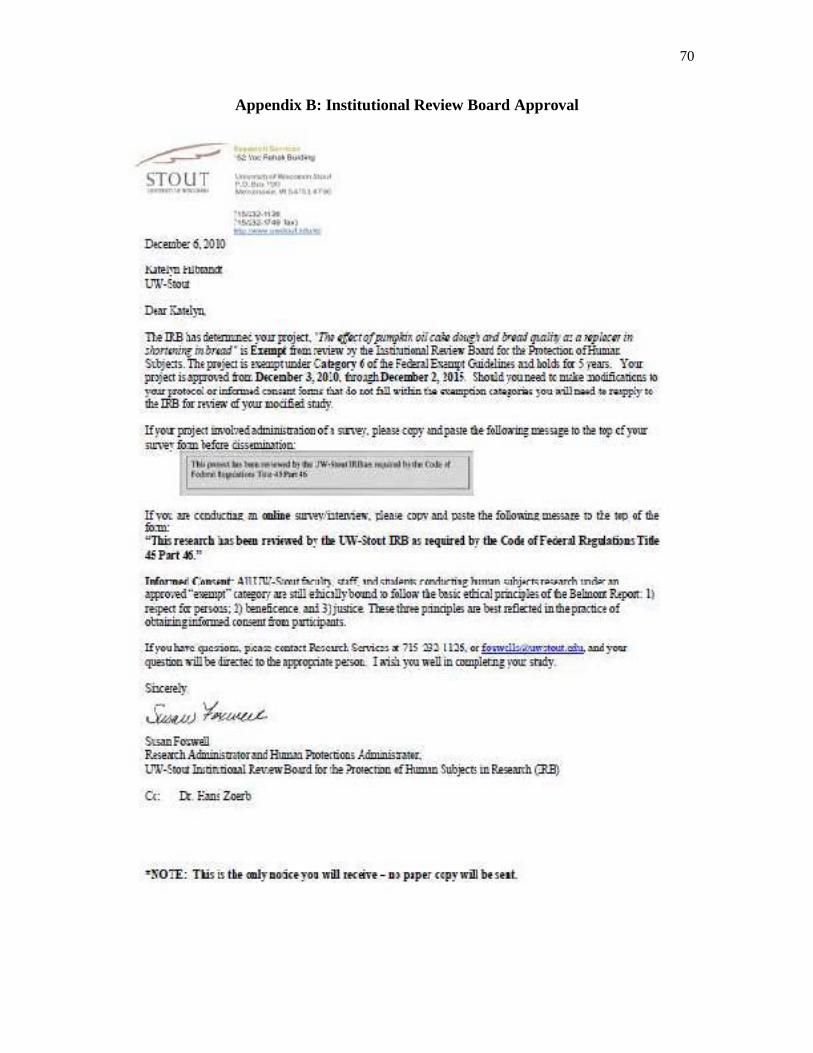
70
Appendix B: Institutional Review Board Approval
~STOUT -·~
lUI!~ h l twxl Ui\.'-~to\J
Dtlt Kl;t!yn.
\._.o~ ... _ ... , ...... r.O.IIUI"lii' ~-"""'""'ll l tf •
· ·:..Q;), \1)1 ~u,·;u,O<Of l;,lo) lit; ............... .
TI~ JlBMl::ie~ }'O'J1~Kf. ' Th; f{[«rqfpJ11fJkir. tA~c<Wd~ altf .Mal qut!iyt:! aNpi~U1 fu ;km:,r.i.r<! inlm!7il ' is Eum(i fr.m rai..~ ~·1M bilii.ltional Rai~ Bmd f« tm Protc<riot! oilt.unil!: Sdfe:is. Thfprtje.:t i; ~tur.ierCattgory 6o: ihe Fe&ra!Ex:m:p1 Gaidtl.il!6 a:t.dbo!d; f« Sye.m. YttJ! .pt>ject is<lpproo;~ fr1xt: DKtobtr J, 20LO. tao~Df<eailu2, !OH. Sho'Ud :r-oo teEd t< DU.ft'llOdificatims 10 y.nt J.:'oOtoX0: or it::fi:n:I.C oc.;m.t !or.:u: WI do 1.01 b!1 'l-it& 6o ~Xl <~!oril~ ~0':1 ~ill~.-N.l.ppir to dtt IRB ttt n\i='i\' Clf yew U!Ocifiai st.J:iy.
If YO! m cctldoctiu. m <llliDt sun>er/ilW\~n-. lliea;.e 010\' ru:.i pme the follo'i\ir..!_mes>ate I) tle MO .U !he !O:m: "This retartb Us beu miE·Kt4 by fbt LW-Stott IRS ~ teqaird br tbt Code: ofF t&NliUglllafi>as Title J:: Part J6.""
fll{~ r.'IIM"'t• .1111 fll1-!\:1T.ITfN'u\!), Ulf( m.i(<:;inl .. m=; tf:t:Vitrlhthm".oln tnhj~fl''-'llrth tndor ,\11
~.--ed''e:e:pf' <~rf m wll ehio!lybomd :o fbl.t.oi\' tle bl;ic ettic.alprfnd]$of be Bel!nm R!po!t: I) ta'P=<t f« pa>4lS; l) l:eneficcoce,ci 3)jusfa !hse~p.:inriplei m 001: r-o...fl«:ted ill.dt!PJ<I'1ictof ohaicing~:.d (OI!!ol'IU from pli'Mpaati.
U you blT-t ~=:. Ji,ea.-..:c c«:d:~:t P'~eud Scr\ic:o:. ~ 115 ")3;) I t)S. or f<»Wdb:ir:~=ta:r .ci'!l, ~ )'OCit
quotfoo AiD~ di!~ to 1M aw¢tt pe:;.oc. I ~&is.l yru wen in oxnpter:q. rw ttmy.
Shce:ely .
... ~,))I~~ SGmf..w.ll Rtseru A:imi:nl>m;or .uui Huma!l. PtoteclfOC!i J.d!::nmi;I a;u. U'.\.l~oo<.t lnitiroicnal b\•n· Bo.u:d for rm Pr01ectim tfHw::nm SUbject;. m ReseW (rRB}
Q : rt. F.allS Zo:ib
'"~07E: T1is Is tbt <lllyao.ict yoo will tKEht- D·) pJptt c<pywill btsul
65
Murkovic, M., Piironen, V., Lampi, A., Kraushofer, T., & Sontag, G. (2004). Changes in
chemical composition of pumpkin seeds during the roasting process for
production of pumpkin seed oil (Part 1: non-volatile compounds), Food
Chemistry, 84(3) 359-365. doi:10.1016/S0308-8146(03)00240-1
Nakić, S., Rade, D., Škevin, D., Štrucelj, D., Mokrovčak, Ž., & Bartolić, M. (2006).
Chemical characteristics of oils from naked and husk seeds of Cucurbita pepo L.
European Journal of Lipid Science and Technology, 108(11), 963-943. doi:
10.1002/ejlt.200600161
Nyam, K., Tan, C. Lai, O., Long, K., & Che Man, Y. (2009). Physicochemical properties and
bioactive compounds of selected seed oils. LWT - Food Science and Technology, 42(8),
1396-1403. doi:10.1016/j.lwt.2009.03.006
Parry, J., Hao, Z., Luther, M., Su, L., Zhou, K., & Yu, L. (2006). Characterization of cold-
pressed onion, parsley, cardamom, mullein, roasted pumpkin, and milk thistle seed oils.
Journal of the American Oil Chemists' Society, 83(10), 847-854. doi:10.1007/s11746-
006-5036-8
Peričin, D., Krimer, V., Trivić, S., & Radulović, L. (2009). The distribution of phenolic
acids in pumpkin’s hull-less seed, skin, oil cake meal, dehulled kernel and hull.
Food Chemistry, 113(2), 450-456. doi:10.1016/j.foodchem.2008.08.079
Popović, S., Peričin, D., Vaštag, Ž., Popović, L., & Lazić,V. (2010). Evaluation of edible
film-forming ability of pumpkin oil cake; effect of pH and temperature. Food
Hydrocolloids, 25(3), 470-476. doi:10.1016/j.foodhyd.2010.07.022