Embed Size (px)
Citation preview
1
STUDY OF OCCUPANT RESPONSES IN A MINE BLAST USING MADYMO
Anant Kendale, TASS Americas, Livonia, MI 48152, USA Rohit Jategaonkar, TASS Americas, Livonia, MI 48152, USA Mutaz Shkoukani, TASS Americas, Livonia, MI 48152, USA
Geng Zhang, Michigan Engineering Services, Ann Arbor, MI, 48108, USA
ABSTRACT
This study is a continuation of the work presented at GVSS Conference 2009. First part of this paper is reproduced from the paper published at GVSS Conference. Additional studies have been conducted to evaluate the effect of various countermeasures on occupant response in a mine blast. Recent wars in Iraq and Afghanistan have underlined importance of Military vehicles’ occupant protection systems in mine blast type of events. Because of the nature of the event, it is often difficult to test the military vehicles and collect all necessary data to use for vehicle development. The purpose of this study was to establish a methodology of mine blast testing and simulations to understand occupant injuries. The proposed process consists of blast testing of simplified test objects, finite element (FE) modeling to simulate the blast testing and Madymo occupant modeling to analyze the effect of structural deformation on occupant injuries. The modeling approach taken was of a coupled simulation using MADYMO and a partner FE code LS-Dyna. Using this approach, FE capabilities of partner code are combined with Madymo capabilities to perform simulations accurately and efficiently. Further effect of various modeling parameters such as depth of air model and type of occupant model on occupant injuries is established.
The developed model was used to evaluate the effect of countermeasures such as increased floor thickness, additional footrest foam, two point seatbelt and seat frame attachments.
1. Introduction
Recent wars in Iraq and Afghanistan have underlined importance of Military vehicles’ occupant protection systems in mine blast type of events. The main injuries seen are either traumatic brain injuries or extremities injuries (ref 1 and ref 2). Naval Research Health Center describes Traumatic Brain Injury (TBI) as “a non-degenerative, non-congenital injury to the head arising from blunt or penetrating trauma or from acceleration/ deceleration forces. Specifically head injury is defined as a TBI when there is a decreased level of consciousness, amnesia, and skull fracture”. Based on published data it can be seen that those injured in the battle were more likely than those not injured in battle to have multiple TBI. During the Iraq war, Improvised explosive devices (IED’s) were the most common cause of TBI among battle injuries. Among non-battle injuries blunt Trauma and motor vehicle crashes were the most common causes. In order to use this field information in design and analysis process frequently injury criteria are defined relative to AIS categories. Relative to head injuries one of the popular injury criterion is HIC. HIC 1000 represents a 16% risk of AIS 4 or greater brain injury. According to the Army Office of Surgeon General, between September 2001 and January 2009, there were 1,286 amputations in Operation Iraqi Freedom (OIF) and Operation Enduring Freedom (OEF). Out of those, 935 were major limb amputations and 351 were minor amputations. 55% of the OIF and OEF amputations were caused by IED, making IEDs the main cause of extremities injury. NATO Research & Technology Organization (HFM-090) defines the injury tolerance for lower leg
2
(Lower tibia axial force) 4.7KN with 5% RISK of injury and 5.4KN with 10% RISK of injury which represents “lower risk of life-threatening and disabling injuries”. With the advent of CAE techniques it has become possible to simulate the actual detonation of explosives and its effect on vehicle deformations. In this study FE code LS-Dyna was used to simulate the detonation and test object deformations and MADYMO, an industry standard occupant safety code, has been used to analyze occupant injuries. In this study, first a simplified test object was built and tested over detonation of an explosive. The collected test data was used to create and correlate a finite element vehicle structure model to capture the vehicle local and global effects. Next, the vehicle model built in LS-Dyna was coupled with MADYMO occupant model to understand force transfer from the vehicle structure to the interiors and occupant. Coupling basically uses a plug and play approach to easily incorporate occupant models and restraint systems designed and optimized in MADYMO into a FE model of any vehicle built in a partner FE code. Main focus of this study was to understand the local effects of vehicle floor deformation on lower extremity injuries and forces exerted by the deformation on the occupant.
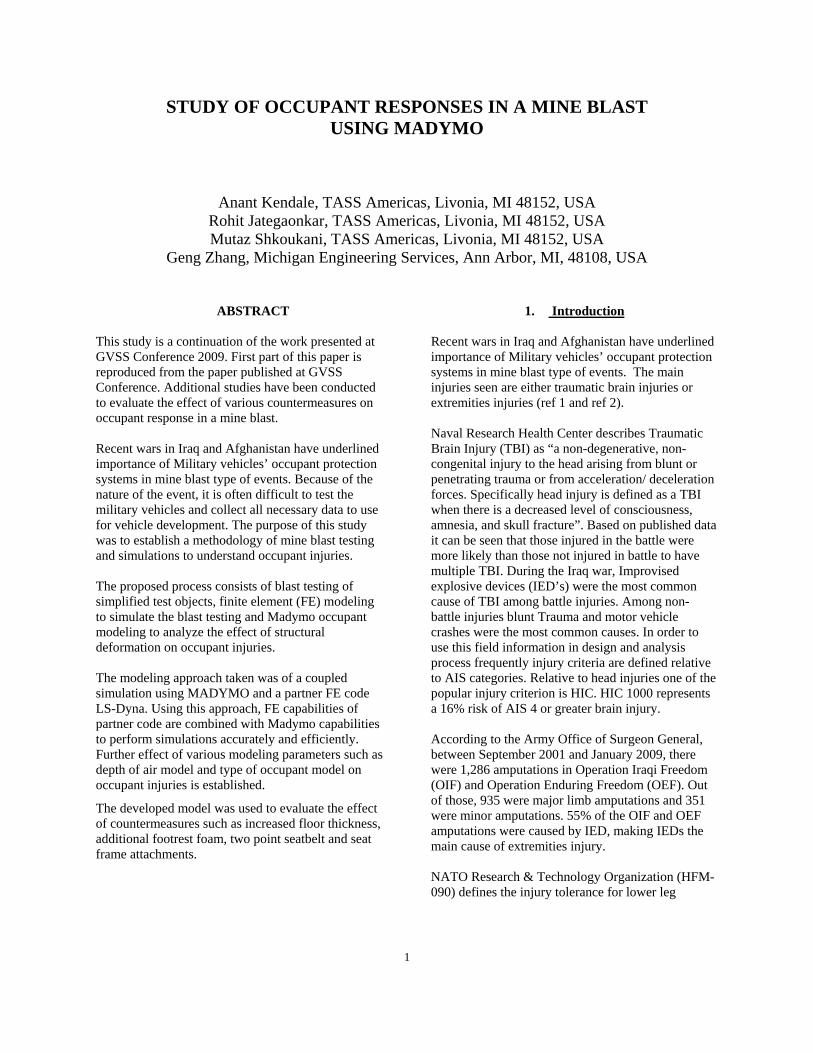
2. Mine Blast Analysis Methodology
Figure 1 Mine Blast Analysis Methodology
The methodology followed for this study is depicted in Figure 1. Mine Blast testing was followed by building numerical models with MADYMO and LS-Dyna to simulate the complete process of a mine
detonation under a military vehicle. This process included the detonation effects, the local structural response, the global vehicle response and finally the occupant response. Mine Blast Testing was conducted by TNO Defense, Security and Safety (TNO DSS) in the Netherlands. A test object, representative of military vehicles with a V-shaped bottom section was built and tested with anti-tank blast mines. For this test the structural response was measured and filmed by high-speed video cameras. The occupant response was measured with a well instrumented 50th %ile Hybrid III crash test dummy. A simulation model was built in LS-Dyna for the structure used in the test and the floor deformation was correlated with test data. The LS-Dyna Structural model and Madymo occupant model were used to setup a Madymo-LS-Dyna coupled simulation using MADYMO 50th %ile Hybrid III dummy. The coupled simulation was correlated to the test data for occupant responses.
2.1 Mine Blast Testing
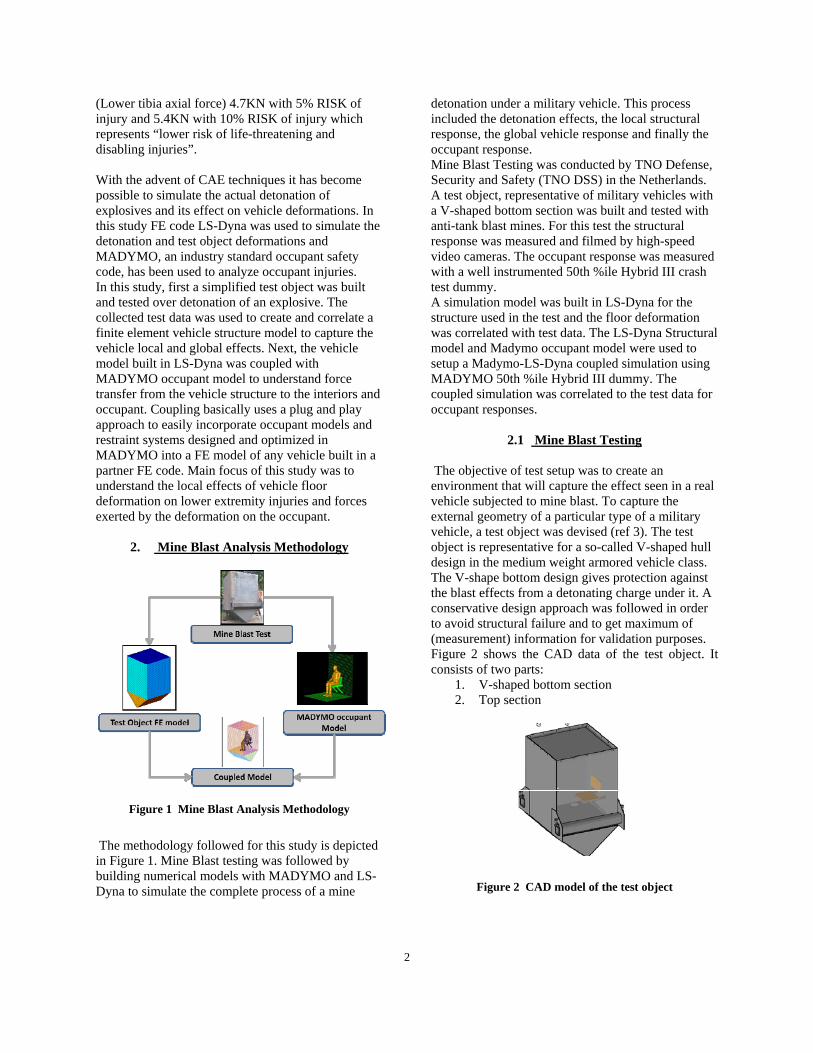
The objective of test setup was to create an environment that will capture the effect seen in a real vehicle subjected to mine blast. To capture the external geometry of a particular type of a military vehicle, a test object was devised (ref 3). The test object is representative for a so-called V-shaped hull design in the medium weight armored vehicle class. The V-shape bottom design gives protection against the blast effects from a detonating charge under it. A conservative design approach was followed in order to avoid structural failure and to get maximum of (measurement) information for validation purposes. Figure 2 shows the CAD data of the test object. It consists of two parts:
1. V-shaped bottom section 2. Top section
Figure 2 CAD model of the test object
3
The V-shaped bottom section consists of two bottom plates and one floor plate made of armor steel. The bottom plates are 15 mm thick and the floor plate is 10 mm thick. The front/back side of the section is closed with 6 mm thick construction steel plates. The top section consists of a steel box with 10 mm thick construction steel plates at the sides and 6 mm construction steel plate at the front/back side. The top side is closed with a 6 mm plate, which is bolted to the four side walls. The seat system consists of a steel frame work welded to the side wall and with extra support to the corner of floor plate and side wall. Two wooden plates are used as seat pan and seat back rest. The mass of the test object was 1800 kg.
2.2 The Explosive Charge
For testing under laboratory conditions a detonation charge was used for an anti-tank blast mine. This charge was placed in a so-called steel pot for well defined boundary conditions with respect to the local blast effects (= structural response of bottom section). Figure 3 shows the steel pot with the detonation charge placed in it.
Figure 3 Sketch (left) and real test set-up (right) of steel pot and charge
2.3 The Instrumentation Of The Test Object
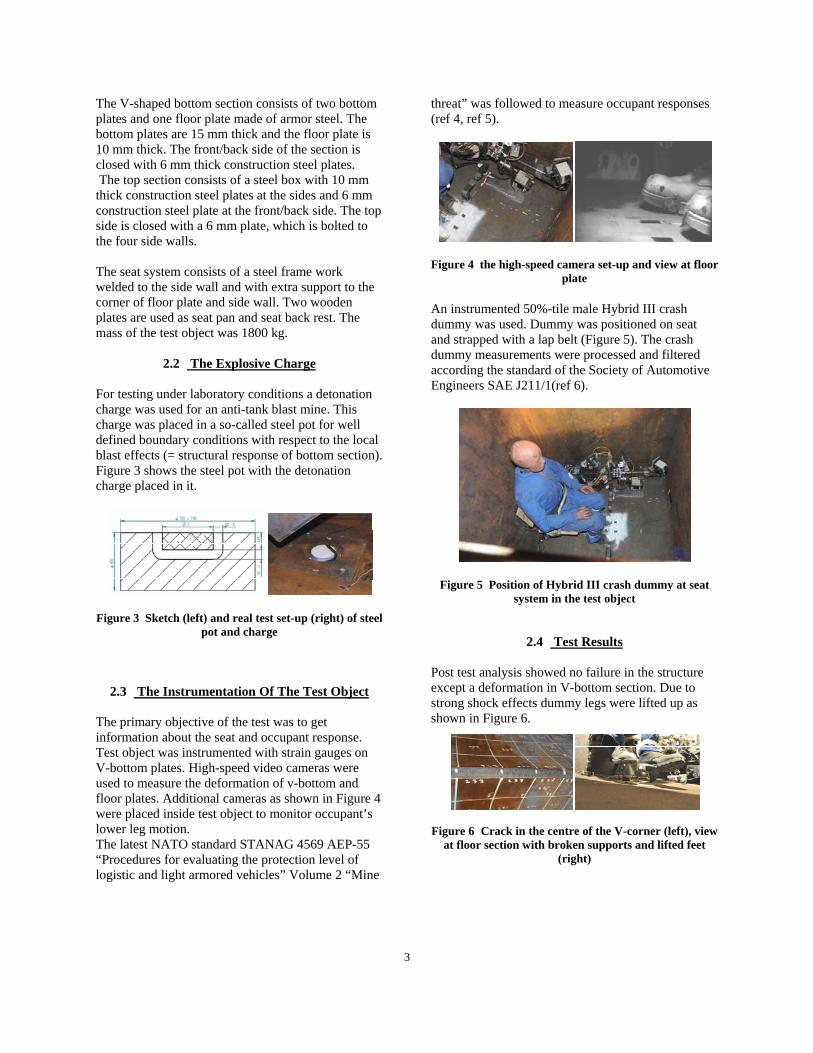
The primary objective of the test was to get information about the seat and occupant response. Test object was instrumented with strain gauges on V-bottom plates. High-speed video cameras were used to measure the deformation of v-bottom and floor plates. Additional cameras as shown in Figure 4 were placed inside test object to monitor occupant’s lower leg motion. The latest NATO standard STANAG 4569 AEP-55 “Procedures for evaluating the protection level of logistic and light armored vehicles” Volume 2 “Mine
threat” was followed to measure occupant responses (ref 4, ref 5).
Figure 4 the high-speed camera set-up and view at floor plate
An instrumented 50%-tile male Hybrid III crash dummy was used. Dummy was positioned on seat and strapped with a lap belt (Figure 5). The crash dummy measurements were processed and filtered according the standard of the Society of Automotive Engineers SAE J211/1(ref 6).
Figure 5 Position of Hybrid III crash dummy at seat system in the test object
2.4 Test Results
Post test analysis showed no failure in the structure except a deformation in V-bottom section. Due to strong shock effects dummy legs were lifted up as shown in Figure 6.
Figure 6 Crack in the centre of the V-corner (left), view at floor section with broken supports and lifted feet
(right)
4
2.4.1 Elastic Deformation
Based on the high-speed video analysis the maximum displacement of the V-bottom section was 64mm and of the floor plate was 20 mm in upwards direction and 33 mm in downwards direction. In Figure 7 shows the respective displacement curves.
Figure 7 Displacement curve of V-bottom plate (blue line) and floor plate (red line)
2.4.2 Crash Dummy Measurements
The crash dummy was highly loaded and therefore its final position differed significantly from the original position as can be seen in Figure 8.
Figure 8 Position of Crash dummy after the test The crash dummy measured extreme high loads in the lower legs due to the swinging floor plate. In the Figure 9 axial compression forces in the lower and upper part of the tibias for both legs are shown.
Figure 9 Axial compression forces measured in the left and right lower leg
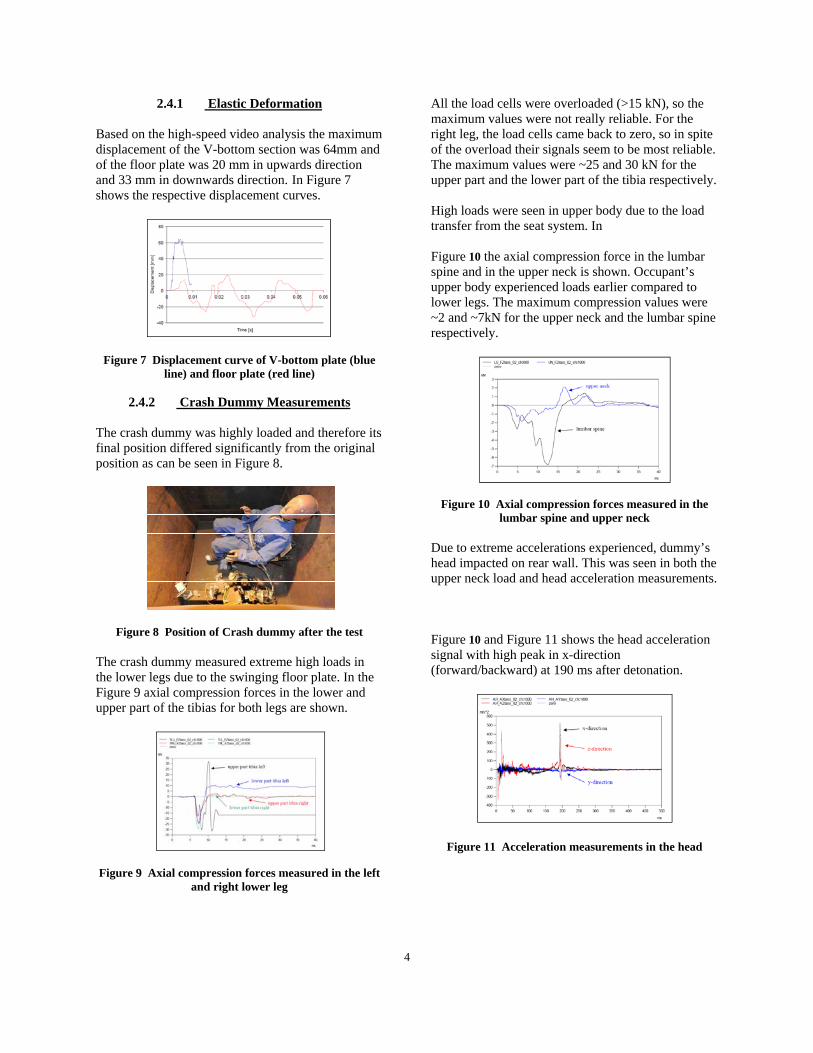
All the load cells were overloaded (>15 kN), so the maximum values were not really reliable. For the right leg, the load cells came back to zero, so in spite of the overload their signals seem to be most reliable. The maximum values were ~25 and 30 kN for the upper part and the lower part of the tibia respectively. High loads were seen in upper body due to the load transfer from the seat system. In Figure 10 the axial compression force in the lumbar spine and in the upper neck is shown. Occupant’s upper body experienced loads earlier compared to lower legs. The maximum compression values were ~2 and ~7kN for the upper neck and the lumbar spine respectively.
Figure 10 Axial compression forces measured in the lumbar spine and upper neck
Due to extreme accelerations experienced, dummy’s head impacted on rear wall. This was seen in both the upper neck load and head acceleration measurements. Figure 10 and Figure 11 shows the head acceleration signal with high peak in x-direction (forward/backward) at 190 ms after detonation.
Figure 11 Acceleration measurements in the head
5
2.5 Finite Element Structural Model
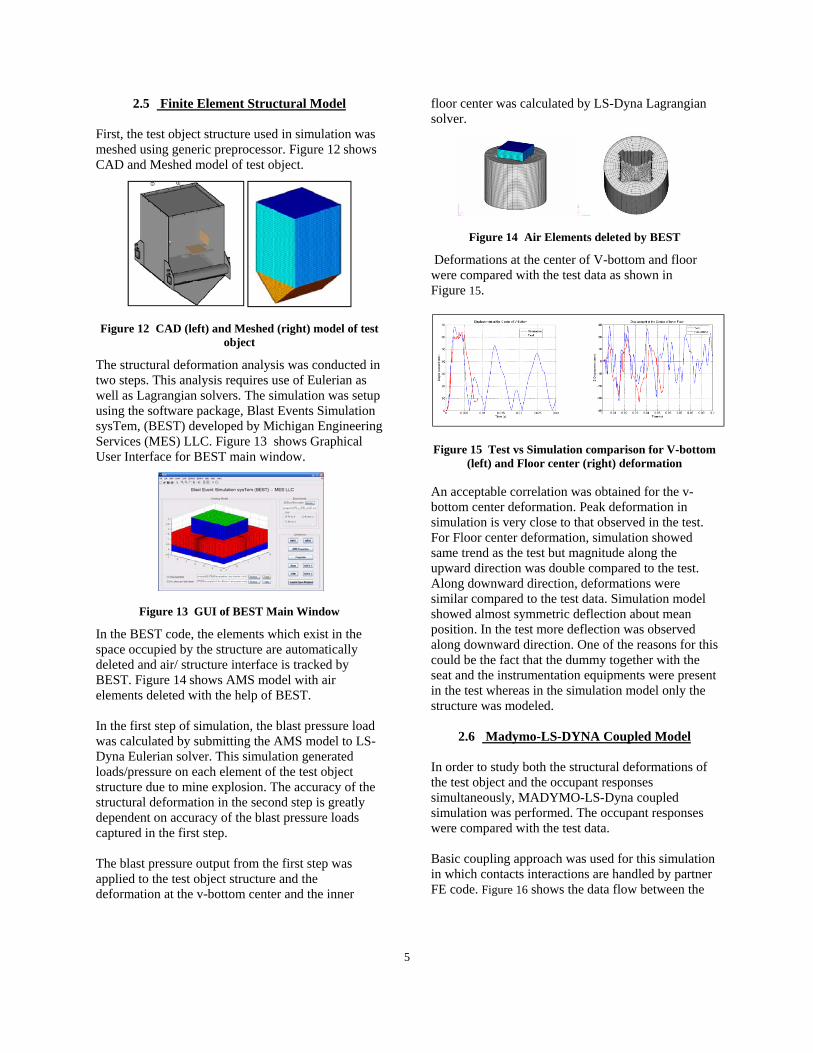
First, the test object structure used in simulation was meshed using generic preprocessor. Figure 12 shows CAD and Meshed model of test object.
Figure 12 CAD (left) and Meshed (right) model of test object
The structural deformation analysis was conducted in two steps. This analysis requires use of Eulerian as well as Lagrangian solvers. The simulation was setup using the software package, Blast Events Simulation sysTem, (BEST) developed by Michigan Engineering Services (MES) LLC. Figure 13 shows Graphical User Interface for BEST main window.
Figure 13 GUI of BEST Main Window
In the BEST code, the elements which exist in the space occupied by the structure are automatically deleted and air/ structure interface is tracked by BEST. Figure 14 shows AMS model with air elements deleted with the help of BEST. In the first step of simulation, the blast pressure load was calculated by submitting the AMS model to LS-Dyna Eulerian solver. This simulation generated loads/pressure on each element of the test object structure due to mine explosion. The accuracy of the structural deformation in the second step is greatly dependent on accuracy of the blast pressure loads captured in the first step. The blast pressure output from the first step was applied to the test object structure and the deformation at the v-bottom center and the inner
floor center was calculated by LS-Dyna Lagrangian solver.
Figure 14 Air Elements deleted by BEST
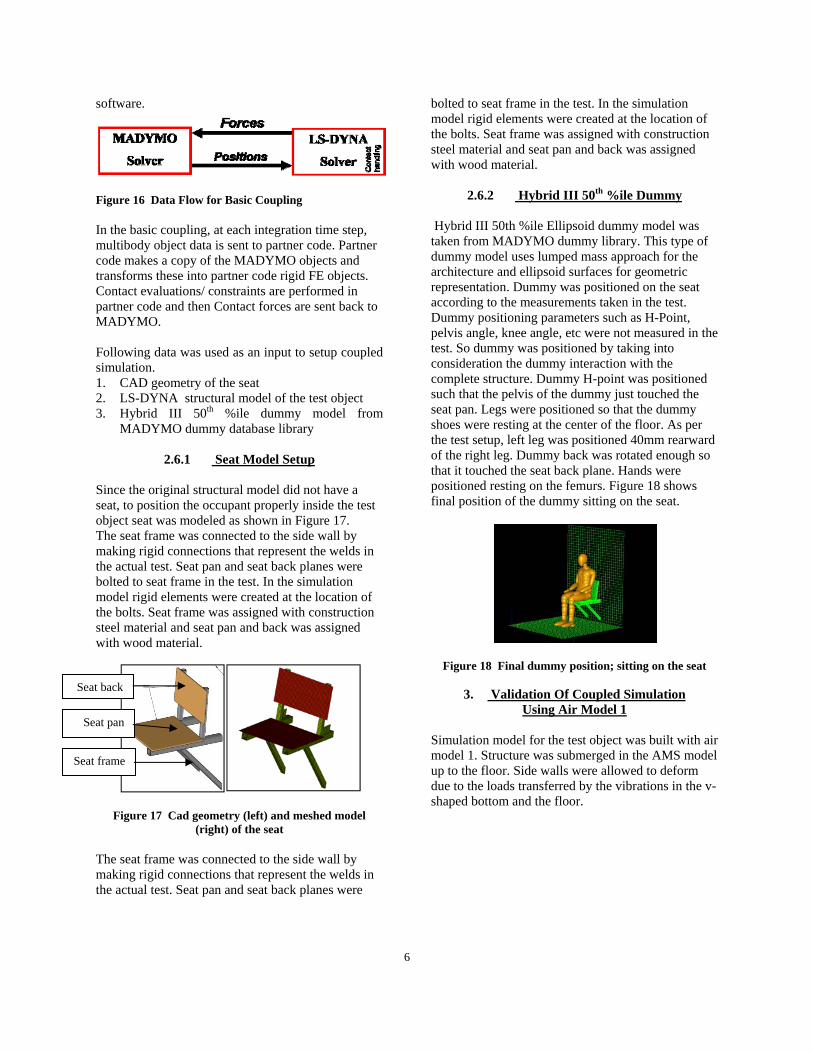
Deformations at the center of V-bottom and floor were compared with the test data as shown in Figure 15.
Figure 15 Test vs Simulation comparison for V-bottom
(left) and Floor center (right) deformation
An acceptable correlation was obtained for the v-bottom center deformation. Peak deformation in simulation is very close to that observed in the test. For Floor center deformation, simulation showed same trend as the test but magnitude along the upward direction was double compared to the test. Along downward direction, deformations were similar compared to the test data. Simulation model showed almost symmetric deflection about mean position. In the test more deflection was observed along downward direction. One of the reasons for this could be the fact that the dummy together with the seat and the instrumentation equipments were present in the test whereas in the simulation model only the structure was modeled.
2.6 Madymo-LS-DYNA Coupled Model In order to study both the structural deformations of the test object and the occupant responses simultaneously, MADYMO-LS-Dyna coupled simulation was performed. The occupant responses were compared with the test data. Basic coupling approach was used for this simulation in which contacts interactions are handled by partner FE code. Figure 16 shows the data flow between the
6
software.
Figure 16 Data Flow for Basic Coupling In the basic coupling, at each integration time step, multibody object data is sent to partner code. Partner code makes a copy of the MADYMO objects and transforms these into partner code rigid FE objects. Contact evaluations/ constraints are performed in partner code and then Contact forces are sent back to MADYMO. Following data was used as an input to setup coupled simulation. 1. CAD geometry of the seat 2. LS-DYNA structural model of the test object 3. Hybrid III 50th %ile dummy model from
MADYMO dummy database library
2.6.1 Seat Model Setup Since the original structural model did not have a seat, to position the occupant properly inside the test object seat was modeled as shown in Figure 17. The seat frame was connected to the side wall by making rigid connections that represent the welds in the actual test. Seat pan and seat back planes were bolted to seat frame in the test. In the simulation model rigid elements were created at the location of the bolts. Seat frame was assigned with construction steel material and seat pan and back was assigned with wood material.
Figure 17 Cad geometry (left) and meshed model (right) of the seat
The seat frame was connected to the side wall by making rigid connections that represent the welds in the actual test. Seat pan and seat back planes were
bolted to seat frame in the test. In the simulation model rigid elements were created at the location of the bolts. Seat frame was assigned with construction steel material and seat pan and back was assigned with wood material.
2.6.2 Hybrid III 50th %ile Dummy
Hybrid III 50th %ile Ellipsoid dummy model was taken from MADYMO dummy library. This type of dummy model uses lumped mass approach for the architecture and ellipsoid surfaces for geometric representation. Dummy was positioned on the seat according to the measurements taken in the test. Dummy positioning parameters such as H-Point, pelvis angle, knee angle, etc were not measured in the test. So dummy was positioned by taking into consideration the dummy interaction with the complete structure. Dummy H-point was positioned such that the pelvis of the dummy just touched the seat pan. Legs were positioned so that the dummy shoes were resting at the center of the floor. As per the test setup, left leg was positioned 40mm rearward of the right leg. Dummy back was rotated enough so that it touched the seat back plane. Hands were positioned resting on the femurs. Figure 18 shows final position of the dummy sitting on the seat.
Figure 18 Final dummy position; sitting on the seat
3. Validation Of Coupled Simulation Using Air Model 1
Simulation model for the test object was built with air model 1. Structure was submerged in the AMS model up to the floor. Side walls were allowed to deform due to the loads transferred by the vibrations in the v-shaped bottom and the floor.
Seat frame
Seat pan
Seat back
7
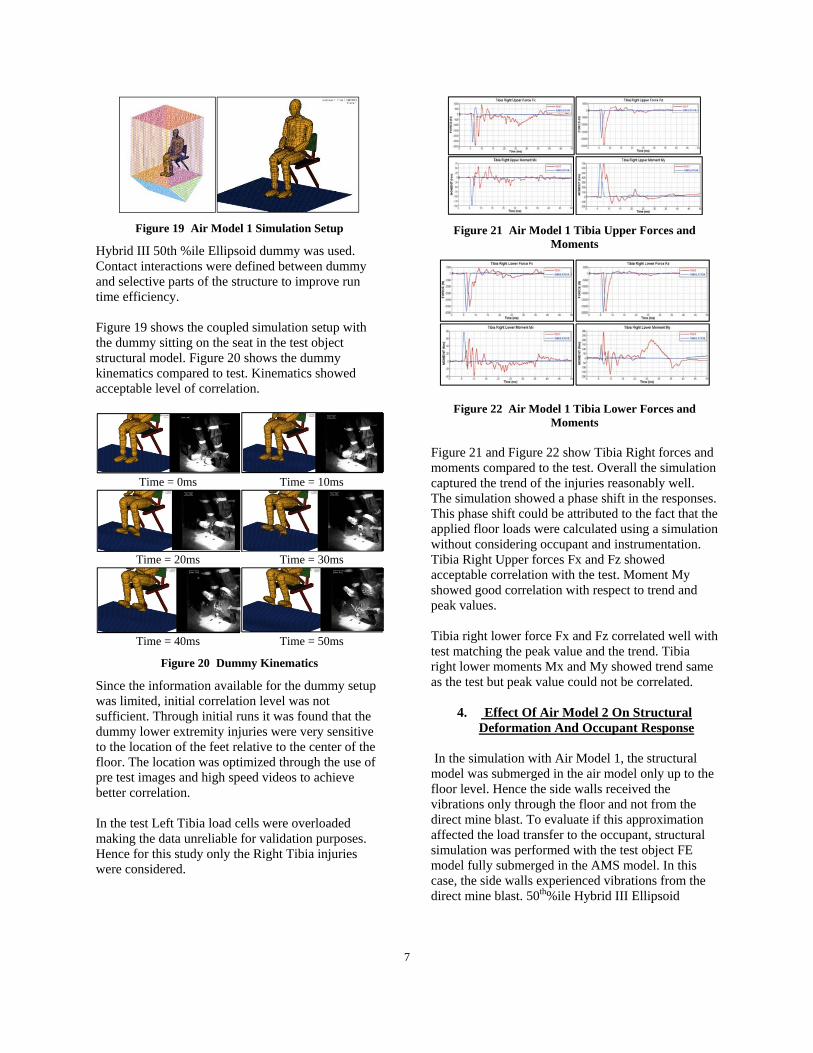
Figure 19 Air Model 1 Simulation Setup
Hybrid III 50th %ile Ellipsoid dummy was used. Contact interactions were defined between dummy and selective parts of the structure to improve run time efficiency. Figure 19 shows the coupled simulation setup with the dummy sitting on the seat in the test object structural model. Figure 20 shows the dummy kinematics compared to test. Kinematics showed acceptable level of correlation.
Time = 0ms Time = 10ms
Time = 20ms Time = 30ms
Time = 40ms Time = 50ms
Figure 20 Dummy Kinematics
Since the information available for the dummy setup was limited, initial correlation level was not sufficient. Through initial runs it was found that the dummy lower extremity injuries were very sensitive to the location of the feet relative to the center of the floor. The location was optimized through the use of pre test images and high speed videos to achieve better correlation. In the test Left Tibia load cells were overloaded making the data unreliable for validation purposes. Hence for this study only the Right Tibia injuries were considered.
Figure 21 Air Model 1 Tibia Upper Forces and
Moments
Figure 22 Air Model 1 Tibia Lower Forces and Moments
Figure 21 and Figure 22 show Tibia Right forces and moments compared to the test. Overall the simulation captured the trend of the injuries reasonably well. The simulation showed a phase shift in the responses. This phase shift could be attributed to the fact that the applied floor loads were calculated using a simulation without considering occupant and instrumentation. Tibia Right Upper forces Fx and Fz showed acceptable correlation with the test. Moment My showed good correlation with respect to trend and peak values. Tibia right lower force Fx and Fz correlated well with test matching the peak value and the trend. Tibia right lower moments Mx and My showed trend same as the test but peak value could not be correlated.
4. Effect Of Air Model 2 On Structural Deformation And Occupant Response
In the simulation with Air Model 1, the structural model was submerged in the air model only up to the floor level. Hence the side walls received the vibrations only through the floor and not from the direct mine blast. To evaluate if this approximation affected the load transfer to the occupant, structural simulation was performed with the test object FE model fully submerged in the AMS model. In this case, the side walls experienced vibrations from the direct mine blast. 50th%ile Hybrid III Ellipsoid
8
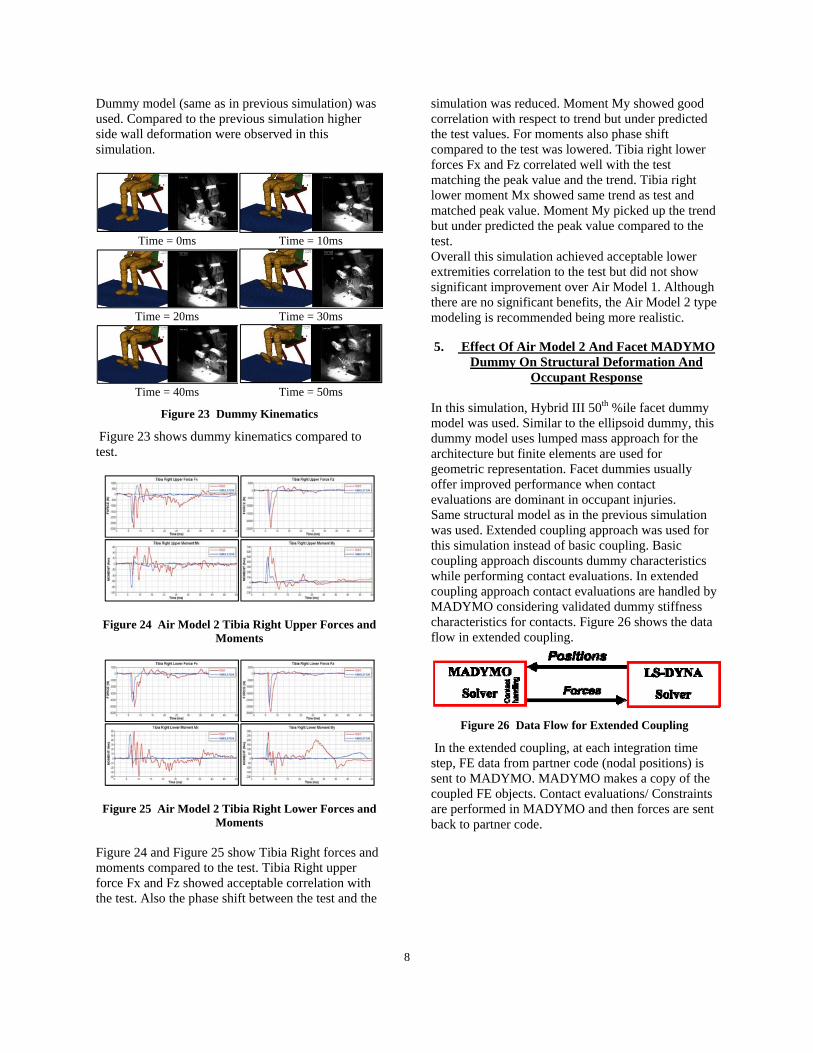
Dummy model (same as in previous simulation) was used. Compared to the previous simulation higher side wall deformation were observed in this simulation.
Time = 0ms Time = 10ms
Time = 20ms Time = 30ms
Time = 40ms Time = 50ms
Figure 23 Dummy Kinematics
Figure 23 shows dummy kinematics compared to test.
Figure 24 Air Model 2 Tibia Right Upper Forces and Moments
Figure 25 Air Model 2 Tibia Right Lower Forces and Moments
Figure 24 and Figure 25 show Tibia Right forces and moments compared to the test. Tibia Right upper force Fx and Fz showed acceptable correlation with the test. Also the phase shift between the test and the
simulation was reduced. Moment My showed good correlation with respect to trend but under predicted the test values. For moments also phase shift compared to the test was lowered. Tibia right lower forces Fx and Fz correlated well with the test matching the peak value and the trend. Tibia right lower moment Mx showed same trend as test and matched peak value. Moment My picked up the trend but under predicted the peak value compared to the test. Overall this simulation achieved acceptable lower extremities correlation to the test but did not show significant improvement over Air Model 1. Although there are no significant benefits, the Air Model 2 type modeling is recommended being more realistic. 5. Effect Of Air Model 2 And Facet MADYMO
Dummy On Structural Deformation And Occupant Response
In this simulation, Hybrid III 50th %ile facet dummy model was used. Similar to the ellipsoid dummy, this dummy model uses lumped mass approach for the architecture but finite elements are used for geometric representation. Facet dummies usually offer improved performance when contact evaluations are dominant in occupant injuries. Same structural model as in the previous simulation was used. Extended coupling approach was used for this simulation instead of basic coupling. Basic coupling approach discounts dummy characteristics while performing contact evaluations. In extended coupling approach contact evaluations are handled by MADYMO considering validated dummy stiffness characteristics for contacts. Figure 26 shows the data flow in extended coupling.
Figure 26 Data Flow for Extended Coupling
In the extended coupling, at each integration time step, FE data from partner code (nodal positions) is sent to MADYMO. MADYMO makes a copy of the coupled FE objects. Contact evaluations/ Constraints are performed in MADYMO and then forces are sent back to partner code.
9
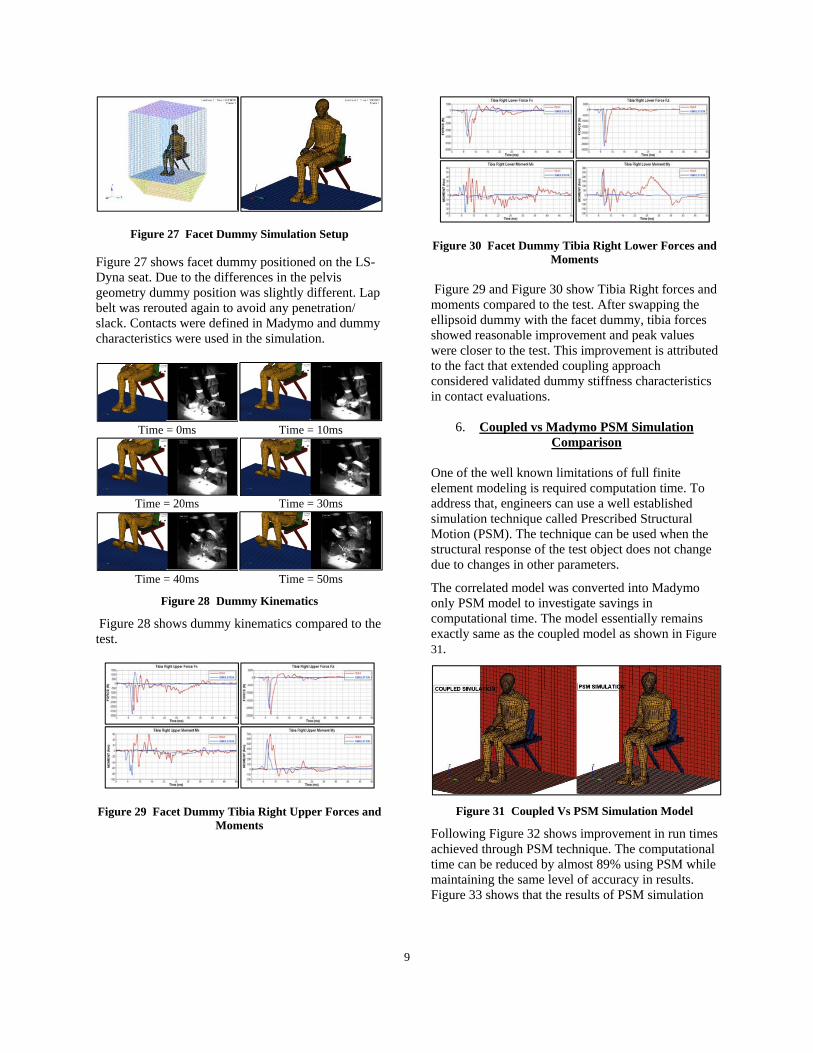
Figure 27 Facet Dummy Simulation Setup
Figure 27 shows facet dummy positioned on the LS-Dyna seat. Due to the differences in the pelvis geometry dummy position was slightly different. Lap belt was rerouted again to avoid any penetration/ slack. Contacts were defined in Madymo and dummy characteristics were used in the simulation.
Time = 0ms Time = 10ms
Time = 20ms Time = 30ms
Time = 40ms Time = 50ms
Figure 28 Dummy Kinematics
Figure 28 shows dummy kinematics compared to the test.
Figure 29 Facet Dummy Tibia Right Upper Forces and Moments
Figure 30 Facet Dummy Tibia Right Lower Forces and Moments
Figure 29 and Figure 30 show Tibia Right forces and moments compared to the test. After swapping the ellipsoid dummy with the facet dummy, tibia forces showed reasonable improvement and peak values were closer to the test. This improvement is attributed to the fact that extended coupling approach considered validated dummy stiffness characteristics in contact evaluations.
6. Coupled vs Madymo PSM Simulation Comparison
One of the well known limitations of full finite element modeling is required computation time. To address that, engineers can use a well established simulation technique called Prescribed Structural Motion (PSM). The technique can be used when the structural response of the test object does not change due to changes in other parameters.
The correlated model was converted into Madymo only PSM model to investigate savings in computational time. The model essentially remains exactly same as the coupled model as shown in Figure 31.
Figure 31 Coupled Vs PSM Simulation Model
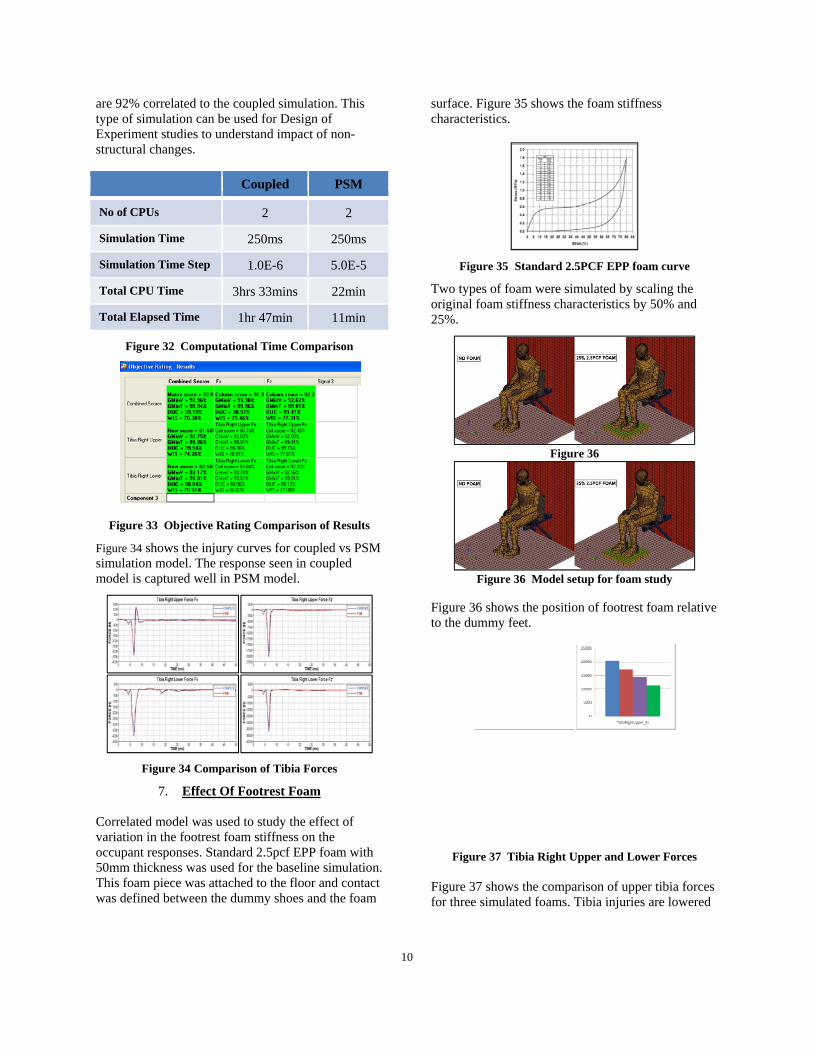
Following Figure 32 shows improvement in run times achieved through PSM technique. The computational time can be reduced by almost 89% using PSM while maintaining the same level of accuracy in results. Figure 33 shows that the results of PSM simulation
10
are 92% correlated to the coupled simulation. This type of simulation can be used for Design of Experiment studies to understand impact of non-structural changes.
Coupled PSM
No of CPUs 2 2
Simulation Time 250ms 250ms
Simulation Time Step 1.0E-6 5.0E-5
Total CPU Time 3hrs 33mins 22min
Total Elapsed Time 1hr 47min 11min
Figure 32 Computational Time Comparison
Figure 33 Objective Rating Comparison of Results
Figure 34 shows the injury curves for coupled vs PSM simulation model. The response seen in coupled model is captured well in PSM model.
Figure 34 Comparison of Tibia Forces
7. Effect Of Footrest Foam Correlated model was used to study the effect of variation in the footrest foam stiffness on the occupant responses. Standard 2.5pcf EPP foam with 50mm thickness was used for the baseline simulation. This foam piece was attached to the floor and contact was defined between the dummy shoes and the foam
surface. Figure 35 shows the foam stiffness characteristics.
Figure 35 Standard 2.5PCF EPP foam curve
Two types of foam were simulated by scaling the original foam stiffness characteristics by 50% and 25%.
Figure 36
Figure 36 Model setup for foam study
Figure 36 shows the position of footrest foam relative to the dummy feet.
Figure 37 Tibia Right Upper and Lower Forces
Figure 37 shows the comparison of upper tibia forces for three simulated foams. Tibia injuries are lowered
11
with lowering the foam stiffness. Also simulation with no foam on the floor shows more tibia injuries compared with the simulation with foam on the floor.
8. Effect Of Floor Thickness Change
By taking the coupled simulation with air model 2 and facet dummy, effect of floor thickness change on occupant response was studied. In this study floor thickness was varied between 10mm and 25mm with 10mm being the baseline simulation.
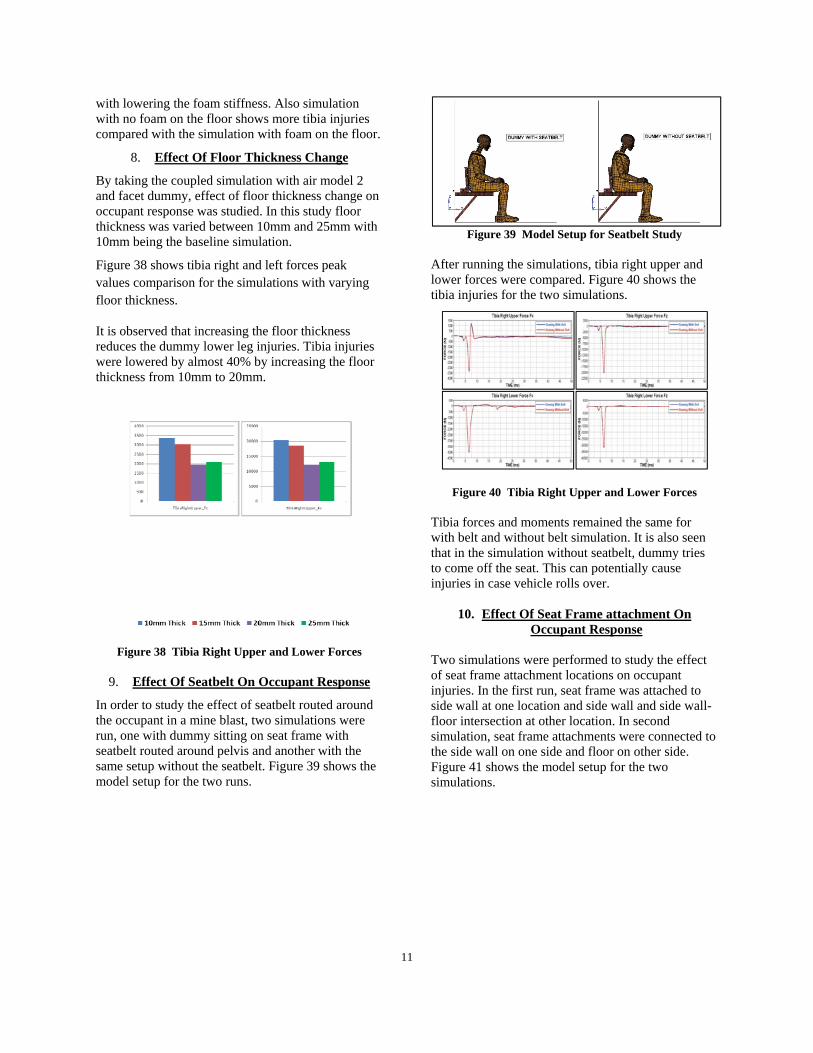
Figure 38 shows tibia right and left forces peak values comparison for the simulations with varying floor thickness.
It is observed that increasing the floor thickness reduces the dummy lower leg injuries. Tibia injuries were lowered by almost 40% by increasing the floor thickness from 10mm to 20mm.
Figure 38 Tibia Right Upper and Lower Forces
9. Effect Of Seatbelt On Occupant Response
In order to study the effect of seatbelt routed around the occupant in a mine blast, two simulations were run, one with dummy sitting on seat frame with seatbelt routed around pelvis and another with the same setup without the seatbelt. Figure 39 shows the model setup for the two runs.
Figure 39 Model Setup for Seatbelt Study
After running the simulations, tibia right upper and lower forces were compared. Figure 40 shows the tibia injuries for the two simulations.
Figure 40 Tibia Right Upper and Lower Forces
Tibia forces and moments remained the same for with belt and without belt simulation. It is also seen that in the simulation without seatbelt, dummy tries to come off the seat. This can potentially cause injuries in case vehicle rolls over.
10. Effect Of Seat Frame attachment On
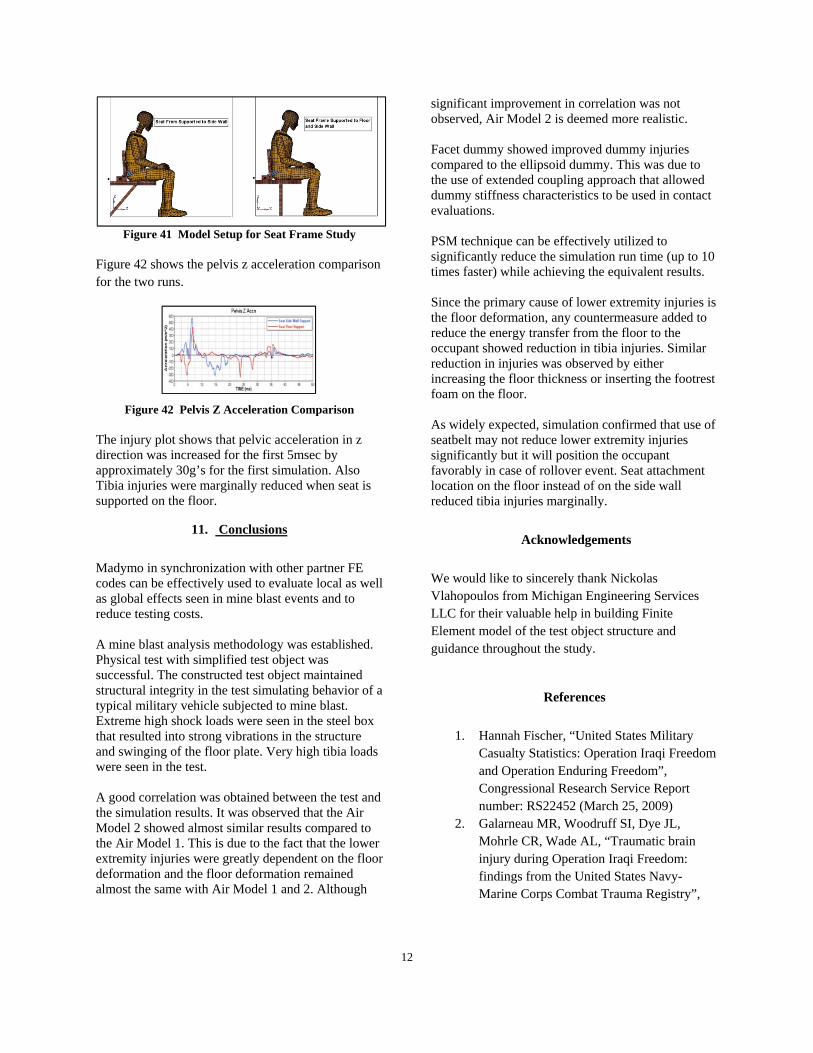
Occupant Response Two simulations were performed to study the effect of seat frame attachment locations on occupant injuries. In the first run, seat frame was attached to side wall at one location and side wall and side wall-floor intersection at other location. In second simulation, seat frame attachments were connected to the side wall on one side and floor on other side. Figure 41 shows the model setup for the two simulations.
12
Figure 41 Model Setup for Seat Frame Study
Figure 42 shows the pelvis z acceleration comparison for the two runs.
Figure 42 Pelvis Z Acceleration Comparison
The injury plot shows that pelvic acceleration in z direction was increased for the first 5msec by approximately 30g’s for the first simulation. Also Tibia injuries were marginally reduced when seat is supported on the floor.
11. Conclusions
Madymo in synchronization with other partner FE codes can be effectively used to evaluate local as well as global effects seen in mine blast events and to reduce testing costs. A mine blast analysis methodology was established. Physical test with simplified test object was successful. The constructed test object maintained structural integrity in the test simulating behavior of a typical military vehicle subjected to mine blast. Extreme high shock loads were seen in the steel box that resulted into strong vibrations in the structure and swinging of the floor plate. Very high tibia loads were seen in the test. A good correlation was obtained between the test and the simulation results. It was observed that the Air Model 2 showed almost similar results compared to the Air Model 1. This is due to the fact that the lower extremity injuries were greatly dependent on the floor deformation and the floor deformation remained almost the same with Air Model 1 and 2. Although
significant improvement in correlation was not observed, Air Model 2 is deemed more realistic. Facet dummy showed improved dummy injuries compared to the ellipsoid dummy. This was due to the use of extended coupling approach that allowed dummy stiffness characteristics to be used in contact evaluations. PSM technique can be effectively utilized to significantly reduce the simulation run time (up to 10 times faster) while achieving the equivalent results. Since the primary cause of lower extremity injuries is the floor deformation, any countermeasure added to reduce the energy transfer from the floor to the occupant showed reduction in tibia injuries. Similar reduction in injuries was observed by either increasing the floor thickness or inserting the footrest foam on the floor. As widely expected, simulation confirmed that use of seatbelt may not reduce lower extremity injuries significantly but it will position the occupant favorably in case of rollover event. Seat attachment location on the floor instead of on the side wall reduced tibia injuries marginally.
Acknowledgements
We would like to sincerely thank Nickolas Vlahopoulos from Michigan Engineering Services LLC for their valuable help in building Finite Element model of the test object structure and guidance throughout the study.
References
1. Hannah Fischer, “United States Military Casualty Statistics: Operation Iraqi Freedom and Operation Enduring Freedom”, Congressional Research Service Report number: RS22452 (March 25, 2009)
2. Galarneau MR, Woodruff SI, Dye JL, Mohrle CR, Wade AL, “Traumatic brain injury during Operation Iraqi Freedom: findings from the United States Navy-Marine Corps Combat Trauma Registry”,
13
Naval Research health Center Report number: 06-25
3. Absil, L.H.J. "Quotation Experimental Support Mine Response", 08 DV3/2007, TNO DSS, Rijswijk, the Netherlands, January 30th, 2008.
4. STANAG 4569 edition 1, "Protection levels for occupants of logistic and light armored vehicles", NSA/0533-LAND/4569.
5. AEP-055, "Procedures for evaluating the protection level of logistic and light armoured vehicles", Volume 2, "Grenade and blast mine threats", September 2006.
6. SAE J211/1 (2003), Surface Vehicle Recommended Practice, (R) Instrumentation for Impact Test - Part 1, - Electronic Instrumentation, Revision December.


![Pandur Dynamic Driving Simulator - Analysis of mine blast ... · Pandur Dynamic Driving Simulator - Analysis of mine blast effects Armando J. Loureiro da Silva ... mass of 6 [Kg]](https://img.pdfslide.us/doc/110x75/5e6d513b241fb16f2e44f9e7/pandur-dynamic-driving-simulator-analysis-of-mine-blast-pandur-dynamic-driving.jpg)