Embed Size (px)
Citation preview

UNCLASSIFIED
UNCLASSIFIED
STUDY OF CETANE PROPERTIES OF ATJ BLENDS BASED ON WORLD SURVEY OF JET FUELS
INTERIM REPORT
TFLRF No. 475
by Nigil Jeyashekar, Ph.D., P.E.
Ed Frame
U.S. Army TARDEC Fuels and Lubricants Research Facility Southwest Research Institute® (SwRI®)
San Antonio, TX
for Patsy Muzzell
U.S. Army TARDEC Force Projection Technologies
Warren, Michigan
Contract No. W56HZV-09-C-0100 (WD32 Task 2.2)
UNCLASSIFIED: Distribution Statement A. Approved for public release
January 2016

UNCLASSIFIED
UNCLASSIFIED
Disclaimers Reference herein to any specific commercial company, product, process, or service by trade name, trademark, manufacturer, or otherwise, does not necessarily constitute or imply its endorsement, recommendation, or favoring by the United States Government or the Department of the Army (DoA). The opinions of the authors expressed herein do not necessarily state or reflect those of the United States Government or the DoA, and shall not be used for advertising or product endorsement purposes.
Contracted Author As the author(s) is(are) not a Government employee(s), this document was only reviewed for export controls, and improper Army association or emblem usage considerations. All other legal considerations are the responsibility of the author and his/her/their employer(s).
DTIC Availability Notice Qualified requestors may obtain copies of this report from the Defense Technical Information Center, Attn: DTIC-OCC, 8725 John J. Kingman Road, Suite 0944, Fort Belvoir, Virginia 22060-6218.
Disposition Instructions Destroy this report when no longer needed. Do not return it to the originator.

UNCLASSIFIED
UNCLASSIFIED
STUDY OF CETANE PROPERTIES OF ATJ BLENDS
BASED ON WORLD SURVEY OF JET FUELS
INTERIM REPORT TFLRF No. 475
by Nigil Jeyashekar, Ph.D., P.E.
Ed Frame
U.S. Army TARDEC Fuels and Lubricants Research Facility Southwest Research Institute® (SwRI®)
San Antonio, TX
for Patsy Muzzell
U.S. Army TARDEC Force Projection Technologies
Warren, Michigan
Contract No. W56HZV-09-C-0100 (WD32 Task 2.2) SwRI® Project No. 08.20639.01.201
UNCLASSIFIED: Distribution Statement A. Approved for public release
January 2016
Approved by:
Gary B. Bessee, Director U.S. Army TARDEC Fuels and Lubricants Research Facility (SwRI®)

UNCLASSIFIED
UNCLASSIFIED iv
REPORT DOCUMENTATION PAGE Form Approved OMB No. 0704-0188
Public reporting burden for this collection of information is estimated to average 1 hour per response, including the time for reviewing instructions, searching existing data sources, gathering and maintaining the data needed, and completing and reviewing this collection of information. Send comments regarding this burden estimate or any other aspect of this collection of information, including suggestions for reducing this burden to Department of Defense, Washington Headquarters Services, Directorate for Information Operations and Reports (0704-0188), 1215 Jefferson Davis Highway, Suite 1204, Arlington, VA 22202-4302. Respondents should be aware that notwithstanding any other provision of law, no person shall be subject to any penalty for failing to comply with a collection of information if it does not display a currently valid OMB control number. PLEASE DO NOT RETURN YOUR FORM TO THE ABOVE ADDRESS. 1. REPORT DATE (DD-MM-YYYY) 28-01-2016
2. REPORT TYPE Interim Report
3. DATES COVERED (From - To) August 2014 – March 2016
4. TITLE AND SUBTITLE Study of Cetane Properties of ATJ Blends Based on World Survey of Jet Fuels
5a. CONTRACT NUMBER W56HZV-09-C-0100
5b. GRANT NUMBER
5c. PROGRAM ELEMENT NUMBER
6. AUTHOR(S) Jeyashekar, Nigil; Frame, Ed
5d. PROJECT NUMBER SwRI 08.20639.01.201
5e. TASK NUMBER WD 32, Task 2.2
5f. WORK UNIT NUMBER
7. PERFORMING ORGANIZATION NAME(S) AND ADDRESS(ES) 8. PERFORMING ORGANIZATION REPORT NUMBER
U.S. Army TARDEC Fuels and Lubricants Research Facility (SwRI®) Southwest Research Institute® P.O. Drawer 28510 San Antonio, TX 78228-0510
TFLRF No. 475
9. SPONSORING / MONITORING AGENCY NAME(S) AND ADDRESS(ES) 10. SPONSOR/MONITOR’S ACRONYM(S)
U.S. Army RDECOM U.S. Army TARDEC 11. SPONSOR/MONITOR’S REPORT Force Projection Technologies NUMBER(S) Warren, MI 48397-5000 12. DISTRIBUTION / AVAILABILITY STATEMENT UNCLASSIFIED: Dist A Approved for public release; distribution unlimited 13. SUPPLEMENTARY NOTES
14. ABSTRACT The cetane properties of a fuel blend containing highly iso-paraffinic ATJ fuel and Jet fuel were studied. Literature review was conducted to obtain cetane properties from PQIS database, CRC report and Tri-Services report. Based on data collected from Task 2.4 of WD0024, on cetane properties of ATJ blends, correlation equations were developed to determine cetane properties as a function of volume percentage of ATJ in the fuel, which was used to determine cetane properties of maximum ATJ blends (50/50 ATJ/Jet fuel). The overall conclusion is that maximum ATJ blends from any jet fuel (Jet A, Jet A-1, and JP-8) had an increase in CI from 7% to 8% using the four variable, D4737 method, while the increase in CI was approximately 3% using D976 method. Based on the extensive decrease in CN and DCN values much below 40, maximum ATJ blends (50/50 ATJ/Jet fuel blends) were deemed not fit-for-use. It was concluded that the amount of ATJ that must be blended with Jet A or JP-8 to obtain 40 DCN, was less than 50% for all the PADD. 15. SUBJECT TERMS Cetane properties, Cetane Index, Cetane Number, Derived Cetane Number, ATJ Blends, Jet A, JP-8, Jet A-1, Dataset
16. SECURITY CLASSIFICATION OF: 17. LIMITATION OF ABSTRACT
18. NUMBER OF PAGES
19a. NAME OF RESPONSIBLE PERSON Nigil Jeyashekar
a. REPORT Unclassified
b. ABSTRACT Unclassified
c. THIS PAGE Unclassified
Unclassified
39
19b. TELEPHONE NUMBER (include area code)
201-522-2533
Standard Form 298 (Rev. 8-98) Prescribed by ANSI Std. Z39.18

UNCLASSIFIED
UNCLASSIFIED v
EXECUTIVE SUMMARY
The cetane properties of a fuel blend containing highly iso-paraffinic ATJ fuel and jet fuel were
studied. Literature review was conducted to obtain cetane properties from the Petroleum Quality
Information System (PQIS) database, a Coordinating Research Council (CRC) report and a Tri-
Services report. Based on data collected from Task 2.4 of WD0024, on cetane properties of ATJ
blends, correlation equations were developed to determine cetane properties as a function of
volume percentage of ATJ in the fuel. These equations were used to determine the cetane
properties of maximum ATJ blends (50/50 ATJ/Jet fuel) across all the data sets for all PADDs in
the CONUS and OCONUS regions to the extent that data is available.
The overall conclusion is that maximum ATJ blends from any jet fuel (Jet A, Jet A-1, and JP-8) had
an increase in CI from 7% to 8% using the four variable, ASTM D4737 method, while the increase
in CI was approximately 3% using ASTM D976 method. These values were consistent in all the
literature datasets, spanning from 2006 to 2014, that were reviewed and examined. Based on the
extensive decrease in CN and DCN values much below 40, maximum ATJ blends (50/50 ATJ/Jet
fuel blends) were deemed not fit-for-use. Recommendations were made on the volume percentage
of ATJ that can be blended in for each PADD region in CONUS region to result in a value of 40,
that is deemed fit-for-use in ground equipment, as shown in the Table below. Due to limited data
availability, recommendation could not be made for OCONUS region.
PADD Region
Jet A Jet A JP-8 JP-8 Max vol.%
ATJ DCN Max vol.% ATJ CN Max vol.%
ATJ DCN Max vol.% ATJ CN
1 32.00 40.17 30.00 40.03 32.00 40.17 20.00 40.00 2 0.00 39.90 0.00 39.40 47.00 40.09 26.00 40.19 3 48.00 40.19 32.00 40.19 33.00 40.13 22.00 40.10 4 29.00 40.07 15.00 40.04 16.00 40.07 11.00 40.15 5 24.00 40.05 13.00 40.10 35.00 40.13 11.00 40.15
Jet A obtained from PADD 2 is not qualified to make an ATJ blend. For all practical purposes, it
was concluded that maximum ATJ blends can be made from PADD 3 for Jet A fuel, and PADD 2
for JP-8 fuel, without greatly compromising the overall combustion quality.

UNCLASSIFIED
UNCLASSIFIED vi
FOREWORD/ACKNOWLEDGMENTS
The U.S. Army TARDEC Fuel and Lubricants Research Facility (TFLRF) located at Southwest
Research Institute (SwRI), San Antonio, Texas, performed this work during the period August
2014 through March 2016 under Contract No. W56HZV-09-C-0100. The U.S. Army
Tank Automotive RD&E Center, Force Projection Technologies, Warren, Michigan administered
the project. Mr. Eric Sattler (RDTA-SIE-ES-FPT) served as the TARDEC contracting officer’s
technical representative. Ms. Patsy Muzzell of TARDEC served as project technical monitor.
The author would like to acknowledge the contribution of the TFLRF technical support staff along
with the administrative and report-processing support provided by the TFLRF administrative staff.

UNCLASSIFIED
UNCLASSIFIED vii
TABLE OF CONTENTS
Section Page EXECUTIVE SUMMARY .......................................................................................................................... v FOREWORD/ACKNOWLEDGMENTS .................................................................................................... vi LIST OF FIGURES ................................................................................................................................... viii LIST OF TABLES ...................................................................................................................................... ix ACRONYMS AND ABBREVIATIONS ..................................................................................................... x 1.0 INTRODUCTION AND OBJECTIVE ............................................................................................... 1 2.0 LITERATURE REVIEW .................................................................................................................... 1
2.1 REVIEW OF PQIS DATABASE..................................................................................................... 2 2.2 REVIEW OF CRC REPORT .......................................................................................................... 8 2.3 REVIEW OF TRI-SERVICES DATA ............................................................................................... 9
3.0 ANALYSIS OF PQIS LITERATURE DATA .................................................................................... 9 4.0 DEVELOPING DATA CORRELATIONS ...................................................................................... 18 5.0 CETANE PROPERTIES OF ATJ BLENDS .................................................................................... 20
5.1 MAXIMUM ATJ BLEND CETANE INDEX FOR PQIS DATASET ................................................. 20 5.2 MAXIMUM ATJ BLEND CETANE INDEX FOR CRC DATASET .................................................. 26 5.3 MAXIMUM ATJ BLEND CETANE PROPERTIES FOR TRI-SERVICES DATASET .......................... 27
6.0 CONCLUSIONS ............................................................................................................................... 29 7.0 REFERENCES .................................................................................................................................. 29

UNCLASSIFIED
UNCLASSIFIED viii
LIST OF FIGURES
Figure Page Figure 1. PADD Regions in CONUS ....................................................................................................... 2 Figure 2. Worldwide Defense Regions ..................................................................................................... 2 Figure 3. Defense Regions by Country ..................................................................................................... 3 Figure 4. Non-weighted Cetane Index (D4737-10) of Jet A from PQIS Database for 2011, 2012
and 2013 .................................................................................................................................. 10 Figure 5. Non-weighted Cetane Index (D976-06 (2011)) of Jet A from PQIS Database for
2011, 2012 and 2013 ............................................................................................................... 11 Figure 6. Non-weighted Cetane Index (D4737-10) of Jet A-1 from PQIS Database from 2010
to 2013 ..................................................................................................................................... 12 Figure 7. Non-weighted Cetane Index (D976-06 (2011)) of Jet A-1 from PQIS Database from
2010 to 2013 ............................................................................................................................ 13 Figure 8. Non-weighted Cetane Index (D4737-10) of JP-8 from PQIS Database from 2010 to
2013 ......................................................................................................................................... 14 Figure 9. Non-weighted Cetane Index (D976-06 (2011)) of JP-8 from PQIS Database from
2010 to 2013 ............................................................................................................................ 15 Figure 10. Weighted Cetane Index (D4737-10) of JP-8 from PQIS Database from 2010 to 2013 .......... 16 Figure 11. Weighted Cetane Index (D976-06 (2011)) of JP-8 from PQIS Database from 2010 to
2013 ......................................................................................................................................... 17 Figure 12. Cetane Index Variation in JP-8–ATJ Fuel Blend .................................................................... 18 Figure 13. Derived Cetane Number Variation in JP-8–ATJ Fuel Blend .................................................. 19 Figure 14. Cetane Number Variation in JP-8-ATJ Fuel Blend ................................................................. 19 Figure 15. Non-weighted Cetane Index of Jet A versus 50/50-ATJ/Jet A ............................................... 22 Figure 16. Non-weighted Cetane Index of Jet A-1 versus 50/50-ATJ/Jet A-1 ......................................... 23 Figure 17. Non-weighted Cetane Index of JP-8 versus 50/50-ATJ/JP-8 .................................................. 24 Figure 18. Weighted Cetane Index of JP-8 versus 50/50-ATJ/JP-8 ......................................................... 25

UNCLASSIFIED
UNCLASSIFIED ix
LIST OF TABLES
Table Page Table 1. Summary of Non-weighted PQIS Jet A Data from 2010 to 2013 ............................................ 4 Table 2. Summary of Non-weighted PQIS Jet A-1 Data from 2010 to 2013 ......................................... 5 Table 3. Summary of Non-weighted PQIS JP-8 Data from 2010 to 2013 .............................................. 6 Table 4. Summary of Weighted PQIS JP-8 Data from 2010 to 2013 ..................................................... 7 Table 5. World Survey of Fuels containing Non-weighted CI values from CRC Report ...................... 8 Table 6. Non-weighted Tri-Services Data (2014) .................................................................................. 9 Table 7. Calculated CI Data for JP-8 as Published in 2013 PQIS 2013 Annual Report ....................... 18 Table 8. Non-weighted Cetane Index of Jet A versus 50/50-ATJ/Jet A – PQIS Dataset ...................... 21 Table 9. Non-weighted Cetane Index of Jet A-1 versus 50/50-ATJ/Jet A-1 – PQIS Dataset ............... 21 Table 10. Non-weighted Cetane Index of JP-8 versus 50/50-ATJ/JP-8 – PQIS Dataset ........................ 21 Table 11. Weighted Cetane Index of JP-8 versus 50/50-ATJ/JP-8 – PQIS Dataset ................................ 21 Table 12. Non-weighted Cetane Index of Jet A versus 50/50-ATJ/Jet A – CRC Dataset....................... 26 Table 13. Non-weighted Cetane Index of Jet A-1 versus 50/50-ATJ/Jet A-1 – CRC Dataset ................ 26 Table 14. Non-weighted Cetane Index of JP-8 versus 50/50-ATJ/JP-8 – CRC Dataset ......................... 26 Table 15. Non-weighted Cetane Properties of Jet A versus 50/50-ATJ/Jet A – Tri-Services
Dataset ..................................................................................................................................... 27 Table 16. Non-weighted Cetane Properties of JP-8 versus 50/50-ATJ/JP-8 – Tri-Services
Dataset ..................................................................................................................................... 27 Table 17. Maximum Allowable Volume Percent of ATJ in Fuel Blend ................................................. 28

UNCLASSIFIED
UNCLASSIFIED x
ACRONYMS AND ABBREVIATIONS % Percent
ASTM American Society for Testing and Materials
ATJ Alcohol-to-Jet
CI Cetane Index
CN Cetane Number
CONUS Contiguous United States
CRC Coordinating Research Council
DCN Derived Cetane Number
DoD Department of Defense
FAME Fatty Acid Methyl Ester
JP-8 Jet Propellant-8
max. Maximum
OCONUS Outside the Contiguous United States
PADD Petroleum Administration for Defense Districts
PQIS Petroleum Quality Information System
SwRI Southwest Research Institute
vol. Volume
WD Work Directive
WPFAB Wright-Patterson Air Force Base

UNCLASSIFIED
UNCLASSIFIED 1
1.0 INTRODUCTION AND OBJECTIVE
The Army desired to study the effect of blending highly iso-paraffinic ATJ (Alcohol-to-Jet)
blending stock into JP-8 (Jet Propellant-8) in order to understand the effect of ATJ fuel blends
would have on ground vehicle engines and support equipment. As a part of this objective, the
following study describes the variation in cetane properties when ATJ is blended into JP-8. More
specifically, the objective of the study was to develop formulations for variation in Cetane Index
(CI), Cetane Number (CN), and Derived Cetane Number (DCN), as a function of volume percent
of ATJ in JP-8, using data obtained from Task 2.2 of WD0024. The goal of this study was to apply
these formulations to data available in the literature to determine the CI, CN and DCN values of
50/50 ATJ-JP-8 blends, also known as maximum ATJ blends.
The objective was accomplished by conducting a literature review to collect JP-8, Jet A and
Jet A-1 data available worldwide and applying the formulations to obtain cetane properties of
50/50 ATJ-Jet fuel blends. This report presents and compares statistical charts, containing mean,
standard deviation and range, between jet fuels and 50/50 ATJ-JP-8 blends, also called as
maximum ATJ blends. Weighted statistics are presented to the extent where pertinent data is
available for computation of weighted quantities. The study concludes by presenting the maximum
volume percentage of ATJ that could be blended with JP-8 to maintain a minimum of 40 for the
DCN and CN values.
2.0 LITERATURE REVIEW
The literature review for worldwide data on jet fuel cetane properties was focused on the following
sources:
a. Petroleum Quality Information System (PQIS) 2013: Annual Report and Database [1].
b. Coordinating Research Council (CRC) Report No. 647 [2].
c. SwRI Tri-Services Final Report (Project No. 08.17149.36.100) [3].
A detailed review of each literature source and any limitations thereof are described in the
subsequent sections.

UNCLASSIFIED
UNCLASSIFIED 2
2.1 REVIEW OF PQIS DATABASE
Department of Defense (DoD) has twelve regions in its worldwide reporting structure. Regions 1
to 5, in Figure 1, are designated as Petroleum Administration for Defense Districts (PADD), which
handles the Contiguous United States (CONUS) procurements, while Regions 6 to 12, in Figure 2
are designated to handle procurements Outside the Contiguous United States (OCONUS). Figure
3 provides a detailed breakdown of the 12 worldwide regions by States (for CONUS) and by
countries (for OCONUS).
Figure 1. PADD Regions in CONUS [1]
Figure 2. Worldwide Defense Regions [1]

UNCLASSIFIED
UNCLASSIFIED 3
Figure 3. Defense Regions by Country [1]
In the PQIS database, the mean cetane property refers to the sum of test result of all the batch
analysis and divided by the total number of batches and the weighted cetane property refers to the
volumetrically weighted average of the property, based on volume of jet fuel represented by test
values. The following points highlight the summary of literature review and limitations on the
published data in the PQIS 2013 Annual Report.
• The PQIS 2013 Annual Report provided the necessary distillation information to calculate CI
information for Jet A, JP-8 and Jet A-1, by PADDs for CONUS and OCONUS regions.
Therefore, CI values were calculated using both ASTM D4737 and ASTM D976. This
calculation from distillation data was necessary since CI values were missing and were not
reported as a value in the database at several instances. In certain instances, where CI
information was provided, the method used to obtain that CI value was not given. Due to these
reasons, calculations from distillation data were necessary. It should be noted that there were
no CN or DCN data available, for all three fuels in the PQIS report.
• The second limitation in the PQIS database was the absence of density, distillation data, and
region, from which samples were taken, in several instances. As a result, CI values were not
computed and those data points were excluded as bad data, in addition to data points where the
PADD location, designating the origin of the samples, was missing.

UNCLASSIFIED
UNCLASSIFIED 4
• For Jet A and Jet A-1 fuels, the volume of fuel was missing for more than 50% of the population
even though it contained all the other relevant information for obtaining CI values. Therefore,
weighted CI values could not be obtained for Jet A and Jet A-1 fuels, since the results are
biased and incomparable to non-weighted CI values.
Thus, non-weighted CI values were calculated for Jet A, Jet A-1, and JP-8; and weighted CI values
were calculated for JP-8 fuel. The non-weighted CI values from the PQIS Database for Jet A, Jet
A-1 and JP-8 are provided in Table 1, Table 2, and Table 3, respectively while Table 4 shows the
weighted JP-8 data, wherein both the non-weighted and weighted CI values are listed by PADD
regions and for years 2010 to 2013. The number of data points indicates the actual number of fuel
samples that have both density and distillation data to calculate Cetane Index values.
Table 1. Summary of Non-weighted PQIS Jet A Data from 2010 to 2013 2010
PADD Region Data Points
CI (D4737-10) CI (D976-06 (2011)) Avg SD Min Max Avg SD Min Max
5 17 41.45 0.39 40.66 41.89 39.69 0.53 38.7 40.27 1 to 4 and 6 to 12 U/A* U/A U/A U/A U/A U/A U/A U/A U/A
2011
PADD Region Data Points
CI (D4737-10) CI (D976-06 (2011)) Avg SD Min Max Avg SD Min Max
1 8 45.73 0.77 44.63 46.36 44.53 0.51 43.81 45.01 5 92 41.14 0.4 40.16 42.16 39.25 0.59 37.82 40.23
2 to 4 and 6 to 12 U/A U/A U/A U/A U/A U/A U/A U/A U/A 2012
PADD Region Data Points
CI (D4737-10) CI (D976-06 (2011)) Avg SD Min Max Avg SD Min Max
1 8 46.56 0.31 46.06 47.09 45.37 0.31 44.85 45.87 2 2 43.89 N/A N/A N/A 42.57 N/A N/A N/A 3 21 43.77 1.49 42.37 49.9 42.71 1.11 41.46 47.16 4 9 42.15 0.74 40.94 43.67 39.41 0.82 38.27 41.19 5 24 41.08 0.35 40.22 41.58 39.03 0.44 37.88 39.6
6 to 12 U/A U/A U/A U/A U/A U/A U/A U/A U/A 2013
PADD Region Data Points
CI (D4737-10) CI (D976-06 (2011)) Avg SD Min Max Avg SD Min Max
1 18 47.46 0.64 46.33 48.83 46.16 0.56 45.24 47.1 2 1 47.07 N/A N/A N/A 45.75 N/A N/A N/A 3 84 44.74 2.54 41.82 53.02 43.65 1.93 41.07 50.07 4 39 44.47 1.67 41.27 47.07 42.59 2.29 38.31 45.98 5 12 43.13 0.78 41.91 43.96 41.7 0.98 39.88 43.01
6 and 8 to 12 U/A U/A U/A U/A U/A U/A U/A U/A U/A 7 1 43.33 N/A N/A N/A 41.1 N/A N/A N/A
*U/A – Unavailable in PQIS Database; N/A – Not applicable due to single data point

UNCLASSIFIED
UNCLASSIFIED 5
Table 2. Summary of Non-weighted PQIS Jet A-1 Data from 2010 to 2013 2009
PADD Region
Data Points
CI (D4737-10) CI (D976-06 (2011)) Avg SD Min Max Avg SD Min Max
7 3 47.27 0.49 46.79 47.76 44.63 0.52 44.1 45.14 Remaining U/A U/A U/A U/A U/A U/A U/A U/A U/A
2010 PADD
Region Data
Points CI (D4737-10) CI (D976-06 (2011))
Avg SD Min Max Avg SD Min Max 1 to 5 U/A U/A U/A U/A U/A U/A U/A U/A U/A
6 10 48.06 0.38 47.56 48.64 45.79 0.42 45.22 46.34 7 66 45.55 2.42 37.66 56.99 43.28 2.88 32.33 56.56 8 17 45.55 2.01 42.06 49.8 43.75 2.11 40.1 47.97
2011 PADD
Region Data
Points CI (D4737-10) CI (D976-06 (2011))
Avg SD Min Max Avg SD Min Max 1 to 5 U/A U/A U/A U/A U/A U/A U/A U/A U/A
6 39 46.91 1.17 45.11 49.01 44.19 1.53 41.59 46.5 7 216 45.23 1.88 37.22 48.25 43.34 2.1 35 46.38 8 1 43.16 N/A N/A N/A 41.56 N/A N/A N/A
2012 PADD
Region Data
Points CI (D4737-10) CI (D976-06 (2011))
Avg SD Min Max Avg SD Min Max 1 to 5 U/A U/A U/A U/A U/A U/A U/A U/A U/A
6 15 46.7 0.78 45.46 47.84 43.82 1.33 41.89 45.74 7 156 44.67 1.75 37.79 48.74 42.65 2 29.91 46.2 8 5 45.14 0.79 44.21 46.32 42.46 1.18 40.95 44.06
2013 PADD
Region Data
Points CI (D4737-10) CI (D976-06 (2011))
Avg SD Min Max Avg SD Min Max 1 to 5 U/A U/A U/A U/A U/A U/A U/A U/A U/A
6 15 47.21 1.55 45.22 52.08 44.75 1.73 42.37 49.52 7 89 45.14 2.03 38.68 48.58 43.07 2.23 35.2 46.49 8 3 47.63 0.62 46.92 48.07 45.03 0.6 44.35 45.47
U/A – Unavailable in PQIS Database; N/A – Not applicable due to single data point

UNCLASSIFIED
UNCLASSIFIED 6
Table 3. Summary of Non-weighted PQIS JP-8 Data from 2010 to 2013 2010
PADD Region
Data Points
CI (D4737-10) CI (D976-06 (2011)) Avg SD Min Max Avg SD Min Max
1 2 46.23 0.66 45.76 46.69 43.98 0.83 43.39 44.56 2 224 46.19 1.35 39.82 48.41 45.15 1.53 37.71 47.84 3 406 46.1 2.66 37.47 51.94 46.1 2.66 37.47 51.94 4 27 41.98 0.98 39.51 43.23 39.11 1.29 36 41.01 5 86 40.66 3.11 30.5 46.02 39.34 3.19 29.52 44.87 6 78 46.23 0.44 45.07 47.26 43.02 0.57 41.45 44.27 7 31 46.42 1.24 43.39 48.75 43.86 1.48 40.37 46.6 8 170 42.6 2.56 37.45 48.11 40.64 2.49 35.7 45.8
2011 PADD
Region Data
Points CI (D4737-10) CI (D976-06 (2011))
Avg SD Min Max Avg SD Min Max 1 9 47.05 0.5 45.97 47.78 44.59 0.55 43.73 45.5 2 249 46.14 1.67 40.99 59 45.16 1.9 39.16 59.11 3 445 44.96 3.62 35.78 55.61 43.4 3.49 34.36 53.41 4 16 41.94 0.87 40.85 43.49 38.89 1.17 37.24 40.94 5 104 38.73 2.79 31.59 44.62 37.31 2.72 30.13 43.97 6 89 45.76 0.56 42.2 47.16 42.35 0.7 38.71 44.23 7 55 44.98 2.35 39.53 48.84 42.18 2.58 35.57 46.37 8 158 42.1 2.51 38.07 52.95 40.08 2.43 35.08 50.38
2012 PADD
Region Data
Points CI (D4737-10) CI (D976-06 (2011))
Avg SD Min Max Avg SD Min Max 1 8 47.07 1.54 43.39 48.08 44.66 1.43 41.28 45.7 2 229 46.39 1.4 43.54 60.65 45.24 1.69 41.18 60.03 3 400 45.89 2.45 38.85 51.99 44.27 2.25 37.75 49.78 4 46 43.37 1.33 41.62 48.13 41.04 1.99 38.38 46.83 5 58 37.61 1.95 32.18 43.12 36.2 2.07 30.32 42.67 6 75 46.49 0.63 45.07 47.61 43.25 0.86 41.2 44.81 7 20 46.33 2.47 41.23 48.66 43.67 2.31 39.13 45.93 8 145 42.65 2.67 39.6 47.81 40.53 2.43 37.59 45.1
2013 PADD
Region Data
Points CI (D4737-10) CI (D976-06 (2011))
Avg SD Min Max Avg SD Min Max 1 7 46.09 1.06 44.12 47.61 43.48 1.07 41.85 45.25 2 263 45.95 2.06 38.31 61.15 44.79 2.75 33.07 60.39 3 217 46.98 1.74 44.03 51.62 45.19 1.68 41.36 48.67 4 23 44.66 1.69 41.91 46.55 43.35 1.72 40.44 45.47 5 50 41.46 2.47 35.66 44.35 40.57 3.25 29.27 44.32 6 141 46.24 0.68 40.17 47.92 42.95 1.00 33.81 45.27 7 8 47.03 2.20 42.21 50.04 44.94 2.06 40.76 48.17 8 106 43.24 3.00 39.78 48.32 41.1 2.80 37.65 46.08
U/A – Unavailable in PQIS Database; N/A – Not applicable due to single data point

UNCLASSIFIED
UNCLASSIFIED 7
Table 4. Summary of Weighted PQIS JP-8 Data from 2010 to 2013 2010
PADD Region
Data Points
CI (D4737-10) CI (D976-06 (2011)) Avg SD Min Max Avg SD Min Max
1 2 45.96 0.54 45.76 46.69 43.65 0.68 43.39 44.56 2 224 46.43 1.28 39.82 48.41 45.34 1.43 37.71 47.84 3 406 46.06 2.59 37.47 51.94 44.42 2.65 35.92 50.83 4 27 41.74 1.15 39.51 43.23 38.77 1.49 36.00 41.01 5 86 39.80 4.34 30.50 46.02 38.74 4.54 29.52 44.87 6 78 46.26 0.42 45.07 47.26 43.06 0.56 41.45 44.27 7 31 46.73 1.28 43.39 48.75 44.25 1.55 40.37 46.60 8 170 44.46 2.70 37.45 48.11 42.53 2.57 35.70 45.80
2011 PADD
Region Data
Points CI (D4737-10) CI (D976-06 (2011))
Avg SD Min Max Avg SD Min Max 1 9 47.03 0.52 45.97 47.78 44.52 0.57 43.73 45.50 2 249 46.14 1.31 40.99 59.00 45.14 1.48 39.16 59.11 3 445 45.65 3.34 35.78 55.61 44.09 3.36 34.36 53.41 4 16 41.93 0.87 40.85 43.49 38.85 1.17 37.24 40.94 5 104 39.69 3.43 31.59 44.62 38.18 3.26 30.13 43.97 6 89 45.66 0.84 42.20 47.16 42.26 0.95 38.71 44.23 7 55 44.85 2.44 39.53 48.84 42.08 2.73 35.57 46.37 8 158 43.28 2.63 38.07 52.95 41.22 2.63 35.08 50.38
2012 PADD
Region Data
Points CI (D4737-10) CI (D976-06 (2011))
Avg SD Min Max Avg SD Min Max 1 8 47.38 1.17 43.39 48.08 44.94 1.09 41.28 45.70 2 229 46.22 1.10 43.54 60.65 44.99 1.46 41.18 60.03 3 400 46.17 2.37 38.85 51.99 44.56 2.38 37.75 49.78 4 46 43.46 1.30 41.62 48.13 41.19 1.97 38.38 46.83 5 58 38.36 2.68 32.18 43.12 37.03 2.89 30.32 42.67 6 75 46.44 0.70 45.07 47.61 43.18 0.98 41.20 44.81 7 20 46.44 2.28 41.23 48.66 43.74 2.21 39.13 45.93 8 145 44.41 0.39 39.60 47.81 42.15 0.35 37.59 45.10
2013 PADD
Region Data
Points CI (D4737-10) CI (D976-06 (2011))
Avg SD Min Max Avg SD Min Max 1 7 46.51 1.01 44.12 47.61 43.95 1.13 41.85 45.25 2 263 45.35 2.19 38.31 61.15 43.90 3.03 33.07 60.39 3 217 47.21 1.63 44.03 51.62 45.57 1.59 41.36 48.67 4 23 45.01 1.55 41.91 46.55 43.71 1.59 40.44 45.47 5 50 40.54 3.14 35.66 44.35 39.13 3.29 29.27 44.32 6 141 46.25 0.70 40.17 47.92 42.96 1.04 33.81 45.27 7 8 47.47 2.32 42.21 50.04 45.38 2.25 40.76 48.17 8 106 45.80 0.31 39.78 48.32 43.43 0.29 37.65 46.08

UNCLASSIFIED
UNCLASSIFIED 8
2.2 REVIEW OF CRC REPORT
The data from Coordinating Research Council (CRC) Aviation Committee report, “World Fuel
Sampling Program, CRC Report No. 647” is presented in Table 5 [2]. The original data from the
report only contained distillation and density information from which CI values were computed
and categorized by PADDs along with relevant statistics. It should be noted that no CN or DCN
information was available in the report. Also, the number of data points are so low compared to
PQIS database, that statistical plots of the same are insignificant for this data set [2]. Alternatively,
the data set will be used to study the properties of maximum ATJ blends.
Table 5. World Survey of Fuels containing Non-weighted CI values from CRC Report Jet A
PADD Region
CI (D4737-10) CI (D976-06) Data Points Avg SD Min Max Avg SD Min Max
1 2 46.09 1.56 44.98 47.19 44.94 2.62 43.09 46.8 2 5 45.77 0.85 45.05 46.95 44.65 1.07 43.66 45.97 3 1 47.33 N/A N/A N/A 46.79 N/A N/A N/A 4 U/A U/A U/A U/A U/A U/A U/A U/A U/A 5 4 44.41 5.3 36.95 49.19 43.42 6.07 35.3 49.72
11 (Canada) 1 45.67 N/A N/A N/A 43.76 N/A N/A N/A JP-8
PADD Region
CI (D4737-10) CI (D976-06) Data Points Avg SD Min Max Avg SD Min Max
1 5 47.32 1.04 46.29 48.89 45.46 1.07 44.39 46.94 2 3 45.32 4.22 40.72 49.01 43.34 4.45 38.34 46.84 3 1 40.78 N/A N/A N/A 39.88 N/A N/A N/A 4 U/A U/A U/A U/A U/A U/A U/A U/A U/A 5 1 47.38 N/A N/A N/A 46 N/A N/A N/A
JP-5 PADD
Region CI (D4737-10) CI (D976-06)
Data Points Avg SD Min Max Avg SD Min Max 5 1 42.74 N/A N/A N/A 43.11 N/A N/A N/A 8 1 41.86 N/A N/A N/A 41.06 N/A N/A N/A
Jet A-1 PADD
Region CI (D4737-10) CI (D976-06)
Data Points Avg SD Min Max Avg SD Min Max 6 1 47.71 N/A N/A N/A 45.2 N/A N/A N/A 7 13 44 2.1 40.77 47.6 41.63 2.34 37.72 45.89 8a 4 46.39 0.94 45.09 47.17 43.74 0.76 42.69 44.41 8b 1 47.23 N/A N/A N/A 45.105 N/A N/A N/A 8c 1 40.34 N/A N/A N/A 37.36 N/A N/A N/A 8d 1 40.91 N/A N/A N/A 38.05 N/A N/A N/A 9 U/A U/A U/A U/A U/A U/A U/A U/A U/A 10 2 42.98 3.08 40.81 45.16 40.95 1.76 39.71 42.19 11 6 41.39 2.59 37.48 43.95 39.73 3.25 35.32 43.31
12 (Part Syn.) 1 49.84 N/A N/A N/A 46.92 N/A N/A N/A 12 (100% Syn.) 1 57.79 N/A N/A N/A 53.48 N/A N/A N/A
a - Conventional petroleum based jet fuel; b - Oil Shale, Australia (% Nitrogen content unknown) c - Oil Shale, Australia (Low Nitrogen); d - Oil Shale, Australia (High Nitrogen)
U/A – Unavailable in PQIS Database; N/A – Not applicable due to single data point

UNCLASSIFIED
UNCLASSIFIED 9
2.3 REVIEW OF TRI-SERVICES DATA
All cetane property data from the report “Tri-service Jet Fuel Characterizations for DOD
Applications – Fit-For-Purpose and Trace Impurity Evaluations”, are presented in Table 6 [3]. It
should be noted that this study was conducted with one sample from each CONUS PADD and
therefore, statistical analysis cannot be performed on the data set. However, the data will be used
for predicting cetane properties of maximum ATJ blends, for Jet A and JP-8 fuels.
Table 6. Non-weighted Tri-Services Data (2014) Sample No. on Report Sample Name CI (D4737-10) CI (D976-06) CN (D613) DCN
(D6890) 1 ATJ 61.08 54.47 <19.4 15.2 2 ATJ/JP-8 (50/50) 52.18 48.36 30.8 34.6 7 JP-8 Blend Stock 47.97 46.54 46 45.4 8 JP-8 - PADD 1 47.74 46.23 45.4 45.7 9 JP-8 - PADD 2 47.14 46.38 47.4 49.7
10 JP-8 - PADD 3 49.27 47.52 46.1 45.9 11 JP-8 - PADD 4 44.33 43.15 43 42.3 12 JP-8 - PADD 5 44.68 42.74 43 46.4 25 JP-8 - WPAFB 47.75 46.02 47.4 47.9
13 Jet A - FAME Sensitive 42.34 39.79 41.3 41
14 Jet A - PADD 1 49.39 48.48 48.5 45.7 15 Jet A - PADD 2 41.48 40.37 39.4 39.9 16 Jet A - PADD 3 52.68 50.5 49.3 50.1 17 Jet A - PADD 4 44.51 41.6 44 44.9 18 Jet A - PADD 5 48.1 47.12 43.5 43.8 22 Jet A - Nominal 46.92 45.43 47 48.3 23 Jet A - Best Case 51.58 48.29 47.9 48.8
3.0 ANALYSIS OF PQIS LITERATURE DATA
The statistical CI values generated from the PQIS database are shown from Figure 4 to Figure 11.
It should be noted that CRC and Tri-Services literature data had an insignificant number of data
points and therefore statistical plots were not generated. The general trend for Jet A fuel CONUS
region is that the CI value decreases from PADD region 1 to region 5, while for Jet A-1 in the
OCONUS region there is significant overlap in the range and the variation in CI values in those
OCONUS regions; those regions were concluded to be statistically insignificant. There is no clear
trend in JP-8 CI values. It should be noted that CI values were computed using both D976 and
D4737 methods. The CI values of maximum ATJ blends will be predicted for both methods as
well.

UNCLASSIFIED
UNCLASSIFIED 10
Figure 4. Non-weighted Cetane Index (D4737-10) of Jet A from PQIS Database for 2011, 2012 and 2013

UNCLASSIFIED
UNCLASSIFIED 11
Figure 5. Non-weighted Cetane Index (D976-06 (2011)) of Jet A from PQIS Database for 2011, 2012 and 2013

UNCLASSIFIED
UNCLASSIFIED 12
Figure 6. Non-weighted Cetane Index (D4737-10) of Jet A-1 from PQIS Database from 2010 to 2013

UNCLASSIFIED
UNCLASSIFIED 13
Figure 7. Non-weighted Cetane Index (D976-06 (2011)) of Jet A-1 from PQIS Database from 2010 to 2013

UNCLASSIFIED
UNCLASSIFIED 14
Figure 8. Non-weighted Cetane Index (D4737-10) of JP-8 from PQIS Database from 2010 to 2013

UNCLASSIFIED
UNCLASSIFIED 15
Figure 9. Non-weighted Cetane Index (D976-06 (2011)) of JP-8 from PQIS Database from 2010 to 2013

UNCLASSIFIED
UNCLASSIFIED 16
Figure 10. Weighted Cetane Index (D4737-10) of JP-8 from PQIS Database from 2010 to 2013

UNCLASSIFIED
UNCLASSIFIED 17
Figure 11. Weighted Cetane Index (D976-06 (2011)) of JP-8 from PQIS Database from 2010 to 2013

UNCLASSIFIED
UNCLASSIFIED 18
4.0 DEVELOPING DATA CORRELATIONS
The summary of cetane property results for ATJ-JP-8 blends from Task 2.4 of WD0024 is listed in
Table 7.
Table 7. Calculated CI Data for JP-8 as Published in 2013 PQIS 2013 Annual Report % ATJ Density (15oC) CI (D4737-10) CI (D976-06 (2011)) DCN (D6890) CN (D613)
100 0.7575 60.30 53.90 15.65 <19.4 85 0.7635 58.10 52.53 24.50 <19.4 65 0.7710 56.14 51.41 31.89 26.70 50 0.7766 55.04 50.97 37.04 32.00 35 0.7820 53.77 50.28 41.02 36.40 25 0.7857 53.30 50.22 42.66 41.00 15 0.7896 52.50 49.83 45.15 44.20 0 0.7951 51.18 49.14 47.68 46.90
A plot of the CI data obtained using four variable method ASTM D4737-10 and D976-06 (2011)
versus percent ATJ in JP-8–ATJ blend is shown in Figure 12. A plot of DCN versus percent ATJ in
JP-8–ATJ blend is shown in Figure 13 along with the regression equation that describes the data with
the best fit.
Figure 12. Cetane Index Variation in JP-8–ATJ Fuel Blend

UNCLASSIFIED
UNCLASSIFIED 19
Figure 13. Derived Cetane Number Variation in JP-8–ATJ Fuel Blend
The decreasing DCN trend in Figure 13 is what is expected when synthetic jet fuels are blended with
petroleum based jet fuels. However, Figure 12 is contrary to the trend, indicating the CI correlation
equations stated in ASTM D4737-10 and ASTM D976-06 (2011) are not a direct measure of
combustion quality of jet fuels. Cetane Number (D613) versus percent ATJ in JP-8–ATJ blend is
shown in Figure 14.
Figure 14. Cetane Number Variation in JP-8-ATJ Fuel Blend

UNCLASSIFIED
UNCLASSIFIED 20
The correlation equations were differentiated with respect to volume percentage of ATJ in the fuel
blend to yield the equations required for numerical computation of cetane properties for maximum
ATJ blends. If ‘i’ refers to volume percentage of ATJ in the fuel blend, then:
i. 𝐷𝐷𝐷𝐷𝐷𝐷(𝑖𝑖+1) = 𝐷𝐷𝐷𝐷𝐷𝐷(𝑖𝑖) − [(0.0042 ∙ 𝑖𝑖) + 0.1036]
ii. 𝐷𝐷𝐷𝐷(𝑖𝑖+1) = 𝐷𝐷𝐷𝐷(𝑖𝑖) − [(0.0024 ∙ 𝑖𝑖) + 0.2450]
iii. 𝐷𝐷𝐶𝐶(𝐷𝐷4737)(𝑖𝑖+1) = 𝐷𝐷𝐶𝐶(𝐷𝐷4737)(𝑖𝑖) + [(0.0006 ∙ 𝑖𝑖) + 0.0565]
iv. 𝐷𝐷𝐶𝐶(𝐷𝐷976)(𝑖𝑖+1) = 𝐷𝐷𝐶𝐶(𝐷𝐷976)(𝑖𝑖) + [(0.0004 ∙ 𝑖𝑖) + 0.0188]
The above equations could either be programmed or used in MS Excel, starting with iteration i=0%,
corresponding to neat jet fuel, computed up to i=49%, which yields cetane property values at (i+1)
or 50%, corresponding to 50/50-ATJ/Jet fuel blends, also called maximum ATJ blends. The
subsequent section presents the results obtained by applying the above algorithm to data set that has
been reviewed in the literature.
5.0 CETANE PROPERTIES OF ATJ BLENDS
The numerical iterative technique using the above equations were applied to PQIS, CRC and Tri-
services data set to obtain cetane properties of maximum ATJ blends.
5.1 MAXIMUM ATJ BLEND CETANE INDEX FOR PQIS DATASET
The CI values of jet fuels versus maximum ATJ blend for PADD regions are presented from Table 8
to Table 11. Non-weighted statistical quantities such as mean, standard deviation, and range were
determined for Jet A, Jet A-1, and JP-8 fuels, while the same weighted statistical quantities were
determined only for JP-8 fuel because of the availability of sufficient data in PQIS database.
Overall, for all the jet fuels it was determined that the CI value maximum ATJ blend increased by
7% to 9% using the four variable CI D4737 method, while the CI obtained using D976 method
showed an overall increase in CI between 3% and 4%. Because of the lack of CN and DCN
information in the PQIS report, no statistical projections were made and it is recommended that this
information be added to future releases of PQIS database.

UNCLASSIFIED
UNCLASSIFIED 21
Table 8. Non-weighted Cetane Index of Jet A versus 50/50-ATJ/Jet A – PQIS Dataset PADD Region
CI (D4737-10) CI (D976-06 (2011)) Jet A 50/50
ATJ/Jet A % Increase Jet A 50/50
ATJ/Jet A %
Increase 1 47.46 51.05 7.56 46.16 47.61 3.14 2 47.07 50.66 7.63 45.75 47.2 3.17 3 44.74 48.33 8.02 43.65 45.1 3.32 4 44.47 48.06 8.07 42.59 44.04 3.40 5 43.13 46.72 8.32 41.7 43.15 3.48 7 43.33 46.92 8.29 41.1 42.55 3.53
Table 9. Non-weighted Cetane Index of Jet A-1 versus 50/50-ATJ/Jet A-1 – PQIS Dataset PADD Region
CI (D4737-10) CI (D976-06 (2011)) Jet A-1 50/50
ATJ/Jet A-1 %
Increase Jet A-1 50/50
ATJ/Jet A-1 %
Increase 6 47.21 50.8 7.60 44.75 46.2 3.24 7 45.14 48.73 7.95 43.07 44.52 3.37 8 47.63 51.22 7.54 45.03 46.48 3.22
Table 10. Non-weighted Cetane Index of JP-8 versus 50/50-ATJ/JP-8 – PQIS Dataset PADD Region
CI (D4737-10) CI (D976-06 (2011)) JP-8 50/50
ATJ/JP-8 %
Increase JP-8 50/50
ATJ/JP-8 %
Increase 1 46.09 49.68 7.79 43.48 44.93 3.33 2 45.95 49.54 7.81 44.79 46.24 3.24 3 46.98 50.57 7.64 45.19 46.64 3.21 4 44.66 48.25 8.04 43.35 44.8 3.34 5 41.46 45.05 8.66 40.57 42.02 3.57 6 46.24 49.83 7.76 42.95 44.40 3.38 7 47.03 50.62 7.63 44.94 46.39 3.23 8 43.24 46.83 8.30 41.10 42.55 3.53
Table 11. Weighted Cetane Index of JP-8 versus 50/50-ATJ/JP-8 – PQIS Dataset PADD Region
CI (D4737-10) CI (D976-06 (2011)) JP-8 50/50
ATJ/JP-8 %
Increase JP-8 50/50
ATJ/JP-8 %
Increase 1 46.51 50.10 7.72 43.95 45.40 3.30 2 45.35 48.94 7.92 43.90 45.35 3.30 3 47.21 50.80 7.60 45.57 47.02 3.18 4 45.01 48.60 7.98 43.71 45.16 3.32 5 40.54 44.13 8.86 39.13 40.58 3.71 6 46.25 49.84 7.76 42.96 44.41 3.38 7 47.47 51.06 7.56 45.38 46.83 3.20 8 45.80 49.39 7.84 43.43 44.88 3.34

UNCLASSIFIED
UNCLASSIFIED 22
Figure 15. Non-weighted Cetane Index of Jet A versus 50/50-ATJ/Jet A

UNCLASSIFIED
UNCLASSIFIED 23
Figure 16. Non-weighted Cetane Index of Jet A-1 versus 50/50-ATJ/Jet A-1
UNCLASSIFIED
UNCLASSIFIED 24
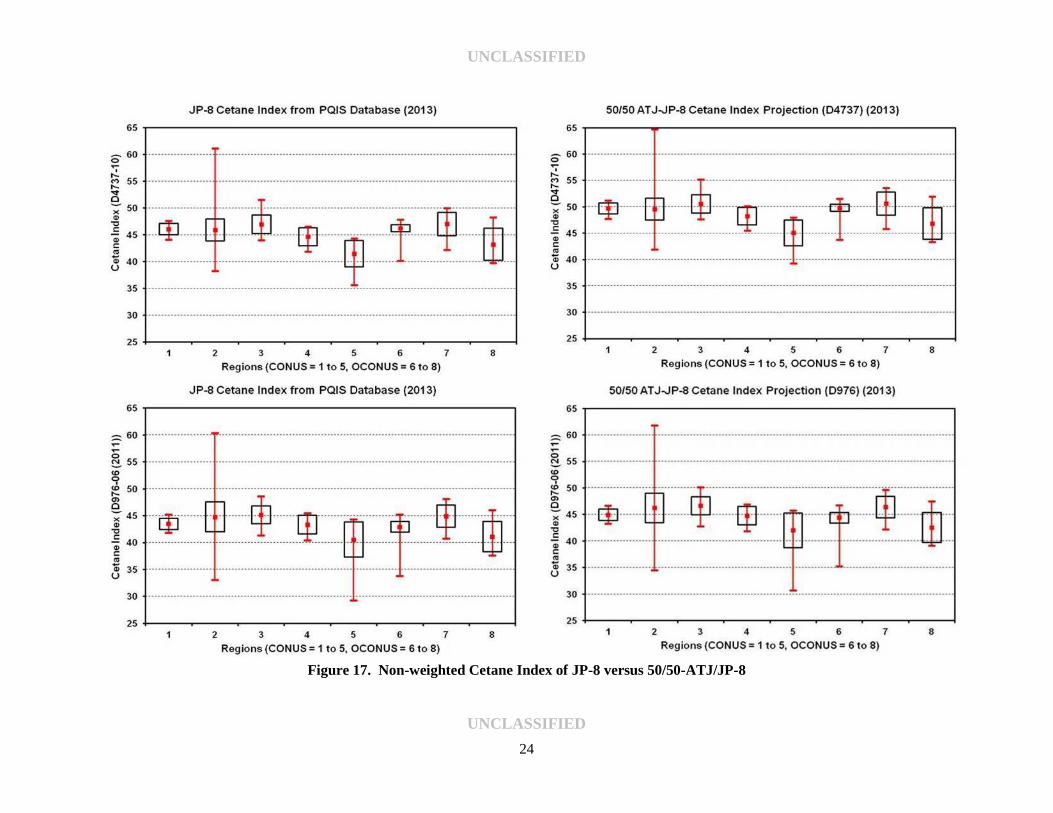
Figure 17. Non-weighted Cetane Index of JP-8 versus 50/50-ATJ/JP-8

UNCLASSIFIED
UNCLASSIFIED 25
Figure 18. Weighted Cetane Index of JP-8 versus 50/50-ATJ/JP-8

UNCLASSIFIED
UNCLASSIFIED 26
5.2 MAXIMUM ATJ BLEND CETANE INDEX FOR CRC DATASET
The projected CI values of maximum ATJ blends for the CRC data set are shown from Table 12 to
Table 14.
Table 12. Non-weighted Cetane Index of Jet A versus 50/50-ATJ/Jet A – CRC Dataset
PADD Region
CI (D4737-10) CI (D976-16 (2011))
Jet A 50/50 ATJ/Jet A
% Increase Jet A 50/50
ATJ/Jet A %
Increase 1 46.09 49.68 7.79 46.09 47.54 3.15 2 45.77 49.36 7.84 45.77 47.22 3.17 3 47.33 50.92 7.59 47.33 48.78 3.06 4 U/A U/A U/A U/A U/A U/A 5 44.41 48 8.08 44.41 45.86 3.27
11 (Canada) 45.67 49.26 7.86 45.67 47.12 3.17 U/A - Unavailable
Table 13. Non-weighted Cetane Index of Jet A-1 versus 50/50-ATJ/Jet A-1 – CRC Dataset
PADD Region
CI (D4737-10) CI (D976-16 (2011)) Jet A-1 50/50
ATJ/Jet A-1 %
Increase Jet A-1 50/50
ATJ/Jet A-1 %
Increase 6 47.71 51.3 7.52 47.71 49.16 3.04 7 44 47.59 8.16 44 45.45 3.3 8a 46.39 49.98 7.74 46.39 47.84 3.13 8b 47.23 50.82 7.6 47.23 48.68 3.07 8c 40.34 43.93 8.9 40.34 41.79 3.59 8d 40.91 44.5 8.78 40.91 42.36 3.54 9 U/A U/A U/A U/A U/A U/A 10 42.98 46.57 8.35 42.98 44.43 3.37 11 41.39 44.98 8.67 41.39 42.84 3.5
12 (Part-Syn) 49.84 53.43 7.2 49.84 51.29 2.91 12 (100% Syn) 57.79 61.38 6.21 57.79 59.24 2.51
a - Conventional petroleum based jet fuel b - Oil Shale, Australia (% Nitrogen content unknown) c - Oil Shale, Australia (Low Nitrogen) d - Oil Shale, Australia (High Nitrogen) U/A - Unavailable
Table 14. Non-weighted Cetane Index of JP-8 versus 50/50-ATJ/JP-8 – CRC Dataset
PADD Region
CI (D4737-10) CI (D976-06 (2011))
JP-8 50/50 ATJ/JP-8
% Increase JP-8 50/50
ATJ/JP-8 %
Increase 1 47.32 50.91 7.59 47.32 48.77 3.06 2 45.32 48.91 7.92 45.32 46.77 3.2 3 40.78 44.37 8.8 40.78 42.23 3.56 4 U/A U/A U/A U/A U/A U/A 5 47.38 50.97 7.58 47.38 48.83 3.06
U/A - Unavailable

UNCLASSIFIED
UNCLASSIFIED 27
The dataset from CRC Report No. 647 contained a few fuel sample sets and therefore statistical
quantities were not computed and plotted. The CI values were calculated from distillation data and
density in the report. The overall conclusion is that the CI values increase between 7% to 8% for
maximum ATJ blend when four variable CI ASTM D4737 method is used and the increase is a around
3% when CI is computed using ASTM D976 method, for all three jet fuels. This conclusion is
consistent with the overall increase in CI values obtained using the PQIS data set.
5.3 MAXIMUM ATJ BLEND CETANE PROPERTIES FOR TRI-SERVICES DATASET
The Tri-Services dataset contains all the cetane properties, including DCN and CN values, in addition
to CI data from both ASTM D4737 and ASTM D976 methods, for Jet A and JP-8 fuel. In addition to
CI predictions of maximum ATJ blends, projections could also be made for CN and DCN properties.
The most vital information being the percentage volume of ATJ that can be blended in to result in a
minimum DCN or CN value of 40, for each PADD region. A comparison of cetane properties for
neat fuels and maximum ATJ blends are shown in Table 15 and Table 16, for Jet A and JP-8 fuels,
respectively.
Table 15. Non-weighted Cetane Properties of Jet A versus 50/50-ATJ/Jet A – Tri-Services Dataset PADD Region
CI (D4737-10) CI (D976-16 (2011)) DCN CN
Jet A 50/50
ATJ/Jet A %
Change
Jet A 50/50
ATJ/Jet A %
Change
Jet A 50/50
ATJ/Jet A %
Change
Jet A 50/50
ATJ/Jet A %
Change 1 47.71 51.3 7.52 47.71 49.16 3.04 45.70 35.17 -23.05 48.50 33.19 -31.57 2 44 47.59 8.16 44 45.45 3.3 39.90 29.37 -26.40 39.40 24.09 -38.86
3 46.39 49.98 7.74 46.39 47.84 3.13 50.10 39.57 -21.03 49.30 33.99 -31.05 4 47.23 50.82 7.6 47.23 48.68 3.07 44.90 34.37 -23.46 44.00 28.69 -34.80 5 40.34 43.93 8.9 40.34 41.79 3.59 43.80 33.27 -24.05 43.50 28.19 -35.20
Table 16. Non-weighted Cetane Properties of JP-8 versus 50/50-ATJ/JP-8 – Tri-Services Dataset
PADD Region
CI (D4737-10) CI (D976-16 (2011)) DCN CN
JP 8 50/50
ATJ/JP-8 %
Change
JP-8 50/50
ATJ/JP-8 %
Change
JP-8 50/50
ATJ/JP-8 %
Change
JP-8 50/50
ATJ/JP-8 %
Change 1 47.74 51.33 7.52 46.23 47.68 3.14 45.70 35.17 -23.05 45.40 30.09 -33.72 2 47.14 50.73 7.62 46.38 47.83 3.13 49.70 39.17 -21.20 47.40 32.09 -32.30 3 49.27 52.86 7.29 47.52 48.97 3.05 45.90 35.37 -22.95 46.10 30.79 -33.21 4 44.33 47.92 8.10 43.15 44.60 3.36 42.30 31.77 -24.91 43.00 27.69 -35.60 5 44.68 48.27 8.03 42.74 44.19 3.39 46.40 35.87 -22.70 43.00 27.69 -35.60

UNCLASSIFIED
UNCLASSIFIED 28
It should be noted that the percentage change in CI values for both Jet A and JP-8, was between 7%
to 8% using ASTM D4737, and around 3% using ASTM D976 method, which is consistent with
PQIS and CRC data sets. The additional information that can be inferred from the results is that there
is a drastic decrease in CN and DCN values for maximum ATJ blends. The decrease in DCN varies
between 20% to 25%, while the decrease in CN varies between 30% to 35%. As a result the CN and
DCN values for some PADD regions fall much below than the prescribed value of 40. In PADD 2,
for Jet A, the maximum ATJ blend has a DCN value of 29.37, while PADD 4 performs poorly with
a DCN value of 31.77. Therefore, it is strongly recommended that maximum ATJ blends should not
be used for Army ground equipment.
The maximum volume percentage of ATJ in the blend that yields a CN or DCN value of 40, was
determined for each PADD, based on the correlation equations that were developed in Section 4.0
and the results are listed in Table 17.
Table 17. Maximum Allowable Volume Percent of ATJ in Fuel Blend PADD Region
Jet A Jet A JP-8 JP-8 Max vol.%
ATJ DCN Max vol.% ATJ CN Max vol.%
ATJ DCN Max vol.% ATJ CN
1 32.00 40.17 30.00 40.03 32.00 40.17 20.00 40.00 2 0.00 39.90 0.00 39.40 47.00 40.09 26.00 40.19 3 48.00 40.19 32.00 40.19 33.00 40.13 22.00 40.10 4 29.00 40.07 15.00 40.04 16.00 40.07 11.00 40.15 5 24.00 40.05 13.00 40.10 35.00 40.13 11.00 40.15
For Jet A fuel, in PADD 2, the CN and DCN values of neat fuel are approximately equal to 40, and
therefore, Jet A obtained from PADD 2 is not qualified to make a blend, as it would further reduce
the CN/DCN values. While on the other hand, PADD 3 is best suited to make fuel blends with
maximum volume percentage of ATJ, as high as 48-vol.% of ATJ. For CN values of Jet A, PADDs
4 and 5 can take the least amount of ATJ in the fuel to get a CN value around 40, while PADDs 1 and
3 can take twice the volume of ATJ to reach the same value. For JP-8 fuel, PADDs 1, 3 and 5, takes
around 30-vol% of ATJ to reach a DCN value of 40. PADD 2 can take as high as 47-vol%, while
PADD 4 takes around 16-vol% to each the same value. For all the PADDs, it takes between 10-vol%
and 25-vol% for CN values to drop closer to 40. Overall, for all practical purposes, it can be concluded
that maximum ATJ blends can be made from PADD 3 for Jet A fuel , and PADD 2 for JP-8 fuel.

UNCLASSIFIED
UNCLASSIFIED 29
6.0 CONCLUSIONS
The overall conclusion is that maximum ATJ blends from any jet fuel (Jet A, Jet A-1, and JP-8) had
an increase in CI from 7% to 8% using the four variable, ASTM D4737 method, while the increase
in CI was approximately 3% using ASTM D976 method. These values were consistent in all the
literature datasets, spanning from 2006 to 2014, that were reviewed and examined. Based on the
extensive decrease in CN and DCN values much below 40, it is recommended that maximum ATJ
blends (50/50 ATJ/Jet fuel blends) not be used in Army equipment with diesel engines. Calculations
were made for the volume percentage of ATJ that can be blended into jet fuel for each PADD region
in CONUS to result in a CN or DCN value of 40. This formed the recommendation for achieving
maximum ATJ blends that are deemed fit-for-use in ground equipment. Additionally, it was
highlighted that Jet A obtained from PADD 2 is not qualified to make an ATJ blend. For all practical
purposes, it was concluded that maximum ATJ blends can be made from PADD 3 for Jet A fuel , and
PADD 2 for JP-8 fuel, without greatly compromising the overall combustion quality.
7.0 REFERENCES
1. Petroleum Quality Information System 2013 Annual Report, Defense Logistics Agency
Energy, Fort Belvoir, VA.
2. Hadaller, O. J., and Johnson, J. M., “World Fuel Sampling Program,” CRC Final Report No.
647, prepared for Coordinating Research Council, Inc., Alpharetta, GA, 2006.
3. Edwards, J. T., Hutzler, S. A., Morris, R. E., Muzzell, P. A., “Tri-Service Jet Fuel
Characterization for DoD Applications – Fit-For-Purpose and Trace Impurity Evaluations,”
SwRI Final Report – Project No. 08.17149.36.100, Southwest Research Institute, San
Antonio, TX, 2014.


![[Revista ATJ 12] Entrevista a Zaffaroni](https://img.pdfslide.us/doc/110x75/55cf9008550346703ba292fa/revista-atj-12-entrevista-a-zaffaroni.jpg)