Embed Size (px)
Citation preview
[ 1 ]
KENDRIYA VIDYALAYA SANGATHAN
ZONAL INSTITUTE OFEDUCATION AND TRAINING
BhubaneswarSTUDY MATERIAL 2012- 13
CLASS XI
ECONOMICS
PATRON : Ms Usha Aswath Iyer
MATERIAL PRODUCTION: Mr. Parsuram Shukla
[ 2 ]
STUDY MATERIAL
CLASS. XI ECONOMICS
For : 2012 - 2013
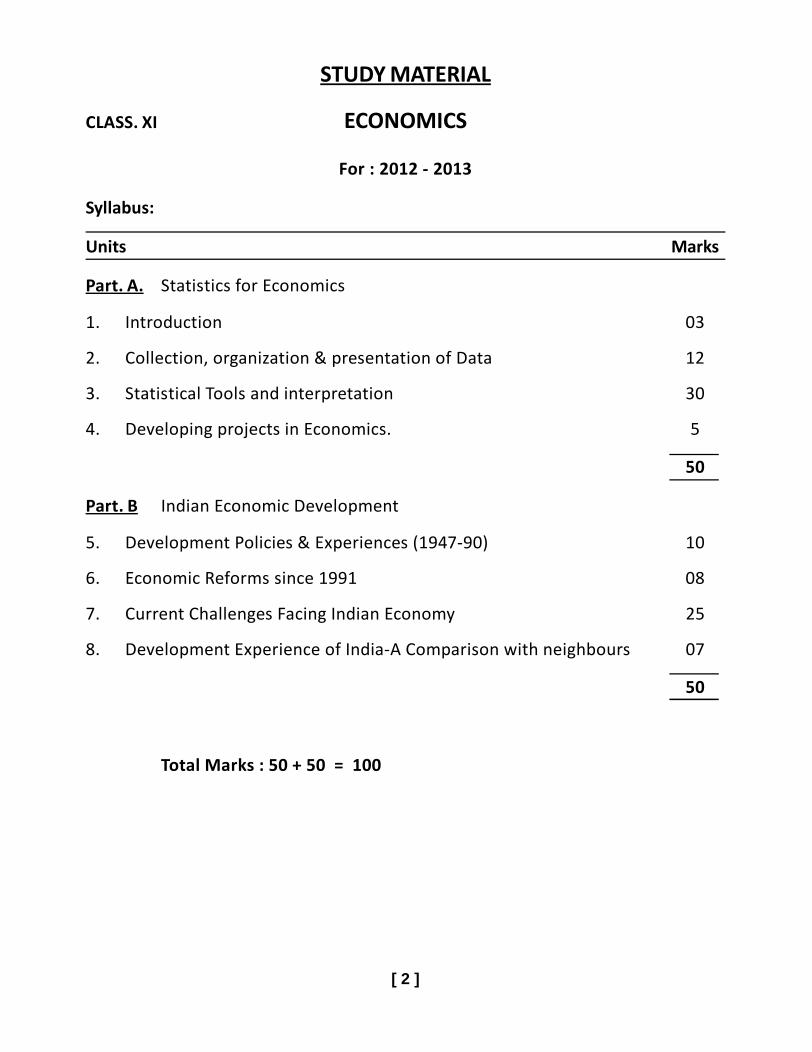
Syllabus:
Units Marks
Part. A. Statistics for Economics
1. Introduction 03
2. Collection, organization & presentation of Data 12
3. Statistical Tools and interpretation 30
4. Developing projects in Economics. 5
50
Part. B Indian Economic Development
5. Development Policies & Experiences (1947-90) 10
6. Economic Reforms since 1991 08
7. Current Challenges Facing Indian Economy 25
8. Development Experience of India-A Comparison with neighbours 07
50
Total Marks : 50 + 50 = 100

[ 3 ]
UNIT – 3 STATISTICAL TOOLS AND INTERPRETATION :-
1. Measures of central Tendency.
2. Measures of Dispersion
3. Co-relation and Measures of correlation
4. Introduction to Index Numbers.
Measures of Central Tendency
(Important Terms & Concepts) :-
1. Average or measures of central Tendency :- It is a value which is a typical orrepresentative of a set of data. Averages are also called measures of centraltendency, since they tend to lie centrally, with in a set of data arranged accordingto magnitude.
2. Functions of Average :-
Average helps to get a representative value to the entire set of data.
It Facilitates Comparison.
It is a useful tool in decision- making.
3. Essentials of a Good Average / good measures of Central Tendency : -
Simplicity in calculation
Easy to understand
Rigidly Defined
Precise Value
Based upon all observations
Unaffected by extreme values.
Capable for further statistical calculations.
4. Types of Averages / measures of central Tendency :- There are three averages,which are in common use- Arithmetic Mean, Median and Mode.

[ 4 ]
5. Arithmetic Means ( X ):-
It is the most common type of measures of central tendency. It is obtained bydividing the sum of all observations in a series by the total numbers ofobservations.
6. Calculation of Arithmetic Mean :-
For Individual series / ungrouped Data :-
(i)N
XX Direct Method
(ii)N
dAX Assumed Mean Method / Short Cut Method.
(iii) iN
dAX '
(step Deviation method.)
For Discrete and Continuous Series / Grouped Data:
(i)
f
fmor
f
fxX ( Direct method )
(ii)N
fdAX (Assumed Mean Method / Short-cut method.)
(iii) iN
fdAX '
(step deviation method)
7. Mathematical Properties Of Arithmetic Mean :-
The algebraic sum of deviations of items from arithmetic mean X is alwayss
Zero, i.e. 0– XX .
The Sum of the squared deviations of the item from A.M. is minimum i.e.
2––2
AXXX .
8. Merits of Arithmetic Mean:-
(i) It is easy to calculate and simple to understand.(ii) It is rigidly defined.(iii) It is a calculated value not a positional value.(iv) It is based on all observations.
[ 5 ]
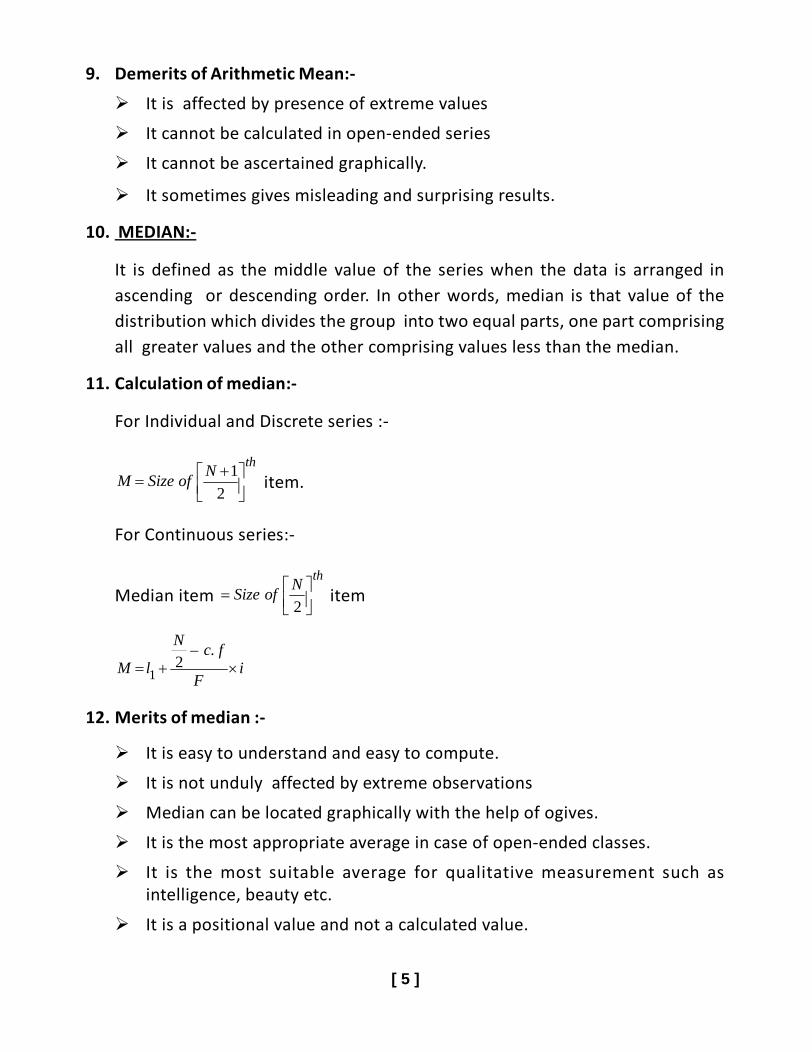
9. Demerits of Arithmetic Mean:-
It is affected by presence of extreme values
It cannot be calculated in open-ended series
It cannot be ascertained graphically.
It sometimes gives misleading and surprising results.
10. MEDIAN:-
It is defined as the middle value of the series when the data is arranged inascending or descending order. In other words, median is that value of thedistribution which divides the group into two equal parts, one part comprisingall greater values and the other comprising values less than the median.
11. Calculation of median:-
For Individual and Discrete series :-
thN
ofSizeM
2
1 item.
For Continuous series:-
Median itemth
NofSize
2 item
iF
fcN
lM .–
21
12. Merits of median :-
It is easy to understand and easy to compute.
It is not unduly affected by extreme observations
Median can be located graphically with the help of ogives.
It is the most appropriate average in case of open-ended classes.
It is the most suitable average for qualitative measurement such asintelligence, beauty etc.
It is a positional value and not a calculated value.
[ 6 ]
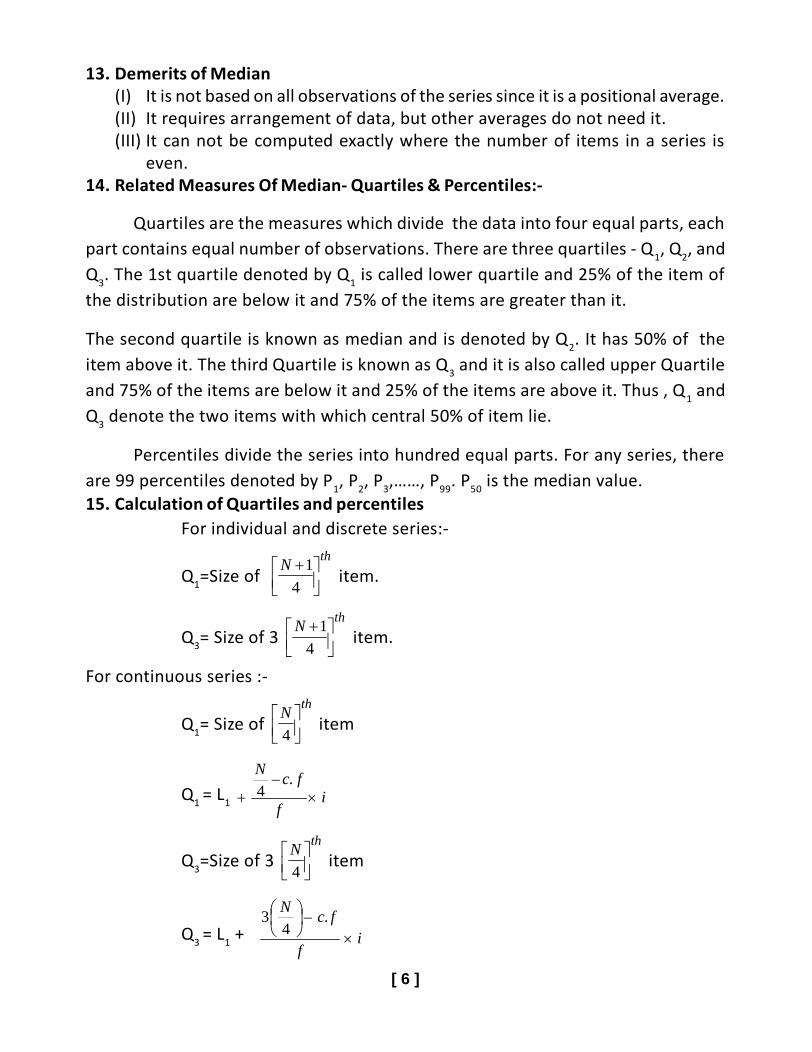
13. Demerits of Median(I) It is not based on all observations of the series since it is a positional average.(II) It requires arrangement of data, but other averages do not need it.(III) It can not be computed exactly where the number of items in a series is
even.14. Related Measures Of Median- Quartiles & Percentiles:-
Quartiles are the measures which divide the data into four equal parts, eachpart contains equal number of observations. There are three quartiles - Q1, Q2, andQ3. The 1st quartile denoted by Q1 is called lower quartile and 25% of the item ofthe distribution are below it and 75% of the items are greater than it.
The second quartile is known as median and is denoted by Q2. It has 50% of theitem above it. The third Quartile is known as Q3 and it is also called upper Quartileand 75% of the items are below it and 25% of the items are above it. Thus , Q1 andQ3 denote the two items with which central 50% of item lie.
Percentiles divide the series into hundred equal parts. For any series, thereare 99 percentiles denoted by P1, P2, P3,……, P99. P50 is the median value.15. Calculation of Quartiles and percentiles
For individual and discrete series:-
Q1=Size ofth
N
4
1 item.
Q3= Size of 3th
N
4
1 item.
For continuous series :-
Q1= Size ofth
N
4 item
Q1 = L1 if
fcN
.–
4
Q3=Size of 3th
N
4 item
Q3 = L1 + if
fcN
.–
43
[ 7 ]
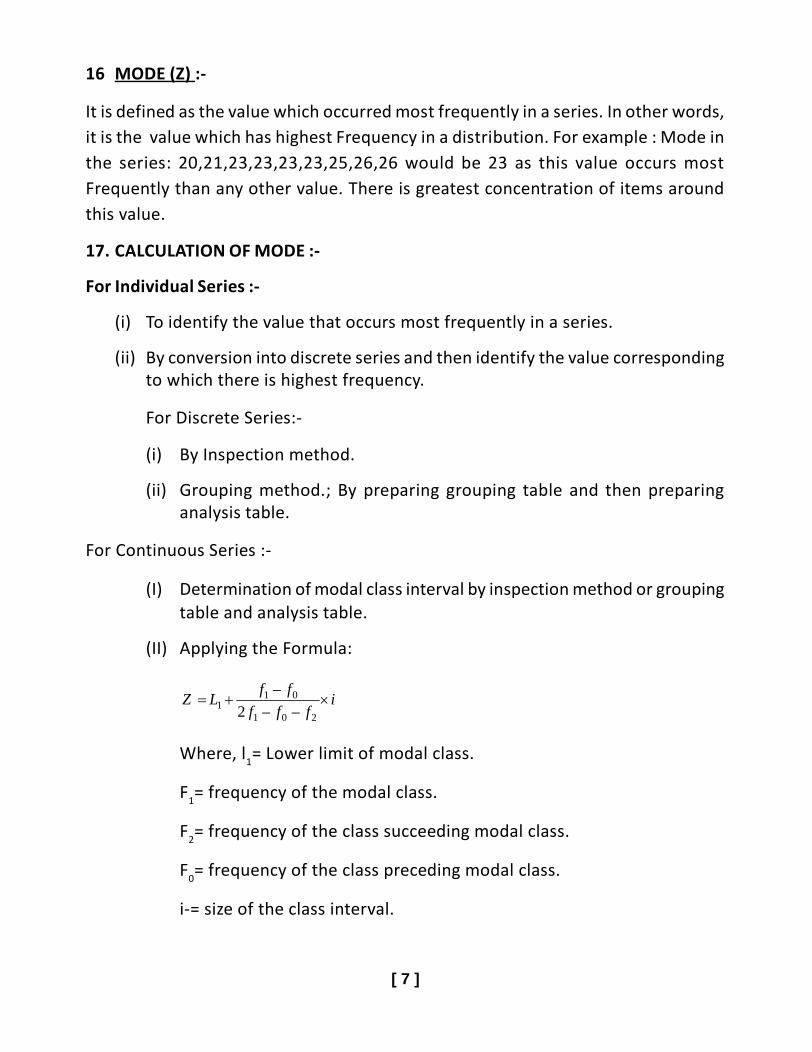
16 MODE (Z) :-
It is defined as the value which occurred most frequently in a series. In other words,it is the value which has highest Frequency in a distribution. For example : Mode inthe series: 20,21,23,23,23,23,25,26,26 would be 23 as this value occurs mostFrequently than any other value. There is greatest concentration of items aroundthis value.
17. CALCULATION OF MODE :-
For Individual Series :-
(i) To identify the value that occurs most frequently in a series.
(ii) By conversion into discrete series and then identify the value correspondingto which there is highest frequency.
For Discrete Series:-
(i) By Inspection method.
(ii) Grouping method.; By preparing grouping table and then preparinganalysis table.
For Continuous Series :-
(I) Determination of modal class interval by inspection method or groupingtable and analysis table.
(II) Applying the Formula:
ifff
ffLZ
201
011 ––2
–
Where, l1= Lower limit of modal class.
F1= frequency of the modal class.
F2= frequency of the class succeeding modal class.
F0= frequency of the class preceding modal class.
i-= size of the class interval.

[ 8 ]
18. Merits of mode :-
(i) It is easy to understand and simple to calculate
(ii) It is not affected by the presence of extreme values .
(iii) It can be located graphically with the help of histogram.
(iv) It can be easily calculated in case of open-ended classes.
19. Demerits of mode:-
(i) It is not rigidly defined.
(ii) When frequencies of all items are identical, It is difficult to identify the ModalValue.
(iii) It is not based on all observations.
(iv) Mode is not capable of further algebraic treatment.
20. Relative position of mean, median and mode:-
The relative position of X , M and Z depends upon the shape of the frequencydistribution which is discussed below.
(i) In case of symmetrical distribution, mean median and mode are identicali.e.
ZMX .
(ii) In a moderately asymmetrical (skewed) distribution, mean median andmode are not equal, i.e. ZMX .
(a) When the distribution is positively skewed, i.e. skewed to the right, then
ZMX .
(b) When the distribution is negatively skewed, i.e. skewed to the left, then
ZMX .
Note :- The median (m) always lie between arithmetic mean X and mode (Z).
21. Empirical Relationship between x,m and z:
In a moderately asymmetrical distribution, the values of mean, median and modeare observed to have the following relationship :
Mode = 3 median – 2 mean.

[ 9 ]
22. Questions with Answer
1 Mark Questions :-
1. Define an average?
Ans. An average is a single value that represents the whole group.
2. Name the measures of central tendency?
Ans. Three important types of statistical averages are :-
Arithmetic Mean, median and mode.
3. What is median?
Ans. It is defined as the middle value of the series when arranged either inascending order or in descending order.
4. What is mode ?
Ans. It is defined as the value which occurs most frequently in a series.
5. Can mode be graphically located ?
Ans : Mode can be located graphically with the help of histogram
6. Average daily wage of 50 workers of a factory was Rs. 200. Each worker isgiven a raise of Rs 20. What is the new average daily wage ?
Ans. Increase is wages of each worker=Rs20.
Total increase in wages = 50x20= Rs 1000.
Total wages before increase in wages = 50x200=Rs 10,000.
Total wages after increase in wages= 10,000+1000= Rs 11000.
New average wages 220.50
000,11Rs
N
X
Thus mean wage will increase by Rs 20.
7. What relationship exists between mean, median and mode in case of asymmetrical distribution ?
Ans. In a symmetrical distribution, ZMX
[ 10 ]
8. What relationship exists between MX and Z in moderately negativeeswewed distribution ?
Ans. In a moderately negative skewed distribution. ZMX .
3 / 4 marks Questions : -
9. Explain the characteristics of a good average?
Ans. Characteristics of a good average/measures of central tendency
(i) It should be easy to understand.
(ii) It should be simple to compute.
(iii) It should be rigidly (well) defined.
(iv) It should be based on all the observations.
(v) It should not be unduly affected by the extreme values.
(vi) It should be capable of further algebraic treatment.
10. “Arithmetic mean is affected by very large and very small values but medianand mode are not affected by them.” Explain.
Ans. Median is the value of the middle item of a series arranged in ascending orin descending order of magnitude. Mode only takes values at the pointsaround which the items tend to be most heavily concentrated. Arithmeticmean takes into account the value of all items (i.e. very large and very small)in a series. Thus it is only the arithmetic mean which is affected by extremevalues in the series.
11. Which average would be suitable in the following cases?
(i) Average size of readymade garments.
(ii) Average intelligence of students in a class.
(iii) Average Production in a factory per shift.
(iv) Average wages in an industrial concern.
(v) When the sum of absolute deviations from average is least.
(vi) In case of open-ended frequency distribution
Ans.
(i) Mode, (ii) Median, (iii) Mean(iv) Mean, (V) Median, (vi) Median or mode.

[ 11 ]
23. Some Numerical Questions : -
1. Calculate Arithmetic mean from the following data using direct and short cutmethod / Assumed mean method:
Size: 10 20 30 40 50 60
Frequency 7 8 12 15 5 3
2. Calculate Arithmetic mean from the following data using step- deviationmethod:-
Size 20-29 30-39 40-49 50-59 60-69
Frequency 10 8 6 4 2
3. Find median of the following observations:
20,15,25,28,18, 16,30
4. Calculate median of the following data.
Marks : 11-15 16-20 21-25 26-30 31-35 36-40 41-45 46-50
No of Students: 7 10 13 26 35 22 11 5
5. Calculate Q1 and Q3 From the following data
Marks: 10 20 30 40 50 60
No of students: 4 10 20 8 6 3
6. Calculate the value of median and Q1 from the following data :
Marks: 0-10 10-20 20-30 30-40 40-50
No of Students: 5 8 10 4 3
7. Calculate the mode of the following data:
4,6,5,7,9,8,10,4,7,6,5,8,7,7,9
8. Calculate mode from the following data
Marks: 0-10 10-20 20-30 30-40 40-50 50-60 60-70
No of Students : 2 5 8 10 8 5 2
[ 12 ]
MEASURES OF DISPERSION :-
1. Dispersion refers to the variation of the items around an average. According toDr Bowley : “Dispersion is the measure of variations of items.” To quoteCONNOR : - “Dispersion is a measure of the extent to which the individual itemsvary.”
2. Objectives of Dispersion :
(i) To determine the reliability of an average
(ii) To compare the variability of two or more series
(iii) It serves the basis of other statistical measures such as correlation etc.
(iv) It serves the basis of statistical quality control.
3. Properties of a good measure of dispersion:
(i) It should be easy to understand.
(ii) It should be simple to calculate
(iii) It should be uniquely defined.
(iv) It should be based on all observations.
(v) It should not be unduly affected by extreme items.
4. Measures of dispersion may be either absolute or relative.
Absolute measures of dispersion are expressed in the some units in which dataof the series are expressed i.e., rupees kgs, tons etc. where as relative measuresof dispersion are independent of the units of measurement. They are expressedin percentage these are used to compare two or more series which are expressedin different units.
5. Absolute measures of dispersion are:-
(i) Range
(ii) Quartile Deviation
(iii) Mean Deviation
(iv) Standard deviation and variance.
[ 13 ]
6. Relative measures of dispersion are:-
(i) Coefficient of Range.
(ii) Coefficient of Quartile Deviation
(iii) Coefficient of mean Deviation
(iv) Coefficient of standard Deviation
(v) Coefficient of variation
7. Besides the above measures of dispersion there is a graphic method of studyingdispersion, known as Lorenz curve.
8. Range is the simplest measure of dispersion : -
It is the difference between the largest and smallest value of the distribution.
Computation of range:- It is calculated as
Range = L - S
Coefficient of Range =SL
SL
–
.
9. Merits of Range :-
(i) It is simple to understand and easy to calculate
(ii) It is widely used in statistical quality control.
10. Demerits of Range=
(i) It is affected by extreme values in the series.
(ii) It can not be calculated in case of open-ended series.
(iii) It is not based on all the items of the series.
11.Inter quartile range and quartile deviation are another measures of dispersion.Inter-quartile range is the difference between the upper quartile Q3 and lowerquartile Q1. Quartile deviation is half of the difference between the upper quartileand lower quartile i.e. half of the inter-quartile range.
Computation of Inter-quartile Range and Quartile Deviation:-
Inter- quartile Range:- Q3 – Q1
[ 14 ]
Quartile Deviation (Q.D) : =2
– 13 QQ
Co. efficient of Q.D : =13
13 –QQ
12. Merits of Quartile Deviation:-
(i) It is easy to compute.
(ii) It is less affected by extreme items
(iii) It can be computed in open-ended series.
13. Demerits of Quartile Deviation :-
(i) It ignores half i.e. 50% of the items.
(ii) It is useful only for rough study.
(iii) It is not based on all observations.
14. Mean deviation :- It is defined as the arithmetic average of the absolutedeviations (ignoring signs) of the various items from a measure of centraltendency ; i.e. mean or median. Generally, mean deviation is calculated frommedian because the sum of the absolute deviations taken from median isminimum or least.
15. Computation of mean Deviation :- It is computed as:-
Individual series /ungrouped data:-
N
DMD
Discrete/Continuous series :-N
DfMD
Coefficient of M.D. = MorX
MDMD
16. Merits of mean Deviation:-
(i) It is based on all observations.
(ii) It is least affected by extreme items.
(iii) It is simple to understand and easy to calculate.
[ 15 ]
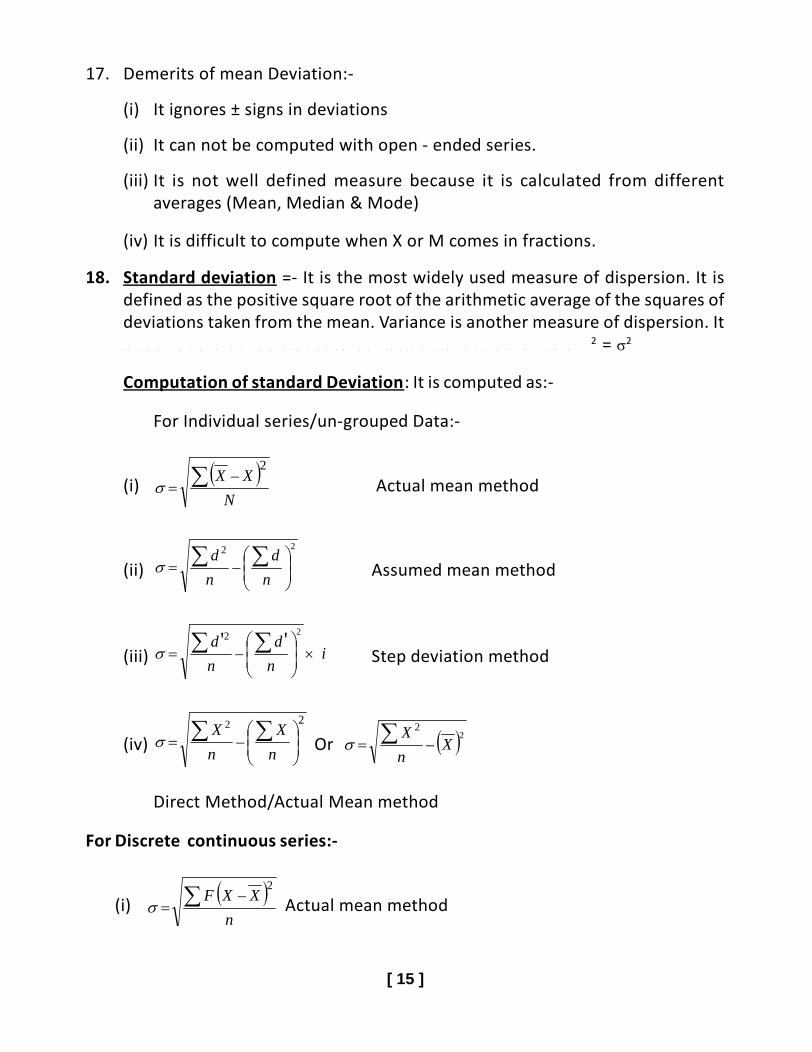
17. Demerits of mean Deviation:-
(i) It ignores ± signs in deviations
(ii) It can not be computed with open - ended series.
(iii) It is not well defined measure because it is calculated from differentaverages (Mean, Median & Mode)
(iv) It is difficult to compute when X or M comes in fractions.
18. Standard deviation =- It is the most widely used measure of dispersion. It isdefined as the positive square root of the arithmetic average of the squares ofdeviations taken from the mean. Variance is another measure of dispersion. Iti s t h e s q u a r e o f t h e s t a n d a r d d e v i a t i o n i . e , V a r i a n c e = ( S . D . )
2 = 2
Computation of standard Deviation: It is computed as:-
For Individual series/un-grouped Data:-
(i) N
XX2
– Actual mean method
(ii)2
–2
n
d
n
d Assumed mean method
(iii) in
d
n
d
2''
–2
Step deviation method
(iv)2
–2
n
X
n
X Or 2–
2
Xn
X
Direct Method/Actual Mean method
For Discrete continuous series:-
(i) n
XXF2
– Actual mean method
[ 16 ]
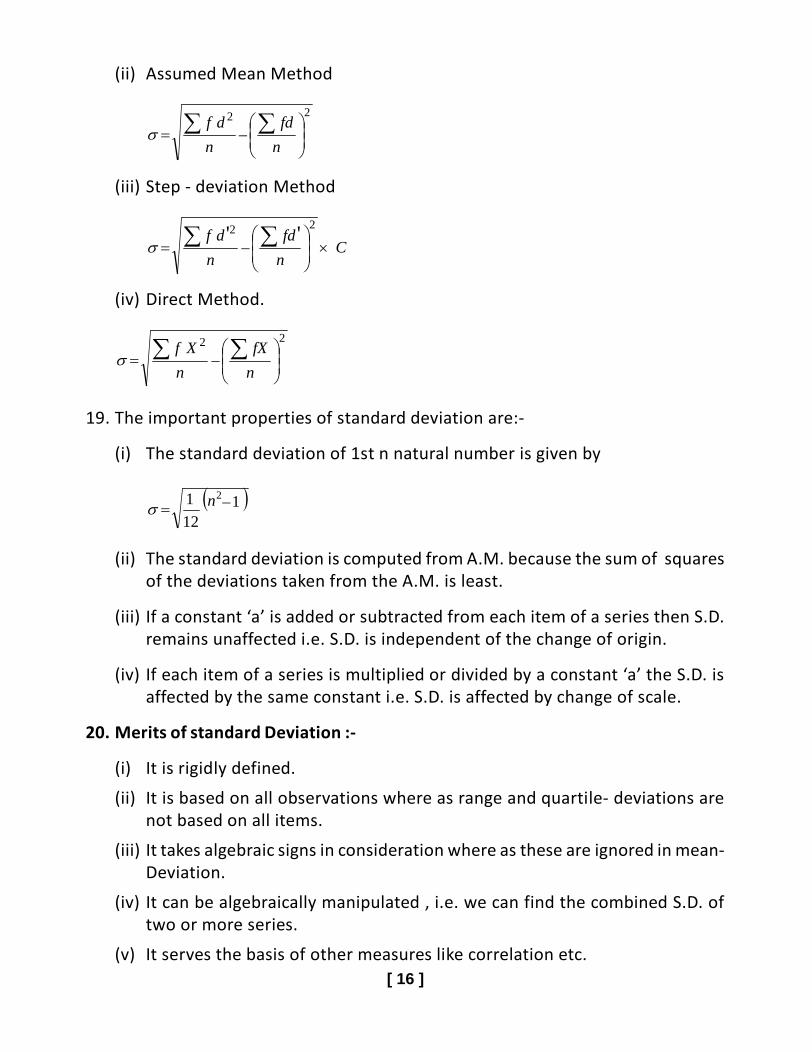
(ii) Assumed Mean Method
22
–
n
fd
n
df
(iii) Step - deviation Method
Cn
fd
n
df
22 ''–
(iv) Direct Method.
22
–
n
fX
n
Xf
19. The important properties of standard deviation are:-
(i) The standard deviation of 1st n natural number is given by
1–12
1 2n
(ii) The standard deviation is computed from A.M. because the sum of squaresof the deviations taken from the A.M. is least.
(iii) If a constant ‘a’ is added or subtracted from each item of a series then S.D.remains unaffected i.e. S.D. is independent of the change of origin.
(iv) If each item of a series is multiplied or divided by a constant ‘a’ the S.D. isaffected by the same constant i.e. S.D. is affected by change of scale.
20. Merits of standard Deviation :-
(i) It is rigidly defined.
(ii) It is based on all observations where as range and quartile- deviations arenot based on all items.
(iii) It takes algebraic signs in consideration where as these are ignored in mean-Deviation.
(iv) It can be algebraically manipulated , i.e. we can find the combined S.D. oftwo or more series.
(v) It serves the basis of other measures like correlation etc.
[ 17 ]
21. Demerits of standard deviation:-
(i) As compared to range and quartile deviation, it is difficult to understandand compute.
(ii) It gives more importance to extreme items.
22. Coefficient of variation is a relative measure of dispersion. It is used incomparing the variability of two or more series. Computation of coefficientof variation:- It is computed as: -
Coefficient of variation (C.V.)= 100X
23. Lorenz curve:- It is a graphical method of measuring dispersion. It has greatutility in the study of degree of inequality in the distribution of income andwealth between the countries. It is also useful for comparing the distributionof wages, profits etc over different business groups. It is a cumulativepercentage curve in which the percentage of frequency (persons or workers)is combined with the percentage of other items such as income, profits,wages etc.
Selected Questions
1. What do you mean by dispersion ?
2. What is range?
3. What is meant by quartile deviation?
4. What do you mean by mean deviation?
5. What do you mean by standard deviation?
6. What is variance ?
7. What is relative measure of dispersion?
8. What is coefficient of variation?”
9. What is a Lorenz curve?
10. If Q1=41, Q3=49, find the value of coefficient of Quartile deviation.
11. Name the important absolute and relative measures of dispersion.
12. Why standard deviation is measured from the mean?”
13. Find out the standard deviation, if variance is, 1444 ?
14. Write the formula of calculating mean deviation from mean.
[ 18 ]
15. Distinguish between absolute and relative measures of dispersion.
16. Name the various measures of dispersion. Explain the merits and demeritsof any two .
17. From the following data, calculate range and coefficient of range.
Marks: 10 20 30 40 50 60 70
No of students 8 12 7 30 10 5 2
18. Calculate quartile deviation and coefficient of quartile deviation from thedata given below.
320, 400 450 530 550 580 600 610 700 780 800
19. Find out mean deviation of the following data (use median method)
Item 12 18 25 35 47 55 62 75
Frequency 8 12 15 23 16 18 31 12
20. Calculate mean and standard deviation from the following data:-
Class interval: 0-10 10-20 20-30 30-40 40-50
Frequency: 8 13 16 8 5
21. Draw a Lorenz curve from the data given below.
Income 100 200 400 500 800
No. of persons: 80 75 50 30 20
22. Explain the characteristics of a good measure of dispersion.
23. Find the mean deviation from the median and its coefficient for the followingdata :
Class interval: 10-19 20-29 30-39 40-49 50-59
Frequency: 3 4 6 5 2
24. Calculate mean and standard deviation from the following data :
C.I. 10-20 20-30 30-40 40-50
F: 13 16 8 5

[ 19 ]
Correlation Analysis: -
1. Meaning of correlation : It studies and measures the intensity of relationshipbetween two or more variables. If the two variables, X and Y change (vary) insuch a way that with a change in value of one variable the values of the othervariable also change, then they are said to be correlated.
2. Significance of correlation: correlation has immense utility in statistics.
i. It helps in determining the degree of relationship between variables.
ii. We can estimate the value of one variable on the basis of the value ofanother variable correlation serves the basis of regression.
iii. Correlation is useful for economists. An economist specifies the relationshipbetween different variables like demand and supply, money supply andprice level by way of the correlation.
3. Correlation and causation: It measures co-variation, not causation. It shouldnever be interpreted as implying cause and effect relationship between twovariables. The presence of correlation between two variables X and Y simplymeans that when one variable is found to change in one direction, the value ofthe other variable is found to change either in same direction or in the oppositedirection.
4. Positive and Negative Correlation :-
Correlation is classified into positive and negative correlation when twovariables move in the same direction, i.e. if the value of Y increases ( ordecreases) with an increase (or decrease) in the value of X, they are said to bepositively related. On the other hand when two variables move in the oppositedirection i.e. if the value of variable ‘X’ increase (or decrease) with the decreaseor increase in the value of Y variable, they one said to be negatively correlated.
5. Linear and Non- linear correlation:-
Correlation may be linear or non-linear . If the amount of change in one variabletends to have a constant relation with the amount of change in the othervariable then the correlation is said to be liner. It is represented by a straightline. On the otherhand if the amount of change in one variable does not haveconstant proportional relationship to the amount of change in the othervariable, then the correlation is said to be non-linear or curvi-linear.
[ 20 ]
6. Simple , multiple and partial correlation :-
Correlation may also be simple, multiple and partial correlation. When twovariables are studied to determine correlation, it is called simple correlation onthe other hand when more than two variables are studied to determine thecorrelation it is called multiple correlation. When correlation of only two variablesis studied keeping other variables constant, it is called partial correlation.
7. Methods of studying correlation :- The correlation between the two variablescan be determined by the following three methods:-
(a) Scatter diagram
(b) Karl Pearson’s method of correlation coefficient
(c) Spearman’s method of Rank correlation.
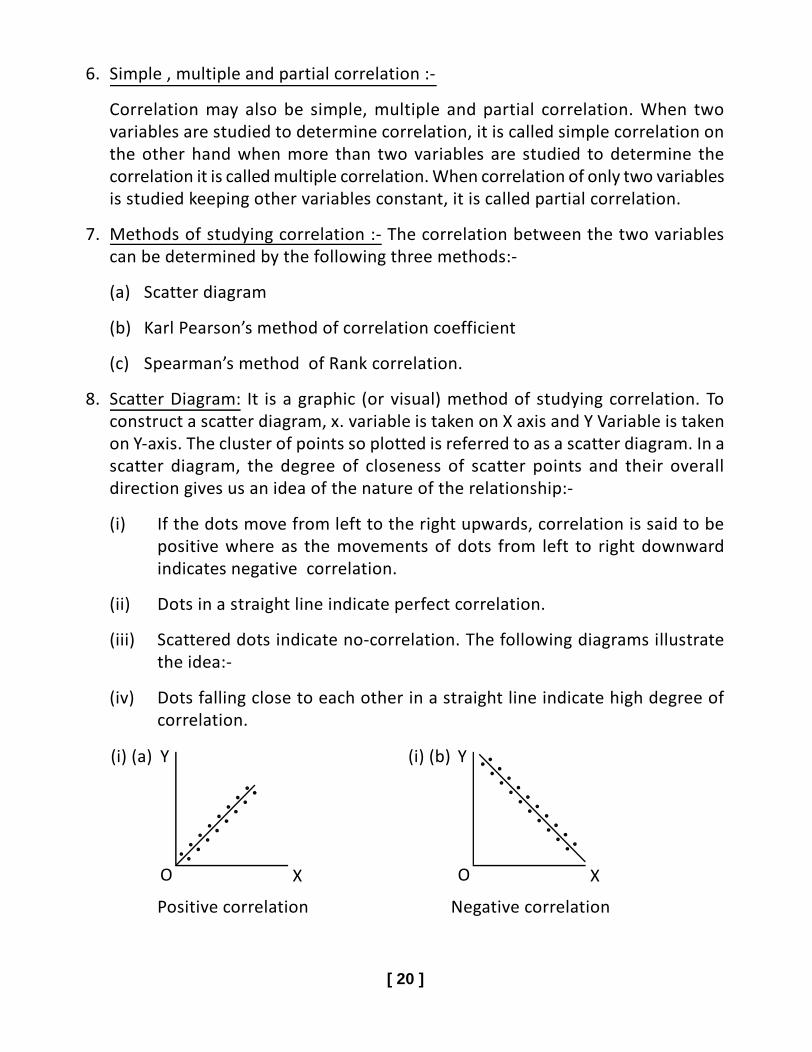
8. Scatter Diagram: It is a graphic (or visual) method of studying correlation. Toconstruct a scatter diagram, x. variable is taken on X axis and Y Variable is takenon Y-axis. The cluster of points so plotted is referred to as a scatter diagram. In ascatter diagram, the degree of closeness of scatter points and their overalldirection gives us an idea of the nature of the relationship:-
(i) If the dots move from left to the right upwards, correlation is said to bepositive where as the movements of dots from left to right downwardindicates negative correlation.
(ii) Dots in a straight line indicate perfect correlation.
(iii) Scattered dots indicate no-correlation. The following diagrams illustratethe idea:-
(iv) Dots falling close to each other in a straight line indicate high degree ofcorrelation.
Positive correlation Negative correlation
Y
XO
(i) (a) Y
XO
(i) (b)

[ 21 ]
Perfect Positive correlation Perfect Negative correlation
No correlation
9 Karl pearson’s coefficient of correlation:- Karl pearson’s coefficient of correlationis an important and widely used method of studying correlation. Karl pearsonhas measured the degree of relationship between the two variables with help ofcorrelation coefficient. Coefficient of correlation measures the degree ofrelationship between the two variables.
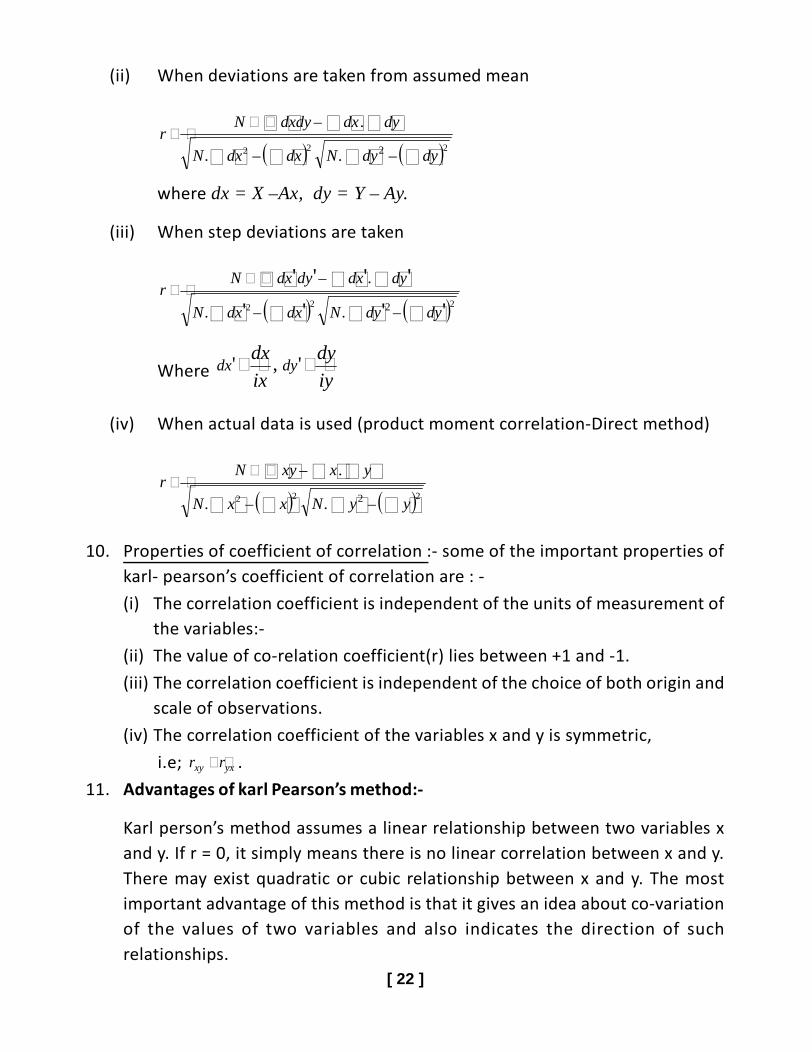
Computation of Karl pearsons coefficient of correlation :- The various formulae usedto calculate coefficient of correlation (r) are : -
(i) When deviations are taken from mean
22 . YX
XYr
The formula is also expressed as :
22
––
––
YYXX
YYXXr
Y
XO
(ii) (a) Y
XO
(ii) (b)
Y
XO
(iii)
[ 22 ]
(ii) When deviations are taken from assumed mean
222 –.–.
.–
2 dydyNdxdxN
dydxdxdyNr
where dx = X –Ax, dy = Y – Ay.
(iii) When step deviations are taken
222 ''''
''''
–.–.
.–
2 dydyNdxdxN
dydxdydxNr
Where iy
dy
ix
dxdydx ','
(iv) When actual data is used (product moment correlation-Direct method)
222 –.–.
.–
2 yyNxxN
yxxyNr
10. Properties of coefficient of correlation :- some of the important properties ofkarl- pearson’s coefficient of correlation are : -
(i) The correlation coefficient is independent of the units of measurement ofthe variables:-
(ii) The value of co-relation coefficient(r) lies between +1 and -1.
(iii) The correlation coefficient is independent of the choice of both origin andscale of observations.
(iv) The correlation coefficient of the variables x and y is symmetric,
i.e; yxxy rr .
11. Advantages of karl Pearson’s method:-
Karl person’s method assumes a linear relationship between two variables xand y. If r = 0, it simply means there is no linear correlation between x and y.There may exist quadratic or cubic relationship between x and y. The mostimportant advantage of this method is that it gives an idea about co-variationof the values of two variables and also indicates the direction of suchrelationships.

[ 23 ]
12. Rank Correlation :- Charles Edward spearman evolved another method offinding out correlation between different qualitative attributes of a variable.This is known, as rank correlation coefficient. When a group of individuals arearranged according to their degree of possession of a character (say, beauty,intelligence etc), they are said to be ranked. Spearman’s formula for rankscorrelation coefficient in as follows:-
(A) When Ranks are not repeated :-
NN
DR
–6
–1 3
2
(B When Ranks are repeated
NN
MMDR
–
........–121
6–1 3
32
Where D = Difference between the ranks of the two series and
N = number of individuals in each series.
13. The most important advantage of rank correlation method is that it can beused when quantitative measurement is not possible.
Important Questions :-
(1) What is correlation?
(2) When are the two variables said to be in perfect correlation?
(3) Define karl- Pearson’s coefficient of correlation
(4) Mention any two properties of karl Pearson’s coefficient of correlation.
(5) Define covariance ?
(6) Can simple correlation coefficient measure any type of relationship?
(7) What is the difference between liner and non-liner correlation?
(8) What is scatter Diagram method and how is it useful in the study ofcorrelation ?
(9) State the merits of Spear Man’s Rank - Correlation ?
[ 24 ]
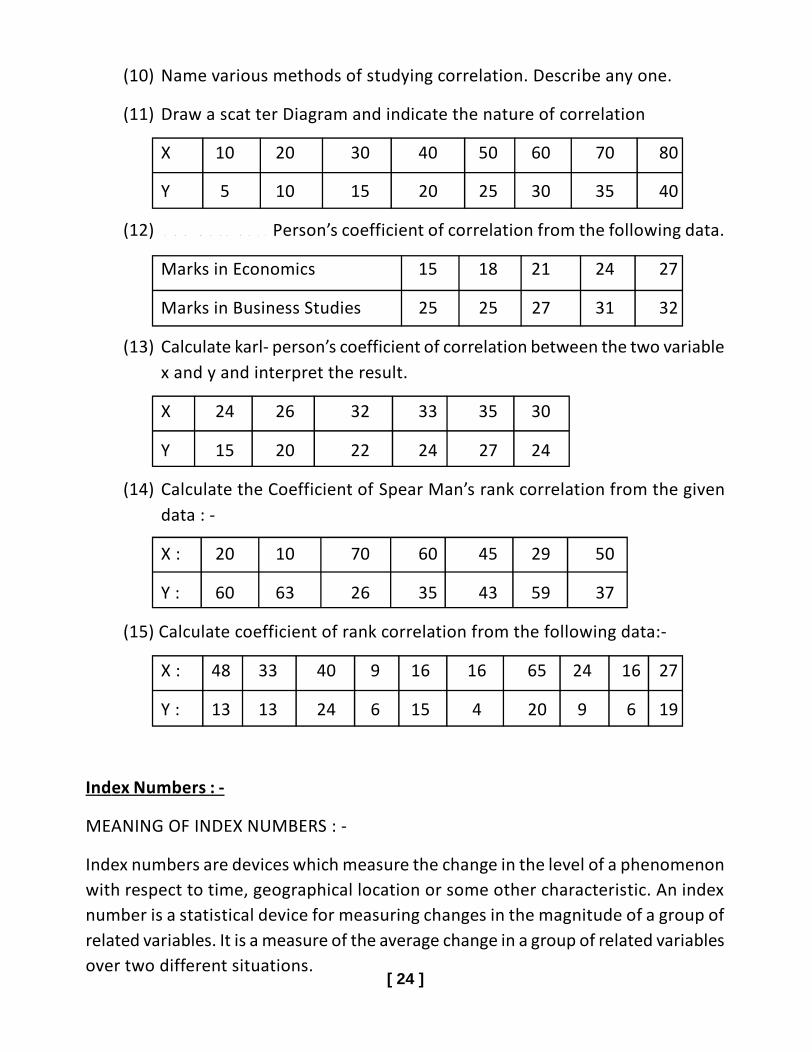
(10) Name various methods of studying correlation. Describe any one.
(11) Draw a scat ter Diagram and indicate the nature of correlation
X 10 20 30 40 50 60 70 80
Y 5 10 15 20 25 30 35 40
(12) C o m p u t e k a r l Person’s coefficient of correlation from the following data.
Marks in Economics 15 18 21 24 27
Marks in Business Studies 25 25 27 31 32
(13) Calculate karl- person’s coefficient of correlation between the two variablex and y and interpret the result.
X 24 26 32 33 35 30
Y 15 20 22 24 27 24
(14) Calculate the Coefficient of Spear Man’s rank correlation from the givendata : -
X : 20 10 70 60 45 29 50
Y : 60 63 26 35 43 59 37
(15) Calculate coefficient of rank correlation from the following data:-
X : 48 33 40 9 16 16 65 24 16 27
Y : 13 13 24 6 15 4 20 9 6 19
Index Numbers : -
MEANING OF INDEX NUMBERS : -
Index numbers are devices which measure the change in the level of a phenomenonwith respect to time, geographical location or some other characteristic. An indexnumber is a statistical device for measuring changes in the magnitude of a group ofrelated variables. It is a measure of the average change in a group of related variablesover two different situations.
[ 25 ]
Definitions of Index Numbers : -
In the words of Edge worth, ‘Index number shows by its variation the changesin a magnitude which is not susceptible either of a accurate measurement in itselfor of direct valuation in practice.’
In the words of Tuttle, ‘ An index number is a single ratio (usually inpercentage)which measures the combined (i.e., averaged) change of severalvariables between two different times, places or situations.’
Features/Characteristics of Index Numbers:-
Index numbers are specialized averages.
Index numbers are expressed in percentages.
Index numbers measure the effect of changes in relation to time or place.
PROBLEMS IN CONSTRUCTION OF INDEX NUMBERS:-
Purpose of Index Numbers.
Selection of Base Year. Base year is the reference year. It is the year with whichprice of the Current year are compared.
(i) The base period should be a normal year.
(ii) The difference between base year and current year should not be too long.
(iii) Fixed Base or Chain Base.
Selection of number of goods and services.
(i) The commodities selected should be representative of the tastes, habitsand customs of the people for whom the Index is meant.
(ii) The total number of items should be neither too small nor too large,because if it is too small, then the index number will not be representativeand if it is too large, the more representative shall be the index but at thesame time the greater shall be the cost and the time taken.
(iii) The standardized or graded commodities should be selected to arrive atmeaningful and valid comparisons.
(iv) Selection of Prices of the goods and services (Price Quotations)
V) There are two methods, in which price can be quoted:- (Price Quotations)
(i) Money prices
(ii) Quantity prices
Selection of the Average
[ 26 ]
V) Selection of appropriate weights : - There are several Methods of accordingweight i.e.
(i) Fisher’s Method (ii) Paasche’s Method (iii) Laspeyre’s Method.
Vi) Selection of an appropriate Formula
Index numbers can be constructed with the help of the many Formulae.
Such as : (1) Laspeyres Method. (2) Paasche’s Method
(3) Fisher’s ideal Method.
TYPES OF INDEX NUMBERS:-
i) Consumer Price Index (CPI) (iv) Index of Agricultural Production
ii) Wholesale Price Index (WPI) v) Sensex (Stock Market)
iii) Index of Industrial Prodution (IIP)
Price Index Numbers:-
i. Wholesale Price Index Numbers
The wholesale price index number reflects the general price level for a groupof items taken as a whole. In India, it is the most popular price index used in thebusiness industry and policy market. It acts as an indicator of the rate of inflation.
ii. Retail Price Index Numbers
The retail price index number reflects the general changes in the retail pricesof various items including food, housing, clothing, and so on. The Consumer PriceIndex, a special type of retail price index, is the primary measure of the cost ofliving in a country.
METHODS OF CONSTRUCTING PRICE INDEX NUMBERS
i. Unweighted Index Numbers
ii. Weighted Index Numbers.
iii. Both of these methods of constructing index numbers are further classifiedas:
(i) Aggregative Method;
(ii) Average of Relatives Method.
[ 27 ]
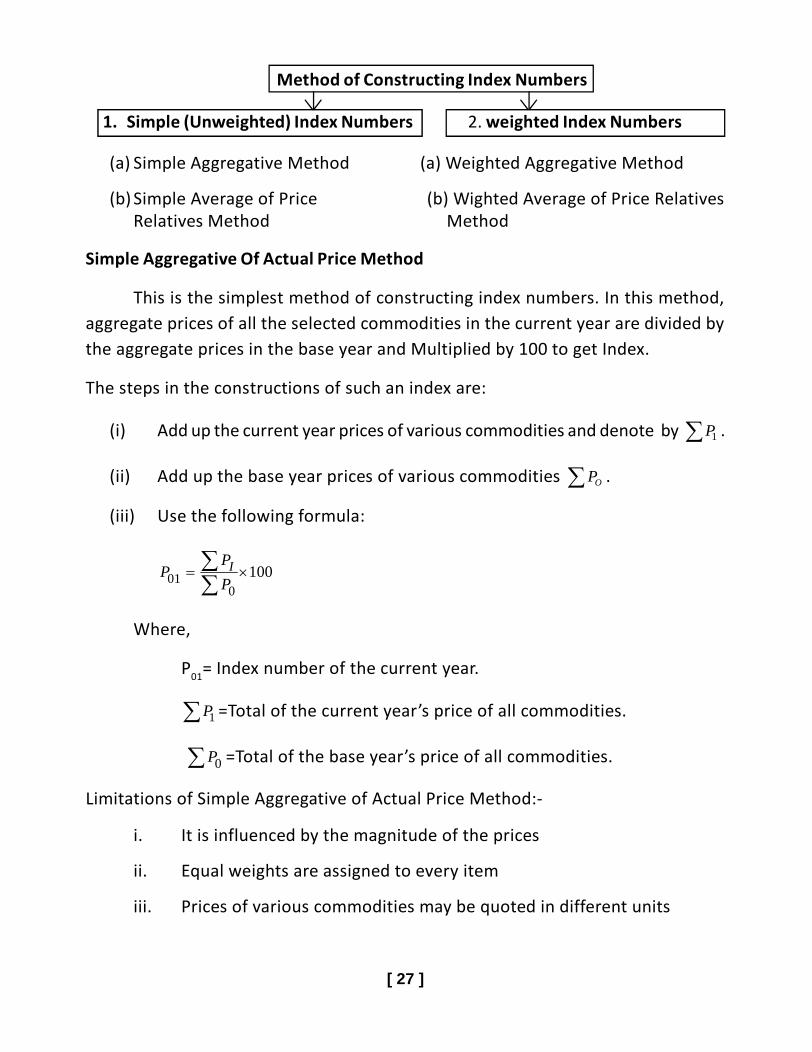
Method of Constructing Index Numbers
1. Simple (Unweighted) Index Numbers 2. weighted Index Numbers
(a) Simple Aggregative Method (a) Weighted Aggregative Method
(b) Simple Average of Price (b) Wighted Average of Price RelativesRelatives Method Method
Simple Aggregative Of Actual Price Method
This is the simplest method of constructing index numbers. In this method,aggregate prices of all the selected commodities in the current year are divided bythe aggregate prices in the base year and Multiplied by 100 to get Index.
The steps in the constructions of such an index are:
(i) Add up the current year prices of various commodities and denote by 1P .
(ii) Add up the base year prices of various commodities OP .
(iii) Use the following formula:
1000
01
P
PP I
Where,
P01= Index number of the current year.
1P =Total of the current year’s price of all commodities.
0P =Total of the base year’s price of all commodities.
Limitations of Simple Aggregative of Actual Price Method:-
i. It is influenced by the magnitude of the prices
ii. Equal weights are assigned to every item
iii. Prices of various commodities may be quoted in different units
[ 28 ]
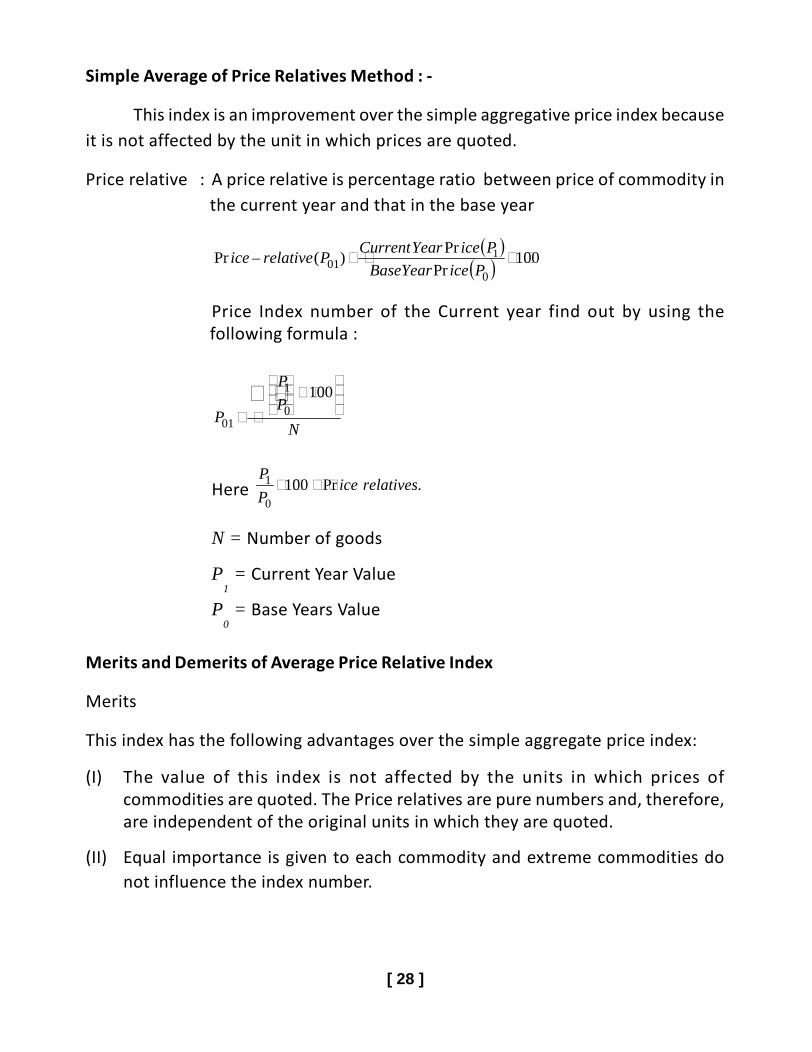
Simple Average of Price Relatives Method : -
This index is an improvement over the simple aggregative price index becauseit is not affected by the unit in which prices are quoted.
Price relative : A price relative is percentage ratio between price of commodity inthe current year and that in the base year
100
Pr
Pr)(–Pr
001
1 PiceBaseYear
PiceYearCurrentPrelativeice
Price Index number of the Current year find out by using thefollowing formula :
N
P
P
P
1000
1
01
Here .Pr1000
1 relativesiceP
P
N = Number of goods
P1 = Current Year Value
P0 = Base Years Value
Merits and Demerits of Average Price Relative Index
Merits
This index has the following advantages over the simple aggregate price index:
(I) The value of this index is not affected by the units in which prices ofcommodities are quoted. The Price relatives are pure numbers and, therefore,are independent of the original units in which they are quoted.
(II) Equal importance is given to each commodity and extreme commodities donot influence the index number.
[ 29 ]
Demerits
(i) As it is an unweighted index, each price relative is given equal importance.However, in actual practice, a few price relatives are more important thanothers.
(ii) Difficulty is faced with regard to the selection of an appropriate average.
WEIGHTED INDEX NUMBERS
Weighted index numbers can be constructed by two methods:
(i) Weighted Aggregative Method; and
(ii) Weighted Average of Price Relatives Method.
Weighted Aggregative Method
1. Laspeyre’s method
2. Paasche’s Method
3. Fisher’s Ideal Method
1. Laspeyre’s Method
Mr. Laspeyres in 1871 gave an weighted aggregated index, in which weights arerepresented by the quantities of the commodities in the base year. It helps inanswering the question that, if the expenditure in the base year on a basket ofcommodities was Rs.100, then, how much should be that expenditure in the currentperiod on the same basket of commodities.
Formula:
10000
0101
qP
qPP
Steps:
1. Multiply the current year prices (p1) by base year quantity weights (q0) and
total all such products to get 01qp .
2. Similarly , multiply the base year prices 0p by base year quantity weightss
0q and obtain the total to get 00qp .
3. Divided 01qp by 00qp and multiply the quotient by 100. This will bethe index number of the current year.
[ 30 ]
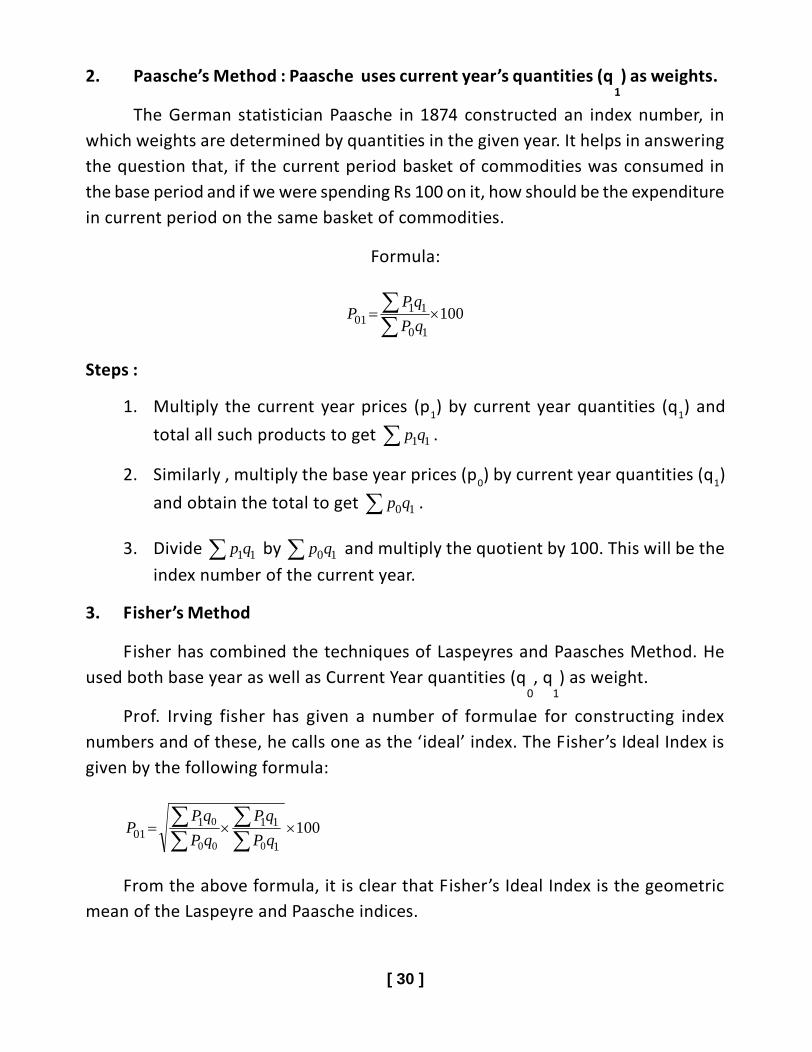
2. Paasche’s Method : Paasche uses current year’s quantities (q1) as weights.
The German statistician Paasche in 1874 constructed an index number, inwhich weights are determined by quantities in the given year. It helps in answeringthe question that, if the current period basket of commodities was consumed inthe base period and if we were spending Rs 100 on it, how should be the expenditurein current period on the same basket of commodities.
Formula:
10010
1101
qP
qPP
Steps :
1. Multiply the current year prices (p1) by current year quantities (q1) and
total all such products to get 11qp .
2. Similarly , multiply the base year prices (p0) by current year quantities (q1)
and obtain the total to get 10qp .
3. Divide 11qp by 10qp and multiply the quotient by 100. This will be theindex number of the current year.
3. Fisher’s Method
Fisher has combined the techniques of Laspeyres and Paasches Method. Heused both base year as well as Current Year quantities (q
0, q
1) as weight.
Prof. Irving fisher has given a number of formulae for constructing indexnumbers and of these, he calls one as the ‘ideal’ index. The Fisher’s Ideal Index isgiven by the following formula:
1001
11101
000
0
qP
qP
qP
qPP
From the above formula, it is clear that Fisher’s Ideal Index is the geometricmean of the Laspeyre and Paasche indices.
[ 31 ]
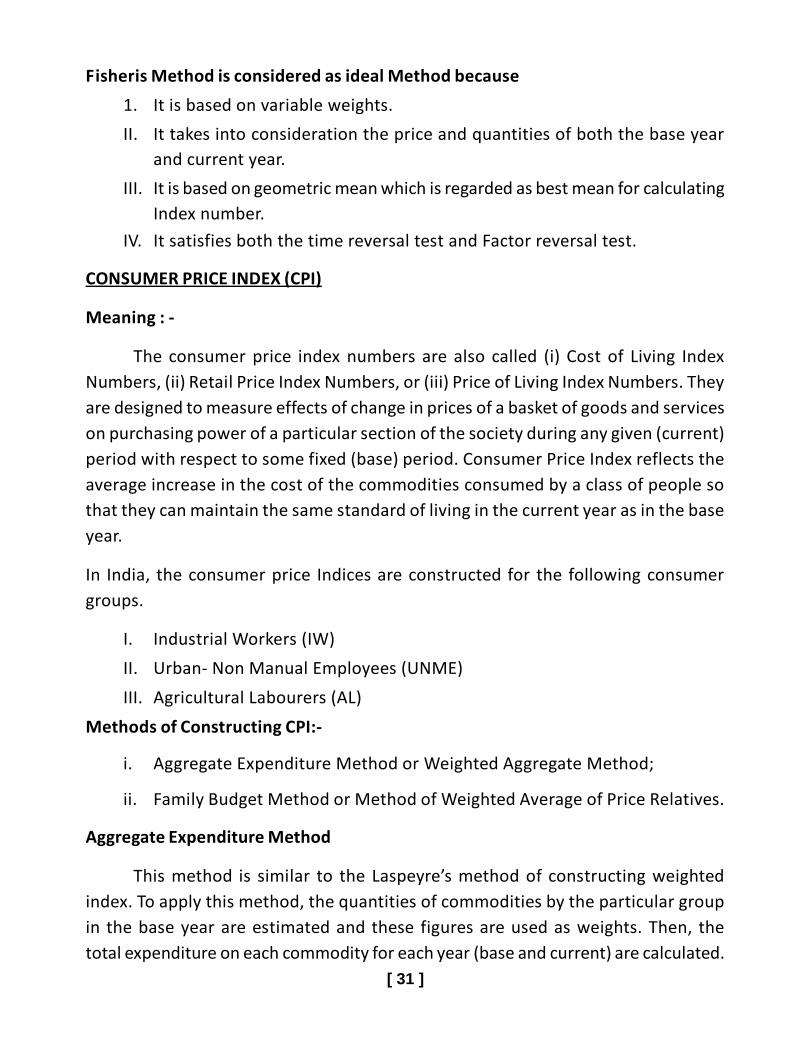
Fisheris Method is considered as ideal Method because
1. It is based on variable weights.
II. It takes into consideration the price and quantities of both the base yearand current year.
III. It is based on geometric mean which is regarded as best mean for calculatingIndex number.
IV. It satisfies both the time reversal test and Factor reversal test.
CONSUMER PRICE INDEX (CPI)
Meaning : -
The consumer price index numbers are also called (i) Cost of Living IndexNumbers, (ii) Retail Price Index Numbers, or (iii) Price of Living Index Numbers. Theyare designed to measure effects of change in prices of a basket of goods and serviceson purchasing power of a particular section of the society during any given (current)period with respect to some fixed (base) period. Consumer Price Index reflects theaverage increase in the cost of the commodities consumed by a class of people sothat they can maintain the same standard of living in the current year as in the baseyear.
In India, the consumer price Indices are constructed for the following consumergroups.
I. Industrial Workers (IW)
II. Urban- Non Manual Employees (UNME)
III. Agricultural Labourers (AL)
Methods of Constructing CPI:-
i. Aggregate Expenditure Method or Weighted Aggregate Method;
ii. Family Budget Method or Method of Weighted Average of Price Relatives.
Aggregate Expenditure Method
This method is similar to the Laspeyre’s method of constructing weightedindex. To apply this method, the quantities of commodities by the particular groupin the base year are estimated and these figures are used as weights. Then, thetotal expenditure on each commodity for each year (base and current) are calculated.
[ 32 ]
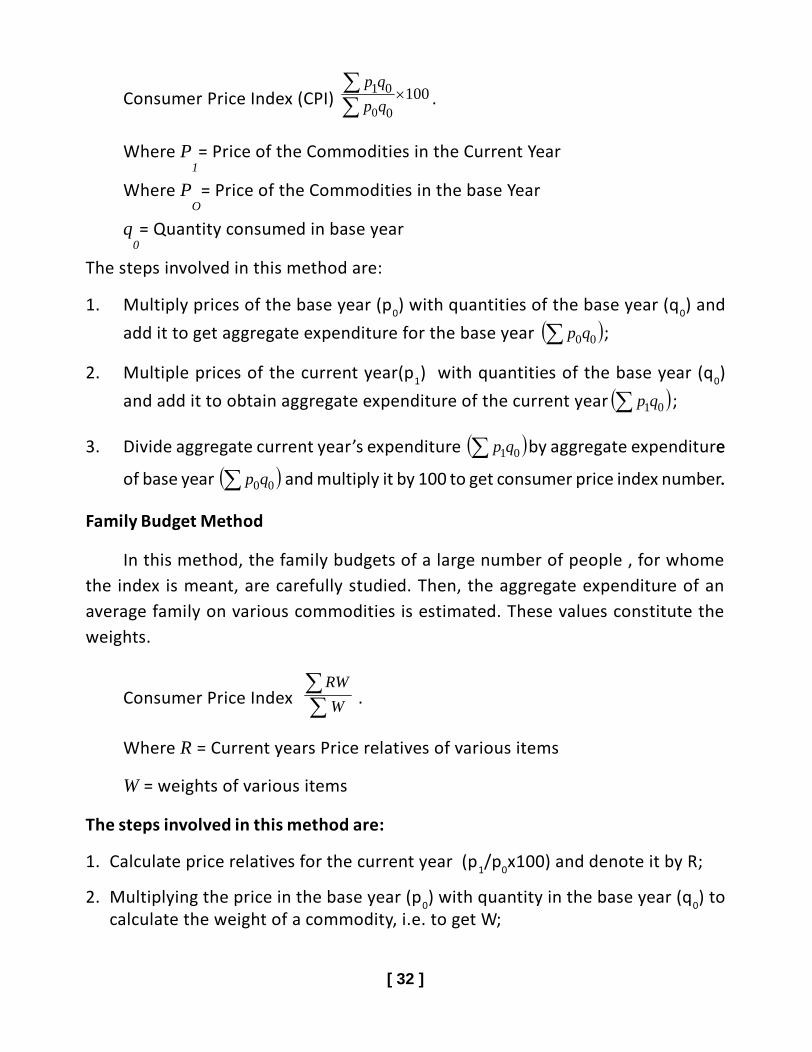
Consumer Price Index (CPI) 1000
01
0
qp
qp.
Where P1= Price of the Commodities in the Current Year
Where PO
= Price of the Commodities in the base Year
q0= Quantity consumed in base year
The steps involved in this method are:
1. Multiply prices of the base year (p0) with quantities of the base year (q0) and
add it to get aggregate expenditure for the base year 00qp ;
2. Multiple prices of the current year(p1) with quantities of the base year (q0)
and add it to obtain aggregate expenditure of the current year 01qp ;
3. Divide aggregate current year’s expenditure 01qp by aggregate expendituree
of base year 00qp and multiply it by 100 to get consumer price index number..
Family Budget Method
In this method, the family budgets of a large number of people , for whomethe index is meant, are carefully studied. Then, the aggregate expenditure of anaverage family on various commodities is estimated. These values constitute theweights.
Consumer Price Index
W
RW.
Where R = Current years Price relatives of various items
W = weights of various items
The steps involved in this method are:
1. Calculate price relatives for the current year (p1/p0x100) and denote it by R;
2. Multiplying the price in the base year (p0) with quantity in the base year (q0) tocalculate the weight of a commodity, i.e. to get W;
[ 33 ]
3. Multiply the price relatives (R) with weight (W) of each commodity and obtain
its total to get RW ;
4. Obtain the sum total of weights to get W ;
5. Apply the formula: Consumer Price Index =
W
RW
Uses of Consumer Price Index (CPI) Number
1. Consumer price index numbers helps in wage negotiations, formulation of wagepolicy, price policy, rent control, taxation and general economic policyformulation.
2. The government and business units use the consumer price index numbers toregulate the Dearness allowance (D.A.) or grant of bonus to the employees inorder to compensate them for increased cost of living due to price rise.
3. The CPI are used to measure purchasing power of the consumer in rupees. Thepurchasing power of the rupee is the value of a given year as compared to a baseyear. The formula for calculating the purchasing power of the rupee is:
Purchasing Power=1/ Consumer Price Index X 100
It indicates that money purchasing power is the reciprocal of the price index.Accordingly, if the consumer price index for a given year is 140, then purchasingpower of a rupee is 1/ 140 x 100 = 0.71. That is, the purchasing power of a rupeein given year is 71 paisa as compared to the base year.
4. With the increase in prices, the amount of goods and services which money wagescan buy (or the real wages) goes on decreasing. Index numbers tell us the changein real wages. Real wages can also be determined, in the following manner:
Real Wages = Money Wages/Consumer Price Index X 100
5. Consumer Price index numbers are also used for analyzing markets for particularkinds of goods and services.
INDEX OF INDUSTRIAL PRODUCTION
Index numbers of industrial production have become fairly common thesedays. The index number of industrial production measure change in the level ofindustrial production comprising many industries.

[ 34 ]
Index Number of Industrial Production = 1000
1
W
Wq
q
Where,q1 = Level of production in the current year
q0 = Level of production in the base year
w = Weight or relative importance of industrial output
USES OF INDEX NUMBERS:-1. Helps in Policy Formulation2. Index numbers act as Economic Barometers3. Help in studying trends and forecasting demand and supply4. To measure and compare changes5. Index numbers help to measure purchasing power6. Index numbers help in deflating various values
7. Indicator of rate of Inflation.
LIMITATIONS OF INDEX NUMBERS : -1. Provides relative changes only2. Lack of Perfect Accuracy3. Difference between purpose and method of construction4. Ignores qualitative changes5. Manipulations are possible
WHOLESALE PRICE INDEX NUMBERS: (WPI) -
Wholesale price index numbers are those price index numbers which measurethe general changes in the wholesale prices of goods in a country.
Groups of Commodities for Wholesale Price Index (WPI):-1. Primary Articles : Ex : Rice, Fruits, Pukes, vegetables and non - food articles
like cotton, Jute.2. Energy Articles : Ex. : LPG, Electricity, Petroleum of Coal.3. Manufactured Articles : Ex. : Textiles, Sugar, Paper Machinery & Chemicals.
Utility of Wholesale Price Index Number:-1. Indicator of Inflaction2. Forecasting Demand and Supply3. Helps in determining real changes in aggregates4. Useful in Cost Evaluation of various projects
[ 35 ]
INFLATION AND INDEX NUMBERS:-
Inflation is described as a situation characterized by a sustained increase inthe general price level over a period of time.
Index Number of Agricultural Production:-
It is a weighted average of quantity relatives. It provides a ready reckoner ofthe performance of agricultural sector. Its base period is the triennium ending 1981-82. In 2003-02, the index number of agricultural production was 179.5. It meansthat agricultural production has increased by 79.5 percent over the average of thethree years 1979-80, 1980-81 and 1981-82.
Sensex:-
The sensex, short from of the Bombay stock Exchange (BSE)- Sensitive Index,is a market capitalization weighted index of 30 stocks, representing a sample oflarge, well established and financially sound companies. It is the oldest index inIndia and has acquired a unique place in the collective consciousness of investors.The index is widely used to measure the performance of the Indian stock markets.Sensex is considered to be the pulse of the Indian stock markets. The base value ofthe Sensex is 100 on April 1, 1979, and the base year of BSE-Sensex is 1978-79.Sensex is a useful guide for investors in the stock market. If the sensex rises, itindicates that the market is doing well and investors are optimistic of the futureperformance of the economy.
Human Development Index:-
The Human Development Index (HD) is an combining normalized measuresof life expectancy, literacy, educational attainment, and GDP per capita for countriesworldwide. It is claimed as a standard means of measuring human development.The basic use of HDI is to rank countries by level of ‘human development’, whichaims to determine whether a country is a developed, developing, or underdevelopedcountry.
Producer Price Index:-
Producer Price Index measures the average change of the selling prices ofproducers who sell goods. To compute this index, the mean of all changes over ayear is usually taken. It measures the price changes according to the producer’sperspective. It concentrates on the area of industry based production and stage ofprocessing based companies.
[ 36 ]
Some selected questions:-
Short Answer type Questions (3-4 Marks each): -
1. What are the desirable properties of the base period?
2. Why is it essential to have different CPI for different categories of consumers?
3. Discuss the limitations of simple aggregative of actual price method.
4. Discuss the merits and demerits of average price relative index.
5. Mention the steps involved for calculating index number by Laspeyre’sMethod.
6. Why Fisher’s method is considered to be an ideal method?
7. Mention the difficulties in construction of consumer price index.
8. Write a short note on index of industrial production.
9. Explain clearly the classification of commodities in the formation of wholesaleprice index.
10.Write a short note on inflation and index Numbers.
Very Short Answer type Questions (1 Mark each):-
1. Define index number.
2. State any one feature of index numbers.
3. Define base period.
4. What are three types of index numbers?
5. What is the difference between a price index and quantity index?
6. State any one limitation of index number?
7. Mention the types of price index numbers?
8. What is the difference between unweighted and weighted index numbers?
9. What is meant by price relative?
10. What does a Consumer price index for industrial workers measure?
11. Whether change in price is reflected by price index number?
12. State any one use of index number.
13. Mention one problem in constructing index numbers.
14. What does consumer price index number reflect ?

[ 37 ]
Long Answer Questions :
1. Construct cost of living Index on the basis of the following data
Items Price Weights
Wheat 241 10
Rice 150 4
Pulses 170 2
Oil 125 2
Milk 40 2
2. Construct Price Index Number of the following data by using.
(i) Laspeyre’s Method
(ii) Poasche’s Method
(iii) Fisher’s Method
Items Base Year Current Year
Quantity Price Quantity Price
A 3 5 2 8
B 7 4 5 6
C 4 7 3 10
D 6 6 5 7
3. Construct cost of living Index for 2006 based on 2011 from the following data.
Group Food Housing Clothing Food & Light Miscellaneous
Group Index No.of 2011 (basedon 2006) 122 140 112 116 106
Weights 32 10 10 6 42