Embed Size (px)
Citation preview
UNRESTRICTED
Study into Spectrally Efficient Radar Systems in the L and S Bands Ofcom Spectral Efficiency Scheme 2004 - 2005 (SES-2004-2)
May 2006 Ofcom contract No. 410000259 SP-A21524-18304-RPT Issue 001
Copyright © BAE SYSTEMS [2006]. All rights reserved. Permission is hereby granted for the reproduction or [translation] in whole or in part of this document provided that a full acknowledgement to BAE SYSTEMS is given and the copyright notice above and this notice is reproduced. This report was commissioned by Ofcom to provide an independent view on issues relevant to its duties as regulator for the UK communication industry, for example issues of future technology or efficient use of the radio spectrum in the United Kingdom. The assumptions, conclusions and recommendations expressed in this report are entirely those of the contractors and should not be attributed to Ofcom.
BAE Systems Integrated System Technologies Limited Registered No: 3456325 Registered Office: Warwick House, Farnborough Aerospace Centre, Farnborough, Hampshire, GU14 6YU England
UNRESTRICTED
BAE Systems Integrated System Technologies Limited, Eastwood House, Glebe Road, Chelmsford, Essex CM1 1QW Tel: +44 (0) 1245 702702, Fax: +44 (0) 1245 702700

UNRESTRICTED
Study into Spectrally Efficient Radar Systems in the L and S Bands ii Ofcom Spectral Efficiency Scheme 2004 - 2005 (SES-2004-2)
This page is intentionally left blank.
UNRESTRICTED Use, duplication or disclosure of data contained on this sheet is subject to the restrictions on the title page of this document
UNRESTRICTED
Study into Spectrally Efficient Radar Systems in the L and S BandsOfcom Spectral Efficiency Scheme 2004 - 2005 (SES-2004-2) iii
Approvals
Role Name Organisation Principal Author Dr. C. A. Jackson BAE Systems Integrated System Technologies.
Eastwood House, Chelmsford, Essex, CM1 1QW e-mail: [email protected] Tel: +44 1245 703525
Co- Authors Mr. R. Pollard Mr. R. Larsen Mr. C. Sarno
BAE Systems Advanced Technology Centre, Great Baddow
Prof. C. Baker Dr. K. Woodbridge
University College London, Department of Electronic & Electrical Engineering
Prof. R.F. Ormondroyd Mr. M. B. Lewis
Cranfield University, Defence College of Management and Technology
Dr. A. G. Stove Thales Air Systems UK
Document Version History
Issue Date Superseded documents/description/details 01 May 2006 02 July 2006 Modified front cover statements, modified Executive Summary
and fixes of small number of typographical errors.
UNRESTRICTED Use, duplication or disclosure of data contained on this sheet is subject to the restrictions on the title page of this document

UNRESTRICTED
Study into Spectrally Efficient Radar Systems in the L and S Bands iv Ofcom Spectral Efficiency Scheme 2004 - 2005 (SES-2004-2)
This page is intentionally left blank.
UNRESTRICTED Use, duplication or disclosure of data contained on this sheet is subject to the restrictions on the title page of this document

UNRESTRICTED
Study into Spectrally Efficient Radar Systems in the L and S BandsOfcom Spectral Efficiency Scheme 2004 - 2005 (SES-2004-2) v
Contents
1 Executive Summary 1 1.1 Re-locate radar to a different frequency band (SHIFT) 1 1.2 Improve the spectral efficiency of radar (SQUASH) 1 1.2.1 Pulsed radar 1 1.2.2 Continuous Wave (CW) radar 2 1.2.3 Passive radar 2 1.3 Share the spectrum with other users (SHARE) 2 1.4 Economics and development timescales 2
2 Consortium background 5 2.1 BAE Systems, Integrated System Technologies 6 2.2 BAE Systems, ATC Baddow 6 2.3 Cranfield University, Defence College of Management and Technology 6 2.4 University College London 7 2.5 THALES Air Systems U.K. 7
3 Study overview 9 3.1 Re-locate radar to a different frequency band in lower demand (SHIFT) 10 3.2 Improve the spectral efficiency of radar (SQUASH) and re-plan their
allocations to take advantage of this 10 3.2.1 Changes and improvements to current and developing pulsed radar
technology 11 3.2.2 Entire system concept changes 11 3.3 Share the spectrum with other users (SHARE) 11 3.4 Economics and development timescales 12
4 Detailed Work Packages 13 4.1 A review of the spectrum utilised by radar in the L & S bands and
recommendations on which (if any) could be moved to lightly-used higher frequency bands 13
4.1.1 Spectrum review 13 4.1.2 Radar system aspects at higher frequencies 16 4.1.3 Summary 28 4.2 Assessment of the economies of introducing new spectrally efficient radar
technologies 31 4.2.1 Alternative spectrum management and valuation methodologies 31 4.2.2 The predicted costs of putting new technologies into a band 37 4.2.3 Economic and programmatic considerations 42 4.2.4 Conclusions 43 4.3 A study into the practical problems of generating high power coded
waveforms using travelling wave tube or alternative devices 45 4.3.1 Review of existing transmitter techniques and their applicability to coded
waveforms 46 4.3.2 Review of basic performance limitation of current power devices 58
UNRESTRICTED Use, duplication or disclosure of data contained on this sheet is subject to the restrictions on the title page of this document

UNRESTRICTED
Study into Spectrally Efficient Radar Systems in the L and S Bands vi Ofcom Spectral Efficiency Scheme 2004 - 2005 (SES-2004-2)
4.3.3 Review of proposed new techniques and their applicability to practical radar systems 75
4.3.4 Study into the practical application of potentially productive approaches identified 83
4.3.5 Conclusions and recommendations 111 4.4 A review of the degree to which frequency and time agile applications can
co-exist with radar in the same band without causing interference and the effect of secondary users 115
4.4.1 Introduction 115 4.4.2 Methods of spectrum sharing 117 4.4.3 Application of bandsharing methods to L and S band radars 133 4.4.4 Summary 139 4.5 Identification of boundary field strengths that could be realistically set as
part of radar licences that would encourage development of a spectrum market in radar bands 142
4.5.1 Analysis of radar boundary field strengths 142 4.5.2 Implications of boundary field-strength definitions for a spectrum market 146 4.6 Analysis of deliberate or accidental jamming of CW radar systems and
methods for avoidance 151 4.6.1 An investigation of accidental interference including that due to co-
channel, adjacent channel and out of band signals 151 4.6.2 Demonstration of effects of interference and ways to counter them 159 4.6.3 Methods of interference mitigation 168 4.6.4 Conclusions 172 4.7 Analysis of the deployment of a multi-static CW radar system for Air Traffic
Control 175 4.7.1 Multi-static transmitter/receiver location 175 4.7.2 Separation by Doppler shift only 178 4.7.3 Separation by Doppler shift and directional antennas 188 4.7.4 Conclusions 193 4.8 Range information from reduced bandwidth radar 195 4.8.1 Achieving radar range resolution 195 4.8.2 Modelling the echo Signal 201 4.8.3 Adaptation of MUSIC range superresolution to pulsed radar 208 4.8.4 Adaptation of MUSIC to FMCW radar 219 4.8.5 Conclusions and recommendations 228 4.9 Review of passive sensor systems potential 231 4.9.1 Background 231 4.9.2 Review of potential signals 232 4.9.3 Passive radar 236 4.9.4 Passive radar sensor performance 240 4.9.5 Summary 246
5 Conclusions and recommendations 247 5.1 Recommendations 249
UNRESTRICTED Use, duplication or disclosure of data contained on this sheet is subject to the restrictions on the title page of this document
UNRESTRICTED
Study into Spectrally Efficient Radar Systems in the L and S BandsOfcom Spectral Efficiency Scheme 2004 - 2005 (SES-2004-2) vii
6 References 251
Annex A Angle of Arrival Estimation Methods A-1 A.1 Introduction A-1 A.2 Signal Model A-1 A.3 Fourier-based methods A-2 A.4 Spatial Correlation A-9 A.4.1 Comment on using multiple snapshots – effect of signal bandwidth A-11 A.5 Minimum Variance Method A-11 A.6 Super-resolution methods based on Eigen-decomposition A-14 A.6.1 Pisarenko’s method A-16 A.6.2 MUltiple SIgnal Classifier (MUSIC) A-18 A.6.3 Minimum Norm Method A-24 A.6.4 ESPRIT A-25 A.7 Cramer-Rao Lower Bound A-29 A.7.1 Comparison of the AOA Methods in Gaussian Noise A-30 A.8 Conclusions A-31
Annex B Methods of Emitter Geolocation B-1 B.1 Introduction B-1 B.2 Effect of measurement errors on geolocation accuracy B-3 B.2.1 Comment on the Assessment of Altitude using multi-static CW radar B-8 B.2.2 AOA/TOA Target geolocation B-8 B.3 Improved AoA Target Location using Position Estimators B-10 B.3.1 Non-linear Estimators B-18 B.3.2 Use of non-linear maximum-likelihood estimator for triangulation B-18 B.3.3 2D Target Geolocation using of FOA data B-21 B.3.4 2D Target Geolocation using TDOA data B-23 B.3.5 Combined estimator B-25 B.4 Conclusions B-27
List of Figures
Figure 1.4-1 Timescales of likely radar procurement and technology availability in the UK 3
Figure 3-2.5-1 Work package mapping 10 Figure 4.1-1 : Estimated required peak RF output power 22 Figure 4.1-2 : Estimated Peak field strength at 1km 24 Figure 4.1-3 : Estimated mean power levels at 100m 25 Figure 4.1-4 : Estimated Peak Field strength at 1km 26 Figure 4.1-5 : Estimated Peak Field strength at 500m 27 Figure 4.1-6 : Estimated Peak Field strength at 100m 28 Figure 4.2-1 : Timescales of likely radar procurement and technology availability
in the UK 43 Figure 4.3-1 : Diagram showing the construction of a conventional magnetron 49Figure 4.3-2 : Spectrum Signature of Conventional Magnetron (200MHz/DIV,
10dB/DIV,Centre Frequency 2.84GHz) 51
UNRESTRICTED Use, duplication or disclosure of data contained on this sheet is subject to the restrictions on the title page of this document
UNRESTRICTED
Study into Spectrally Efficient Radar Systems in the L and S Bands viii Ofcom Spectral Efficiency Scheme 2004 - 2005 (SES-2004-2)
Figure 4.3-3 : Spectrum Signature of Coaxial Magnetron (200MHz/DIV, 10dB/DIV, Centre Frequency 2.8GHz) 51
Figure 4.3-4 : Simple representation of a CFA, (a) linear format and (b) circular format. 52
Figure 4.3-5 : Diagram of the principle parts of a three-cavity klystron amplifier. 53Figure 4.3-6 : Diagram of the principle parts of a TWT. 54 Figure 4.3-7 : Output power against frequency for TMD travelling wave tube used
in the Watchman radar for different drive levels. 59 Figure 4.3-8 : The effect of passing a shaped pulse through a saturated
transmitter stage: a) Shaped pulse with cosine shaped edges, b) distorted pulse with more rectangular edges. 60
Figure 4.3-9 : Generic diagram of TWT power supplies and control circuitry. 61Figure 4.3-10 : Diagram showing a typical solid-state RF power module. 62Figure 4.3-11 : Typical values of output power as a function of input power for a
Class C Phillips BLS2731-50 S-band silicon bipolar microwave transistor currently available for radar applications. Note that the linear region only exists for a small range if input powers. Note also that the device does not operate at all until a threshold input power is applied. 63
Figure 4.3-12 : Experimental set up to measure phase and amplitude performance across the band 66
Figure 4.3-13 : Transmit power variation across the band 2.7 – 3GHz 67 Figure 4.3-14 : Phase change variation across the band 2.7 – 3GHz 67 Figure 4.3-15 : Test equipment setup 69 Figure 4.3-16 : 1.0MHz LFM chirp measured on oscilloscope 69 Figure 4.3-17 : Leading edge of the transmitter pulse output 70 Figure 4.3-18 : Theoretical, Signal Generator and Transmitted spectra for 80µs
LFM pulse 71 Figure 4.3-19 : 1.0MHz Measured LFM pulse spectra of various pulse lengths at
2.825GHz 71 Figure 4.3-20 : Measured Transmitted spectra for 80µs LFM pulses at various
centre frequencies 72 Figure 4.3-21 : Measured spectrum of a dual frequency diversity TWT based ATC
system [1]. 74 Figure 4.3-22 : Measured spectrum (Lower two frequencies) of S band civil ATC
radar using various measurement bandwidths (RBw) [1]. 74 Figure 4.3-23 : Linear Freqeuncy modulated pulse (LFM Chirp) 76 Figure 4.3-24 : Compressed LFM pulse with sidelobes 77 Figure 4.3-25 : Nonlinear Freqeuncy modulated pulse (NLFM Chirp) with 40dB
Taylor weighting 78 Figure 4.3-26 : Compressed NLFM pulse with reduced range sidelobes 78 Figure 4.3-27 : Theoretical spectrum of 0.4µs plain pulse with 35ns rise&fall time. 84Figure 4.3-28 : Theoretical spectrum of 20µs NLFM 2.5MHz pulse with 35ns
rise&fall time. 85 Figure 4.3-29 : Theoretical spectrum of 1µs plain pulse with 35ns rise&fall time. 85Figure 4.3-30 : Theoretical spectrum of 20µs NLFM 1.0MHz pulse with 35ns
rise&fall time. 86 Figure 4.3-31 : Theoretical spectral envelopes of the current and proposed
Watchman pulse waveforms 87
UNRESTRICTED Use, duplication or disclosure of data contained on this sheet is subject to the restrictions on the title page of this document

UNRESTRICTED
Study into Spectrally Efficient Radar Systems in the L and S BandsOfcom Spectral Efficiency Scheme 2004 - 2005 (SES-2004-2) ix
Figure 4.3-32 : Upper panel - Peak signal level from a neighbouring radar (Black line) and Protection level (red line). Lower panel - Additional required isolation to reduce signal below the protection level 89
Figure 4.3-33 : Required frequency separation vs. Range for the Watchman 0.4µs pulse 90
Figure 4.3-34 : Required frequency separation vs. Range separation for current and proposed Watchman waveforms. 91
Figure 4.3-35 : One sided theoretical spectra for various transmitted waveforms 93Figure 4.3-36 : Required frequency separation vs radar separation for various
waveforms and transmitter types 94 Figure 4.3-37 : a) Local feedback for PA linearization, b) open loop dynamic bias
implementation for PA linearization. 97 Figure 4.3-38 : a) Open-loop RF pre-distortion before PA, b) Closed-loop pre-
distortion scheme. 98 Figure 4.3-39 : Adaptive feed forward system. 98 Figure 4.3-40 : Measured transfer curve for a test sample Philips BLS2731-100
LDMOS transistor. 100W device run at 32V, 200us pulse and 10% duty. 103
Figure 4.3-41 : Measured transfer curve for a Philips 300YK Silicon bipolar transistor. 300W device run at 48V, 250us pulse and 10% duty. 103
Figure 4.3-42 : Transfer curve from datasheet for a Philips BLL1214-250 LDMOS transistor. 250W device run at 36V, 100us pulse and 10% duty. Note: curves, (1) f=1.2GHz, (2) f=1.3GHz, (3)f=1.4GHz. 104
Figure 4.3-43 : Theoretical spectra for 100µs (trapezoidal) pulse with various rise / fall times 105
Figure 4.3-44 : Required separations for 100µs (trapezoidal) pulse with various rise / fall times 106
Figure 4.3-45 : Theoretical spectra for 100µs (cosine edge and gaussian) pulse with various rise / fall times 107
Figure 4.3-46 : Required separations for 100µs (cosine edge and gaussian) pulse with various rise / fall times 108
Figure 4.4-1 : Schematic of the underlay approach to bandsharing 118 Figure 4.4-2 : Simplified schematic of a bandsharing scenario using underlay 123Figure 4.4-3 : Interference model of underlay bandsharing taken from FCC ET
Docket 03-237 124 Figure 4.4-4 : Schematic of the underlay approach to bandsharing highlighting the
need for different levels of interference temperature cap to protect vulnerable or high priority primary users via an interference mask. 125
Figure 4.4-5 : Schematic of the overlay concept of bandsharing 127 Figure 4.4-6 : Schematic of dynamic spectrum allocation technique showing
intelligent exploitation of time and frequency plane 128 Figure 4.4-7 : Schematic of an interleaved bandsharing system using
heteromorphic waveforms 131 Figure 4.4-8 : Use of adaptive antennas to reduce mutual interference 133 Figure 4.6-1 : Self Interference model 152 Figure 4.6-2 : Target to interferer power ratio vs. target range for 1km Tx – Rx
separation 154 Figure 4.6-3 : Target power to interference ratio as a function of increasing
transmitter – receiver distance 155 Figure 4.6-4 : Bistatic interference geometry 156
UNRESTRICTED Use, duplication or disclosure of data contained on this sheet is subject to the restrictions on the title page of this document
UNRESTRICTED
Study into Spectrally Efficient Radar Systems in the L and S Bands x Ofcom Spectral Efficiency Scheme 2004 - 2005 (SES-2004-2)
Figure 4.6-5 : Effect of a 500W barrage jammer on radar maximum detection range for a 100m2 target 158
Figure 4.6-6 : Target to interferer power ratio for increasing numbers of WLAN users at different EIRP 159
Figure 4.6-7 : Block Diagram of Demonstration Hardware 160 Figure 4.6-8 : Block Diagram of Demonstration Software 160 Figure 4.6-9 : Circuit to Add interference to Test Signal 162 Figure 4.6-10 : The Radar Display 165 Figure 4.6-11 : Features Seen on the Display 165 Figure 4.6-12 : Interference fence 169 Figure 4.6-13 : Beam pattern for a 12 element array after applying the Hamming
window 170 Figure 4.6-14 : Beam Pattern for a 12 element Array with an imposed null at -20°
controlled by both amplitude and phase 172 Figure 4.7-1 : Position of Multistatic Radar System 176 Figure 4.7-2 : Contour Patterns on receiver configurations (modeled on Heathrow
Airport). 177 Figure 4.7-3 : Transmitter at Centre of Cartesitan coordination 178 Figure 4.7-4 : Flight Path and Doppler Spaces 180 Figure 4.7-5 : Circular Flight Paths 186 Figure 4.7-6 : High-performance jets: speed > 300 m/sec 190 Figure 4.7-7 : Passenger jets: speed 150 – 300 m/sec 190 Figure 4.7-8 : Passenger jets landing: speed 80 – 150 m/sec, roll up to 30 º 191Figure 4.7-9 : Cessna-type aircraft: speed 50 to 80 m/sec, roll up to 40 º 191 Figure 4.7-10 : Helicopters: speed ± 30 m/sec, roll up to 40º 192 Figure 4.8-1 : Relationship between range resolution and bandwidth 196 Figure 4.8-2 197 Figure 4.8-3 : Range resolution using normal and superresolution techniques 198Figure 4.8-4 202 Figure 4.8-5 203 Figure 4.8-6 204 Figure 4.8-7 204 Figure 4.8-8 205 Figure 4.8-9 : Scattering model of a Boeing 727 206 Figure 4.8-10 : Range profile of a Boeing 727 207 Figure 4.8-11 207 Figure 4.8-12 : Comparison of MUSIC spectrum (upper panel) and FFT power
spectrum (lower panel) 211 Figure 4.8-13 212 Figure 4.8-14 213 Figure 4.8-15 214 Figure 4.8-16 : Comparison of resolution performance of MUSIC vs standard FFT
method at 15dB SNR 214 Figure 4.8-17 215 Figure 4.8-18 216 Figure 4.8-19 217 Figure 4.8-20 218 Figure 4.8-21 218 Figure 4.8-22 220 Figure 4.8-23 222
UNRESTRICTED Use, duplication or disclosure of data contained on this sheet is subject to the restrictions on the title page of this document
UNRESTRICTED
Study into Spectrally Efficient Radar Systems in the L and S BandsOfcom Spectral Efficiency Scheme 2004 - 2005 (SES-2004-2) xi
Figure 4.8-24 224 Figure 4.8-25 225 Figure 4.8-26 226 Figure 4.8-27 227 Figure 4.8-28 227 Figure 4.9-1 Passive Radar Concepts 231 Figure 4.9-2 : Transmit antenna vertical power patterns 233 Figure 4.9-3 : Aircraft elevation variation with ground range 234 Figure 4.9-4 : Bistatic Geometry 235 Figure 4.9-5 : Direct versus Indirect signal strength - 10m2 target RCS 235 Figure 4.9-6 : Direct versus Indirect signal strength - 100m2 target RCS 236 Figure 4.9-7 : Multistatic & Forward scatter radar 237 Figure 4.9-8 : TDOA ellipses 239 Figure 4.9-9 : Estimated Passive Radar, DAB Coverage for Heathrow 241 Figure A-1 : Geometry used for the uniform linear array A-2 Figure A-2 : Steered response of an a linear array to a far field source at 25°
using FFT method A-6 Figure A-3 : Steered response of ULA for two far field sources at 25° and 35°
using FFT method A-6 Figure A-4 : Use of the Dolph-Chebychev taper to help resolve the two far-field
sources at 25° and 35°, which were not resolvable with the untapered 8 element ULA shown in figure A.3a A-7
Figure A-5 : Impact of a 10dB SNR on the steered response of the 8 element ULA to a single source at 25° (a) raw snapshots (b) averaged periodogram response after averaging 100 snapshots A-8
Figure A-6 : Effect of SNR on the distribution of the measured angle of arrivals for the FFT method A-9
Figure A-7 : Equivalent steered response of an 8 element array to a single source at 25° using the minimum variance method at an SNR=0dB (500 snapshot averaging) A-12
Figure A-8 : Steered response of an 8 element array using the minimum variance method for signal sources at -35°, 25° and 40° at an SNR=0dB per signal source (500 snapshot averaging) A-13
Figure A-9 : Steered response of a 32 element array using the minimum variance method for signal sources at -35°, 25° and 29° at an SNR=0dB per signal source (500 snapshot averaging) A-13
Figure A-10 : Effect of amount of averaging to produce R̂ on the steered response for sources at -35°, 25° and 40° (for the case of coherent sources) A-14
Figure A-11 : Pisarenko’s method used to obtain the AOA of a single source at an AOA=25°. The SNR of the received signal is 0dB but 500 snapshots are used to form R̂ A-17
Figure A-12 : Histogram of the AOA estimate for 2000 trials using Pisarenko’s method for SNR=0dB and the use of 500 signal snapshots to form the correlation matrix A-18
Figure A-13 : AOA estimation of a single source at 25° using the MUSIC algorithm A-19
Figure A-14 : Histogram of the AOA estimate for 2000 trials using the MUSIC method for SNR=0dB and the use of 500 signal snapshots to form the correlation matrix A-20
UNRESTRICTED Use, duplication or disclosure of data contained on this sheet is subject to the restrictions on the title page of this document

UNRESTRICTED
Study into Spectrally Efficient Radar Systems in the L and S Bands xii Ofcom Spectral Efficiency Scheme 2004 - 2005 (SES-2004-2)
Figure A-15 : AOA estimation of three non-coherent sources at -35°, 25° and 30° using the MUSIC algorithm A-21
Figure A-16 : Effect of making the wrong assumption regarding the number of signal sources. In this case, the actual number of sources was three at -35°, 25° and 30°. A-21
Figure A-17 : Steered response of (a) 8 and (b) 32 element array using the MUSIC algorithm when the sources are coherent. Source are at -35°, 25° and 30°. SNR = 0dB per source A-22
Figure A-18 : Use of sub-arrays to reduce the effect of coherent signals on the MUSIC algorithm A-24
Figure A-19 : AOA estimation of three non-coherent sources at -35°, 25° and 30° using the minimum-norm algorithm A-25
Figure A-20 : Histogram of the AOA estimate for 2000 trials using the minimum-norm method for SNR=0dB and the use of 500 signal snapshots to form the correlation matrix A-25
Figure A-21 : Comparison of the RMSE performance of the various AOA estimation methods in AWGN A-30
Figure B-1 : Concept of multistatic radar using single signal source B-1 Figure B-2 : Geolocation with three lines of bearing B-3 Figure B-3 : Contour plot showing the pdf of the target at different positions within
a 5km x 5km area for bearings-only geolocation. The radar receivers are located at (0,0) and (0,5km) B-7
Figure B-4 : Zoomed-in view of a particular target position showing the bias that occurs due to the non-linearity of the triangulation equations B-8
Figure B-5 : Contour plot showing the pdf of the target at different positions within a 5km x 5km area for range/AOA geolocation. The radar receiver is located at (0,0). B-9
Figure B-6 : Four Tikhonov distributions for different values of concentration, v B-15Figure B-7 : Geolocation scenario where three receivers have no bias error and
the fourth B-16 Figure B-8 : Tikhonov distribution functions for each AoA measurement B-17 Figure B-9 : Tikhonov distribution after combining individual dstributions B-18
List of Tables
Table 4.1-1 17 Table 4.1-2 : Attenuation coefficients (2-way) for radar bands 19 Table 4.1-3 : HIRF Certification Field Strengths 26 Table 4.2-1 : Productive inefficiency 36 Table 4.2-2 : Marginal values after reallocation 36 Table 4.2-3 : Typical development and production prices of spectrally efficient
radar technology 39 Table 4.2-4 : Costs and development times for Receiver and SPU modifications 39Table 4.2-5 : Costs and development times for transmitter based upgrade 41Table 4.2-6 : Costs and development times to design new ATC pulsed radar
using conventional technology in an alternative band 41 Table 4.3-1 : Various pushing figures for a Watchman TWT tube. 60 Table 4.3-2 : Table of measured LFM pulse spectra 68 Table 4.3-3 : Two sided spectral spreads in MHz at the various roll off points 86
UNRESTRICTED Use, duplication or disclosure of data contained on this sheet is subject to the restrictions on the title page of this document

UNRESTRICTED
Study into Spectrally Efficient Radar Systems in the L and S BandsOfcom Spectral Efficiency Scheme 2004 - 2005 (SES-2004-2) xiii
Table 4.3-4 : Required spectral separations for 0.4µs and 1.0µs Watchman pulses 91
Table 4.3-5 : Example transmitted waveform parameters for TWT and SS based radar system 92
Table 4.3-6 : Required spectral separations for 1.0µs TWT and Solid State pulses 95Table 4.3-7 : Spectral widths for 100µs (trapezoidal) pulse with various rise / fall
times 105 Table 4.3-8 : Spectrum parameters for 100µs cosine edge and Gaussian pulses 107Table 4.3-9 : Required spectral separations for 100µs class-C and linear
transmitted pulses 109 Table 4.3-10 : Required spectral separations for 1µs class-C and linear
transmitted pulses 110 Table 4.5-1 : Clear air attenuation, α (dB/km) 143 Table 4.5-2 : Radar Parameters 145 Table 4.5-3 : Permissible Transmitter ERP density (dBW/km2) 145 Table 4.5-4 : Number of permissible transmitters per km2 for different minimum
radar ranges of interest 145 Table 4.6-1 155 Table 4.6-2 : Effect of various amplitude windows on main beam and sidelobe
performance 170 Table 4.7-1 : Prediction of position accuracy (metres) as a function of number of
receivers. 192 Table 4.7-2 : Predicted Velocity Errors (m/s) as a function of the number of
receivers. 192 Table 4.8-1 212 Table 4.8-2 215 Table 4.8-3 225 Table 4.9-1 : Broadcast signal parameters 232 Table 4.9-2 : Passive Radar coverage 245
UNRESTRICTED Use, duplication or disclosure of data contained on this sheet is subject to the restrictions on the title page of this document

UNRESTRICTED
Study into Spectrally Efficient Radar Systems in the L and S Bands xiv Ofcom Spectral Efficiency Scheme 2004 - 2005 (SES-2004-2)
This page is intentionally left blank.
UNRESTRICTED Use, duplication or disclosure of data contained on this sheet is subject to the restrictions on the title page of this document
UNRESTRICTED
Study into Spectrally Efficient Radar Systems in the L and S BandsOfcom Spectral Efficiency Scheme 2004 - 2005 (SES-2004-2) xv
Definitions, abbreviations and references
Acronym Description A-D, A/D, ADC Analogue To Digital Converter ADS Automatic Dependent Surveillance AIP Administered Incentive Pricing AM Amplitude Modulation AOA Angle of Arrival ASMI Airport Surface Movement Indicator ASR Airport Surveillance Radar ATC Air Traffic Control ATS Air Traffic Services AWGN Additive White Gaussian Noise BBC British Broadcasting Corporation BITE Built In Test Equipment BJT Bipolar Junction Transistors BPSK Binary Phase Shift Keyed BW Bandwidth BWE Bandwidth Extrapolation CAA Civil Aviation Authority CAP Civil Aviation Publication CC Central Control CDMA Code Division Multiple Access CEP Circular Error Probable CEPT European Conference of Postal And Telecommunications
Administrations CFA Crossed-Field Amplifiers COFDM Coded Orthogonal Frequency Division Multiplexing CR Cognitive Radio CRLB Cramer Rao Lower Bound CRT Cathode Ray Tube CSMA Carrier-Sense Multiple Access CW Continuous Wave DAB Digital Audio Broadcast DAP Directorate of Airspace Policy DC Direct Current DCF Distributed Coordination Function DDS Direct Digital Synthesis
UNRESTRICTED Use, duplication or disclosure of data contained on this sheet is subject to the restrictions on the title page of this document

UNRESTRICTED
Study into Spectrally Efficient Radar Systems in the L and S Bands xvi Ofcom Spectral Efficiency Scheme 2004 - 2005 (SES-2004-2)
Acronym Description DOP Dilution Of Precision DPD Discrete Probability Density DS Direct Sequence DSA Dynamic Spectrum Access DSP Digital Signal Processor / Processing DTI Department of Trade And Industry DVB Digital Video Broadcast ECC Electronic Communications Committee ECCM Electronic Counter Counter Measures EHT Extra High Tension EIRP Equivalent Isotropically Radiated Power EKF Extended Kalman Filter EM Electromagnetic ERP Effective Radiated Power ESPRIT Estimation of Signal Parameters Via Rotational Invariance Techniques ET Engineering and Technology FCC Federal Communication Comission FDOA Frequency Difference of Arrival FET Field Effect Transistor FFT Fast Fourier Transform FIM Fisher Information Matrix FM Frequency Modulation FMCW Frequency Modulated Continuous Wave FOA Frequency of Arrival FSR Forward Scatter Radar GaAs Gallium Arsenide GaN Gallium Nitride GDOP Geometric Dilution Of Precision GDP Gross Domestic Product GEESE Generalised Eigenvalues Utililising Signal Subspace Eigenvectors GHz Giga Hertz GMR Ground Movement Radar GPIB General Purpose Interface Bus GPS Global Positioning System GSM Global System For Mobile Communication GTD Geometric Theory of Diffraction HAPs High Altitude Platforms
UNRESTRICTED Use, duplication or disclosure of data contained on this sheet is subject to the restrictions on the title page of this document
UNRESTRICTED
Study into Spectrally Efficient Radar Systems in the L and S BandsOfcom Spectral Efficiency Scheme 2004 - 2005 (SES-2004-2) xvii
Acronym Description HEMTs High Electron Mobility Transistor HFETs Heterostructure Field Effect Transistor HIRF High Intensity Radiated Field HT High Tension ICNIRP International Council On Non-Ionizing Radiation Protection IEE Institude of Electrical Engineers IEEE Institute of Electrical And Electronics Engineers IF Intermediate Frequency IFFT Inverse Fast Fourier Transform IMP Iterative Multi Parameter IMT International Mobile Telephony ISM Industrial Scientific Medical ITA Independent Television Authority ITU International Telecommunication Union ITV Independent Television LAN Local Area Network LDMOS Laterally Diffused Metal Oxide Semiconductor LFM Linear Frequency Modulation LMMSE Linear Minimum Mean Square Error LMS Least Mean Square Error LO Local Oscillator LOB Line Of Bearing LOS Line Of Sight LPI Low Probability of Intercept LSE Least Square Error MESFET Metal Semiconductor Field Effect Transistor MHz Mega Hertz MIMO Many In Many Out ML Maximum Likelihood MMSE Minimum Mean Square Error MoD Ministry of Defence MOSFET Metal Oxide Silicon Field Effect Transistor MSSP Modified Spatial Smoothing Preprocessor MTBF Mean Time Between Failures MTD Moving Target Discrimination MTI Moving Target Indication MTTF Mean Time To Failure
UNRESTRICTED Use, duplication or disclosure of data contained on this sheet is subject to the restrictions on the title page of this document
UNRESTRICTED
Study into Spectrally Efficient Radar Systems in the L and S Bands xviii Ofcom Spectral Efficiency Scheme 2004 - 2005 (SES-2004-2)
Acronym Description MUSIC Multiple Signal Classification MV Marginal Values MW Mega Watt N/A Not Applicable NATS National Air Traffic Services ; National Air Traffic Control NERA National Economic Research Associates NF Noise Figure NLFM Non-Linear Swept Frequency Modulation NM Nautical Mile NOI Notices Of Inquiry NPRM Notice of Provisional Rule Making OFDM Orthogonal Frequency Division Multiplexing OR Operational Requirement PA Power Amplifier PAL Phase Alternating Line PC Personal Computer PCL Passive Coherent Location PD Probability of Detection PDF Probability Density Function PPM Periodic-Permanent Magnet PRF Pulse Repetition Frequency PRFD Pulse Repetition Frequency Discriminator PRI Pulse Repetition Interval PRR Pulse Repetition Rate PSD Phase Sensitive Detector QAM Quadrature Amplitude Modulation QoS Quality of Service RA Radio-Communications Agency RADHAZ Radiation Hazard RCS Radar Cross Section RF Radio Frequency RMA Reliability Maintainability Availability RMSE Root Mean Square Error RRV Rate of Rise RTT Round Trip Time S/I Signal To Interference SDR Software Defined Radio
UNRESTRICTED Use, duplication or disclosure of data contained on this sheet is subject to the restrictions on the title page of this document
UNRESTRICTED
Study into Spectrally Efficient Radar Systems in the L and S BandsOfcom Spectral Efficiency Scheme 2004 - 2005 (SES-2004-2) xix
Acronym Description SEP Spherical Error Probable SNR Signal-To-Noise Power Ratio SPU Signal Processing Unit SRA Surveillance Radar Approach SS Solid State SSP Spatial Smoothing Pre-Processor SSR Secondary Surveillance Radars SVD Singular Value Decomposition TDOA Time Difference Of Arrival TLS Total Least Squares TLSE Total Least Squares Error TMA Terminal Manoeuvring Area TOA Time Of Arrival TOO Transmitter Of Opportunity TWT Travelling-Wave Tubes TX Transmitter UAV Unmanned Air Vehicle UHF Ultra High Frequency UK United Kingdom ULA Uniform Linear Array UMTS Universal Mobile Telecommunications System UPC Unit Production Cost US United States USA United States of America UWB Ultrawideband VSWR Voltage Standing Wave Ratio W-CDMA Wideband Code Division Multiple Access W/Hz Watts / Hertz WLAN Wireless Local Area Network WLSE Weighted Least Squares Estimator WT Wireless Telephony
UNRESTRICTED Use, duplication or disclosure of data contained on this sheet is subject to the restrictions on the title page of this document

UNRESTRICTED
Study into Spectrally Efficient Radar Systems in the L and S Bands xx Ofcom Spectral Efficiency Scheme 2004 - 2005 (SES-2004-2)
This page is intentionally left blank.
UNRESTRICTED Use, duplication or disclosure of data contained on this sheet is subject to the restrictions on the title page of this document
UNRESTRICTED
Study into Spectrally Efficient Radar Systems in the L and S BandsOfcom Spectral Efficiency Scheme 2004 - 2005 (SES-2004-2) 1
1 Executive Summary
In the commercially important L and S bands 31% of the spectrum is primarily allocated to radar systems and is unavailable to other users of the spectrum. Potentially large amounts of spectrum could be freed up for commercial purposes if radar systems could:
Be moved to a different frequency band in lower demand (SHIFT)
Be improved in terms of their spectral efficiency (SQUASH) and their allocations re-planned to take advantage of this
Share the spectrum with commercial users (SHARE)
The purpose of this study is to investigate some of the challenges related to these approaches; a number of avenues are explored, from incremental improvements to current and developing radar technology through to entire system concept changes.
1.1 Re-locate radar to a different frequency band (SHIFT) Based on device power and radiation hazard safety considerations it is concluded that, of the currently designated radar bands, the only frequency bands to which ATC radars could possibly be moved would be C-band (5 GHz) and X-band (10 GHz). However, these bands are themselves already relatively congested, and so may not offer significant opportunities for re-location of L-band or S-band radars.
1.2 Improve the spectral efficiency of radar (SQUASH) The major benefits of improving radar spectral efficiency will come from widespread deployment (whichever approach is chosen), followed by re-planning of the radar frequency allocations to take advantage of the spectrum savings.
1.2.1 Pulsed radar In nearly all developed radar systems, including the current state of the art, the transmitter is operated in class-C (saturated non-linear) with fast pulse rise and fall times.
Many candidate spectrally efficient waveforms rely on transmitter linearity and are thus not suitable for use in these radar. In addition, their performance can significantly degrade when used with fast moving Doppler shifted targets. It was found that long pulse Non Linearly Frequency Modulated (NLFM) chirp waveforms offer the best combination of spectral efficiency and Doppler tolerance, while being suitable for class-C transmitters.
UNRESTRICTED Use, duplication or disclosure of data contained on this sheet is subject to the restrictions on the title page of this document

UNRESTRICTED
Study into Spectrally Efficient Radar Systems in the L and S Bands 2 Ofcom Spectral Efficiency Scheme 2004 - 2005 (SES-2004-2)
Recent technology advances have lead to the availability of high power near linear solid state LDMOS technology in L-band and its emergence in S-band. Since waveform spectral efficiency is largely controlled by pulse rise (and fall) time significant improvements can be achieved with this technology using shaped pulse edges.
Development timescales for LDMOS technology are such that practical radar transmitters could be developed within 5 years. This is the most likely and low risk direction for the development of the next generation of radar transmitters.
1.2.2 Continuous Wave (CW) radar CW radar has the potential to reduce required radar bandwidth; however, CW systems are limited by:
Self interference - this reduces the detection performance compared to similar power pulsed systems.
Lack of range information – this can be overcome using multi-static system geometry, discriminating targets via Doppler and/or angle of arrival. This could fail for multiple slow moving aircraft. Alternatively some bandwidth may be applied and superresolution algorithms used to recover range resolution, however, this would fail at low SNR.
CW systems must overcome significant technological hurdles, requiring further analysis and long development processes. This requires significant time and effort; any CW radar product for ATC purposes will not be available to the market within the next 10 – 15 years.
1.2.3 Passive radar In principle passive radar systems could detect civil aircraft at lower altitudes but performance would be limited at higer altitudes. Such a system would require support from other (possibly active) sensors. In addition there are signal availability, reliability and redundancy issues affecting safety that need to be examined for ATC applications.
It is thus unlikely that practical passive radar systems, using terrestrial broadcast transmissions, on their own could replace ATC radar in the near future.
1.3 Share the spectrum with other users (SHARE) A method of bandsharing between communications systems, utilising cognitive radio, and prospective CW radar was examined that resulted in good mutual protection both to the radar receiver and to the bandsharing secondary users. Since it relies on sensing CW transmissions it is unlikely that this type of sharing will be feasible until the possible development of CW radar, at the earliest in 15 years time.
1.4 Economics and development timescales Figure 1.4-1 summarises both civil and military timescales for procurement and upgrade / life extension of ATC radar capability, along with indications of the likely opportunities for insertion of new spectrally efficient radar technologies.
UNRESTRICTED Use, duplication or disclosure of data contained on this sheet is subject to the restrictions on the title page of this document

UNRESTRICTED
Study into Spectrally Efficient Radar Systems in the L and S BandsOfcom Spectral Efficiency Scheme 2004 - 2005 (SES-2004-2) 3
Linear SS Tx
available Possible availability of CW, Passive or
Sharing radar
NATS buying class C Tx, ASR 10-SS
Mid-life upgrade opportunity
Phased replacement / life ext of ASR 10-SS
Civil ATC
0 – 5 years 5 – 10 years 10 – 15 years 15+ years
Military ATC
Replace / life ext
Military ATC required
Figure 1.4-1 Timescales of likely radar procurement and technology availability in the UK
Passive, CW or Shared systems will not be near to maturity for ATC radar application within the next 3 - 7 years and would not be considered as part of military or civil ATC capability provision. It is clear that, should they even be proved feasible, the first opportunity for deployment of these alternative spectrally efficient radar technologies will not be before 15 – 20 years hence.
However, new high power linear pulsed radar transmitters could be developed and deployed (as part of a life extension upgrade to existing radar or in a new pulsed radar design) within approximately 6 years. This timescale is consistent with both the procurement of new military ATC capability and mid-life upgrade opportunities in civil ATC radar.
It is clear that the significant spectral efficiency improvements available through the adoption of linear solid state LDMOS transmitter systems, their relatively low technological risk, the predicted development timescales and the expected costs mean that should spectral efficiency become requirements of ATC radar, then this technology is by far the best candidate for procurement into both Civil and Military ATC capability.
UNRESTRICTED Use, duplication or disclosure of data contained on this sheet is subject to the restrictions on the title page of this document

UNRESTRICTED
Study into Spectrally Efficient Radar Systems in the L and S Bands 4 Ofcom Spectral Efficiency Scheme 2004 - 2005 (SES-2004-2)
This page is intentionally left blank.
UNRESTRICTED Use, duplication or disclosure of data contained on this sheet is subject to the restrictions on the title page of this document

UNRESTRICTED
Study into Spectrally Efficient Radar Systems in the L and S BandsOfcom Spectral Efficiency Scheme 2004 - 2005 (SES-2004-2) 5
2 Consortium background
This study has been carried out by a consortium of both industrial and academic partners as illustrated below:
Lead Contractor
Sub Contractors
Consulting & Demo
INTEGRATED SYSTEM TECHNOLOGIES (Insyte)
Advanced Technology Centre
UNRESTRICTED Use, duplication or disclosure of data contained on this sheet is subject to the restrictions on the title page of this document

UNRESTRICTED
Study into Spectrally Efficient Radar Systems in the L and S Bands 6 Ofcom Spectral Efficiency Scheme 2004 - 2005 (SES-2004-2)
2.1 BAE Systems, Integrated System Technologies Integrated System Technologies (Insyte) has been formed through the combination of two strategic business units, AMS UK and BAE Systems NS&S.
As a part of BAE Systems, Insyte focus on delivering complete capability solutions in the electronic systems sector, meeting our customers' desire for high reliability, time critical decision-making systems. Insyte has developed leading edge products, value added systems integration skills and through-life support capability and can offer a complete range, from high tech sensors, to highly sophisticated command systems capable of integrating complex information and making mission critical decisions.
Insyte has one of the world's highest concentrations of system integration skills and a track record of providing proven systems that offer an unmatched presence in every aspect of the system solution.
2.2 BAE Systems, ATC Baddow The BAE SYSTEMS Advanced Technology Centre, together with individual BAE SYSTEMS business units and joint venture companies have been involved in the field of radio propagation research and spectrum management for many years. The corporate commercial interests span the design, manufacture and support of communication and radar systems for military and civil, maritime, airborne, land and space applications. The Advanced Technology Centre (ATC) has been at the forefront of radio propagation research, propagation planning and frequency management developments for many years, and has produced a number of proprietary radio and frequency planning tools that are used by a number of government departments and regulatory agencies.
2.3 Cranfield University, Defence College of Management and Technology Cranfield University is one of Western Europe’s largest academic centres for strategic and applied research, development and design. It is unique in its almost entirely postgraduate focus. The university is made up of three campuses Cranfield, Silsoe and Shrivenham (The Defence College of Management and Technology).
The Communications and Wireless Networks Group provides a focus for the teaching and research activities of the Department of Aerospace Power and Sensors (DAPS) with regard to commercial and military communication systems and wireless networks.
The Radar Group specialises in research on multi-platform, direction-finding, algorithms as well as multi-agent systems for radar arrays in extreme noise environments. The emphasis is on developing new techniques for very difficult problems that current techniques are not able to solve.
UNRESTRICTED Use, duplication or disclosure of data contained on this sheet is subject to the restrictions on the title page of this document

UNRESTRICTED
Study into Spectrally Efficient Radar Systems in the L and S BandsOfcom Spectral Efficiency Scheme 2004 - 2005 (SES-2004-2) 7
2.4 University College London The Electronic and Electrical Engineering Department at UCL is one of six departments in the faculty of Engineering.
The departments’ research activities are based around four main themes:
Microwave, Radar and Optics
Electronic materials and devices
Optoelectronics and Optical networks
Telecommunications, Networks, Circuits and Systems
The department has long a proud history of radar and related research and has published widely on various aspects of SAR, GMTI, Bistatics, netted radar. The department has a comprehensive coherent radar simulator, SAR processor, SAR simulator, a GMTI processor, a GMTI simulator and has a working and characterized low-cost, miniature coherent radar.
2.5 THALES Air Systems U.K. Thales Airborne Systems U.K. is based in Crawley, U.K., with additional sites at Chessington and Leicester. The organization is a part of Thales Defence Ltd, which is part of Thales U.K.
Thales Airborne Systems U.K. has a wide range of experience of research, development and manufacture of advanced radar systems. The radar product line of Thales sensors includes the Searchwater 2000 family, including the Maritime Reconnaissance variant for the Nimrod MRA4 for the Royal Air Force, the AEW variant for the Sea King Mk7 for the Royal Navy and export variants.
The company also manufactures the MSTAR battlefield radar, and are researching an active phased array successor to its vehicle mounted variant. A prototype of the phased array battlefield radar using FMCW modulation has been successfully built and demonstrated. The organization is therefore well-placed to study the opportunities and limitations of CW radars in practical applications as well as methods of minimising their susceptibility to interference.
UNRESTRICTED Use, duplication or disclosure of data contained on this sheet is subject to the restrictions on the title page of this document

UNRESTRICTED
Study into Spectrally Efficient Radar Systems in the L and S Bands 8 Ofcom Spectral Efficiency Scheme 2004 - 2005 (SES-2004-2)
This page is intentionally left blank.
UNRESTRICTED Use, duplication or disclosure of data contained on this sheet is subject to the restrictions on the title page of this document
UNRESTRICTED
Study into Spectrally Efficient Radar Systems in the L and S BandsOfcom Spectral Efficiency Scheme 2004 - 2005 (SES-2004-2) 9
3 Study overview
The work carried out by the industrial and academic partners in this study was divided into nine work packages:
Work Package
Title Lead Partner
4.1 A review of the spectrum utilised by radar in the L & S bands and recommendations on which (if any) could be moved to lightly-used higher frequency bands
ATC
4.2 Assessment of the economies of introducing new spectrally efficient radar technologies
Insyte
4.3 A study into the practical problems of generating high power coded waveforms using travelling wave tube or alternative devices
Insyte
4.4 A review of the degree to which frequency and time agile applications can co-exist with radar in the same band without causing interference and the effect of secondary users.
DCMT
4.5 Identification of boundary field strengths that could be realistically set as part of radar licences that would encourage development of a spectrum market in radar bands
ATC
4.6 Analysis of deliberate or accidental jamming of CW radar systems and methods for avoidance
Insyte / Thales / UCL
4.7 Analysis of the deployment of a multi-static CW radar system for Air Traffic Control
UCL
4.8 Range information from reduced bandwidth radar UCL
4.9 Review of passive sensor systems potential ATC
UNRESTRICTED Use, duplication or disclosure of data contained on this sheet is subject to the restrictions on the title page of this document
UNRESTRICTED
Study into Spectrally Efficient Radar Systems in the L and S Bands 10 Ofcom Spectral Efficiency Scheme 2004 - 2005 (SES-2004-2)
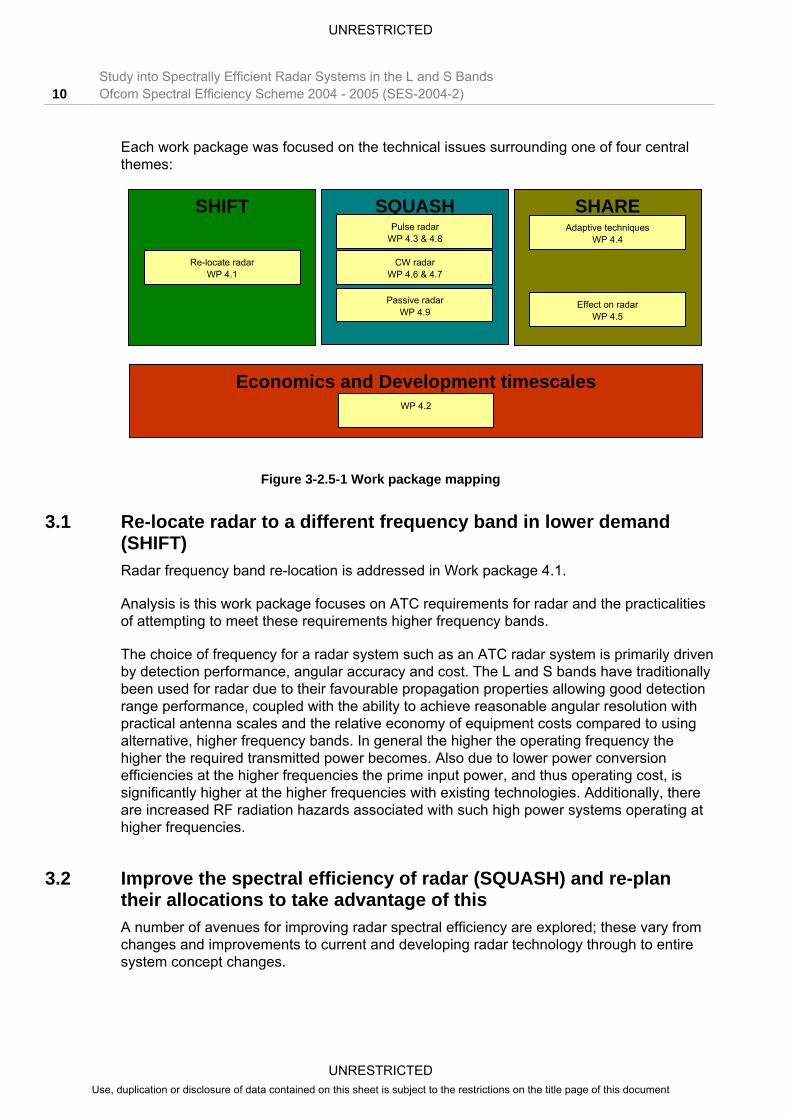
Each work package was focused on the technical issues surrounding one of four central themes:
SQUASH Pulse radar
WP 4.3 & 4.8
CW radar WP 4.6 & 4.7
Passive radar WP 4.9
SHIFT
Re-locate radar WP 4.1
SHARE Adaptive techniques
WP 4.4
Effect on radar WP 4.5
Economics and Development timescales WP 4.2
Figure 3-2.5-1 Work package mapping
3.1 Re-locate radar to a different frequency band in lower demand (SHIFT) Radar frequency band re-location is addressed in Work package 4.1.
Analysis is this work package focuses on ATC requirements for radar and the practicalities of attempting to meet these requirements higher frequency bands.
The choice of frequency for a radar system such as an ATC radar system is primarily driven by detection performance, angular accuracy and cost. The L and S bands have traditionally been used for radar due to their favourable propagation properties allowing good detection range performance, coupled with the ability to achieve reasonable angular resolution with practical antenna scales and the relative economy of equipment costs compared to using alternative, higher frequency bands. In general the higher the operating frequency the higher the required transmitted power becomes. Also due to lower power conversion efficiencies at the higher frequencies the prime input power, and thus operating cost, is significantly higher at the higher frequencies with existing technologies. Additionally, there are increased RF radiation hazards associated with such high power systems operating at higher frequencies.
3.2 Improve the spectral efficiency of radar (SQUASH) and re-plan their allocations to take advantage of this A number of avenues for improving radar spectral efficiency are explored; these vary from changes and improvements to current and developing radar technology through to entire system concept changes.
UNRESTRICTED Use, duplication or disclosure of data contained on this sheet is subject to the restrictions on the title page of this document

UNRESTRICTED
Study into Spectrally Efficient Radar Systems in the L and S BandsOfcom Spectral Efficiency Scheme 2004 - 2005 (SES-2004-2) 11
3.2.1 Changes and improvements to current and developing pulsed radar technology The options for incrementally changing or significantly improving the spectral efficiency of conventional pulsed radar designs are examined in work package 4.3, these focus primarily on the capabilities and limits of radar transmitters to generate more spectrally efficient waveforms and the technological changes that could be made to improve these capabilities. A review of candidate waveforms is carried out to find the most appropriate for application in spectrally efficient pulsed radar.
Work package 4.8 investigates the possibilities of using superresolution algorithms to recover resolution performance in radar with reduced bandwidth.
3.2.2 Entire system concept changes Alternative system concepts are explored in work packages 4.7 and 4.9. These fall into two categories:
3.2.2.1 Narrowband Continuous Wave (CW) radar Concept CW radar architectures and their potential detection and location performance are examined in work package 4.7, while their susceptibility to accidental and deliberate jamming is detailed in work package 4.6.
3.2.2.2 Passive radar The potential of passive radar systems is examined in work package 4.9. Various candidate signal sources are explored and the performance of possible passive systems is compared with the requirements for ATC radar. Example performance has been estimated for a passive radar receiver system located at Heathrow airport, using local signals.
3.3 Share the spectrum with other users (SHARE) The degree to which other applications could share the existing radar bands is investigated in work packages 4.4 and 4.5.
In work package 4.4 methods by which frequency and time agile applications could potentially co-exist with radar in the same band without causing interference, using adaptive techniques, are examined.
Meanwhile, work package 4.5 investigates the effect that co-channel transmissions of other services, such as WiFi, could have on the performance of radar. The limits that could be placed on their design, deployment and use to ensure radar performance is maintained are examined.
UNRESTRICTED Use, duplication or disclosure of data contained on this sheet is subject to the restrictions on the title page of this document

UNRESTRICTED
Study into Spectrally Efficient Radar Systems in the L and S Bands 12 Ofcom Spectral Efficiency Scheme 2004 - 2005 (SES-2004-2)
3.4 Economics and development timescales In work package 4.2 the economics of introducing selected candidate technologies from those discussed in the rest of this study are assessed in the context of the provision of Air Traffic Control radar services in both the L and S bands.
Development costs are estimated along with timescales for development and deployment. This information, along with the known timescales of ATC capability procurement in both the civil and military markets, is used to make recommendations on the best way forward to ensure improved radar spectral efficiency in the future.
UNRESTRICTED Use, duplication or disclosure of data contained on this sheet is subject to the restrictions on the title page of this document