Embed Size (px)
Citation preview


Study Area: Central Valley, California, USA

Orchard Crop Distribution in California
• 14 tree crops with significant commercial production in CA, of which almost 800,000 ha (> 98%) in 3 species
• > 99% of these crops grown within Central Valley

Orchard Crop Distribution in California
Major determining factors for distribution related to economic sustainability
• Water availability/ cost• Soil quality/ crop needs• Land/ input cost• Yield/market value
Regionally specific inputs/ practices

LCA Model Assumptions
Input values representative or “typical” for CA
• Local scale variations cancel on large scales
• No significant orchard demographic pattern
Factors omitted:
• Orchard soil carbon storage
• Marketing, distribution, consumption
• Human labor

LCA Model AssumptionsModel perspective: orchard crop production
• Goal: inform orchard industry and policy decision makers
• Scope: nursery to processor (post-harvest) gate
• System Boundary: orchard lifespan (25-60 yrs)
• Functional Unit: land use (ha), product (kg)
• Impact Assessment: Global Warming Potential (GWP100)

AB32: GHG Cap-and-trade in CASigned into law 2006, took effect 2012
Goal: reduce GHG emissions to 1990 levels by 2020
GHG emission monitoring and enforceable compliance obligation (“cap”) since 2013- Implementation and enforcement by California Air
Resources Board (CARB)- Applies to emitters of 22,675 tonnes CO2e yr-1 or more- Different industries including ag to be “rolled in” gradually- Soon to include some major orchard postharvest facilities
Offset credits issued for quantifiable GHG reduction (but not in course of “business as usual”)

Credit: www.xkcd.com

LCA Model
Process-based, comprehensive
Management choices from input production to end-of-life phases potentially have large effects on results

Major Determining Factorsfor total life cycle GHG emissions
Orchard Productive Lifespan (Pistachio > Walnut > Almond)
Fertilizer Input(Pistachio > Walnut > Almond)
Irrigation Water Input/ Source(Pistachio > Walnut > Almond)
Biomass Accumulation/ Fate(Walnut > Pistachio > Almond)
Yield (Dry Mass)(Walnut > Almond > Pistachio)
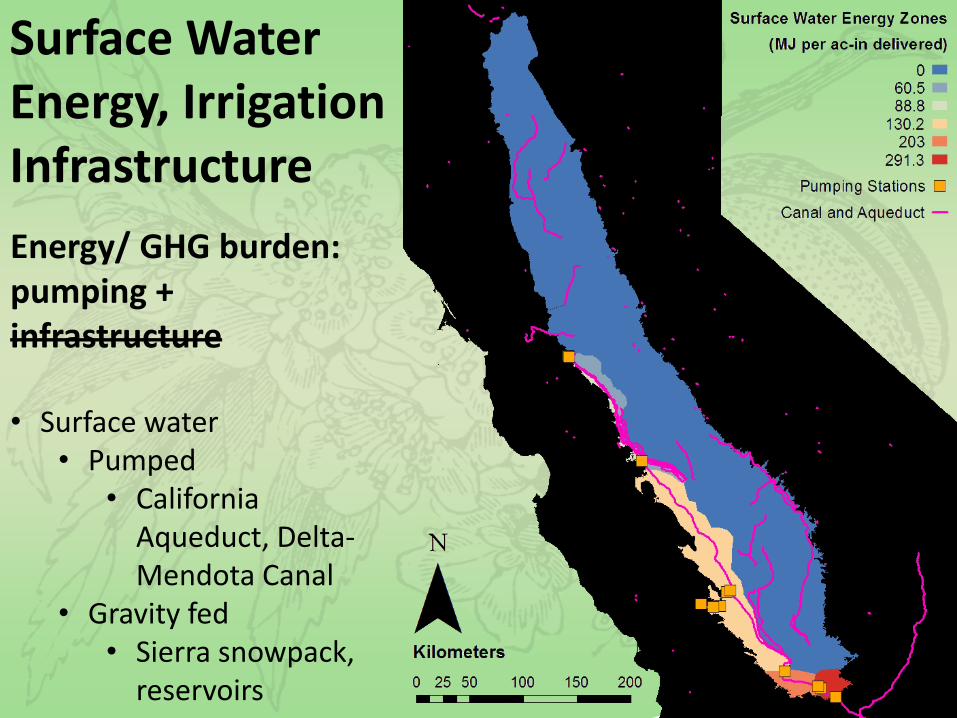
Surface Water Energy, Irrigation Infrastructure
Energy/ GHG burden: pumping + infrastructure
• Surface water• Pumped
• California Aqueduct, Delta-Mendota Canal
• Gravity fed• Sierra snowpack,
reservoirs

Groundwater Depth
California Department of Water Resources
• 23 years of groundwater depth data points (test wells)
• Interpolation to assign values to entire Central Valley orchard production region
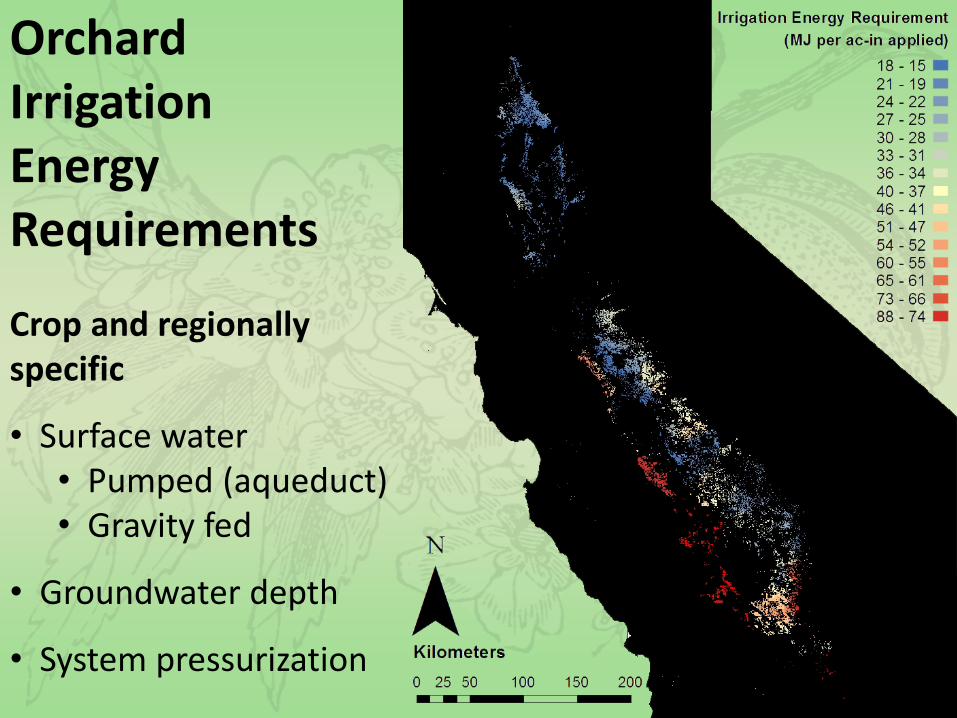
Orchard IrrigationEnergyRequirements
Crop and regionally specific
• Surface water• Pumped (aqueduct)• Gravity fed
• Groundwater depth
• System pressurization
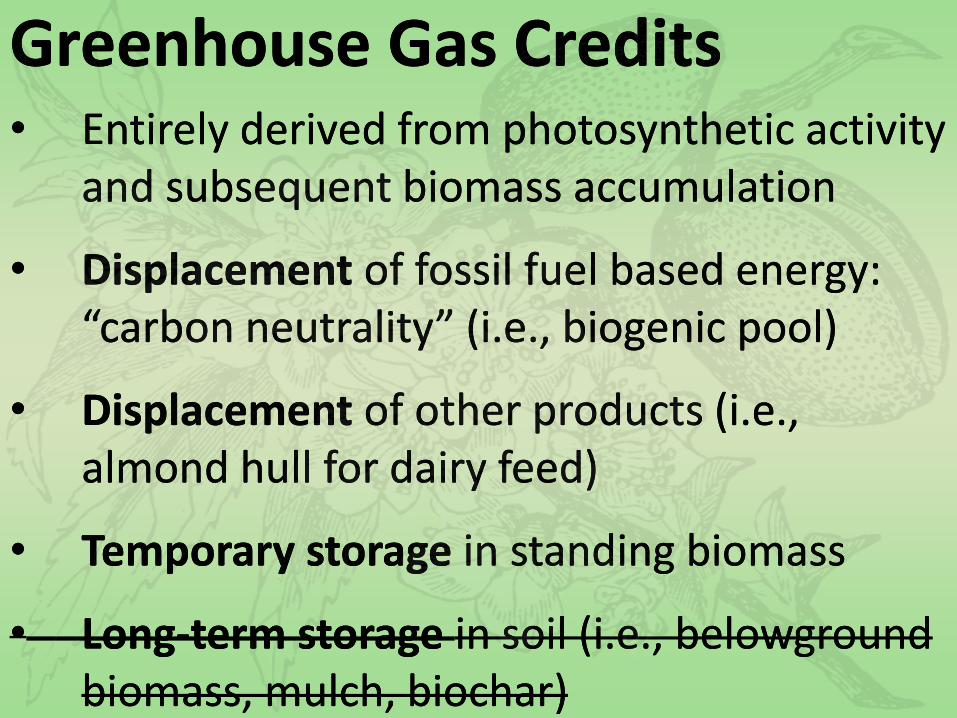
Greenhouse Gas Credits• Entirely derived from photosynthetic activity
and subsequent biomass accumulation
• Displacement of fossil fuel based energy: “carbon neutrality” (i.e., biogenic pool)
• Displacement of other products (i.e., almond hull for dairy feed)
• Temporary storage in standing biomass
• Long-term storage in soil (i.e., belowground biomass, mulch, biochar)
0
20000
40000
60000
80000
100000
0 10 20 30 40 50 60
kg C
O2e
ha-1
Year
Almond
Walnut
Pistachio
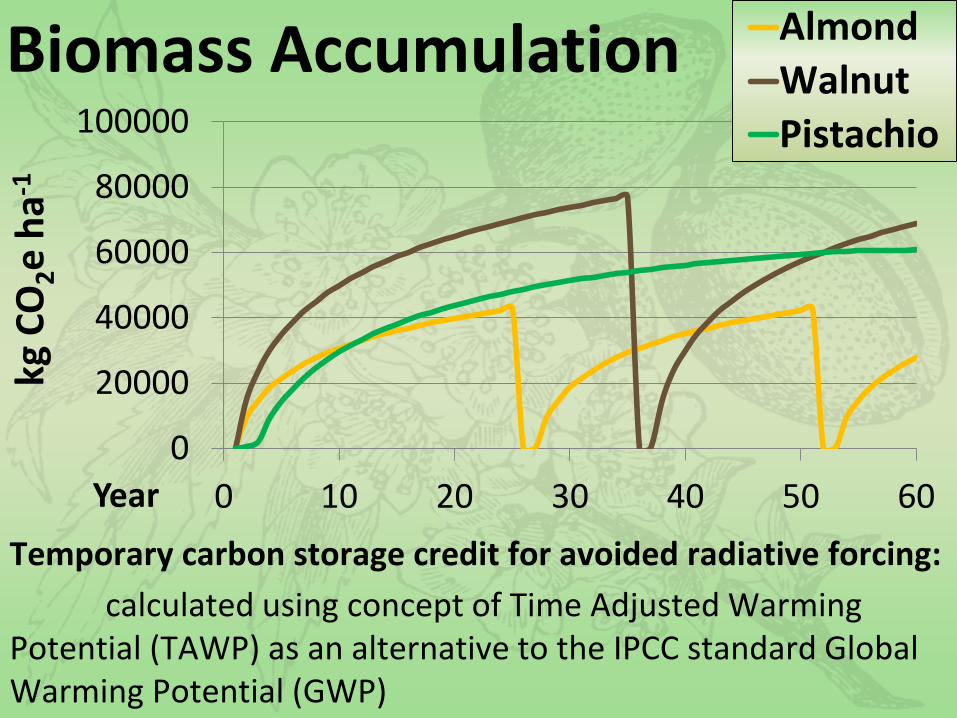
Biomass Accumulation
Temporary carbon storage credit for avoided radiative forcing:
calculated using concept of Time Adjusted Warming Potential (TAWP) as an alternative to the IPCC standard Global Warming Potential (GWP)

Biomass Energy
Fossil fuel displacement: potential source of GHG reduction credits
Spatial relationships, conversion technology, biomass accumulation: major determinants

GHG Emission (GWP100)
-2000
-1000
0
1000
2000
3000
4000
Almond Walnut Pistachio
kg C
O2e
ha-1
yr-1
TemporaryStorageCredit
Co-productCredit
Emission
NetEmission

-1.50
-1.00
-0.50
0.00
0.50
1.00
1.50
2.00
2.50
3.00
Almond Walnut Pistachio
kg C
O2e
kg-1
TemporaryStorageCredit
OffsetCredit
Emissions
NetEmissions
GHG Emission (GWP100)

-3.00E-04
-2.00E-04
-1.00E-04
0.00E+00
1.00E-04
2.00E-04
3.00E-04
4.00E-04
5.00E-04
Almond Walnut Pistachio
kg C
O2e
kca
l-1
TemporaryStorageCredit
OffsetCredit
Emissions
NetEmissions
GHG Emission (GWP100)

Walnut
GHG Emission (GWP100) by Management Category
Almond
Pistachio
Pest Mgmt
Nutrient Mgmt
Land Prep
Biomass Mgmt
Nursery
Irrigation
Pollination
Harvest
Hulling/ Shelling
Other

Sensitivity Analysis: Net GHG Emission
-3 -2 -1 0 1 2 3
BS4
BS6
BS5
BS8
BS3
ISE4
ISE3
ISS3
NS1
ISE1
ISS4
ISS2
ISS1
ISE2
ISS5
ISS6
NS2
BS2
BS1
BS7
% Output Change/ % Parameter Change
Par
amet
er
% biomass to gasificationbiomass power plant efficiencybiomass accumulation ratefertilizer application rate% using diesel pumps% using electric pumpsirrigation water use% under flood irrigation% under microsprinkler irrigation% under sprinkler irrigationirrigation energy intensityN2O soil emission factor% under drip irrigation% using surface water% using ground waterannual pruning mass removed% biomass burned in-field% annual tree loss/replacementplanting densitydistance to power plant
Direct grower controlPartial grower controlNo grower control

-40000
-20000
0
20000
40000
60000
80000
100000
1 3 5 7 9 11 13 15 17 19 21 23 25
kg C
O2e
ha-1
Year
Business as Usual
Scenario Range
Biomass Accumulation
Scenario Analysis: Net GHG Emission (Almond)
-6,000
-4,000
-2,000
0
2,000
4,000
6,000
8,000
10,000
12,000
kg C
O2e
ha-1
MeanBaUOther Scenarios

Maximum Biomass Energy Production
-6000
-5000
-4000
-3000
-2000
-1000
0
1000
2000
3000
4000
Almond Walnut Pistachio
kg C
O2e
ha-1
yr-1
TemporaryStorageCredit
Co-ProductCredit
Emissions
NetEmissions

Maximum Biomass Energy Production
-4.00
-3.00
-2.00
-1.00
0.00
1.00
2.00
3.00
Almond Walnut Pistachio
kg C
O2e
kg-1
TemporaryStorageCredit
Co-ProductCredit
Emissions
Net Emission

Maximum Biomass Energy Production
-6.00E-04
-4.00E-04
-2.00E-04
0.00E+00
2.00E-04
4.00E-04
6.00E-04
Almond Walnut Pistachio
kg C
O2e
kca
l-1
TemporaryStorageCredit
Co-ProductCredit
Emissions
NetEmissions

-80 -60 -40 -20 0
baseline
10%, 15 yr interval
25%, 15 yr interval
50%, 15 yr interval
10%, 30 yr interval
25%, 30 yr interval
50%, 30 yr interval
50%, 10 yr interval
Tonnes CO2e ha-1
Co-productCredit
TemporaryStorageCredit
Temporary storage vs co-product use credit tradeoffs: orchard biomass management

Conclusions
GHG reduction credits• Potential for growers to achieve GHG neutral or negative
status: carbon credit payments?
• Incentives to manage for yield and biomass production?
• Economic sustainability under adverse conditions?
Comparative assessment• Depends on point of view: land use, economic yield,
nutrition
• Best options for GHG reduction vary depending on productive lifespan, biomass accumulation, input demands

Thank you for your attention!
AcknowledgementsThe Almond Board of CaliforniaThe Pistachio Research Board
California Department of Food and AgricultureUC Davis Agricultural Sustainability Institute
G&F AgriservicesDixon Ridge Farms
UC Cooperative ExtensionDr. Ted Dejong
Dr. Louise FergusonDr. Bruce Roberts
Dr. Elena Agueron-Fuentes
Contact: [email protected], [email protected], [email protected]

• 453203 ha planted
• Widely distributed in Central Valley
• Productive on relatively wide range of soil conditions
• Mostly micro-irrigation, some flood
• 56 dry tonnes/ha biomass accumulation
Almond• Productive Lifespan: 25 years
• Typical yield: 2.3 tonne ha-1 yr-1

• 132614 ha planted
• Well-distributed in CV
• Requires reasonably high-quality, deep soil – often riparian
• Mostly micro-irrigation, some flood
• 76 dry tonnes/ha biomass accumulation
Walnut• Productive Lifespan: 35 years
• Typical yield: 3.4 tonne ha-1 yr-1

• 72839 ha planted
• Mostly confined to southern CV
• Productive on marginal, shallow soils
• Mostly drip and microsprinkler
• 65 dry tonnes/ha biomass accumulation
Pistachio• Productive Lifespan: 60-100 yrs?
• Typical yield: 1.6 tonne ha-1 yr-1

Carbon Flow in Almond
Scenario: 95% biomass to energy production via 3% gasification, 97% solid fuel, and 50% long-term sequestration
of biochar gasification co-product.

Scenario CodesScenario Description
M1 Business as Usual (BaU)
M2 Linear scenario combination resulting in maximum net emissions/energy use
M3 Linear scenario combination resulting in minimum net emissions/energy use
B1 BaU scenario with alternative biomass accumulation model
B2 BaU with hulls displacing straw instead of corn silage
B3BaU biomass utilization mix with 3% gasification power plants, accounting for gasification power plant efficiency
and assuming 50% biochar long-term sequestration
B4BaU biomass utilization mix with solid fuel power plants replaced by gasification plants, plant efficiency 37.2%, 0%
biochar sequestration
B5BaU biomass utilization mix with solid fuel power plants replaced by gasification plants, plant efficiency 37.2%, 50%
biochar sequestration
B6Maximum biomass utilization mix (including all clearing, pruning, shells, and processing waste biomass) with solid
fuel power plants replaced by gasification plants, plant efficiency 37.2%, 0% biochar sequestration
B7
Maximum biomass utilization mix (including all clearing, pruning, shells, and processing waste biomass) with solid
fuel power plants replaced by gasification plants, plant efficiency 37.2%, 0% biochar sequestration, transport
distance 0 km (on-site generation)
B8
Maximum biomass utilization mix (including all clearing, pruning, shells, and processing waste biomass) with solid
fuel power plants replaced by gasification plants, plant efficiency 37.2%, 50% biochar sequestration, transport
distance 0 km (on-site generation)
B9Maximum biomass utilization mix (including all clearing, pruning, shells, and processing waste biomass) with solid
fuel power plants, plant efficiency 25%, 50% biochar sequestration, transport distance 0 km (on-site generation)
B10 All biomass waste burned in-field.

I1 BaU with 100% diesel pump
I2 BaU with 100% electric pump
I3 BaU with 100% electric pump, 100% flood irrigation
I4 BaU with 100% electric pump, 100% microsprinkler irrigation
I5 BaU with 100% electric pump, 100% drip irrigation
I6 BaU with 100% electric pump, 100% sprinkler irrigation
I7 BaU with 100% diesel pump, 100% flood irrigation
I8 BaU with 100% diesel pump, 100% microsprinkler irrigation
I9 BaU with 100% diesel pump, 100% drip irrigation
I10 BaU with 100% diesel pump, 100% sprinkler irrigation
I11 BaU with 100% electric pump, 100% surface water
I12 BaU with 100% electric pump, 100% groundwater
I13 BaU with 100% electric pump, 50% surface and 50% ground water
I14 BaU with 100% diesel pump, 100% surface water
I15 BaU with 100% diesel pump, 100% ground water
I16 BaU with 100% diesel pump, 50% surface and 50% ground water
I17 100% diesel pump, 100% surface water, microsprinkler irrigation
I18 100% electric pump, 100% ground water, flood irrigation
N1IPCC Tier 1/2; direct N2O EF data from Alsina and Smart (2010), indirect N2O via NH3 EF data from Krauter and Goorahoo (2000), indirect N2O via
NOx EF data from Matson (1997), flood direct N2O EF from intermittently flooded rice field data (IPCC 2006)
N2IPCC Tier 1/2; direct N2O EF data from Alsina and Smart (2010), indirect N2O via NH3 EF as IPCC (2006) default, indirect N2O via NOx EF data from
Matson (1997), flood irrigation direct N2O EF from intermittently flooded rice field data (IPCC 2006)
N3 IPCC Tier 1 default values (IPCC 2006)
N4
IPCC Tier 2/3; direct N2O EF data from Alsina and Smart (2010), indirect N2O via NH3 EF data from Krauter and Goorahoo (2000), indirect N2O via
NOx EF data from Matson (1997), flood irrigation direct N2O EF from intermittently flooded rice field data (IPCC 2006), drip irrigation direct N2O EF
directly measured
O1 Population-based model from OFFROAD software (CARB 2006)
E1 Electricity Supply Mixer - WECC Production eGrid05
E2 GREET
E3 Electricity, at grid, California|US|UCSB|agg - LCI result
E4 electricity, power supply, at grid, California Mix|US|EcoInvent/CA mix|agg - LCI result
E5 electricity, power supply, at power plant, California Mix|US|EcoInventCA mix|agg - LCI result
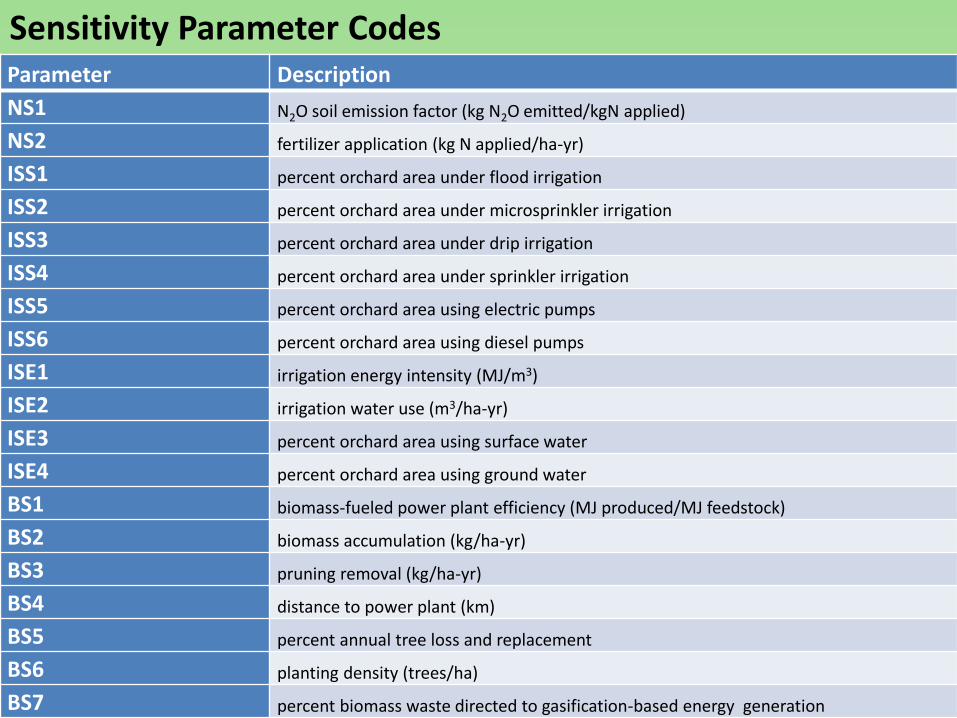
Sensitivity Parameter CodesParameter Description
NS1 N2O soil emission factor (kg N2O emitted/kgN applied)
NS2 fertilizer application (kg N applied/ha-yr)
ISS1 percent orchard area under flood irrigation
ISS2 percent orchard area under microsprinkler irrigation
ISS3 percent orchard area under drip irrigation
ISS4 percent orchard area under sprinkler irrigation
ISS5 percent orchard area using electric pumps
ISS6 percent orchard area using diesel pumps
ISE1 irrigation energy intensity (MJ/m3)
ISE2 irrigation water use (m3/ha-yr)
ISE3 percent orchard area using surface water
ISE4 percent orchard area using ground water
BS1 biomass-fueled power plant efficiency (MJ produced/MJ feedstock)
BS2 biomass accumulation (kg/ha-yr)
BS3 pruning removal (kg/ha-yr)
BS4 distance to power plant (km)
BS5 percent annual tree loss and replacement
BS6 planting density (trees/ha)
BS7 percent biomass waste directed to gasification-based energy generation
BS8