Embed Size (px)
Citation preview
ReportStudy and work in the EU:
set apart by gender
Review of the implementation of the Beijing Platform
for Action in the EU Member States
More information on the European Union is available on the internet (http://europa.eu).
Luxembourg: Publications Office of the European Union, 2018
Print ISBN 978-92-9493-895-4 doi:10.2839/41595 MH-01-17-512-EN-CPDF ISBN 978-92-9493-894-7 doi:10.2839/595585 MH-01-17-512-EN-N
© European Institute for Gender Equality, 2018Reproduction is authorised provided the source is acknowledged.
Europe Direct is a service to help you find answers to your questions about the European Union.
Freephone number (*): 00 800 6 7 8 9 10 11
(*) The information given is free, as are most calls (though some operators, phone boxes or hotels may charge you).
European Institute for Gender Equality
The EIGE is the EU knowledge centre on gender equality. EIGE supports policymakers and all relevant institutions in their efforts to make equality between women and men a reality for all Europeans by providing them with specific expertise and comparable and reliable data on gender equality in Europe.
European Institute for Gender EqualityGedimino pr. 16LT-01103 VilniusLITHUANIATel. +370 52157444Email: [email protected]
http://www.eige.europa.eu http://www.twitter.com/eurogender http://www.facebook.com/eige.europa.eu http://www.youtube.com/eurogenderhttp://eurogender.eige.europa.eu
In 1995 the Fourth World Conference on Women adopted the Beijing Declaration and Platform for Action for Equality, Development and Peace (BPfA). The BPfA is an agenda for women’s empowerment. It reaffirms the fundamental principle whereby the human rights of women and the girl child are an inalienable, integral and indivisible part of universal human rights. As an agenda for action, the BPfA seeks to promote and protect the full enjoyment of all human rights and fundamental freedoms by women throughout their lives.
The European Union and its Member States committed to the BPfA since the beginning. The European Council requested an annual review of the implementation of the BPfA in the Member States. In 1998 the Council of the EU agreed that the review would include a proposal on a set of quantitative and qualitative indicators.
This report is part of the European Institute for Gender Equality’s (EIGE) research on monitoring the BPfA. EIGE regularly produces research reports reviewing different areas and indicators of the BPfA, as requested by the Presidencies of the Council of the EU.
Most recent research reports include:
• Gender, skills and precarious work in the EU (2017);• Poverty, gender and intersecting inequalities in the EU (2016);• Gender equality in power and decision-making (2016).
You can explore all of EIGE’s previous BPfA reports and publications at http://eige.europa.eu/monitoring-the-bpfa
Study and work in the EU:set apart by gender
This report was developed by Dr Lina Salanauskaitė and Dr Jolanta Reingardė at the European Institute for Gender Equality (EIGE) on the basis of contributions provided by the experts: Kristi Anniste, Helen Biin, Laura Kirss, Märt Masso, Eve Mägi, Kirsti Nurmela and Heti Pisarev of Praxis Center for Policy Studies (PRAXIS). The research was coordinated by Dr Lina Salanauskaitė.
A particular thank you goes to Davide Barbieri at EIGE for statistical support and to other colleagues for valuable comments and contributions: Hedvika Janeckova, Dr Marre Karu, Raffaele Lelleri, Dr Zuzana Madarova, Katherine Maxwell and Blandine Mollard. Many thanks to the team at EIGE for their administrative and communications support.
The report has greatly benefited from expert advice received from: EIGE’s Experts’ Forum, the experts’ consultation on Gender segregation in education, training and the labour market (2 March 2017), the High Level Group on Gender Mainstreaming, the European Foundation for the Improvement of Living and Working Conditions (Eurofound), the European Trade Union Committee for Education (ETUCE), the General Secretariat of the Council of the EU and the European Commission, in particular the Gender Equality Unit at DG Justice and Consumers and Eurostat.
Neither EIGE nor any person acting on its behalf can be held responsible for the use made of the information contained within this publication. The opinions expressed in this independent publication do not necessarily reflect the views of either the European Commission or of the Member States.
Study and work in the EU: set apart by gender 3
EIGE
ForewordIn education and the labour market, women and men are set apart by gender. This poses a real threat to the sustain-able and inclusive growth of the EU. It creates and reinforces gender inequalities in and beyond the classroom and work-place. It weakens the EU economy by making the labour market less competitive and harder for companies to find highly qualified professionals in growing sectors, such as in-formation and technology. These divisions also lead to the untapped potential of talent, unfulfilled career aspirations and reduced well-being for all. This is a serious matter.
It is time to do more and much better to reduce gender segregation, which reinforces the undervaluation of wom-en’s work and leads to their greater poverty and lower eco-nomic independence. While educational attainment for women now exceeds that of men, most part-time workers are women who are predominantly working in industries with lower pay and status. This is not fair. A person’s job prospects should not be dependent on their gender.
The fact that employment growth stems from the creation of quality jobs for men but not so much for women needs to be recognised by a much wider circle of stakeholders. This is especially relevant for those looking into the future of work and the cohesiveness of our societies.
Fewer economic opportunities for women not only implies less prosperity for their families, but also limits the chances of better living conditions for both women and men. In our ageing society, where every resource counts, we can-not expect men to keep rolling the ‘economic turbines’ by themselves. Our recent research shows that narrowing the gender gap in science, technology, engineering and math-ematics (STEM) education would lead to economic growth, with more jobs (up to 1.2 million by 2050) and increased GDP over the long-term (up to EUR 820 billion by 2050). Gender segregation needs to be more prominently and coherently addressed in policies supporting sustainable growth.
In recent years, opportunities for women in the EU labour market have been growing. However, the workforce re-mains strongly divided along gender lines. For example, women make up fewer than 20 % of graduates in informa-tion and communications technology (ICT) across the EU and this number has been going backwards in recent years. Yet, the demand for high-skilled professionals in ICT is only expected to grow. Women will keep missing out on these opportunities because of gender segregation that starts from an early age.
The reasons behind segregation largely come down to gen-der stereotypes that influence subject choices and career aspirations for girls and boys. The current situation needs to change. It is up to everyone — parents, peers, teachers and politicians — to let young people know that they have both the ability and the possibility to study and work in fields that are not typically associated with their gender.
This report is part of EIGE’s work to monitor EU progress to-wards gender equality in relation to the objectives of the Beijing Platform for Action (BPfA). I would like to thank all the institutions and experts that contributed, particularly the Estonian government, the European Commission, espe-cially the Gender Equality Unit at DG Justice and Consum-ers, Eurostat, the High Level Group on Gender Mainstream-ing, the European Foundation for the Improvement of Living and Working Conditions (Eurofound), the European Trade Union Committee for Education (ETUCE), the General Secretariat of the Council of the EU, EIGE’s Experts’ Forum and our staff. We are confident that this report and its find-ings and recommendations offer solid and useful evidence to address the unresolved challenge of gender segregation facing Europe today.
Virginija Langbakk Director
The European Institute for Gender Equality (EIGE)

Study and work in the EU: set apart by gender 5
EIGE
ContentsForeword ����������������������������������������������������������������������������������������������������������������������������������������������������� 3
Executive summary ����������������������������������������������������������������������������������������������������������������������������������11
Introduction ���������������������������������������������������������������������������������������������������������������������������������������������� 15
1� Defining gender segregation in education, training and the labour market �������������������������� 19
1.1. What gender segregation means ..............................................................................................................................19
1.2. Why segregation matters ............................................................................................................................................ 20
1.3. Beijing Platform for Action: challenges in monitoring gender segregation.............................................. 22
1.4. Focus of this report ........................................................................................................................................................ 24
2� Policy context �������������������������������������������������������������������������������������������������������������������������������������� 29
2.1. Combating gender segregation in education and training policy ............................................................... 29
2.2. Combating gender segregation in employment ................................................................................................ 29
3� Gender segregation in education and training ����������������������������������������������������������������������������� 33
3.1. Gender segregation in education: across study fields and time.................................................................... 33
3.2. Comparing gender segregation in vocational and tertiary education ....................................................... 37
4� Transition from education to work �������������������������������������������������������������������������������������������������� 43
4.1. Getting the first job ....................................................................................................................................................... 43
4.2. Occupational pathways ................................................................................................................................................ 44
4.3. Labour market performance of graduates ............................................................................................................ 48
5� Gender segregation in the labour market ������������������������������������������������������������������������������������� 55
5.1. Occupational segregation across countries, time and age cohorts ............................................................. 55
5.2. Gender pay gap in gender-segregated sectors ................................................................................................... 60
6� Segregation-influencing factors ������������������������������������������������������������������������������������������������������ 65
7� Proposed revision of Beijing Platform for Action indicators ������������������������������������������������������ 75
8� Conclusions ������������������������������������������������������������������������������������������������������������������������������������������ 79
9� Recommendations ����������������������������������������������������������������������������������������������������������������������������� 85
References ������������������������������������������������������������������������������������������������������������������������������������������������� 91
Annexes ����������������������������������������������������������������������������������������������������������������������������������������������������� 97
Study and work in the EU: set apart by gender6
EIGE
List of tablesTable 1: Current BPfA indicators on gender segregation by level of education ................................................................................................23
Table 2: BPfA: proportion of female and male ISCED 5A graduates of all ISCED 5A graduates (EU-28, %, 2015) ..........................24
Table 3: Proportion of women and men in STEM and EHW occupations (EU-28, %, 2013-2014) ...........................................................25
Table 4: Share of women and men across the 20 most common EU occupations (EU-28, %, 2014) ...................................................26
Table 5: Other most popular occupations among STEM graduates who do not work in STEM occupations (EU-27, %, 2014) .........................................................................................................................................................................................................................................47
Table 6: Other most popular occupations among EHW graduates who do not work in EHW occupations (EU-27, %, 2014)........................................................................................................................................................................................................................48
Table 7: Change in share of women across selected STEM occupations (2011-2012 to 2013-2014) ...................................................58
Table 8: Change in share of men across EHW occupations (2011-2012 to 2013-2014) ................................................................................59
Table 9: Pearson correlation coefficients between 15-year-old girls’/boys’ achievements in science and mathematics (PISA test scores, 2015) and graduates in STEM, by sex (2013-2015 average) ...................................................67
Table 10: Individual factors influencing work in the EU’s STEM/EHW fields, predicted probabilities (2014) ....................................68
Table 11: Proposal on the restructuring of BPfA indicators on gender segregation in education, training and the labour market ................................................................................................................................................................................................................76
Table A.1: Share of women within STEM and share of men within EHW study fields and by educational level of all graduates in the field, EU average and Member States (%, 2013-2015) .................................................................................107
Table A.2: Share of girls (of all girls) and share of boys (of all boys) at the age of 15 expecting to work in science-related occupations in the EU Member States at the age of 30 (%, 2015) ...............................................................109
Table A.3: Share of women and share of men employed in occupations of the STEM and EHW employment fields as a share of employees within a respective occupation (%, 2013-2014) ......................................................................110
Study and work in the EU: set apart by gender 7
EIGE
List of figuresFigure 1: Proportion of STEM and EHW graduates within total number of graduates, by field of education (%, 2013-2015) .......33
Figure 2: Proportion of women among STEM graduates, by field of education (%, 2013-2015) .....................................................................34
Figure 3: Share of women graduates in STEM: average share in 2004-2006 (%) and change from 2004-2006 to 2010-2012 (p.p.) ..............................................................................................................................................................................................................................35
Figure 4: Proportion of men among EHW graduates, by field of education (%, 2013-2015) ..............................................................................36
Figure 5: Share of men graduates in EHW: average share in 2004-2006 (%) and change from 2004-2006 to 2010-2012 (p.p.) ...........................................................................................................................................................................................................................................36
Figure 6: Share of women graduates in STEM in tertiary education and VET (%, 2013-2015) ............................................................................37
Figure 7: Share of men graduates in EHW in tertiary education and VET (%, 2013-2015) ....................................................................................37
Figure 8: Share of women graduates in STEM: average share in 2004-2006 by educational level (%) and change over 2004-2012 (p.p.) ...................................................................................................................................................................................................................38
Figure 9: Share of men graduates in EHW: average share in 2004-2006 (%) by educational level and change from 2004-2006 to 2010-2012 (p.p.) ...............................................................................................................................................................................................39
Figure 10: Share of women and men in the EU with a first job matching educational profile (EU-26, %, 2009) ...................................43
Figure 11: Share of women and men graduates in STEM (aged 15-35) with a first job corresponding to their field of education (%, 2009) ...................................................................................................................................................................................................................44
Figure 12: Share of women and men graduates of EHW education aged 15-35 with a first job corresponding to their field of education (%, 2009) ......................................................................................................................................................................................44
Figure 13: Women and men graduates in STEM tertiary education and in VET working in a corresponding field (EU-27, %, 2004-2014) .................................................................................................................................................................................................................................45
Figure 14: Women and men graduates in EHW tertiary education and in VET working in a corresponding field (EU-27, %, 2004-2014) .................................................................................................................................................................................................................................46
Figure 15: Occupations of women and men graduates in STEM (EU-27, %, 2014) ...................................................................................................46
Figure 16: Occupations of women and men graduates in EHW (EU-27, %, 2014).....................................................................................................47
Figure 17: Labour market status of women and men STEM graduates (EU-27, %, 2014) .....................................................................................49
Figure 18: Change in labour market status of STEM graduates (EU-27, p.p., 2004-2014) ......................................................................................49
Figure 19: Labour market status of women and men EHW graduates (EU-27, %, 2014) .......................................................................................50
Figure 20: Change in labour market status of EHW graduates (EU-27, p.p., 2004-2014)........................................................................................51
Figure 21: Share of all employees working in STEM and EHW occupations (%, 2013-2014) ...............................................................................55
Figure 22: Gender segregation in STEM (share of women) and EHW (share of men) occupations (EU-27, %, 2004-2014) .............56
Figure 23: Gender segregation in STEM (share of women) and EHW (share of men) occupations, by age group (EU-27, %, 2013-2014) .................................................................................................................................................................................................................................56
Figure 24: Gender segregation in STEM (share of women) and EHW (share of men) occupations (%, 2013-2014) .............................57
Figure 25: Gender segregation across STEM (share of women) occupations (%, 2013-2014)............................................................................58
Figure 26: Gender segregation across EHW (share of men) occupations (%, 2013-2014) ....................................................................................59
Figure 27: Gender pay gap in unadjusted form (%, 2015) ........................................................................................................................................................61
Figure 28: Gender difference in 15-year-olds’ mean achievement in science and mathematics (PISA test scores, 2015) ...............66
Figure 29: Share of 15-year-olds expecting to work in science-related occupations at age 30 (%, 2015) ..................................................67
Figure 30: Share of women VET graduates in STEM (%, 2013-2015) and the age of the first placement of students into different educational tracks ........................................................................................................................................................................................70
Figure 31: Share of men graduates in tertiary education in EHW (%, 2013-2015) and public attitudes to gender equality (%, 2014) ........................................................................................................................................................................................................................71
Figure 32: Gender segregation and relative size of STEM (share of women) and EHW (share of men) occupations (2013-2014) .....................................................................................................................................................................................................................................72
Study and work in the EU: set apart by gender8
EIGE
Country abbreviations
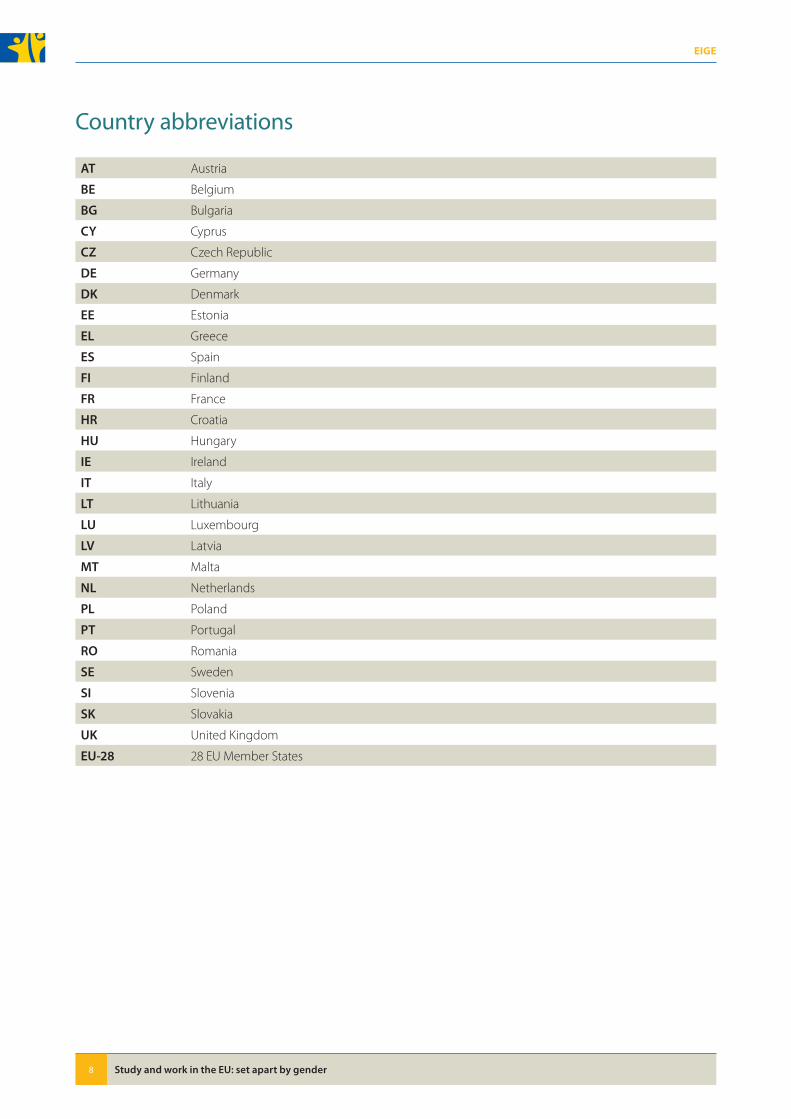
AT Austria
BE Belgium
BG Bulgaria
CY Cyprus
CZ Czech Republic
DE Germany
DK Denmark
EE Estonia
EL Greece
ES Spain
FI Finland
FR France
HR Croatia
HU Hungary
IE Ireland
IT Italy
LT Lithuania
LU Luxembourg
LV Latvia
MT Malta
NL Netherlands
PL Poland
PT Portugal
RO Romania
SE Sweden
SI Slovenia
SK Slovakia
UK United Kingdom
EU-28 28 EU Member States

Executive summary

Study and work in the EU: set apart by gender 11
Executive summaryEIGE
Executive summaryGender segregation is a deeply entrenched feature of edu-cation systems and occupations across the EU. It refers to the concentration of one gender in certain fields of educa-tion or occupations (horizontal segregation) or the concen-tration of one gender in certain grades, levels of responsibil-ity or positions (vertical segregation). Though today women work in all occupations that formerly were ‘all-men’, their share within some occupations is still minor, for example, as construction workers, engineers or ICT professionals. On the other hand, a number of jobs are commonly dominated by women, namely pre-primary education, nursing, per-sonal care and domestic work. Gender segregation narrows life choices, education and employment options, leads to unequal pay, further reinforces gender stereotypes and lim-its access to certain jobs while also perpetuating unequal gender power relations in the public and private spheres.
Gender segregation has detrimental effects on women’s and men’s chances in the labour market and in society in general. A continuous increase in women’s labour market participation over recent decades has largely been due to women entering ‘traditional female jobs’ rather than a more even distribution of women and men across sectors and occupations. In the presence of gendered barriers, numer-ous sectors such as engineering and ICT fail to attract or retain women workers, despite the immense growth pros-pects and a shortage of specialists. Numerous barriers also restrict men’s occupational choices, including lower pay across the sectors where women’s employment is concen-trated and prejudices about men’s supposedly lower need for work–life balance or their aptitude to work in the sec-tors of education or care. Gender segregation is one of the reasons behind skills shortages and surpluses and thus has large, though often still unaccounted for, effects on numer-ous policy initiatives, including those to stimulate economic growth and to reduce long-term unemployment. In the fast-changing and digitalising world of work, where every talent counts, this undermines the realisation of the EU’s full innovative and economic potential.
By committing to the Beijing Platform for Action (BPfA), policymakers long ago recognised the need to ‘eliminate occupational segregation, especially by promoting the equal participation of women in highly skilled jobs and se-nior management positions, and through other measures, such as counselling and placement, that stimulate their on-the-job career development and upward mobility in the labour market, and by stimulating the diversification of oc-cupational choices by both women and men; encourage women to take up non-traditional jobs, especially in science and technology, and encourage men to seek employment in the social sector’ (United Nations, 1995). A wide range
of EU and national initiatives are being pursued to tackle gender segregation. This includes the strategic frame-work for education and training 2020 (ET 2020), the Europe 2020 strategy for jobs and smart, sustainable and inclusive growth, the EU’s strategic engagement for gender equality 2016-2019 (which identifies equal economic independence for women and men as a priority area) and the recent Euro-pean pillar of social rights, which intends to secure social rights more effectively for fair and well-functioning labour markets.
This report focuses on the fields of education and training and the occupations that are highly gender segregated (dominated by one gender). In particular, the focus is on the fields of science, technology, engineering and mathemat-ics (STEM) and education, health and welfare (EHW). The analysis refers to education/training in tertiary education at ISCED Levels 5-8 (from short-cycle tertiary education to doctoral or an equivalent level of education) and to voca-tional education and training at ISCED Levels 35 and 45 (up-per secondary and post-secondary non-tertiary vocational education).
Within STEM, the most men-dominated fields of education are ICT and engineering on the one hand, and manufactur-ing and construction on the other, with women represent-ing 17 % and 19 % of the respective educational cohorts. Among the EHW study fields, gender segregation is more clearly pronounced in education than within the health and welfare fields, with men representing 19 % and 21 % of the cohorts respectively. Over the last decade (2004-2015), women’s share among STEM graduates in the EU has fallen from 23 % to 22 %. Neither has progress in increas-ing men’s share in the EHW study field been achieved, with the share staying around 21 % at EU level during the same period (2004-2015). Among the highly diverse STEM fields, the share of women graduates notably declined in ICT (in 20 Member States), whereas few significant changes were noted in the study fields of engineering, manufacturing and construction (the largest STEM discipline). The fields of natural sciences, mathematics and statistics have sustained their gender-balanced distribution of graduates.
Gender segregation is much stronger in vocational than in tertiary education in almost all EU countries. Overall, only 13 % of EU graduates from STEM vocational education are women, whereas 32 % graduate from STEM tertiary edu-cation. Five countries (EE, IT, PL, PT, RO) have a gender-bal-anced proportion of STEM graduates in tertiary education, but no country has achieved gender balance in vocational education. Over the last decade, a declining interest in STEM studies was observed among all students, but in particular
Study and work in the EU: set apart by gender12
Executive summary EIGE
among women in vocational education. In EHW studies, no country has yet achieved a gender balance among students at either the tertiary or vocational education level: men rep-resent 16 % of EHW graduates in vocational education and 23 % of EHW graduates in tertiary education. The data show an increase in women’s and men’s interest in EHW studies at the vocational education level.
The chances of employment for women graduating from men-dominated fields of education are significantly lower compared to those of men. In 2014, the employment rate of EU women STEM graduates at tertiary level was 76 %. This is more than 10 p.p. lower than the employment rate of men with the same qualification and three p.p. lower than the average employment rate of women with tertiary education. Furthermore, in contrast to the overall increase in women’s employment in the EU, the employment rate of women STEM graduates decreased between 2004 and 2014. Additionally, there has been a notable increase in in-activity rates among women STEM graduates who studied at vocational level. Across the EU, the employment rate of men graduates in EHW was above the general employment rate of men and also higher than that of all men with ter-tiary education.
In the transition from education to work, gender plays a prominent role in ‘funnelling’ young men and women into gendered rather than ‘gender-atypical’ jobs. The chances of finding a job matching their educational profile are higher for women EHW graduates than for women STEM gradu-ates and the opposite holds true for men graduates in these fields. Among tertiary STEM graduates, only one third of women work in STEM occupations, compared to one in two men. Among vocational education graduates, the gap is even greater, with only 10 % of women but 41 % of men working in STEM occupations. Among those moving away from STEM, 21 % of women at the tertiary education level work as teaching professionals and 20 % of women with vocational STEM education work in sales. The chances of finding a job to match one’s educational profile are more equitable in the EHW field, with about half of women and men from any educational level able to find work in EHW occupations.
Gender segregation in STEM and EHW occupations is per-sistently high and has not improved in the last decade. In fact, the share of men in EHW occupations decreased from 30 % in 2004 to 26 % in 2014 at the EU level. This is partially due to the retirement of men, who make up about 40 % of the EHW workforce aged 60-64, whereas there are far fewer men (23 %) among the youngest cohorts. The share
of women in STEM occupations increased marginally from 13 % in 2004 to 14 % in 2014. No differences are observed in the share of women across the age cohorts of the STEM workforce.
Gender segregation varies significantly across countries and across STEM and EHW-related occupations. There is thus a vast scope for improvement. Building and related trades, electrical and electronic trades, metal, machinery and re-lated trades and ICT are almost exclusively men-dominated occupations, whereas personal care work is a women-dom-inated occupation. The gender balance among science and engineering professionals is observed in one country only (LV). Stationary plant and machine operator work is a pre-dominantly men-dominated occupation in some countries, and one with a very high proportion of women employees in other countries. A gender-balanced distribution of em-ployees has been reached among (associate) health profes-sionals in a few countries; however, men are under-repre-sented in the teaching profession across all Member States.
Gender segregation is viewed as one of the main factors underlying the gender pay gap across the sectors. Circu-larly, the gender pay gap also hampers the reduction of gender segregation. Differences in pay levels across sectors can not only motivate women to take up employment in men-dominated occupations, but can also discourage men from entering women-dominated occupations. Among those already working in the sectors under study, the un-adjusted gender pay gap is found to be lower within STEM than in EHW sectors, though there are large country and sub-sector differences. For example, in manufacturing and ICT men earned more than women in all EU Member States, whereas in waste management and remediation activities or construction women were observed to have higher aver-age pay than men in some Member States.
Following the request of the Estonian Presidency of the Council of the EU (2017), the present report explores the progress made between 2004 and 2015 in breaking gender segregation in education, training and the labour market in the EU. The analysis is based on existing and proposed new Beijing indicators on gender segregation in education, transition from education to employment and occupa-tional segregation. The report draws on a number of varied data sources, including Unesco-OECD-Eurostat (UOE), the European Labour Force Survey (LFS), Eurofound’s European Working Conditions Survey (EWCS) and the European Skills and Jobs Survey (ESJS) of the European Centre for the De-velopment of Vocational Training (Cedefop).

Introduction

Study and work in the EU: set apart by gender 15
IntroductionEIGE
IntroductionToday, women make up the majority of tertiary students in almost all EU Member States. They also constitute between a third and half of graduates within upper secondary vo-cational programmes across the EU. In the last decades, women’s participation in education has greatly increased, providing them with more opportunities in the labour mar-ket. There is an encouraging trend towards gender equal-ity in employment. Yet in spite of this, women’s and men’s engagement in certain occupations is still limited. Horizon-tal and vertical gender segregation prevails as a significant feature of the labour market. Horizontal segregation refers to the concentration of women or men in different sectors and occupations while vertical segregation refers to the concentration of women or men in different grades, levels of responsibility or positions (see EIGE’s Gender Equality Glossary and Thesaurus). Although gender segregation is often framed in terms of its negative effects on women’s opportunities, it has detrimental effects for men too.
Gender segregation determines, among other things, women’s and men’s status, prestige, working conditions, work environments, experiences and earnings (Charles and Grusky, 2004; Kreimer, 2004; Reskin and Bielby, 2005; Stein-metz, 2012; Burchell, Hardy, Rubery and Smith, 2014) and hence maintains and recreates gender hierarchy in society (Kreimer, 2004). However, segregation is not always consid-ered an exclusively negative phenomenon. For instance, higher segregation is also associated with higher employ-ment rates among women. It can act as a protector of women’s employment, for example via women’s concen-tration in the public service, which provides greater job se-curity (Burchell et al., 2014).
The segregated labour market restricts the career choices of women and men and affects the value (both in ideo-logical and economic terms) attached to their contribution (Sparreboom, 2014). In addition, gender segregation has economic effects as it is an important factor of labour mar-ket inefficiency and rigidity (Steinmetz, 2012; Sparreboom, 2014). For example, science, technology, engineering and mathematics (STEM) is one of the fastest-growing sectors in the EU. An analysis by the European Centre for Vocational Training (Cedefop) (2014) shows that demand for STEM pro-fessionals and associate professionals is expected to grow by 8 % between 2014 and 2025, while the average growth forecast for all occupations is 3 %. There is evidence of a skills shortage in this sector in spite of high unemployment rates in many Member States. The proportion of students choosing STEM is not increasing at EU level and vast under-representation of women in this sector persists (European Parliament, 2015a). On the other hand, the increasing reli-ance of the state and families on private markets to carry
out both care and non-care domestic services will lead to increasing demands for workers in the health, education and social welfare sectors (EHW), which have a vast under-representation of men.
Gender segregation hinders the full use of resources and slows down the adjustment to changes in the labour mar-ket. EIGE’s recent study on the economic benefits of gender equality in the EU shows that improving gender equality and closing the gender gap in STEM education can signifi-cantly boost the potential productive capacity and improve the long-term competitiveness of the EU economy (EIGE, 2017a). The study shows that closing gender gaps in STEM education would have a positive impact on employment, with total EU employment foreseen to rise from 850 000 to 1 200 000 jobs by 2050. This would imply an increase in EU GDP per capita from 0.7 % to 0.9 % by 2030 and from 2.2 % to 3 % by 2050. Gender segregation in education, training and the labour market has been addressed by a number of EU policies. The European Commission’s strategic en-gagement for gender equality 2016-2020 seeks to promote gender equality in all levels and types of education, includ-ing in relation to gendered subject choices and careers, in line with the priorities set out in the education and training 2020 (ET 2020) framework. This is seen as one of the key ac-tions to reduce potential gender gaps in income and pov-erty among women. The close link between education and the labour market is also addressed in the European Pact for Gender Equality 2011-2020, which aims to ‘eliminate gender stereotypes and promote gender equality at all levels of ed-ucation and training, as well as in working life, in order to re-duce gender segregation in the labour market’ (Council of the European Union, 2011). The recently proposed European pillar of social rights recognises that there is vast untapped potential in the EU in terms of participation in employment and in terms of productivity, which impedes growth and social cohesion. The European pillar of social rights recon-firms the EU’s commitment to foster gender equality in all areas, including participation in the labour market, condi-tions of employment and skills.
The EU’s commitment to the Beijing Platform for Action (BPfA) also marks an important step in recognising the need to advance gender equality in education, training and the economy. The BPfA seeks to eliminate occupational segregation, especially by promoting equal participation of women in highly skilled jobs and senior management positions and by stimulating the diversification of occupa-tional choices by both women and men (United Nations, 1995). A number of BPfA indicators on segregation in edu-cation, training and the labour market have been proposed by the German (2007), Slovenian (2008) and Belgian (2010)
Study and work in the EU: set apart by gender16
Introduction EIGE
Presidencies, which were endorsed by the Council of the European Union.
Following the request of the Estonian Presidency of the Council of the EU (2017), this report explores progress in overcoming educational and occupational gender segrega-tion in the EU. It focuses on highly gender-segregated study and employment fields, such as science, technology, engi-neering and mathematics or education, health and welfare. The research seeks to reveal which factors support or hin-der segregation in education and the labour market, and what policies are addressing these issues at EU and Mem-ber State levels. The report analyses the trends and cross-country differences in women’s and men’s subject choices in education and training, transition from education to the labour market and employment conditions in gender-seg-regated fields, including pay gaps. The analysis will support the monitoring of the implementation of the BPfA in the EU.
Chapter 1 provides a brief conceptualisation of gender seg-regation and its impact on gender equality. It also presents indicators on segregation developed within the framework of the BPfA in the EU and defines the scope of the report. Chapter 2 provides an overview of the EU policy framework addressing gender segregation in education, training and the labour market. Chapter 3 presents data analysis on prog-ress in overcoming segregation in education and training. Occupational pathways of graduates in highly gender-seg-regated study fields are discussed in Chapter 4. Chapter 5 reviews trends in occupational segregation. The gender pay gap in gender-segregated sectors is an important aspect of the analysis. The factors feeding into gender segregation are discussed in Chapter 6. The analysis is based on existing and new proposed indicators on gender segregation in ed-ucation, transition from education to employment and oc-cupational segregation. A list of new indicators is presented in Chapter 1 and Annex V.
1. Defining gender segregation in education, training and the labour market

Study and work in the EU: set apart by gender 19
1. Defining gender segregation in education, training and the labour marketEIGE
1� Defining gender segregation in education, training and the labour market
1.1. What gender segregation means
Gender segregation is a deeply entrenched feature of edu-cation systems and occupations across the EU. It manifests itself in women’s and men’s different patterns of participa-tion in the labour market, public and political life, unpaid domestic work and caring, and young women’s and men’s educational choices. As such, it refers to the concentration of one gender in certain fields of education or occupations, which narrows down life choices, education and employ-ment options, leads to unequal pay, further reinforces gen-der stereotypes and limits access to certain jobs while also perpetuating unequal gender power relations in the public and private spheres. Gender segregation has detrimental effects on both women’s and men’s chances in the labour market and society in general.
In recent decades, women have made tremendous inroads into higher education and the labour market, which marks a notable advancement towards gender equality. A parallel development of gender-divided labour markets, however, highlights the need for further progress. Since women’s en-try into the formal employment sector, a series of occupa-tions have been tacitly denoted as ‘fit for women’ or ‘fit for men’. Though women are working in all occupations that formerly were ‘men-only’, their share within some occupa-tions is still minor, e.g. as construction workers, agricultural operators, machinery mechanics, etc. Professions in health-care, law and human resources are examples of higher-level occupations in which women’s presence has greatly increased. A number of jobs are still commonly considered as ‘women-only’, including pre-primary education, nursing or midwifery, secretarial and personal care work, domestic and related help, etc. Men’s engagement in these sectors is very limited. Against this background, gender-segregated education systems and workplaces remain a major issue in moving towards more inclusive and innovative societies.
The understanding of the gender segregation phenom-enon has evolved largely due to a number of positive de-velopments in recent decades (Tinklin et al., 2005). Gender equality legislation has been enforced, men’s and in par-ticular women’s participation in education has increased and educational levels have advanced, physical attrib-utes have diminished in importance as a proxy for labour force productivity and attitudes towards labour market
participation and family roles (i.e. equal sharing of childcare) have changed. In parallel, the way gender segregation in education, training and the labour market is conceptualised and approached by researchers and policymakers has also changed. For example, gender segregation in education was initially explained in terms of boys’ and girls’ aptitudes for certain subjects and the lower academic performance of girls (Eccles, et al., 1990). Since the 1990s, more compre-hensive explanations have occurred, with causal links be-ing made to a sense of belonging, to what remained highly vigorous stereotypes on gender roles, to gendered notions of certain fields (Kanny, Sax and Riggers-Pieh, 2014), and to related cultural values (Yazilitas, Saharso, de Vries and Sven-sson, 2016), etc.
Various types of gender segregation coexist. Most often gender segregation is viewed in terms of vertical (also re-ferred to as hierarchical) and horizontal divides. Horizontal segregation occurs when women and men study different disciplines or work in different sectors or types of occupa-tions. It is understood as the under- or over-representation of women or men in study fields, occupations or sectors. This contrasts with vertical segregation, which occurs as a result of women and men undertaking education at differ-ent levels or being under-represented in the jobs located at the top of a hierarchy of ‘desirable’ attributes such as in-come and prestige (see EIGE’s Gender Equality Glossary and Thesaurus). With some relevant exceptions, the focus of this report is on horizontal gender segregation in education, training and the labour market.
The degree of gender segregation varies across study and occupational fields. The theoretical equality benchmark would imply equal numbers of women and men in rel-evant participation statistics (or no gender gap). In practi-cal terms, a certain gender gap is accepted. As noted by Burchell, Hardy, Rubery and Smith (2014), ‘gender-neutral’ or ‘mixed’ occupations are those where the proportions of women and men are between 40 % and 60 %. In parallel, occupations are considered to be dominated by one gen-der if more than 60 % of the employees in that occupation are of one gender. Other benchmarks are also used in in-ternational practice, with the UN, for example, referring to the range of 45 % to 55 % as gender-equal participation in study or employment.
In addition to horizontal and vertical gender segregation as overarching concepts, a number of more specific manifes-tations of gender segregation are recognised, such as the
Study and work in the EU: set apart by gender20
1. Defining gender segregation in education, training and the labour market EIGE
glass ceiling, the leaky pipeline, the sticky floor, implicit bias or the gender pay gap.
The ‘glass ceiling’ refers to artificial impediments and invis-ible barriers that act against women’s access to top deci-sion-making and managerial positions in an organisation, whether public or private and in whatever domain. The term ‘glass’ is used because these impediments are appar-ently invisible and are usually linked to the maintenance of the status quo in organisations, as opposed to transparent and equal career advancement opportunities for women and men within organisations (see EIGE’s Gender Equality Glossary and Thesaurus).
The phenomenon known as the ‘leaky pipeline’ results in an overwhelmingly men-dominated environment at the highest hierarchical levels, as women progressively aban-don the chosen fields of work, not least due to a lack of progression in their careers (see, for example, EIGE, 2016a). In contrast, the ‘sticky floor’ is used as a metaphor to point to a discriminatory employment pattern that keeps workers, mainly women, in the lower ranks of the job scale, with low mobility and invisible barriers to career advancement (see EIGE’s Gender Equality Glossary and Thesaurus). ‘Implicit bias’ refers to a lack of awareness of how the surrounding environment and processes can be discriminatory, even if the very best intentions on fairness and equality are in place. For example, women can be significantly disadvan-taged by a gendered concept of ‘merit’, especially one that values a full-time, uninterrupted career trajectory or re-search success.
The gender pay gap could be viewed as a monetary ‘fa-cade’ of gender segregation (Evans, 2002). It reinforces the trend that women and men continue to work in different jobs and sectors and within those in lower-valued and low-er-paid occupations and positions (such as health, educa-tion, and public administration). The problem of the gender pay gap persists due to differences in the labour market participation of men and women. Reasons include (but are not limited to) vertical and horizontal segregation, under-valuation of women’s work and an uneven distribution of caring responsibilities. As summarised by the Council con-clusions (2010), the causes underlying the gender pay gap are numerous and complex, reflecting discrimination on the grounds of gender as well as inequalities linked to edu-cation and the labour market, such as horizontal and verti-cal segregation in employment and in education and vo-cational training (see Council of the European Union, 2010).
Women’s and men’s concentration in different occupa-tions, positions and sectors makes the comparison be-tween women and men workers difficult if not impossible, and allows differences in remuneration between so-called women’s and men’s occupations to be easily maintained (Kreimer, 2004). Overall, the gender pay gap at the individ-ual level and the gender pay gap across highly segregated
workplaces reinforce gendered segregation processes in the labour market. On the one hand, it could be argued that higher wage prospects could motivate women to take up employment in men-dominated occupations. On the other hand, it could act as an important hindering factor for men’s motivation to move into and remain in occupations dominated by women (i.e. Rolfe, 2005).
Gender segregation forms can change over time, with new forms emerging or being identified. For example, evidence suggests that women have less access to core and innova-tive technical roles if they work in science and technology-related sectors. As a result, women are found to be more under-represented in technology patenting than they are even in the technology workforce as a whole (Ash-craft, McLain and Eger, 2016). Similarly, emerging research suggests women have fewer challenging and rewarding work experiences than men, which negatively influences women’s career progression (De Pater et al., 2010). Impacts of the uneven allocation of tasks relevant to advancing in an organisation between women and men (Babcock et al., 2017) also go hand in hand with pay differentials, especially in terms of bonuses paid to reward extra efforts or to recog-nise challenging tasks or work under intense circumstances. In parallel, the gender bonus gap is found to be among the largest pay gaps across different remuneration sources, especially if working in sales and financial services’ jobs — both in terms of the share of women and men receiving them and in terms of the generosity of bonuses (Morgan McKinley, 2016).
Even small imbalances add up to major disadvantages over time. It has been demonstrated with computer simulations that a tiny bias in favour of promoting men throughout ca-reer progression would lead to top-level positions domin-ated by men (Martell, Lane and Emrich, 1996). Similarly, in real life, numerous explicit and implicit gender barriers re-sult in strongly gender-segregated education and employ-ment, with due pay differentials.
1.2. Why segregation matters
Gender segregation in education and the labour market creates and perpetuates gender inequalities in and beyond the labour market. It narrows women’s and men’s educa-tion and employment choices by maintaining and reinforc-ing stereotypes, limiting women’s access to a number of (higher-level) jobs and feeding into the undervaluation of women’s work and associated skills and competences. It also relates to both women’s and men’s ability to better bal-ance work and private life. Despite de jure gender-neutral policy support, segregation in the labour market implies that men are likely to be working in better-paid and pri-vate sector jobs, and in organisational cultures that are less ‘sympathetic to leave for care reasons’ (Lewis, 2009). This
Study and work in the EU: set apart by gender 21
1. Defining gender segregation in education, training and the labour marketEIGE
discourages men from taking time off that is needed and women from participating in quality employment.
Gender segregation leads to a higher poverty rate and less economic independence among women. Gender segrega-tion implies that women are in the majority in sectors that are generally characterised by low pay (i.e. Smith, 2010), few options for upskilling and often informal working arrange-ments. According to EIGE’s research on gender, skills and pre-carious work in the EU (2017b), 27 % of women in comparison to 15 % of men are either very low paid, work very few hours per week or have low job security. In addition, in many fami-lies with children, men work full-time, whereas women work part-time (Lewis, 2009). This affects both the current and the future gender gap in earnings (i.e. pensions) and results in women’s lower economic independence throughout the life course. It also means that unless real progress in reducing gender segregation is made, no significant poverty reduc-tion in the EU can be achieved. The link between gender segregation and poverty reduction must be better account-ed for in the design and objectives of relevant policy initia-tives, including the Europe 2020 strategy targets.
Gender segregation also acts as a barrier to increasing women’s labour market participation. Given the overall low-er earnings and career prospects of women, they face more pressure than men, who are still often viewed as primary earners, to fully or partially withdraw from the labour mar-ket, in order to fulfil caring duties. With 80 % of all caregivers being women (European Parliament, 2016), labour market participation of women is affected by numerous challenges of combining work and care responsibilities. Overall, in-creasing labour market participation among women tends to go hand in hand with widespread gender segregation in the labour market, as the major share of jobs occupied by women are in specific (care) sectors and tend to be lower-remunerated. Thus, the underlying causal factors of gender segregation in principle remain intact even when women’s labour market participation increases.
Gender segregation is increasingly recognised as an impor-tant factor in labour market inefficiency and rigidity. Seg-regation excludes a substantial share of the labour force from accessing numerous occupations; therefore, human resources are wasted and reacting to changes in the labour market (e.g. labour and skill shortages) takes longer (Bettio and Verashchagina, 2009b; Steinmetz, 2012b). Recent evi-dence by Cedefop (2016) shows that the top five occupa-tions across the EU with critical shortages and a mismatch of skills are highly gender segregated: ICT professionals; medi-cal doctors; STEM professionals; nurses and midwifes; and teachers. At the other extreme, extensive skills surpluses are recognised in a number of other highly gender-segregat-ed occupations, including workers in building and related trades, manufacturing and transport workers, and plant and machine operators. The challenges posed by unmet or surplus skills within these occupations are highly important
to national economies and their strategic development sectors, as well as for overall education and training of the labour force. Gender segregation partially underlies those skills shortages and surpluses and thus has large, though still often unaccounted for, effects for numerous policy initiatives, including those relating to economic growth, re-ducing long-term unemployment and the upskilling of the population.
Gender segregation not only impacts labour market effi-ciency but also inhibits inclusive and innovative economic growth. The digital single market initiative of the EU, for example, aims at improving productivity and economic growth through the wide diffusion and adoption of ICT (European Commission, 2016a). Large shortages of ICT and STEM professionals already exist and are forecast to worsen in the future. The EU urgently needs human capital in fast-growing areas, such as STEM, where all talent counts and large skills shortages exist (see The Royal Society of Edin-burgh, 2012). It is also increasingly recognised that, in addi-tion to bridging the supply gap in the e-skilled workforce, e-leadership skills — which are necessary to initiate and guide ICT-related innovation at all levels of enterprise — are particularly lacking and will take years to develop (European Commission, 2015a). Horizontal and vertical gender segre-gation acts as a profound barrier to responding to these challenges. As a European Commission (2012) report notes, ‘the low numbers of women in decision-making positions throughout the science and technology system is a waste of talent that European economies cannot afford’. On the other hand, EIGE’s study on the economic benefits of gen-der equality (2017a) shows that reducing gender segrega-tion in STEM education alone could lead to an additional 1.2 million jobs in the EU. These jobs are estimated to occur mostly in the long term, however, as employment is likely to be affected only after new women STEM graduates choose to work in the STEM fields. In parallel, higher productivity associated with these STEM jobs is likely to result in higher wages for newly graduated women — affecting the gender pay gap as well as income and living standards of women, men, children and their extended families (European Parlia-ment, 2015a).
A higher participation rate of women in science and tech-nology-related areas would bring greater opportunities for more sustainable science and growth of the sustainable and ‘green’ economy. For example, the energy and trans-port sectors, which determine climate change policies to a great extent, are among the sectors still predominantly occupied by men. As shown by EIGE’s research (EIGE, 2012), more gender-balanced participation in the latter sectors is expected to improve the overall responsiveness of climate change policies to the multifaceted needs of society. Fur-thermore, as observed by the Organisation for Economic Cooperation and Development (OECD) (2014), horizontal and vertical segregation in areas such as STEM implies that women are practically excluded from various sustainable
Study and work in the EU: set apart by gender22
1. Defining gender segregation in education, training and the labour market EIGE
economy developments, including upcoming ‘green’ em-ployment opportunities. As with climate change policies, gender segregation is a factor that impedes the faster and more balanced development of the ‘green’ economy.
Gender segregation needs to be better understood in or-der to find the most suitable pathways to tackle the issue. In the historical context of men’s dominance in the formal la-bour market, women-dominated sectors are still viewed as a stepping stone for women’s entry into the labour market. Over several decades, up to the present, increased women’s employment rates go hand in hand with increased gender segregation. The occurrence and societal acceptance of ‘jobs for women’ enabled and protected women’s overall participation in the labour market. One example is the on-going high concentration of women in the public service sector, which has greater job security and is associated with a more predictable working environment — something that is in high demand in fostering work–family balance (Burchell et al., 2014, p. 29). Although it is important to rec-ognise that our societies have achieved progress in gender equality (1), gender-segregated workplaces should be tack-led with due care so as to address many women’s poor op-portunities in the labour market.
A better understanding of gender segregation, as well as its effects and underlying causes, could enable societies to more quickly tap into the necessary diversity of skills. According to Cedefop (2016), a reduction observed in the number of STEM graduates is partially due to the lack of attractiveness of the study area, especially to women. The growing demand for STEM professionals, on the other hand, goes hand in hand with an increasing need not only for technological skills, but also for highly developed ‘soft’ skills such as foreign languages, management, communication, problem-solving or project management. Recognising the vital need for diversity in the STEM sector, in May 2017 the European Commission called for closer collaboration across different education sectors and business/public sector em-ployers in order to promote and modernise the STEM cur-riculum through more multidisciplinary programmes and a greater focus on science, technology, engineering, (arts) and mathematics (STE(A)M) (European Commission, 2017a). Here, the evolution from STEM to STE(A)M reflects recogni-tion of the important interaction between STEM and the arts as a driving force to boost innovation and creativity within the STEM sectors.
It should also be recognised that the impacts of gender segregation, and thus the ways to go about tackling them, are highly country specific. For example,there is empirical evidence that women’s working hours depend very much on the specific country’s family policies: women work more
when there are easily available childcare places and less if family allowances are high (Schlenker, 2015). This points to ample space for diverse public policy tools (i.e. social secu-rity, labour market and economic tools) to tackle stereo-typical views on gender roles and gender segregation simultaneously.
1.3. Beijing Platform for Action: challenges in monitoring gender segregation
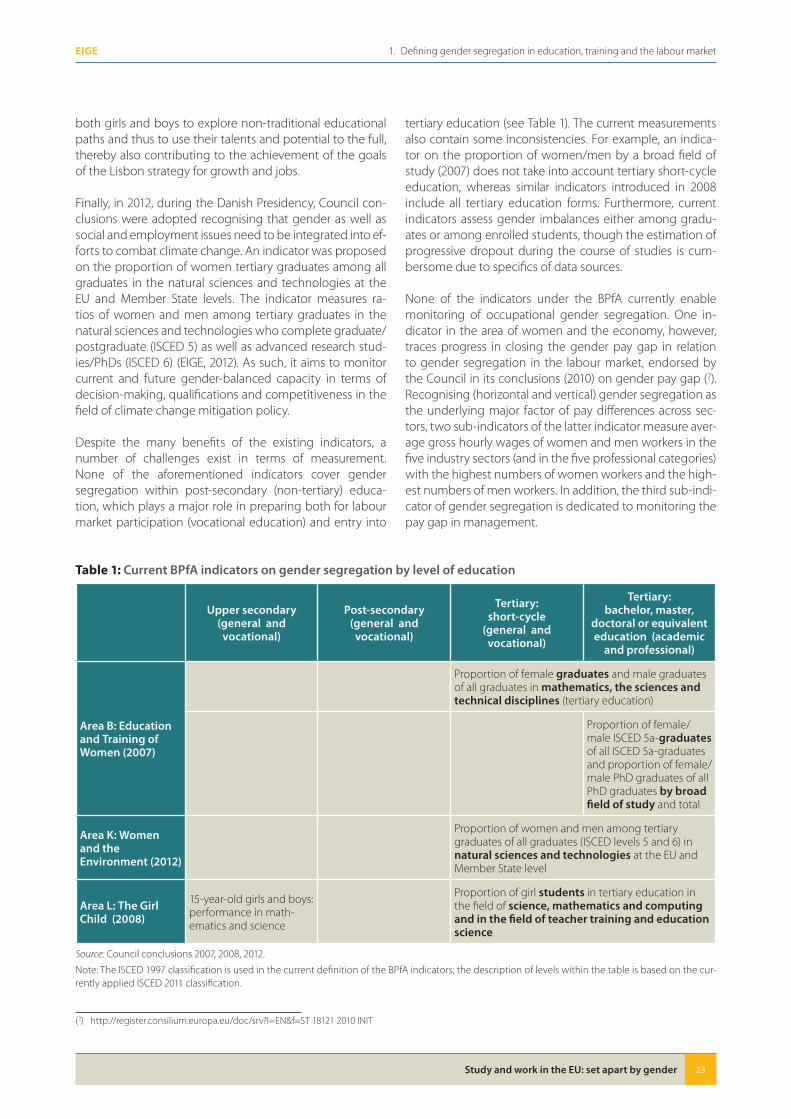
Four indicators under the BPfA currently measure progress in reducing gender segregation in education and training across the EU, as agreed by different Council conclusions (see Table 1).
In 2007 the German Presidency chose to work on the educa-tion and training of women and proposed a set of indicators, including two indicators on subject choices in tertiary edu-cation (see Council of the European Union, 2007). The indica-tor on the proportion of women and men graduates among all graduates in mathematics, the sciences and technical disciplines (tertiary education) assesses the gender ratios in fields of studies considered as key areas for realising the Lisbon strategy for growth and jobs. It thus serves to evalu-ate progress towards reducing the unequal representation of women and men in mathematics, science and technology.
The indicators on the proportion of women and men ISCED 5A graduates among all ISCED 5A graduates and the pro-portion of women and men PhD graduates among all PhD graduates by broad field of study and total number both examine the gender ratios among highly qualified gradu-ates as they reach the point of admission to advanced research programmes or entry into employment, specifi-cally research and development. Gender equality at the ad-vanced research level is seen as one of the prerequisites for an innovative and competitive research and development environment in the EU.
In 2008 the Slovenian Presidency proposed an indicator to monitor gender imbalances in educational achievements under the area of the girl child (see Council of the European Union, 2008). Two sub-indicators examine the performance of 15-year-old students in mathematics and science and the proportion of girl students in tertiary education in the fields of science, mathematics and computing and in teacher training and education science. The indicator aims to assess the potential impact of policies and measures to encourage
(1) The results of the Gender Equality Index 2017, which assesses gender inequalities in domains such as work, money, knowledge, time, power, health, inter-secting inequalities and violence since 2005, show that the EU moves at a snail’s pace towards gender equality. See: http://eige.europa.eu/gender-statistics/gender-equality-index
Study and work in the EU: set apart by gender 23
1. Defining gender segregation in education, training and the labour marketEIGE
both girls and boys to explore non-traditional educational paths and thus to use their talents and potential to the full, thereby also contributing to the achievement of the goals of the Lisbon strategy for growth and jobs.
Finally, in 2012, during the Danish Presidency, Council con-clusions were adopted recognising that gender as well as social and employment issues need to be integrated into ef-forts to combat climate change. An indicator was proposed on the proportion of women tertiary graduates among all graduates in the natural sciences and technologies at the EU and Member State levels. The indicator measures ra-tios of women and men among tertiary graduates in the natural sciences and technologies who complete graduate/postgraduate (ISCED 5) as well as advanced research stud-ies/PhDs (ISCED 6) (EIGE, 2012). As such, it aims to monitor current and future gender-balanced capacity in terms of decision-making, qualifications and competitiveness in the field of climate change mitigation policy.
Despite the many benefits of the existing indicators, a number of challenges exist in terms of measurement. None of the aforementioned indicators cover gender segregation within post-secondary (non-tertiary) educa-tion, which plays a major role in preparing both for labour market participation (vocational education) and entry into
tertiary education (see Table 1). The current measurements also contain some inconsistencies. For example, an indica-tor on the proportion of women/men by a broad field of study (2007) does not take into account tertiary short-cycle education, whereas similar indicators introduced in 2008 include all tertiary education forms. Furthermore, current indicators assess gender imbalances either among gradu-ates or among enrolled students, though the estimation of progressive dropout during the course of studies is cum-bersome due to specifics of data sources.
None of the indicators under the BPfA currently enable monitoring of occupational gender segregation. One in-dicator in the area of women and the economy, however, traces progress in closing the gender pay gap in relation to gender segregation in the labour market, endorsed by the Council in its conclusions (2010) on gender pay gap (2). Recognising (horizontal and vertical) gender segregation as the underlying major factor of pay differences across sec-tors, two sub-indicators of the latter indicator measure aver-age gross hourly wages of women and men workers in the five industry sectors (and in the five professional categories) with the highest numbers of women workers and the high-est numbers of men workers. In addition, the third sub-indi-cator of gender segregation is dedicated to monitoring the pay gap in management.
Table 1: Current BPfA indicators on gender segregation by level of education
Upper secondary (general and
vocational)
Post-secondary (general and
vocational)
Tertiary: short-cycle
(general and vocational)
Tertiary: bachelor, master,
doctoral or equivalent education (academic
and professional)
Area B: Education and Training of Women (2007)
Proportion of female graduates and male graduates of all graduates in mathematics, the sciences and technical disciplines (tertiary education)
Proportion of female/male ISCED 5a-graduates of all ISCED 5a-graduates and proportion of female/male PhD graduates of all PhD graduates by broad field of study and total
Area K: Women and the Environment (2012)
Proportion of women and men among tertiary graduates of all graduates (ISCED levels 5 and 6) in natural sciences and technologies at the EU and Member State level
Area L: The Girl Child (2008)
15-year-old girls and boys: performance in math-ematics and science
Proportion of girl students in tertiary education in the field of science, mathematics and computing and in the field of teacher training and education science
Source: Council conclusions 2007, 2008, 2012.
Note: The ISCED 1997 classification is used in the current definition of the BPfA indicators; the description of levels within the table is based on the cur-rently applied ISCED 2011 classification.
(2) http://register.consilium.europa.eu/doc/srv?l=EN&f=ST 18121 2010 INIT
Study and work in the EU: set apart by gender24
1. Defining gender segregation in education, training and the labour market EIGE
The new indicators on educational and occupational gen-der segregation proposed by EIGE are presented in Chap-ter 7 and Annex V.
1.4. Focus of this report
This report focuses on the fields of education, training and occupations, which are highly gender segregated (dominat-ed by one gender). Particular focus is placed on the fields of STEM and on EHW. The analysis refers to education and train-ing in tertiary education studies at the level of ISCED 5-8 (from short-cycle tertiary education to doctoral or an equivalent level of education) and to vocational education and training at ISCED levels 35-45 (upper secondary and post-secondary non-tertiary vocational education). Graduates from upper- and post-secondary vocational education and training are important providers of EHW and in particular STEM skills (Ce-defop, 2014). Close to 60 % of STEM students across the se-lected ISCED levels graduated from the vocational education level (2013-2015) at the EU level, whereas approximately one third (34 %) of EHW students graduated from the vocational education level. Where relevant, the current BPfA indicators are used to present the current situation and major trends.
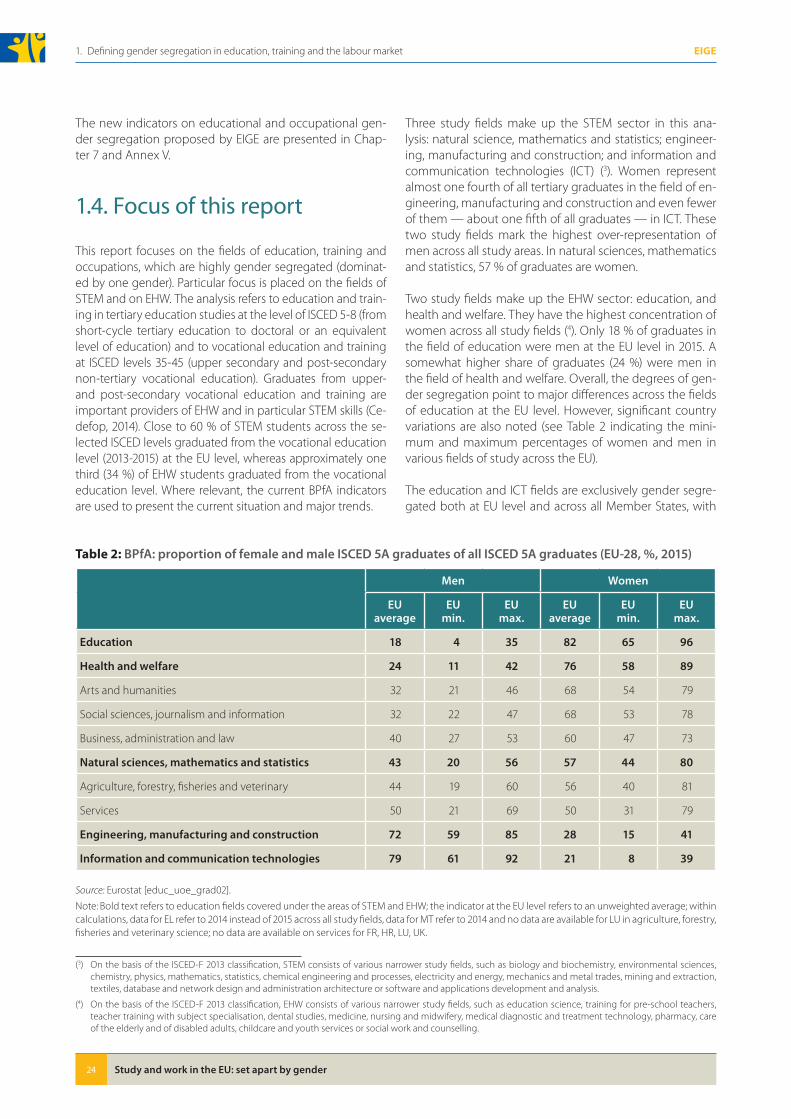
Three study fields make up the STEM sector in this ana-lysis: natural science, mathematics and statistics; engineer-ing, manufacturing and construction; and information and communication technologies (ICT) (3). Women represent almost one fourth of all tertiary graduates in the field of en-gineering, manufacturing and construction and even fewer of them — about one fifth of all graduates — in ICT. These two study fields mark the highest over-representation of men across all study areas. In natural sciences, mathematics and statistics, 57 % of graduates are women.
Two study fields make up the EHW sector: education, and health and welfare. They have the highest concentration of women across all study fields (4). Only 18 % of graduates in the field of education were men at the EU level in 2015. A somewhat higher share of graduates (24 %) were men in the field of health and welfare. Overall, the degrees of gen-der segregation point to major differences across the fields of education at the EU level. However, significant country variations are also noted (see Table 2 indicating the mini-mum and maximum percentages of women and men in various fields of study across the EU).
The education and ICT fields are exclusively gender segre-gated both at EU level and across all Member States, with
Table 2: BPfA: proportion of female and male ISCED 5A graduates of all ISCED 5A graduates (EU-28, %, 2015)
Men Women
EU average
EU min�
EU max�
EU average
EU min�
EU max�
Education 18 4 35 82 65 96
Health and welfare 24 11 42 76 58 89
Arts and humanities 32 21 46 68 54 79
Social sciences, journalism and information 32 22 47 68 53 78
Business, administration and law 40 27 53 60 47 73
Natural sciences, mathematics and statistics 43 20 56 57 44 80
Agriculture, forestry, fisheries and veterinary 44 19 60 56 40 81
Services 50 21 69 50 31 79
Engineering, manufacturing and construction 72 59 85 28 15 41
Information and communication technologies 79 61 92 21 8 39
Source: Eurostat [educ_uoe_grad02].
Note: Bold text refers to education fields covered under the areas of STEM and EHW; the indicator at the EU level refers to an unweighted average; within calculations, data for EL refer to 2014 instead of 2015 across all study fields, data for MT refer to 2014 and no data are available for LU in agriculture, forestry, fisheries and veterinary science; no data are available on services for FR, HR, LU, UK.
(3) On the basis of the ISCED-F 2013 classification, STEM consists of various narrower study fields, such as biology and biochemistry, environmental sciences, chemistry, physics, mathematics, statistics, chemical engineering and processes, electricity and energy, mechanics and metal trades, mining and extraction, textiles, database and network design and administration architecture or software and applications development and analysis.
(4) On the basis of the ISCED-F 2013 classification, EHW consists of various narrower study fields, such as education science, training for pre-school teachers, teacher training with subject specialisation, dental studies, medicine, nursing and midwifery, medical diagnostic and treatment technology, pharmacy, care of the elderly and of disabled adults, childcare and youth services or social work and counselling.
Study and work in the EU: set apart by gender 25
1. Defining gender segregation in education, training and the labour marketEIGE
no country yet achieving a gender-equal share of gradu-ates. More varied country situations are observed in other fields of study, with at least one country having gender bal-ance in the field of engineering, manufacturing and con-struction, and one country achieving it in the field of health and welfare.
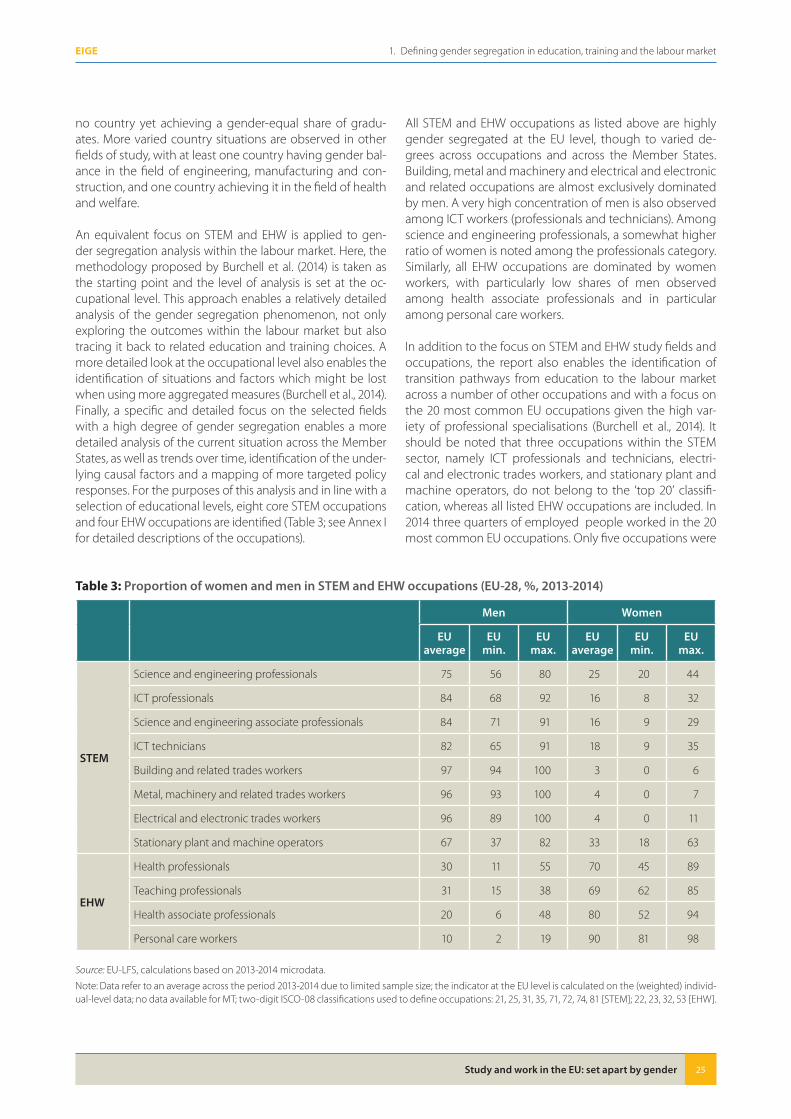
An equivalent focus on STEM and EHW is applied to gen-der segregation analysis within the labour market. Here, the methodology proposed by Burchell et al. (2014) is taken as the starting point and the level of analysis is set at the oc-cupational level. This approach enables a relatively detailed analysis of the gender segregation phenomenon, not only exploring the outcomes within the labour market but also tracing it back to related education and training choices. A more detailed look at the occupational level also enables the identification of situations and factors which might be lost when using more aggregated measures (Burchell et al., 2014). Finally, a specific and detailed focus on the selected fields with a high degree of gender segregation enables a more detailed analysis of the current situation across the Member States, as well as trends over time, identification of the under-lying causal factors and a mapping of more targeted policy responses. For the purposes of this analysis and in line with a selection of educational levels, eight core STEM occupations and four EHW occupations are identified (Table 3; see Annex I for detailed descriptions of the occupations).
All STEM and EHW occupations as listed above are highly gender segregated at the EU level, though to varied de-grees across occupations and across the Member States. Building, metal and machinery and electrical and electronic and related occupations are almost exclusively dominated by men. A very high concentration of men is also observed among ICT workers (professionals and technicians). Among science and engineering professionals, a somewhat higher ratio of women is noted among the professionals category. Similarly, all EHW occupations are dominated by women workers, with particularly low shares of men observed among health associate professionals and in particular among personal care workers.
In addition to the focus on STEM and EHW study fields and occupations, the report also enables the identification of transition pathways from education to the labour market across a number of other occupations and with a focus on the 20 most common EU occupations given the high var-iety of professional specialisations (Burchell et al., 2014). It should be noted that three occupations within the STEM sector, namely ICT professionals and technicians, electri-cal and electronic trades workers, and stationary plant and machine operators, do not belong to the ‘top 20’ classifi-cation, whereas all listed EHW occupations are included. In 2014 three quarters of employed people worked in the 20 most common EU occupations. Only five occupations were
Table 3: Proportion of women and men in STEM and EHW occupations (EU-28, %, 2013-2014)
Men Women
EU average
EU min�
EU max�
EU average
EU min�
EU max�
STEM
Science and engineering professionals 75 56 80 25 20 44
ICT professionals 84 68 92 16 8 32
Science and engineering associate professionals 84 71 91 16 9 29
ICT technicians 82 65 91 18 9 35
Building and related trades workers 97 94 100 3 0 6
Metal, machinery and related trades workers 96 93 100 4 0 7
Electrical and electronic trades workers 96 89 100 4 0 11
Stationary plant and machine operators 67 37 82 33 18 63
EHW
Health professionals 30 11 55 70 45 89
Teaching professionals 31 15 38 69 62 85
Health associate professionals 20 6 48 80 52 94
Personal care workers 10 2 19 90 81 98
Source: EU-LFS, calculations based on 2013-2014 microdata.
Note: Data refer to an average across the period 2013-2014 due to limited sample size; the indicator at the EU level is calculated on the (weighted) individ-ual-level data; no data available for MT; two-digit ISCO-08 classifications used to define occupations: 21, 25, 31, 35, 71, 72, 74, 81 [STEM]; 22, 23, 32, 53 [EHW].
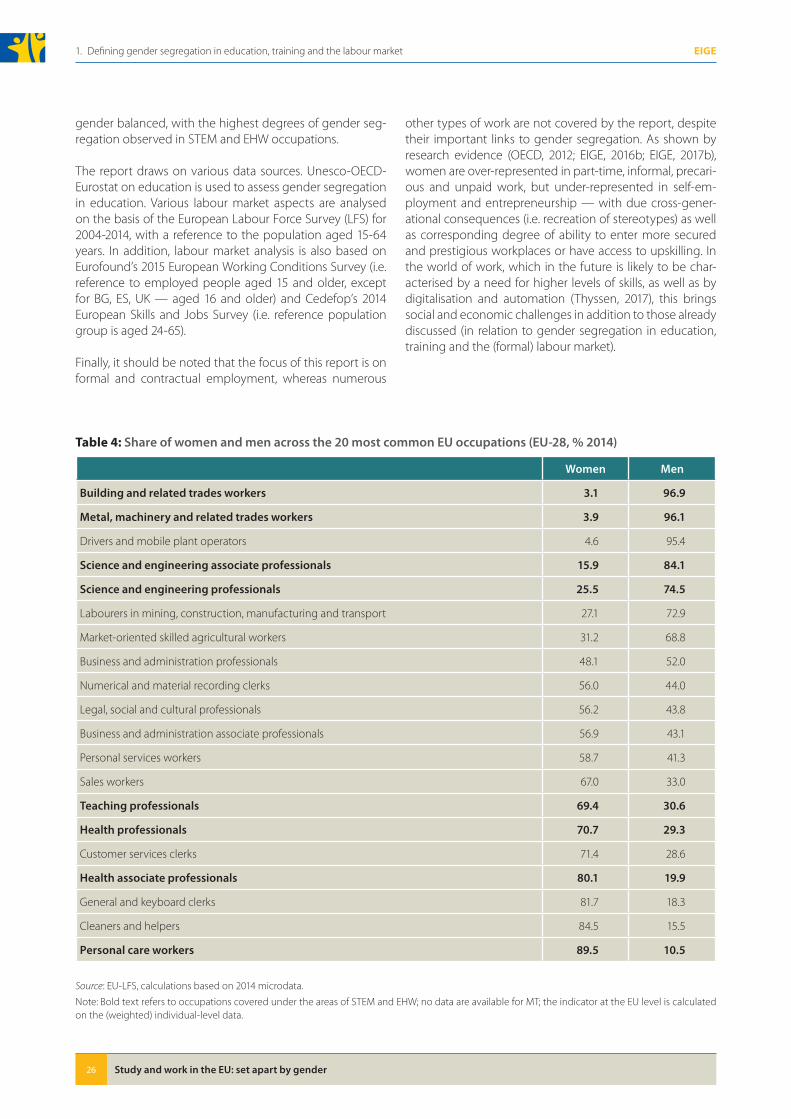
Study and work in the EU: set apart by gender26
1. Defining gender segregation in education, training and the labour market EIGE
gender balanced, with the highest degrees of gender seg-regation observed in STEM and EHW occupations.
The report draws on various data sources. Unesco-OECD-Eurostat on education is used to assess gender segregation in education. Various labour market aspects are analysed on the basis of the European Labour Force Survey (LFS) for 2004-2014, with a reference to the population aged 15-64 years. In addition, labour market analysis is also based on Eurofound’s 2015 European Working Conditions Survey (i.e. reference to employed people aged 15 and older, except for BG, ES, UK — aged 16 and older) and Cedefop’s 2014 European Skills and Jobs Survey (i.e. reference population group is aged 24-65).
Finally, it should be noted that the focus of this report is on formal and contractual employment, whereas numerous
other types of work are not covered by the report, despite their important links to gender segregation. As shown by research evidence (OECD, 2012; EIGE, 2016b; EIGE, 2017b), women are over-represented in part-time, informal, precari-ous and unpaid work, but under-represented in self-em-ployment and entrepreneurship — with due cross-gener-ational consequences (i.e. recreation of stereotypes) as well as corresponding degree of ability to enter more secured and prestigious workplaces or have access to upskilling. In the world of work, which in the future is likely to be char-acterised by a need for higher levels of skills, as well as by digitalisation and automation (Thyssen, 2017), this brings social and economic challenges in addition to those already discussed (in relation to gender segregation in education, training and the (formal) labour market).
Table 4: Share of women and men across the 20 most common EU occupations (EU-28, % 2014)
Women Men
Building and related trades workers 3�1 96�9
Metal, machinery and related trades workers 3�9 96�1
Drivers and mobile plant operators 4.6 95.4
Science and engineering associate professionals 15�9 84�1
Science and engineering professionals 25�5 74�5
Labourers in mining, construction, manufacturing and transport 27.1 72.9
Market-oriented skilled agricultural workers 31.2 68.8
Business and administration professionals 48.1 52.0
Numerical and material recording clerks 56.0 44.0
Legal, social and cultural professionals 56.2 43.8
Business and administration associate professionals 56.9 43.1
Personal services workers 58.7 41.3
Sales workers 67.0 33.0
Teaching professionals 69�4 30�6
Health professionals 70�7 29�3
Customer services clerks 71.4 28.6
Health associate professionals 80�1 19�9
General and keyboard clerks 81.7 18.3
Cleaners and helpers 84.5 15.5
Personal care workers 89�5 10�5
Source: EU-LFS, calculations based on 2014 microdata.
Note: Bold text refers to occupations covered under the areas of STEM and EHW; no data are available for MT; the indicator at the EU level is calculated on the (weighted) individual-level data.

2. Policy context

Study and work in the EU: set apart by gender 29
2. Policy contextEIGE
2� Policy context
Gender segregation in education, training and the labour market is a complex issue involving a mixture of economic and sociocultural factors and policies. It cuts across different policy domains and concerns many groups of stakeholders. While competence concerning the content and organisa-tion of education and training systems lies with the Mem-ber States, a wide range of European initiatives have been pursued to tackle gender segregation.
2.1. Combating gender segregation in education and training policy
The ‘Education and training 2020’ (ET 2020) strategic framework for European cooperation in education and training is the main instrument for the exchange of infor-mation and experience on issues common to the education and training systems of the Member States (Lisbon Treaty, Articles 165 and 166). It provides a forum for exchanges of good practices, mutual learning, advice and support for policy reforms in Member States. In the 2015 joint report of the Council and the Commission on progress in the im-plementation of ET 2020, the Commission and the Member States set new priorities for 2020 that include tackling the gender gap in education and promoting more gender-balanced choices in education (see European Commission, 2015c). The gender equality dimension is integrated in the relevant European funding programmes, in particular Eras-mus + and the EU funding programme for education, train-ing, youth and sport.
In the Paris Declaration of March 2015 on promoting citi-zenship and the common values of freedom, tolerance and non-discrimination through education, EU education minis-ters and the Commissioner for Education agreed to strength-en their actions in education with a view to promoting gen-der equality, among other issues. In this context, promoting gender equality is embedded within a wider framework of fundamental values, tolerance and citizenship. These two policy-steering documents provide a new mandate to the Commission for action in the area of education and training.
The Commission supports the Member States in delivering on the Paris Declaration and on the implementation of the provisions of the 2015 joint report. As part of the ET 2020 strategic framework and in order to implement the open method of coordination in education and training, coopera-tion between the Commission and Member States is organ-ised in the form of working groups (2016-2018). These will
identify and analyse pertinent examples of policies within the EU so as to draw common principles and factors for challenges or success that are transferable to other Mem-ber States. The Working Group on Promoting Citizenship and the Common Values of Freedom, Tolerance and Non-Discrimination through Education and the Working Group on the Modernisation of Higher Education will deal, inter alia, with social inclusion and gender gaps in education.
2.2. Combating gender segregation in employment
The European Union has regulatory power in the area of employment policy. It has issued a number of legal acts that have implications for combating segregation.
At policy level, the Europe 2020 strategy is the EU’s main strategic document for growth and jobs for the current decade. It emphasises smart, sustainable and inclusive growth as a way to overcome the structural weaknesses in Europe’s economy, improve its competitiveness and pro-ductivity and underpin a sustainable social market econ-omy. The strategy sets out the headline targets for educa-tion, research and innovation and employment. The Europe 2020 strategy sets a target of 75 % employment for women and men aged 20-64. This implies reinforcing edu-cation and training for women, particularly in sectors where they are under-represented. Another objective of the Eu-rope 2020 strategy is to ensure that at least 40 % of 30-34-year-olds complete tertiary-level education.
Gender segregation in employment is a major factor hin-dering the stimulation of more competitive, sustainable and inclusive growth. For example, the evidence of persist-ing skills shortages in STEM fields in spite of high unem-ployment levels in many Member States shows that there is a vast pool of untapped potential, as well as a waste of resources and investment in human capital. A sufficient labour supply in STEM, one of the fastest-growing sectors in the EU, is an essential precondition for implementing the European agenda for growth and jobs (European Parlia-ment, 2015a). STEM skills are of particular strategic relevance for the jobs, growth and investment package (infrastruc-ture, notably broadband and energy networks, as well as transport infrastructure in industrial centres; education, research and innovation; renewable energy and energy ef-ficiency) (see European Commission, 2014).
The most recent initiative of the European pillar of social rights is intended to secure social rights more effectively
Study and work in the EU: set apart by gender30
2. Policy context EIGE
for fair and well-functioning labour markets and welfare systems. It is recognised that, to a large extent, the social challenges Europe is facing today are a result of relatively modest growth, which is rooted in untapped potential in terms of participation in employment and productivity (European Commission, 2017c). Equal opportunities and ac-cess to the labour market are one of the three focus areas of the European pillar of social rights, with gender equality as one of the key principles. The pillar reconfirms the EU commitment to foster gender equality in all areas, includ-ing participation in the labour market, terms and conditions of employment, career progression and equal pay for work of equal value. Gender equality is also considered in other areas of the pillar, focusing on fair working conditions and social protection and inclusion.
The European Commission’s strategic engagement for gender equality 2016-2019 seeks to increase women’s labour market participation and the equal economic inde-pendence of women and men, as well as to reduce gender gaps in pay, earnings and pensions and thus fight poverty among women. Actions planned within these priority areas include:
� the introduction of further measures to improve the gender balance in economic sectors and occupations; use of the Grand Coalition for Digital Jobs to support measures enhancing women’s and girls’ digital skills; promoting women’s employment in the ICT sector; and raising awareness on educational and vocational training choices;
� the promotion of gender equality in all levels and types of education, including in relation to gendered study subject choices and careers, using existing policy cooperation tools and funding instruments as appropriate, in line with the priorities set out in the ET 2020 framework.
The close link between education and the labour market is also addressed in the European Pact for Gender Equal-ity 2011-2020, which aims to ‘eliminate gender stereotypes and promote gender equality at all levels of education and training, as well as in working life, in order to reduce gender segregation in the labour market’ (Council of the European Union, 2011).
The Council, in its recent conclusions on ‘Enhancing the skills of women and men in the EU labour market’, stresses the importance of combating horizontal occupational seg-regation by gender along with measures promoting the recognition and status of sectors dominated by women. The conclusions encourage girls, boys, women and men from all backgrounds to choose educational fields and oc-cupations in accordance with their abilities and skills, not based on gender stereotypes, in particular by promoting women’s and girls’ access to STEM educational fields and
occupations and by encouraging men and boys to study and work in fields such as social services, childcare and long-term care (Council of the European Union, 2017).
The Council conclusions on ‘Women and the economy: eE-conomic independence from the perspective of part-time work and self-employment’ recognise the importance of developing gender-sensitive education and career counsel-ling, including by means of training, promoting a gender balance among relevant staff and undertaking media cam-paigns encouraging and enabling girls and boys/women and men to choose educational paths and occupations in accordance with their abilities and skills. The Council calls on Member States to tackle occupational and sectoral seg-regation in employment including by means of positive ac-tion measures, awareness-raising measures and measures to support family-friendly approaches and gender equality in organisations, as well as by considering the removal of disincentives in tax-and-benefit systems that discourage women’s participation is the labour market (Council of the European Union, 2014).
A need for active, evidence-guided intervention was con-firmed by the European Parliament resolution of September 2015 on empowering women and girls through education in the EU. Gender stereotypes and sexism are recognised as the greatest obstacles to achieving gender equality, as they affect the self-image and decisions made by girls and boys. Member States are urged to fight these stereotypes through informal and formal education and by encourag-ing girls and boys to take equal interest in all subjects.
The 2014-2020 rights, equality and citizenship programme (with a budget of EUR 439 million) supports training, mu-tual learning, cooperation activities, the exchange of good practices, peer reviews, development of ICT tools and awareness-raising and dissemination. It supports main ac-tors (key European NGOs and networks, Member State au-thorities implementing Union law) as well as analytical ac-tivities to promote non-discrimination, equality and gender mainstreaming and to combat all forms of intolerance. In May 2016 a call for projects was launched to promote good practices on gender roles and overcome gender stereo-types in education and training and in the workplace; eight projects were supported (European Commission, 2016b). The EU has funded numerous projects in the field of wom-en in science, and more recently, structural change (e.g. genSET on gender action plans in science and GENDERA on best practices) (European Commission, 2012).
3. Gender segregation in education and training

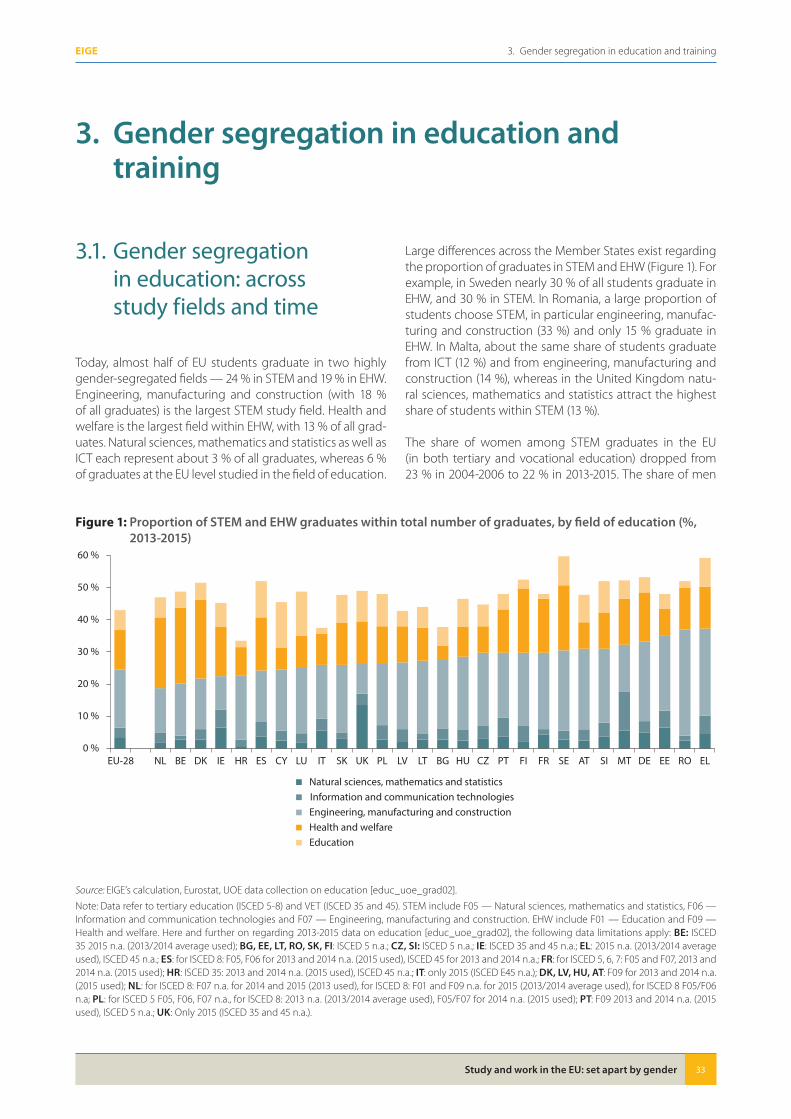
Study and work in the EU: set apart by gender 33
3. Gender segregation in education and trainingEIGE
3� Gender segregation in education and training
3.1. Gender segregation in education: across study fields and time
Today, almost half of EU students graduate in two highly gender-segregated fields — 24 % in STEM and 19 % in EHW. Engineering, manufacturing and construction (with 18 % of all graduates) is the largest STEM study field. Health and welfare is the largest field within EHW, with 13 % of all grad-uates. Natural sciences, mathematics and statistics as well as ICT each represent about 3 % of all graduates, whereas 6 % of graduates at the EU level studied in the field of education.
Large differences across the Member States exist regarding the proportion of graduates in STEM and EHW (Figure 1). For example, in Sweden nearly 30 % of all students graduate in EHW, and 30 % in STEM. In Romania, a large proportion of students choose STEM, in particular engineering, manufac-turing and construction (33 %) and only 15 % graduate in EHW. In Malta, about the same share of students graduate from ICT (12 %) and from engineering, manufacturing and construction (14 %), whereas in the United Kingdom natu-ral sciences, mathematics and statistics attract the highest share of students within STEM (13 %).
The share of women among STEM graduates in the EU (in both tertiary and vocational education) dropped from 23 % in 2004-2006 to 22 % in 2013-2015. The share of men
Figure 1: Proportion of STEM and EHW graduates within total number of graduates, by field of education (%, 2013-2015)
0 %
10 %
20 %
30 %
40 %
50 %
60 %
EU-28 NL BE DK IE HR ES CY LU IT SK UK PL LV LT BG HU CZ PT FI FR SE AT SI MT DE EE RO EL
Natural sciences, mathematics and statisticsInformation and communication technologiesEngineering, manufacturing and constructionHealth and welfareEducation
Source: EIGE’s calculation, Eurostat, UOE data collection on education [educ_uoe_grad02].
Note: Data refer to tertiary education (ISCED 5-8) and VET (ISCED 35 and 45). STEM include F05 — Natural sciences, mathematics and statistics, F06 — Information and communication technologies and F07 — Engineering, manufacturing and construction. EHW include F01 — Education and F09 — Health and welfare. Here and further on regarding 2013-2015 data on education [educ_uoe_grad02], the following data limitations apply: BE: ISCED 35 2015 n.a. (2013/2014 average used); BG, EE, LT, RO, SK, FI: ISCED 5 n.a.; CZ, SI: ISCED 5 n.a.; IE: ISCED 35 and 45 n.a.; EL: 2015 n.a. (2013/2014 average used), ISCED 45 n.a.; ES: for ISCED 8: F05, F06 for 2013 and 2014 n.a. (2015 used), ISCED 45 for 2013 and 2014 n.a.; FR: for ISCED 5, 6, 7: F05 and F07, 2013 and 2014 n.a. (2015 used); HR: ISCED 35: 2013 and 2014 n.a. (2015 used), ISCED 45 n.a.; IT: only 2015 (ISCED E45 n.a.); DK, LV, HU, AT: F09 for 2013 and 2014 n.a. (2015 used); NL: for ISCED 8: F07 n.a. for 2014 and 2015 (2013 used), for ISCED 8: F01 and F09 n.a. for 2015 (2013/2014 average used), for ISCED 8 F05/F06 n.a; PL: for ISCED 5 F05, F06, F07 n.a., for ISCED 8: 2013 n.a. (2013/2014 average used), F05/F07 for 2014 n.a. (2015 used); PT: F09 2013 and 2014 n.a. (2015 used), ISCED 5 n.a.; UK: Only 2015 (ISCED 35 and 45 n.a.).
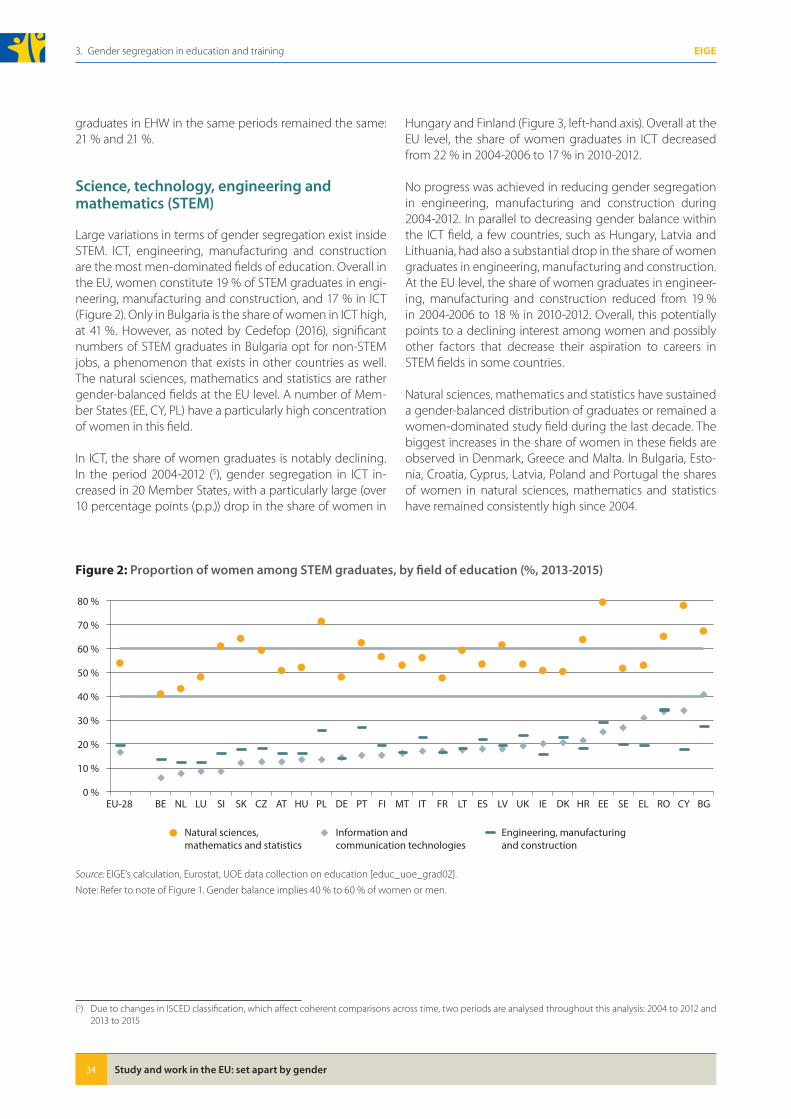
Study and work in the EU: set apart by gender34
3. Gender segregation in education and training EIGE
graduates in EHW in the same periods remained the same: 21 % and 21 %.
Science, technology, engineering and mathematics (STEM)
Large variations in terms of gender segregation exist inside STEM. ICT, engineering, manufacturing and construction are the most men-dominated fields of education. Overall in the EU, women constitute 19 % of STEM graduates in engi-neering, manufacturing and construction, and 17 % in ICT (Figure 2). Only in Bulgaria is the share of women in ICT high, at 41 %. However, as noted by Cedefop (2016), significant numbers of STEM graduates in Bulgaria opt for non-STEM jobs, a phenomenon that exists in other countries as well. The natural sciences, mathematics and statistics are rather gender-balanced fields at the EU level. A number of Mem-ber States (EE, CY, PL) have a particularly high concentration of women in this field.
In ICT, the share of women graduates is notably declining. In the period 2004-2012 (5), gender segregation in ICT in-creased in 20 Member States, with a particularly large (over 10 percentage points (p.p.)) drop in the share of women in
Hungary and Finland (Figure 3, left-hand axis). Overall at the EU level, the share of women graduates in ICT decreased from 22 % in 2004-2006 to 17 % in 2010-2012.
No progress was achieved in reducing gender segregation in engineering, manufacturing and construction during 2004-2012. In parallel to decreasing gender balance within the ICT field, a few countries, such as Hungary, Latvia and Lithuania, had also a substantial drop in the share of women graduates in engineering, manufacturing and construction. At the EU level, the share of women graduates in engineer-ing, manufacturing and construction reduced from 19 % in 2004-2006 to 18 % in 2010-2012. Overall, this potentially points to a declining interest among women and possibly other factors that decrease their aspiration to careers in STEM fields in some countries.
Natural sciences, mathematics and statistics have sustained a gender-balanced distribution of graduates or remained a women-dominated study field during the last decade. The biggest increases in the share of women in these fields are observed in Denmark, Greece and Malta. In Bulgaria, Esto-nia, Croatia, Cyprus, Latvia, Poland and Portugal the shares of women in natural sciences, mathematics and statistics have remained consistently high since 2004.
(5) Due to changes in ISCED classification, which affect coherent comparisons across time, two periods are analysed throughout this analysis: 2004 to 2012 and 2013 to 2015
Figure 2: Proportion of women among STEM graduates, by field of education (%, 2013-2015)
0 %
10 %
20 %
30 %
40 %
50 %
60 %
70 %
80 %
EU-28 BE NL LU SI SK CZ AT HU PL DE PT FI MT IT FR LT ES LV UK IE DK HR EE SE EL RO CY BG
Natural sciences,mathematics and statistics
Information andcommunication technologies
Engineering, manufacturingand construction
Source: EIGE’s calculation, Eurostat, UOE data collection on education [educ_uoe_grad02].
Note: Refer to note of Figure 1. Gender balance implies 40 % to 60 % of women or men.
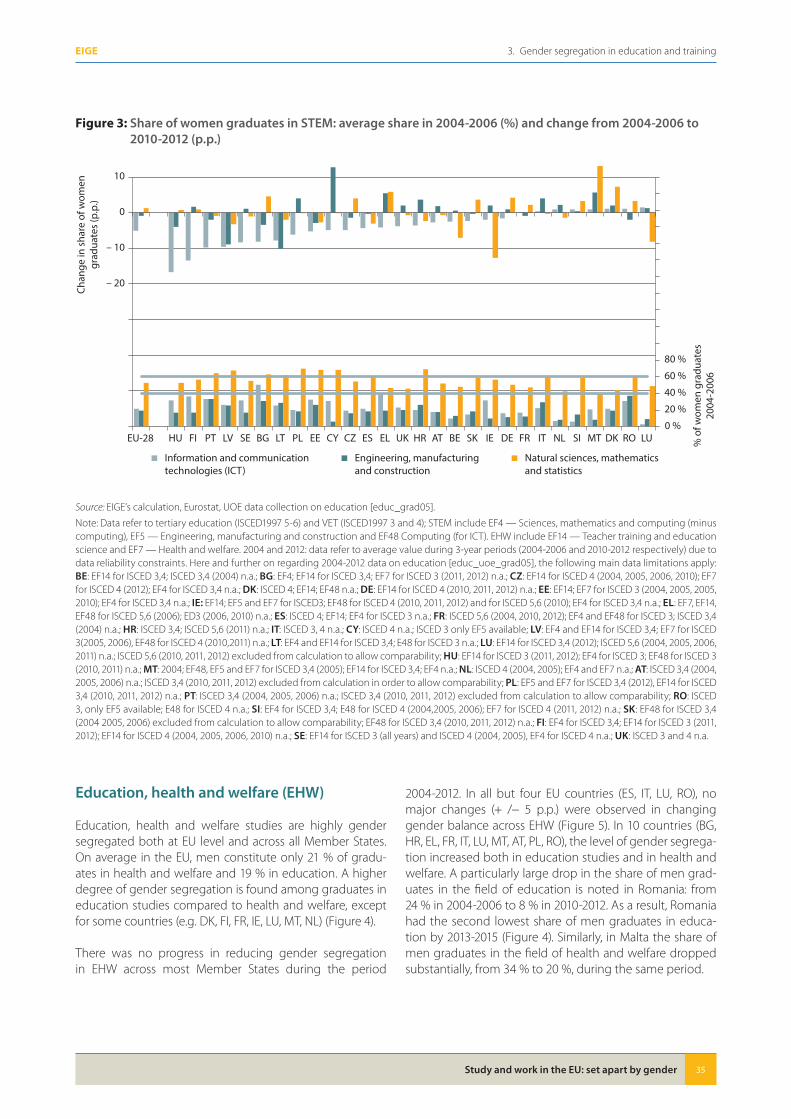
Study and work in the EU: set apart by gender 35
3. Gender segregation in education and trainingEIGE
Figure 3: Share of women graduates in STEM: average share in 2004-2006 (%) and change from 2004-2006 to 2010-2012 (p�p�)
0 %
20 %
40 %
60 %
80 %
– 20
– 10
0
10
EU-28 HU FI PT LV SE BG LT PL EE CY CZ ES EL UK HR AT BE SK IE DE FR IT NL SI MT DK RO LU % o
f wom
en g
radu
ates
2004
-200
6
Chan
ge in
sha
re o
f wom
engr
adua
tes
(p.p
.)
Information and communicationtechnologies (ICT)
Engineering, manufacturingand construction
Natural sciences, mathematicsand statistics
Source: EIGE’s calculation, Eurostat, UOE data collection on education [educ_grad05].
Note: Data refer to tertiary education (ISCED1997 5-6) and VET (ISCED1997 3 and 4); STEM include EF4 — Sciences, mathematics and computing (minus computing), EF5 — Engineering, manufacturing and construction and EF48 Computing (for ICT). EHW include EF14 — Teacher training and education science and EF7 — Health and welfare. 2004 and 2012: data refer to average value during 3-year periods (2004-2006 and 2010-2012 respectively) due to data reliability constraints. Here and further on regarding 2004-2012 data on education [educ_uoe_grad05], the following main data limitations apply: BE: EF14 for ISCED 3,4; ISCED 3,4 (2004) n.a.; BG: EF4; EF14 for ISCED 3,4; EF7 for ISCED 3 (2011, 2012) n.a.; CZ: EF14 for ISCED 4 (2004, 2005, 2006, 2010); EF7 for ISCED 4 (2012); EF4 for ISCED 3,4 n.a.; DK: ISCED 4; EF14; EF48 n.a.; DE: EF14 for ISCED 4 (2010, 2011, 2012) n.a.; EE: EF14; EF7 for ISCED 3 (2004, 2005, 2005, 2010); EF4 for ISCED 3,4 n.a.; IE: EF14; EF5 and EF7 for ISCED3; EF48 for ISCED 4 (2010, 2011, 2012) and for ISCED 5,6 (2010); EF4 for ISCED 3,4 n.a.; EL: EF7, EF14, EF48 for ISCED 5,6 (2006); ED3 (2006, 2010) n.a.; ES: ISCED 4; EF14; EF4 for ISCED 3 n.a.; FR: ISCED 5,6 (2004, 2010, 2012); EF4 and EF48 for ISCED 3; ISCED 3,4 (2004) n.a.; HR: ISCED 3,4; ISCED 5,6 (2011) n.a.; IT: ISCED 3, 4 n.a.; CY: ISCED 4 n.a.; ISCED 3 only EF5 available; LV: EF4 and EF14 for ISCED 3,4; EF7 for ISCED 3(2005, 2006), EF48 for ISCED 4 (2010,2011) n.a.; LT: EF4 and EF14 for ISCED 3,4; E48 for ISCED 3 n.a.; LU: EF14 for ISCED 3,4 (2012); ISCED 5,6 (2004, 2005, 2006, 2011) n.a.; ISCED 5,6 (2010, 2011, 2012) excluded from calculation to allow comparability; HU: EF14 for ISCED 3 (2011, 2012); EF4 for ISCED 3; EF48 for ISCED 3 (2010, 2011) n.a.; MT: 2004; EF48, EF5 and EF7 for ISCED 3,4 (2005); EF14 for ISCED 3,4; EF4 n.a.; NL: ISCED 4 (2004, 2005); EF4 and EF7 n.a.; AT: ISCED 3,4 (2004, 2005, 2006) n.a.; ISCED 3,4 (2010, 2011, 2012) excluded from calculation in order to allow comparability; PL: EF5 and EF7 for ISCED 3,4 (2012), EF14 for ISCED 3,4 (2010, 2011, 2012) n.a.; PT: ISCED 3,4 (2004, 2005, 2006) n.a.; ISCED 3,4 (2010, 2011, 2012) excluded from calculation to allow comparability; RO: ISCED 3, only EF5 available; E48 for ISCED 4 n.a.; SI: EF4 for ISCED 3,4; E48 for ISCED 4 (2004,2005, 2006); EF7 for ISCED 4 (2011, 2012) n.a.; SK: EF48 for ISCED 3,4 (2004 2005, 2006) excluded from calculation to allow comparability; EF48 for ISCED 3,4 (2010, 2011, 2012) n.a.; FI: EF4 for ISCED 3,4; EF14 for ISCED 3 (2011, 2012); EF14 for ISCED 4 (2004, 2005, 2006, 2010) n.a.; SE: EF14 for ISCED 3 (all years) and ISCED 4 (2004, 2005), EF4 for ISCED 4 n.a.; UK: ISCED 3 and 4 n.a.
Education, health and welfare (EHW)
Education, health and welfare studies are highly gender segregated both at EU level and across all Member States. On average in the EU, men constitute only 21 % of gradu-ates in health and welfare and 19 % in education. A higher degree of gender segregation is found among graduates in education studies compared to health and welfare, except for some countries (e.g. DK, FI, FR, IE, LU, MT, NL) (Figure 4).
There was no progress in reducing gender segregation in EHW across most Member States during the period
2004-2012. In all but four EU countries (ES, IT, LU, RO), no major changes (+ /− 5 p.p.) were observed in changing gender balance across EHW (Figure 5). In 10 countries (BG, HR, EL, FR, IT, LU, MT, AT, PL, RO), the level of gender segrega-tion increased both in education studies and in health and welfare. A particularly large drop in the share of men grad-uates in the field of education is noted in Romania: from 24 % in 2004-2006 to 8 % in 2010-2012. As a result, Romania had the second lowest share of men graduates in educa-tion by 2013-2015 (Figure 4). Similarly, in Malta the share of men graduates in the field of health and welfare dropped substantially, from 34 % to 20 %, during the same period.
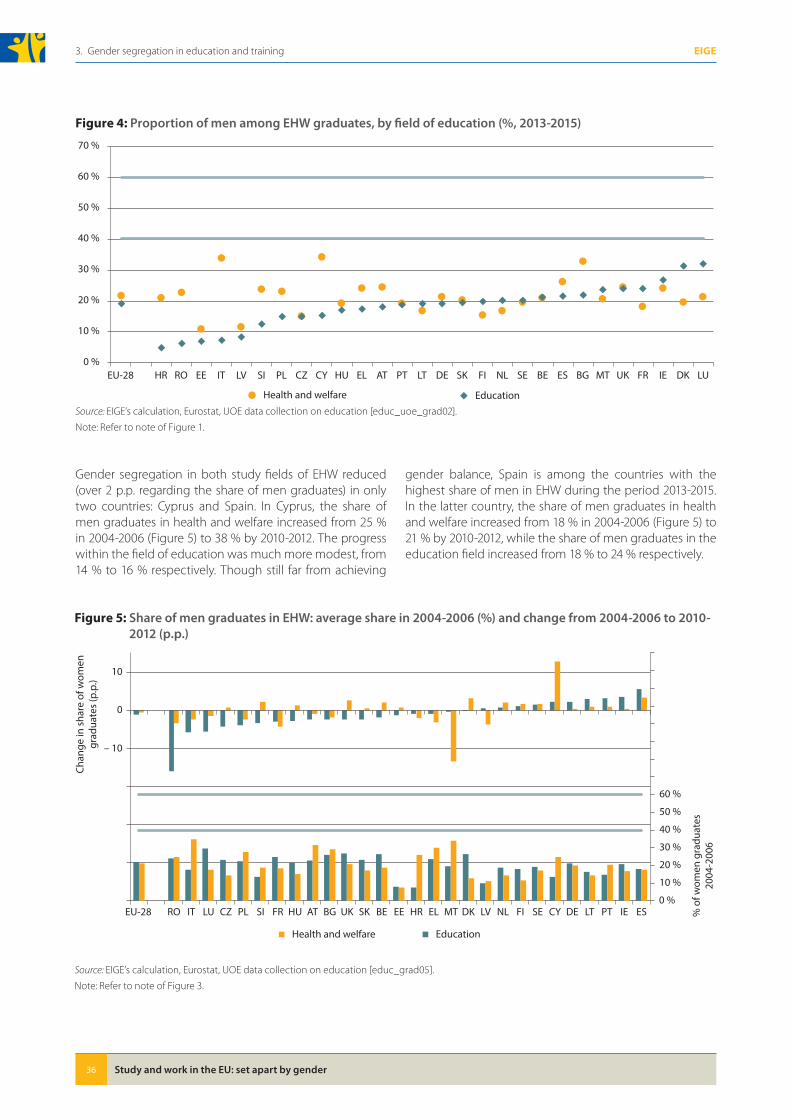
Study and work in the EU: set apart by gender36
3. Gender segregation in education and training EIGE
Gender segregation in both study fields of EHW reduced (over 2 p.p. regarding the share of men graduates) in only two countries: Cyprus and Spain. In Cyprus, the share of men graduates in health and welfare increased from 25 % in 2004-2006 (Figure 5) to 38 % by 2010-2012. The progress within the field of education was much more modest, from 14 % to 16 % respectively. Though still far from achieving
gender balance, Spain is among the countries with the highest share of men in EHW during the period 2013-2015. In the latter country, the share of men graduates in health and welfare increased from 18 % in 2004-2006 (Figure 5) to 21 % by 2010-2012, while the share of men graduates in the education field increased from 18 % to 24 % respectively.
Figure 4: Proportion of men among EHW graduates, by field of education (%, 2013-2015)
0 %
10 %
20 %
30 %
40 %
50 %
60 %
70 %
EU-28 HR RO EE IT LV SI PL CZ CY HU EL AT PT LT DE SK FI NL SE BE ES BG MT UK FR IE DK LU
Health and welfare EducationSource: EIGE’s calculation, Eurostat, UOE data collection on education [educ_uoe_grad02].
Note: Refer to note of Figure 1.
Figure 5: Share of men graduates in EHW: average share in 2004-2006 (%) and change from 2004-2006 to 2010-2012 (p�p�)
0 %
10 %
20 %
30 %
40 %
50 %
60 %
– 10
0
10
EU-28 RO IT LU CZ PL SI FR HU AT BG UK SK BE EE HR EL MT DK LV NL FI SE CY DE LT PT IE ES % o
f wom
en g
radu
ates
2004
-200
6
Chan
ge in
sha
re o
f wom
engr
adua
tes
(p.p
.)
EducationHealth and welfare
Source: EIGE’s calculation, Eurostat, UOE data collection on education [educ_grad05].
Note: Refer to note of Figure 3.
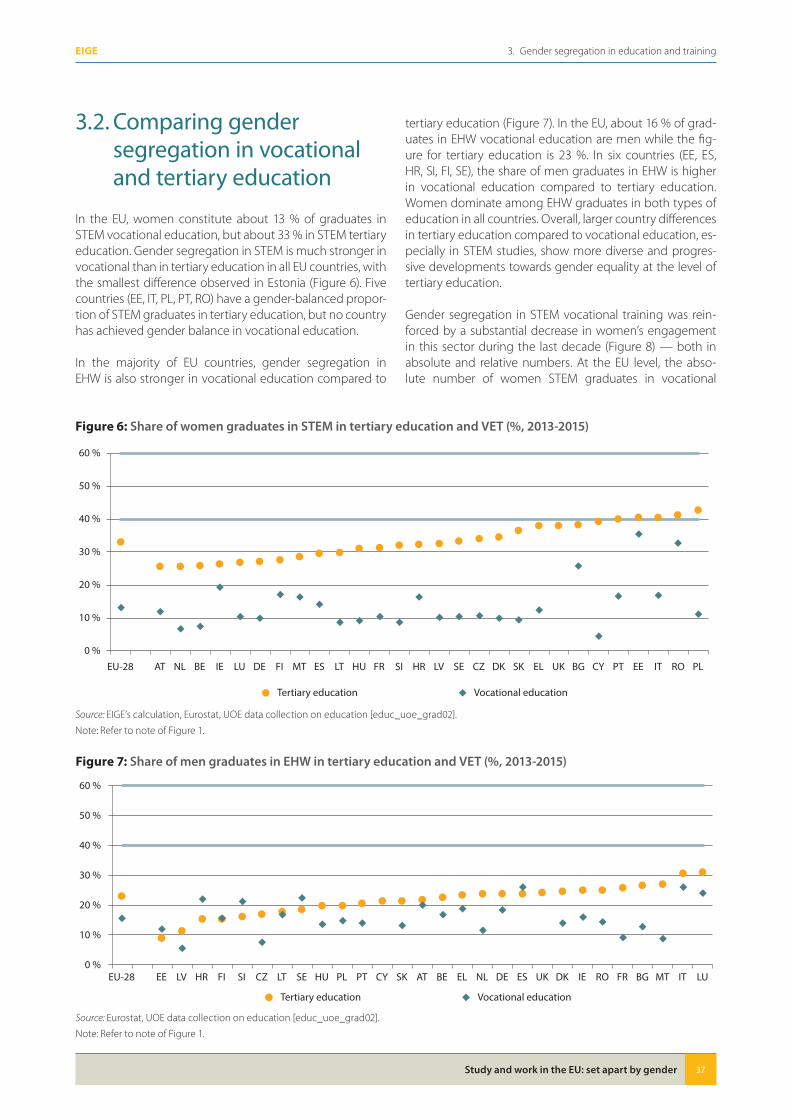
Study and work in the EU: set apart by gender 37
3. Gender segregation in education and trainingEIGE
3.2. Comparing gender segregation in vocational and tertiary education
In the EU, women constitute about 13 % of graduates in STEM vocational education, but about 33 % in STEM tertiary education. Gender segregation in STEM is much stronger in vocational than in tertiary education in all EU countries, with the smallest difference observed in Estonia (Figure 6). Five countries (EE, IT, PL, PT, RO) have a gender-balanced propor-tion of STEM graduates in tertiary education, but no country has achieved gender balance in vocational education.
In the majority of EU countries, gender segregation in EHW is also stronger in vocational education compared to
tertiary education (Figure 7). In the EU, about 16 % of grad-uates in EHW vocational education are men while the fig-ure for tertiary education is 23 %. In six countries (EE, ES, HR, SI, FI, SE), the share of men graduates in EHW is higher in vocational education compared to tertiary education. Women dominate among EHW graduates in both types of education in all countries. Overall, larger country differences in tertiary education compared to vocational education, es-pecially in STEM studies, show more diverse and progres-sive developments towards gender equality at the level of tertiary education.
Gender segregation in STEM vocational training was rein-forced by a substantial decrease in women’s engagement in this sector during the last decade (Figure 8) — both in absolute and relative numbers. At the EU level, the abso-lute number of women STEM graduates in vocational
Figure 6: Share of women graduates in STEM in tertiary education and VET (%, 2013-2015)
0 %
10 %
20 %
30 %
40 %
50 %
60 %
EU-28 AT NL BE IE LU DE FI MT ES LT HU FR SI HR LV SE CZ DK SK EL UK BG CY PT EE IT RO PL
Tertiary education Vocational education
Source: EIGE’s calculation, Eurostat, UOE data collection on education [educ_uoe_grad02].
Note: Refer to note of Figure 1.
Figure 7: Share of men graduates in EHW in tertiary education and VET (%, 2013-2015)
0 %
10 %
20 %
30 %
40 %
50 %
60 %
EU-28 EE LV HR FI SI CZ LT SE HU PL PT CY SK AT BE EL NL DE ES UK DK IE RO FR BG MT IT LU
Tertiary education Vocational education
Source: Eurostat, UOE data collection on education [educ_uoe_grad02].
Note: Refer to note of Figure 1.
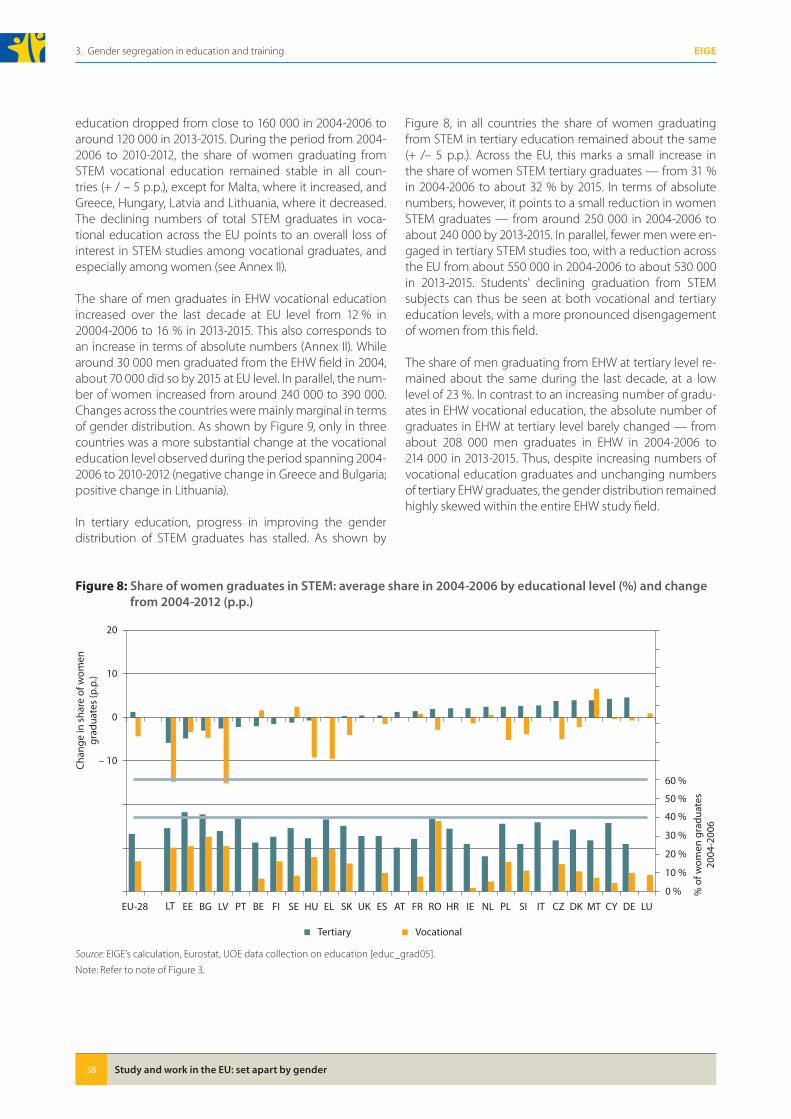
Study and work in the EU: set apart by gender38
3. Gender segregation in education and training EIGE
education dropped from close to 160 000 in 2004-2006 to around 120 000 in 2013-2015. During the period from 2004-2006 to 2010-2012, the share of women graduating from STEM vocational education remained stable in all coun-tries (+ / – 5 p.p.), except for Malta, where it increased, and Greece, Hungary, Latvia and Lithuania, where it decreased. The declining numbers of total STEM graduates in voca-tional education across the EU points to an overall loss of interest in STEM studies among vocational graduates, and especially among women (see Annex II).
The share of men graduates in EHW vocational education increased over the last decade at EU level from 12 % in 20004-2006 to 16 % in 2013-2015. This also corresponds to an increase in terms of absolute numbers (Annex II). While around 30 000 men graduated from the EHW field in 2004, about 70 000 did so by 2015 at EU level. In parallel, the num-ber of women increased from around 240 000 to 390 000. Changes across the countries were mainly marginal in terms of gender distribution. As shown by Figure 9, only in three countries was a more substantial change at the vocational education level observed during the period spanning 2004-2006 to 2010-2012 (negative change in Greece and Bulgaria; positive change in Lithuania).
In tertiary education, progress in improving the gender distribution of STEM graduates has stalled. As shown by
Figure 8, in all countries the share of women graduating from STEM in tertiary education remained about the same (+ /– 5 p.p.). Across the EU, this marks a small increase in the share of women STEM tertiary graduates — from 31 % in 2004-2006 to about 32 % by 2015. In terms of absolute numbers, however, it points to a small reduction in women STEM graduates — from around 250 000 in 2004-2006 to about 240 000 by 2013-2015. In parallel, fewer men were en-gaged in tertiary STEM studies too, with a reduction across the EU from about 550 000 in 2004-2006 to about 530 000 in 2013-2015. Students’ declining graduation from STEM subjects can thus be seen at both vocational and tertiary education levels, with a more pronounced disengagement of women from this field.
The share of men graduating from EHW at tertiary level re-mained about the same during the last decade, at a low level of 23 %. In contrast to an increasing number of gradu-ates in EHW vocational education, the absolute number of graduates in EHW at tertiary level barely changed — from about 208 000 men graduates in EHW in 2004-2006 to 214 000 in 2013-2015. Thus, despite increasing numbers of vocational education graduates and unchanging numbers of tertiary EHW graduates, the gender distribution remained highly skewed within the entire EHW study field.
Figure 8: Share of women graduates in STEM: average share in 2004-2006 by educational level (%) and change from 2004-2012 (p�p�)
0 %
10 %
20 %
30 %
40 %
50 %
60 %
– 10
0
10
20
EU-28 LT EE BG LV PT BE FI SE HU EL SK UK ES AT FR RO HR IE NL PL SI IT CZ DK MT CY DE LU
% o
f wom
en g
radu
ates
2004
-200
6
Chan
ge in
sha
re o
f wom
engr
adua
tes
(p.p
.)
Tertiary Vocational
Source: EIGE’s calculation, Eurostat, UOE data collection on education [educ_grad05].
Note: Refer to note of Figure 3.
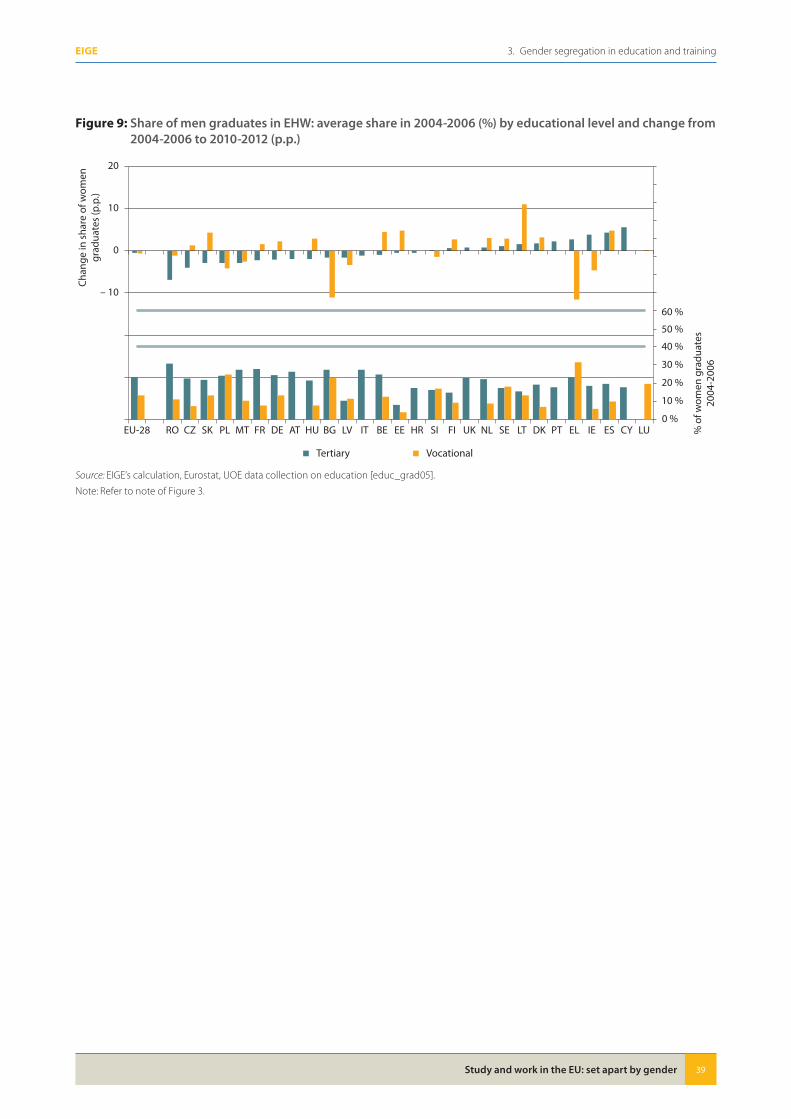
Study and work in the EU: set apart by gender 39
3. Gender segregation in education and trainingEIGE
Figure 9: Share of men graduates in EHW: average share in 2004-2006 (%) by educational level and change from 2004-2006 to 2010-2012 (p�p�)
0 %
10 %
20 %
30 %
40 %
50 %
60 %
– 10
0
10
20
EU-28 RO CZ SK PL MT FR DE AT HU BG LV IT BE EE HR SI FI UK NL SE LT DK PT EL IE ES CY LU % o
f wom
en g
radu
ates
2004
-200
6
Chan
ge in
sha
re o
f wom
engr
adua
tes
(p.p
.)
Tertiary Vocational
Source: EIGE’s calculation, Eurostat, UOE data collection on education [educ_grad05].
Note: Refer to note of Figure 3.

4. Transition from education to work

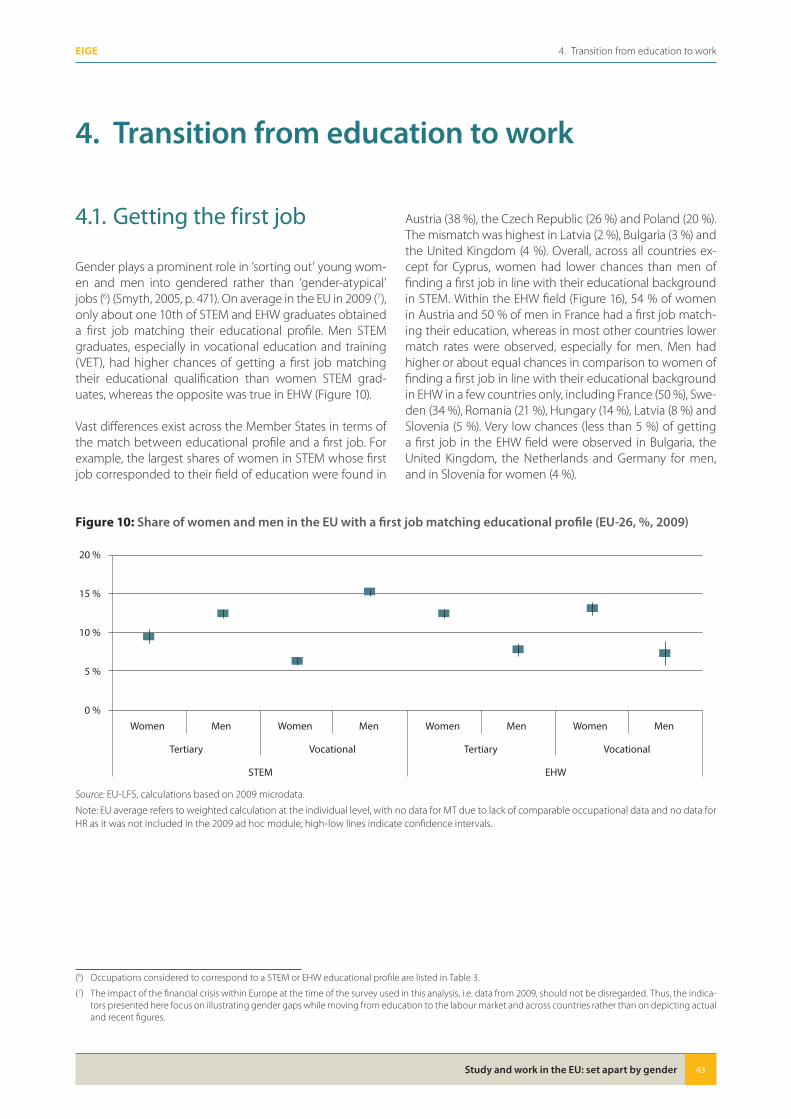
Study and work in the EU: set apart by gender 43
4. Transition from education to workEIGE
4� Transition from education to work
4.1. Getting the first job
Gender plays a prominent role in ‘sorting out’ young wom-en and men into gendered rather than ‘gender-atypical’ jobs (6) (Smyth, 2005, p. 471). On average in the EU in 2009 (7), only about one 10th of STEM and EHW graduates obtained a first job matching their educational profile. Men STEM graduates, especially in vocational education and training (VET), had higher chances of getting a first job matching their educational qualification than women STEM grad-uates, whereas the opposite was true in EHW (Figure 10).
Vast differences exist across the Member States in terms of the match between educational profile and a first job. For example, the largest shares of women in STEM whose first job corresponded to their field of education were found in
Austria (38 %), the Czech Republic (26 %) and Poland (20 %). The mismatch was highest in Latvia (2 %), Bulgaria (3 %) and the United Kingdom (4 %). Overall, across all countries ex-cept for Cyprus, women had lower chances than men of finding a first job in line with their educational background in STEM. Within the EHW field (Figure 16), 54 % of women in Austria and 50 % of men in France had a first job match-ing their education, whereas in most other countries lower match rates were observed, especially for men. Men had higher or about equal chances in comparison to women of finding a first job in line with their educational background in EHW in a few countries only, including France (50 %), Swe-den (34 %), Romania (21 %), Hungary (14 %), Latvia (8 %) and Slovenia (5 %). Very low chances (less than 5 %) of getting a first job in the EHW field were observed in Bulgaria, the United Kingdom, the Netherlands and Germany for men, and in Slovenia for women (4 %).
Figure 10: Share of women and men in the EU with a first job matching educational profile (EU-26, %, 2009)
0 %
5 %
10 %
15 %
20 %
Women Men Women Men Women Men Women Men
Tertiary Vocational Tertiary Vocational
STEM EHW
Source: EU-LFS, calculations based on 2009 microdata.
Note: EU average refers to weighted calculation at the individual level, with no data for MT due to lack of comparable occupational data and no data for HR as it was not included in the 2009 ad hoc module; high-low lines indicate confidence intervals.
(6) Occupations considered to correspond to a STEM or EHW educational profile are listed in Table 3.
(7) The impact of the financial crisis within Europe at the time of the survey used in this analysis, i.e. data from 2009, should not be disregarded. Thus, the indica-tors presented here focus on illustrating gender gaps while moving from education to the labour market and across countries rather than on depicting actual and recent figures.
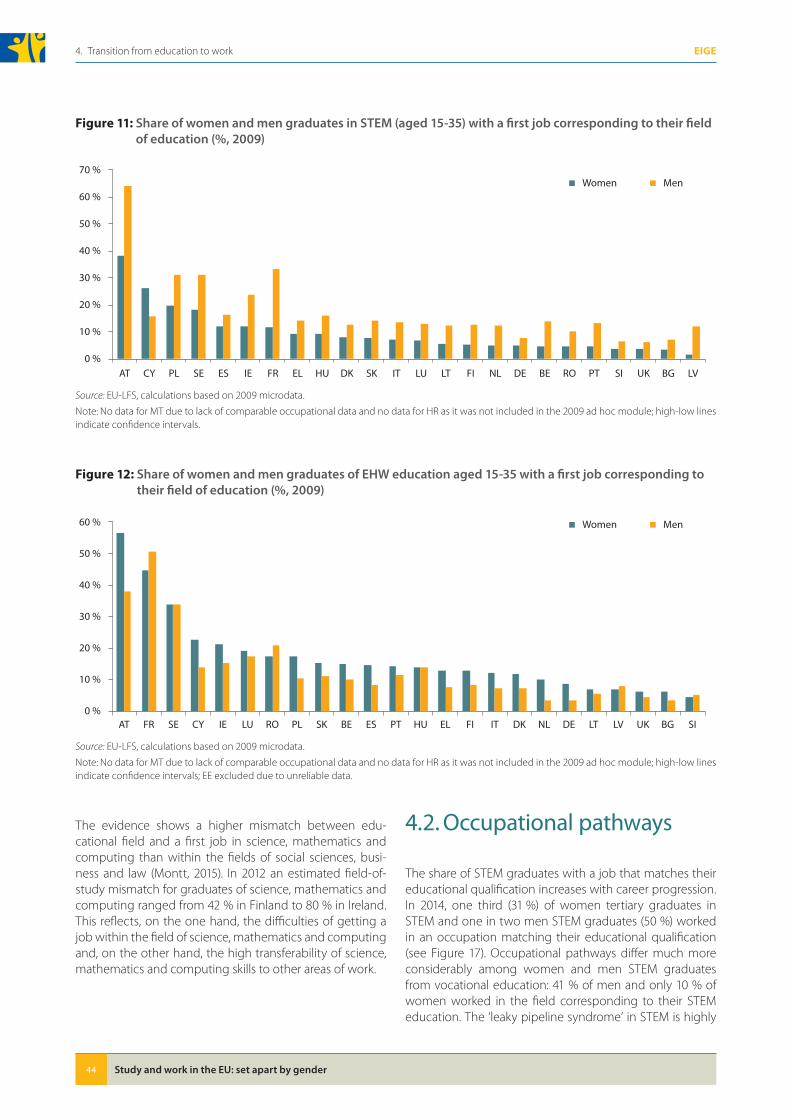
Study and work in the EU: set apart by gender44
4. Transition from education to work EIGE
The evidence shows a higher mismatch between edu-cational field and a first job in science, mathematics and computing than within the fields of social sciences, busi-ness and law (Montt, 2015). In 2012 an estimated field-of-study mismatch for graduates of science, mathematics and computing ranged from 42 % in Finland to 80 % in Ireland. This reflects, on the one hand, the difficulties of getting a job within the field of science, mathematics and computing and, on the other hand, the high transferability of science, mathematics and computing skills to other areas of work.
4.2. Occupational pathways
The share of STEM graduates with a job that matches their educational qualification increases with career progression. In 2014, one third (31 %) of women tertiary graduates in STEM and one in two men STEM graduates (50 %) worked in an occupation matching their educational qualification (see Figure 17). Occupational pathways differ much more considerably among women and men STEM graduates from vocational education: 41 % of men and only 10 % of women worked in the field corresponding to their STEM education. The ‘leaky pipeline syndrome’ in STEM is highly
Figure 11: Share of women and men graduates in STEM (aged 15-35) with a first job corresponding to their field of education (%, 2009)
0 %
10 %
20 %
30 %
40 %
50 %
60 %
70 %
AT CY PL SE ES IE FR EL HU DK SK IT LU LT FI NL DE BE RO PT SI UK BG LV
Women Men
Source: EU-LFS, calculations based on 2009 microdata.
Note: No data for MT due to lack of comparable occupational data and no data for HR as it was not included in the 2009 ad hoc module; high-low lines indicate confidence intervals.
Figure 12: Share of women and men graduates of EHW education aged 15-35 with a first job corresponding to their field of education (%, 2009)
0 %
10 %
20 %
30 %
40 %
50 %
60 % Women Men
AT FR SE CY IE LU RO PL SK BE ES PT HU EL FI IT DK NL DE LT LV UK BG SI
Source: EU-LFS, calculations based on 2009 microdata.
Note: No data for MT due to lack of comparable occupational data and no data for HR as it was not included in the 2009 ad hoc module; high-low lines indicate confidence intervals; EE excluded due to unreliable data.
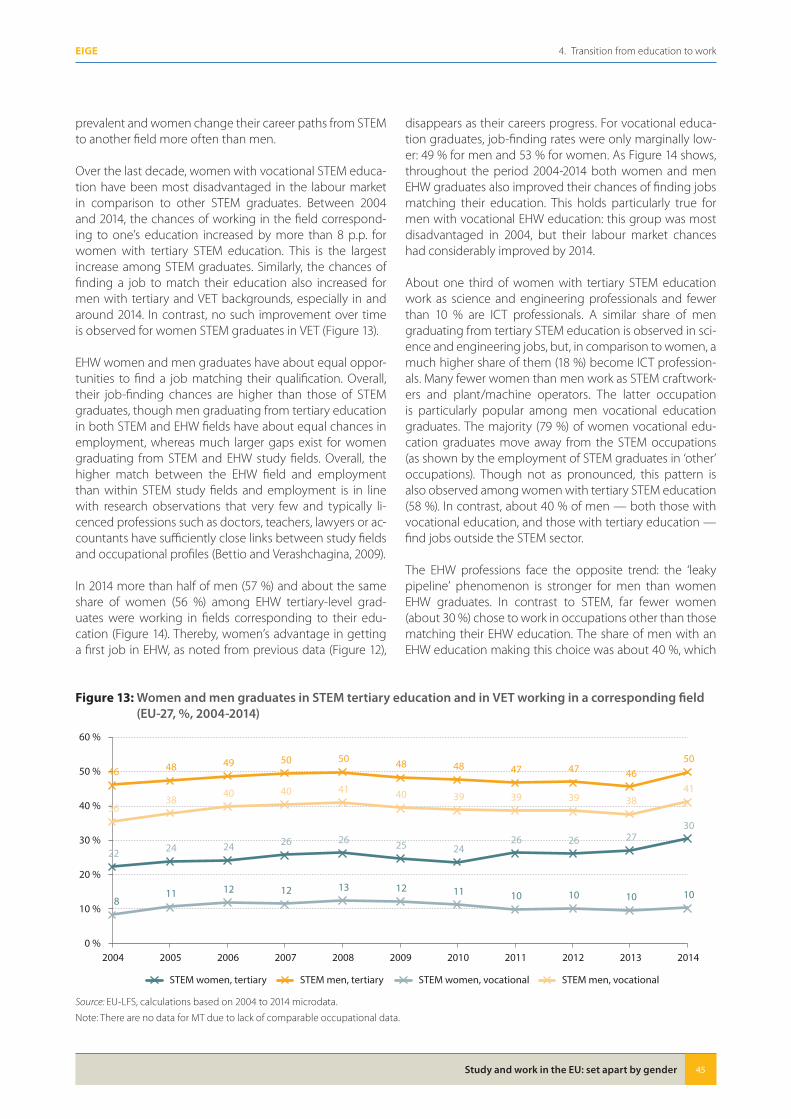
Study and work in the EU: set apart by gender 45
4. Transition from education to workEIGE
prevalent and women change their career paths from STEM to another field more often than men.
Over the last decade, women with vocational STEM educa-tion have been most disadvantaged in the labour market in comparison to other STEM graduates. Between 2004 and 2014, the chances of working in the field correspond-ing to one’s education increased by more than 8 p.p. for women with tertiary STEM education. This is the largest increase among STEM graduates. Similarly, the chances of finding a job to match their education also increased for men with tertiary and VET backgrounds, especially in and around 2014. In contrast, no such improvement over time is observed for women STEM graduates in VET (Figure 13).
EHW women and men graduates have about equal oppor-tunities to find a job matching their qualification. Overall, their job-finding chances are higher than those of STEM graduates, though men graduating from tertiary education in both STEM and EHW fields have about equal chances in employment, whereas much larger gaps exist for women graduating from STEM and EHW study fields. Overall, the higher match between the EHW field and employment than within STEM study fields and employment is in line with research observations that very few and typically li-cenced professions such as doctors, teachers, lawyers or ac-countants have sufficiently close links between study fields and occupational profiles (Bettio and Verashchagina, 2009).
In 2014 more than half of men (57 %) and about the same share of women (56 %) among EHW tertiary-level grad-uates were working in fields corresponding to their edu-cation (Figure 14). Thereby, women’s advantage in getting a first job in EHW, as noted from previous data (Figure 12),
disappears as their careers progress. For vocational educa-tion graduates, job-finding rates were only marginally low-er: 49 % for men and 53 % for women. As Figure 14 shows, throughout the period 2004-2014 both women and men EHW graduates also improved their chances of finding jobs matching their education. This holds particularly true for men with vocational EHW education: this group was most disadvantaged in 2004, but their labour market chances had considerably improved by 2014.
About one third of women with tertiary STEM education work as science and engineering professionals and fewer than 10 % are ICT professionals. A similar share of men graduating from tertiary STEM education is observed in sci-ence and engineering jobs, but, in comparison to women, a much higher share of them (18 %) become ICT profession-als. Many fewer women than men work as STEM craftwork-ers and plant/machine operators. The latter occupation is particularly popular among men vocational education graduates. The majority (79 %) of women vocational edu-cation graduates move away from the STEM occupations (as shown by the employment of STEM graduates in ‘other’ occupations). Though not as pronounced, this pattern is also observed among women with tertiary STEM education (58 %). In contrast, about 40 % of men — both those with vocational education, and those with tertiary education — find jobs outside the STEM sector.
The EHW professions face the opposite trend: the ‘leaky pipeline’ phenomenon is stronger for men than women EHW graduates. In contrast to STEM, far fewer women (about 30 %) chose to work in occupations other than those matching their EHW education. The share of men with an EHW education making this choice was about 40 %, which
Figure 13: Women and men graduates in STEM tertiary education and in VET working in a corresponding field (EU-27, %, 2004-2014)
22 24 24 26 26 25 2426 26 27
30
46 48 49 50 50 48 48 47 47 4650
811 12 12 13 12 11 10 10 10 10
3638
40 40 41 40 39 39 39 3841
0 %
10 %
20 %
30 %
40 %
50 %
60 %
2004 2005 2006 2007 2008 2009 2010 2011 2012 2013 2014
STEM women, tertiary STEM men, tertiary STEM women, vocational STEM men, vocational
Source: EU-LFS, calculations based on 2004 to 2014 microdata.
Note: There are no data for MT due to lack of comparable occupational data.
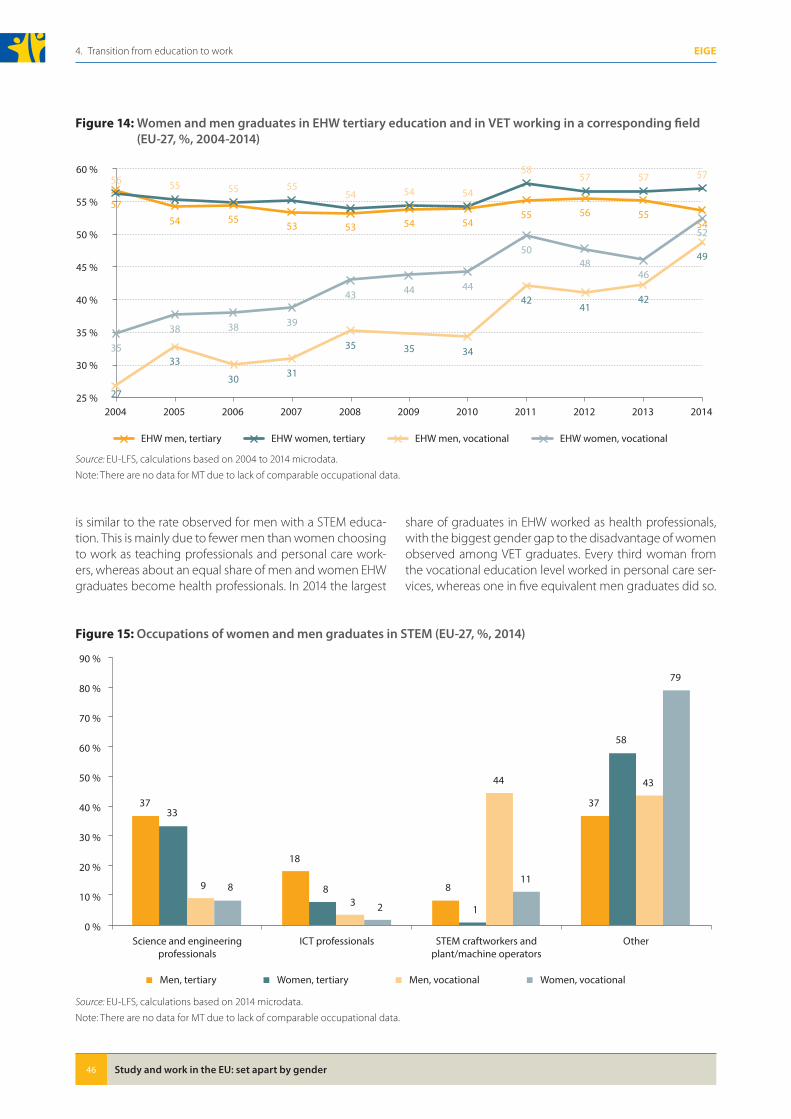
Study and work in the EU: set apart by gender46
4. Transition from education to work EIGE
is similar to the rate observed for men with a STEM educa-tion. This is mainly due to fewer men than women choosing to work as teaching professionals and personal care work-ers, whereas about an equal share of men and women EHW graduates become health professionals. In 2014 the largest
share of graduates in EHW worked as health professionals, with the biggest gender gap to the disadvantage of women observed among VET graduates. Every third woman from the vocational education level worked in personal care ser-vices, whereas one in five equivalent men graduates did so.
Figure 14: Women and men graduates in EHW tertiary education and in VET working in a corresponding field (EU-27, %, 2004-2014)
57
54 5553 53 54 54
55 56 5554
56 55 55 5554 54 54
5857 57 57
27
33
30 31
35 35 34
4241
42
49
35
38 38 39
43 44 44
5048
46
52
25 %
30 %
35 %
40 %
45 %
50 %
55 %
60 %
2004 2005 2006 2007 2008 2009 2010 2011 2012 2013 2014
EHW men, tertiary EHW women, tertiary EHW men, vocational EHW women, vocational
Source: EU-LFS, calculations based on 2004 to 2014 microdata.
Note: There are no data for MT due to lack of comparable occupational data.
Figure 15: Occupations of women and men graduates in STEM (EU-27, %, 2014)
37
18
8
3733
8
1
58
9
3
44 43
8
2
11
79
0 %
10 %
20 %
30 %
40 %
50 %
60 %
70 %
80 %
90 %
Science and engineeringprofessionals
ICT professionals STEM craftworkers andplant/machine operators
Other
Men, tertiary Women, tertiary Men, vocational Women, vocational
Source: EU-LFS, calculations based on 2014 microdata.
Note: There are no data for MT due to lack of comparable occupational data.
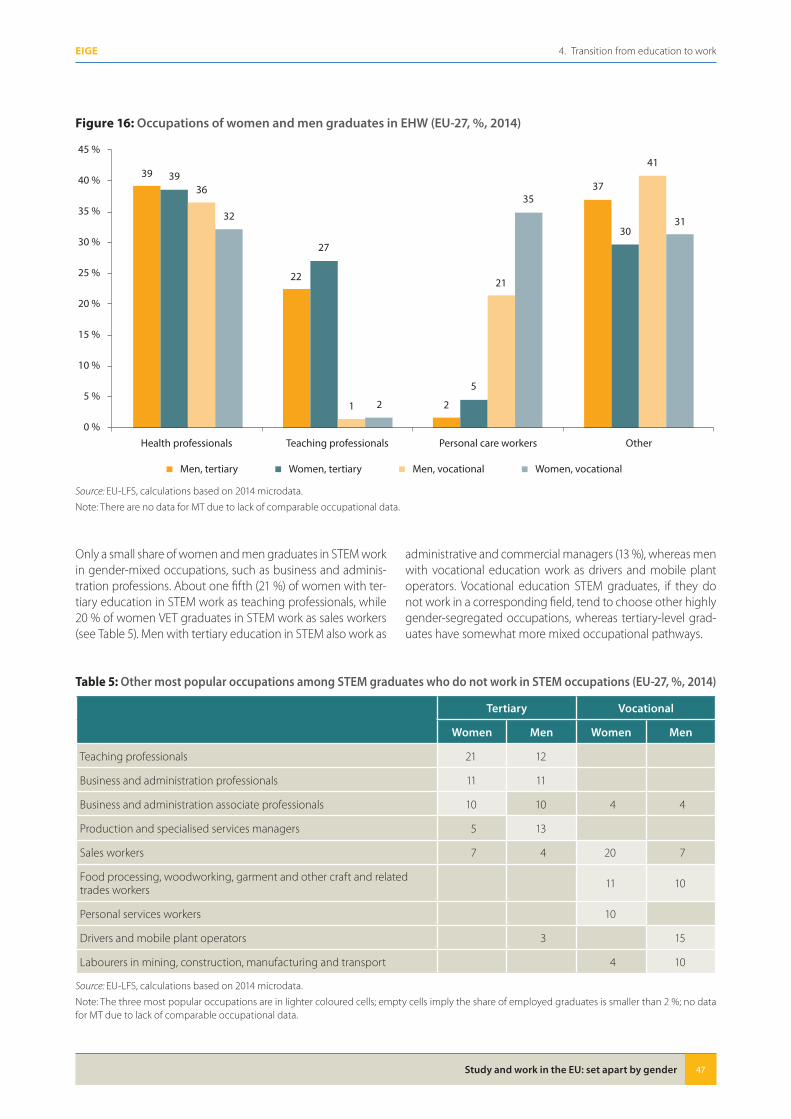
Study and work in the EU: set apart by gender 47
4. Transition from education to workEIGE
Only a small share of women and men graduates in STEM work in gender-mixed occupations, such as business and adminis-tration professions. About one fifth (21 %) of women with ter-tiary education in STEM work as teaching professionals, while 20 % of women VET graduates in STEM work as sales workers (see Table 5). Men with tertiary education in STEM also work as
administrative and commercial managers (13 %), whereas men with vocational education work as drivers and mobile plant operators. Vocational education STEM graduates, if they do not work in a corresponding field, tend to choose other highly gender-segregated occupations, whereas tertiary-level grad-uates have somewhat more mixed occupational pathways.
Figure 16: Occupations of women and men graduates in EHW (EU-27, %, 2014)
39
22
2
3739
27
5
30
36
1
21
41
32
2
35
31
0 %
5 %
10 %
15 %
20 %
25 %
30 %
35 %
40 %
45 %
Health professionals Teaching professionals Personal care workers Other
Men, tertiary Women, tertiary Men, vocational Women, vocational
Source: EU-LFS, calculations based on 2014 microdata.
Note: There are no data for MT due to lack of comparable occupational data.
Table 5: Other most popular occupations among STEM graduates who do not work in STEM occupations (EU-27, %, 2014)
Tertiary Vocational
Women Men Women Men
Teaching professionals 21 12
Business and administration professionals 11 11
Business and administration associate professionals 10 10 4 4
Production and specialised services managers 5 13
Sales workers 7 4 20 7
Food processing, woodworking, garment and other craft and related trades workers 11 10
Personal services workers 10
Drivers and mobile plant operators 3 15
Labourers in mining, construction, manufacturing and transport 4 10
Source: EU-LFS, calculations based on 2014 microdata.
Note: The three most popular occupations are in lighter coloured cells; empty cells imply the share of employed graduates is smaller than 2 %; no data for MT due to lack of comparable occupational data.
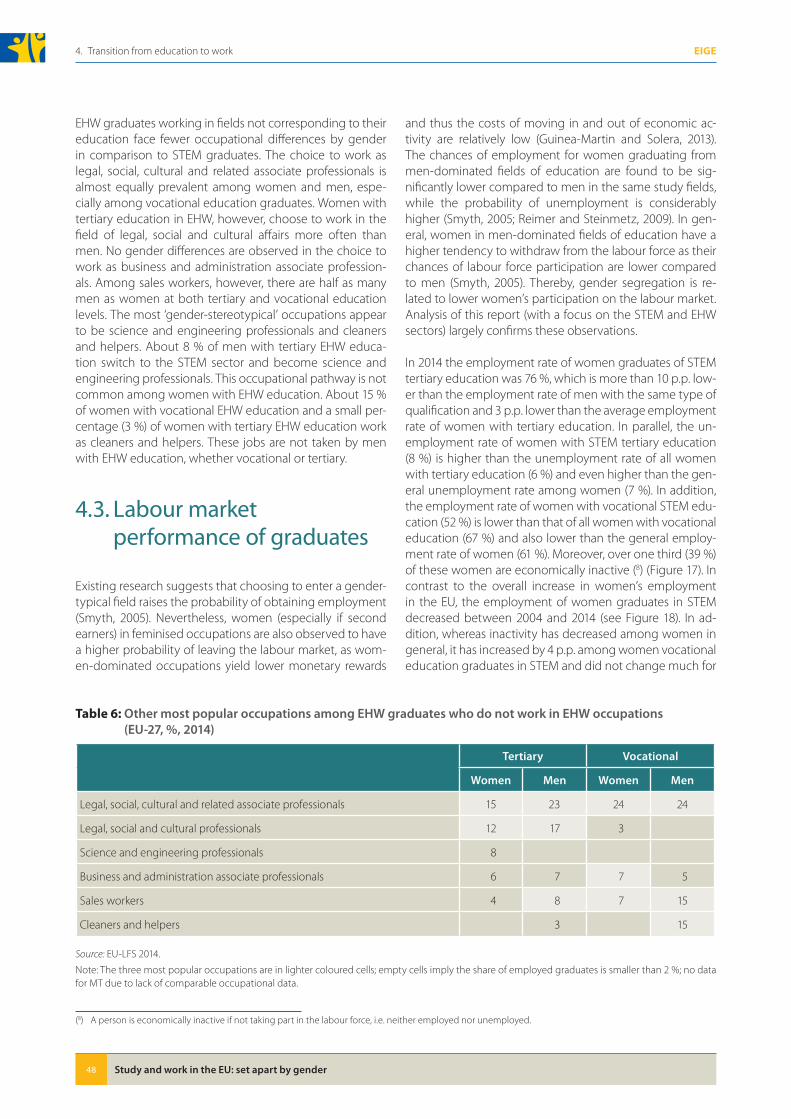
Study and work in the EU: set apart by gender48
4. Transition from education to work EIGE
EHW graduates working in fields not corresponding to their education face fewer occupational differences by gender in comparison to STEM graduates. The choice to work as legal, social, cultural and related associate professionals is almost equally prevalent among women and men, espe-cially among vocational education graduates. Women with tertiary education in EHW, however, choose to work in the field of legal, social and cultural affairs more often than men. No gender differences are observed in the choice to work as business and administration associate profession-als. Among sales workers, however, there are half as many men as women at both tertiary and vocational education levels. The most ‘gender-stereotypical’ occupations appear to be science and engineering professionals and cleaners and helpers. About 8 % of men with tertiary EHW educa-tion switch to the STEM sector and become science and engineering professionals. This occupational pathway is not common among women with EHW education. About 15 % of women with vocational EHW education and a small per-centage (3 %) of women with tertiary EHW education work as cleaners and helpers. These jobs are not taken by men with EHW education, whether vocational or tertiary.
4.3. Labour market performance of graduates
Existing research suggests that choosing to enter a gender-typical field raises the probability of obtaining employment (Smyth, 2005). Nevertheless, women (especially if second earners) in feminised occupations are also observed to have a higher probability of leaving the labour market, as wom-en-dominated occupations yield lower monetary rewards
and thus the costs of moving in and out of economic ac-tivity are relatively low (Guinea-Martin and Solera, 2013). The chances of employment for women graduating from men-dominated fields of education are found to be sig-nificantly lower compared to men in the same study fields, while the probability of unemployment is considerably higher (Smyth, 2005; Reimer and Steinmetz, 2009). In gen-eral, women in men-dominated fields of education have a higher tendency to withdraw from the labour force as their chances of labour force participation are lower compared to men (Smyth, 2005). Thereby, gender segregation is re-lated to lower women’s participation on the labour market. Analysis of this report (with a focus on the STEM and EHW sectors) largely confirms these observations.
In 2014 the employment rate of women graduates of STEM tertiary education was 76 %, which is more than 10 p.p. low-er than the employment rate of men with the same type of qualification and 3 p.p. lower than the average employment rate of women with tertiary education. In parallel, the un-employment rate of women with STEM tertiary education (8 %) is higher than the unemployment rate of all women with tertiary education (6 %) and even higher than the gen-eral unemployment rate among women (7 %). In addition, the employment rate of women with vocational STEM edu-cation (52 %) is lower than that of all women with vocational education (67 %) and also lower than the general employ-ment rate of women (61 %). Moreover, over one third (39 %) of these women are economically inactive (8) (Figure 17). In contrast to the overall increase in women’s employment in the EU, the employment of women graduates in STEM decreased between 2004 and 2014 (see Figure 18). In ad-dition, whereas inactivity has decreased among women in general, it has increased by 4 p.p. among women vocational education graduates in STEM and did not change much for
Table 6: Other most popular occupations among EHW graduates who do not work in EHW occupations (EU-27, %, 2014)
Tertiary Vocational
Women Men Women Men
Legal, social, cultural and related associate professionals 15 23 24 24
Legal, social and cultural professionals 12 17 3
Science and engineering professionals 8
Business and administration associate professionals 6 7 7 5
Sales workers 4 8 7 15
Cleaners and helpers 3 15
Source: EU-LFS 2014.
Note: The three most popular occupations are in lighter coloured cells; empty cells imply the share of employed graduates is smaller than 2 %; no data for MT due to lack of comparable occupational data.
(8) A person is economically inactive if not taking part in the labour force, i.e. neither employed nor unemployed.
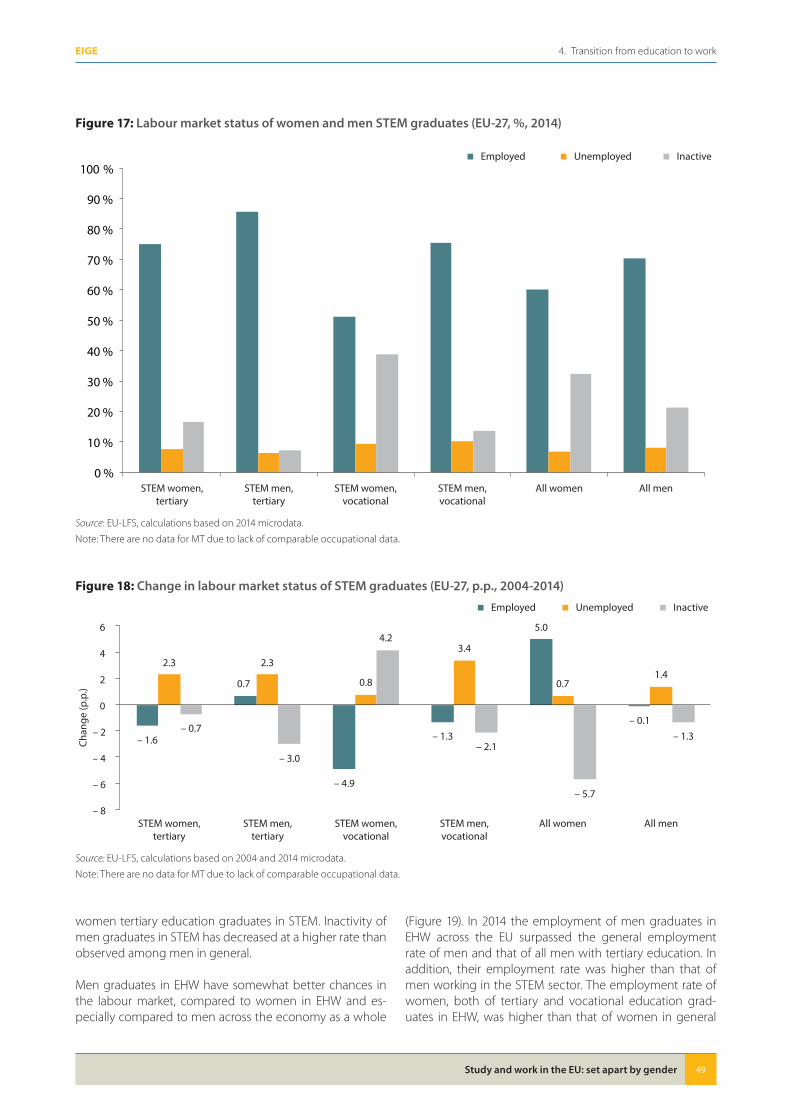
Study and work in the EU: set apart by gender 49
4. Transition from education to workEIGE
women tertiary education graduates in STEM. Inactivity of men graduates in STEM has decreased at a higher rate than observed among men in general.
Men graduates in EHW have somewhat better chances in the labour market, compared to women in EHW and es-pecially compared to men across the economy as a whole
(Figure 19). In 2014 the employment of men graduates in EHW across the EU surpassed the general employment rate of men and that of all men with tertiary education. In addition, their employment rate was higher than that of men working in the STEM sector. The employment rate of women, both of tertiary and vocational education grad-uates in EHW, was higher than that of women in general
Figure 17: Labour market status of women and men STEM graduates (EU-27, %, 2014)
0 %
10 %
20 %
30 %
40 %
50 %
60 %
70 %
80 %
90 %
100 %
STEM women,tertiary
STEM men,tertiary
STEM women,vocational
STEM men,vocational
All women All men
Employed Unemployed Inactive
Source: EU-LFS, calculations based on 2014 microdata.
Note: There are no data for MT due to lack of comparable occupational data.
Figure 18: Change in labour market status of STEM graduates (EU-27, p�p�, 2004-2014)
– 8
– 6
– 4
– 2
0
2
4
6
STEM women,tertiary
STEM men,tertiary
STEM women,vocational
STEM men,vocational
All women All men
Cha
nge
(p.p
.)
Employed Unemployed Inactive
– 1.6
0.7
– 4.9
– 1.3
5.0
– 0.1
2.3 2.3
0.8
3.4
0.71.4
– 0.7
– 3.0
4.2
– 2.1
– 5.7
– 1.3
Source: EU-LFS, calculations based on 2004 and 2014 microdata.
Note: There are no data for MT due to lack of comparable occupational data.
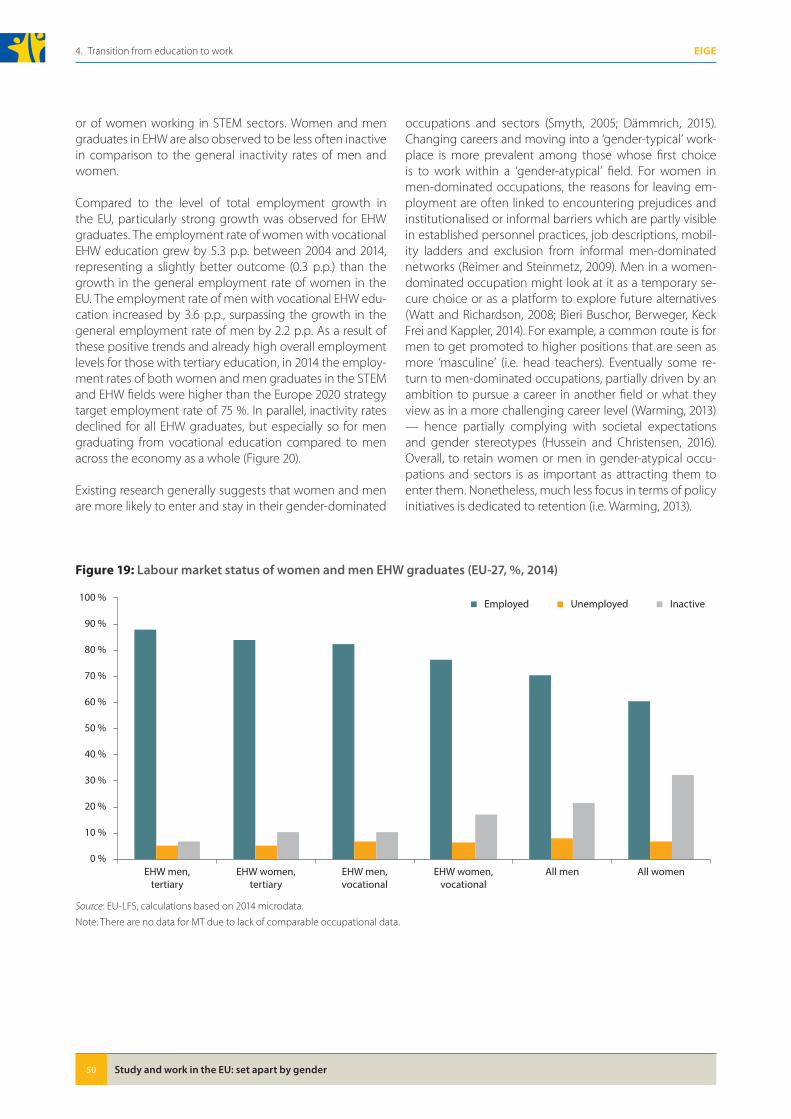
Study and work in the EU: set apart by gender50
4. Transition from education to work EIGE
or of women working in STEM sectors. Women and men graduates in EHW are also observed to be less often inactive in comparison to the general inactivity rates of men and women.
Compared to the level of total employment growth in the EU, particularly strong growth was observed for EHW graduates. The employment rate of women with vocational EHW education grew by 5.3 p.p. between 2004 and 2014, representing a slightly better outcome (0.3 p.p.) than the growth in the general employment rate of women in the EU. The employment rate of men with vocational EHW edu-cation increased by 3.6 p.p., surpassing the growth in the general employment rate of men by 2.2 p.p. As a result of these positive trends and already high overall employment levels for those with tertiary education, in 2014 the employ-ment rates of both women and men graduates in the STEM and EHW fields were higher than the Europe 2020 strategy target employment rate of 75 %. In parallel, inactivity rates declined for all EHW graduates, but especially so for men graduating from vocational education compared to men across the economy as a whole (Figure 20).
Existing research generally suggests that women and men are more likely to enter and stay in their gender-dominated
occupations and sectors (Smyth, 2005; Dämmrich, 2015). Changing careers and moving into a ‘gender-typical’ work-place is more prevalent among those whose first choice is to work within a ‘gender-atypical’ field. For women in men-dominated occupations, the reasons for leaving em-ployment are often linked to encountering prejudices and institutionalised or informal barriers which are partly visible in established personnel practices, job descriptions, mobil-ity ladders and exclusion from informal men-dominated networks (Reimer and Steinmetz, 2009). Men in a women-dominated occupation might look at it as a temporary se-cure choice or as a platform to explore future alternatives (Watt and Richardson, 2008; Bieri Buschor, Berweger, Keck Frei and Kappler, 2014). For example, a common route is for men to get promoted to higher positions that are seen as more ‘masculine’ (i.e. head teachers). Eventually some re-turn to men-dominated occupations, partially driven by an ambition to pursue a career in another field or what they view as in a more challenging career level (Warming, 2013) — hence partially complying with societal expectations and gender stereotypes (Hussein and Christensen, 2016). Overall, to retain women or men in gender-atypical occu-pations and sectors is as important as attracting them to enter them. Nonetheless, much less focus in terms of policy initiatives is dedicated to retention (i.e. Warming, 2013).
Figure 19: Labour market status of women and men EHW graduates (EU-27, %, 2014)
0 %
10 %
20 %
30 %
40 %
50 %
60 %
70 %
80 %
90 %
100 %
EHW men,tertiary
EHW women,tertiary
EHW men,vocational
EHW women,vocational
All men All women
Employed Unemployed Inactive
Source: EU-LFS, calculations based on 2014 microdata.
Note: There are no data for MT due to lack of comparable occupational data.
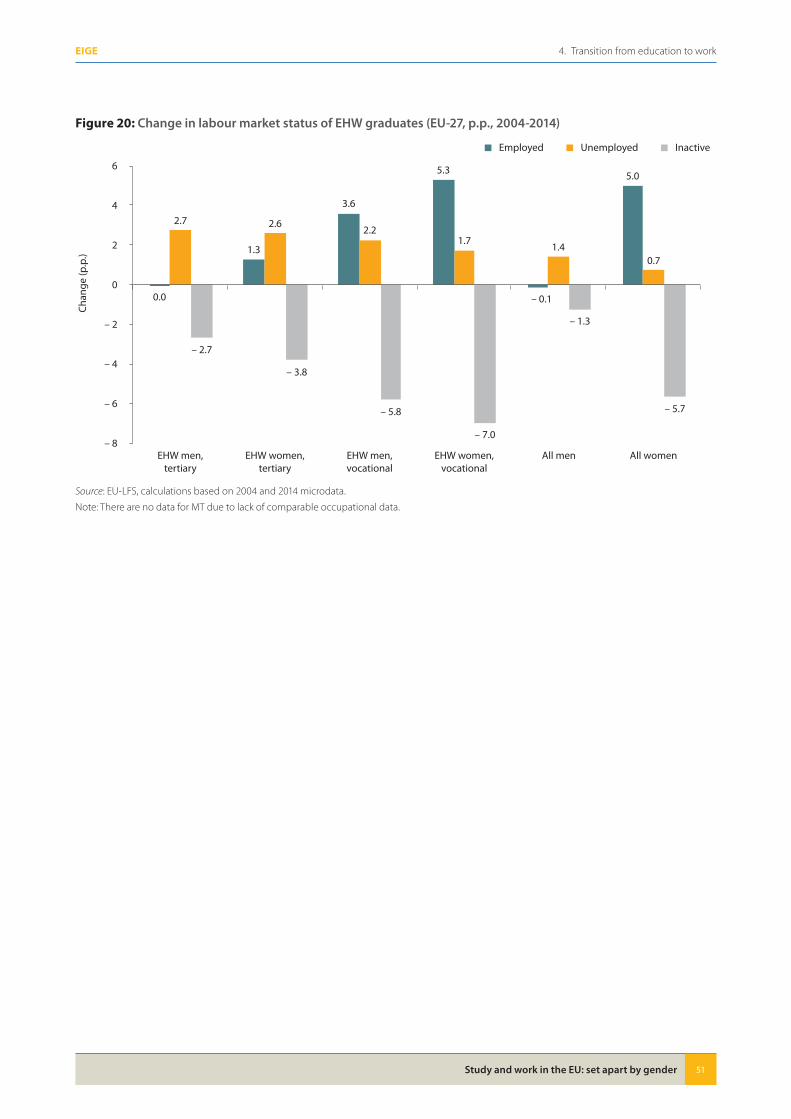
Study and work in the EU: set apart by gender 51
4. Transition from education to workEIGE
Figure 20: Change in labour market status of EHW graduates (EU-27, p�p�, 2004-2014)
0.0
1.3
3.6
5.3
– 0.1
5.0
2.7 2.62.2
1.71.4
0.7
– 2.7
– 3.8
– 5.8
– 7.0
– 1.3
– 5.7
– 8
– 6
– 4
– 2
0
2
4
6
EHW men,tertiary
EHW women,tertiary
EHW men,vocational
EHW women,vocational
All men All women
Cha
nge
(p.p
.)
Employed Unemployed Inactive
Source: EU-LFS, calculations based on 2004 and 2014 microdata.
Note: There are no data for MT due to lack of comparable occupational data.

5. Gender segregation in the labour market

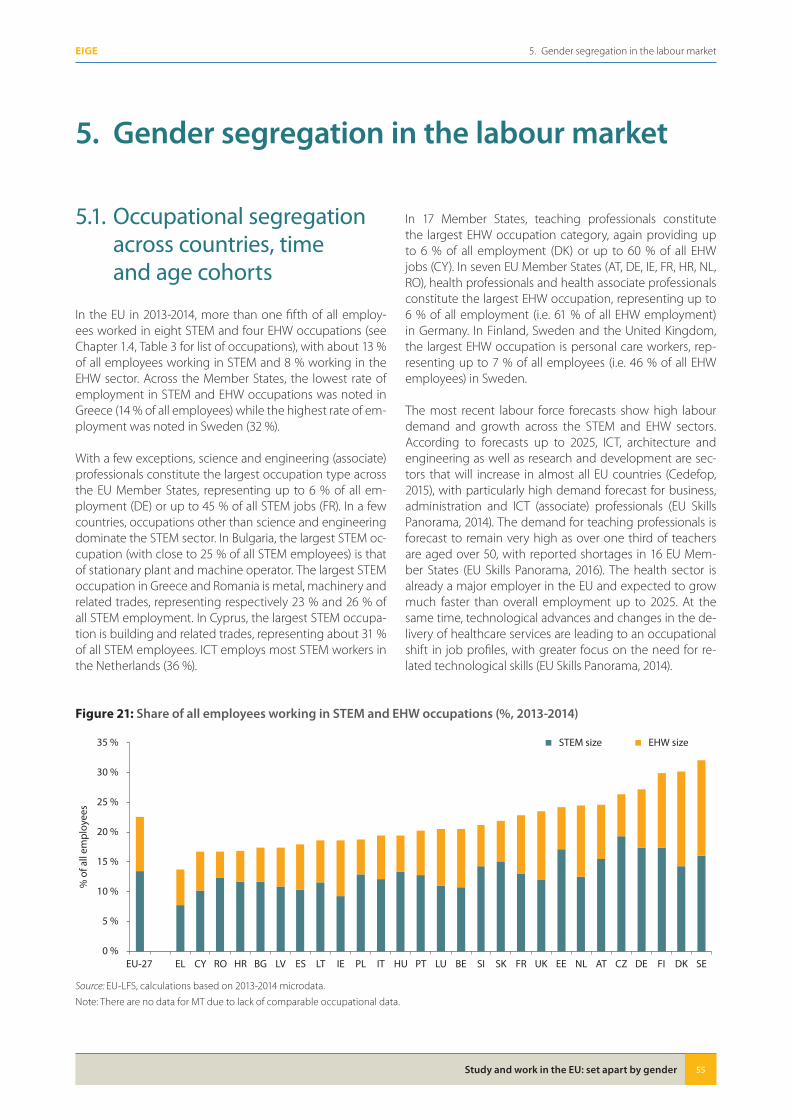
Study and work in the EU: set apart by gender 55
5. Gender segregation in the labour marketEIGE
5� Gender segregation in the labour market
5.1. Occupational segregation across countries, time and age cohorts
In the EU in 2013-2014, more than one fifth of all employ-ees worked in eight STEM and four EHW occupations (see Chapter 1.4, Table 3 for list of occupations), with about 13 % of all employees working in STEM and 8 % working in the EHW sector. Across the Member States, the lowest rate of employment in STEM and EHW occupations was noted in Greece (14 % of all employees) while the highest rate of em-ployment was noted in Sweden (32 %).
With a few exceptions, science and engineering (associate) professionals constitute the largest occupation type across the EU Member States, representing up to 6 % of all em-ployment (DE) or up to 45 % of all STEM jobs (FR). In a few countries, occupations other than science and engineering dominate the STEM sector. In Bulgaria, the largest STEM oc-cupation (with close to 25 % of all STEM employees) is that of stationary plant and machine operator. The largest STEM occupation in Greece and Romania is metal, machinery and related trades, representing respectively 23 % and 26 % of all STEM employment. In Cyprus, the largest STEM occupa-tion is building and related trades, representing about 31 % of all STEM employees. ICT employs most STEM workers in the Netherlands (36 %).
In 17 Member States, teaching professionals constitute the largest EHW occupation category, again providing up to 6 % of all employment (DK) or up to 60 % of all EHW jobs (CY). In seven EU Member States (AT, DE, IE, FR, HR, NL, RO), health professionals and health associate professionals constitute the largest EHW occupation, representing up to 6 % of all employment (i.e. 61 % of all EHW employment) in Germany. In Finland, Sweden and the United Kingdom, the largest EHW occupation is personal care workers, rep-resenting up to 7 % of all employees (i.e. 46 % of all EHW employees) in Sweden.
The most recent labour force forecasts show high labour demand and growth across the STEM and EHW sectors. According to forecasts up to 2025, ICT, architecture and engineering as well as research and development are sec-tors that will increase in almost all EU countries (Cedefop, 2015), with particularly high demand forecast for business, administration and ICT (associate) professionals (EU Skills Panorama, 2014). The demand for teaching professionals is forecast to remain very high as over one third of teachers are aged over 50, with reported shortages in 16 EU Mem-ber States (EU Skills Panorama, 2016). The health sector is already a major employer in the EU and expected to grow much faster than overall employment up to 2025. At the same time, technological advances and changes in the de-livery of healthcare services are leading to an occupational shift in job profiles, with greater focus on the need for re-lated technological skills (EU Skills Panorama, 2014).
Figure 21: Share of all employees working in STEM and EHW occupations (%, 2013-2014)
0 %
5 %
10 %
15 %
20 %
25 %
30 %
35 %
EU-27 EL CY RO HR BG LV ES LT IE PL IT HU PT LU BE SI SK FR UK EE NL AT CZ DE FI DK SE
% o
f all
empl
oyee
s
EHW sizeSTEM size
Source: EU-LFS, calculations based on 2013-2014 microdata.
Note: There are no data for MT due to lack of comparable occupational data.
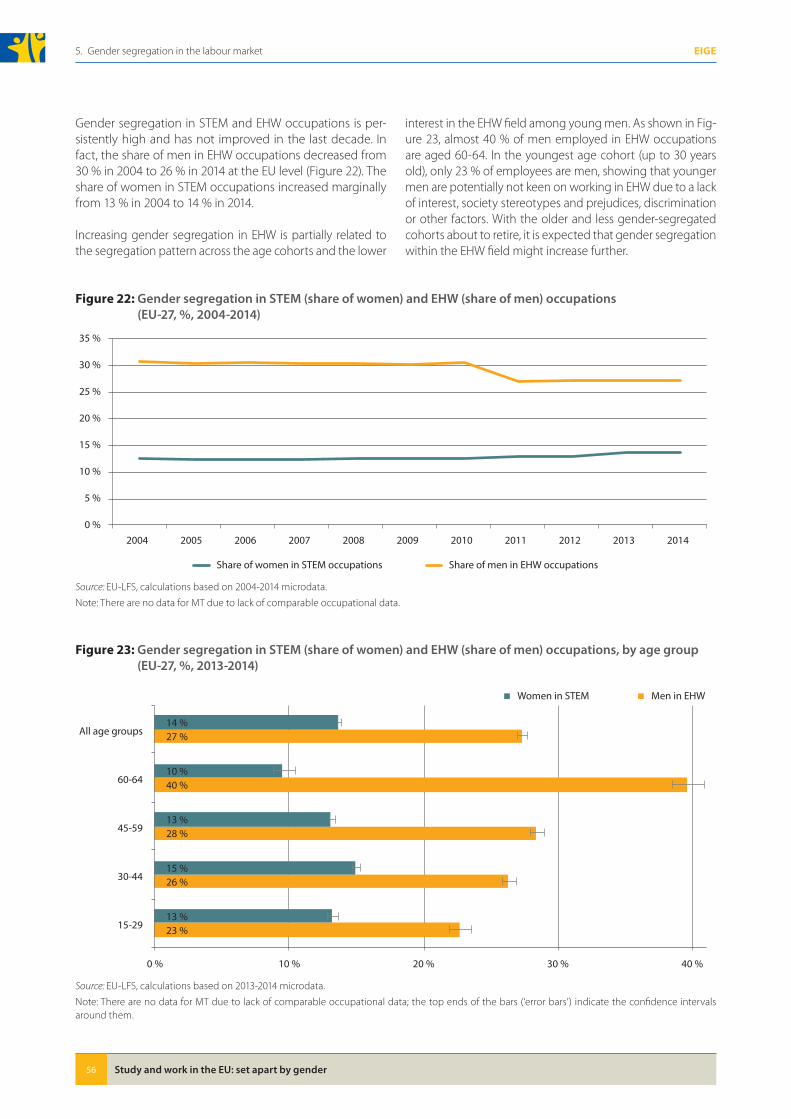
Study and work in the EU: set apart by gender56
5. Gender segregation in the labour market EIGE
Gender segregation in STEM and EHW occupations is per-sistently high and has not improved in the last decade. In fact, the share of men in EHW occupations decreased from 30 % in 2004 to 26 % in 2014 at the EU level (Figure 22). The share of women in STEM occupations increased marginally from 13 % in 2004 to 14 % in 2014.
Increasing gender segregation in EHW is partially related to the segregation pattern across the age cohorts and the lower
interest in the EHW field among young men. As shown in Fig-ure 23, almost 40 % of men employed in EHW occupations are aged 60-64. In the youngest age cohort (up to 30 years old), only 23 % of employees are men, showing that younger men are potentially not keen on working in EHW due to a lack of interest, society stereotypes and prejudices, discrimination or other factors. With the older and less gender-segregated cohorts about to retire, it is expected that gender segregation within the EHW field might increase further.
Figure 22: Gender segregation in STEM (share of women) and EHW (share of men) occupations (EU-27, %, 2004-2014)
0 %
5 %
10 %
15 %
20 %
25 %
30 %
35 %
2004 2005 2006 2007 2008 2009 2010 2011 2012 2013 2014
Share of women in STEM occupations Share of men in EHW occupations
Source: EU-LFS, calculations based on 2004-2014 microdata.
Note: There are no data for MT due to lack of comparable occupational data.
Figure 23: Gender segregation in STEM (share of women) and EHW (share of men) occupations, by age group (EU-27, %, 2013-2014)
23 %
26 %
28 %
40 %
27 %
13 %
15 %
13 %
10 %
14 %
0 % 10 % 20 % 30 % 40 %
15-29
30-44
45-59
60-64
All age groups
Women in STEM Men in EHW
Source: EU-LFS, calculations based on 2013-2014 microdata.
Note: There are no data for MT due to lack of comparable occupational data; the top ends of the bars (‘error bars’) indicate the confidence intervals around them.
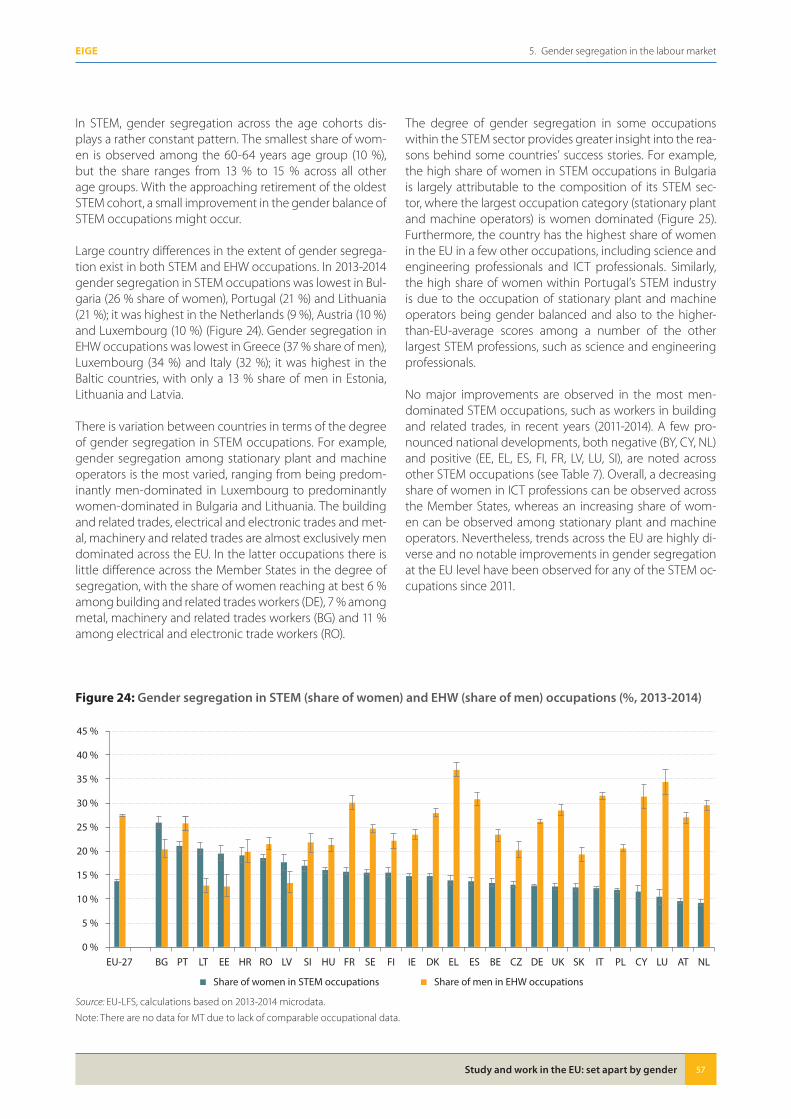
Study and work in the EU: set apart by gender 57
5. Gender segregation in the labour marketEIGE
In STEM, gender segregation across the age cohorts dis-plays a rather constant pattern. The smallest share of wom-en is observed among the 60-64 years age group (10 %), but the share ranges from 13 % to 15 % across all other age groups. With the approaching retirement of the oldest STEM cohort, a small improvement in the gender balance of STEM occupations might occur.
Large country differences in the extent of gender segrega-tion exist in both STEM and EHW occupations. In 2013-2014 gender segregation in STEM occupations was lowest in Bul-garia (26 % share of women), Portugal (21 %) and Lithuania (21 %); it was highest in the Netherlands (9 %), Austria (10 %) and Luxembourg (10 %) (Figure 24). Gender segregation in EHW occupations was lowest in Greece (37 % share of men), Luxembourg (34 %) and Italy (32 %); it was highest in the Baltic countries, with only a 13 % share of men in Estonia, Lithuania and Latvia.
There is variation between countries in terms of the degree of gender segregation in STEM occupations. For example, gender segregation among stationary plant and machine operators is the most varied, ranging from being predom-inantly men-dominated in Luxembourg to predominantly women-dominated in Bulgaria and Lithuania. The building and related trades, electrical and electronic trades and met-al, machinery and related trades are almost exclusively men dominated across the EU. In the latter occupations there is little difference across the Member States in the degree of segregation, with the share of women reaching at best 6 % among building and related trades workers (DE), 7 % among metal, machinery and related trades workers (BG) and 11 % among electrical and electronic trade workers (RO).
The degree of gender segregation in some occupations within the STEM sector provides greater insight into the rea-sons behind some countries’ success stories. For example, the high share of women in STEM occupations in Bulgaria is largely attributable to the composition of its STEM sec-tor, where the largest occupation category (stationary plant and machine operators) is women dominated (Figure 25). Furthermore, the country has the highest share of women in the EU in a few other occupations, including science and engineering professionals and ICT professionals. Similarly, the high share of women within Portugal’s STEM industry is due to the occupation of stationary plant and machine operators being gender balanced and also to the higher-than-EU-average scores among a number of the other largest STEM professions, such as science and engineering professionals.
No major improvements are observed in the most men-dominated STEM occupations, such as workers in building and related trades, in recent years (2011-2014). A few pro-nounced national developments, both negative (BY, CY, NL) and positive (EE, EL, ES, FI, FR, LV, LU, SI), are noted across other STEM occupations (see Table 7). Overall, a decreasing share of women in ICT professions can be observed across the Member States, whereas an increasing share of wom-en can be observed among stationary plant and machine operators. Nevertheless, trends across the EU are highly di-verse and no notable improvements in gender segregation at the EU level have been observed for any of the STEM oc-cupations since 2011.
Figure 24: Gender segregation in STEM (share of women) and EHW (share of men) occupations (%, 2013-2014)
0 %
5 %
10 %
15 %
20 %
25 %
30 %
35 %
40 %
45 %
EU-27 BG PT LT EE HR RO LV SI HU FR SE FI IE DK EL ES BE CZ DE UK SK IT PL CY LU AT NL
Share of women in STEM occupations Share of men in EHW occupations
Source: EU-LFS, calculations based on 2013-2014 microdata.
Note: There are no data for MT due to lack of comparable occupational data.
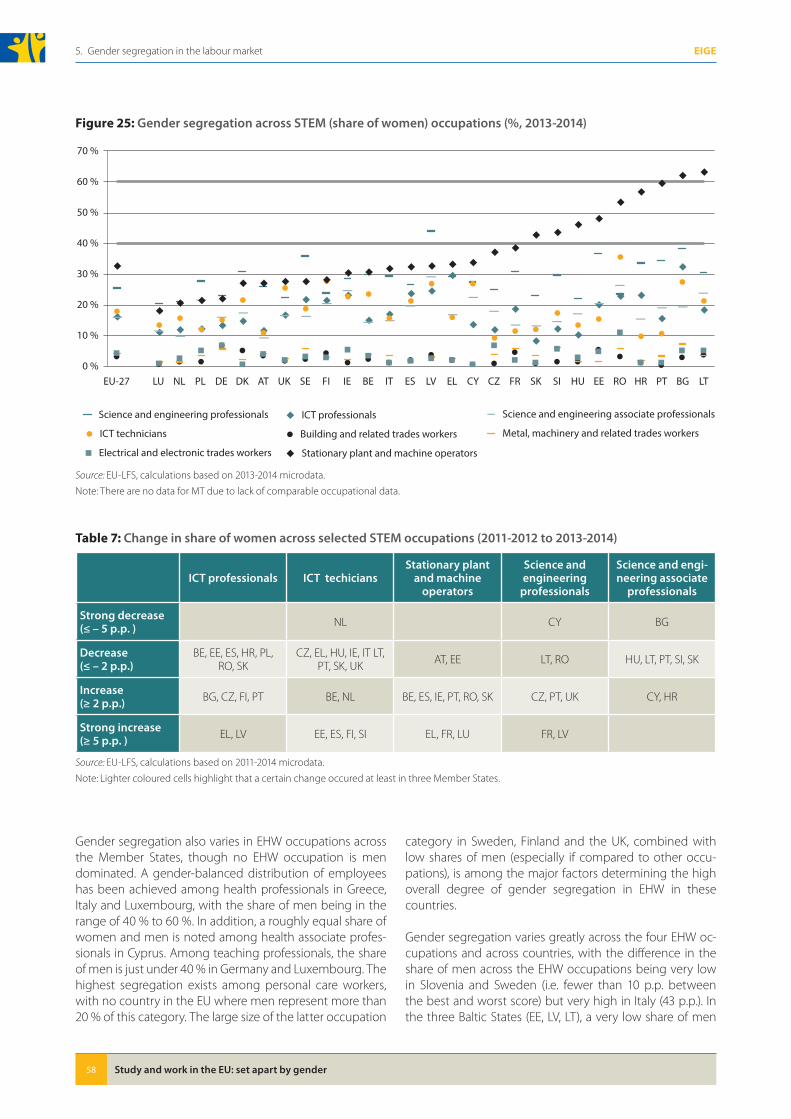
Study and work in the EU: set apart by gender58
5. Gender segregation in the labour market EIGE
Gender segregation also varies in EHW occupations across the Member States, though no EHW occupation is men dominated. A gender-balanced distribution of employees has been achieved among health professionals in Greece, Italy and Luxembourg, with the share of men being in the range of 40 % to 60 %. In addition, a roughly equal share of women and men is noted among health associate profes-sionals in Cyprus. Among teaching professionals, the share of men is just under 40 % in Germany and Luxembourg. The highest segregation exists among personal care workers, with no country in the EU where men represent more than 20 % of this category. The large size of the latter occupation
category in Sweden, Finland and the UK, combined with low shares of men (especially if compared to other occu-pations), is among the major factors determining the high overall degree of gender segregation in EHW in these countries.
Gender segregation varies greatly across the four EHW oc-cupations and across countries, with the difference in the share of men across the EHW occupations being very low in Slovenia and Sweden (i.e. fewer than 10 p.p. between the best and worst score) but very high in Italy (43 p.p.). In the three Baltic States (EE, LV, LT), a very low share of men
Figure 25: Gender segregation across STEM (share of women) occupations (%, 2013-2014)
0 %
10 %
20 %
30 %
40 %
50 %
60 %
70 %
EU-27 LU NL PL DE DK AT UK SE FI IE BE IT ES LV EL CY CZ FR SK SI HU EE RO HR PT BG LT
Science and engineering professionals ICT professionals Science and engineering associate professionals
ICT technicians Building and related trades workers Metal, machinery and related trades workers
Electrical and electronic trades workers Stationary plant and machine operators
Source: EU-LFS, calculations based on 2013-2014 microdata.
Note: There are no data for MT due to lack of comparable occupational data.
Table 7: Change in share of women across selected STEM occupations (2011-2012 to 2013-2014)
ICT professionals ICT techiciansStationary plant
and machine operators
Science and engineering
professionals
Science and engi-neering associate
professionals
Strong decrease (≤ – 5 p�p� ) NL CY BG
Decrease (≤ – 2 p�p�)
BE, EE, ES, HR, PL, RO, SK
CZ, EL, HU, IE, IT LT, PT, SK, UK AT, EE LT, RO HU, LT, PT, SI, SK
Increase (≥ 2 p�p�) BG, CZ, FI, PT BE, NL BE, ES, IE, PT, RO, SK CZ, PT, UK CY, HR
Strong increase (≥ 5 p�p� ) EL, LV EE, ES, FI, SI EL, FR, LU FR, LV
Source: EU-LFS, calculations based on 2011-2014 microdata.
Note: Lighter coloured cells highlight that a certain change occured at least in three Member States.
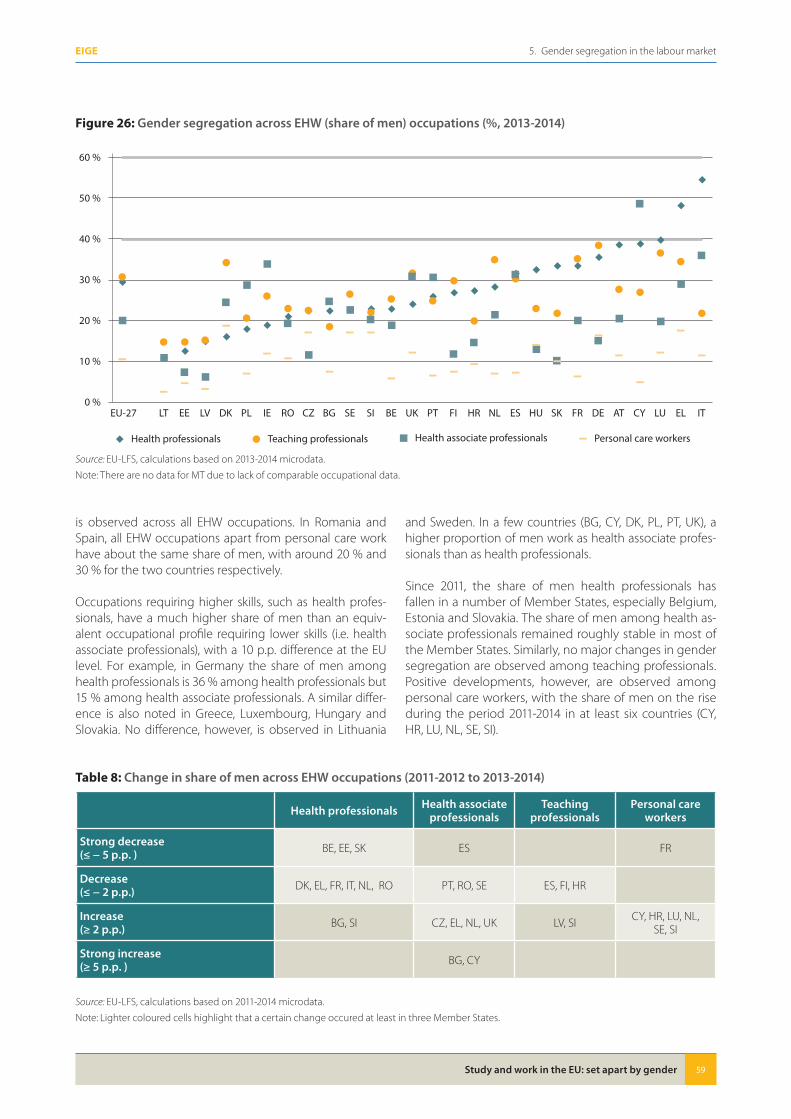
Study and work in the EU: set apart by gender 59
5. Gender segregation in the labour marketEIGE
is observed across all EHW occupations. In Romania and Spain, all EHW occupations apart from personal care work have about the same share of men, with around 20 % and 30 % for the two countries respectively.
Occupations requiring higher skills, such as health profes-sionals, have a much higher share of men than an equiv-alent occupational profile requiring lower skills (i.e. health associate professionals), with a 10 p.p. difference at the EU level. For example, in Germany the share of men among health professionals is 36 % among health professionals but 15 % among health associate professionals. A similar differ-ence is also noted in Greece, Luxembourg, Hungary and Slovakia. No difference, however, is observed in Lithuania
and Sweden. In a few countries (BG, CY, DK, PL, PT, UK), a higher proportion of men work as health associate profes-sionals than as health professionals.
Since 2011, the share of men health professionals has fallen in a number of Member States, especially Belgium, Estonia and Slovakia. The share of men among health as-sociate professionals remained roughly stable in most of the Member States. Similarly, no major changes in gender segregation are observed among teaching professionals. Positive developments, however, are observed among personal care workers, with the share of men on the rise during the period 2011-2014 in at least six countries (CY, HR, LU, NL, SE, SI).
Figure 26: Gender segregation across EHW (share of men) occupations (%, 2013-2014)
0 %
10 %
20 %
30 %
40 %
50 %
60 %
EU-27 LT EE LV DK PL IE RO CZ BG SE SI BE UK PT FI HR NL ES HU SK FR DE AT CY LU EL IT
Health professionals Teaching professionals Health associate professionals Personal care workers
Source: EU-LFS, calculations based on 2013-2014 microdata.
Note: There are no data for MT due to lack of comparable occupational data.
Table 8: Change in share of men across EHW occupations (2011-2012 to 2013-2014)
Health professionals Health associate professionals
Teaching professionals
Personal care workers
Strong decrease (≤ − 5 p�p� ) BE, EE, SK ES FR
Decrease (≤ − 2 p�p�) DK, EL, FR, IT, NL, RO PT, RO, SE ES, FI, HR
Increase (≥ 2 p�p�) BG, SI CZ, EL, NL, UK LV, SI CY, HR, LU, NL,
SE, SI
Strong increase (≥ 5 p�p� ) BG, CY
Source: EU-LFS, calculations based on 2011-2014 microdata.
Note: Lighter coloured cells highlight that a certain change occured at least in three Member States.
Study and work in the EU: set apart by gender60
5. Gender segregation in the labour market EIGE
5.2. Gender pay gap in gender-segregated sectors
The gender pay gap remains remarkably resilient across all Member States, despite more than 30 years of equal pay legislation. It affects not only current earnings, but also lifetime earnings and pension entitlements (Smith, 2010). A number of influences account for the gender pay gap, including differences in educational levels, competences, access to promotion, number of working hours and career length and concentration of women within low value-added jobs, especially ones that lack union representation (Burchell et al., 2014).
Research shows that gender differences relating to the ob-servable characteristics of employees (i.e. education and career length) explain just part of the pay gap (OECD, 2012). The proportion of the gap that cannot be explained by these characteristics is particularly high at the upper end of the wage distribution. This reflects the strong role of (verti-cal) gender segregation in the labour market and the ac-companying glass-ceiling effect.
Although the impact of many of these factors varies across countries, gender segregation (in sectors and occupations) is recognised as an underlying factor for the gender pay gap across all EU countries. Recent research (Boll, Leppin, Rossen and Wolf, 2016) based on data from 2010 concludes that for all countries, a significant part of the gender pay gap is due to the fact that women are over-represented in sectors with lower pay levels, such as education, health and social work. On the other hand, men dominate higher pay sectors, such as construction and chemical products and electric and transport equipment.
Research shows that earnings of both women and men are lower in women-dominated occupations. However, when it comes to the gender pay gap within those occupations, the results point to rather different outcomes across coun-tries, with for example a stronger negative effect for men in Germany (Busch and Holst, 2011). Overall, the average pay gap at the occupational level in the EU is fairly small as it masks large differences across countries and across/within occupations (European Commission, 2002).
The negative association between the share of women in an occupation and average wages in that occupation has frequently been interpreted as an expression of the devalu-ation of women’s work (Reid, 1998; Tomaskovic-Devey, 2002; de Ruijter et al., 2003; England et al., 2007). As noted by Eng-land (2010, p. 153): ‘The devaluation of and underpayment of predominantly female occupations is an important insti-tutional reality that provides incentives for both men and women to choose ‘male’ over ‘female’ occupations and the fields of study that lead to them. Biases in job evaluation
practices, the degree of ‘professionalisation’ of occupations, the length of occupational ladders and the visibility of skills all emerge as important factors in sustaining gender seg-regation, although they do not exhaust the list. Existing re-search also notes that the lower wages in women-dominat-ed occupations were supposedly settled in the past though still determine wages in these occupations (England et al., 2007). In recent years, mostly due to the financial crisis, many jobs in the EU and especially jobs in the public sector (i.e. education) underwent significant budgetary cuts.
Paradoxically, even today gender segregation implies both discrimination and protection of women’s earnings. A recent cross-national study by Jarman, Blackburn and Racko (2012) examines the interplay of differences in pay, social stratifica-tion and occupational segregation in 30 industrial countries. The authors note that ‘for over a century, researchers have linked occupational feminisation to disadvantaged out-comes in terms of pay, prestige, power and attractiveness of the occupation concerned, both for the women entering the occupation, and also for the occupation as a whole.’ One crucial finding is, however, that while segregation is certainly related to discrimination against women, it is also the case that the ‘less they are in competition with men (higher over-all segregation) the greater their attainment of senior pos-itions’ and the more likely they are to be in more desirable jobs with better social positioning. Moreover, occupational segregation and the gender gap in pay were found to be in-versely related to a certain degree (Jarman et al., 2012): ‘The position of women is more favourable where the overall segregation is higher — the lower the male advantage on pay and the greater the female advantage on stratification.’
Over the last decade, there has been no clear trend towards the reduction of the gender pay gap (O’Reilly, Smith, Deakin and Burchell, 2015). In some countries where the gap has been traditionally rather low, such as Italy and Portugal, the gap increased after the economic crisis. As argued by Peru-zzi (2015), this can be attributed to an expansion of women’s employment in lower-wage sectors. This highlights the risk of increasing the rates of women employment at the cost of the expansion of low-quality employment.
Recent statistics show that the average gender pay gap was higher in the EHW sector compared to the STEM sec-tor in almost all countries in 2015 (except in BE, CY, DK, EL, IE, LU, LV). Belgium had a negative gender pay gap (pay levels were higher for women compared to men) among EHW subsectors in 2015 (– 1 % in human health and social work). While in STEM only Estonia and Ireland exceeded the 20 % pay gap, this was the case for seven countries (BG, CZ, EE, FI, HR, SK, UK) in the EHW sector. The high gender pay gap in EHW was due to large gender pay biases in hu-man health and social work activities in almost all countries (i.e. the gender pay gap in the health sector was higher compared to education), except Belgium, Ireland, France, Luxembourg and Austria.
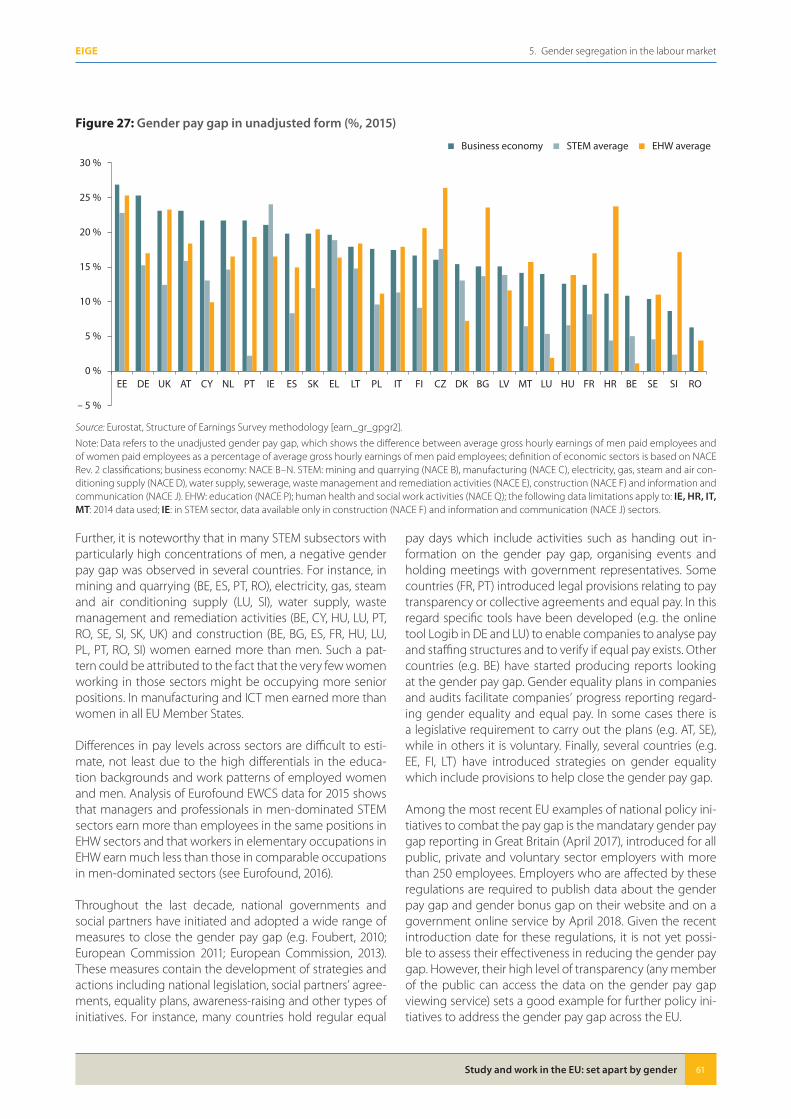
Study and work in the EU: set apart by gender 61
5. Gender segregation in the labour marketEIGE
Further, it is noteworthy that in many STEM subsectors with particularly high concentrations of men, a negative gender pay gap was observed in several countries. For instance, in mining and quarrying (BE, ES, PT, RO), electricity, gas, steam and air conditioning supply (LU, SI), water supply, waste management and remediation activities (BE, CY, HU, LU, PT, RO, SE, SI, SK, UK) and construction (BE, BG, ES, FR, HU, LU, PL, PT, RO, SI) women earned more than men. Such a pat-tern could be attributed to the fact that the very few women working in those sectors might be occupying more senior positions. In manufacturing and ICT men earned more than women in all EU Member States.
Differences in pay levels across sectors are difficult to esti-mate, not least due to the high differentials in the educa-tion backgrounds and work patterns of employed women and men. Analysis of Eurofound EWCS data for 2015 shows that managers and professionals in men-dominated STEM sectors earn more than employees in the same positions in EHW sectors and that workers in elementary occupations in EHW earn much less than those in comparable occupations in men-dominated sectors (see Eurofound, 2016).
Throughout the last decade, national governments and social partners have initiated and adopted a wide range of measures to close the gender pay gap (e.g. Foubert, 2010; European Commission 2011; European Commission, 2013). These measures contain the development of strategies and actions including national legislation, social partners’ agree-ments, equality plans, awareness-raising and other types of initiatives. For instance, many countries hold regular equal
pay days which include activities such as handing out in-formation on the gender pay gap, organising events and holding meetings with government representatives. Some countries (FR, PT) introduced legal provisions relating to pay transparency or collective agreements and equal pay. In this regard specific tools have been developed (e.g. the online tool Logib in DE and LU) to enable companies to analyse pay and staffing structures and to verify if equal pay exists. Other countries (e.g. BE) have started producing reports looking at the gender pay gap. Gender equality plans in companies and audits facilitate companies’ progress reporting regard-ing gender equality and equal pay. In some cases there is a legislative requirement to carry out the plans (e.g. AT, SE), while in others it is voluntary. Finally, several countries (e.g. EE, FI, LT) have introduced strategies on gender equality which include provisions to help close the gender pay gap.
Among the most recent EU examples of national policy ini-tiatives to combat the pay gap is the mandatary gender pay gap reporting in Great Britain (April 2017), introduced for all public, private and voluntary sector employers with more than 250 employees. Employers who are affected by these regulations are required to publish data about the gender pay gap and gender bonus gap on their website and on a government online service by April 2018. Given the recent introduction date for these regulations, it is not yet possi-ble to assess their effectiveness in reducing the gender pay gap. However, their high level of transparency (any member of the public can access the data on the gender pay gap viewing service) sets a good example for further policy ini-tiatives to address the gender pay gap across the EU.
Figure 27: Gender pay gap in unadjusted form (%, 2015)
– 5 %
0 %
5 %
10 %
15 %
20 %
25 %
30 %
EE DE UK AT CY NL PT IE ES SK EL LT PL IT FI CZ DK BG LV MT LU HU FR HR BE SE SI RO
Business economy STEM average EHW average
Source: Eurostat, Structure of Earnings Survey methodology [earn_gr_gpgr2].
Note: Data refers to the unadjusted gender pay gap, which shows the difference between average gross hourly earnings of men paid employees and of women paid employees as a percentage of average gross hourly earnings of men paid employees; definition of economic sectors is based on NACE Rev. 2 classifications; business economy: NACE B–N. STEM: mining and quarrying (NACE B), manufacturing (NACE C), electricity, gas, steam and air con-ditioning supply (NACE D), water supply, sewerage, waste management and remediation activities (NACE E), construction (NACE F) and information and communication (NACE J). EHW: education (NACE P); human health and social work activities (NACE Q); the following data limitations apply to: IE, HR, IT, MT: 2014 data used; IE: in STEM sector, data available only in construction (NACE F) and information and communication (NACE J) sectors.

6. Segregation-influencing factors

Study and work in the EU: set apart by gender 65
6. Segregation-influencing factorsEIGE
6� Segregation-influencing factors
There is no single factor that can unilaterally explain the emergence, prevalence and recreation of segregation in education and the labour market (Bettio and Verashchagina, 2009). The factors spread across various levels: the individual level (i.e. personal achievements and motivation), the or-ganisational level (i.e. teaching practices, curriculum, organi-sational gender culture) and the societal (or country) level.
Overall, segregation in education and segregation in the labour market are strongly coupled. In order to understand segregation in the labour market, one needs to understand educational gender segregation and what influences the educational differences of girls and boys during their school years. Thus, the positioning of an individual in the labour market is the result of long-term developments over the course of their life (Hillmert, 2015).
Gender stereotypes
The influence of stereotypes and the dominant expecta-tions in society in causing and recreating segregation in ed-ucation as well as the labour market are well documented (Reskin and Bielby, 2005; Bettio and Verashchagina, 2009). Stereotypes are prescriptions of appropriate behaviour that apply to different spheres of life, including study and em-ployment choices (Reskin and Bielby, 2005). According to prominent approaches to the social construction of gender, people are held accountable for acting in accordance with the prescribed gender roles and stereotypes in any given society (Allegrini, Pellegrini and Segafredo, 2015) (9).
Stereotypes can have both a direct and indirect impact on gender segregation; they impact the choice of study fields or occupations that women and men take by driving inter-est towards specific subjects that are deemed ‘appropriate’ (Reskin and Bielby, 2005; Burchell et al., 2014; Henriksen, Dil-lon and Ryder, 2014). People’s choices can therefore be in-terpreted as a sign of what the culture accepts and enforces as appropriate gender behaviour in relation to a specific field of study or occupation.
For example, participation in STEM is traditionally associ-ated with various stereotypically masculine identity traits and roles (Charles and Bradley, 2009; Morgan et al., 2013; Charles, Harr, Cech and Hendley, 2014; Gabay-Egozi et al., 2014; Henriksen et al., 2014; Legewie and DiPrete, 2014). This is enforced by the long-lasting historical and cultural idea
that science is male gendered, an idea that remains persis-tent in the discipline (Allegrini et al., 2015; Ulriksen, Madsen and Holmegaard, 2015). This stereotypical association stems from the association of men with objectivity and rationality, while irrationality and emotionality are purportedly wom-en’s attributes. Similar associations could be made with fields and professions associated with caring and educat-ing, which are traditionally deemed feminine.
Current research (van der Vleuten et al., 2016) suggests that a more traditional gender ideology leads to gender-stereo-typical educational choices among adolescent boys, but not among girls. Gender expectations appear to affect what boys prefer to do at present and what they find important for the future. The dominant association of science as mas-culine makes it particularly challenging for girls to see STEM as a potential career choice and, on the other hand, may equip boys with easily available and pre-established roles in science and technology (Henriksen et al., 2014). The same applies to the EHW field, which might be seen as a potential career choice first and foremost for girls, particularly in re-lation to the roles of caring and educating. Overall, these re-sults support the idea that gender expectations are stricter for boys than girls and that cross-gendered pathways are currently more acceptable for girls than for boys (van der Vleuten et al., 2016).
Stereotypes can also make it challenging for individuals to remain in their chosen career pathway. Students who dif-fer from what is considered normal within their field exper-ience more challenges in being academically and socially accepted as well as in developing an identity of belonging to the discipline (Ulriksen et al., 2015 based on university students; Solomon, Radovic and Black, 2016). Likewise, in the labour market deviation from the ‘norm’ is not toler-ated. For example, though it comes with monetary pen-alties, women working part-time is typically viewed as an enabling factor in terms of work and family balance. The equivalent choice among men, however, is often met with strong resistance as it deviates even further from the ‘norm’.
Furthermore, stereotypes can drive recruitment and em-ployment practices (see, for instance, Bettio and Verashcha-gina, 2009; Burchell et al., 2014). They also shape country-level policies or institutional frameworks such as policies supporting the combination of work and family life, which in turn have an impact on gender segregation in education systems and labour markets.
(9) For an in-depth discussion of the ways and reasons why gender is constructed and upheld in social interaction, see Candace West and Don H. Zimmerman (1987), ‘Doing gender’, Gender & Society, Vol. 1, No 2, pp. 125-151 and Judith Butler (1990), Gender trouble: feminism and the subversion of identity, Routledge, London.
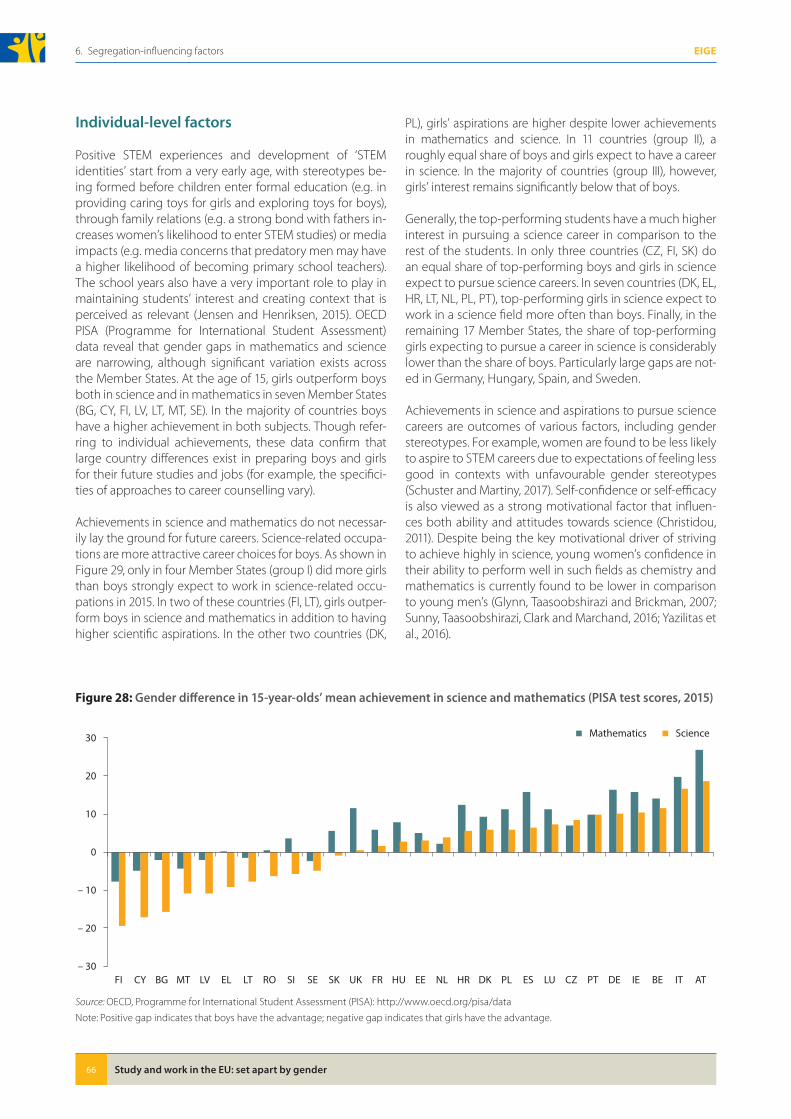
Study and work in the EU: set apart by gender66
6. Segregation-influencing factors EIGE
Individual-level factors
Positive STEM experiences and development of ‘STEM identities’ start from a very early age, with stereotypes be-ing formed before children enter formal education (e.g. in providing caring toys for girls and exploring toys for boys), through family relations (e.g. a strong bond with fathers in-creases women’s likelihood to enter STEM studies) or media impacts (e.g. media concerns that predatory men may have a higher likelihood of becoming primary school teachers). The school years also have a very important role to play in maintaining students’ interest and creating context that is perceived as relevant (Jensen and Henriksen, 2015). OECD PISA (Programme for International Student Assessment) data reveal that gender gaps in mathematics and science are narrowing, although significant variation exists across the Member States. At the age of 15, girls outperform boys both in science and in mathematics in seven Member States (BG, CY, FI, LV, LT, MT, SE). In the majority of countries boys have a higher achievement in both subjects. Though refer-ring to individual achievements, these data confirm that large country differences exist in preparing boys and girls for their future studies and jobs (for example, the specifici-ties of approaches to career counselling vary).
Achievements in science and mathematics do not necessar-ily lay the ground for future careers. Science-related occupa-tions are more attractive career choices for boys. As shown in Figure 29, only in four Member States (group I) did more girls than boys strongly expect to work in science-related occu-pations in 2015. In two of these countries (FI, LT), girls outper-form boys in science and mathematics in addition to having higher scientific aspirations. In the other two countries (DK,
PL), girls’ aspirations are higher despite lower achievements in mathematics and science. In 11 countries (group II), a roughly equal share of boys and girls expect to have a career in science. In the majority of countries (group III), however, girls’ interest remains significantly below that of boys.
Generally, the top-performing students have a much higher interest in pursuing a science career in comparison to the rest of the students. In only three countries (CZ, FI, SK) do an equal share of top-performing boys and girls in science expect to pursue science careers. In seven countries (DK, EL, HR, LT, NL, PL, PT), top-performing girls in science expect to work in a science field more often than boys. Finally, in the remaining 17 Member States, the share of top-performing girls expecting to pursue a career in science is considerably lower than the share of boys. Particularly large gaps are not-ed in Germany, Hungary, Spain, and Sweden.
Achievements in science and aspirations to pursue science careers are outcomes of various factors, including gender stereotypes. For example, women are found to be less likely to aspire to STEM careers due to expectations of feeling less good in contexts with unfavourable gender stereotypes (Schuster and Martiny, 2017). Self-confidence or self-efficacy is also viewed as a strong motivational factor that influen-ces both ability and attitudes towards science (Christidou, 2011). Despite being the key motivational driver of striving to achieve highly in science, young women’s confidence in their ability to perform well in such fields as chemistry and mathematics is currently found to be lower in comparison to young men’s (Glynn, Taasoobshirazi and Brickman, 2007; Sunny, Taasoobshirazi, Clark and Marchand, 2016; Yazilitas et al., 2016).
Figure 28: Gender difference in 15-year-olds’ mean achievement in science and mathematics (PISA test scores, 2015)
– 30
– 20
– 10
0
10
20
30
FI CY BG MT LV EL LT RO SI SE SK UK FR HU EE NL HR DK PL ES LU CZ PT DE IE BE IT AT
Mathematics Science
Source: OECD, Programme for International Student Assessment (PISA): http://www.oecd.org/pisa/data
Note: Positive gap indicates that boys have the advantage; negative gap indicates that girls have the advantage.
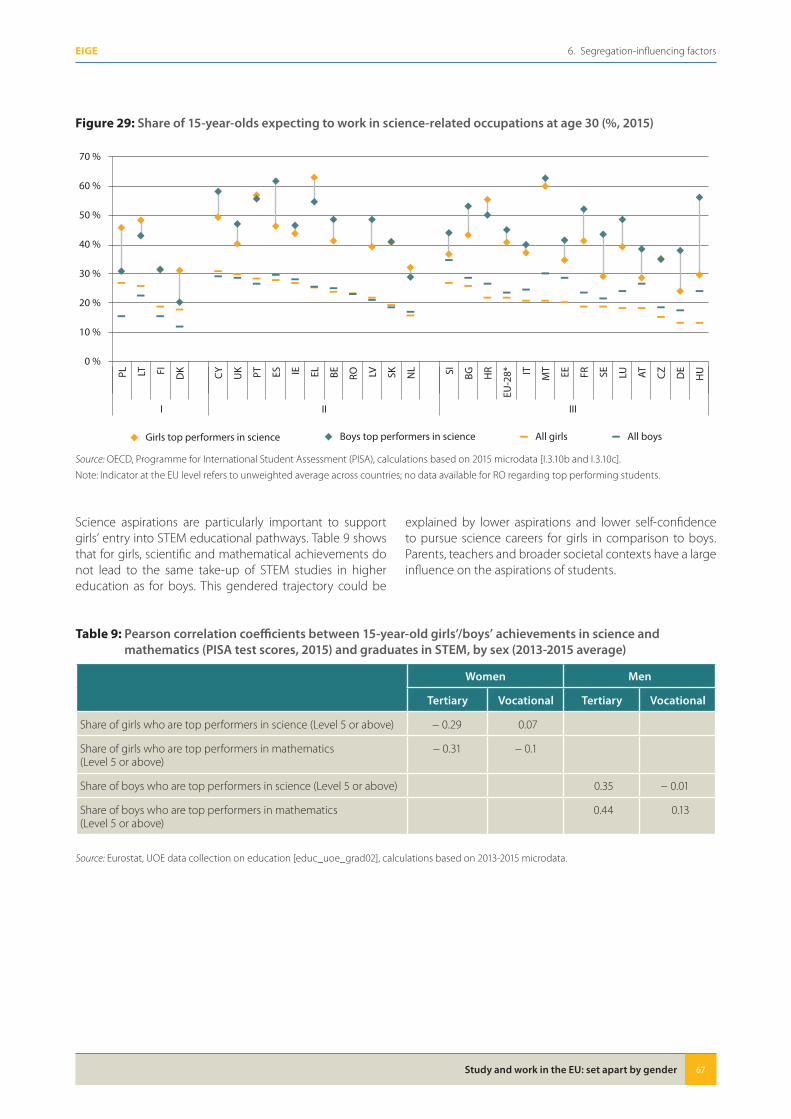
Study and work in the EU: set apart by gender 67
6. Segregation-influencing factorsEIGE
Science aspirations are particularly important to support girls’ entry into STEM educational pathways. Table 9 shows that for girls, scientific and mathematical achievements do not lead to the same take-up of STEM studies in higher education as for boys. This gendered trajectory could be
explained by lower aspirations and lower self-confidence to pursue science careers for girls in comparison to boys. Parents, teachers and broader societal contexts have a large influence on the aspirations of students.
Figure 29: Share of 15-year-olds expecting to work in science-related occupations at age 30 (%, 2015)
0 %
10 %
20 %
30 %
40 %
50 %
60 %
70 %
PL LT FI DK CY UK PT ES IE EL BE RO LV SK NL SI BG HR
EU-2
8* IT MT EE FR SE LU AT CZ DE
HU
I II III
Girls top performers in science Boys top performers in science All girls All boys
Source: OECD, Programme for International Student Assessment (PISA), calculations based on 2015 microdata [I.3.10b and I.3.10c].
Note: Indicator at the EU level refers to unweighted average across countries; no data available for RO regarding top performing students.
Table 9: Pearson correlation coefficients between 15-year-old girls’/boys’ achievements in science and mathematics (PISA test scores, 2015) and graduates in STEM, by sex (2013-2015 average)
Women Men
Tertiary Vocational Tertiary Vocational
Share of girls who are top performers in science (Level 5 or above) − 0.29 0.07
Share of girls who are top performers in mathematics (Level 5 or above)
− 0.31 − 0.1
Share of boys who are top performers in science (Level 5 or above) 0.35 − 0.01
Share of boys who are top performers in mathematics (Level 5 or above)
0.44 0.13
Source: Eurostat, UOE data collection on education [educ_uoe_grad02], calculations based on 2013-2015 microdata.
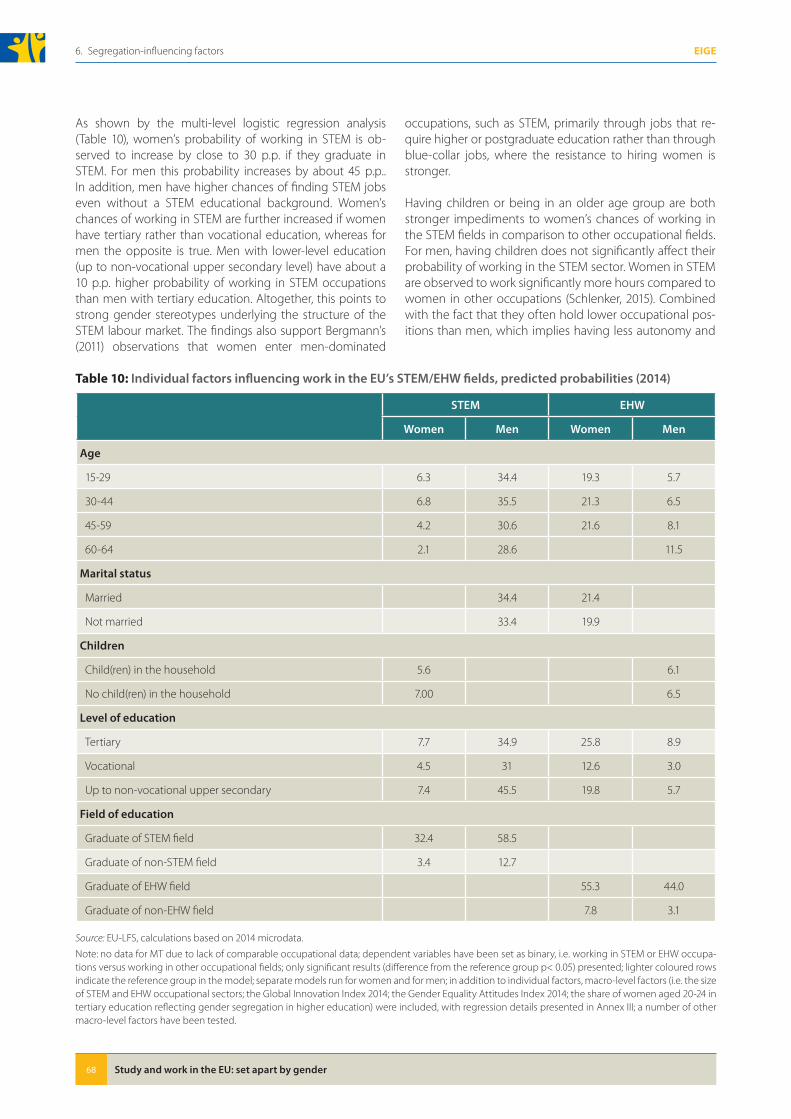
Study and work in the EU: set apart by gender68
6. Segregation-influencing factors EIGE
As shown by the multi-level logistic regression analysis (Table 10), women’s probability of working in STEM is ob-served to increase by close to 30 p.p. if they graduate in STEM. For men this probability increases by about 45 p.p.. In addition, men have higher chances of finding STEM jobs even without a STEM educational background. Women’s chances of working in STEM are further increased if women have tertiary rather than vocational education, whereas for men the opposite is true. Men with lower-level education (up to non-vocational upper secondary level) have about a 10 p.p. higher probability of working in STEM occupations than men with tertiary education. Altogether, this points to strong gender stereotypes underlying the structure of the STEM labour market. The findings also support Bergmann’s (2011) observations that women enter men-dominated
occupations, such as STEM, primarily through jobs that re-quire higher or postgraduate education rather than through blue-collar jobs, where the resistance to hiring women is stronger.
Having children or being in an older age group are both stronger impediments to women’s chances of working in the STEM fields in comparison to other occupational fields. For men, having children does not significantly affect their probability of working in the STEM sector. Women in STEM are observed to work significantly more hours compared to women in other occupations (Schlenker, 2015). Combined with the fact that they often hold lower occupational pos-itions than men, which implies having less autonomy and
Table 10: Individual factors influencing work in the EU’s STEM/EHW fields, predicted probabilities (2014)
STEM EHW
Women Men Women Men
Age
15-29 6.3 34.4 19.3 5.7
30-44 6.8 35.5 21.3 6.5
45-59 4.2 30.6 21.6 8.1
60-64 2.1 28.6 11.5
Marital status
Married 34.4 21.4
Not married 33.4 19.9
Children
Child(ren) in the household 5.6 6.1
No child(ren) in the household 7.00 6.5
Level of education
Tertiary 7.7 34.9 25.8 8.9
Vocational 4.5 31 12.6 3.0
Up to non-vocational upper secondary 7.4 45.5 19.8 5.7
Field of education
Graduate of STEM field 32.4 58.5
Graduate of non-STEM field 3.4 12.7
Graduate of EHW field 55.3 44.0
Graduate of non-EHW field 7.8 3.1
Source: EU-LFS, calculations based on 2014 microdata.
Note: no data for MT due to lack of comparable occupational data; dependent variables have been set as binary, i.e. working in STEM or EHW occupa-tions versus working in other occupational fields; only significant results (difference from the reference group p< 0.05) presented; lighter coloured rows indicate the reference group in the model; separate models run for women and for men; in addition to individual factors, macro-level factors (i.e. the size of STEM and EHW occupational sectors; the Global Innovation Index 2014; the Gender Equality Attitudes Index 2014; the share of women aged 20-24 in tertiary education reflecting gender segregation in higher education) were included, with regression details presented in Annex III; a number of other macro-level factors have been tested.
Study and work in the EU: set apart by gender 69
6. Segregation-influencing factorsEIGE
poorer working conditions, STEM workplaces seem to pro-vide less scope for staff to combine work and family.
The aforementioned factors have a rather different influ-ence for women and men working in the EHW field. Men generally have a lower probability of working in EHW than women, especially younger men (15-29 years old) and those with children in the household. According to Madichie (2013), entering a stereotypically women’s field can imply setbacks in prestige and pay for men. In combination with still active stereotypes of men being the main breadwinner of the family, one could argue that men with children still tend to avoid gender atypical jobs due to potential psycho-logical uneasiness and potentially lower pay observed in women-dominated sectors.
Nonetheless, having children has a somewhat smaller effect on men’s chances of being employed in EHW than it does for women to be employed in STEM occupations. More-over, and in contrast to what is observed for the STEM sector, having children in the household is insignificant in terms of women’s chances of working in EHW. Overall, women aged 45-59 and married women have the highest probability of working in the EHW field.
Men with tertiary education have higher chances of work-ing in EHW in comparison to men with vocational or lower education. As for women in STEM, tertiary education seems to serve as a ‘stepping stone’ for men to discover and work in the EHW field.
Organisational-level factors
Working conditions are often viewed as one factor under-lying gender segregation (Eurofound, 2013). Research evi-dence shows that working conditions for women and men within and between gender-segregated sectors of employ-ment are different. In particular, women in men-dominated sectors tend to experience gender discrimination more of-ten than men, as well as differences in task allocation, fewer opportunities for promotion and lower salaries. At the same time, men working in women-dominated sectors have more opportunities for promotion, take more senior posts and earn higher salaries compared to women.
Overall, job quality is a multifaceted concept that refers to both actual and perceived differences in employment and working conditions. It refers to characteristics of work (work autonomy, physical working conditions, risks for health and safety), characteristics of employment (working hours, wage, job security) and numerous other characteristics that affect the subjective and objective well-being of employ-ees (see European Parliament, 2009). In the present study, Eurofound’s conceptualisation of job quality is used. It is
measured by seven job quality indices: physical environ-ment; work intensity; working-time quality; social environ-ment; skills and discretion; prospects; and earnings (Euro-found, 2012; Eurofound, 2013; Eurofound, 2016).
Analysis of differences between the median of sub-groups, based on the Kruskal-Wallis test, shows that the indices for physical environment (ergonomic and ambient factors, such as lifting heavy objects and working with toxic vapours) are highest (10) in gender-neutral sectors and lowest in the STEM sector (see Annex IV). Men working in EHW occupa-tions assess their physical working environment more posi-tively than women. In STEM, women report better physical work conditions than men. This can be partially explained by the fact that in STEM men are more often employed in blue-collar jobs, whereas very few women are found in such jobs. Therefore, women in STEM tend to take on rela-tively more senior positions than all men employed in the STEM industry. In contrast, more women than men work in manual occupations within the EHW field and are therefore less satisfied with at least the physical environment.
Overall, work intensity (quantitative and emotional de-mands, pace determinants and inter-dependency) is slight-ly stronger in STEM than in the EHW sector, as reported by those working in the respective field. Furthermore, women and men take on jobs of the same intensity within the STEM sector. This is in line with existing research observations, that women in STEM take more intensive jobs compared to women in EHW occupations (Schlenker, 2015). In contrast, the job intensity index is slightly higher for women working in the EHW sector as compared to men.
The EHW sector has higher estimated job prospects (pos-sibilities for career advancement) than all other sectors. This might be related to the high share of white-collar occupa-tions including permanent contracts in the sector and clear and transparent processes for career advancement. The EHW sector is also dominated by jobs in the public sector, giving further room for more transparent and well-defined career models.
The median of skills and discretion in the EHW sector is at least 9 points higher than in STEM, indicating that EHW em-ployees perceive their opportunities to use their skills and have autonomy to be higher than those in the STEM sector. This is most likely related to the good (and often manda-tory) access to opportunities for skills advancement in these specific sectors and to the fact that there are probably more opportunities and resources available for training in the public sector. A comparison between broad EHW and STEM sectors should also be made with caution, as high- and low-skilled occupations might have different weights across the two sectors. For example, a number of STEM
(10) A higher Index score means fewer physical risks and thus a better physical environment.
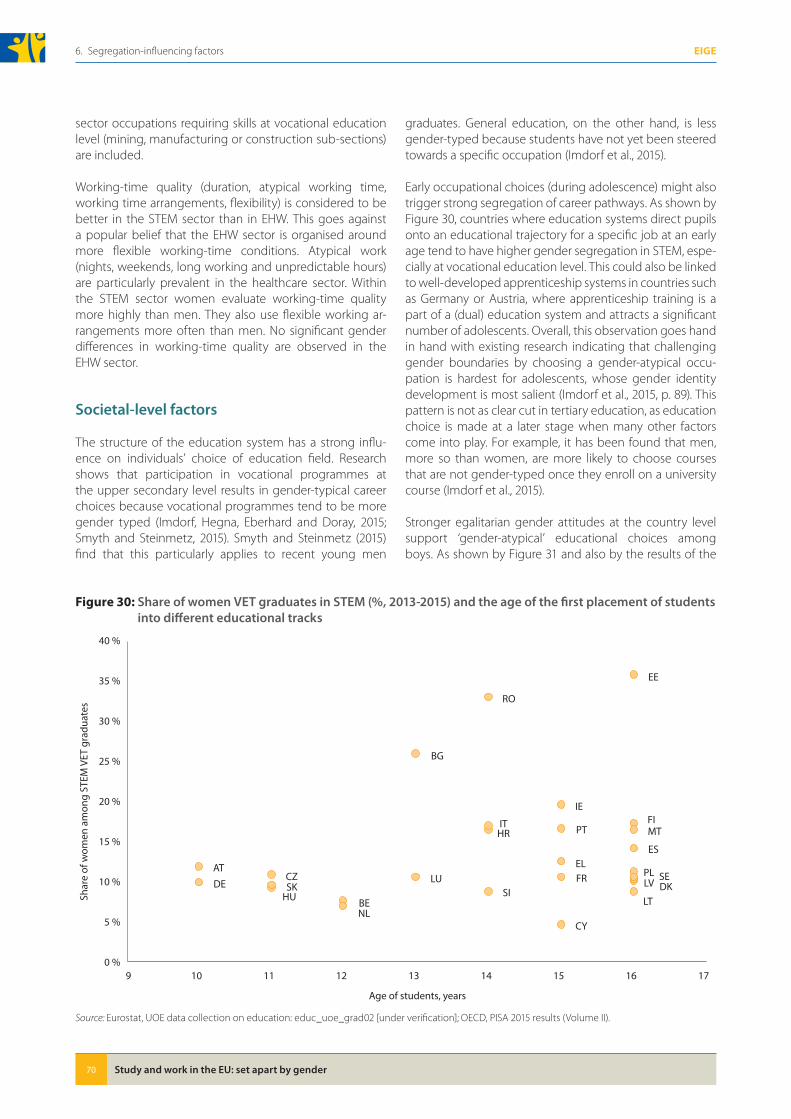
Study and work in the EU: set apart by gender70
6. Segregation-influencing factors EIGE
sector occupations requiring skills at vocational education level (mining, manufacturing or construction sub-sections) are included.
Working-time quality (duration, atypical working time, working time arrangements, flexibility) is considered to be better in the STEM sector than in EHW. This goes against a popular belief that the EHW sector is organised around more flexible working-time conditions. Atypical work (nights, weekends, long working and unpredictable hours) are particularly prevalent in the healthcare sector. Within the STEM sector women evaluate working-time quality more highly than men. They also use flexible working ar-rangements more often than men. No significant gender differences in working-time quality are observed in the EHW sector.
Societal-level factors
The structure of the education system has a strong influ-ence on individuals’ choice of education field. Research shows that participation in vocational programmes at the upper secondary level results in gender-typical career choices because vocational programmes tend to be more gender typed (Imdorf, Hegna, Eberhard and Doray, 2015; Smyth and Steinmetz, 2015). Smyth and Steinmetz (2015) find that this particularly applies to recent young men
graduates. General education, on the other hand, is less gender-typed because students have not yet been steered towards a specific occupation (Imdorf et al., 2015).
Early occupational choices (during adolescence) might also trigger strong segregation of career pathways. As shown by Figure 30, countries where education systems direct pupils onto an educational trajectory for a specific job at an early age tend to have higher gender segregation in STEM, espe-cially at vocational education level. This could also be linked to well-developed apprenticeship systems in countries such as Germany or Austria, where apprenticeship training is a part of a (dual) education system and attracts a significant number of adolescents. Overall, this observation goes hand in hand with existing research indicating that challenging gender boundaries by choosing a gender-atypical occu-pation is hardest for adolescents, whose gender identity development is most salient (Imdorf et al., 2015, p. 89). This pattern is not as clear cut in tertiary education, as education choice is made at a later stage when many other factors come into play. For example, it has been found that men, more so than women, are more likely to choose courses that are not gender-typed once they enroll on a university course (Imdorf et al., 2015).
Stronger egalitarian gender attitudes at the country level support ‘gender-atypical’ educational choices among boys. As shown by Figure 31 and also by the results of the
Figure 30: Share of women VET graduates in STEM (%, 2013-2015) and the age of the first placement of students into different educational tracks
AT
BE
BG
CY
CZDE DK
EE
ELES
FI
FR
HR
HU
IE
IT
LT
LU LV
MT
NL
PL
PT
RO
SE
SISK
0 %
5 %
10 %
15 %
20 %
25 %
30 %
35 %
40 %
9 10 11 12 13 14 15 16 17
Shar
e of
wom
en a
mon
g ST
EM V
ET g
radu
ates
Age of students, years
Source: Eurostat, UOE data collection on education: educ_uoe_grad02 [under verification]; OECD, PISA 2015 results (Volume II).
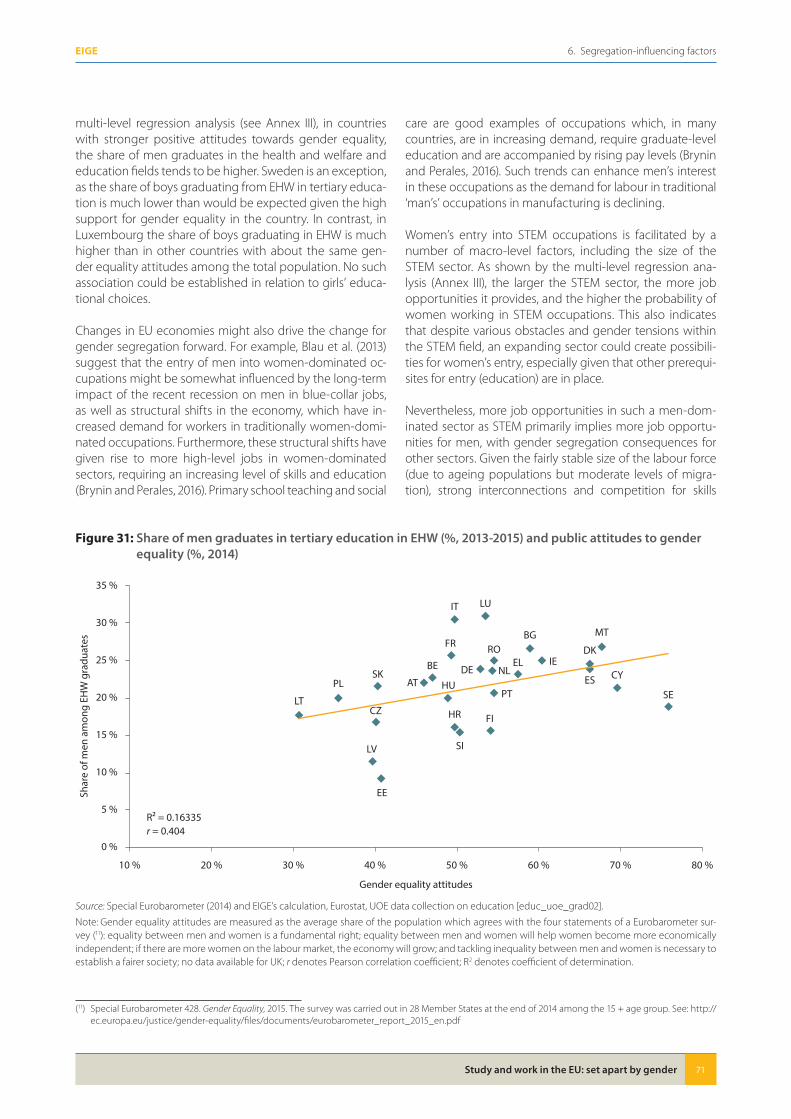
Study and work in the EU: set apart by gender 71
6. Segregation-influencing factorsEIGE
multi-level regression analysis (see Annex III), in countries with stronger positive attitudes towards gender equality, the share of men graduates in the health and welfare and education fields tends to be higher. Sweden is an exception, as the share of boys graduating from EHW in tertiary educa-tion is much lower than would be expected given the high support for gender equality in the country. In contrast, in Luxembourg the share of boys graduating in EHW is much higher than in other countries with about the same gen-der equality attitudes among the total population. No such association could be established in relation to girls’ educa-tional choices.
Changes in EU economies might also drive the change for gender segregation forward. For example, Blau et al. (2013) suggest that the entry of men into women-dominated oc-cupations might be somewhat influenced by the long-term impact of the recent recession on men in blue-collar jobs, as well as structural shifts in the economy, which have in-creased demand for workers in traditionally women-domi-nated occupations. Furthermore, these structural shifts have given rise to more high-level jobs in women-dominated sectors, requiring an increasing level of skills and education (Brynin and Perales, 2016). Primary school teaching and social
care are good examples of occupations which, in many countries, are in increasing demand, require graduate-level education and are accompanied by rising pay levels (Brynin and Perales, 2016). Such trends can enhance men’s interest in these occupations as the demand for labour in traditional ‘man’s’ occupations in manufacturing is declining.
Women’s entry into STEM occupations is facilitated by a number of macro-level factors, including the size of the STEM sector. As shown by the multi-level regression ana-lysis (Annex III), the larger the STEM sector, the more job opportunities it provides, and the higher the probability of women working in STEM occupations. This also indicates that despite various obstacles and gender tensions within the STEM field, an expanding sector could create possibili-ties for women’s entry, especially given that other prerequi-sites for entry (education) are in place.
Nevertheless, more job opportunities in such a men-dom-inated sector as STEM primarily implies more job opportu-nities for men, with gender segregation consequences for other sectors. Given the fairly stable size of the labour force (due to ageing populations but moderate levels of migra-tion), strong interconnections and competition for skills
(11) Special Eurobarometer 428. Gender Equality, 2015. The survey was carried out in 28 Member States at the end of 2014 among the 15 + age group. See: http://ec.europa.eu/justice/gender-equality/files/documents/eurobarometer_report_2015_en.pdf
Figure 31: Share of men graduates in tertiary education in EHW (%, 2013-2015) and public attitudes to gender equality (%, 2014)
AT
BE
BG
CY
CZ
DE
DK
EE
EL
ES
FI
FR
HR
HU
IE
IT
LT
LU
LV
MT
NLPL
PT
RO
SE
SI
SK
R² = 0.16335r = 0.404
0 %
5 %
10 %
15 %
20 %
25 %
30 %
35 %
10 % 20 % 30 % 40 % 50 % 60 % 70 % 80 %
Shar
e of
men
am
ong
EHW
gra
duat
es
Gender equality attitudes
Source: Special Eurobarometer (2014) and EIGE’s calculation, Eurostat, UOE data collection on education [educ_uoe_grad02].
Note: Gender equality attitudes are measured as the average share of the population which agrees with the four statements of a Eurobarometer sur-vey (11): equality between men and women is a fundamental right; equality between men and women will help women become more economically independent; if there are more women on the labour market, the economy will grow; and tackling inequality between men and women is necessary to establish a fairer society; no data available for UK; r denotes Pearson correlation coefficient; R2 denotes coefficient of determination.
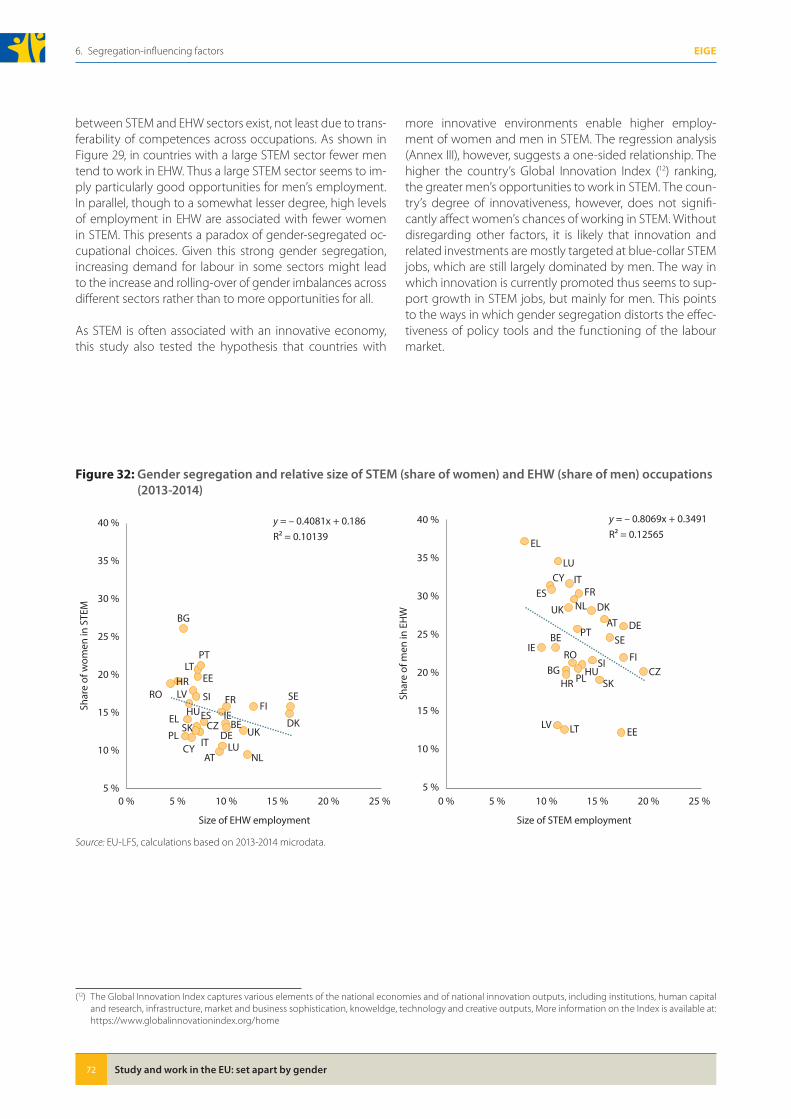
Study and work in the EU: set apart by gender72
6. Segregation-influencing factors EIGE
between STEM and EHW sectors exist, not least due to trans-ferability of competences across occupations. As shown in Figure 29, in countries with a large STEM sector fewer men tend to work in EHW. Thus a large STEM sector seems to im-ply particularly good opportunities for men’s employment. In parallel, though to a somewhat lesser degree, high levels of employment in EHW are associated with fewer women in STEM. This presents a paradox of gender-segregated oc-cupational choices. Given this strong gender segregation, increasing demand for labour in some sectors might lead to the increase and rolling-over of gender imbalances across different sectors rather than to more opportunities for all.
As STEM is often associated with an innovative economy, this study also tested the hypothesis that countries with
more innovative environments enable higher employ-ment of women and men in STEM. The regression analysis (Annex III), however, suggests a one-sided relationship. The higher the country’s Global Innovation Index (12) ranking, the greater men’s opportunities to work in STEM. The coun-try’s degree of innovativeness, however, does not signifi-cantly affect women’s chances of working in STEM. Without disregarding other factors, it is likely that innovation and related investments are mostly targeted at blue-collar STEM jobs, which are still largely dominated by men. The way in which innovation is currently promoted thus seems to sup-port growth in STEM jobs, but mainly for men. This points to the ways in which gender segregation distorts the effec-tiveness of policy tools and the functioning of the labour market.
Figure 32: Gender segregation and relative size of STEM (share of women) and EHW (share of men) occupations (2013-2014)
AT
BE
BG
CY
CZDE
DK
EE
ESFI
FR
EL
HR
HU IE
IT
LT
LU
LV
NL
PL
PT
RO SESI
SK UK
y = – 0.4081x + 0.186 R² = 0.10139
5 %
10 %
15 %
20 %
25 %
30 %
35 %
40 %
0 % 5 % 10 % 15 % 20 % 25 %
Shar
e of
wom
en in
STE
M
Size of EHW employment
ATBE
BG
CY
CZ
DE
DK
EE
ES
FI
FR
EL
HRHU
IE
IT
LT
LU
LV
NL
PL
PT
ROSE
SI
SK
UK
y = – 0.8069x + 0.3491 R² = 0.12565
5 %
10 %
15 %
20 %
25 %
30 %
35 %
40 %
0 % 5 % 10 % 15 % 20 % 25 %
Shar
e of
men
in E
HW
Size of STEM employment
Source: EU-LFS, calculations based on 2013-2014 microdata.
(12) The Global Innovation Index captures various elements of the national economies and of national innovation outputs, including institutions, human capital and research, infrastructure, market and business sophistication, knoweldge, technology and creative outputs, More information on the Index is available at: https://www.globalinnovationindex.org/home
7. Proposed revision of Beijing Platform for Action indicators

Study and work in the EU: set apart by gender 75
7. Proposed revision of Beijing Platform for Action indicatorsEIGE
7� Proposed revision of Beijing Platform for Action indicators
On the basis of the findings of this report, EIGE proposes a number of adjustments in order to streamline the current BPfA indicators, make the monitoring on gender segrega-tion in education, training and the labour market more operational and more closely link it to possible policy re-sponses. Specifically, EIGE proposes the following BPfA revi-sions (see Table 11 for visual presentation and Annex V for more details):
� Retain the current indicator under Area K: Women and the Environment and retain the current gender segregation indicator in terms of the gender pay gap under Area F: Women and the Economy� If the first indicator is specifically designed to monitor gender-balanced decision-making capacity in the area of environmental protection, the second indicator enables the monitoring of pay differences in gender-segregated sectors and occupations. Thus, both indicators meet their specific objectives and provide important complementary information to monitor gender segregation in terms of participation in education, training and the labour market.
� Propose a new indicator under Area B: Education and Training of Women, which would merge and revise information currently (with overlaps) collected by (1) two current indicators under Area B: Education and Training of Women and by (2) an indicator on the share of ‘girl students in tertiary education’ under Area L: The Girl Child� The new indicator would expand coverage from tertiary education to non-tertiary vocational education and would focus collection of information on the study fields with the highest degrees of gender segregation. Specifically, the new indicator would enable monitoring trends regarding the ‘proportion of women and men graduates in tertiary (ISCED levels 5-8) and vocational
(ISCED levels 3-4) education and training in the fields of science, technology, engineering and mathematics (STEM) and in the field of education, health and welfare (EHW) — of all graduates in the study field’.
� Propose a new indicator under Area L: the Girl Child, which would enable monitoring of gender differences in career aspirations and expectations� As shown by the findings of this report, girls are catching up with boys in science or mathematics proficiency. Nonetheless, better performance does not yet lead into the pursuit of science-related careers, with stagnant gender-related stereotypes influencing future job aspirations and remaining among the major underlying factors of gender-segregated labour markets. The proposed new indicator — ‘proportion of all and top-performing girls and boys in science aged 15 expecting to work in science-related occupations at age 30’ — would provide a necessary and timely monitoring tool not only to address gender segregation within the education system but also within the labour market.
� Propose a new indicator under Area F: Women and the Economy to monitor gender segregation within the labour market, with a necessary focus on occupations in the STEM and EHW employment fields. Though gender segregation on the labour market has an immense influence on the functioning of our societies, economies and the labour market itself, no indicator under the BPfA currently enables monitoring of the phenomenon. The proposed indicator would allow a closer and more regular monitoring of gender segregation across the EU labour markets, providing a needed and timely evidence basis for respective education and training, labour market or associated social (i.e. on work–life balance) policy responses.
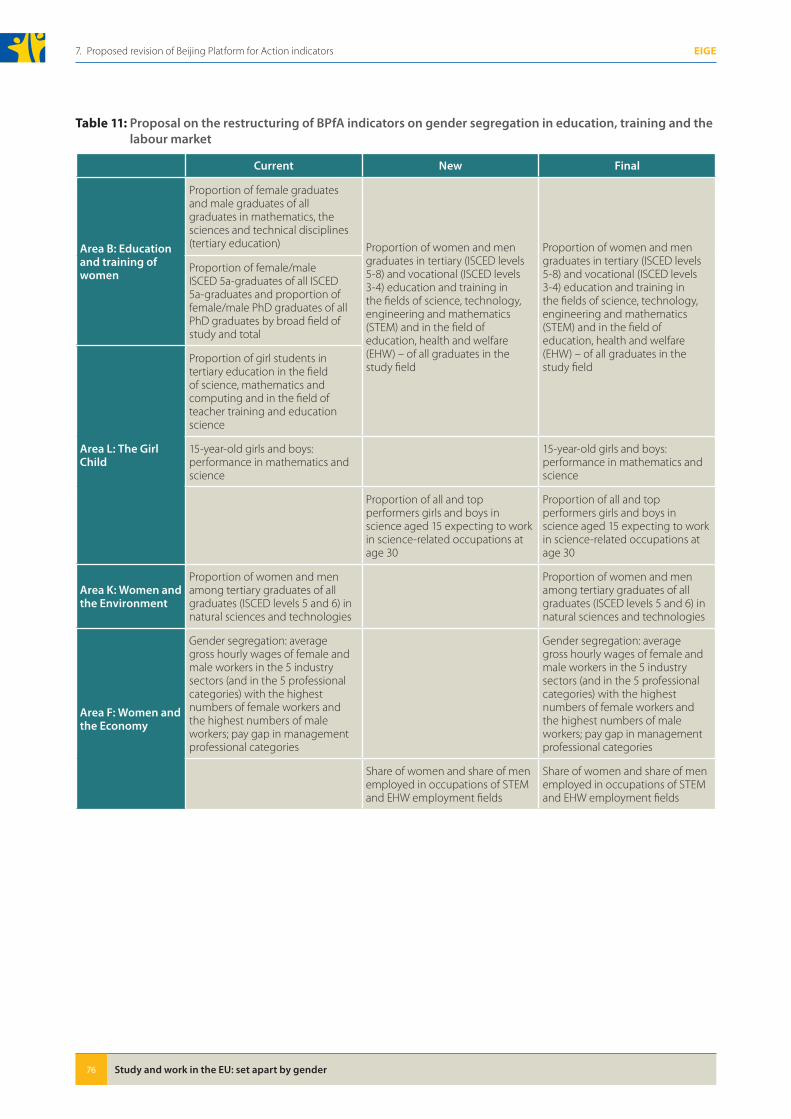
Study and work in the EU: set apart by gender76
7. Proposed revision of Beijing Platform for Action indicators EIGE
Table 11: Proposal on the restructuring of BPfA indicators on gender segregation in education, training and the labour market
Current New Final
Area B: Education and training of women
Proportion of female graduates and male graduates of all graduates in mathematics, the sciences and technical disciplines (tertiary education) Proportion of women and men
graduates in tertiary (ISCED levels 5-8) and vocational (ISCED levels 3-4) education and training in the fields of science, technology, engineering and mathematics (STEM) and in the field of education, health and welfare (EHW) – of all graduates in the study field
Proportion of women and men graduates in tertiary (ISCED levels 5-8) and vocational (ISCED levels 3-4) education and training in the fields of science, technology, engineering and mathematics (STEM) and in the field of education, health and welfare (EHW) – of all graduates in the study field
Proportion of female/male ISCED 5a-graduates of all ISCED 5a-graduates and proportion of female/male PhD graduates of all PhD graduates by broad field of study and total
Area L: The Girl Child
Proportion of girl students in tertiary education in the field of science, mathematics and computing and in the field of teacher training and education science
15-year-old girls and boys: performance in mathematics and science
15-year-old girls and boys: performance in mathematics and science
Proportion of all and top performers girls and boys in science aged 15 expecting to work in science-related occupations at age 30
Proportion of all and top performers girls and boys in science aged 15 expecting to work in science-related occupations at age 30
Area K: Women and the Environment
Proportion of women and men among tertiary graduates of all graduates (ISCED levels 5 and 6) in natural sciences and technologies
Proportion of women and men among tertiary graduates of all graduates (ISCED levels 5 and 6) in natural sciences and technologies
Area F: Women and the Economy
Gender segregation: average gross hourly wages of female and male workers in the 5 industry sectors (and in the 5 professional categories) with the highest numbers of female workers and the highest numbers of male workers; pay gap in management professional categories
Gender segregation: average gross hourly wages of female and male workers in the 5 industry sectors (and in the 5 professional categories) with the highest numbers of female workers and the highest numbers of male workers; pay gap in management professional categories
Share of women and share of men employed in occupations of STEM and EHW employment fields
Share of women and share of men employed in occupations of STEM and EHW employment fields

8. Conclusions

Study and work in the EU: set apart by gender 79
8. ConclusionsEIGE
8� Conclusions
Despite progress in gender equality, entrenched gender segregation in education, training and the labour market remains a reality for women and men in Europe today. Gen-der segregation refers to the concentration of one gender in certain fields of education or occupations. It is mostly in-fluenced by stereotypes, working conditions, social norms and cultural practices, which deter women and men from choosing and remaining in professions traditionally dom-inated by the other gender.
Gender segregation narrows women’s and men’s life choices, education and employment options by limiting ac-cess to certain jobs. It further reinforces gender stereotypes while also perpetuating unequal gender power relations in the public and private spheres. Women are usually in the majority in sectors that are generally characterised by low pay, status, prestige and career prospects, fewer options for upskilling and often informal working arrangements. The concentration of women and men in different occupations is a major cause of the gender pay gap, gender gap in pen-sions and women’s overall economic dependence through-out life. Overall, the persistent gender segregation in educa-tion and the labour market seriously hampers the potential for smart, sustainable and inclusive growth in the EU.
In 2014 a gender-balanced workforce was observed in only five occupations within the 20 largest occupation categor-ies in the EU. The fields of STEM and EHW were the most gender-segregated areas in the education system and sub-sequently in employment. There is already an acute short-age of STEM and EHW professionals and this is forecast to worsen in the future, not least due to declining numbers of students in a number of STEM and EHW fields, ageing populations, mismatch of skills and a broader need for more STEM skills across all other professions. With close to half of all EU students graduating in STEM (24 %) and EHW (19 %) educational fields, the distinction between ‘women-‘ and ‘men-compatible’ jobs remains one of the most distorting forces in the labour market. It restricts choices in life and work and may lead to complete disillusionment with and disengagement from the labour market.
Horizontal segregation in the STEM and EHW fields of edu-cation and training is particularly pronounced, and progress in reducing it has stalled or started to reverse. Within STEM, ICT, engineering, manufacturing and construction are the most men-dominated fields of education. In the EU, 19 % of students engaged in engineering, manufacturing and con-struction are women and in ICT the level is 17 %. Among the EHW study fields, gender segregation was more pro-nounced within the education field (where men represent a share of 19 %) than it was in the health and welfare disci-plines (where men represent a share of 21 %). Throughout
the last decade (2004-2015), women’s share among STEM graduates in the EU has fallen from 23 % to 22 %. Men’s share in EHW remained about the same at 21 %. Across the STEM fields, the share of women graduates was notably de-clining in ICT (in 20 Member States), whereas no significant changes were noted in the study field of engineering, man-ufacturing and construction (the largest STEM discipline). The field of natural sciences, mathematics and statistics has sustained its gender-balanced distribution of graduates. No progress from 2004 to 2015 in reducing gender segrega-tion was noted across the EHW study fields, with the share of men in the health and welfare field as well as in the edu-cation field remaining below 35 % in all countries.
Gender segregation is much stronger in vocational than in tertiary education in almost all EU countries, which has par-ticularly significant effects on outcomes within the STEM field. More than half (55 %) of STEM and about one third (34 %) of EHW students in the EU graduate from vocational education (figures for 2013-2015). Though a few countries have achieved gender balance in the proportion of women and men tertiary STEM graduates, no country has achieved this at the vocational education level. Gender segregation of lower-skilled STEM jobs thus needs to be investigated in more detail, not least due to the changing world of work and the various gender consequences that emerging or disappearing jobs would have for women and men.
In the EHW field, no country has yet achieved a gender-balanced share of students either in tertiary or vocational education. Overall, only 13 % of the EU graduates from vocational STEM education are women, whereas 31 % of women graduate from the tertiary education level. This gap is somewhat smaller in the EHW field, but comes at the expense of higher gender segregation, with 16 % of men graduates at the vocational education level and 23 % at the tertiary EHW education level. In addition to a low share of women in STEM vocational education at present, a substan-tial decrease has been observed during the last decade — both in absolute and relative numbers — pointing to an overall loss of student interest in STEM studies, especially among women. In contrast, in the EHW field an increase in student interest at the vocational education level can be observed. Nonetheless, the share of men graduates re-mained low — with an increase from 12 % to 16 % through-out the last decade.
The chances of finding a job are higher for women in the EHW field than in STEM, while the opposite holds true for men. Though only about one 10th of STEM and EHW graduates in the EU get a first job matching their educa-tional qualification, sharp differences exist across the Mem-ber States, with the ‘matching rate’ reaching up to 40 % in
Study and work in the EU: set apart by gender80
8. Conclusions EIGE
STEM and up to 50 % in EHW fields. This indicates vast un-tapped potential at the country level: graduates’ qualifica-tions could be used much more efficiently. Though more graduates find jobs matching their education as their career progresses, gender gaps remain vast. Among tertiary STEM graduates, only one third of women but one in two men work in STEM occupations. Among vocational education graduates, the gap is even greater, with only 10 % of wom-en but 41 % of men working in STEM occupations. Further-more, the chances of finding a job match have increased for all STEM graduates — but more for women with vocational STEM education — over the last decade. The chances of finding a job to match one’s qualification are more equita-ble in the EHW field, with about half of women and men EHW graduates from either tertiary or vocational educa-tional levels able to find jobs that correspond to their edu-cation. Furthermore, the chances of finding EHW jobs have particularly increased for men graduates of the vocational education level during the last decade.
If they do not stay employed in STEM, only a small share of women and men graduates choose gender-mixed occupa-tions, such as business and administration professions. The majority continue on gender-segregated pathways, with 21 % of women with tertiary education working as teach-ing professionals and 20 % of women vocational education graduates working as sales workers. Fewer occupational dif-ferences by gender are noted in the EHW field, though gen-der biases still exist. For example, about 8 % of men with tertiary EHW education become science and engineering professionals, but this is apparently not an attractive choice for women at present, illustrating the presence of various restrictions, such as limited possibilities to take care leave or flexible working conditions.
The chances of finding employment for women graduating from men-dominated fields of education are significantly lower compared to those for men. In 2014 the employment rate among EU women graduates in tertiary STEM educa-tion was 76 %. This is more than 10 p.p. lower than the em-ployment rate of men with the same qualification and 3 p.p. lower than the average employment rate of women with ter-tiary education. In addition, the employment rate of women with vocational STEM education (52 %) is lower than that for all women with vocational education (67 %) and for women in general (61 %). Furthermore, in contrast to the overall in-crease in women’s employment in the EU, the employment rate among women STEM graduates decreased between 2004 and 2014. There was also a notable increase in inactiv-ity rates among women STEM graduates from the vocational education field. Across the EU, the employment rate of men EHW graduates was above the general employment rate of men and also above that of men with tertiary education.
Overall, more than one fifth of all employees work in eight STEM and four EHW core occupations in the EU (2013-2014),
though the size of these professions is rather different across the Member States. Gender segregation in STEM and EHW occupations is persistently high and has not improved in the last decade. In fact, the share of men in EHW occupa-tions decreased from 30 % in 2004 to 26 % in 2014 at the EU level. This is partially due to the retirement of men, who make up about 40 % of the EHW workforce aged 60-64, whereas there are far fewer men (23 %) among the young-est cohorts. The share of women in STEM occupations in-creased marginally from 13 % in 2004 to 14 % in 2014; this share is persistent across age cohorts too.
As within education and training, gender segregation is very different across countries and across STEM and EHW occupations, pointing to a vast scope for potential improve-ments. Gender segregation among stationary plant and machine operators ranges from it being a predominantly men-dominated occupation in Luxembourg to one with a high proportion of women employees in Bulgaria and Lithuania. Building and related trades, electrical and elec-tronic trades and metal, machinery and related trades are almost exclusively men dominated across the EU. The sci-ence and engineering profession is gender balanced in Lat-via only and no gender-balanced distribution has yet been achieved within the ICT field in any Member State. Within the EHW field, gender-balanced distribution among health (associate) professionals has been achieved in a few coun-tries, whereas women are overrepresented in the teaching profession across all Member States. The highest segrega-tion within the EHW field, however, exists among personal care workers, with no country in the EU yet achieving a 20 % share of men in this occupation.
Trends across the STEM and EHW professions point to an increasing polarisation across countries and across occu-pations. This makes it difficult to establish general STEM or EHW trends within the EU, as average stability masks stark differences. The share of women is predominantly decreas-ing in ICT occupations across the EU. On the other hand, the proportion of women among stationary plant and machine operator roles, which already employ a considerable share of women in a number of Member States, is predominantly on the rise. No substantial changes and trends could be es-tablished across other STEM occupations. The share of men is also falling in at least one third of the Member States, and no progress is noted in the others. Positive developments, however, are noted among personal care workers, with an increasing share of men in at least six Member States, counter-balancing a larger fall in France and no significant changes in other countries. Despite increasing demand and an ageing workforce, no changes are noted in terms of at-tracting more men to the teaching occupation. Overall, this shows that during the last decade and despite policy initia-tives, no significant progress has been achieved in attract-ing and retaining women in STEM and men in EHW. New and structural approaches are needed.
Study and work in the EU: set apart by gender 81
8. ConclusionsEIGE
The gender pay gap, prevalent across entire EU econ-omies, is also visible in the STEM and EHW sectors. Paradox-ically, despite the ‘unattractiveness’ of STEM, the sector has a much lower gender pay gap than the EHW field in al-most all EU Member States. While in the STEM sector only two countries had a pay gap exceeding 20 %, this was the case for seven countries in the EHW sector. The high gen-der pay gap in EHW was due to larger gender pay biases in human health and social work activities than in the field of education in almost all EU countries. In a number of STEM sub-sectors, such as water supply, waste management and remediation or construction, women were also noted to have higher average pay than men in some Member States. In manufacturing and ICT, however, men earned more than women in all EU Member States. Overall, the gender pay gap limits the reduction of gender segrega-tion. On the one hand, it can motivate women to take up employment in men-dominated occupations, though evi-dence shows that other gendered barriers tend to coun-teract this choice. On the other hand, the gender pay gap acts as an important hindering factor in terms of men be-ing motivated to move into occupations dominated by women.
Gender segregation in the STEM field is still particularly in-fluenced by stereotypes regarding masculine identity traits and roles, with impacts across entire career pathways. In secondary-level education, gender differences in achieve-ment in mathematics and science are narrowing and no longer act as a dominant factor in the choice to pursue a STEM career. More women than men graduate from sci-ence, mathematics and statistics fields at post-secondary level, but their share in other STEM sub-sectors remains continuously low, if not decreasing. Aspirations, on the oth-er hand, play a major motivational role in choosing STEM career pathways. Girls’ aspirations to pursue science careers, despite their ability in this subject area, remain much lower than boys’ in almost all Member States. In part this is linked to women’s lower degree of self-confidence about their ability to perform well in the science fields, but lack of ad-equate counselling, and peer and family influences, are also important. Furthermore, even if they have aspirations to pursue a science career, in the end girls often do not opt for
actual careers in science, which points to numerous gen-dered barriers to their occupational pathways.
Gender biases also imply that educational achievements do not equally translate into occupational successes for women and men. Women’s probability of working in STEM increases by close to 30 p.p. if they graduate in STEM. For men, however, this probability increases by about 45 p.p.. In the EHW sector, men’s chances of finding jobs are lower than women’s.
There are significant differences between the STEM and EHW sectors in terms of career advancement and the ease with which it is possible to combine work and family life. Having children or being in older age groups impede wom-en’s chances of working in the STEM field, which is not the case in the EHW field. Overall, women perceive STEM jobs to be more intensive than EHW jobs, whereas for men the opposite is true. Working-time quality is considered better in STEM than in the EHW sector, providing evidence against a popular belief of flexible working-time conditions in EHW. Good access to skills advancement and more transparent and well-defined career models are more often observed in the EHW sector than in the STEM sector. Altogether, this points to various areas of improvements for both women’s and men’s employment within the two sectors.
Women and men’s entry into ‘gender-atypical’ occupa-tions is facilitated by a number of macro-level factors. For example, more favourable gender equality attitudes within a country seem to facilitate men’s entry into the EHW field. The growth of the STEM sector has been found to be linked with growing women’s employment in STEM. However, a cautious note should be struck here. Unless gender segre-gation is being actively combated, more job opportunities in the STEM sector might first of all imply more opportuni-ties for men. This has a knock-on effect on men’s interest in participating in the EHW field, for example. Furthermore, in-creasing innovation in the sector, including through invest-ment, is likely to support growth in STEM jobs, but mainly for men. This exemplifies numerous ways that gender seg-regation distorts the effectiveness of policy tools and the functioning of economies as well as labour markets.


9. Recommendations

Study and work in the EU: set apart by gender 85
9. RecommendationsEIGE
9� Recommendations
Gender stereotypes should be addressed at all levels of education and training from an early age
Gender stereotypes lead to gender segregation, and seg-regation, in turn, reinforces gender stereotypes. Gender stereotypes are broadly recognised as the greatest obstacle to achieving gender equality. They affect decisions made by girls and boys, as well as their self-image. Evidence also shows that gender expectations regarding educational choices are stricter for boys than girls, whereas atypical choices are more acceptable for girls than for boys. Mem-ber States should address gender stereotypes and sexism through informal and formal education from a very early age by providing initial teacher training and continuous professional development on mainstreaming gender equality in education and by promoting gender-sensitive school curricula, teaching approaches, administrative prac-tices and leisure time activities at all levels of education.
Measures addressing gender stereotypes need to be sus-tainable and conducted over the long term. It is impor-tant to foster gender equality awareness among students, parents and teachers, including those dealing with career orientation, and to encourage young women and men to choose non-traditional fields and occupations. For instance, families and their associations could be systematically in-volved in gender equality promotion in education and ca-reer counselling.
However, addressing gender segregation has to go be-yond getting individual women or men onto particular education courses or into particular occupations. Structural change within education and the labour market is needed to secure lasting outcomes. It is necessary to take a compre-hensive and sustainable approach to tackling gender differ-ences in teaching content and methods, gender composi-tion of teaching staff and the vertical segregation and value attached to certain qualifications/occupations. Institutional change will go hand in hand with societal change in terms of the sharing of domestic and caring work and addressing stereotypical societal expectations of women and men.
Combating gender segregation in education and occupations is imperative for closing the gender pay gap and gender gap in pensions
Increasing women’s employment rates can sometimes in-crease occupational segregation and the gender pay gap. Horizontal and vertical segregation of the labour market is a major cause underlying the gender pay gap and gender
gap in pensions. Women are concentrated in sectors and occupations which are generally lower paid and less valued. They are also under-represented in most scientific, engin-eering and management posts and at higher hierarchical levels, even in sectors where they are in the majority, such as the education sector.
The stalled progress in tackling gender segregation across key sectors of the economy requires actions targeted at both the participation of women and men in the labour market and working conditions, including equal pay. Equal pay between women and men must be further promoted, including by addressing transparency of pay and uncon-scious bias in recruitment and career progression as well as by strengthening policies and organisational culture to further advance work–life balance. It is important to co-operate with national trade unions (especially in the most gender-segregated professions) in order to fight gender stereotypes and raise awareness among their members on underlying causes of the gender pay gap.
Narrowing the gender pay gap could accelerate progress in reducing occupational segregation and the gender gap in pensions. In addition, measures addressed to gender oc-cupational segregation should also cover the gender gap in pay and pensions.
Work–life balance provisions should be available and encouraged for women and men in all sectors and occupations
Women’s disproportionate responsibility for care of de-pendent family members and household tasks is a major factor in gender segregation in employment. Data show that it is relatively easy for women to make the transition between full-time and part-time employment and remain employed in the same (women-dominated) sector. The sectors in which men are employed are less prone to part-time working, resulting in men not being able to work part-time while remaining in the same sector of employment (EIGE, 2014). This may be a factor preventing men from tak-ing on more caring duties.
Working on a part-time basis can be detrimental in terms of access to economic and financial resources. Low numbers of working hours (including micro-jobs with fewer than 10 hours per week) are mainly associated with women and often lead to lower earnings, lower access to social secur-ity benefits, lower pensions and higher risk poverty. In all Member States the percentage of part-time workers below the low pay threshold is higher for women than for men.
Study and work in the EU: set apart by gender86
9. Recommendations EIGE
Moreover, on average, for the EU-28, the share of part-time workers at risk of poverty is almost double the proportion of individual full-time workers who are at risk of poverty. It is necessary to ensure that part-time work involves a pos-sibility to make transitions between part-time and full-time work, equal career prospects and protection from precari-ousness, poverty and social exclusion (EIGE, 2014).
The European Commission recently proposed a package of measures on work–life balance (13), with particular focus on paternity/parental/carer’s leave, flexible working ar-rangements, accessible care services, including long-term care, and economic (dis)incentives for employment. When implemented in the Member States, the measures should promote organisational cultures that embrace the work–life balance needs of both women and men. Flexible working arrangements and other provisions in the workplace should consider the changing life-course needs of workers. Part-time work should be considered as an opportunity for all (women and men) at specific phases of the life course when work has to be balanced with other needs (i.e. education and training, care responsibilities, health, etc.). The choice should be reversible (transition from part-time to full-time job) when the life-course needs change and should not be penalised in terms of pay, career opportunities and access to social protection.
Active labour market policies and lifelong learning should be more geared to meet new demands of the labour market
When Member States address labour shortages and sup-port creation of new jobs in STEM and EHW, active measures are needed in parallel to those on decreased segregation so that both women and men can benefit from these oppor-tunities. Active labour market policies should provide more opportunities for young people, the unemployed or early leavers from education to upgrade their skills in response to labour market potential and shortage of specific skills and to broaden educational and career options across fields tra-ditionally dominated by either women or men. As noted by the European pillar of social rights and the ‘New skills for Europe’ agenda, lifelong learning is playing an increasingly important role in changing economies and societies. Mem-ber States should encourage women and men to engage more actively in lifelong learning to acquire occupational qualifications suited to the new structure and demands of the labour market, including changing employment sector and taking non-stereotypical jobs.
Secondary education should encourage more innovative approaches to career choices
Education systems tend to reinforce gender segregation if they require girls and boys to make choices about studies and career prospects at an early age. Research links segrega-tion across scientific fields at the university level with segre-gation in study fields downstream at the secondary school level. Too often education systems are not flexible enough and direct pupils onto an educational trajectory for a spe-cific job, especially in vocational education and training, at an early age. Opportunities for secondary school pupils to change their core subjects would introduce greater flexibil-ity in their future studies and offer more career choices.
Building closer links between schools and real-life experi-ence in the workplace could also enable broader occupa-tional choices for girls and boys. It is recognised that business could play a more prominent role in challenging negative and misleading perceptions of STEM or EHW careers by be-ing more involved in education at all levels and providing a context for studies and positive role models. For example, in a number of countries school and business partnerships are being promoted to get young people interested in STEM, especially in sectors with skills shortages. Such initia-tives could also include career guidance and labour market information. The evidence shows that girls and boys may not receive accurate information on STEM or EHW cours-es and careers and may be steered into fields traditionally typical for their gender. Career guidance should counteract gender prejudices about professional careers and provide good-quality information so that young people can make well-informed decisions free from gender bias.
Enriching STEM with arts and humanities could increase its attractiveness to women and men
The European Parliament, in its resolution on women’s careers in science and university (European Parliament, 2015b), recognised that demand for STEM professionals is expected to grow until 2025, that cross-fertilisation be-tween STEM subjects and the arts and humanities (STE(A)M) holds enormous economic, social and cultural potential and that women and researchers are well placed to develop links from STEM to STE(A)M.
The evidence shows that learning STEM is more effective when linked to economic, environmental and social chal-lenges, arts and design and demonstrating its relevance for daily life (European Commission, 2017b). Project- and problem-based learning or community service learning in-crease young people’s motivation, put subject content into
(13) http://ec.europa.eu/social/main.jsp?catId=1311&langId=en&moreDocuments=yes
Study and work in the EU: set apart by gender 87
9. RecommendationsEIGE
context and offer opportunities for the development of social, civic and entrepreneurship competences and leader-ship skills.
Gender segregation can be reduced with a better gender balance in decision-making
Vertical segregation by gender is as important as horizon-tal segregation and has to be addressed to overcome oc-cupational segregation and to promote gender equality. In the European Pact for Gender Equality, the Council urged ‘measures to close gender gaps and combat gender seg-regation in the labour market’, including promotion of ‘the equal participation of women and men in decision-making at all levels and in all fields, in order to make full use of all tal-ents’. Women make up more than half of the EU population
and they are highly educated, yet even in the sectors and occupations where they dominate women continue to be under-represented in decision-making positions at all levels.
The under-representation of women in decision-making is very broad, multifaceted and widespread in all sectors. It is crucial to address it through policies aimed at improving gender equality, in particular women’s employment, work–life balance, equal pay, and equal sharing of caring duties. Governments, the social partners and companies in the pri-vate and public sectors should agree on far-reaching gen-der equality policies and targets and implement effective measures supporting women in gaining access to positions of responsibility through more transparent selection and promotion processes, personal development initiatives, sponsoring schemes and other initiatives.


References

Study and work in the EU: set apart by gender 91
ReferencesEIGE
References
Allegrini, A., Pellegrini, G. and Segafredo, C. (2015), ‘Ital-ian female and male students’ choices: STEM studies and motivations’, in Henriksen, E.K., Dillon, J. and Ryder, J. (eds), Understanding student participation and choice in science and technology education, Springer Netherlands, Dordrecht, pp. 297-313.
Ashcraft, C., McLain, B. and Eger, E. (2016), Women in tech: the facts, National Center for Women and Technology (NCWIT), available at: https://www.ncwit.org/sites/default/files/resources/ncwit_women-in-it_2016-full-report_final-web06012016.pdf
Babcock, L., Recalde, M. P., Vesterlund, L. and Weingart, L. (2017), ‘Gender differences in accepting and receiving re-quests for tasks with low promotability’, American Economic Review, Vol. 107, No 3, pp. 714-747, available at: http://pubs.aeaweb.org/doi/pdfplus/10.1257/aer.20141734
Bergmann, B. R. (2011), ‘Sex segregation in the blue-collar occupations: Women’s choices or unremedied discrimina-tion? Comment on England’, Gender and Society, Vol. 25, No 1), pp. 88-93.
Bettio, F. and Verashchagina, A. (2009), Gender segregation in the labour market: Root causes, implications and policy re-sponses in the EU, European Commission’s Expert Group on Gender and Employment (EGGE), Luxembourg, available at: http://ec.europa.eu/social/BlobServlet?docId=4028&langId=en
Bieri Buschor, C., Berweger, S., Keck Frei, A. and Kappler, C. (2014), ‘Majoring in STEM — What accounts for women’s ca-reer decision making? A mixed methods study’, The Journal of Educational Research, Vol. 107, No 3, pp. 167-176.
Blau, F. D., Brummund, P. and Liu, A. Y.-H. (2013), ‘Trends in oc-cupational segregation by gender 1970-2009: Adjusting for the impact of changes in the occupational coding system’, Demography, Vol. 50, No 2, pp. 471-492.
Boll, C., Leppin, J., Rossen, A. and Wolf, A. (2016), Magnitude and impact factors of the gender pay gap in EU countries, Eu-ropean Commission, Directorate-General for Justice and Consumers, Luxembourg, available at: http://hwwi.org/fileadmin/hwwi/Publikationen/Publikationen_PDFs_2016/Magnitude_And_Impact_Factors_All.pdf
Brynin, M. and Perales, F. (2016), ‘Gender wage inequality: The de-gendering of the occupational structure’, European Sociological Review, Vol. 32, No 1, pp. 162-174, available at: https://doi.org/10.1093/esr/jcv092
Burchell, B., Hardy, V., Rubery, J. and Smith, M. (2014), A new method to understand occupational gender segregation in Eu-ropean labour markets, European Commission, Luxembourg, available at: http://ec.europa.eu/justice/gender-equality/files/documents/150119_segregation_report_web_en.pdf
Busch, A. and Holst, E. (2011), ‘Gender-specific occupational segregation, glass ceiling effects and earnings in manage-rial positions: results of a fixed effects model’, DIW Discussion Paper, DIW, Berlin.
Cedefop (2014), Rising STEMs, accessed 21 June 2017, available at: http://www.cedefop.europa.eu/en/publications-and-resources/statistics-and-indicators/statistics-and-graphs/rising-stems
Cedefop (2015), Employment trends: 2016 Skills forecast, ac-cessed 15 April 2017, available at: http://www.cedefop.eu-ropa.eu/en/publications-and-resources/data-visualisations/employment-trends
Cedefop (2016), Briefing note 9115 — Skill shortage and surplus occupations in Europe, accessed 21 June 2017, available at: http://www.cedefop.europa.eu/en/publications-and-resources/publications/9115
Charles, M. and Bradley, K. (2009), ‘Indulging our gendered selves? Sex segregation by field of study in 44 countries’, American Journal of Sociology, Vol. 114, No 4, pp. 924-976.
Charles, M. and Grusky, D. (2004), Occupational ghettos: The worldwide segregation of women and men, Stanford Univer-sity Press, Redwood City.
Charles, M., Harr, B., Cech, E. and Hendley, A. (2014), ‘Who likes math where? Gender differences in eighth-graders’ at-titudes around the world’, International Studies in Sociology of Education, Vol. 24, No 1, pp. 85-112.
Christidou, V. (2011), ‘Interest, attitudes and images related to science: Combining students’ voices with the voices of school science, teachers and popular science’, International Journal of Environmental and Science Education, Vol. 6, No 2, pp. 141-159.
Council of the European Union (2006), Presidency conclu-sions (7775/1/06 REV1), Brussels, available at: http://www.consilium.europa.eu/ueDocs/cms_Data/docs/pressData/en/ec/89013.pdf
Study and work in the EU: set apart by gender92
References EIGE
Council of the European Union (2007), ‘Review of the im-plementation by the Member States and the EU institutions of the Beijing Platform for Action: indicators in respect of the education and training of women: Draft Council conclu-sions (9152/07)’, Brussels, available at: http://register.consili-um.europa.eu/doc/srv?l=EN&f=ST %209152 %202007 %20INIT
Council of the European Union (2008), ‘Review of the im-plementation by the Member States and the EU institutions of the Beijing Platform for Action: indicators in respect of the Girl Child: Draft Council conclusions, (9669/08)’, Brus-sels, available at: http://register.consilium.europa.eu/doc/srv?l=EN&f=ST %209669 %202008 %20INIT
Council of the European Union (2010), Council conclusions on strengthening the commitment and stepping up action to close the gender pay gap, and on the review of the im-plementation of the Beijing Platform for Action (8121/10)’, Brussels, available at: http://register.consilium.europa.eu/doc/srv?l=EN&f=ST 18121 2010 INIT
Council of the European Union (2011), ‘Council conclusions on the European Pact for gender equality for the period 2011-2020 (7370/11)’, Brussels, available at: https://www.con-silium.europa.eu/uedocs/cms_data/docs/pressdata/en/lsa/119628.pdf
Council of the European Union (2014), Council conclusions on women and the economy: economic independence from the perspective of part-time work and self-employ-ment (11050/14), Brussels, available at: http://www.con-silium.europa.eu/uedocs/cms_data/docs/pressdata/en/lsa/143269.pdf
Council of the European Union (2017), Council conclusions on enhancing the skills of women and men in the EU la-bour market (6889/17), Brussels, available at: http://data.con-silium.europa.eu/doc/document/ST-6889-2017-INIT/en/pdf
Dämmrich, J. (2015), ‘Gendered labor market outcomes at labor market entry and their relationship with country-spe-cific characteristics: a comparative perspective’, in Blossfeld, H. P., Skopek, J., Triventi, M. and Buchholz, S. (eds), Gender, education and employment. an international comparison of school-to-work transitions, Edward Elgar Publishing, Chelten-ham, pp. 62-81.
De Pater, I. E., Van Vianen, A. E. M. and Bechtoldt, M. N. (2010), ‘Gender differences in job challenge: a master of task allocation’, Gender, Work and Organisation, Vol. 17, No 4, pp. 407-436.
De Ruijter, J., van Doorne-Huiskes, A. and Schippers, J. (2003), ‘Size and causes of the occupational gender wage-gap in the Netherlands’, European Sociological Review, Vol. 19, No 4, pp. 345-360.
Eccles, J., Jacobs, J. and Harold, R. (1990), ‘Gender role stereo-types, expectancy effects, and parents’ socialization of gen-der differences’, Journal of Social Issues, Vol. 46, No 2, pp.183-201, available at: https://www.researchgate.net/profile/Jacquelynne_Eccles/publication/227848517_Gender_Role_Stereotypes_Expectancy_Effects_and_Parents %27_Social-ization_of_Gender_Differences/links/00b7d5166b7647bc78000000/Gender-Role-Stereotypes-Expectancy-Effects-and-Parents-Socialization-of-Gender-Differences.pdf
England, P., Allison, P. and Wu, X. (2007), ‘Does bad pay cause occupations to feminize, does feminization reduce pay, and how can we tell with longitudinal data?’, Social Science Re-search, Vol. 36, No 3, pp. 1237-1256.
England, P. (2010), ‘The gender revolution: uneven and stalled’, Gender and Society, Vol. 24, No 2, pp. 149-166.
Eurofound (2012), Trends in job quality in Europe: A report based on the fifth European Working Conditions Survey, Pub-lications Office of the European Union, Luxembourg, avail-able at: https://www.eurofound.europa.eu/sites/default/files/ef_publication/field_ef_document/ef1228en_0.pdf
Eurofound (2013), Women, men and working conditions in Eu-rope: A report based on the fifth European Working Conditions Survey, Publications Office of the European Union, Luxem-bourg, available at: http://eurogender.eige.europa.eu/sites/default/files/EF1349EN.pdf
Eurofound (2016), Sixth European working conditions survey: overview report, Publications Office of the European Union, Luxembourg.
European Commission, ‘Strategic framework — Educa-tion and Training 2020’, accessed 22 June 2017, available at: http://ec.europa.eu/education/policy/strategic-framework/index_en.htm
European Commission (2011), Tackling the gender pay gap in the European Union, Publications Office of the Euro-pean Union, Luxembourg, available at: http://ec.europa.eu/justice/gender-equalit y/gender-pay-gap/f i les/gpg2011-leaflet_en.pdf
European Commission (2012), Structural change in research institutions: Enhancing excellence, gender equality and efficien-cy in research and innovation, Publications Office of the Eu-ropean Union, Luxembourg, available at: https://ec.europa.eu/research/science-society/document_library/pdf_06/structural-changes-final-report_en.pdf
European Commission (2013), Tackling the gender pay gap in the European Union, Publications Office of the European Union, Luxembourg, available at: https://www.wgea.gov.au/sites/default/files/tackling_gender_pay_gap_europe-an_union.pdf
Study and work in the EU: set apart by gender 93
ReferencesEIGE
European Commission (2014), Communication from the Commission to the European Parliament, the Council, the European Central Bank, the European Economic and Social Committee, the Committee of the Regions and the Euro-pean Investment Bank, ‘An Investment Plan for Europe’, COM(2014) 903 final, available at: http://eur-lex.europa.eu/legal-content/EN/TXT/PDF/?uri=CELEX:52014DC0903&from=EN
European Commission (2015a), Acquiring e-leadership skills: Fostering the digital transformation of Europe, Publications Office of the European Union, Luxembourg, available at: http://eskills-guide.eu/fileadmin/guide/documents/elead-ership_brochure_for_download.pdf
European Commission (2015b), Does the EU need more STEM graduates? Final report, Publications Office of the European Union, Luxembourg, available at: htt-ps://publications.europa.eu/en/publication-detail/-/publication/60500ed6-cbd5-11e5-a4b5-01aa75ed71a1
European Commission (2015c), Communication from the Commission to the European Parliament, the Coun-cil, the European Economic and Social Committee and the Committee of the Regions, `Draft 2015 Joint Re-port of the Council and the Commission on the im-plementation of the Strategic framework for European cooperation in education and training (ET2020). New pri-orities for European cooperation in education and train-ing’, SWD(2015) 161 final, available at: http://ec.europa.eu/dgs/education_culture/repository/education/documents/et-2020-draft-joint-report-408-2015_en.pdf
European Commission (2015d), Science education for respon-sible citizenship, Publications Office of the European Union, Luxembourg, available at: http://ec.europa.eu/research/swafs/pdf/pub_science_education/KI-NA-26-893-EN-N.pdf
European Commission (2016a), Employment and social de-velopments in Europe 2016, Publications Office of the Eu-ropean Union, Luxembourg, available at: https://www.portugal2020.pt/Portal2020/Media/Default/Docs/NOTI-CIAS2020/Relatorio_ESDE2016.pdf
European Commission (2016b), Rights, equality and citi-zenship programme 2014-2020, accessed 20 June 2017, available at: http://ec.europa.eu/justice/grants1/programmes-2014-2020/rec/index_en.htm
European Commission (2017a), Communication from the Commission to the European Parliament, the Coun-cil, the European Economic and Social Committee and the Committee of the Regions ‘On a renewed EU agenda for higher education’, COM(2017) 247 final, available at: https://ec.europa.eu/education/sites/education/files/he-com-2017-247_en.pdf
European Commission (2017b), Communication from the Commission to the European Parliament, the Council, the European Economic and Social Committee and the Committee of the Regions on ‘School development and excellent teaching for a great start in life’, COM(2017) 248 final, available at: https://ec.europa.eu/education/sites/education/files/school-com-2017-248_en.pdf
European Commission (2017c), Proposal for a interinstitu-tional proclamation on the European pillar of social rights, COM(2017) 251 final, available at: http://eur-lex.europa.eu/legal-content/EN/TXT/PDF/?uri=CELEX:52017DC0251&from=EN
European Institute for Gender Equality (EIGE), Gender Equal-ity Glossary and Thesaurus, accessed 20 June 2017, available at: http://eige.europa.eu/rdc/thesaurus
European Institute for Gender Equality (EIGE) (2012), Gen-der equality and climate change: the review of the imple-mentation of the Beijing Platform for Action in the EU, Pub-lications Office of the European Union, Luxembourg, available at: http://eige.europa.eu/sites/default/files/docu-ments/mh3212425enc_002.pdf
European Institute for Gender Equality (EIGE) (2014), Gender equality and economic independence: Part-time work and self-employment. Review of the Implementation of the Beijing Plat-form for Action in the EU Member States, Publications Office of the European Union, Luxembourg, available at: http://eige.europa.eu/sites/default/files/documents/MH0414228ENC.pdf
European Institute for Gender Equality (EIGE) (2016a), Gender and digital agenda, Publications Office of the European Un-ion, Luxembourg, available at: http://eige.europa.eu/sites/default/files/documents/ti_pubpdf_mh0216896enn_pd-fweb_20170124121443.pdf
European Institute for Gender Equality (EIGE) (2016b), Pov-erty, gender and intersecting inequalities in the EU: Report, Pub-lications Office of the European Union, Luxembourg, availa-ble at: http://eige.europa.eu/sites/default/files/documents/ti_pubpdf_mh0416244enn_pdfweb_20161208181320.pdf
European Institute for Gender Equality (EIGE) (2017a), Eco-nomic Benefits of Gender Equality in the EU: EU and EU Member States overviews, Publications Office of the European Un-ion, Luxembourg, available at: http://eige.europa.eu/sites/default/files/documents/ti_pubpdf_mh0116183enn_pd-fweb_20170518162039.pdf
European Institute for Gender Equality (EIGE) (2017b), Gen-der, skills and precarious work in the EU: Research note, Publica-tions Office of the European Union, Luxembourg, available at: http://eige.europa.eu/sites/default/files/documents/ti_pubpdf_mh0217250enn_pdfweb_20170503163908.pdf
Study and work in the EU: set apart by gender94
References EIGE
European Parliament (2009), Indicators of job quality in the European Union — IP/A/EMPL/ST/2008-09, available at: http://www.europarl.europa.eu/document/activities/cont/201107/20110718ATT24284/20110718ATT24284EN.pdf
European Parliament (2015a), Encouraging STEM stud-ies for the labour market — IP/A/EMPL/2014-13, avail-able at: http://www.europarl.europa.eu/RegData/etudes/STUD/2015/542199/IPOL_STU(2015)542199_EN.pdf
European Parliament (2015b), Resolution with recommenda-tions to the Commission on women’s careers in science and universities, and glass ceilings encountered (2014/2251(INI)), available at: http://www.europarl.europa.eu/sides/getDoc.do?type=TA&language=EN&reference=P8-TA-2015-0311
European Parliament (2016), Report on women domestic workers and carers in the EU (2015/2094(INI)), available at: http://www.europarl.europa.eu/sides/getDoc.do?pubRef=-//EP//NONSGML+REPORT+A8-2016-0053+0+DOC+PDF+V0//EN
EU Skills Panorama, Homepage, accessed 26 June 2017, available at: http://skillspanorama.cedefop.europa.eu/en
EU Skills Panorama (2014), Health sector analytical high-light, prepared by ICF GHK and Cedefop for the European Commission, accessed 21 June 2017, available at: http://skillspanorama.cedefop.europa.eu/sites/default/files/EUSP_AH_Health_0.pdf
EU Skills Panorama (2016), ‘Teaching professionals analytical highlight: skills opportunities and challenges’, prepared by Cedefop for the European Commission, accessed 14 April 2017, available at: http://skillspanorama.cedefop.europa.eu/en/analytical_highligths/prospects-teaching-professionals-0
European Union (2009), Lisbon Treaty.
Evans, J. M. (2002), ‘Work/family reconciliation, gender wage equity and occupational segregation: the role of firms and public Policy’, Canadian Public Policy/Analyse de Politiques, Vol. 27 (Supplement/Numéro Spécial 1), pp. S187-S216, avail-able at: http://www.jstor.org/stable/3552351
Foubert, P. (2010), The gender pay gap in Europe from a legal perspective, European Commission, Directorate-General for Employment, Social Affairs and Equal Op-portunities, Publications Office of the European Un-ion, Luxembourg, available at: http://ec.europa.eu/justice/gender-equality/f iles/gender_pay_gap/genderpaygapfromlegalperspective-nov2010_en.pdf
Gabay-Egozi, L., Shavit, Y. and Yaish, M. (2015), ‘Gender dif-ferences in fields of study: the role of significant others and rational choice motivations’, European Sociological Review, Vol. 31, No 3, pp. 1-14.
Glynn, S. M., Taasoobshirazi, G. and Brickman, P. (2007), ‘Non-science majors learning science: a theoretical model of mo-tivation’, Journal of Research in Science Teaching, Vol. 44, No 8, pp. 1088-1107.
Guinea-Martin, D. and Solera, C. (2013), ‘Do women in fe-male-dominated occupations exit the labour market more? Evidence from Italy, Spain, Denmark and the UK’, Population Review, Vol. 52, No 1, pp. 172-191, available at: https://doi.org/10.1353/prv.2013.0002
Henriksen, E. K., Dillon, J. and Ryder, J. (eds) (2014), Under-standing student participation and choice in science and technology education (2015 edition), Springer Netherlands, Dordrecht.
Hillmert, S. (2015), ‘Gender segregation in occupational ex-pectations and in the labour market: international variation and the role of education and training systems’, Compara-tive Social Research, Vol. 31, pp. 123-148.
Hussein, S. and Christensen, K. (2017), ‘Migration, gender and low-paid work: on migrant men’s entry dynamics into the feminised social care work in the UK’, Journal of Ethnic and Migration Studies, Vol. 43, No 5, pp. 749-765, available at: http://dx.doi.org/10.1080/1369183X.2016.1202751
Imdorf, C., Hegna, K., Eberhard, V. and Doray, P. (2015), ‘Edu-cational systems and gender segregation in education: a three-country comparison of Germany, Norway and Canada’, Gender Segregation in Vocational Education, Vol. 31, pp. 83-122.
International Labor Organisation (ILO), ISCO-08 Structure, in-dex correspondence with ISCO-88, accessed 26 June 2017, available at: http://www.ilo.org/public/english/bureau/stat/isco/isco08/index.htm
Jarman, J., Blackburn, R. M. and Racko, G. (2012), ‘The di-mensions of occupational gender segregation in industrial countries’, Sociology, Vol. 46, No 6, pp. 1003-1019.
Jensen, Fredrik and Henriksen, E. K. (2015), ‘Short stories of educational choice: in the words of science and technol-ogy students’, in Henriksen, E. K., Dillon, J. and Ryder, J. (eds), Understanding student participation and choice in science and technology education, Springer Netherlands, Dordrecht, pp. 135-151.
Kanny, M. A., Sax, L. J. and Riggers-Pieh, T. A. (2014), ‘Investi-gating forty years of STEM research: How explanations for the gender gap have evolved over time’, Journal of Wom-en and Minorities in Science and Engineering, Vol. 20, No 2, pp. 127-148.
Study and work in the EU: set apart by gender 95
ReferencesEIGE
Kreimer, M. (2004), ‘Labour market segregation and the gen-der-based division of labour’, European Journal of Women’s Studies, Vol. 11, No 2, pp. 223-246.
Legewie, J. and DiPrete, T. A. (2014), ‘The high school envi-ronment and the gender gap in science and engineering’, Sociology of Education, Vol. 87, No 4, pp. 259-280.
Lewis, J. (2009), Work–family balance, gender and policy, Ed-ward Elgar Publishing Limited, Cheltenham.
Madichie, N. O. (2013), ‘Sex in the kitchen: changing gender roles in a female-dominated occupation’, International Jour-nal of Entrepreneurship and Small Business, Vol. 18, No 1, pp. 90-102, available at: https://doi.org/10.1504/IJESB.2013.050754
Martell, R. F., Lane, D. M. and Emrich, C. (1996), ‘Male–fe-male differences: a computer simulation’, American Psy-chologist, Vol. 51, No 2, pp. 157-158, available at: http://dx.doi.org/10.1037/0003-066X.51.2.157
Montt, G. (2015), The causes and consequences of field-of-study mismatch: An analysis using PIAAC, OECD Social, Em-ployment and Migration Working Papers, No 167, OECD Publishing, Paris.
Morgan McKinley (2016), Gender pay gap Ireland 2016, avail-able at: https://www.morganmckinley.ie/sites/morganmc-kinley.ie/files/gender_pay_gap_in_ireland_2016.pdf
Morgan, S. L., Gelbgiser, D. and Weeden, K. A. (2013), ‘Feeding the pipeline: gender, occupational plans, and college major selection’, Social Science Research, Vol. 42, No 4, pp. 989-1005, available at: https://doi.org/10.1016/j.ssresearch.2013.03.008
OECD (2012), Closing the gender gap: act now, OECD Publishing, Paris, available at: http://dx.doi.org/10.1787/9789264179370-en.
OECD/Cedefop (2014), Greener skills and jobs, OECD Publishing, Paris, available at: http://dx.doi.org/10.1787/9789264208704-en.
OECD (2016), 2015 results (Volume I): Excellence and equity in education, PISA, OECD Publishing, Paris, available at: http://dx.doi.org/10.1787/9789264266490-en
O’Reilly, J., Smith, M., Deakin, S. and Burchell, B. (2015), ‘Equal pay as a moving target: international perspectives on forty years of addressing the gender pay gap’, Cambridge Journal of Economics, Vol. 39, No 2, pp. 299-317, available at: https://doi.org/10.1093/cje/bev010
Peruzzi, M. (2015), ‘Contradictions and misalignments in the EU approach towards the gender pay gap’, Cambridge Jour-nal of Economics, Vol. 39, No 2, pp. 441-466.
Reid, L. (1998), ‘Devaluing women and minorities: the ef-fect of race/ethnic and sex composition of occupations on wage level’, Work and Occupations, Vol. 25, No 4, pp. 511-536.
Reimer, D. and Steinmetz, S. (2009), ‘Highly educated but in the wrong field?’, European Societies, Vol. 11, No 5, pp. 723-746.
Reskin, B. F. and Bielby, D. D. (2005), ‘A sociological perspec-tive on gender and career outcomes’, Journal of Economic Perspectives, Vol. 19, No 1, pp. 71-86.
Rolfe, H. (2005), Men in childcare, National Institute of Eco-nomic and Social Research EOC Working Paper Series, avail-able at: http://www.koordination-maennerinkitas.de/up-loads/media/Rolfe-Heather.pdf
Schlenker, E. (2015), ‘The labour supply of women in STEM’, IZA Journal of European Labor Studies, Vol. 4, No 1.
Schuster, C. and Martiny, S. E. (2017), ‘Not feeling good in STEM: effects of stereotype activation and anticipated affect on women’s career aspirations’, Sex Roles, Vol. 76, No 1-2, pp. 40-55, available at: https://link.springer.com/article/10.1007/s11199-016-0665-3
Solomon, Y., Radovic, D. and Black, L. (2016), ‘I can actually be very feminine here’: contradiction and hybridity in becom-ing a female mathematician’, Educational Studies in Math-ematics, Vol. 91, No 1, pp. 55-71.
Smith, M. (2010), Analysis Note: The gender pay gap in the EU — What policy responses?, European Network of Experts on Employment and Gender Equality issues (EGGE), available at: http://www.eif.gov.cy/mlsi/dl/genderequality.nsf/All/F592B6E5C824A8A6C22579A700296E29/$file/the_gender_pay_gap_in_the_eu_egge_2010.pdf
Smyth, E. (2005), ‘Gender differentiation and early labour market integration across Europe’, European Societies, Vol. 7, No 3, pp. 451-479.
Smyth, E. and Steinmetz, S. (2015), ‘Vocational training and gender segregation across Europe’, Comparative Social Re-search, Vol. 31, pp. 53-81.
Sparreboom, T. (2014), ‘Gender equality, part-time work and segregation in Europe’, International Labour Review, Vol. 153, No 2, pp. 245-268.
Steinmetz, S. (2012), The contextual challenges of occupa-tional sex segregation: Deciphering cross-national differences in Europe, VS Verlag für Sozialwissenschaften, Springer Fach-medien Wiesbaden GmbH, Wiesbaden.
Study and work in the EU: set apart by gender96
References EIGE
Sunny, C. E., Taasoobshirazi, G., Clark, L. and Marchand, G. (2017), ‘Stereotype threat and gender differences in chemis-try’, Instructional Science, Vol. 45, No 2, pp. 157-175.
The Royal Society of Edinburgh (2012), Tapping all our Tal-ents: Women in science, technology, engineering and math-ematics: a strategy for Scotland, Edinburgh, accessed 21 June 2017, available at: http://www.rse.org.uk/cms/files/advice-papers/inquiry/women_in_stem/tapping_talents.pdf
Tinklin, T., Croxford, L., Ducklin, A. and Frame, B. (2005), ‘Gen-der and attitudes to work and family roles: the views of young people at the millenium’, Gender and Education, Vol. 17, No 2, pp. 129-142, available at: http://www.ces.ed.ac.uk/PDF %20Files/TT_0214.pdf
Thyssen, Marianne (2017), ‘New skills agenda for Europe — An agenda for a changing world’, speech delivered at the European Commission conference on Changing skills for a changing world, Turin, accessed 21 June 2017, available at: https://ec.europa.eu/commission/commis-sioners/2014-2019/thyssen/announcements/speech-new-skills-agenda-europe-agenda-changing-world-torino-2017-conference-changing-skills_en
Tomaskovic-Devey, D. (2002), ‘Sex segregation, labor pro-cess organisation and gender earnings inequality’, American Journal of Sociology, Vol. 108, pp.102-128.
Ulriksen, L., Madsen, L. M. and Holmegaard, H. T. (2015), ‘Why do students in STEM higher education programmes drop/opt out?’, in Henriksen, E. K., Dillon, J. and Ryder, J. (eds),
Understanding student participation and choice in science and technology education, Springer Netherlands, Dordrecht, pp. 203-218.
United Nations (1995), Beijing Declaration and Platform for Action, adopted by the Fourth World Conference on Women, 27 October 1995, United Nations, accessed 20 June 2017, available at: http://www.un.org/womenwatch/daw/beijing/pdf/BDPfA %20E.pdf
van der Vleuten, M., Jaspers, E., Maas, I. and van der Lippe, T. (2016), ‘Boys’ and girls’ educational choices in secondary education: the role of gender ideology’, Educational Studies, Vol. 42, No 2, pp. 181-200.
Warming, K. (2013), ‘Men who stop caring: the exit of men from caring occupations’, Nordic Journal of Working Life Stud-ies, Vol. 3, No 4, pp. 4-19, available at: http://rossy.ruc.dk/ojs/index.php/njwls/article/view/3070/1333
Watt, H. M. G. and Richardson, P. W. (2008), ‘Motivations, per-ceptions, and aspirations concerning teaching as a career for different types of beginning teachers’, Learning and In-struction, Vol. 5, No 18, pp. 408-428.
Yazilitas, D., Saharso, S., de Vries, G. C. and Svensson, J. S. (2016), ‘The postmodern perfectionist, the pragmatic he-donist and the materialist maximalist: understanding high school students’ profile choices towards or away from mathematics, science and technology (MST) fields in the Netherlands’, Gender and Education, Vol. 29(7) pp. 1-19.

Annexes

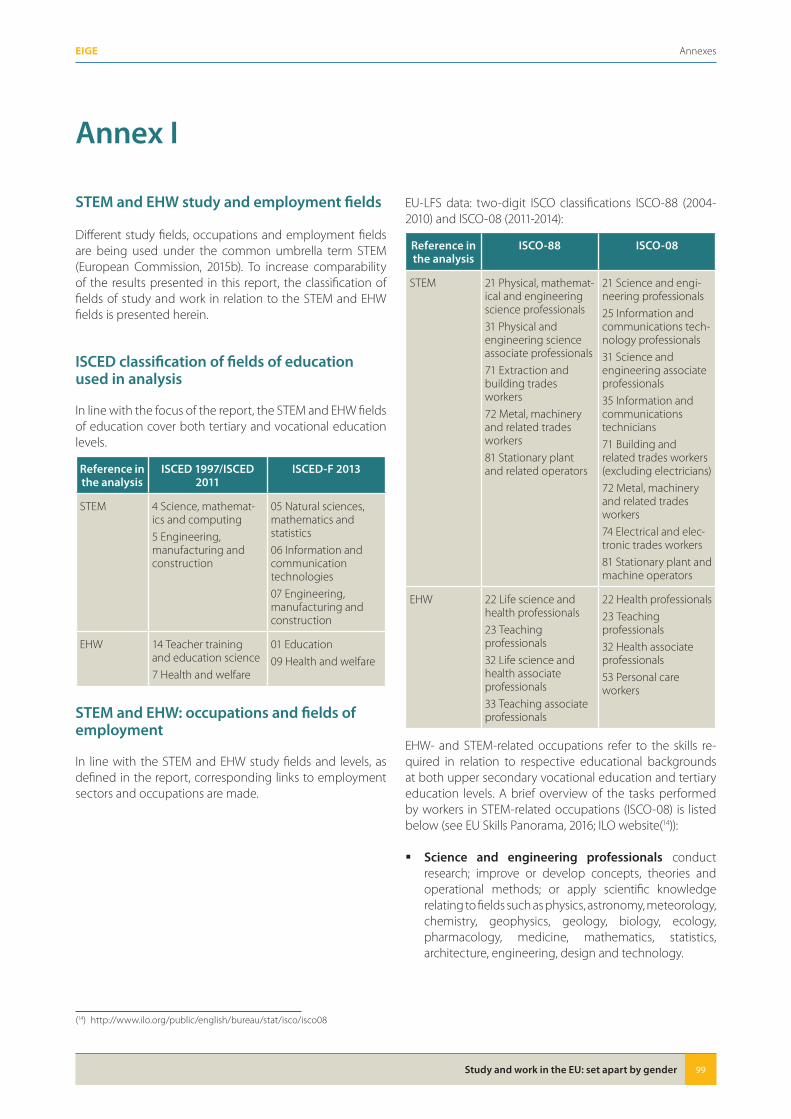
Study and work in the EU: set apart by gender 99
AnnexesEIGE
Annex I
STEM and EHW study and employment fields
Different study fields, occupations and employment fields are being used under the common umbrella term STEM (European Commission, 2015b). To increase comparability of the results presented in this report, the classification of fields of study and work in relation to the STEM and EHW fields is presented herein.
ISCED classification of fields of education used in analysis
In line with the focus of the report, the STEM and EHW fields of education cover both tertiary and vocational education levels.
Reference in the analysis
ISCED 1997/ISCED 2011
ISCED-F 2013
STEM 4 Science, mathemat-ics and computing
5 Engineering, manufacturing and construction
05 Natural sciences, mathematics and statistics
06 Information and communication technologies
07 Engineering, manufacturing and construction
EHW 14 Teacher training and education science
7 Health and welfare
01 Education
09 Health and welfare
STEM and EHW: occupations and fields of employment
In line with the STEM and EHW study fields and levels, as defined in the report, corresponding links to employment sectors and occupations are made.
EU-LFS data: two-digit ISCO classifications ISCO-88 (2004-2010) and ISCO-08 (2011-2014):
Reference in the analysis
ISCO-88 ISCO-08
STEM 21 Physical, mathemat-ical and engineering science professionals
31 Physical and engineering science associate professionals
71 Extraction and building trades workers
72 Metal, machinery and related trades workers
81 Stationary plant and related operators
21 Science and engi-neering professionals
25 Information and communications tech-nology professionals
31 Science and engineering associate professionals
35 Information and communications technicians
71 Building and related trades workers (excluding electricians)
72 Metal, machinery and related trades workers
74 Electrical and elec-tronic trades workers
81 Stationary plant and machine operators
EHW 22 Life science and health professionals
23 Teaching professionals
32 Life science and health associate professionals
33 Teaching associate professionals
22 Health professionals
23 Teaching professionals
32 Health associate professionals
53 Personal care workers
EHW- and STEM-related occupations refer to the skills re-quired in relation to respective educational backgrounds at both upper secondary vocational education and tertiary education levels. A brief overview of the tasks performed by workers in STEM-related occupations (ISCO-08) is listed below (see EU Skills Panorama, 2016; ILO website(14)):
� Science and engineering professionals conduct research; improve or develop concepts, theories and operational methods; or apply scientific knowledge relating to fields such as physics, astronomy, meteorology, chemistry, geophysics, geology, biology, ecology, pharmacology, medicine, mathematics, statistics, architecture, engineering, design and technology.
(14) http://www.ilo.org/public/english/bureau/stat/isco/isco08
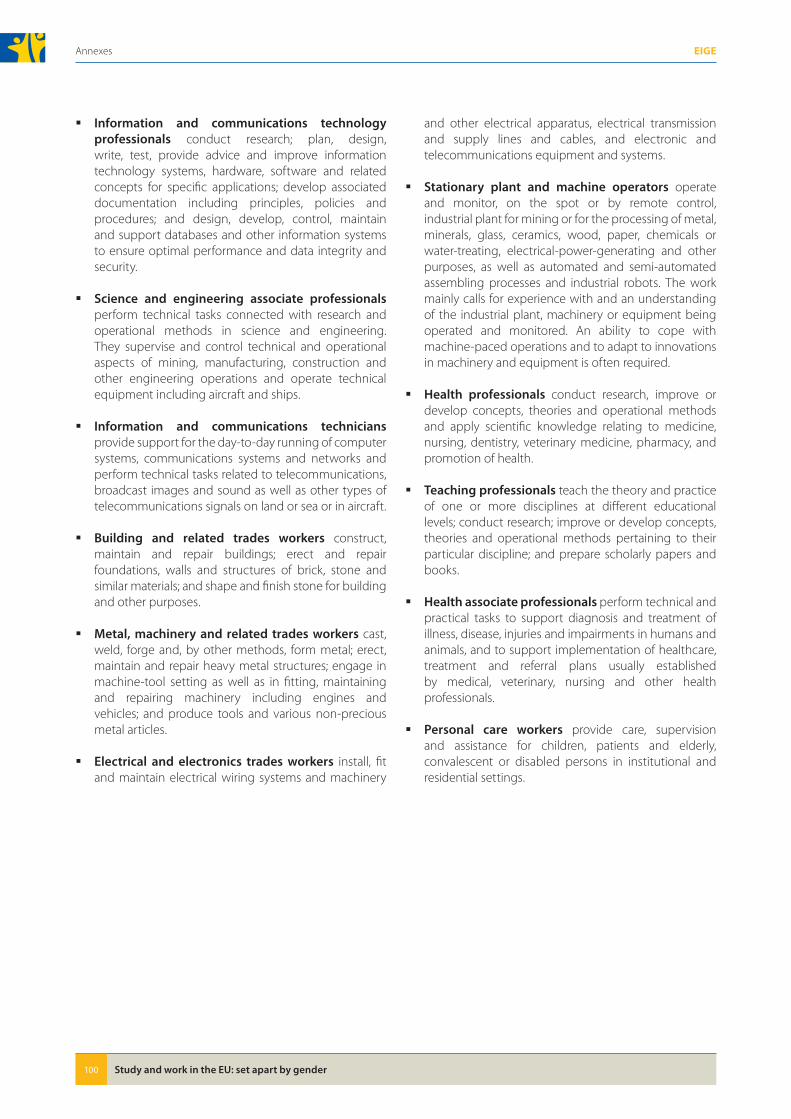
Study and work in the EU: set apart by gender100
Annexes EIGE
� Information and communications technology professionals conduct research; plan, design, write, test, provide advice and improve information technology systems, hardware, software and related concepts for specific applications; develop associated documentation including principles, policies and procedures; and design, develop, control, maintain and support databases and other information systems to ensure optimal performance and data integrity and security.
� Science and engineering associate professionals perform technical tasks connected with research and operational methods in science and engineering. They supervise and control technical and operational aspects of mining, manufacturing, construction and other engineering operations and operate technical equipment including aircraft and ships.
� Information and communications technicians provide support for the day-to-day running of computer systems, communications systems and networks and perform technical tasks related to telecommunications, broadcast images and sound as well as other types of telecommunications signals on land or sea or in aircraft.
� Building and related trades workers construct, maintain and repair buildings; erect and repair foundations, walls and structures of brick, stone and similar materials; and shape and finish stone for building and other purposes.
� Metal, machinery and related trades workers cast, weld, forge and, by other methods, form metal; erect, maintain and repair heavy metal structures; engage in machine-tool setting as well as in fitting, maintaining and repairing machinery including engines and vehicles; and produce tools and various non-precious metal articles.
� Electrical and electronics trades workers install, fit and maintain electrical wiring systems and machinery
and other electrical apparatus, electrical transmission and supply lines and cables, and electronic and telecommunications equipment and systems.
� Stationary plant and machine operators operate and monitor, on the spot or by remote control, industrial plant for mining or for the processing of metal, minerals, glass, ceramics, wood, paper, chemicals or water-treating, electrical-power-generating and other purposes, as well as automated and semi-automated assembling processes and industrial robots. The work mainly calls for experience with and an understanding of the industrial plant, machinery or equipment being operated and monitored. An ability to cope with machine-paced operations and to adapt to innovations in machinery and equipment is often required.
� Health professionals conduct research, improve or develop concepts, theories and operational methods and apply scientific knowledge relating to medicine, nursing, dentistry, veterinary medicine, pharmacy, and promotion of health.
� Teaching professionals teach the theory and practice of one or more disciplines at different educational levels; conduct research; improve or develop concepts, theories and operational methods pertaining to their particular discipline; and prepare scholarly papers and books.
� Health associate professionals perform technical and practical tasks to support diagnosis and treatment of illness, disease, injuries and impairments in humans and animals, and to support implementation of healthcare, treatment and referral plans usually established by medical, veterinary, nursing and other health professionals.
� Personal care workers provide care, supervision and assistance for children, patients and elderly, convalescent or disabled persons in institutional and residential settings.
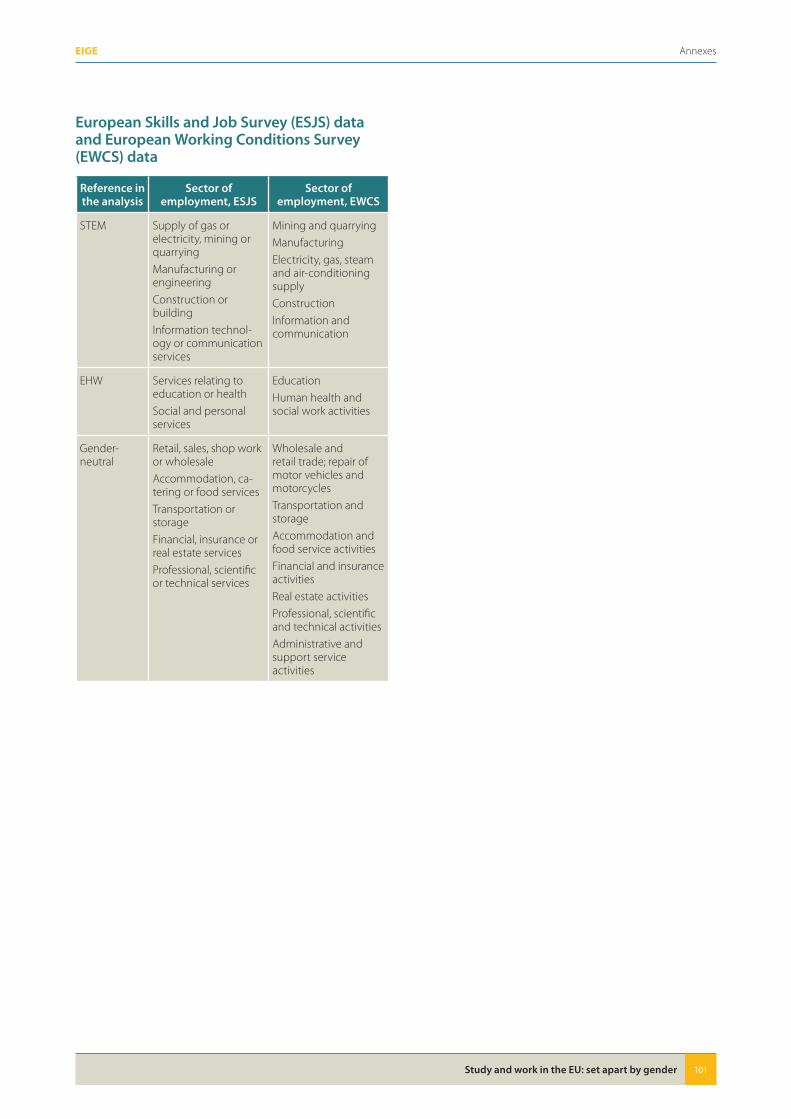
Study and work in the EU: set apart by gender 101
AnnexesEIGE
European Skills and Job Survey (ESJS) data and European Working Conditions Survey (EWCS) data
Reference in the analysis
Sector of employment, ESJS
Sector of employment, EWCS
STEM Supply of gas or electricity, mining or quarrying
Manufacturing or engineering
Construction or building
Information technol-ogy or communication services
Mining and quarrying
Manufacturing
Electricity, gas, steam and air-conditioning supply
Construction
Information and communication
EHW Services relating to education or health
Social and personal services
Education
Human health and social work activities
Gender-neutral
Retail, sales, shop work or wholesale
Accommodation, ca-tering or food services
Transportation or storage
Financial, insurance or real estate services
Professional, scientific or technical services
Wholesale and retail trade; repair of motor vehicles and motorcycles
Transportation and storage
Accommodation and food service activities
Financial and insurance activities
Real estate activities
Professional, scientific and technical activities
Administrative and support service activities
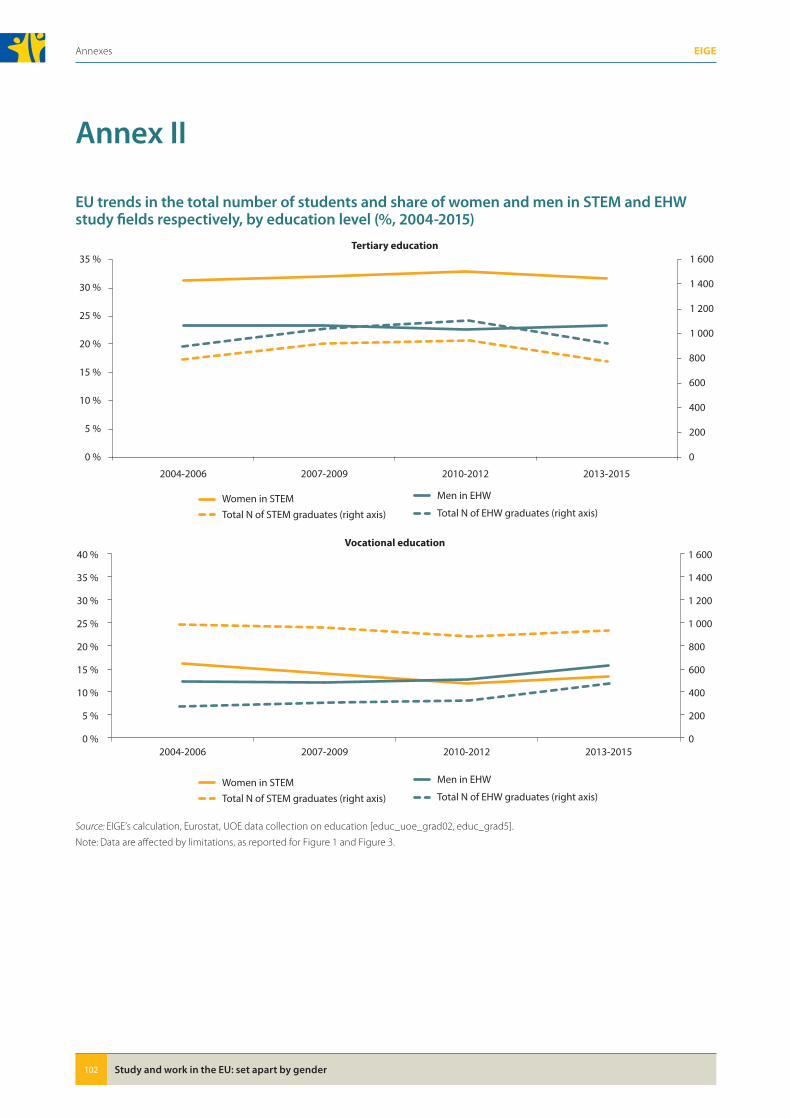
Study and work in the EU: set apart by gender102
Annexes EIGE
Annex II
EU trends in the total number of students and share of women and men in STEM and EHW study fields respectively, by education level (%, 2004-2015)
0
200
400
600
800
1 000
1 200
1 400
1 600
0 %
5 %
10 %
15 %
20 %
25 %
30 %
35 %
2004-2006 2007-2009 2010-2012 2013-2015
2004-2006 2007-2009 2010-2012 2013-2015
Tertiary education
Women in STEM Men in EHW
Total N of STEM graduates (right axis) Total N of EHW graduates (right axis)
Women in STEM Men in EHW
Total N of STEM graduates (right axis) Total N of EHW graduates (right axis)
0
200
400
600
800
1 000
1 200
1 400
1 600
0 %
5 %
10 %
15 %
20 %
25 %
30 %
35 %
40 %Vocational education
Source: EIGE’s calculation, Eurostat, UOE data collection on education [educ_uoe_grad02, educ_grad5].
Note: Data are affected by limitations, as reported for Figure 1 and Figure 3.
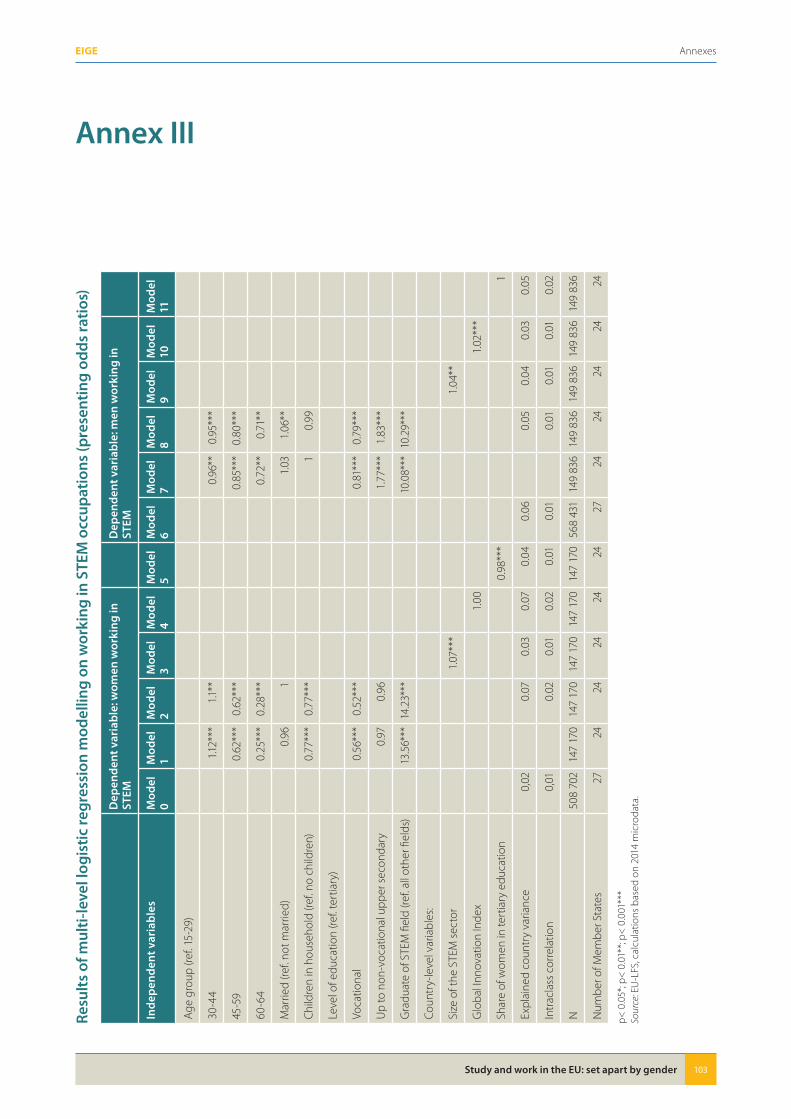
Study and work in the EU: set apart by gender 103
AnnexesEIGE
Annex III
Resu
lts
of m
ulti
-lev
el lo
gist
ic re
gres
sion
mod
ellin
g o
n w
orki
ng in
STE
M o
ccup
atio
ns (p
rese
ntin
g o
dd
s ra
tios
)
Dep
end
ent v
aria
ble
: wo
men
wo
rkin
g in
ST
EMD
epen
den
t var
iab
le: m
en w
ork
ing
in
STEM
Ind
epen
den
t var
iab
les
Mo
del
0
Mo
del
1
Mo
del
2
Mo
del
3
Mo
del
4
Mo
del
5
Mo
del
6
Mo
del
7
Mo
del
8
Mo
del
9
Mo
del
10
Mo
del
11
Age
gro
up (r
ef. 1
5-29
)
30-4
41.1
2***
1.1**
0.96
**0.
95**
*
45-5
90.
62**
*0.
62**
*0.
85**
*0.
80**
*
60-6
40.
25**
*0.
28**
*0.
72**
0.71
**
Mar
ried
(ref.
not m
arrie
d)0.
961
1.03
1.06
**
Child
ren
in h
ouse
hold
(ref
. no
child
ren)
0.77
***
0.77
***
10.
99
Leve
l of e
duca
tion
(ref.
tert
iary
)
Voca
tiona
l0.
56**
*0.
52**
*0.
81**
*0.
79**
*
Up
to n
on-v
ocat
iona
l upp
er s
econ
dary
0.97
0.96
1.77
***
1.83
***
Gra
duat
e of
STE
M fi
eld
(ref.
all o
ther
fiel
ds)
13.5
6***
14.2
3***
10.0
8***
10.2
9***
Coun
try-
leve
l var
iabl
es:
Size
of t
he S
TEM
sec
tor
1.07
***
1.04
**
Glo
bal I
nnov
atio
n In
dex
1.00
1.02
***
Shar
e of
wom
en in
tert
iary
edu
catio
n0.
98**
*1
Expl
aine
d co
untr
y va
rianc
e0,
020.
070.
030.
070.
040.
060.
050.
040.
030.
05
Intr
acla
ss c
orre
latio
n0,
010.
020.
010.
020.
010.
010.
010.
010.
010.
02
N50
8 70
214
7 17
014
7 17
014
7 17
014
7 17
014
7 17
056
8 43
114
9 83
614
9 83
614
9 83
614
9 83
614
9 83
6
Num
ber o
f Mem
ber S
tate
s27
2424
2424
2427
2424
2424
24
p< 0
.05*
; p<
0.0
1**;
p< 0
.001
***
Sour
ce: E
U-L
FS, c
alcu
latio
ns b
ased
on
2014
mic
roda
ta.
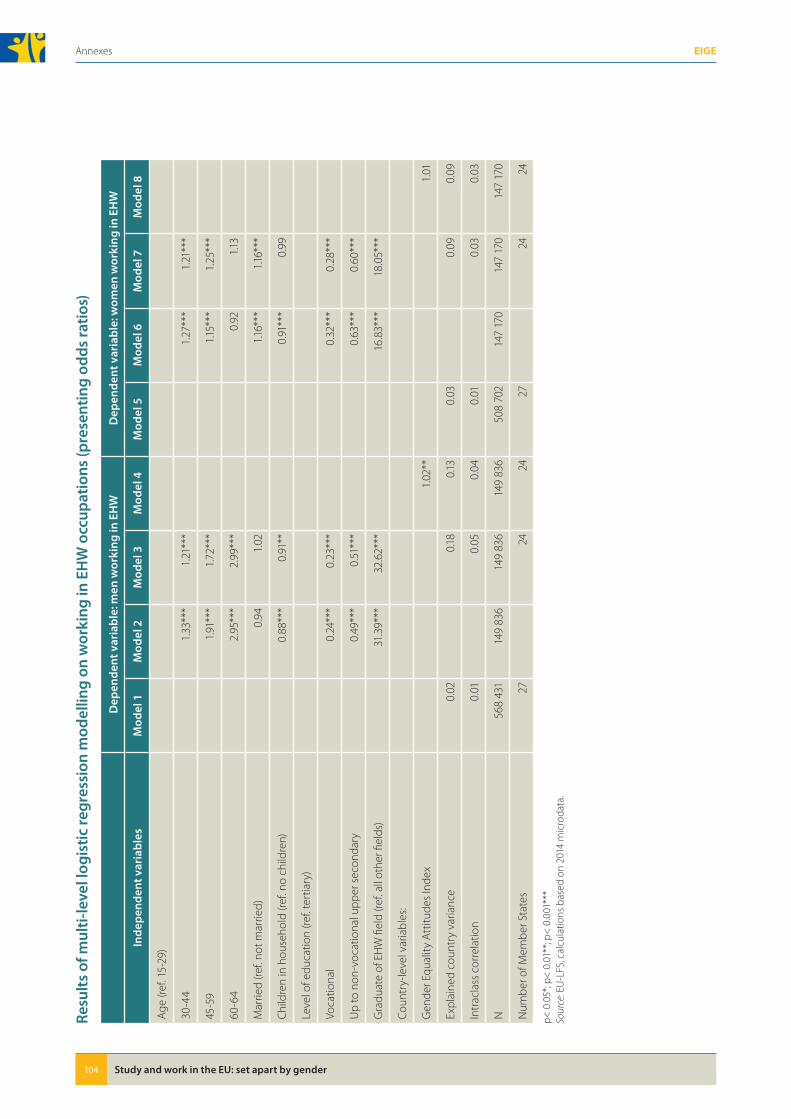
Study and work in the EU: set apart by gender104
Annexes EIGE
Resu
lts
of m
ulti
-lev
el lo
gist
ic re
gres
sion
mod
ellin
g o
n w
orki
ng in
EH
W o
ccup
atio
ns (p
rese
ntin
g o
dd
s ra
tios
)
Dep
end
ent v
aria
ble
: men
wo
rkin
g in
EH
WD
epen
den
t var
iab
le: w
om
en w
ork
ing
in E
HW
Ind
epen
den
t var
iab
les
Mo
del
1M
od
el 2
Mo
del
3M
od
el 4
Mo
del
5M
od
el 6
Mo
del
7M
od
el 8
Age
(ref
. 15-
29)
30-4
41.
33**
*1.
21**
*1.
27**
*1.
21**
*
45-5
91.
91**
*1.
72**
*1.1
5***
1.25
***
60-6
42.
95**
*2.
99**
*0.
921.1
3
Mar
ried
(ref.
not m
arrie
d)0.
941.
021.1
6***
1.16*
**
Child
ren
in h
ouse
hold
(ref
. no
child
ren)
0.88
***
0.91
**0.
91**
*0.
99
Leve
l of e
duca
tion
(ref.
tert
iary
)
Voca
tiona
l0.
24**
*0.
23**
*0.
32**
*0.
28**
*
Up
to n
on-v
ocat
iona
l upp
er s
econ
dary
0.49
***
0.51
***
0.63
***
0.60
***
Gra
duat
e of
EH
W fi
eld
(ref.
all o
ther
fiel
ds)
31.3
9***
32.6
2***
16.8
3***
18.0
5***
Coun
try-
leve
l var
iabl
es:
Gen
der E
qual
ity A
ttitu
des
Inde
x1.
02**
1.01
Expl
aine
d co
untr
y va
rianc
e0.
020.
180.
130.
030.
090.
09
Intr
acla
ss c
orre
latio
n0.
010.
050.
040.
010.
030.
03
N56
8 43
114
9 83
614
9 83
614
9 83
650
8 70
214
7 17
014
7 17
014
7 17
0
Num
ber o
f Mem
ber S
tate
s27
2424
2724
24
p< 0
.05*
; p<
0.0
1**;
p< 0
.001
***
Sour
ce: E
U-L
FS, c
alcu
latio
ns b
ased
on
2014
mic
roda
ta.
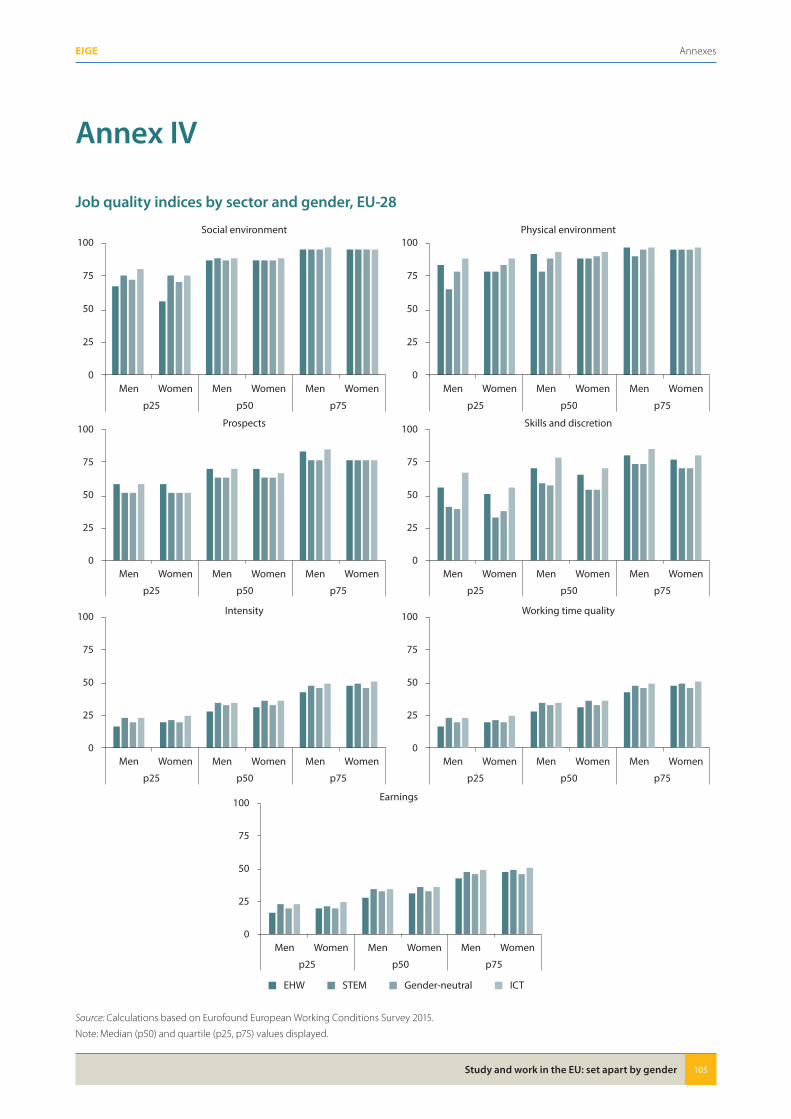
Study and work in the EU: set apart by gender 105
AnnexesEIGE
Annex IV
Job quality indices by sector and gender, EU-28
0
25
50
75
100
Men Women Men Women Men Women
p25 p50 p75
Social environment
EHW STEM Gender-neutral ICT
0
25
50
75
100
Men Women Men Women Men Women
p25 p50 p75
0
25
50
75
100
Men Women Men Women Men Women
p25 p50 p75
Prospects
0
25
50
75
100
Men Women Men Women Men Women
p25 p50 p75
Skills and discretion
0
25
50
75
100
Men Women Men Women Men Women
p25 p50 p75
Intensity
0
25
50
75
100
Men Women Men Women Men Women
p25 p50 p75
Working time quality
0
25
50
75
100
Men Women Men Women Men Women
p25 p50 p75
Earnings
Physical environment
Source: Calculations based on Eurofound European Working Conditions Survey 2015.
Note: Median (p50) and quartile (p25, p75) values displayed.
Study and work in the EU: set apart by gender106
Annexes EIGE
Annex V
Proposed list of BPfA indicators
Area B: Education and Training of Women
In 2007, under the German Presidency, the Council agreed on three EU-wide indicators, including two sub-indicators, to measure the progress in the EU on the implementation of the BPfA objectives in Area B: Education and Training of Women:
� B1. Proportion of female graduates and male graduates of all graduates in mathematics, the sciences and technical disciplines (tertiary education);
� B2. Employment rate of women and men (aged between 25 and 39 years; and aged between 40 and 64) by highest level of education attained;
� B3a. Proportion of female/male ISCED 5A graduates of all ISCED 5A graduates and proportion of female/male PhD graduates of all PhD graduates by broad field of study and total;
� B3b. Proportion of female and male academic staff differentiated by level of seniority and in total.
The proposal is to replace indicators B1, B3a and L3 (Area L: The Girl Child) with a new indicator:
� Proportion of women and men graduates in tertiary (ISCED Levels 5-8) and vocational (ISCED Levels 3-4) education and training in the fields of science, technology, engineering and mathematics (STEM) and in the field of education, health and welfare (EHW) of all graduates in the study field�
Description of a new indicator
The indicator addresses gender segregation in fields of studies that are considered as key areas for the EU’s smart, sustainable and inclusive growth. The Council conclusions on ‘Enhancing the skills of women and men in the EU la-bour market’ call for actions to ‘combat gender discrimina-tion, segregation and stereotypes in education, training, vocational training and career guidance; promote gen-der equality in schools, colleges and universities; encour-age girls, boys, women and men from all backgrounds to choose educational fields and occupations in accordance with their abilities and skills, not based on gender stereo-types, and in particular by promoting women’s and girls’ access to educational fields and occupations inter alia in science, technology, engineering and mathematics (STEM); encourage men and boys to study and work in fields such as social services, childcare and long-term care’ (Council of the European Union, 2017).
The indicator enables the monitoring of progress regard-ing the gender balance of graduates from STEM and EHW study fields, including natural sciences, mathematics and statistics; information and communication technologies; engineering, manufacturing and construction; education; and health and welfare. Furthermore, the indicator makes it possible to take a closer look at the gender distribution of graduates across vocational education (ISCED 35-45) and tertiary education levels.
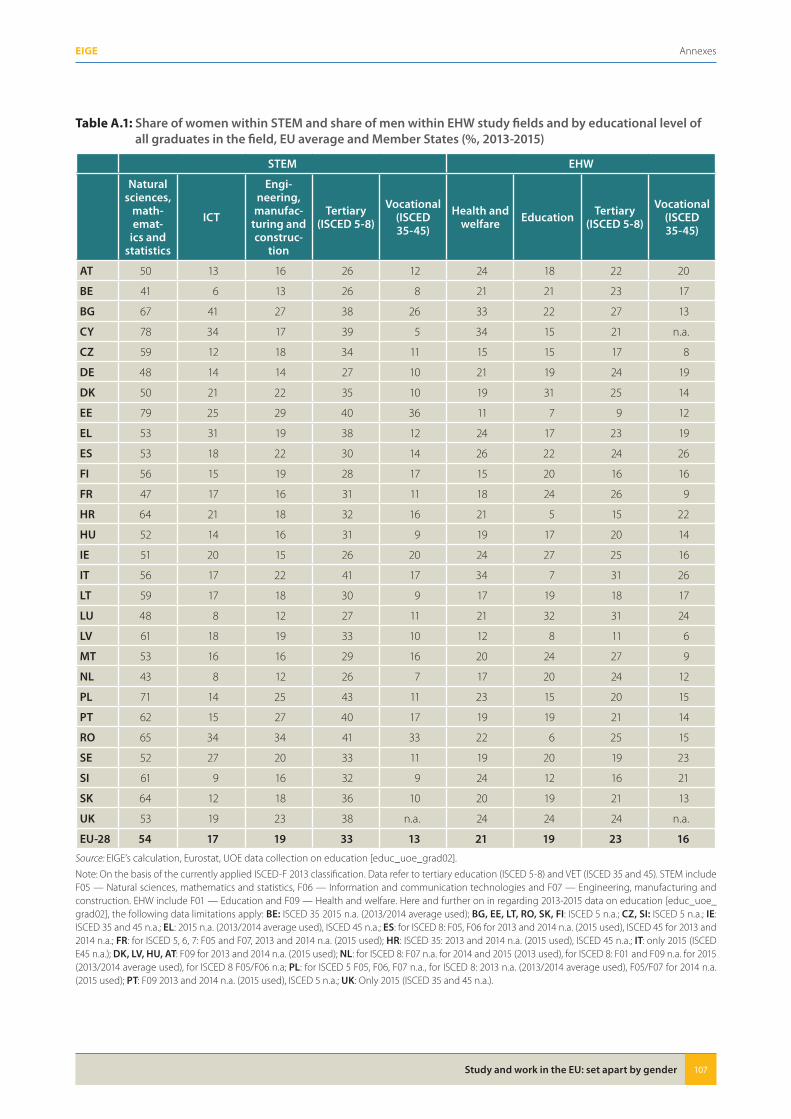
Study and work in the EU: set apart by gender 107
AnnexesEIGE
Table A.1: Share of women within STEM and share of men within EHW study fields and by educational level of all graduates in the field, EU average and Member States (%, 2013-2015)
STEM EHW
Natural sciences,
math-emat-
ics and statistics
ICT
Engi-neering,
manufac-turing and construc-
tion
Tertiary (ISCED 5-8)
Vocational (ISCED 35-45)
Health and welfare Education Tertiary
(ISCED 5-8)
Vocational (ISCED 35-45)
AT 50 13 16 26 12 24 18 22 20
BE 41 6 13 26 8 21 21 23 17
BG 67 41 27 38 26 33 22 27 13
CY 78 34 17 39 5 34 15 21 n.a.
CZ 59 12 18 34 11 15 15 17 8
DE 48 14 14 27 10 21 19 24 19
DK 50 21 22 35 10 19 31 25 14
EE 79 25 29 40 36 11 7 9 12
EL 53 31 19 38 12 24 17 23 19
ES 53 18 22 30 14 26 22 24 26
FI 56 15 19 28 17 15 20 16 16
FR 47 17 16 31 11 18 24 26 9
HR 64 21 18 32 16 21 5 15 22
HU 52 14 16 31 9 19 17 20 14
IE 51 20 15 26 20 24 27 25 16
IT 56 17 22 41 17 34 7 31 26
LT 59 17 18 30 9 17 19 18 17
LU 48 8 12 27 11 21 32 31 24
LV 61 18 19 33 10 12 8 11 6
MT 53 16 16 29 16 20 24 27 9
NL 43 8 12 26 7 17 20 24 12
PL 71 14 25 43 11 23 15 20 15
PT 62 15 27 40 17 19 19 21 14
RO 65 34 34 41 33 22 6 25 15
SE 52 27 20 33 11 19 20 19 23
SI 61 9 16 32 9 24 12 16 21
SK 64 12 18 36 10 20 19 21 13
UK 53 19 23 38 n.a. 24 24 24 n.a.
EU-28 54 17 19 33 13 21 19 23 16
Source: EIGE’s calculation, Eurostat, UOE data collection on education [educ_uoe_grad02].
Note: On the basis of the currently applied ISCED-F 2013 classification. Data refer to tertiary education (ISCED 5-8) and VET (ISCED 35 and 45). STEM include F05 — Natural sciences, mathematics and statistics, F06 — Information and communication technologies and F07 — Engineering, manufacturing and construction. EHW include F01 — Education and F09 — Health and welfare. Here and further on in regarding 2013-2015 data on education [educ_uoe_grad02], the following data limitations apply: BE: ISCED 35 2015 n.a. (2013/2014 average used); BG, EE, LT, RO, SK, FI: ISCED 5 n.a.; CZ, SI: ISCED 5 n.a.; IE: ISCED 35 and 45 n.a.; EL: 2015 n.a. (2013/2014 average used), ISCED 45 n.a.; ES: for ISCED 8: F05, F06 for 2013 and 2014 n.a. (2015 used), ISCED 45 for 2013 and 2014 n.a.; FR: for ISCED 5, 6, 7: F05 and F07, 2013 and 2014 n.a. (2015 used); HR: ISCED 35: 2013 and 2014 n.a. (2015 used), ISCED 45 n.a.; IT: only 2015 (ISCED E45 n.a.); DK, LV, HU, AT: F09 for 2013 and 2014 n.a. (2015 used); NL: for ISCED 8: F07 n.a. for 2014 and 2015 (2013 used), for ISCED 8: F01 and F09 n.a. for 2015 (2013/2014 average used), for ISCED 8 F05/F06 n.a; PL: for ISCED 5 F05, F06, F07 n.a., for ISCED 8: 2013 n.a. (2013/2014 average used), F05/F07 for 2014 n.a. (2015 used); PT: F09 2013 and 2014 n.a. (2015 used), ISCED 5 n.a.; UK: Only 2015 (ISCED 35 and 45 n.a.).
Study and work in the EU: set apart by gender108
Annexes EIGE
Concept. The share of women graduates of all graduates in STEM fields of education indicates the gender composition of a persistently men-dominated study field. The share of men graduates of all graduates in EHW fields of education indicates the gender composition of a persistently women-dominated educational field. The definition of study fields relies on the ISCED classification of education and training (ISCED-F 2013), thus enabling comparison of EU countries based on harmonised definitions. The suggestion is to monitor two educational levels: vocational education, in-cluding upper secondary (ISCED 35) and post-secondary non-tertiary vocational education programmes (ISCED 45), and tertiary education across ISCED Levels 5-8.
Though data cover all EU Member States annually, data gaps across countries and years exist. Due to data availability and reliability limits (i.e. small sample size) across Member States, data are presented as 3-year averages. This helps to com-pensate for the data gaps in some years and to smooth vari-ations due to a low number of graduates in selected fields and countries, where even small changes in terms of abso-lute numbers can indicate a large change in relative terms.
Data source. The calculation of the indicator is based on the Unesco–OECD–Eurostat (UOE) data collection on edu-cation: http://ec.europa.eu/eurostat/statistics-explained/index.php/Unesco_OECD_Eurostat_(UOE)_joint_data_col-lection_ %E2 %80 %93_methodology
Published. Data are available in the Eurostat online data-base (educ_uoe_grad02: ‘Graduates by education level, programme orientation, sex and field of education’ for data since 2013 and educ_grad5: ‘Graduations in ISCED 3 to 6 by field of education and sex’ for data up to 2012). Data are published as total number of graduates. Thus, further calcu-lations are necessary in order to calculate the total number of graduates in educational fields constituting STEM and EHW, as well as to establish 3-year average indicators.
Note: It is important to keep in mind that the study pro-grammes constituting STEM can be different across coun-tries. For instance, in the case of vocational education in the United Kingdom, only graduates of ICT programmes are included. It is also important to note that changes in ISCED classifications since 2013 can have an impact on data com-parability to the period up to 2012 for some countries.
Area L: The Girl Child
In 2008, under the Slovenian Presidency, the Council agreed on three indicators to measure the progress in the EU on the implementation of the BPfA objectives in Area L: The Girl Child:
� L1. Sex and relationship education: parameters of sexuality-related education in schooling (primary and secondary);
� L2. Body self-image: dissatisfaction of girls and boys with their bodies;
� L3. Educational accomplishments: comparison of 15-year-old students’ performance in mathematics and science and the proportion of girl students in tertiary education in the field of science, mathematics and computing and in the field of teacher training and education science.
The indicator L3 duplicates the new indicator proposed un-der Area B: Education and Training of Women (see above); it is therefore redundant and should be removed. A new indicator on the career aspirations of 15-year-old students is proposed:
� Proportion of all and top-performing girls and boys in science aged 15 expecting to work in science-related occupations at age 30�
Description of a new indicator
In order to increase students’ interest in technology and science, both ability and aspirations must be addressed. As highlighted by the EU report Science Education for Responsi-ble Citizenship: ‘Over the last decades, there has been an in-crease in the numbers of students leaving formal education with science qualifications. But there has not been a parallel rise in the numbers interested in pursuing science-related careers nor have we witnessed enhanced science-based in-novation or any increase in entrepreneurship … We must find better ways to nurture the curiosity and cognitive re-sources of children. We need to enhance the educational process to better equip future researchers and other actors with the necessary knowledge, motivation and sense of so-cietal responsibility to participate actively in the innovation process’ (European Commission, 2015d).
The indicator enables the monitoring of students’ prefer-ences at age 15 as an early indication of subsequent edu-cational and occupational segregation. Knowing students’ expectations at this age can enable early intervention in ensuring adequate career advice that could address gender stereotypes and enable students to best make use of their own abilities and pursue their own interests. This informa-tion can also inform policy discussions on reasons for un-met expectations and related policy decisions.
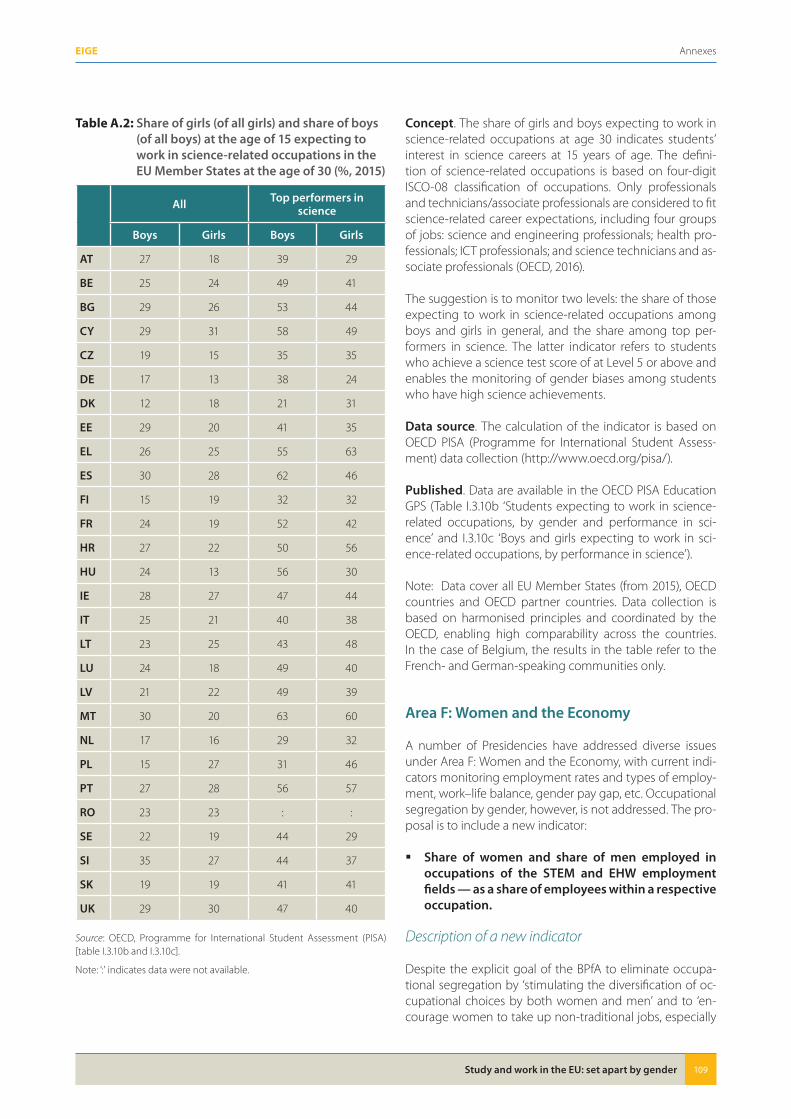
Study and work in the EU: set apart by gender 109
AnnexesEIGE
Table A.2: Share of girls (of all girls) and share of boys (of all boys) at the age of 15 expecting to work in science-related occupations in the EU Member States at the age of 30 (%, 2015)
All Top performers in science
Boys Girls Boys Girls
AT 27 18 39 29
BE 25 24 49 41
BG 29 26 53 44
CY 29 31 58 49
CZ 19 15 35 35
DE 17 13 38 24
DK 12 18 21 31
EE 29 20 41 35
EL 26 25 55 63
ES 30 28 62 46
FI 15 19 32 32
FR 24 19 52 42
HR 27 22 50 56
HU 24 13 56 30
IE 28 27 47 44
IT 25 21 40 38
LT 23 25 43 48
LU 24 18 49 40
LV 21 22 49 39
MT 30 20 63 60
NL 17 16 29 32
PL 15 27 31 46
PT 27 28 56 57
RO 23 23 : :
SE 22 19 44 29
SI 35 27 44 37
SK 19 19 41 41
UK 29 30 47 40
Source: OECD, Programme for International Student Assessment (PISA) [table I.3.10b and I.3.10c].
Note: ‘:’ indicates data were not available.
Concept. The share of girls and boys expecting to work in science-related occupations at age 30 indicates students’ interest in science careers at 15 years of age. The defini-tion of science-related occupations is based on four-digit ISCO-08 classification of occupations. Only professionals and technicians/associate professionals are considered to fit science-related career expectations, including four groups of jobs: science and engineering professionals; health pro-fessionals; ICT professionals; and science technicians and as-sociate professionals (OECD, 2016).
The suggestion is to monitor two levels: the share of those expecting to work in science-related occupations among boys and girls in general, and the share among top per-formers in science. The latter indicator refers to students who achieve a science test score of at Level 5 or above and enables the monitoring of gender biases among students who have high science achievements.
Data source. The calculation of the indicator is based on OECD PISA (Programme for International Student Assess-ment) data collection (http://www.oecd.org/pisa/).
Published. Data are available in the OECD PISA Education GPS (Table I.3.10b ‘Students expecting to work in science-related occupations, by gender and performance in sci-ence’ and I.3.10c ‘Boys and girls expecting to work in sci-ence-related occupations, by performance in science’).
Note: Data cover all EU Member States (from 2015), OECD countries and OECD partner countries. Data collection is based on harmonised principles and coordinated by the OECD, enabling high comparability across the countries. In the case of Belgium, the results in the table refer to the French- and German-speaking communities only.
Area F: Women and the Economy
A number of Presidencies have addressed diverse issues under Area F: Women and the Economy, with current indi-cators monitoring employment rates and types of employ-ment, work–life balance, gender pay gap, etc. Occupational segregation by gender, however, is not addressed. The pro-posal is to include a new indicator:
� Share of women and share of men employed in occupations of the STEM and EHW employment fields — as a share of employees within a respective occupation�
Description of a new indicator
Despite the explicit goal of the BPfA to eliminate occupa-tional segregation by ‘stimulating the diversification of oc-cupational choices by both women and men’ and to ‘en-courage women to take up non-traditional jobs, especially
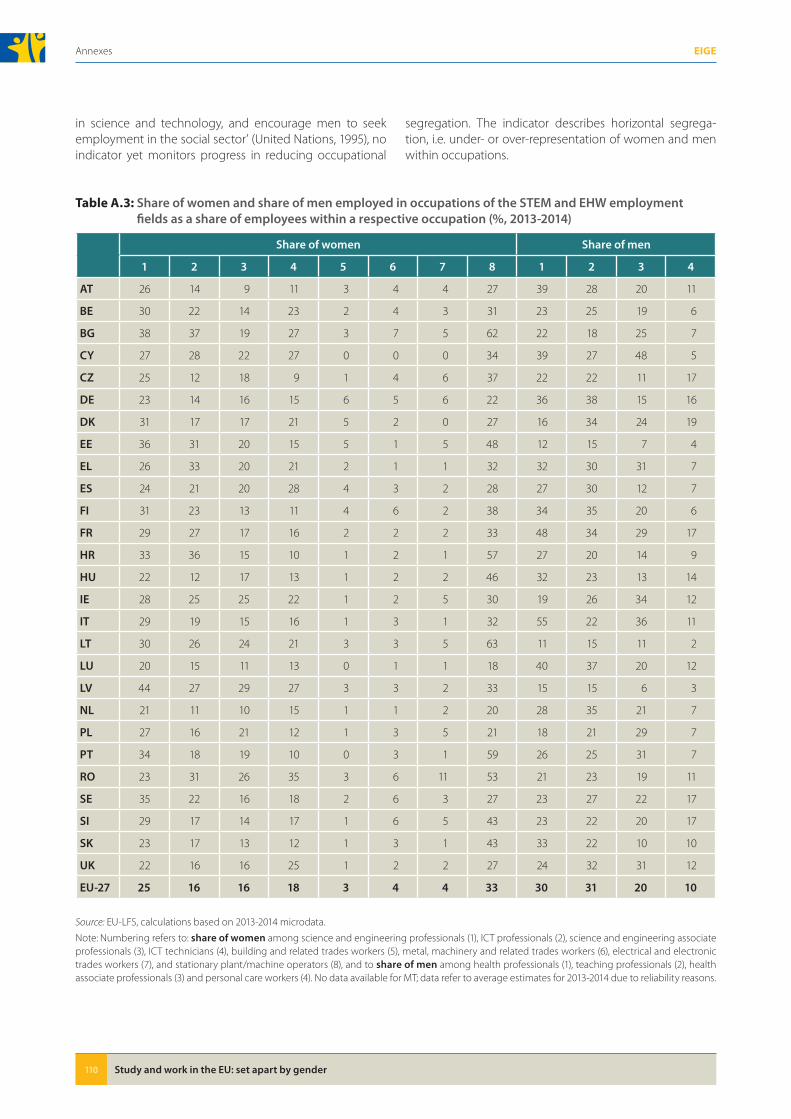
Study and work in the EU: set apart by gender110
Annexes EIGE
in science and technology, and encourage men to seek employment in the social sector’ (United Nations, 1995), no indicator yet monitors progress in reducing occupational
segregation. The indicator describes horizontal segrega-tion, i.e. under- or over-representation of women and men within occupations.
Table A.3: Share of women and share of men employed in occupations of the STEM and EHW employment fields as a share of employees within a respective occupation (%, 2013-2014)
Share of women Share of men
1 2 3 4 5 6 7 8 1 2 3 4
AT 26 14 9 11 3 4 4 27 39 28 20 11
BE 30 22 14 23 2 4 3 31 23 25 19 6
BG 38 37 19 27 3 7 5 62 22 18 25 7
CY 27 28 22 27 0 0 0 34 39 27 48 5
CZ 25 12 18 9 1 4 6 37 22 22 11 17
DE 23 14 16 15 6 5 6 22 36 38 15 16
DK 31 17 17 21 5 2 0 27 16 34 24 19
EE 36 31 20 15 5 1 5 48 12 15 7 4
EL 26 33 20 21 2 1 1 32 32 30 31 7
ES 24 21 20 28 4 3 2 28 27 30 12 7
FI 31 23 13 11 4 6 2 38 34 35 20 6
FR 29 27 17 16 2 2 2 33 48 34 29 17
HR 33 36 15 10 1 2 1 57 27 20 14 9
HU 22 12 17 13 1 2 2 46 32 23 13 14
IE 28 25 25 22 1 2 5 30 19 26 34 12
IT 29 19 15 16 1 3 1 32 55 22 36 11
LT 30 26 24 21 3 3 5 63 11 15 11 2
LU 20 15 11 13 0 1 1 18 40 37 20 12
LV 44 27 29 27 3 3 2 33 15 15 6 3
NL 21 11 10 15 1 1 2 20 28 35 21 7
PL 27 16 21 12 1 3 5 21 18 21 29 7
PT 34 18 19 10 0 3 1 59 26 25 31 7
RO 23 31 26 35 3 6 11 53 21 23 19 11
SE 35 22 16 18 2 6 3 27 23 27 22 17
SI 29 17 14 17 1 6 5 43 23 22 20 17
SK 23 17 13 12 1 3 1 43 33 22 10 10
UK 22 16 16 25 1 2 2 27 24 32 31 12
EU-27 25 16 16 18 3 4 4 33 30 31 20 10
Source: EU-LFS, calculations based on 2013-2014 microdata.
Note: Numbering refers to: share of women among science and engineering professionals (1), ICT professionals (2), science and engineering associate professionals (3), ICT technicians (4), building and related trades workers (5), metal, machinery and related trades workers (6), electrical and electronic trades workers (7), and stationary plant/machine operators (8), and to share of men among health professionals (1), teaching professionals (2), health associate professionals (3) and personal care workers (4). No data available for MT; data refer to average estimates for 2013-2014 due to reliability reasons.
Study and work in the EU: set apart by gender 111
AnnexesEIGE
Concept. The share of women across occupations of the STEM industries and the share of men across occupations of the EHW sector enable monitoring of occupational seg-regation with a focus on the work fields that are marked by persistently high gender segregation. To define occupa-tions, the variable ‘Occupation (ISCO-08 COM)’ has been used (since 2011) in the EU-LFS dataset. As only a one-digit occupation classification has been used for Malta, it is not possible to include the data for Malta. Due to data availabili-ty and reliability limits (i.e. small sample size) across Member States, data are presented as 2-year averages.
Data source. The calculation of the indicator is based on EU-LFS data (European Labour Force Survey): h t t p : //e c . e u r o p a . e u /e u r o s t a t / w e b /m i c r o d a t a /european-union-labour-force-survey
Published. Calculation of the indicator requires access to EU-LFS microdata. Data are not published online with the necessary detail. Microdata access can be applied for from Eurostat.
Note: The EU-LFS is conducted in the 28 Member States of the European Union, as well as in two candidate coun-tries and three countries of the European Free Trade Asso-ciation (EFTA), in accordance with Council Regulation (EEC) No 577/98 of 9 March 1998. The EU-LFS is a large house-hold sample survey providing quarterly results on labour participation of people aged 15 and over. It is important to note changes in the classification of occupations, as ISCO has been updated to take into account developments in the world of work since 1988 and to make improvements in light of experience gained in using ISCO-88. The proposed indicator relies on the recent version of ISCO, i.e. ISCO-08.