Embed Size (px)
Citation preview
Studv Area and
Methods
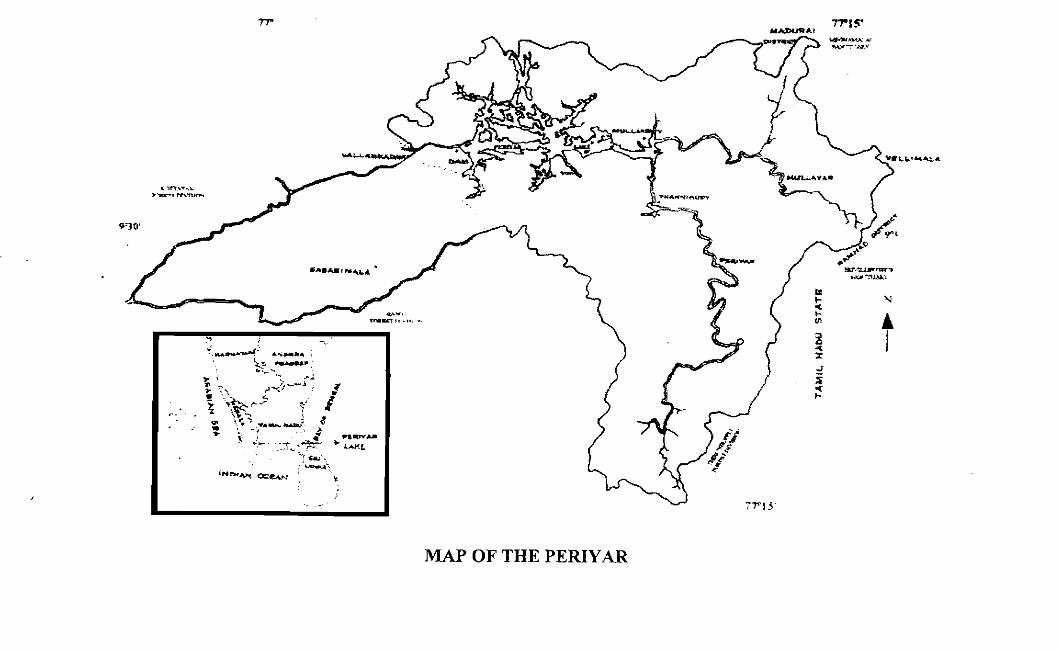
MAP OF THE PERIYAR
Chapter 2 -- - - - -
STUDY AREA AND METHODS
Periyar Tiger Reserve that takes its name from the river Periyar, the largest
river in Kerala, lies between 9' 16' and 9"40' N iat and hetwecn 7 6 " ~ ~ ' and
77"25' E long. The reserve having an area of 777 krn2 is situated on the
Western Ghats in the ldukki district of Kerala (PLATE 11).
2.1 Boundaries.
East: Part of interstate boundary between Kerala and Tamil Nadu
West: Privately owned cardamom and tea estates and also eastern
boundary of Kottayam district.
North: Part of interstate boundary between Kerala and Tamil Nadu
South: Northern boundary of Ranni Forest Division, Pamba river also
forms southern boundary.
2.2 Geornorphology.
The tract is hilly and the terrain undulating in many areas of Periyar
plataeu and rugged with loRy peaks and precipitous slopes it1 other areas.
The elevation ranges from' 400 to 2014 m. There are a large number of
Study area and Methads
peaks in the Sanctuary and in its with Tamil Nadu Some of them '
rise above 2000 nl and Vellimalai the highest peak has an elevation of
2014 m. The Periyar River which originates from Chokkampetty with its
manifold tributaries drains the Sanctuary area The river Mullayar which
originates at Kottamalai, joins Periyar at Mullakudy and forms the
Mullaperiyar River. The Periyar Lake had been formed by constructing a
dam across the Mullaperiyar River by the erstwhile Madras Government in
1895. The lake is at an elevation of 900m. The water spread area of the
lake is 26 km2 with depth rangins from 46 m to 321n. Portions on the
western side of the plateau are drained by rivers Pamha and Azhutha,
which form the boundary of the reserve. Rocks are crystalline and of
plutonic origin There are occasional outcrops of gneiss) and numerous 1 LJ
boulders on the ground particularly in the stream beds and stream banks
Depths of the soil varies according to the terrain, and the soil is n~ostly
wet.
2.3 Vegetation
Vegetation of the reserve comprises tropical evergreen and semi evergreen
forests (74 6%) moist deciduous forests (12.7%), grasslands ( I 5%) and
eucaliptus plantations 97 1%)
The tropical evergreen forests (305 km2) consist of trees like kzleria
iticiicn, l ) ip/crocarl~~i .~ hotrrdillio~ii, I'crlnqrrititrrn el/ipficum, Moslm ,firretr,
E/eocarp~rs it~berctrlatiis, ' C,'ar~ariiim sfricft~rn etc. Reeds are found i n wet - - FISHERY MANAGEMENT IN PERIYAR LAKE 10
I >
areas. Undergrowth
C~irrcirma sp., etc. Semi
hirsirta, Hopeapnrvrfira, Tetrnrneles rl~rdrjora etc. Undergrowth is thick
at many places. Moist deciduous forests (99 km2) consist of 72ctot1a
grai~dis, Dalbergin larifolia, Pterocorpirs mnr,nrpilrm, 7't.rmit1olio
par~iculata. Hridelia re/rrsn, Lmblica ~ f l c i r ~ d i s , Greu~iu iil~a~fi)lin,
Bombax sp. etc. In a preliminary survey, 64 species of grasses, 209
species of trees and 75 species of herbs have been identified in this area.
(Srivasthava et a1 1994, KFD 1986).
2.4 Climate
The climate in the tiger reserve area can be described as cool and humid
with heavy rainfall.
2.5 Temperature
The temperature varies from 1 5 . 5 ' ~ in December - January to 31" C in
April - May.
2.6 Rainfall
The average rainfall of the area is 2500 mm. The area receives both
Southwest and NorthEast monsoons
FISHERY MANAGEMENT IN PERlYAR LAKE 1 1
Study area and Metllods
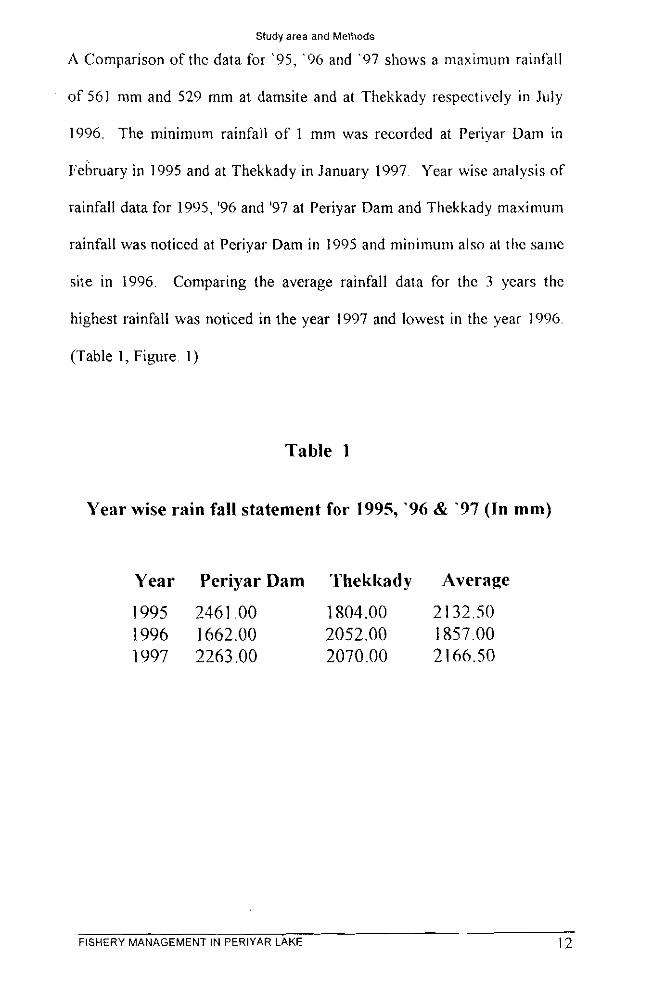
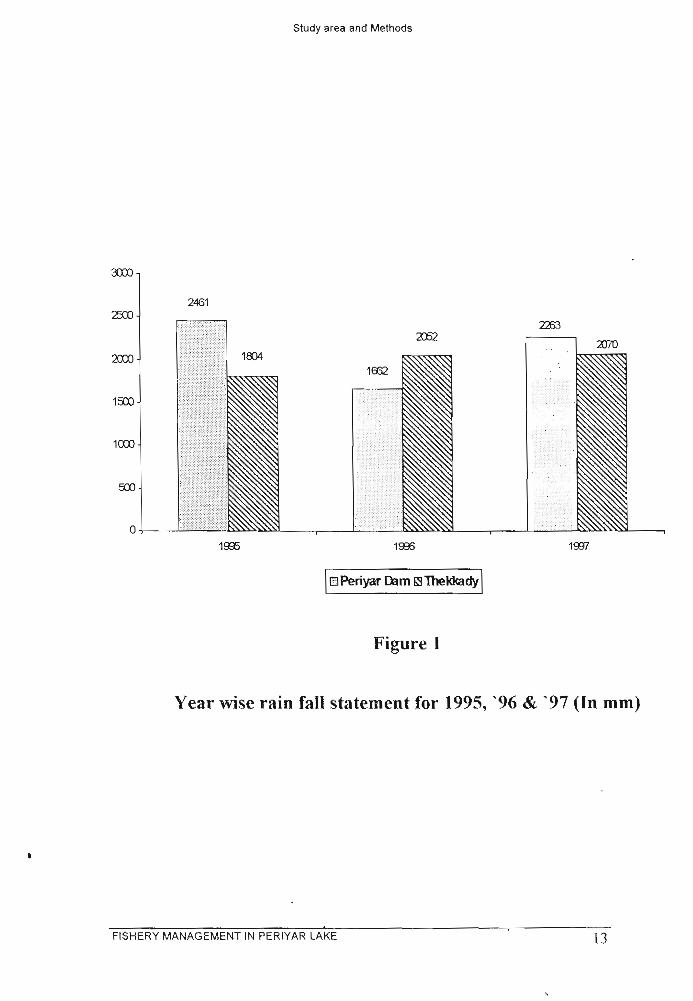
A Cornparison of the data for '95, '96 and '97 shows a maximum rainf'all
of 561 mm and 529 rnm at damsite and at Thekkady respectively i n July
1996. The minimum rainfall of 1 mrn was recorded at Periyar Darn in
~ e b r u a r ~ in 1995 and at Thekkady in January 1997. Year wise analysis of
rainfall data for 1995, '96 and '97 at Periyar Dam and Thekkady maximum
rainfall was noticed at Periyar Dam in 1995 and minimurn also al the same
site in 1996. Comparing the average rainfall data for the 3 years the
highest rainfall was noticed in the year 1997 arid lowest in the year 1996.
(Table 1, Figure. 1)
Table 1
Year wise rain fall statement for 1995, '96 & '97 (In mm)
Year Periyar Dam Thekkady Average
FISHERY MANAGEMENT IN PERIYAR LAKE 12
Study area and Methods
Figure I
Year wise rain fall statement for 1995, '96 & '97 (Cn mm)
FISHERY MANAGEMENT IN PERIYAR LAKE 13
Study area and Methods
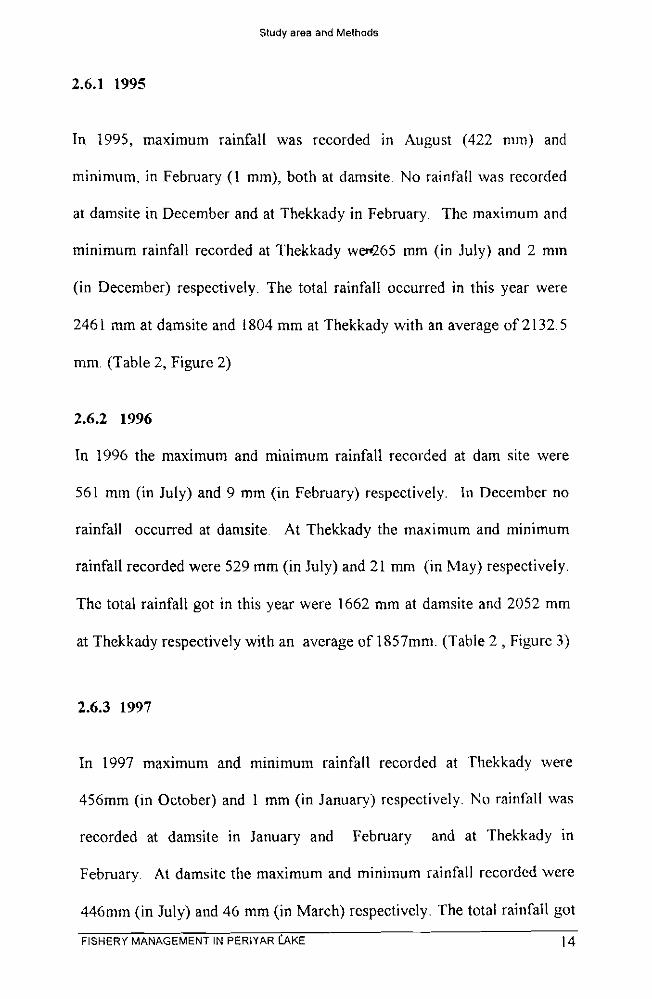
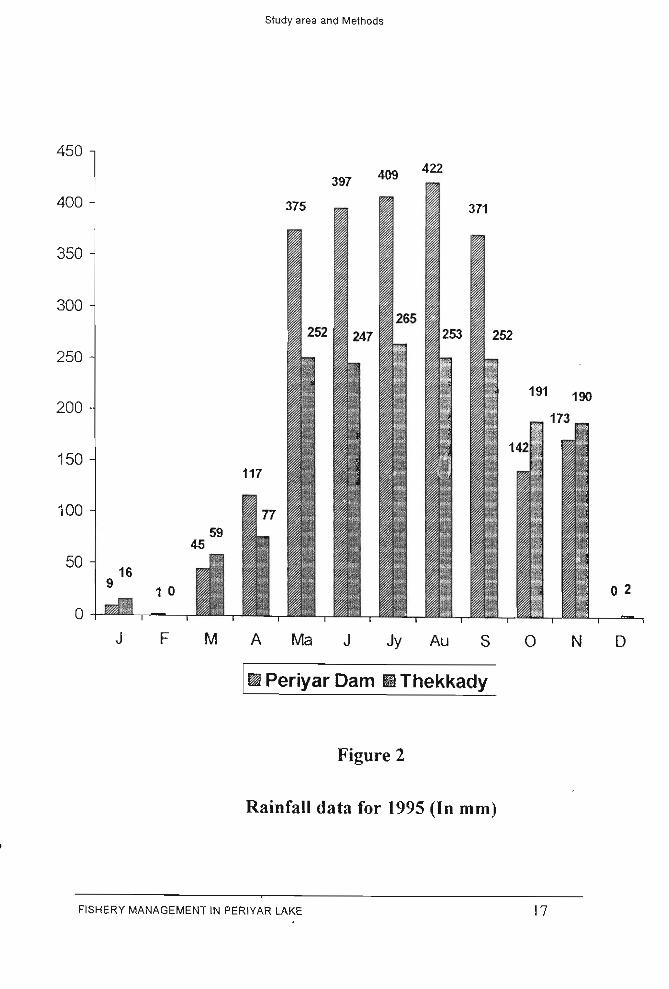
In 1995, maximum rainfall was recorded in August (422 nim) and
minimum, in February (1 mm), both at damsite. No rainfall was recorded
at damsite in December and at Thekkady in February. The maximum and
minimum rainfall recorded at Thekkady wen265 mm (in July) and 2 mtn
(in December) respectively. The total rainfall occurred in this year were
2461 mm at damsite and 1804 mm at Thekkady with an average of 2132.5
mm. (Table 2, Figure 2)
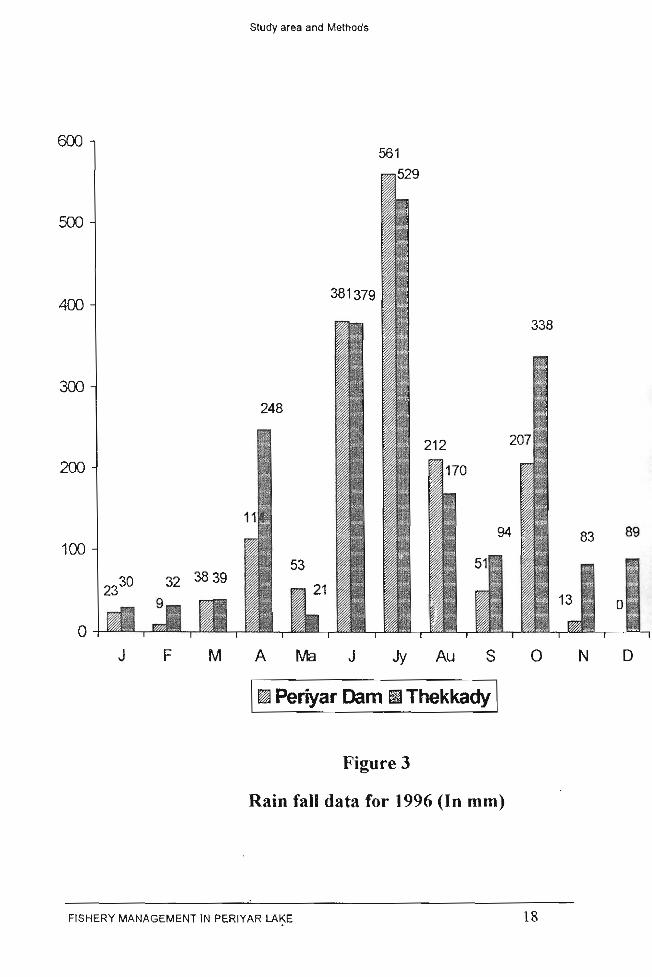
2.6.2 1996
In 1996 the maximum and minimum rainfall recorded at dam site were
561 mm (in July) and 9 mm (in February) respectively. In December no
rainfall occurred at damsite At Thekkady the maximrim and minimum
rainfall recorded were 529 mm (in July) and 21 mrn (in May) respectively
The total rainfall got in this year were 1662 mm at damsite and 2052 mm
at Thekkady respectively with an average of 1857mm. (Table 2 , Figure 3)
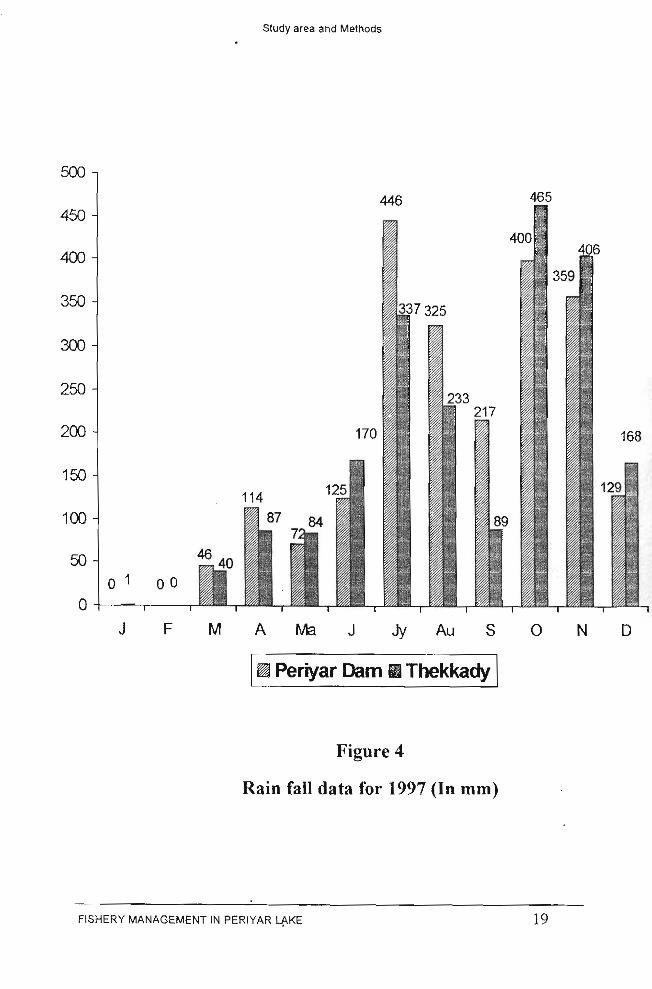
In 1997 maximum and minimum rainfall recorded at Thekkady were
456mm (in October) and 1 mm (in January) rcspectively. No rainfall was
recorded at damsite in January and February and at Thekkady in
February. At damsite the maximum and minimum rainfall recorded were
446mm (in July) and 46 mm (in March) respectively. The total rainfall got
Study area and Methods
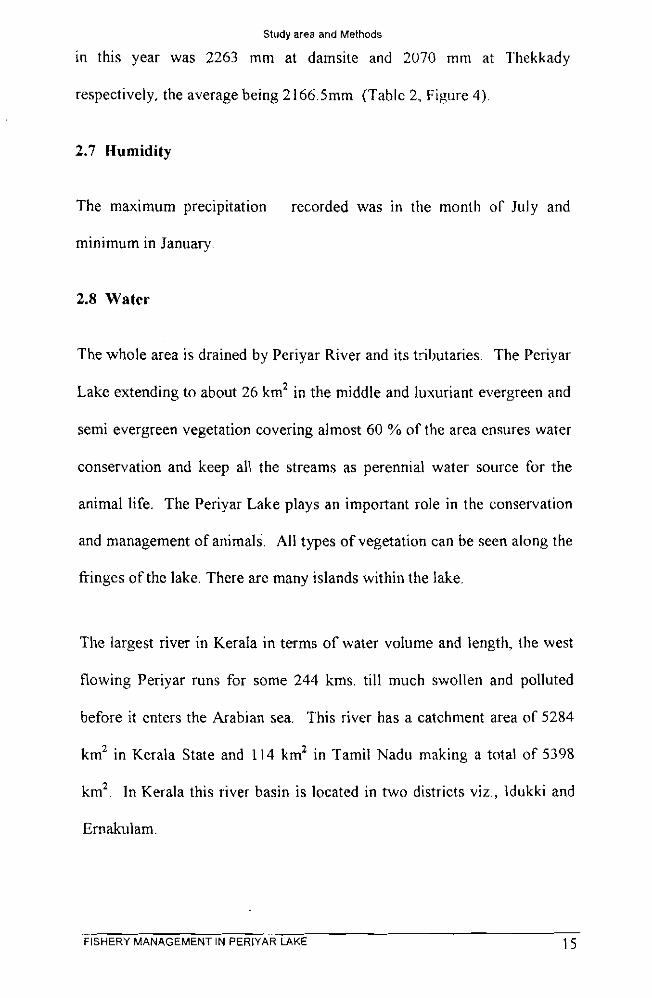
in this year was 2263 mm at damsite and 2070 mm at l'hekkady
respectively, the average being 2166.Smm (Tablc 2, Figure 4).
2.7 Humidity
The maximum precipitation recorded was in the month of July and
minimum in January
2.8 Water
The whole area is drained by Periyar River and its tributaries. The Periyar
Lake extending to about 26 km2 in the middle and luxuriant evergreen and
semi evergreen vegetation covering almost 60 % of the area ensures water
conservation and keep all the streams as perennial water source for the
animal life. The Periyar Lake plays an important role in the conservation
and management of animals. All types of vegetation can be seen along the
fringes of the lake. There are many islands within the lake.
The largest river in Kerala in terms of water volume and length, the west
flowing Periyar runs for some 244 kms, till much swollen and polluted
before it enters the Arabian sea. This river has a catchment area of 5284
kmz in Kerala State and 114 km2 in Tamil Nadu making a total of 5398
kmz. In Kerala this river basin is located in two districts viz., ldukki and
Ernakulam.
FISHERY MANAGEMENT IN PERIYAR LAKE 15
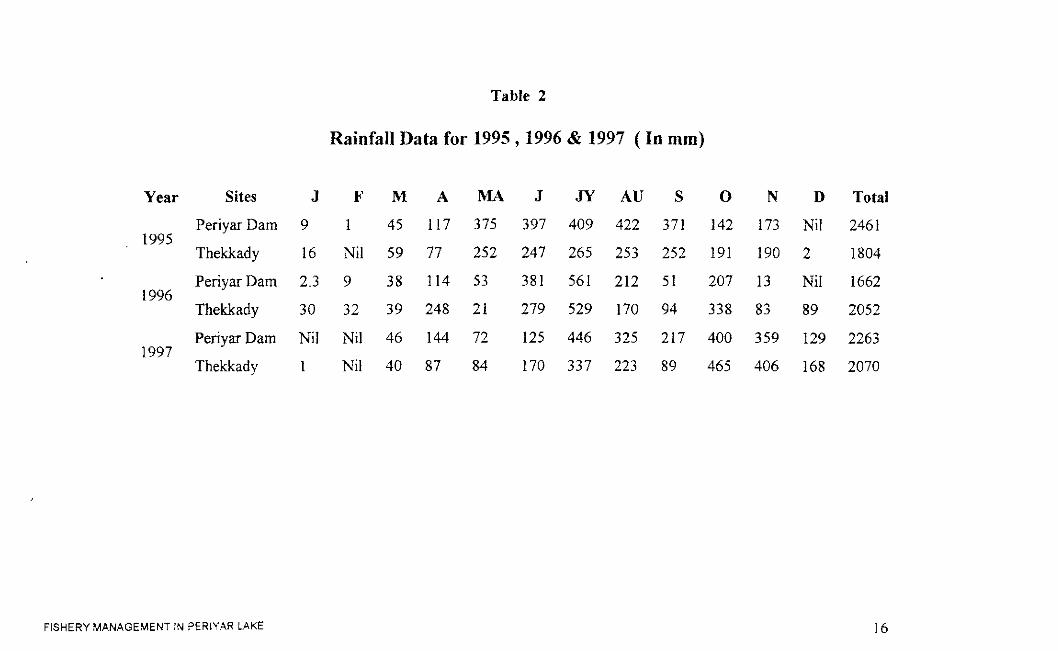
Rainfall Data for 1995,1996 & 1997 ( In mm)
Year Sites J F M A M A J J Y A U S 0 N D Total
Periyar Dam 9 1 45 117 375 397 409 422 371 142 173 Nil 2461 1995
Thekkady 16 Nil 59 77 252 247 265 253 252 191 190 2 1804
Periyar Dam 2.3 9 38 114 5; 381 561 212 51 207 13 Nil 1662 1996
TheMtady 30 32 39 248 21 279 529 170 94 338 83 89 2052
PeriyuDam Nil Nil 46 144 72 125 446 325 217 400 359 129 2263 1997
Thekkady 1 Nil 40 87 84 170 337 223 89 465 406 168 2070
FISHERY MANAGEMENT IN PERlYAR LAKE
Study area and Methods
J F M A M a J J y A u S O N D
B Per j a r Dam Thekkady
Figure 2
Rainfall data for 1995 (In mm)
FISHERY MANAGEMENT IN PERlYAR LAKE 17
Study area and Methods
Figure 3
Rain fall data for 1996 (Jn mm)
FISHERY MANAGEMENT IN PERIYAR LAKE 18
Study area and Methods
Figure 4
Rain fail data for 1997 (In mrn)
FISHERY MANAGEMENT IN PERIYAR LAKE 19
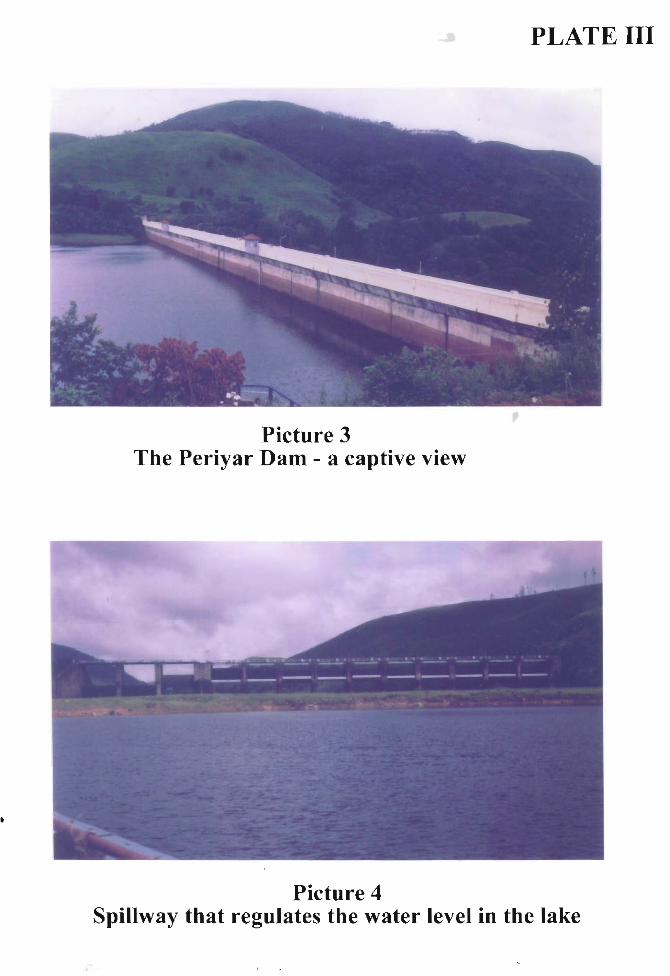
PLATE I11
Picture 3 The Periyar Dam - a captive view
Study area and Methods
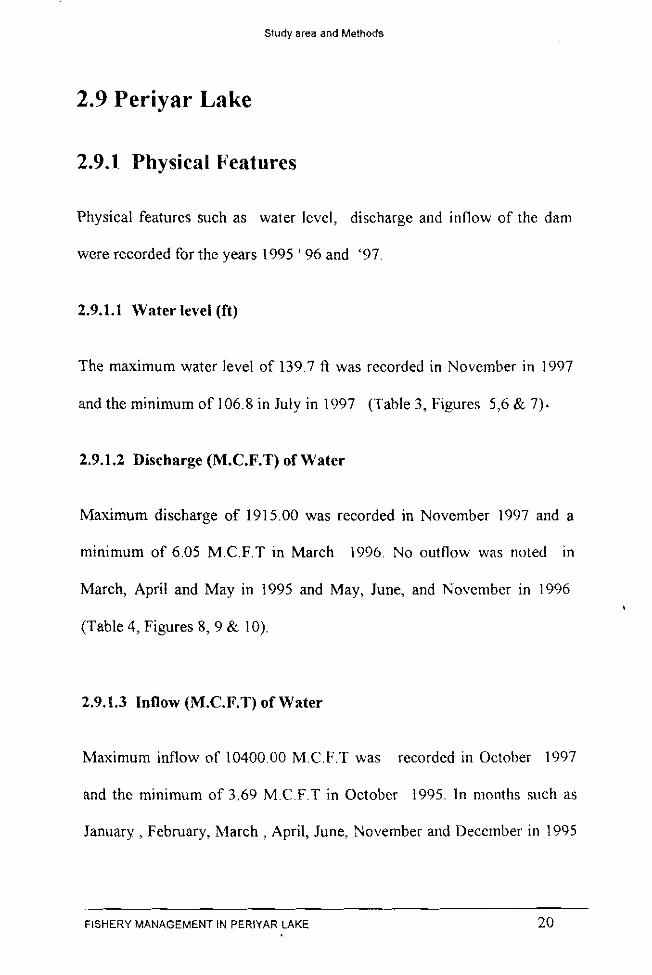
2.9 Periyar Lake
2.9.1 Physical Features
Physical features such as water level, discharge and inflow of the dam
were recorded for the years 1995 ' 96 and '97.
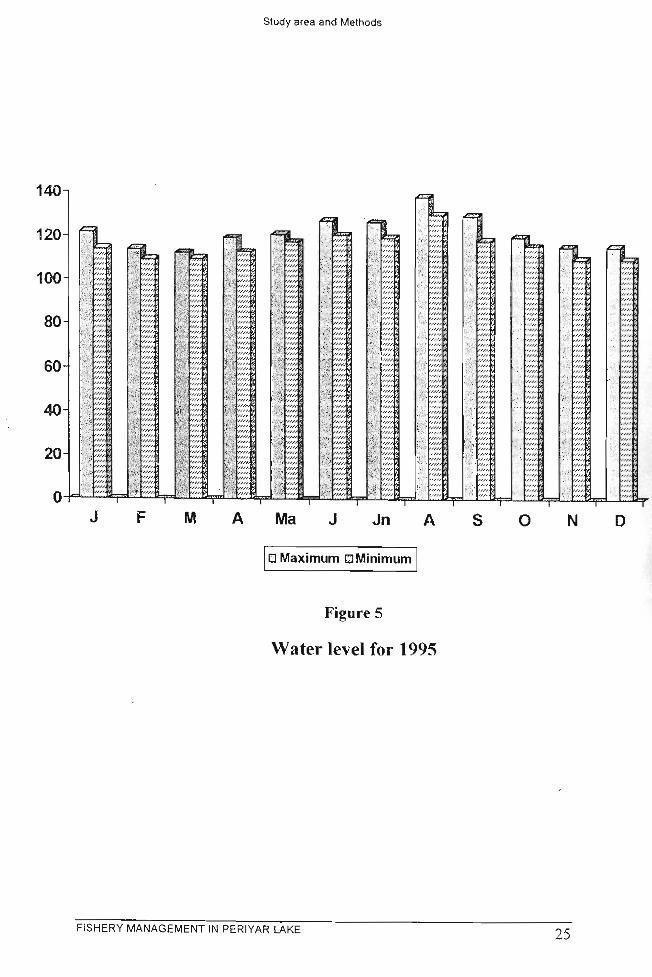
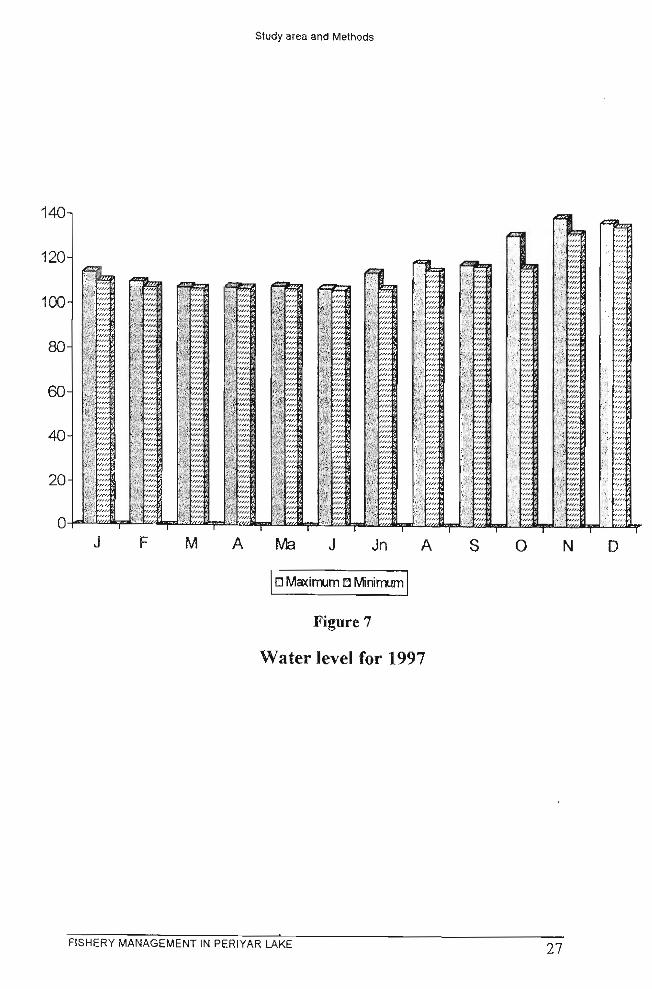
2.9.1.1 Water level (ft)
The maximum water level of 139.7 R was recorded in November in 1997
and the minimum of 106.8 in July in 1997 (Table 3, Fibwres 5,6 & 7).
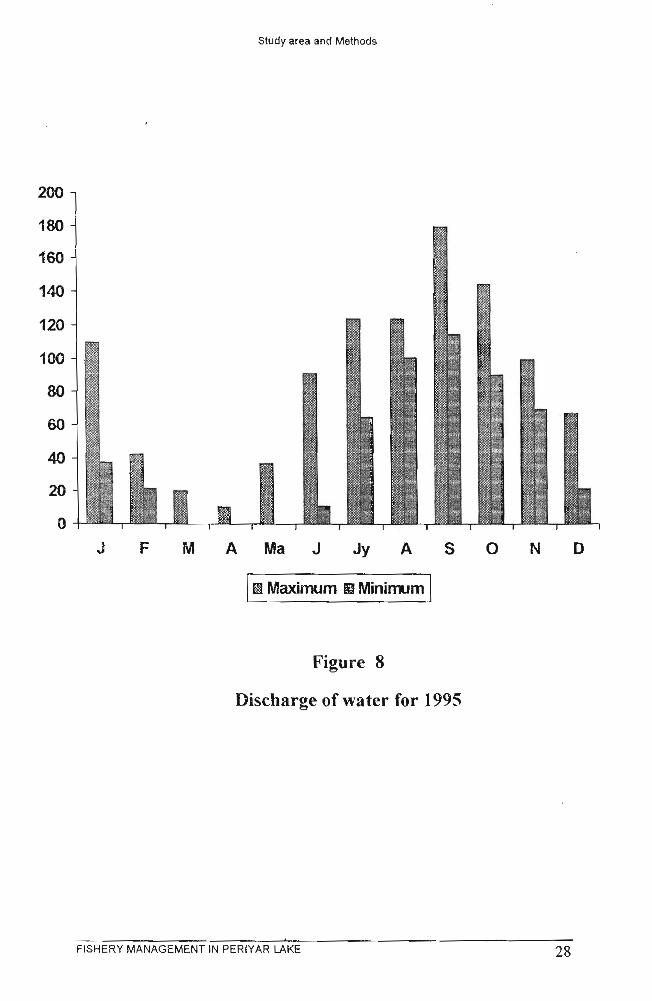
2.9.1.2 Discharge (M.C.F.T) of Water
Maximum discharge of 1915.00 was recorded in November 1997 and a
minimum of 6.05 M.C.F.T in March 1996. No outflow was noted in
March, April and May in 1995 and May, June, and November in 1996
(Table 4, Figures 8 , 9 Rr 10)
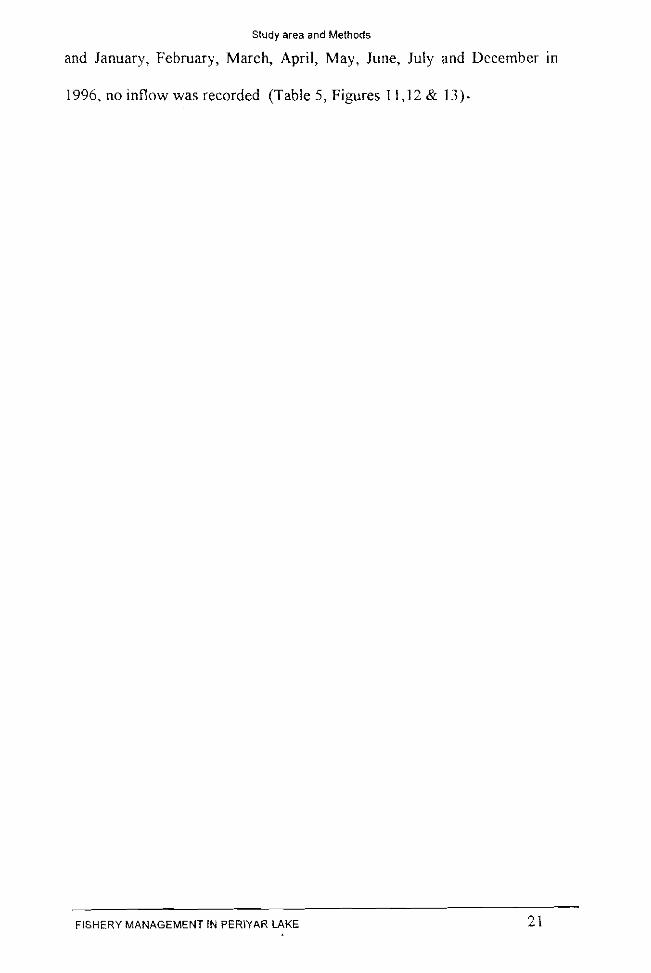
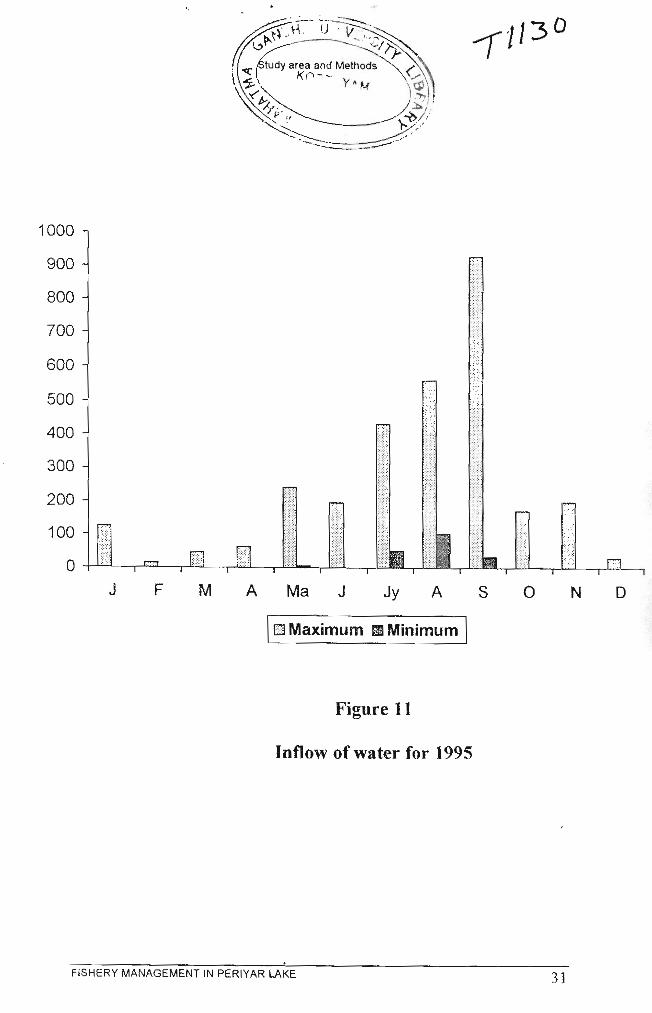
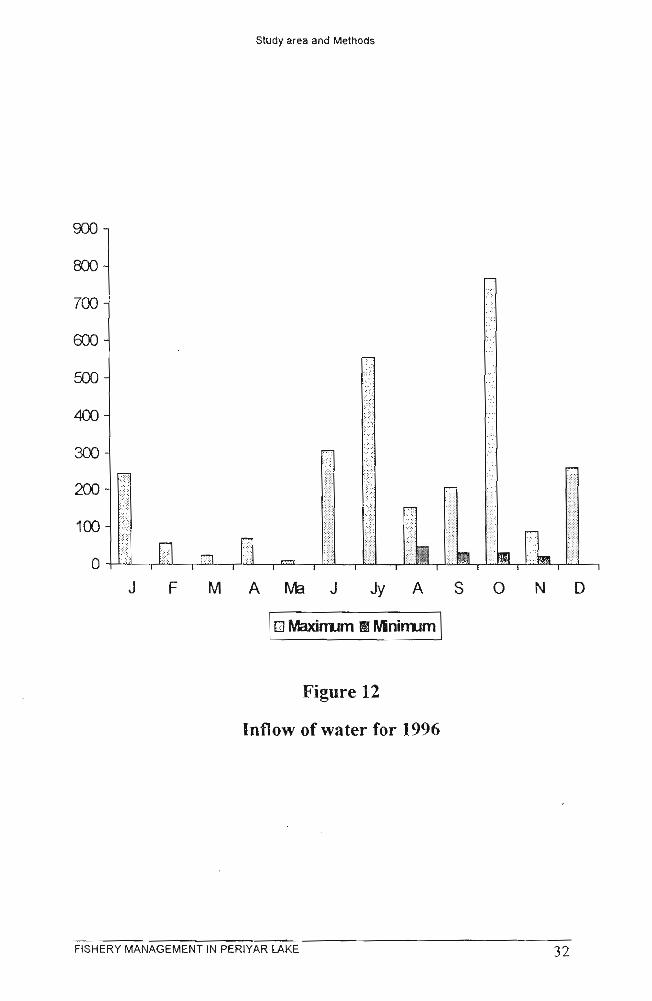
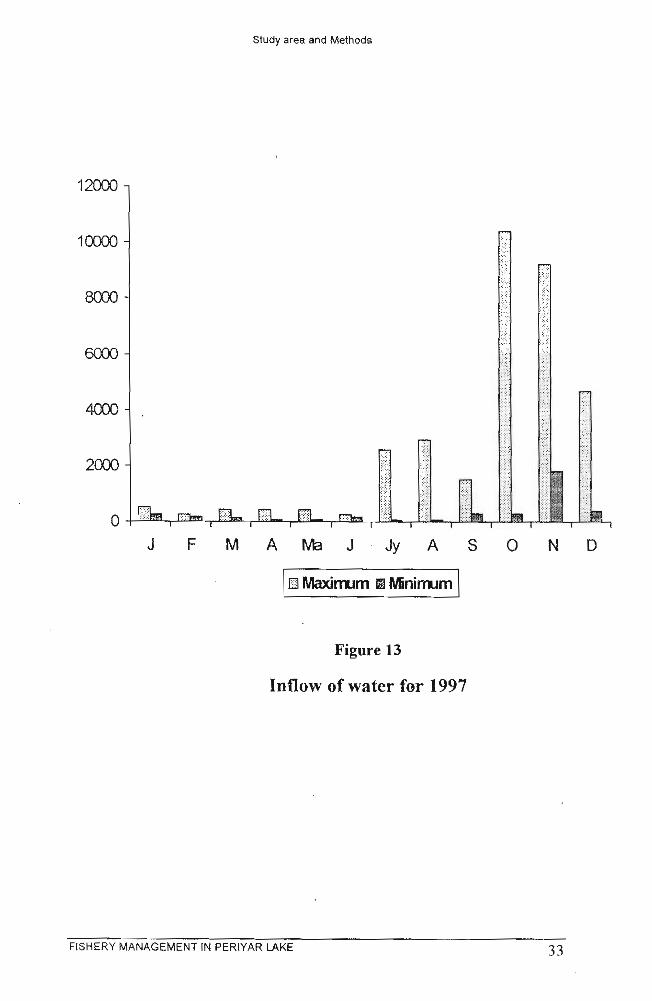
2.9.1.3 Inflow (M.C.F.T) of Water
Maximum inflow of 10400.00 M.C.F.T was recorded in October 1997
and the minimum of 3.69 M.C.F.T in October 1995. In nionths such as
January, February, March, April, June, November and Deccmber in 1995
FISHERY MANAGEMENT IN PERIYAR LAKE 20
Study area and Methods
and January, February, March, April, May, June, July and December in
1996, no inflow was recorded (Table 5, Figures 1 I , 12 Rr 13).
-
FISHERY MANAGEMENT IN PERIYAR LAKE 21
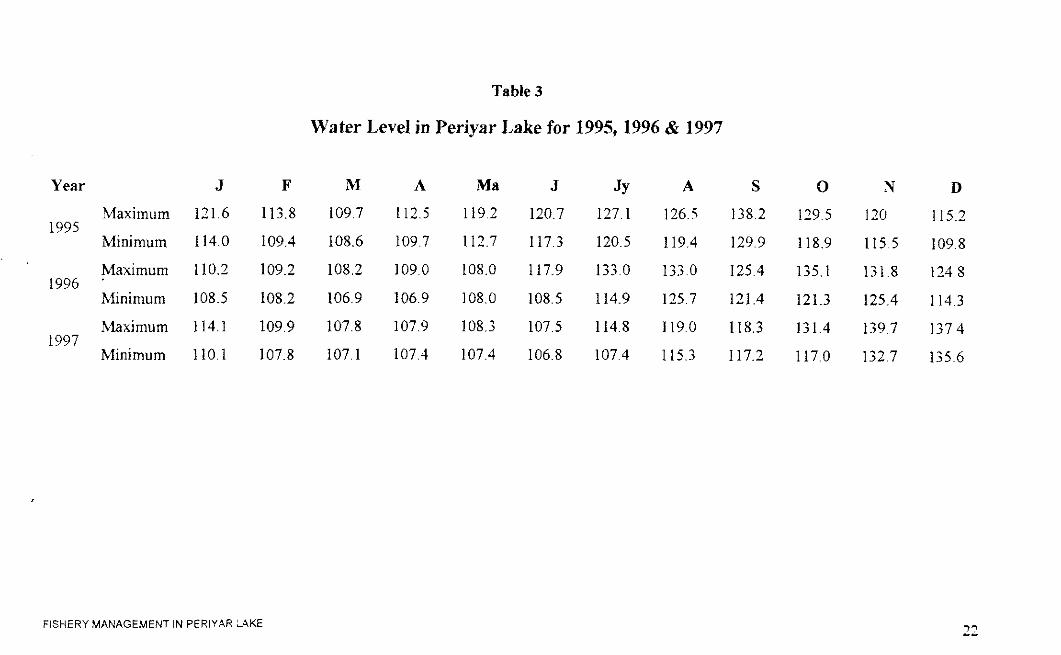
Table 3
Water Level in Periyar Lake for 1995,1996 & 1997
Year J F M A Ma J JY A S 0 N D
Maximum 121.6 113.8 109.7 112.5 119.2 120.7 127.1 126.5 138.2 119.5 120 115.2 1995
Minimum 114.0 109.4 108.6 109.7 112.7 117.3 120.5 119.4 129.9 118.9 115.5 109.8
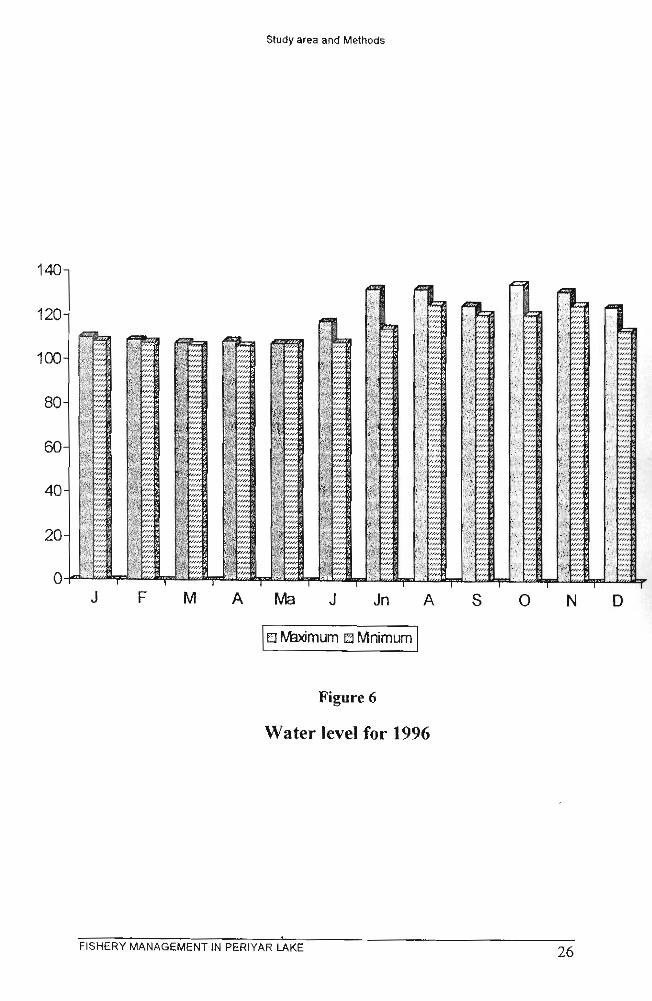
Maximum 110.2 109.2 108.2 109.0 108.0 117.9 133.0 133.0 125.4 135.1 131.8 124.8 1996 '
Minimum 108.5 108.2 106.9 106.9 108.0 108.5 114.9 125.7 121.4 121.3 125.4 114.3
Maximum 114.1 109.9 107.8 107.9 108.3 107.5 114.8 119.0 118.3 131.4 139.7 137.4 1997
hlinimum 110.1 107.8 107.1 107.4 107.4 106.8 107.4 115.3 117.2 117.0 132.7 135.6
FISHERY MANAGEMENT IN PERIYAR L4KE
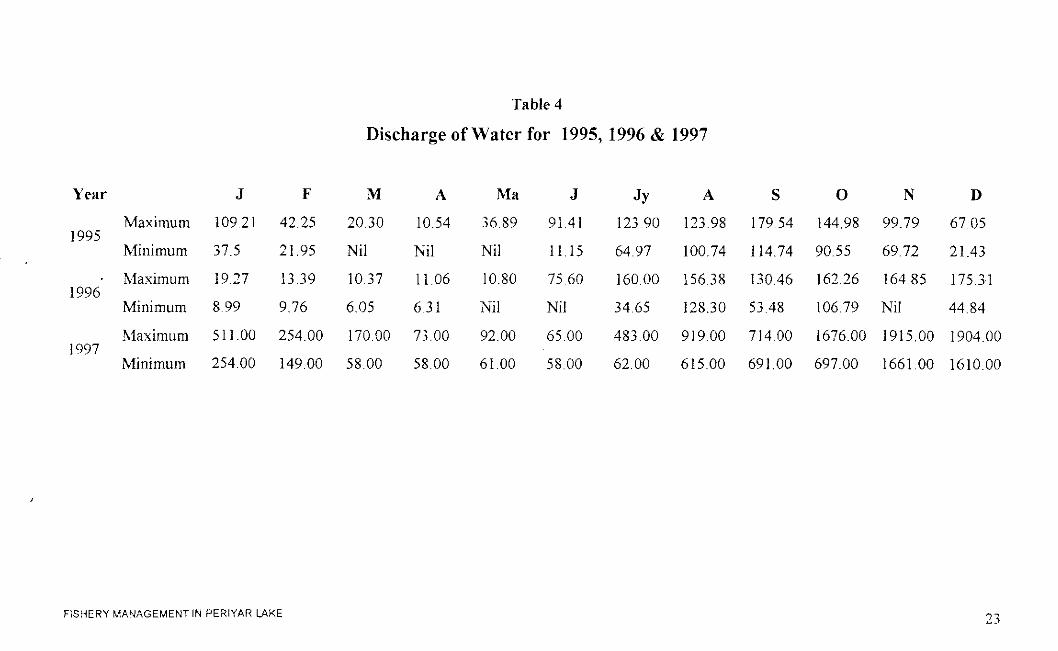
Table 4
Discharge of Water for 1995, 1996 & 1997
Year J F M A Ma J JY A S 0 N D
Maximum 109.21 42.25 20.30 10.54 36.89 91 41 12390 123.98 179.54 144.98 99.79 67.05 1995
Minimum 37.5 21.95 Nil Nil Nil I l l 5 64.97 100.74 114.74 90.55 69.72 21.43
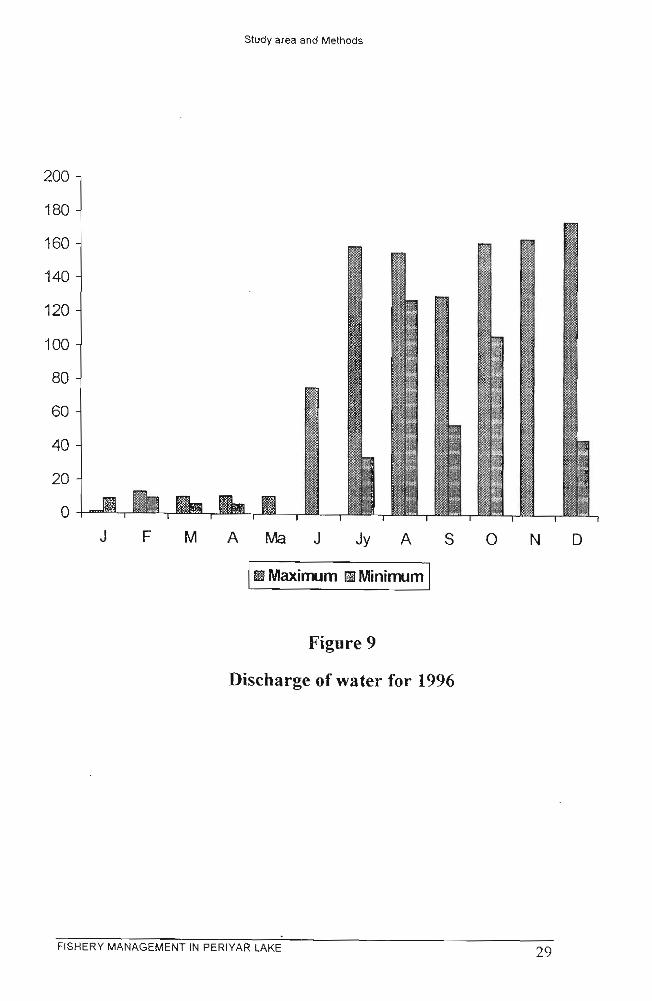
Maximum 19.27 13.39 10.37 11.06 10.80 75.60 160.00 156.38 130.46 162.26 164.85 175.31 1996
Minimum 8.99 9.76 6.05 6 3 1 Nil Nil 34.65 128.30 53.48 106.79 Nil 44.84
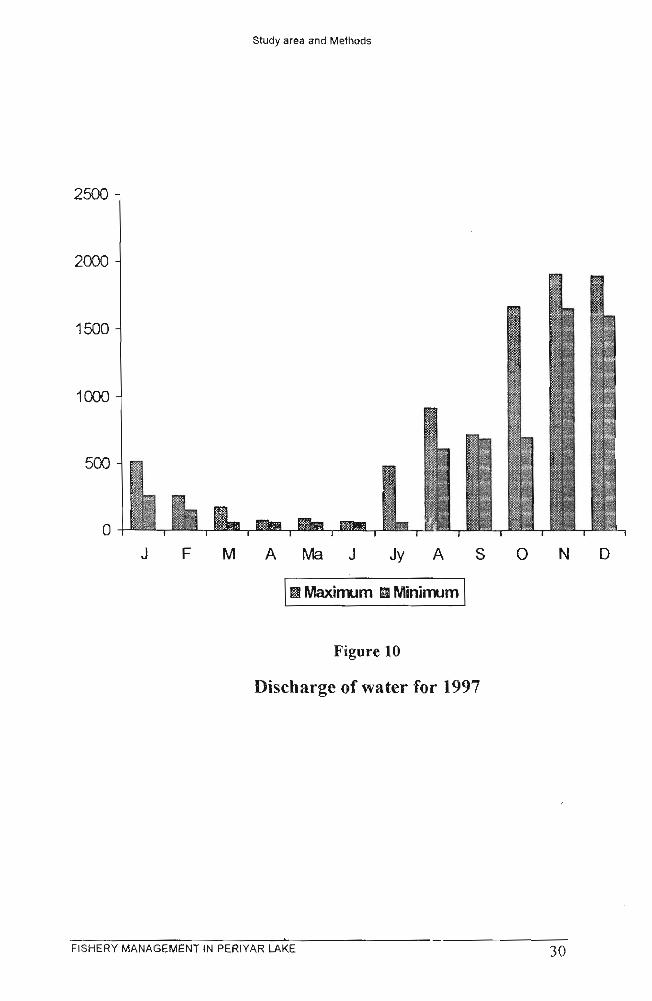
Maximum 511.00 254.00 170.00 73.00 92.00 65.00 483.00 919.00 714.00 1676.00 1915.00 1904.00 1997
Minimum 254.00 149.00 58.00 58.00 61.00 58.00 62.00 615.00 691.00 697.00 1661.00 1610.00
FISHERY MANAGEMENT IN PERIYAR LAKE
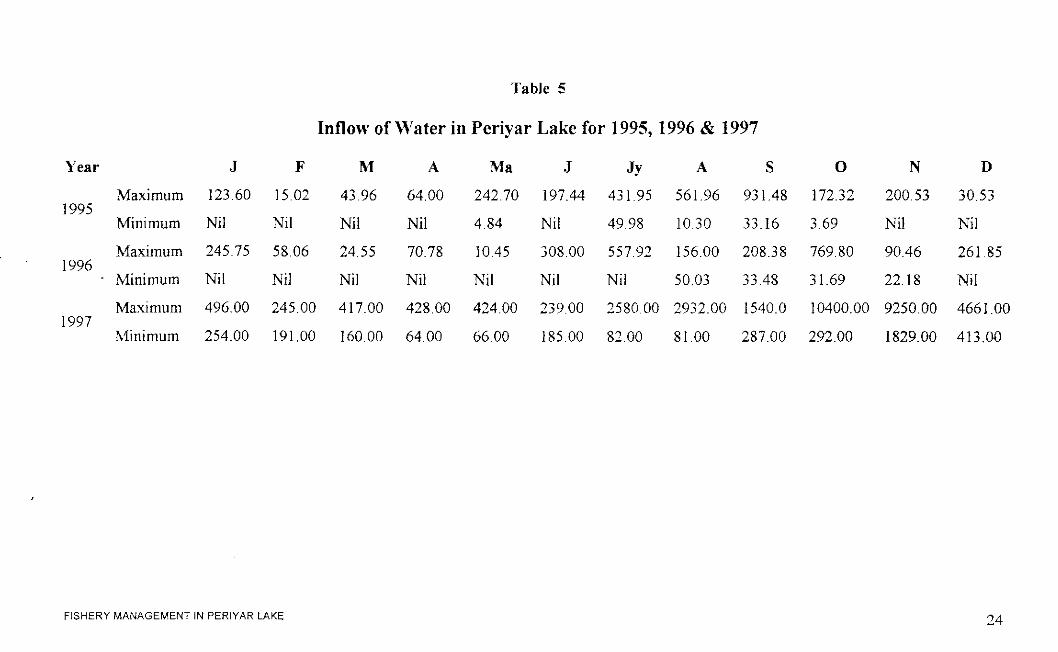
Inflow of Water in Periyar Lake for 1995,1996 & 1997
Year J F M A Ma J JY 4 S 0 N D
Maximum 123.60 15.02 43.96 64.00 242.70 197.44 431.95 561.96 931.48 172.32 200.53 30.53 1995
Minimum Nil Nil Nil Nil 4.84 Nil 49.98 10.30 33.16 3.69 Nil Nil
Maximum 245.75 58.06 24.55 70.78 10.45 308.00 557.92 156.00 208.38 769.80 90.46 261.85 1996
Minimum Nil Nil Nil Nil Nil Nil Nil 50.03 33.48 31.69 22.18 Nil
Maximum 496.00 245.00 417.00 428.00 424.00 239.00 1580.00 1932.00 1540.0 10400.00 9250.00 4661.00 1997
hfinirnum 254.00 191.00 160.00 64.00 66.00 185.00 82.00 81.00 287.00 292.00 1829.00 413.00
FISHERY MANAGEMENT IN PERIYAR LAKE
Study area and Methods
Figure 6
Water level for 1996
FISHERY MANAGEMENT IN PERIYAR LAKE 26
Study area and Methods
I Maximum Minimum
Figure 8
Discharge of water for 1995
FISHERY MANAGEMENT IN PERiYAR LAKE 2 8
Study area and Methods
Maximum Minimum
Figure 9
Discharge of water for 1996
FISHERY MANAGEMENT IN PERIYAR LAKE 29
Study area and Methods
I Maximum EI Miniman (
Figure 10
Discharge of water for 1.997
- FISHERY MANAGEMENT IN PERIYAR LAKE 30
I Maximum IEI Minimum I
Figure 1 I
Inflow of water for 1995
FISHERY MANAGEMENT IN PERIYAR LAKE 3 1
Study area and Methods
1 Maximm 81 Minirmm I
Figure 12
Inflow of water for 1996
FISHERY MANAGEMENT IN PERIYAR LAKE 3 2
Study area and Methods
Figure 13
Inflow of water fsr 1997
FISHERY MANAGEMENT IN PERIYAR LAKE 3 3
Study area and Methods
2.9.1.4 Water Quality
Water analysis of the Iake has been carried out in March, April, May and
June, in 1994 by KeraIa Forest Research Institute, Peechi. The dissolved
0 2 content at different depths of different sites varied from 5.75 to 7.5
rng./lit. Total hardness varied from 6.66 to 7.5 mg /lit. The amount of
free COz varied between 3.0 and 8.0 mg/lit. The range o f pH measured at
different depths of the lake varied between 6.62 and 7.68. Alkalinity and
Chloride were ranging from 38.8 to 59.9 mg/lit and 5.12 to 6.83 mg /lit
respectively.
2.9.2 Biological Features
2.9.2.1 Fauna
According to Luther and Rzoska (1971) no information is available on the
Iimnology of Periyar Lake.
A preliminary survey has shown that a variety of animal forms other than
fishes occur in the lake. Fresh water sponge E~rrrapi~rs cnrteri, Fresh
water medusa Limnocnih indica, Rotifers such as Brm~chiomis falcalus,
Keratella iropica and Trichozria tetracfl~ and Crustaceans (Cladocera)
such as Ceriodaph~ia corn~rta, Bosmina lorzgirostris and Bosminopsis
deitersi and Molluscans such as Nerilina (Ifittinu) perolfetiatla, Palzrdomus
FISHERY MANAGEMENT IN PERtYAR LAKE 3 4
Study area and Methods
(Paludomus) annandalei ( both Gastropods) and /,an~el/iden~ margi17alis
(Pelecypoda) are identified in the lake.
Besides these invertebrates, the pond Terrapin Melanochc/y,v Irtj~t~rcr, a / c
number of fish eating @ such as Cormorants, Darter, Herons, Egrets,
the Osprey and the Grey headed Fishing Eagle and the Common Otter
.also occurs in the lake. The Common Otter Llrlra l~rlt-ci occurring in the
lake and the rivers in fairly good numbers cause considerable damage to
the fishermen by destroying their nets and eating away their catches.
2.9.2.2 People
Four hill tribes viz, Mannans, Paliyans, Uralis and Mala Arayans are found
in the reserve. They have their unique culture and traditions. Four tribal
settlements are situated in the borders of the reserve. The tribal people
were given agriculture land with plantations of pepper, coffee and other
spices but these are very poorly maintained. Of the tribes the Mannans
are traditionally engaged in fishing in the lake, called fishermen in the
foregoing text. Many of them prefer to continue fishing, after giving their
larid on Lease to outside people
2.10 Materials and Methods
Fishes for the present study were colIected from Periyar Lake, either from
the fishermen directly or using cast net, hook and line and vatty (a local
method). FISHERY MANAGEMENT IN PERIYAR LAKE 3 5
Study area and Methods
2.10.1 Methods
i. Details of the dam such as physical features and morphomctry for
the years 1995, 1996 and 1997 were collected from the Dam
Superintendent, P.W.D, Tamil Nadu
ii. Data on the distribution of fishes in the lake were collected by
C, examining the catches of the fishermen at the points i b.
(Nellikampetty and Anchuruli) where they brought their catches for
sale in the year 1996, from January to December All fishes in the
catches were identified, counted and measurements of selected
species were taken at these localities. Obstervation were also made
twice a week at Nellikampetty and once at Anchuruli and the data
pooled together for annual population estimates and catch
proportion of different species.
A study of the characters of 4 selected species of fishes have been carried
out. This was based on the measurements of 50 specimens of 7i1r khrrdree
in the size range of 225 mm, to 890 mm., 50 specimens of Hy~~.~eloharbw.~
krtrali in the size range of 145 mm, to 320 mm., 50 specimens of
Cypri~~us carpio var. communis in the size range of 225 mm to 550 mm
and 50 specimens of Oreochromis mos.~ambira in the size range of 180
mm. to 230 mm.
FISHERY MANAGEMENT IN PERIYAR LAKE 36
Study area and Methods
Biological parameters such as (a) Morphometric measurements and (b)
Meristic characters were studied using the methods described by 1.owe-Mc
Connel (1971) Morphometric measurements such as ( I ) Total length (2)
Standard length (3) Head length (4) Predorsal length (5) Snout length (6)
Eye diameter (7) Post orbital length (8) Inter - orbifal width (9) Gapc (10)
Length of the barbels (1 1) Head depth (12) Body depth (13) Least height
of the body (14) Length of the caudal peduncle ( 1 5) Length of the dorsal
fin (16) Length of free margin of dorsal fin (17) Height of dorsal fin (18)
He~ght of pectroal fin (19) Height of ventral fin (20) Height of anal fin
(21) Length of the base of the anal fin and (22) Girth were takcn All
linear measurements were made to the nearest 0 I Omm , then converted to
a percentage of the standard length Mean and range were tabulated and
compared
Meristic counts were taken for the Number of rays in the dorsal fin,
pectoral fin, ventral fin, anal fin, caudal fin, lateral line scales and lateral
line transverse scales.
Mean biometric index was worked out using the method described by
Tobor (1974) for characters such as Head length, lnter - orbital width, Eye
--.\
diamter, Gape and Girth. Biometric index has been calculated to see
whether it is constant or varying with the increase in total length. For Tor
khudree, Hypselobarhus kurali and (jiprirrus carpio for each character, a
Study area and Methods
mean index for each 50.0 mm, length groups has been calculated and for
Orerrochromi.~ mossnmbica the biometric index has been calciilatcd for
each 10.0 mm length groups. Only 13 groups of Tbr, 3 groups of
Hy,t).wlobarh~rs, 6 groups of Cypri117rs carpio and 5 groups of 0reochromi.s
could be made.
(iii) Monthly collections of 4 species of the lake have been made for gut
content analysis. Two indigenous species viz., 7br klir~dree and
Hyp.seloharbrrs krtrcrli and two exotics viz., Cv1)rinlr.s carpio var.
commtrnis and Oreochromis mossnmhica were selected to study the extent
of overlap of food and the impact of exotics on native species. Regarding
Ibr, specimens were collected from the lake and from the river Periyar for
comparing its food in the two systems and thereby studying the impact of
dam on the species. For this, 50 specimens from both the sources were
collected in different months at random and their gut contents were
analysed. For the other three species also, gut contents of 50 specimens
were collected every month and analysed.
Soon after collection, the specimens were dissected, the digestive tracts
were carehlly taken out and preserved in 5% formalin. Preserved guts
were then uncoiled, cleaned off the attached tissues, cut opened and the
contents were scrapped out into a petridish. The scrapped out contents of
guts were identified under a binocular microscope as far as possible upto
FISHERY MANAGEMENT IN PERIYAR LAKE 3 8
Study area and Methods
generic level except in the cases where the state of digestion rendered it
difficult to do so.
(iv) The tribal fishermen settled in the reserve area were interviewed for
the socioeconomic study. Data were collected by meeting each fishermen
personally.
FISHERY MANAGEMENT IN PERIYAR LAKE 39