Embed Size (px)
Citation preview

Chapter-V
DISCUSSION
5. 1. Introduction
Lakes are socio-economically and bio-aesthetically important aquatic systems.
Although there are extensive back waters in Kerala, natural fresh water lakes are only a
few. The freshwater systems in Kerala are mainly reservoirs of dams constructed across
west flowing rivers situated in the Western Ghats. Among them, the Periyar Lake is a
unique one. This three-year investigation enabled us to generate ample knowledge about
the hydrobiology and physico-chemical characteristics of the Lake water.
Monitoring is a purposeful intermittent surveillance carried out in order to
ascertain the extent of compliance with predetermined standard or the degree of
deviations from an expected norm. It is purposeful to control pollution. But survey is an
exercise in which a set of quantitative or qualitative observations are made, usually by
means of a standard procedure and within a restricted period of time, but without any
preconception of what the findings ought to be (Newson, 1994). The present investigation
may be considered a three-year continuous survey or monitoring as well. A perusal of
literature on Lakes in Kerala reveals that the freshwater reservoirs in the Western Ghats
in general are oligotrophic. The present investigation was to test this hypothesis.
Therefore, this study fits more to the concept of monitoring.
Spatial and temporal variation is evident in all the physical and chemical
parameters of fresh water systems (Chandrasekhar et al., 2003). Since the morphometry
of Periyar Lake is complex with a lot of dendrite structures along its whole length, and
the base of the flooded plane in the reservoir in general has an undulating topography,
accounting of spatial variation due to natural environmental difference was not easy in
this system. However, six field stations were identified in the present investigation to
assess all the spatial variations existing in the Lake.
128
Natural lakes in temperate latitudes usually have a relatively stable water regime
but this is not the case in some natural lakes in the tropics, particularly those that occur in
areas where the climate is divided into distinct wet and dry seasons (Osborne et al.,
1987). Periyar Lake is a high altitude tropical Lake with constant and much frequent
short duration fluctuations in rain fall and out flow. Therefore, the three year monitoring
was minimal to assess the general ecological tendencies of the system.
In monitoring investigations of aquatic systems in Kerala, monthly data are
usually pooled and divided into three seasons for getting reliable trends for explaining the
features (Koshy, 2002). In previous studies of freshwaters in Kerala (Koshy and Nayar,
1999; Jayaraman et al., 2003; Radhika et al., 2004), the three seasons usually recognized
are post-monsoon (Nov–Dec–Jan) pre-monsoon (Feb–March–April–May) and monsoon
(June–July–August–Sept–Oct). However, there exist two monsoons in Kerala, the
southwest and northeast, which quite often differ in the nature and amount of
precipitation. The gap between these two monsoon seasons is quite narrow and
sometimes they overlap. There is a recognizable gap in between the northeast monsoon of
one year and the southwest monsoon of the next year, which is the pre-monsoon. There
exist fluctuations in duration of the two monsoons and the pre-monsoon between years.
Therefore, to enable a better comparison of the exact seasonal tendency of the Lake
system between years, monthly observations were grouped into three seasons, the pre-
monsoon (Jan–Feb–March–April), southwest monsoon (May–June–July–August) and
northeast monsoon (Sept-Oct-Nov) in the present study.
The results of this study are discussed under various subheadings such as: (1)
Climate of the area and hydrology of the Lake, (2) Physical and chemical characteristics
of the Lake water, (3) The phytoplankton community.
5.2. Climate of the area and hydrology of the Lake
5. 2. 1. Air Temperature
Air temperature and precipitation were the major climatic features assessed in the
present study at all stations. Since changes in air temperature show a close proportionality
to that of the water (Kaul et al., 1980), simultaneous measurements of both are
129
significant. Spatial fluctuations in air temperature experienced during a particular season
might be due to the timing of collection and the influence of weather, which quite
fluctuate diurnally and seasonally in the Periyar Lake. Since the air temperature was
recorded during the actual visit to a station every month, the time of record was not
uniform at all the stations and this is the reason for a significant difference in air
temperature across different stations in the Lake area. Jayaraman et al. (2003) recorded
similar fluctuations in air temperature in different stations in Karamana River in
Thiruvananthapuram district, Kerala.
The maximum seasonal air temperature recorded in the PTR was 30 0C during
pre-monsoon at station 3 and 4A in the noon time and the minimum recorded temperature
was 24 0C in the morning (around 8 AM) during the northeast monsoon at station -1, 2,3
and 4B. Tables 1 to 3 shows that in the pre-monsoon and the northeast monsoon,
variations in air temperature across the stations and over the years were insignificant
whereas the same during the southwest monsoon were significant. Southwest monsoon is
therefore the season of maximum air temperature fluctuations in the system. A
comparison of three-year average values of air temperature of different seasons (Table-4)
showed significant variations over the different seasons and across the different stations
during all the seasons. This is a clear indication that the pattern of division of monthly
observations into the three-seasons in the present study was similar to differences in air
temperature regimes of the Lake area.
5. 2.2. Precipitation
Seasonal and monthly precipitation showed certain fluctuations during the three-
year period (Table-5). However, southwest monsoon remained the season of highest
rainfall except in 2003. In 2003 there was only a slight increase in the northeast monsoon
rainfall than that of the southwest monsoon. The fluctuations in total rainfall of southwest
monsoon during the three-year period of study were very high (695mm in 2002, 609mm
in 2003, and 1190mm in 2004). The month of highest rainfall during southwest monsoon
varied from June to August during the study. The highest monthly fall recorded during
the period of study varied from 203-511mm. The month of lowest rainfall during
southwest monsoon was recorded during May in 2002 (134 mm) and 2003 (41 mm), but
130

it was July during 2004 (145 mm). Thus it became clear that fluctuations in monthly
maximum precipitation also occur in this season.
The fluctuations in northeast monsoons varied between 422mm (in 2002) to
648mm (2003). During the northeast monsoon, throughout the entire period of study,
December remained the month of the lowest rainfall (1-41mm) and October remained the
month of the highest fall (249 mm to 488 mm). In general, fluctuations in total
precipitation over years were less in northeast monsoon than the southwest monsoon.
During the three-year period of study monthly fluctuations in precipitation over years was
minimum during the northeast monsoon.
The pre-monsoon rainfall was 158-193mm throughout the period of study. The
fluctuation in pre-monsoon rain fall between years during the three-year period of study
was very narrow when compared to other seasons. In the pre-monsoon period January
remained the month of the lowest rain fall (0-2mm) during the entire period of study. The
month of highest rain fall was April in 2003 and 2004 but it was March in 2002.
The comparison of rainfall between different seasons showed that just like air
temperature, precipitation also was a major atmospheric factor which contributes to
seasonal variations in climate in the system. In the present investigations difference in
rainfall pattern was evident between the seasons. Southwest monsoon season remained
the season of maximum monthly fluctuations in the system between years. Since the
southwest, northeast and the pre-monsoon seasons showed quite distinct precipitation
rates and statistically significant variations in air temperature, the present pooling of
monthly data to develop three seasonal trends - the two different monsoon trends and the
pre-monsoon trend in a year, was found quite reasonable and fruitful. An unusual
increase in the rate of precipitation during the pre-monsoon and the southwest monsoon
was the reason for the very high annual precipitation account of the year 2004.
Each of the inland water body is characterised by unique hydrological features. In
general, thorough and continuous vertical mixing is achieved in rivers due to the
prevailing currents and turbulence. Currents within a lake are multi-directional with
mixing regulated by the climatic conditions and lake depth. Reservoirs are intermediate
between rivers and lakes. Large variations in the water residence time occur in different
131

types of inland water bodies. The hydrologic characteristics of each type of water body
are highly dependent on its size, climatic conditions, and the drainage pattern associated
with it. However, a comparison of fluctuations in water quantity in the Periyar Lake
system revealed that the management of water in this Lake is ill-ecological without any
concern for its hydrobiology, or giving no importance to its role played in the PTR
ecosystem.
The major management concern at present in this Lake was found exploitation of
as much water as possible as and when the inflow increases. Consequently the water level
continuously fluctuates between diurnally and seasonally, and the fluctuations are quite
unpredictable. According to Osborne et al. (1987) the implications of fluctuations of
water level on chemical composition and productivity of water body as a whole is not
obvious. Becht and Harper (2002) found that an ‘equilibrium’ lake level is essential to the
biodiversity conservation and to maintain the general ecology of a lake.
During the three-year period of studies, no efforts were found from the authorities
of the Mullaperiyar Dam to maintain an optimum water level in the Lake. An optimum
water level is essential to keep an aquatic system stable and viable. Hence a specific
study to understand the safe and sustainable use of Periyar water in terms of a sustainable
lake is essential. The water level for the sustainable existence of the Lake as a natural
biological system supporting the wildlife sanctuary and its economical use as water body
supporting international tourism, and as a reservoir for irrigation and power generation
purpose in TN as well as the water resource to sustain the viability of Periyar River down
the Dam is very essential.
5. 3. Physico-chemical parameters
Quality of an aquatic ecosystem is dependent on the physical and chemical
qualities of water (Bhatt et al., 1999). Results of variations in all the physical and
chemical characteristics of water in a lake at a particular place during different seasons
and also the variations at different places during a particular season reveal some of the
significant ecological tendencies of the lake system.
132

5. 3. 1. Water Temperature
Water temperature is of enormous significance as it regulates various abiotic
characteristics and biotic activities of an aquatic ecosystem which is recognized by many
authors (Mc Combie, 1953; Hutchinson, 1957; Jana, 1973; Chari, 1980; Kataria et al.,
1995; Iqbal and Katariya, 1995; Sharma and Sarang, 2004; Radhika et al., 2004). It is
clear from the Tables-7,8 and 9 that there were no significant variations in surface-water
temperature across stations and over years during the pre-monsoon and the northeast
monsoon in the Lake, whereas the differences in surface water temperature across the
stations and over the years were significant during the southwest monsoon. A comparison
of the average of surface-water temperature of the three-year period (Table 10) showed
that the variations in temperature across the different stations were insignificant but the
differences in temperature over the three different seasons were very significant.
The surface-water temperature at all the stations during a particular season
throughout the period of study, showed a maximum fluctuation of 1-20C only. At all the
stations, in between different seasons the temperature variation was 20C to 50C. The
lowest seasonal surface-water temperature noticed in the Lake during the entire period of
study was 24 0C, in the northeast monsoon period of 2004 and the maximum noticed was
29 0C during the pre-monsoon of 2005. Kataria et al. (1995) reported a temperature
variation of 21.40C to 34.2 0C in Tawa reservoir in the North India. Jayaraman et al.
(2003) observed a difference in surface water temperature of 250C (post-monsoon or
northeast monsoon) to 30.60C (pre-monsoon) in Karamana river near
Thiruvananthapuram, in Kerala. Thus it became clear that unlike north Indian waters,
water bodies in Kerala has narrow annual fluctuations in water temperature. This is in
tune with climatic conditions as well. The observations of surface water temperature in
Periyar Lake showed that the seasons of lowest and highest temperature in the Lake area
are similar to that of aquatic systems elsewhere in Kerala, such as that in Karamana
River, but the range of fluctuation in Periyar Lake is narrower than that of other water
bodies in the State. Moreover, the maximum surface-water temperature observed in
Periyar Lake was lower than that of the other fresh water systems in the State. This is on
account of the high altitude location of the lake as well as the presence of thick evergreen
133

forests around. The present observation of surface water temperature in Periyar Lake
agrees with the observations of Kaul et al. (1980) that surface water temperature usually
remains close to the air temperature.
The spatial and vertical difference in temperature of water in a Lake in general is
influenced by the temperature of inflowing waters, extend of vertical mixing as well as
process like exchange of heat with the atmosphere and other localized phenomena also
influence the distribution of temperature. Comparison of bottom-water temperature
across stations showed that there were significant variations in it (Tables- 11, 12 and 13)
during the pre-monsoon; but during the southwest and the northeast monsoon periods the
difference in bottom water temperature across stations were insignificant. The differences
in bottom water temperature over the years were insignificant during the pre monsoon but
significant during the southwest and northeast monsoon periods. The three-year average
temperature of bottom-water of different seasons (Table -14) showed that there were
significant differences in temperature over the three different seasons and that across all
the stations during each season in the Lake.
The differences in bottom-water temperature at different stations were high at the
points of major inflow (1-40C at stations 4A and 4B), whereas it was very less at the
points of outflow (1-20C at stations 1 and 5). At the mid stations, station-2 and 3, the
differences in bottom water temperature was 1-30C. At stations 2 and 3, the depth of
sample collection was constantly 6-10 meters at all the seasons; whereas at the final point
of outflow (station-5) the depth varied from 2-6 meters according to the seasons. At
station-3, where the depth was constantly 10 meters, the bottom temperature was
constantly 24 0C in the pre-monsoon, 22-250C in the southwest monsoon and 22-240C in
the northeast monsoon, during the entire period of study. Since the fluctuation in bottom
water temperature was high during the southwest monsoon, it may be concluded that it is
at this season there is maximum vertical mixing in this Lake. As in the case of surface-
water, the bottom-water also exhibited a slight seasonal trend in temperature with a slight
increase in the pre-monsoon, a decrease during the northeast monsoon and moderate
values during the southwest monsoon. Radhika et al. (2004) made a similar observation
in the Vellayani Lake, in Kerala.
134
5. 3. 2. Transparency (Secchi depth)
Solar radiation is the major source of light energy in an aquatic system, governing
the primary productivity. It measures the light penetrating through the water body.
Transparency is a characteristic of water that varies with the combined effect of colour
and turbidity. Turbidity is caused due to suspended solid materials such as clay, silt,
colloidal organic matter, planktons and is the reason for less transparency. Increase in
turbulence of waters usually increases all the suspended materials, especially in shallow
waters. In a Lake the secchi depth measurement can be affected by factors such as time
of the day, clarity of the sky at the time of measurement (cloudy or not), and suspended
solids in water including phytoplankton. In shallow waters secchi depth is affected by
disturbance such as boat movement for measurement. The secchi depth measurement at
the Periyar Lake was subjected to all these factors.
Comparison of variations in secchi depth showed that the fluctuations in it over
the years during all the seasons were not significant (Table 15, 16 & 17) whereas those
across different stations in all the seasons were significant. Average secchi depth of the
three-year period (Table-18) showed that the variations in secchi depth over seasons and
that across different stations during all the seasons were significant.
In general the secchi depth was found least during the pre-monsoon, highest
during the northeast monsoon and moderate during the southwest monsoon at all the
stations. Among the different stations, station-3 usually had the highest transparency and
station-5 had the lowest transparency throughout the three-year period of observations.
Other stations showed moderate transparency in between these extremes at all seasons
during the entire period of study. Thus, unlike the observations in different tropical
freshwaters (Suvarna and Somashekar, 1997; Amarasinghe and Viverberg, 2002), the
transparency of waters in Periyar Lake increased only during the monsoon seasons. This
is owing to undisturbed watershed which keeps the soil system intact during monsoon.
Higher turbidity during pre-monsoon is due to higher impact of boat activity combined
with lesser water level. Radhika et al. (2004) observed an increase in turbidity during pre-
monsoon in Vellayani Lake, Kerala, which they attributed to high productivity coupled
with excessive plankton growth.
135

Station wise analysis of secchi depth explained the spatial variation of parameters
in the Lake. The highest secchi depth noticed during the study period was 2.2m at
station–3 (Dam site) during the northeast monsoon of 2004 and the lowest measure was
0.85m at station–5 during the pre-monsoon, 2003. This observation agrees with that of
Bhade et al. (2001) that turbidity is 3 to 4 times higher in the riverine stretch compared to
the Dam site. Transparency observed in Jaisamand Lake, Udaipur (Sharma and Sarang,
2004) was 22 to 167 cm; in a forest Lake in Kashmir (Kaul et al., 1980) it was 80 cm to
200 cm and the same observed in Vellayani lake in Kerala (Radhika et al., 2004) was
only 28cm to 58.5 cm. In Periyar Lake, the higher transparency at station-3 corresponds
to higher depth and lesser turbulence. Amarasinghe and Viverberg (2002) reported a
similar influence of depth on increased transparency in waters of a tropical reservoir in
Sri Lanka. The lowest transparency observed at station-5 of the Lake was due to the
combined effect of both sewage inflow as well as the impact of turbulence due to boat
activity at station-1, which is close to it. The second lowest transparency at station-1 is
definitely due to lower depth and highest boat turbulence at this site. Hilton and Philips
(1982) reported a similar increase in turbidity due to boat activity in a river. The same
author observed that increased turbidity reduce light penetrations, which reduce growth
of planktons. But according to Bhatt et al. (1999) transparency of water is negatively
proportional to primary productivity. Kataria et al. (1995) considered turbidity as an
expression of light scattering and absorbing properties of water.
5. 3. 3. Electric Conductivity (EC)
EC is a basic index to select the suitability of water for agricultural purposes
(Kataria et al., 1995). EC in water is due to ionization of dissolved inorganic solids and is
a measure of total dissolved solids (Bhatt et al., 1999) and salinity. Salts that dissolve in
water break in to positive charge and negative charge ions. Dissolved solids affect the
quality of water used for irrigation or drinking. They also have a critical influence on
aquatic biota, and every kind of organism has a typical salinity range that it can tolerate.
Moreover, the ionic composition of the water can be critical. Koshy and Nayar (2000)
observed that the EC value of 250 µS per centimeter is quite normal for aquatic life of
freshwaters. EC of tap water ranges between 50 and 800 µS depending on the source
136

(Web Report, 2004). In Periyar Lake, the highest average seasonal EC observed during
this study was 80 µS at station-5 during the pre-monsoon (2004) and lowest EC reported
was just 15.2µS at station-4B during the northeast monsoon 2004. Therefore, the EC
values in Periyar Lake may be considered quite normal.
However the spatial and seasonal difference in EC value in the Lake explained
certain definite tendencies. The EC value at station-5 was much higher (almost double or
more) than that of the other stations throughout the study period. Station-2 showed the
second highest EC during all seasons whereas station-4B in general showed the lowest
EC values during most of the seasons of the entire period of study. There were
significant fluctuations in EC across the different stations in the Lake during monsoon
season. Moreover, at all the stations there were fluctuations in EC over different seasons
as well as over different years during a particular season. These observations pointed out
that EC is a highly variable factor in freshwaters. Tiwari (1999) reported an EC of 230 to
300 µS at 300C in Upper Lake water of Bhopal. Kataria et al. (1995) found an EC of 150
to 256 µS in Tawa Reservoir, India. Garg (2002) observed an average EC of 769.62 µS in
River Mandakini, Chitrakoot and the author also found a seasonal trend in EC in the same
river: minimum in monsoon due to addition of rain water but maximum in post monsoon
(Northeast monsoon). Radhika et al. (2004) reported that in Vellayani Lake, Kerala, the
EC of surface waters varied from 91.2 to 320 µS during the pre-monsoon, 76.3 to 230µS
during the southwest monsoon and 96 to 226.6 µS during the northeast monsoon (post-
monsoon). Suvarna and Somashekar (1997) reported that EC usually decrease after
rainfall following increase in inflow, culminating in dilution. Taheruzzaman and Kushari
(1995) observed an increase in EC in water bodies of Burdwan, West Bengal, during
monsoon which according to them is due to voluminous runoff carrying diverse types of
electrolytes from the nearer as well as distant areas. But according to Sarojini (1996)
seasonal EC fluctuations are closely related to evaporation and concentration of soluble
salts.
Compared to the previous reports on EC of Indian waters, Periyar waters showed
a very low EC. Low ionic content in natural waters is generally attributed to slow
chemical weathering in the catchments (Blakar et al., 1990) Moreover, apart from
slightly random spatial and yearly fluctuations, water in this Lake did not express definite
137

seasonal trends in EC value. Occasional fluctuations in EC at stations 1 to 4B in this Lake
at a particular season between the years were quite normal as in all natural systems and
were due to differences in the rate of local inflow.
Highest average seasonal EC of bottom water during this study was 86.7 µS from
station-5 during the southwest monsoon of 2004 and lowest EC reported was just 15.6 µS
at station-4B during the northeast monsoon 2004. Except at station-5, the bottom water at
all the other five stations showed more or less the same EC values. Mortimer (1941)
reported that mineralization of organic matter under the influence of reducing conditions
prevailing in the bottom water is accompanied by a release of minerals. Kaul et al. (1980)
finds this as the reason for higher EC in bottom-water than surface-water and also
observed that, mixing of water results in the prevalence of the same conductance values
throughout the vertical profile of water. Since no significant differences in conductivity
of both the surface and bottom waters were observed in Periyar Lake, it may be
concluded that there exist quite good vertical mixing of waters to the depth examined in
the Lake.
There were no significant variations in EC in the bottom-water over years during
all the three seasons (Tables 31 to 33); but across the stations the fluctuations were
insignificant during the northeast monsoon only. The fluctuations in EC of bottom-water
across the stations during the pre-monsoon and the southwest monsoon were significant.
As in the case of surface waters, a comparison of the three-year average of EC of bottom-
water (Table 34) during different seasons showed that variations across the different
stations were very significant in all the seasons whereas that over seasons at a particular
station were insignificant. This indicated that though the impact of inflow from different
areas of the watersheds is different, such differences were not due to factors of seasonal
significance.
5. 3. 4. pH
pH is one of the very significant chemical characteristic of all waters, which
explains certain significant biotic and abiotic ecological characteristics of aquatic systems
in general. pH balance in an ecosystem is maintained when it is within the range of 5.5 to
8.5 (Chandrasekhar et al., 2003). pH of a water body is a diurnally variable property
138

according to temperature variation in the system (Ojha and Mandloi, 2004). Kaul and
Handoo (1980) found that increased surface pH in water bodies is due to increased
metabolic activities of autotrophs, because in general they utilize the CO2 and liberate O2
thus reducing H+ ion concentration . The same authors are also of the opinion that in the
bottom of water bodies liberation of acids from decomposing organic matter under low
O2 concentration result in low pH.
The surface water of Periyar Lake in general always showed a neutral or slightly
alkaline pH. Comparison of pH of surface water showed that the fluctuations in it across
the stations were insignificant (Tables 19 to 21) during all the seasons; but fluctuations in
pH over years were significant during the pre-monsoon and southwest monsoon. The
fluctuations in pH over the years during the northeast monsoon were insignificant. Three-
year average pH (Table 22) of surface water during different seasons showed that the
variations in it across the different stations were insignificant whereas that over the
different seasons were significant. Thus, it seems that pH is a more seasonal dependent
characteristic in freshwaters surrounded by undisturbed watersheds as is found in Periyar
Lake.
During the entire period of study the pH of surface waters changed only once
below neutral value. It was in the pre-monsoon of 2005 at stations 2, 3 and 4A alone. But
pH of surface waters reached 8 or moved above 8 at two seasons during the period of
study–in the pre-monsoon of 2003 at stations–2, 3 and 4A and in the northeast monsoon
of 2004 at station-1 alone. The pH of bottom water was in the range of 6.9 to 7.9 during
the entire period of study at all the stations.
Comparison of pH of bottom-water (Tables 23 to 26) showed that the fluctuations
were insignificant across the stations during all the seasons. The fluctuations over the
years were significant during the pre-monsoon and the southwest monsoon alone, but
insignificant during the northeast monsoon. As in the case of surface-water, the three-
year average of pH of bottom-water during different seasons showed that the variations in
pH across the different stations were insignificant whereas that over the different seasons
were significant. Thus it became clear that the fluctuations in pH of both surface and
139

bottom waters were quite similar in Periyar Lake. This is an indication that a more or less
stable chemical quality exists throughout this water body.
Kataria et al. (1995) pointed out that a suitable range of pH is necessary for fish
survival in water bodies and acid waters reduce the appetite of fish and their growth. The
same author also emphasized that the suitable pH is above neutrality, and the
Environment Protection Agency of United State’s criteria for pH of fresh water aquatic
life is 6.5 to 6.9. According to ICMR (1975) and WHO (1985) safe pH limit is 7 to 8.5.
But ISI (1991) range is 6.5 to 8.5. A pH range of 6 to 8.5 is normal according to the
United States Public Health Association (De, 1999). When compared to all these
Standards, pH observed in Periyar Lake water in general was within the safe limits. The
low value of pH 6.5, noticed in surface water at stations-2 during the pre-monsoon 2003
may be considered as a rare incident. However, such rare occurrence during a three-year
period of observation is enough to suggest a careful continuous monitoring for a better
management of the system, especially when the significance of this Lake as the nucleus
of the precious PTR. Bhatt et al. (1999) observed a pH of 7.7 to 8 in Taudaha Lake,
Katmandu. Koshy and Nayar (1999) observed a pH of 6.1 to 6.9 during post monsoon
(Northeast monsoon), 6.3 to 7.1 during Pre-monsoon and 6.2 to 6.9 during the southwest
monsoon in River Pampa, Kerala. Radhika et al. (2004) also observed a difference in pH
between southwest monsoon and post-monsoon (northeast monsoon) of waters in
Vellayani Lake, Kerala. Garg (2002) found that pH in general is more during the
southwest monsoon than the summer. Jayaraman et al. (2003) observed maximum pH in
the southwest monsoon, minimum during the northeast monsoon and medium during
summer, in Karamana River, Kerala. Such significant seasonal variations were not
visible in Periyar Lake. Tiwari (1999) pointed out that pH values of 7.25 to 8.9 is a safe
range for drinking water as well as irrigational purposes. The pH of Periyar water
therefore, is in the safe range as a drinking as well as irrigational water resource.
The three-year average pH during the pre-monsoon at the inlets was 7.5 and that
at the outlet was 7.6. The three-year average pH during the southwest monsoon at the
inlet and outlet were 7.5. The three year average pH during the northeast monsoon at the
inlet was 7.6 and that at the outlet was 7.8. The pH in a lake clearly demonstrates the
stabilizing effect when the yearly variation is smaller at the outlet than at the inlet, and
140

the stabilizing effect is related to the retention time as well (Halvorsen, 2004). The
maximum variation of pH noticed during the three-year period of study was 7.4 to 8 and
7.1 to 7.7 at the two major inlets (stations-4A and 4B) respectively whereas at the outlet
(station-5) the variation was 7.3 to 7.9. Comparison of fluctuations in pH between the
inlet and outlet showed that its fluctuations across the inlet and outlet were quite
insignificant in Periyar Lake. The retention time of water in Periyar Lake is very short as
it is continuously drawn downwards to eastern plains in the Western Ghats for electricity
generation and irrigation purpose. Therefore, it appeared that pH of water in the entire
Periyar Lake remain stable during all the seasons.
5. 3. 5. Salinity
Salinity is a direct measure of the amount of salts in the water. Because dissolved
ions increase salinity as well as EC; the two measures are related. Salinity is a well
recognized parameter for studying the mixing processes. Bhade et al. (2001) observed
1.25 to 2 times higher salinity in the river zone than at a dam site in central India. As in
the case of EC, the surface water at station-5 in general showed a higher salinity range
(16-24 ppm) and the lowest salinity range noticed was 11-17ppm at station-4B. At
station-2, surface water showed the 2nd highest salinity. The lowest recorded average
seasonal salinity of surface waters during the period of this investigation was 11.4 ppm at
station-4B during the northeast monsoon of 2003 and the highest recorded salinity was 24
at the station-5 during the southwest monsoon in 2002. The general increase in salinity at
station-5 during the southwest monsoon may be due to the influence of increased amount
of sewage waters joining the system at this site.
Comparison of the variations in salinity of surface water (Tables 35 to 37)
showed that the fluctuations in it over the years during the pre-monsoon were slightly
significant, whereas that across the different stations were insignificant. In the southwest
and northeast monsoon there were very significant variations in salinity of surface-water
across the stations. The three-year average salinity of surface-water during the different
seasons (Table 38) showed that the variations of salinity across the different stations
were significant whereas that over the different seasons were insignificant in the Lake.
141

Unlike surface water, fluctuations in salinity of bottom water over different years
were insignificant during all the seasons (Tables 39 to 41). The fluctuations across the
different stations during the pre-monsoon were also insignificant. However, the year wise
fluctuations across different stations were slightly significant during the southwest and
the northeast monsoons. There were no significant fluctuations in the three-year average
salinity over the different seasons (Table 42) of bottom water but the fluctuations were
significant across the different stations.
There was no significant difference in salinity between the surface and bottom
waters. These results suggested that, in general, the salinity range of Periyar Lake was
quite normal. However, the trend of increased salinity at station-5 and its reflection on
salinity range of station-1 were quite alarming. These are definitely due to the inflow of
sewage from Kumily township at these sites. Therefore, the sewage inflow shall be
controlled to keep the system safe from the influence of sewage waters.
5. 3. 6. Total Solids (TS)
The TS is a direct measure of all the dissolved and suspended matters in water. It
comprises dissolved salts, suspended particles, soil particles, discharged effluents and
decomposed organic matter. Taheruzzaman and Kushari (1995) observed TS of 50 to
2240 mg/l in Ganga waters and also found that it was lower during the lean months of
winter and summer when the interferences due to flood and precipitation were quite
lesser. In Periyar Lake the TS of surface water varied from 110 mgL-1 (at station-4B
during northeast monsoon of 2004) to 530 mgL-1 (at station-5 during the southwest
monsoon of 2002). The TS values of surface water of station-5 remained higher than that
of the other stations during the entire period of study. Similarly the 2nd highest TS were
noticed at station-1. Comparison of TS (Tables 43 to 45) showed that fluctuations in it
across the different stations and over the years were significantly different during all the
seasons. The highest content of total solids at both these stations was observed in the
southwest monsoon of 2002. The three year average of TS during different seasons
(Table 46) showed that fluctuation in TS across stations and that over different seasons
were significantly different in the Lake. Thus TS seems to be a highly fluctuating
parameter in Periyar Lake.
142

5. 3. 7. Total dissolved solids (TDS)
TDS is a direct measure of all the dissolved substances, both organic and
inorganic in waters. In Periyar Lake the TDS of surface-water varied from 19 mgL-1
(pre-monsoon of 2004 at station-2) to 44.2 mgL-1 (southwest monsoon of 2003 at station-
5) and that of bottom-water varied from18.8 mgL-1 (northeast monsoon of 2002 at
station-2) to 47.2 mgL-1 (northeast monsoon of 2003 at station-5). The TDS at station-5
(29.8 mgL-1 to 44.2 mgL-1 for surface water and 29.8 to 47.2 mgL-1 for bottom water) in
general were comparatively higher than other stations during the entire period of study.
The 2nd highest TDS was noticed at station-2 (20 to 28.2 mgL-1) for surface-water and
18.5 to 28.2 mgL-1 for bottom-water). At other stations (2, 3, 4A and 4B) the variations in
TDS were quite narrow (19 to 24.4 mgL-1) during the entire period of study.
Comparison of the TDS of surface and bottom waters showed that (Tables 47 to
49 and 51 to 53) fluctuations in it over the years during all the seasons were found
insignificant, but that across the different stations were very significant. The three-year
average of TDS of the three seasons of both surface and bottom waters (Table 50 and 54)
showed that the fluctuations of it over the seasons were insignificant, but that across the
stations were very significant. In general the TDS at station-5 was found always
significantly higher than that at all the other stations. TDS at station-1 was the 2nd
highest, except in the northeast monsoon during which TDS at this station was almost
equal to that at other stations.
Tiwari (1999) observed a TDS of 150 to 192 mgL-1 (mean value 170 mgL-1) in
the ‘Upper Lake’ water of Bhopal. Dwivedi and Sonar (2004) reported a TDS of 150
mgL-1 in a small reservoir in eastern Himalayan State of Arunachal Pradesh in India.
Gupta and Gupta (1999) reported a TDS of 175-414 mgL-1 in drinking waters in Satna,
MP State of India. Compared to those reports TDS at Periyar Lake was found very low at
all the stations during the entire period of study. However, the increase in TDS noticed at
station-5 followed by station-1 points to the increased influence of waste water from
Kumily township on the Periyar Lake, which is a tendency of pollution and must be
seriously curbed.
143
5. 3. 8. Total Alkalinity
Total alkalinity is caused by bicarbonates, carbonates, OH ions, borates, silicates
and phosphates (Kataria et al., 1995). Alkalinity is a measure of buffering capacity of
water and is important for aquatic life in a freshwater system because it equilibrates the
pH changes that occur naturally as a result of photosynthetic activity of phytoplankton
(Kaushik and Saksena, 1989). Alkalinity of water is its capacity to neutralize a strong
acid and is characterized by presence of all hydroxyl ions capable of combining with
hydrogen ions (Koshy and Nayar, 2000). Alkalinity is used as criteria for determining the
nutrient status of waters (Sorgensen, 1948; and Moyle, 1949).
In pure natural waters alkalinity is mostly due to dissolved CO2 or bicarbonate
ions and it represents the main carbon source for assimilation during photosynthesis.
Kaul et al. (1980) found that with increase in atmospheric temperature and the
consequent increase in the photosynthetic process in hot season, alkalinity values usually
decrease in summer. They observed significant difference in alkalinity between surface
and bottom waters: lower in surface waters than in the bottom, in Nilnag Lake, Kashmir.
In that Lake they found the amount of Ca three times higher than Mg, and bicarbonate as
the most dominant ion. According to Ruttner (1963), in lakes, calcium bicarbonate is the
most dominant buffer, a fact which normal lakes share with most of the hard water lakes.
Osborne et al. (1987) observed that an increase in concentration of cations was balanced
by increase in concentration of bicarbonates and the increase in bicarbonate in a lake is
probably due to absorption of atmospheric CO2 if pH increased during the period.
According to them if there is no increase in the relative concentration of the probable
counter ions such as Ca and Mg, the dissolution of carbonates can be ruled out as a
possible mechanism.
In Periyar Lake the alkalinity varied between 13.1 mgL-1 (at station-4A and 4B
during the southwest monsoon of 2004) to 22.5 mgL-1 (at station-5 during the pre-
monsoon of 2005). Haniffa et al. (1993) reported that alkalinity vary from 4.3 to 31.3
mgL-1 in Tambraparni river, TN, India. Sharma and Sarang (2004) observed a total
alkalinity of 190 to 350 mgL-1 in Jaisamand Lake, Udaipur, Rajastan, India. Bhatt et al.
(1999) reported an alkalinity variation of 156 to 191 mgL-1 in Taudaha Lake in
144

Katmandu. When compared to those reports it became clear that the total alkalinity in
surface as well as bottom waters of Periyar Lake remained within the very safe level at
all the stations during the entire period of study. In the Lake, total alkalinity was solely
due to bicarbonates and no carbonate alkalinity could be traced at any station during the
entire period of study. However when the alkalinity level is used as a criterion for
assessing the nutrient status (Sorgensen, 1948; and Moyle, 1949) this Lake water is
moderately nutrient rich. According to their classifications waters are grouped into three
different nutrient status groups on the basis of alkalinity: (a) 1 to 15 mgL-1 as nutrient
poor, (b) 16-60 mgL-1 as moderately rich, and (c) more than 60 mgL-1 as nutrient rich.
The Periyar water at its inlet zones with 13 mgL-1 of total alkalinity (stations-4A and 4B)
might be considered as nutrient poor, where as at the outlet (station-5) with 22 mgL-1 of
total alkalinity might be considered as a water of moderately rich in nutrient status.
Comparison of the total alkalinity of surface water showed that (Tables 55 to 57)
the fluctuations in it over years were very significant during the pre-monsoon and the
southwest monsoon, but that was insignificant during the northeast monsoon. During all
the seasons, fluctuations in total alkalinity across the stations were insignificant. The
three-year average of total alkalinity of surface-water of the different seasons (Tables 58)
showed that variations in this factor over the seasons and across the different stations
were always significant. Comparison (Table 59-61) of total alkalinity of bottom-water
showed that fluctuations in it over the years were significant during south west monsoon
and it across the stations was insignificant during all the seasons (Table-62). The three-
year average total alkalinity of bottom-water of different seasons showed that it was
significantly different over the seasons but the difference was insignificant across the
stations.
Total alkalinity of both the surface and the bottom water during all the seasons in
general showed a decreasing tendency from the pre-monsoon period to the northeast
monsoon at all the stations during the entire period of study. It may be assumed that, as
the monsoon progresses the alkalinity content decreases or water quality stabilizes in the
Lake. However, the total alkalinity of surface and bottom waters at station –5 was found
equal in the pre-monsoon and the northeast monsoon during 2004. Among all the
145

stations, station-5 showed a slightly higher surface water alkalinity than the same at the
other stations.
The observations of seasonal difference in total alkalinity in Periyar Lake in
general agrees with the opinions of Bhatt et al. (1999) and Trivedy and Goel (1986) who
argued that alkalinity is usually higher during the pre-monsoon than the monsoon.
Venkateswarlu (1969) also observed that alkalinity is affected by rain fall. Jayaraman et
al. (2003) observed a variation in total alkalinity from 4mgL-1 (during northeast
monsoon) to 1920 mgL-1 during pre-monsoon, in Karamana River, Kerala. Radhika et al.
(2004) also observed an increase in alkalinity during summer in Vellayani Lake,
Thiruvananthapuram, Kerala. Garg (2002) observed a total alkalinity of 159.43 mgL-1 in
river Mandakini, Chitrakoot, where the minimum is recorded in summer and maximum at
winter. Mandakini is a Himalayan river where summer is characterized by high inflow of
water. Iqbal and Katariya (1995) reported a different observation in the Upper Lake of
Bhopal, MP State, India, where they found a maximum total alkalinity value of 160 mgL-
1 (during monsoon) and a minimum value of 68.2 mgL-1 (during summer).
In Periyar Lake, the surface water of station-5 when compared to other stations,
showed a higher alkalinity in all seasons during entire period of study. It is at this station
the sewage of Kumily township joins the surface water of the Lake and hence the slight
increase in alkalinity in surface waters at this site was a sign of anthropogenic impact on
the system. The absence of such a tendency of higher alkalinity in bottom water
underlines this assumption.
5. 3. 9. Hardness
Hardness is governed by the contents of Ca and Mg, and the major contribution to
hardness is usually Ca. It may be due to other ions such as Fe ++ as well. Practically
hardness is a measure of the capacity of water to precipitate soap. The total hardness is
defined as the sum of Ca and Mg concentrations, both expressed as CaCO3 in mgL-1.
Carbonates and bicarbonates of Ca and Mg cause temporary hardness. Sulphates and
chlorides cause permanent hardness. Water with total hardness 0-60 mgL-1 is considered
soft; 60-120 mgL-1 is considered medium and above 120 mgL-1 is considered very hard.
146
Reid (1961) observed that hard water lakes have little or no carbonate alkalinity
and the bicarbonate alkalinity results in high buffer capacity which keeps the pH
relatively constant. According to Durfer and Baker’s classification when hardness is less
than 75 mgL-1 of CaCO3, water is soft (Adak et al., 2002). According to Moyle (1949)
and Pandey and Soni (1993) a lake with an alkalinity value over 90 mgL-1 is hard. Bhatt
et al. (1999) reported a total hardness of 352 mgL-1 (during summer) to 280 mgL-1
(during monsoon) in Taduaha Lake, Katmandu. Kataria et al. (1995) reported a hardness
of 20-410 mgL-1 in Tawa reservoir, MP State, India. Dwivedi and Sonar (2004) reported
a hardness of 84 mgL-1 (during pre-rainy season) to 58 mgL-1 (post-rainy season) in water
reservoirs in Arunachal Pradesh State, India. Iqbal and Katariya (1995) also reported
higher hardness values in summer and lower in monsoon in Upper Lake of Bhopal, MP
State, India. Garg (2002) observed a difference in hardness between seasons in river
Mandakini, Chitrakoot.
Comparison of surface (Table 63 to 65) and bottom water (Table-67-69)
hardness of different seasons showed that variations in it over the years were very
significant during all the seasons in both samples. In the case of bottom water the
variations across the different stations were insignificant during all the seasons.
Variations in hardness of surface water across the different stations were insignificant
during the pre-monsoon and the northeast monsoon, whereas it was slightly significant
during the southwest monsoon. Comparison of the three-year average of total hardness
of surface and bottom waters showed that fluctuations in hardness were significant over
different seasons whereas such fluctuations were insignificant across stations.
The highest hardness in surface water noticed was during the pre-monsoon season
(12.5 mgL-1 at station-5 in 2003), moderate during the southwest monsoon (6.5 mgL-1 at
station-4B in 2004), and lowest during the northeast monsoon season (5 mgL-1 at station-
5 and the same at station-3 in 2004). In Vellayani Lake, Kerala, Radhika et al. (2004)
observed hardness of 16.25 to 30.75 mgL-1 in surface water whereas in bottom water the
hardness was slightly higher, which varied from 17 to 37.25 mgL-1 in surface water.
Compared to hardness of similar fresh waters in the country, the Periyar water showed a
uniquely low hardness throughout the period of study. In general, the surface water at
station-5 showed comparatively higher hardness than that at the other stations in all the
147

seasons during most of the period of studies. Jain et al. (2002) observed an increase in
hardness of freshwaters due to anthropogenic influence. It is at the station-5, the sewage
of Kumily town joins the surface water of Periyar Lake and hence the slight increase in
hardness in surface water at this site was a sign of anthropogenic impact on the system
just as in the case of alkalinity. The absence of such a tendency of higher hardness in
bottom water at all the stations, also underlines this assumption.
5. 3.10. Free Carbon Dioxide (CO2)
Although CO2 is a minor component of air it is abundant in water because of its
solubility which is 30 times more than that of oxygen, and the amount of CO2 in water
usually shows an inverse relationship with oxygen (Radhika et al., 2004). Free CO2 is
essential for photosynthesis and its concentration affects the phytoplankton, and its
productivity. Excess of it gets dissociated into carbonic acid. The limit of free CO2 as per
acceptable Standards is 10 mgL-1 of surface water. Increase in CO2 indicates increase in
pollution load (Koshy and Nayar, 1999).
Dwivedi and Sonar (2004) observed an average of 2 mgL-1 of free CO2 in water of
reservoirs in Arunachal Pradesh State, India. Radhika et al. (2004) reported an annual
variation of 2.42 to 10.47 mgL-1 of CO2 in Vellayani Lake in Kerala. The same author
found that there was a gradual change in concentration of CO2 in the Lake from the pre-
monsoon to the southwest monsoon to the northeast monsoon; the maximum being in the
northeast monsoon, minimum during the southwest monsoon and moderate during the
pre-monsoon. Sharma and Mathur (1992) noted maximum free CO2 in monsoon and
minimum in winter in north Indian waters.
Comparison of the dissolved (Tables 71 to 73) CO2 of surface water showed that
there were no fluctuations in it over different years and across the different stations in
each season. CO2 content of the different seasons (Table 74) showed that the variation in
it in surface water was significant over the different seasons but insignificant across the
different stations. There were no fluctuations in CO2 content of bottom water over the
different years and across the different stations in the southwest and the northeast
monsoon seasons (Tables 75 to 77). But in the pre-monsoon the fluctuations in dissolved
CO2 of bottom water was found significant over the years and not across the stations. The
148

three year average of dissolved CO2 of bottom water (Table 78) during the different
seasons showed that the variations in this factor were significant over the different
seasons and across the different stations in Periyar Lake.
The CO2 content of surface water varied from 1.6 mgL-1 (at station-3 during the
southwest monsoon of 2004) to 3.4 mgL-1 (at station-5 during the southwest monsoon of
2004). In general both the surface and bottom waters at station-5 showed a comparatively
higher CO2 content than that at the other stations during the entire period of study.
Another significant trend observed was a slight increase in the CO2 content of the surface
water at station-4A during the northeast monsoon. In other stations during the entire
period of study the CO2 content of surface water did not show much fluctuation. CO2
content of bottom water showed a slight increase during the pre-monsoon to the northeast
monsoon at all the stations. In general the free CO2 in the Lake remained quite normal for
an oligotrophic freshwater system and never exceeded the standard values during the
entire period of study.
5. 3. 11. Dissolved Oxygen (DO)
DO is the sole source of oxygen for all the aerobic aquatic life and hence it is
considered as an important measure of purity for all waters. Oxygen content is important
for direct need of many organisms and affects the solubility and availability of many
nutrients and therefore the most significant parameter affecting the productivity of
aquatic systems (Wetzel, 1983). DO reflect the water quality status and physical and
biological processes in waters and show the metabolic balance of a lake. DO is an
important water quality parameter in assessing water pollution (Laluraj et al., 2002). The
factors affecting oxygen content in natural waters include input due to atmosphere and
photosynthesis and output from respiration, decomposition and mineralization of organic
matter as well as losses to atmosphere. Hence, the oxygen balances in water bodies
become poorer as the input of oxygen at the surface and photosynthetic activity decreases
and as the metabolic activities of heterotrophs are enhanced. Fluctuation in DO is also
due to fluctuation in water temperature and addition of sewage waste demanding oxygen
(Koshy and Nayar, 2000).
149

Higher DO means rate of oxygen replenishment in water is greater than O2
consumption and this is healthy for almost all aquatic systems (Adak et al, 2002).
Rabalais (2002) used the term ‘hypoxia’ for low oxygen content and ‘anoxia’ for no
oxygen content in waters. According to the author, where excess carbon is produced and
accumulates in waters, secondary effects of eutrophication often occur such as noxious
algal blooms (including toxic ones) decreased water clarity, and low DO. A low DO
content is a sign of pollution (Bhatt et al., 1999).
The fluctuations of DO of surface water were significant across the different
stations during all the seasons, whereas fluctuations over the years were significant
during the northeast monsoon and the pre-monsoons alone (Tables 79 to 81). In the
southwest monsoon the fluctuations in DO over the years were insignificant. The three
year average DO of surface water (Table 82) during the different seasons revealed that
fluctuations in it over the seasons and across the stations were always significant.
Variations in DO of bottom water over the years were significant during the northeast and
the pre-monsoon, but found not at all significant during the southwest monsoon (Tables
83 to 85). However, variations across stations were significant during all the seasons. The
three year average seasonal DO of bottom water (Table 86) showed that significant
variations in DO occur over seasons and across the different stations.
The DO in surface water of Periyar Lake varied from 4.6 mgL-1 (at station-2,
during the pre-monsoon of 2004) to 8.3 mgL-1 (at station-4B during the pre-monsoon of
2005). The minimum limit of DO required for freshwaters as per ICMR (1975) and the
ISI (1991) standards is 5 to 6 mgL-1. Therefore, the DO of the Lake can be considered
almost normal for a natural lake except at certain points during certain seasons and years.
Kaul et al. (1980) observed DO value of 5.7 to 11.7mgL-1 in Nilnag Lake, Kashmir.
Koshy and Nayar (1999) observed a DO content of 3.1 mgL-1 to 12.6 mgL-1 in Pampa
River, Kerala. Garg (2002) reported DO of a minimum of 6 mgL-1 (during summer) and
maximum 8.12 mgL-1 (during the monsoon) in river Mandakini, Chitrakoot. Singh and
Rai (1999) reported a DO variation of 0.9 to 9.83 mgL-1 in Ganga River at Varanasi.
Jayaraman et al., (2003) observed that DO vary month wise and station wise in waters of
Karamana River, Kerala, India and maximum DO was observed in rainy season.
150

Unlike the above reports, Periyar Lake remained stable with only meager
fluctuations in DO throughout the entire period of study. The fluctuations in DO observed
in the Lake were quite random. There were no visible seasonal trends in the average DO
of surface and bottom waters at all the stations in the Lake. Spatial difference in DO of
surface water was also quite narrow. The maximum surface water DO was observed at
station-4B (5.5 to 8.3 mgL-1) and the minimum (4.7 to 7.1 mgL-1) at station-5 in all the
seasons during the entire period of study. This trend was identical for both surface and
bottom waters. The slight general reduction in DO at station-5 can be due to the impact of
organic load through the sewage from Kumily township reaching the site. Except during
the pre-monsoon of 2004, the year wise fluctuations in DO were not significant at all the
stations.
At all the stations except at 2, 3 and 4A, there were no significant difference in
DO between surface and bottom waters. The uniformity in DO at certain stations was
because of the low bottom sample depth (below 3 meters) at all those stations. At
stations-2, 3 and 4A, where the average sample depth was consistently around 10 meters,
a difference in DO between both surface and bottom waters was quite evident. At station-
2 the bottom water DO fluctuation during the three-year period was 4.6 to 6.5 mgL-1
(surface - 4.6 to 7.4 mgL-1), at station-3 it was 2.1 to 5 (surface - 5.1 to 7.6 mgL-1) and at
station-4A, it was 2 to 7.24 mgL-1 (surface 5.2 to 8.2 mgL-1). At the Dam site (station-3)
where the depth of bottom sample was consistently 10 meters in all the seasons
throughout the entire period of study, the bottom DO was also consistently lower than
that of its surface content; 2.1 to 5 mgL-1 during the pre-monsoon, 4.9 to 7.2 mgL-1
during northeast monsoon and 4.4 to 6.9 mgL-1 during the northeast monsoon.
The organic matter produced during photosynthesis ultimately get deposited in the
Lake mud where for its decomposition it utilizes the oxygen present in the water layer
close to it (Kaul et al., 1980). The amount of trophogenesis occurring in the epilimnion is
correlated with hypolimnetic oxygen depletion and is thus a reflection of its degree of
eutrophy (Hutchinson, 1938). In Lakes depletion of oxygen in the lower layers near the
bottom is an indication of eutrophication (Kaul, 1977). The rate of oxygen depletion
noticed in bottom layers in deep zones of the Periyar Lake may be an indication of the
changing of the system into a more eutrophicated type. However, this cannot be
151

attributed to the freshly deposited organic matter in the Lake. Because freshly sedimented
organic matter usually has higher proportion of less resistant tissue, appears to be highly
refractory to oxidative breakdown by aerobic bacteria, and hence there is an increased
chance of oxygen depletion after heavy rains (monsoons) in such Lakes which receive
inflow of organic matter from the watersheds (Kaul et al., 1980). In the Lake since the
bottom depletion of oxygen was much more intense during the summer (pre-monsoon)
season, the monsoon influence was positive than negative, and hence the bottom
depletion in the pre-monsoon can be attributed to lowering of general water level and to
the heavy deposit of organic matter which may be existing at the extreme bottom from
early inception of the Reservoir. Moreover, there is the chance of re-oxygenation of water
during the monsoon due to circulation and mixing by inflow after the monsoon rains
(Hannan, 1979). The northeast monsoon corresponds to the winter season during which
cooling down of water body enable much more dissolution in waters than during warm
seasons. Depletion of oxygen may occur in summer due to increase in temperature as
well. The oxygen cycle in water involves a rapid decrease during summer at a steady
increase through autumn till maximum content is reached in winter, following the well
known solubility of gases (Kaul et al., 1980). Bhade et al. (2001) observed a direct
anoxic hypolimnion in the Lake zone extending 25 m down to 45 m in Tawa reservoir.
Such an examination of DO of extreme depth could not be done in Periyar Lake during
this study.
5. 4. Major cations in the water 5. 4. 1. Calcium (Ca)
The general acceptable limit of Ca in waters is usually 75 mgL-1 whereas its
maximum permissible limit is 200 mgL-1 (ICMR, 1975). The source of Ca in natural
waters is basically leaching from Ca rich mineral rocks such as lime stone or
mineralization of organic matter by the bacteria. Therefore, Ca in natural waters differs
according to difference in geographic regions or anthropogenic impact.
In Lake Murray of Papua New Guinea Ca content varied from 39 to 60mgL-1 and
the amount was inversely proportional to water level; increased during low water levels
and decreased during high levels (Osborne et al., 1987). But in a Norwegian mountain
152

lake the annual variation in Ca reported is from 0.62 to 0.93 mgL-1 (Halvorsen, 2004).
Laluraj et al. (2002) observed an amount of 220 to 338 mgL-1 of Ca in waters at
Kayamkulam estuary Kerala, India and found that the Ca content generally reaches the
maximum during the pre-monsoon. They also observed that Ca in bottom water in this
estuary is higher than that of surface water which according to them may be due to
dissolution of detritus materials at the bottom. Annual average amount of 30 mgL-1 of Ca
is found in Nilnag Lake, Kashmir and the amount decreased in summer. Summer
decrease of Ca in water is attributed to photosynthetic activity of macrophytes attaining
their peak growth and production during the season (Kaul et al., 1980).
In Periyar Lake the seasonal average of Ca content in waters varied from 2 mgL-1
to 3.6 mgL-1. In general there was a slight increase in Ca ion in waters at station-5 (the
outlet) from that at the Dam site (the culmination of all inlets). Fluctuations in Ca content
of surface-water over the years and across the stations were insignificant during the
southwest and northeast monsoons, whereas it was significant during the pre-monsoon
(Table 99 to 101). The three-year average of Ca content of surface-water (Table 102)
during the different seasons showed that the fluctuations of it over the seasons were
insignificant but that across the stations were significant in all the seasons. Ca of bottom-
water (Table103 to 105) showed that the fluctuation in it over the years and across the
stations were insignificant throughout the period of study, but a comparison of the three-
year average value of the three seasons (Table 106) showed that the fluctuations of Ca in
bottom-water were significant over the seasons and across the stations.
As in the case of other quality parameters this slight increase in Ca at the outlet
from that of the inlet was definitely an impact of sewage waters from the Kumily town
joining at this site. Even though the Ca level was found quite normal at all the stations
and the fluctuations noticed were quite irregular between the seasons throughout the
period of study. The order of the major cations in freshwater is generally a progression-
Ca>Mg>Na>K, but Suvarna and Somasekhar (1997) observed different ionic
composition of Na>Ca>Mg>K in the water body they studied. In Periyar Lake the Ca
ions were found lesser than that of Mg ions.
153

5. 4. 2. Magnesium (Mg)
The general acceptable limit of Mg in water is usually 50 mgL-1 whereas its
maximum permissible limit is 100 mgL-1 (ICMR, 1975). Halvorsen (2004) reported 0.12
to 0.16 mgL-1 of Mg in a Norwegian mountain lake. In lake Murray, Papua New Guinea,
concentration of Mg (6 to 16 mgL-1) varied according to water level, increased during
low water levels and decreased during high levels (Osborne et al., 1987). Laluraj et al.
(2002) found that in Kayamkulam estuary, the Mg content varied from 637 to 1158 mgL-1
and there the Mg and Ca generally reached the maximum during pre-monsoon. Kaul et
al. (1980) observed an average Mg content of 7.4 mgL-1 (3.4 to 10.6 mgL-1) in Nilnag
Lake, Kashmir.
The seasonal average of Mg ions in Periyar waters varied from 3.1 to 6.6 mgL-1,
which is quite below the standards prescribed. However, unlike the mineral composition
of other lakes, the water of Periyar Lake is characterized by a higher amount of Mg than
Ca. There were not much difference in Mg ions in both surface and bottom waters. As in
the case of Ca, there was a general increase in the average amount of Mg ions in water at
station-5 than at all the other stations during the entire period of study.
The fluctuations of Mg in surface-water over the years were significant only
during the southwest monsoon but that across the stations were insignificant in all the
seasons (Tables 107 to 109). The three-year average (Table 110) of the same showed
that the fluctuations were significant over the seasons and across the stations during the
entire period of study. In the bottom samples (Tables 111 to 113) the fluctuations of Mg
over the years and across the stations were insignificant in all the seasons. The three-year
average values (Table 114) showed that the fluctuations over the seasons were significant
and that across the stations were insignificant. The maximum Mg content reported in the
bottom-water was 7.3 mg L-1 (at station-5 during the pre-monsoon 2003) and the
minimum amount reported was 3.1 mg L-1 (at station 2 during the pre-monsoon of 2003).
5. 4. 3. Potassium (K)
Halvorsen (2004) reported 0.23 to 0.30 mgL-1 of K in a Norwegian mountain
Lake. In river Mandakini, Chitrakoot, seasonal variation in K content (2 to 12 mgL-1) was
154

not same at all stations; at certain stations the maximum content recorded was during
summer and at certain others during monsoon (Garg, 2002). K in an estuary of Kerala
varied from 210 to 290 mgL-1 (Laluraj et al., 2002). In Lake Murray of Papua New
Guinea concentration of K (3 to 6 mgL-1) varied according to water level, increased
during low water levels and decreased during high levels (Osborne et al., 1987). K
content in Nilnag Lake in Kashmir waters varied form 0.3 to 0.94 mgL-1 during winter
and recorded a decrease in K ionic content during summer (Kaul et al., 1980).
In Periyar Lake the amount of K ions in both the surface and bottom waters did
not vary much. In both surface and bottom water the K content varied from 0.9 mg L-1(at
station-5 and 1 during the southwest monsoon of 2002 and 2003) to 2 mg L-1 (at station-
4B during the northeast monsoon of 2003). K content in the surface-water showed that
(Table 115 to 117) the fluctuations in it over the years were significant in all the seasons,
whereas the fluctuations across the different stations were significant during the northeast
monsoon alone. K content in the bottom-water showed (Tables 119 to 121) that the
fluctuations in it over the years were significant during the southwest monsoon alone and
the fluctuations across the stations were insignificant during all the seasons. The three-
year average of K ions in surface water (Table 118) during the different seasons showed
that there were no significant fluctuations in K ions in the Lake over the different seasons
and across the different stations. There were no fluctuations in the three-year average of
K ions in bottom-water (Table 122). Insignificance of fluctuations in K+ over the seasons
and across the stations in the Lake evidence the absence of agricultural pressure of all
kinds on the system.
5. 4. 4. Sodium (Na)
Halverson (2004) reported 0.29 to 0.39 mgL-1 of Na in a Norwegian mountain
Lake. In river Mandakini, Chitrakoot, seasonal variation in Na content (7 to 14 mgL-1) in
water was not same at all the stations; at certain stations the maximum content was
recorded during the winter and at certain others during the monsoon (Garg, 2002). In
Lake Murray, Papua New Guinea concentration of Na (22 to 31 mgL-1) varied according
to water level, increased during low water levels and decreased during high levels
155

(Osborne et al., 1987). Na content in Nilnag Lake, Kashmir waters varied from 2.7 to 5.4
mgL-1 (Kaul et al., 1980).
In Periyar Lake the seasonal average of Na ions varied from 1.9 (at Station-4B) to
6.5 mgL-1 (at station-5). There were not much difference in Na ions in both surface and
bottom waters. There were significant fluctuations in the Na ions over different years
during all the seasons but the fluctuations across the stations were significant during the
southwest and the northeast monsoon seasons only (Table 123 to 125). Significant
fluctuations were observed in the three year average of Na ions in the surface and bottom
waters (Table 126 and 130) over the different seasons and across the different stations.
Na ions in bottom water of the different seasons (Tables 127 to 129) showed that the
fluctuations in it over the years were significant during the northeast monsoon alone
whereas insignificant during the pre-monsoon and the southwest monsoon. Across the
different stations such fluctuations were significant during the southwest monsoon alone.
Three-year average of the content of Na ions in the bottom-water (Table 130) showed
that the fluctuations in it were significant over the different seasons and across the
different stations during all the seasons. In general, the water at station-5 showed a higher
amount of Na at all the seasons during the entire period of study. Significant fluctuations
in Na over the seasons and across the stations show that Na+ in tropical freshwaters is
related to differences in quality and quantity of inflow.
5. 5. Major anions in the water
5. 5. 1. Chloride (Cl)
Cl ions in sea-water is around 20,000 mgL-1, in rainwater it is 2 mgL-1 and in
unpolluted rivers the amount of Cl ions is usually 2-10 mgL-1; and when the amount is
above 200 mgL-1, the water is not used for human consumption (Koshy and Nayar,
1999). Maximum permissible limit with regard to Cl content in natural freshwaters
according to WHO (1985) is 200 mgL-1 and the same according to ICMR (1975) and ISI
(1991) is 250 mgL-1. Halvorsen (2004) reported 0.33 to 0.45 mgL-1 of Cl in a Norwegian
mountain lake. In river Mandakini, Chitrakoot, seasonal variation in Cl content (24 to 80
mgL-1) was not same at all the stations (Garg, 2002). Jayaraman et al. (2003) observed a
variation in Cl content of 1.2 to 15807 mgL-1 in Karamana River which is subjected to
156

sea intrusion in pre-monsoon. They observed that in the river the Cl content increases
from southwest monsoon to northeast monsoon to pre-monsoon. Pandey and Sharma
(1999) reported a similar trend in Ramaganga River in U.P and Abbasi et al. (1997) in
Kuttiadi River, Kerala.
Gowd et al. (1998) reported Cl concentration of 11-514 mgL-1 during northeast
monsoon and 10-418 mgL-1 during pre-monsoon season at Pedavanka watershed,
Ananthapur district, Andhra Pradesh, India. In Lake Murray, Papua New Guinea
concentration of Cl (6 to 49 mgL-1) varied according to water level, increased during low
water levels and decreased during high levels (Osborne et al., 1987). Dwivedi and Sonar
(2004) observed a variation of Cl in reservoirs in Arunachal Pradesh from 21 mgL-1
during pre-monsoon to 29.6 mgL-1 during monsoon. Bhade et al. (2001) observed that Cl
ions were 1.25 to 2 times higher in the riverine zone than the dam site in Tawa reservoir,
M.P State, India. Excess Cl ions in water indicate degree of pollution and in natural
waters the Cl ions are usually found associated with Na, K, and Ca, and Cl ions produce
salty taste when concentration is 100 mgL-1 (Kataria et al., 1995). Gowd et al. (1998)
observed that a high concentration of Cl imparts a salty taste to water. According to
Chandrasekhar et al. (2003) the presence of Cl concentration in a water source is used as
an indicator of organic pollution by domestic sewage.
The Cl ionic content in Periyar Lake ranged from 5 mgL-1 (at station-4B during
southwest monsoon of 2003) to 9.9 mgL-1 (at station-5 during pre-monsoon of 2005). At
the major inlet stations (4A and 4B) the Cl ionic content varied from 5 to 6.4 mgL-1,
whereas the same at station-5 varied from 6.3 to 9.9 mgL-1. At station-1 (just inner to
station -5) the Cl ionic content ranged from 6.2 to 9.9 mgL-1, and at the other stations,
lying between station-5 and the major inlet stations, the range of Cl ions was
intermediary in amount. Another important trend noticed was that of an increase in Cl
content at station-1 than that at station-5, during the southwest monsoon of both 2003 and
2004.
The Cl concentration serves as an indicator of pollution by sewage (Trivedi and
Goel, 1986). In Periyar Lake the Cl content was more or less similar in both the surface
and bottom waters and it varied from 5 to 9.9 mgL-1. Throughout the period of study the
157

water at station-5 showed comparatively higher value for Cl than water at the other
stations except during the southwest monsoon. During the southwest monsoon the Cl
content at station 1 exceeded that of station-5. The lowest Cl content was recorded at
station-4B throughout the study period. Cl ions in surface-water showed (Tables 131 to
133) that the fluctuations of it over the years were significant in the pre-monsoon and the
northeast monsoon, but it was insignificant during the southwest monsoon. However,
such fluctuations across the different stations were significant during all the seasons. The
three year average of Cl ions in surface water (Table 134) was insignificant over the
seasons but significant across the stations during all the seasons. In the bottom water, the
fluctuations of Cl ion content over the years were significant during the pre-monsoon and
the northeast monsoon, whereas insignificant during the southwest monsoon. Across the
stations the fluctuations were significant during all the seasons. Fluctuations in the
average three year value of Cl ion content were insignificant over the different seasons
but significant across the stations during all the seasons.
5. 6. Major Nutrients in the water 5. 6. 1. Nitrogen (N)
An increase in trophic status of a lake is associated with an increase in its nutrient
status. Nitrogen and Phosphorus are the major nutrients for all phytoplankton growth and
the limited availability of these nutrients in water usually limits phytoplankton growth in
natural aquatic systems. On the contrary excess availability of both of them triggers
eutrophication. Accumulation of N and P in natural waters is more closely related to
external factors such as cultural influences, fertilization, and the rate of flow (Hutchinson,
1938). In natural waters 150 µ gL-1 of N is a critical value and when the content crosses
the limit algal blooms occur (Sawyer et al., 1945). Once N is transformed through
microbial process in soils to biologically available N in ground and surface waters, there
are a number of effects beginning with ground water contamination and surface water
acidification. The maximum acceptable concentration of N in water for humans either for
drinking or for recreation and aesthetics is 10 mgL-1 (of nitrate or nitrate together with
nitrite) or 1 mgL-1 (nitrite alone), whereas a maximum concentration of 100 mgL-1
158

(nitrate or nitrate and nitrite together) or 10 mgL-1 (nitrite alone) is permissible for
animals including wildlife (Riordan, 1993).
Nitrogen is generally considered the primary limiting nutrient for phytoplankton
biomass accumulation (Rabalais, 2002).The accumulation of N in reservoirs and natural
water bodies has become a common phenomenon which alters ecological process in
many parts of the world due to intensive human activity. Increased nutrients along with
altered nutrient ratios cause multiple and complex changes in aquatic ecosystems. The
forms of N that affect aquatic ecosystems include inorganic dissolved forms; Nitrite
(NO2), Ammonium (NH4), Nitrate (NO3) and a variety of dissolved organic compounds
such as amino acids, urea and composite dissolved organic nitrogen, and particulate
nitrogen.
NH4 in water is produced by microbiological degradation of organic nitrogenous
matter. Free NH4 is an important parameter indicating pollution. Surface waters generally
have lesser NH4 form than bottom waters because it is liberated often from the
decomposing organic matter of the lakes and its release in the deep layers is governed by
anoxic conditions (Kaul et al., 1980). In surface layers the low NH4 concentrations result
through its utilization by plankton and other plants (Prochazkova et al., 1970).
In general, NO2 and NH4 forms are present in natural waters in smaller quantities
when compared to the NO3 form. Nitrite is the product of intermediate oxidation state of
N produced both in the oxidation of NH4 to NO3 and in the reduction of NO3. It is an
intermediate compound in N cycle and is unstable. The low concentration of NO2 is in
consonance with its insignificant role in the environment and also with its short residence
time in water (Malhotra and Zanoni, 1970). Presence of NO2 in water depends on oxygen
content of water.
NO3 is the most highly oxidized form of N, which is the product of aerobic
decomposition of organic nitrogenous matter. NO3 is a plant nutrient and inorganic
fertilizer that enters water supply sources from septic systems, animal feed lots,
agricultural fertilizers, manure, industrial waste waters, sanitary landfills and garbage
dumps. The most important source of NO3 in waters is biological oxidation of
nitrogenous organic matter of both autochthonous and allochthonous origin, which
159
include domestic sewage, Agricultural run-off and effluents from industries (Saxena,
1998). Maximum permitted limit of drinking water level of NO3 N is 20 mgL-1 according
to ICMR (1975) and 45 mgL-1 according to ISI (1991). NO2 form of N is formed by
incomplete bacterial oxidation of organic nitrogen while NO3 concentration depends on
geochemical conditions such as degree of use of agricultural fertilizers and industrial
discharges of nitrogenous compounds (Kataria et al., 1995).
Abbasi (1997) did not detect any NO3 in Punnur puzha while they reported lower
values of the same in Kuttiadi dam. Osborne et al. (1987) observed that concentration of
P and N increased during higher water levels. Closer coupling between benthic and
pelagic process occur in deep lakes (Bengtsson, 1975). Nutrients are stored in sediments
(Threkeld, 1994; Jeppesen et al., 1997). In deep lakes settling of suspended matter can
lead to low nutrients in the epilimnion during summer. Hence internal loading depends
upon the intensity of turbulence across seasonal pycnocline that transports nutrient rich
hypolimnetic water to the photic zone in summer (Jellison et al., 1993 and Romero et al.,
1998). Blum (1956) reported that highest values of NO3 in rainy season may be due to the
addition of N in the form of runoff water and organic pollution due to sewage entry
whereas NO3 depletion in winter and summer may be due to the photosynthetic activity
of the alga or due to the oxidation of organic compounds.
Nitrogen estimation could be carried out only for surface-water during this study.
Total N includes inorganic forms nitrate/nitrite and ammonium, as well as organic
nitrogen. Total kjeldal N is the sum of ammonium and organic nitrogen compounds.
Total kjeldal N in Periyar Lake was extremely small, ranged from 1 to 3.9 mgL-1
whereas the NO3 form of N ranged from 0.1 to 0.6 mgL-1 during the entire period of
study.
Nitrate nitrogen content (Table 139 to 141) in the surface-water showed that there
were significant fluctuations in it across the different stations during all the seasons.
However, such fluctuations over the years were significant only during the southwest
monsoon. Three year average of NO3 N (Table 142) in the surface water showed
significant fluctuations across the different stations but the fluctuations in its value over
the different seasons were insignificant. Total N content in the surface water showed
160

(Tables 143 to 145) that the fluctuations of it over the years were significant during the
two monsoon seasons but insignificant during the pre-monsoon. But such fluctuations
across the stations were significant during the southwest monsoon only. However, the
three year average of total kjeldal N (Table 146) in the surface water showed significant
fluctuations across the different stations and over the different seasons.
The present study showed that, in spite of the increasing anthropogenic
influences, the N concentration in Periyar Lake never reached an alarming level at any
stations during the entire period of study. However, certain interesting trends were visible
in N content as in the case of other quality parameters. In general the N content (both the
total kjeldal form and the NO3 form) at station-5 (total kjeldal N was 1.7 to 3.5 mgL-1;
NO3 was 0.3 to 0.6 mgL-1) remained slightly higher than other stations during all the
seasons throughout the period of study. The second highest content was found at station-
1. There was a seasonal trend of a comparatively slightly higher amount of total kjeldal N
during the pre-monsoon at all the stations, whereas the trend was not visible in NO3 form
of N. The lowest content of total kjeldal N was observed during the southwest monsoon.
In 2004, the content of total kjeldal N during the northeast monsoon was comparatively
higher than that of its content during other years at all the stations, and was almost equal
to its content during the pre-monsoon at station-5.
5. 6. 2. Phosphorus (P)
P occurs almost solely as phosphates in natural waters. All forms of phosphates
such as orthophosphates, condensed phosphates, and organically bound phosphates are
found in waters. Phosphate is added to land through different ways; P containing
fertilizers (manufactured from mined P), animal manures, and waste products from
animals supplemented with P enriched feed. In natural waters P exists as soluble
phosphates. P is the nutrient considered to be the critical limiting nutrient, causing
eutrophications of fresh water systems (Rabalais, 2002). It is a major nutrient that
triggers eutrophications and required by algae in small quantities (Bandela, et al., 1999).
Each P ion promotes the incorporation of seven molecules of N and 40 molecules of CO2
in algae (Wetzel, 1983).
161

P enters surface water from human-generated wastes and land run off; domestic
waste contains approximately 1.6 kg per person, per year of which 64 % is from synthetic
detergents (Kataria et al., 1995). P additions to landscape enter water via waste water
effluents and soil erosions, and also from detergents. Therefore, P in large quantities in
water is an indication of pollution through sewage and industrial waste. P is the primary
limiting nutrient in most lakes and reservoirs. Just like N, higher P in bottom water may
result from decomposition of organic matter and its release from sediments under the
anoxic conditions. P limits the growth of all the algal forms most often, but N limits the
algal growth of certain species alone. This is because of the fact that certain species of
algae which fix nitrogen themselves are not affected by scarcity of N in the water they
grow. Hence, the P nutrient assessment of waters is crucial to the monitoring
investigations of natural freshwater bodies.
In the present study, phosphates at surface-water alone were monitored. P of the
Lake was found varying from 0.01 to 0.1 mgL-1 or 10 to 100 µgL-1, during all the seasons
throughout the period of study. According to Jeppesen et al. (1997), P content of 0.05 to
0.1 mgL-1 is threshold of it as a nutrient for natural waters. Romero et al. (2002)
considered Lake Pamvotis with a P content of 0.11 mgL-1 as one of intermediate nutrient
status. Periyar Lake with P less than 0.1mgL-1 represents a freshwater body of
oligotrophic status.
In Periyar Lake, the fluctuations in P content during the different seasons and
different years were random. Fluctuations in the inorganic P of water (Tables 147 to 149)
were significant across the different stations in all the seasons. But fluctuations in it over
the different years were significant during the pre-monsoon and the southwest monsoon
only. Three year average of P content during different seasons (Table 150) showed that
there was significant difference in this value over the different seasons and across the
different stations.
However, when P at the different stations were compared, waters at station-5
showed the highest values throughout the period of study and water at station-1 showed
the 2nd highest values. According to Welch (1980) a water body may be considered as
eutrophic if the total P value ranged in between 20-30 µgL-1. In Periyar Lake the
162

maximum P content (50-100µgL-1) was noticed at station-5 followed by station-1 with P
content in between 30 to 70 µgL-1. The inlet zones showed minimum P content of 10 to
60 µgL-1. At stations 2 and 3 the P content varied from 10 to 80 µgL-1. Seasonal analysis
showed that maximum P content was noticed at all the stations during the pre-monsoon
and the minimum at the northeast monsoon. Moderate content of P was noticed during
the southwest monsoon.
5. 6. 3. Silica
Silicates are any mineral that contain silica, and include quartz (SiO2), feldspars,
clays, and others. Silicon dioxide occurs in all natural waters in various forms. Much of
the silica in water comes from the dissolution of silicate minerals. The source of silica is
usually natural rock, and therefore freshwater contains higher concentrations. Many
silicates are stable in acidic chemical environments, but tend to dissolve in alkaline
(basic) chemical environments. Much rain is acidic and is not good at dissolving silica.
However, the chemistry of water changes at the Earth's surface and underground, and
some water is alkaline enough to dissolve many silicate minerals. For instance, acid water
dissolves limestone, and in doing so it can become alkaline.
Silica is of significance as a major nutrient for Diatoms and may become a
limiting nutrient during Diatom blooms. Unlike other nutrients, this is only a major
requirement of Diatoms so it is not regenerated in the plankton ecosystem as efficiently
as, for instance, nitrogen or phosphorus nutrients. This can be seen in maps of surface
nutrient concentrations, as nutrients decline along gradients, silicon is usually the first to
be exhausted (followed normally by N, then P). In a classic study, Egge and Aksnes
(1992) found that Diatom dominance of mesocosm communities was directly related to
the availability of silicate. When silicon content approaches a concentration of 2 mmol m-
3, Diatoms typically represent more than 70% of the phytoplankton community. Silica
additionally limits the growth of Diatoms (Schindler, 1978). Other researchers (Milligan
and Morel, 2002) have suggested that the biogenic silica in Diatom cell walls acts as an
effective pH buffer, facilitating the conversion of bicarbonate to dissolved CO2.
In Periyar Lake the amount of dissolved silica in water was low (0.01 mg L-1 to
0.41 mg L-1). The fluctuations in silica content (Tables 151 to 153) across the stations of
163

the Lake were significant during the southwest and the northeast monsoons only, whereas
the fluctuations over the years were significant during the pre-monsoon and the southwest
monsoon only. Three-year average of the silica content (Table 154) showed that the
fluctuations in it over the different seasons were significant in the Lake. Whereas, the
fluctuations across the different stations were insignificant in all the seasons.
5. 7. Organic waste in the Lake
5. 7. 1. Biochemical Oxygen Demand (BOD)
Biological or Biochemical Oxygen Demand is the amount of oxygen utilized by
microorganisms in consuming the organic matter in waters. BOD is a measure of the
actual oxygen demand of wastes under laboratory conditions similar to those found in the
receiving waters, and is a good indicator of biodegradability of wastes. BOD increases as
the bio-degradable organic content increases in waters. BOD above 6 mgL-1 in a water
body is considered polluted and high BOD values are attributed to the stagnation of water
body leading to the absence of self purification (Iqbal and Katariya, 1995). Water bodies
with BOD of 225 to 323 mgL-1 are called septic or anaerobic systems (Chandrasekhar et
al., 2003).
In Periyar Lake the BOD of surface water varied from 0.4 (at station-1 and 3
during the southwest monsoon of 2003) to 3.1 mgL-1(at station-5 during the pre-monsoon
of 2003) during the three-year period of studies. The maximum BOD at station-3, and
station-4A never exceeded 1.9 mgL-1 and the minimum at these stations were 0.4 and 0.6
mgL-1 respectively. The lowest seasonal BOD recorded during the three year period was
0.4 to 0.9 mgL-1 at station-3 in the southwest monsoon and the highest seasonal BOD
noted was 1.7 to 3.1 mgL-1 at station-5 in the pre-monsoon. The minimum pre-monsoon
BOD was found at station-2 (1 to 1.3 mgL-1) and the maximum was at station-3 (1.7 to
3.1 mgL-1) followed by station-1 (1.4 to 2.6 mgL-1). Jayaraman et al. (2003) reported that
the BOD variation from 8.3 mgL-1 (pre-monsoon) to 3.84 mgL-1 (northeast monsoon) in
Karamana river, Kerala and attributed the occurrence of high BOD during the pre-
monsoon to the accumulation of dead organic matter in the river during the season. Bhatt
et al. (1999) observed a variation in BOD of 32 mgL-1 (in summer) to 6.5 mgL-1 (in
164

winter) in Taudaha lake, Katmandu, and the gradual decline of BOD from monsoon
followed by winter was attributed to decrease in temperature which in turn retards
microbial activity. In Tawa reservoir, M.P State, India, Kataria et al. (1995) reported
BOD of 1.64 to 5. 54 mgL-1.
Compared to the reports of BOD from Lakes in different parts of India, the
Periyar Lake was found unique with one of the lowest BOD values in all seasons
throughout the period of study. However, a general increase in BOD, especially at
station-5 and 1 must be seriously observed. Even though the maximum BOD noted in the
Lake during this study was well below the minimum limit prescribed according to
Standards, considering the extremely short residence time of water in the Lake, (water is
continuously drawn eastwards) this is not a factor to be neglected. Comparison of BOD
(Tables 87 to 89) showed that fluctuations in it in surface water over years were
insignificant whereas that across the stations were significant during the pre-monsoon
and the northeast monsoon periods. But during the southwest monsoon fluctuations in
BOD were significant over the years and insignificant across the stations. The three-year
average of BOD (Table 90) of surface waters during the different seasons showed that
both the seasonal fluctuations and fluctuations across the stations were significant. BOD
of bottom water (Table 91-93) showed that the values were insignificant both over the
years and across the stations during the pre-monsoon and the southwest monsoons. But
during the northeast monsoon the fluctuations in BOD over the years were significant and
that across the stations were insignificant. The three year average BOD of bottom water
(Table 94) during the different seasons showed that the fluctuations in it across the
stations and over the different seasons were insignificant
5. 7. 2. Chemical Oxygen Demand (COD)
COD is the measure of oxygen consumed during the oxidation of oxidizable organic matter by a strong oxidizing agent. High COD indicates presence of all forms of organic matter, both biodegradable and non-biodegradable and hence the degree of pollution in waters. Singh and Rai (1999) recorded 26.16 mgL-1 (monsoon) to 3.2 mgL-1
(winter) in river Ganga at Varanasi. Adak et al. (2002) found COD of 32 to 44 mgL-1 in river Bramhani and 9.8 to 12 mgL-1 in water of a tube well in Orissa.
165

In Periyar Lake the COD at stations-1 and 5 were found very high, totally different from that of the other stations. Highest COD values were noted at station-5 during all seasons of the entire period of study, which varied from 3.1 (southwest monsoon) to 3.8 mgL-1 (pre-monsoon). The 2nd highest COD values were obtained at station-1, which varied from 2.4 (southwest monsoon of 2004) to 3.7 mgL-1 (pre-monsoon of 2005). The lowest COD values were obtained at station-4B (0.6 mgL-1
during the southwest monsoon to 1.1 mgL-1 during the pre-monsoon). The COD of surface water during different seasons throughout the period of study showed (Tables 95 to 97) that the fluctuations in its value across the stations were significant in all the seasons whereas that over the years were significant only during the southwest monsoon. The three year average value of COD (Table 98) during different seasons showed that the fluctuations in COD over the different seasons were insignificant but that across the stations were significant in all the seasons.
According to the Indian Standards, desirable limit of COD in freshwaters is 2.72 mgL-1, whereas the maximum permissible limit is 100 mgL-1 (BIS, 1992). At both the stations-5 and 1 (representing the outlet) the COD values were found almost above that of the desirable level whereas COD at the inlet (station-4A and 4B) and up to stations-2 the values remained within the desirable limits (0.9 to 2.2 mgL-1). Organic matters of natural as well as anthropogenic inputs were the main contributory factors for the high COD values in natural waters. When compared to existing values of COD, for example that observed in natural waters of Karamana River (COD of 4.8 to 374 mgL-1 (Jayaraman etal., 2003) the COD of Periyar Lake was found normal.
5. 8. Oil and Grease due to boat activity
Oil contains hydrocarbons, sulphur, metals, aliphatics, aromatics, PAHs, PCBs
and the effects of these compounds on aquatic components depend on grades and types,
and the duration it has been in the water (Haile, 2000). Baker (1971) reported a growth
stimulation following oil pollution. Bury (1972) observed the death of many garter
snakes and pond turtle after a diesel oil spill into a Californian stream. In St. Lawrence
River, many frogs and turtles were also found dead following a huge oil spill (Palm,
1979; Alexander et al., 1981). Oil pollution affects all aquatic organisms including
aquatic birds. In birds oil pollution may cause mineral imbalances such as zinc
166

deficiency, which can take the form of immune depression spanning multiple generations
(Beach et al., 1982).
It is well documented that sub lethal exposure of oil is known to increase
susceptibility to disease, increase energy costs, perturb parental behavior and disturb
hormone status in birds (Eppley, 1992). Secondary effects of oil spills have the potential
to reduce short or long term reproductive success, and may affect its longevity. Tertiary
effects may also impact unexposed seabirds if their prey or predator populations are
affected, or if parents are affected (Eppley and Rubega, 1996). Trans-generational
immune suppression could be disastrous to a population and might be important in cases
like that of the Exxon Valdez spill in Alaska where impacted seabird population fail to
completely recover (Warheit et al., 1997). Later studies have suggested that immune
suppression may be present in birds living in oil polluted sites and the effects of immune
system injury are not evident until days or weeks later when mortality occurs; high
mortality rates and poor breeding success of affected birds may be largely due to damage
to the immune system (Briggs et al., 1997).
Werner (1983) reported that an increased oxygen demand by the biological
community, nutrient immobilization, a reduction in plant biomass accumulation and a
heterotrophically dominated ecosystem are the general effect of oil pollution. According
to the same author nutrient immobilization, rather than toxic effects of oil on plants, is the
primary factor leading to the long-term imbalance between autotrophs and heterotrophs
in aquatic systems; moreover, increased rates of oxygen utilization because of the oil
were identified as a potential primary detrimental effect of oil pollution. Animals and
plants may be affected by the physical properties of floating oil, which prevents
respiration, photosynthesis or feeding whereas higher vertebrates, whose coats get
covered in oil, lose buoyancy and insulation, (hypothermia) while the ingestion of oil
may prove toxic. Many components of oil are toxic to organisms. Also a whole range of
sub lethal effects of PCBs in particular are known to be both mutagenic and carcinogenic
in some organisms. The main effect of oil discharges on microorganisms is one of
stimulation and the hydrocarbons provide a food source. Another serious problem is that
very small residues of oily wastes can cause the fish to taste of fuel oil.
167

Loss of amenity value, when a water body is covered in oil can be enormous, and
have huge repercussion on the tourist industry. Gelda and Effler (2002) reported that the
exchange of gasses across the air water interface is important in regulating concentration
of various constituents of ecological and water quality concern. All over the world, if
water is not free of oils, scum, grease and other floating materials it is not generally
accepted as pure water. Bhattacharya et al. (2003) explained the toxicity of different oil
components to freshwater organisms based on his experiments in laboratory microcosms.
Luiselli and Akani (2003) revealed both direct and indirect effects of oil pollution on the
complexity and habitat use of Nigerian freshwater communities of turtles and they also
found that the main direct effect of oil pollution was a considerable reduction in the turtle
specific diversity with 50% of the species being lost after oil spillage. They also noticed
changes in habitat use in one species. The leak out motor oil creates an oil slick on
surface water. It is estimated that the used motor oil causes about 40% of the pollution in
U. S. waterways (Paul, 2004).
Enujiugha and Nwanna (2004) reported that introduction of significant quantities
of oil into the aquatic ecosystem, will cause increase in BOD, reduction in DO
concentration, increased temperature, and pH of the water body; and the resultant effect
of these abnormal shifts in these impact indicators, cause disorders in the physiological
status, and reduction in the immune status of aquatic organisms, which may lead to
mortality. Oil in water changes the property of the feathers of birds, causing them to
become matted and; this leads to a reduction in the birds waterproofing, insulation,
capacity for flight, buoyancy and ability to find food and water (Neva, 2005). According
to a Web Report (2006) if oil enters a slow-moving river it forms a rainbow-coloured
film over the entire surface preventing oxygen from entering the water, and on larger
stretches of water, the oil contaminates the feathers of water birds and when they preen
the oil enters the gut and kills them. According to Vince (2006), unlike major oil spill
that causes problems for a time and can be cleaned up, chronic oil pollution is continuous
and hard to track or clean up because it comes bit by bit and it is has a long-term negative
effect on wildlife. Improperly disposed motor oil also can contaminate the soil, surface
and drinking water. It is possible that they may sustain numerous forms of physiological
168

lesions after petroleum hydrocarbon ingestion, although they may not indicate, if any,
outward signs of debilitation.
All these authors clearly explain the impact of oil pollution on the structure and
function of aquatic ecosystem. Oil and grease were found on surface-water throughout
the Periyar Lake, as constant broken film during the entire period of study. In different
parts of the Lake the seasonal average of oil and grease was found varied from 89 to 2282
mg L-1 during the three-year period of study. Fluctuations in oil and grease content of the
Lake (Tables 155 to 157) over the different years were significant during the southwest
and the northeast monsoon periods. Its fluctuations across the different stations were
significant during all the seasons. Three-year average oil and grease (Table 158) showed
that the fluctuations in it were significant over the different seasons and across the
different stations during all the seasons.
Among the different stations in the Lake, the highest oil content (930–2282 mgL-
1) was found at stations-1 and 5 throughout the period of study, whereas the lowest oil
content was (89-650 mgL-1) at stations-4A and 4B. At station-2 the oil content varied
from 330 to 1600 mgL-1and at station-3, it varied from 265 to 1313 mgL-1. This showed
that the oil content was directly related to intensity of boat activities, which pointed to a
very deleterious anthropogenial influence on the Lake from tourist activities. The impacts
of oil spill was found not restricted to the region of boat activity alone but found extended
throughout the Lake, several hundreds of meters inside, even up to the core of the
sanctuary area. There is no doubt that the wild animals which drink from the surface
waters are continuously receiving a share of the oil film on surface-water at many points
in the Lake. At all the stations the highest oil content was observed during the pre-
monsoon, the lowest amount was found during the northeast monsoon and moderate oil
content was found during the southwest monsoon.
Our observations have shown that it is in the pre-monsoon that many wild animals resort to the direct dependence on the main water body of the Lake. The increasing accumulation of oil in surface-water during this season is therefore a serious threat to the precious wildlife. This factor suggested the need of a thorough monitoring of oil impact in the Lake system including that on the endemic fish life in general and on the precious
169

wildlife in the sanctuary in particular; such studies should look into the impact of oil on the general health and reproductive biology of endangered wildlife including that of elephants, which depend on the Lake water the maximum (Plate-9).
5. 9. Conclusion on physico-chemical parametersIn order to ensure sustainable management and optimum exploitation of the
aquatic resources, it is necessary to set safe limits for the pollution impact indicators. The goal of all types of monitoring programs is protection of the environment and its resources. Data collected from monitoring programs explains existing conditions and helps recording of changes in these conditions over time. In the want of prior knowledge of environmental conditions, monitoring establishes a baseline for future comparisons. The implementation of a biological criterion approach that directly measures biological integrity is, therefore, essential to account the status and trends in freshwater ecosystems. Freshwater ecosystem monitoring programs are usually long-term, data intensive programs that establish points of reference for environmental conditions, and then attempt to document and identify change in these conditions over a long period of time.
Long-term examination of the above water quality parameters explained that, in general, the pre-monsoon is the season at which certain parameters exceeded the limits of standards (oligotrophic to eutrophic) and the monsoon periods, especially the southwest monsoon, is the season of highest fluctuations in quality parameters over the years, and across the different stations in the Lake. Anthropogenic impacts from tourism were evident especially in the oil and grease content, nutrient status, in Periyar Lake. The accumulation of oil and grease is definitely due to careless boat transport associated with tourist visit which could be avoided if necessary precautions were taken. The general increase in nutrient content, pH and other quality parameters at station-5 followed by station-1 indicated that the 2nd major source of anthropogenic impact on the Lake is from the sewage channel of Kumily township joining the Lake at station-5.
5.10. Coli form Bacteria in the Lake
The entry of pathogenic microorganisms into drinking, irrigation and recreational
water resources poses a risk to human health. Difficulties and expenses involved in the
testing for specific pathogens hazardous to humans have generally led to the use of
indicator organisms of enteric origin to estimate the persistence and fate of enteric
170

bacteria in the environment (Crane et al., 1981). Water quality criteria of developed
nations for recreational activities are usually 200 MPN FC/100ml (CCME, 1999). Total
Coli form densities between 69 to 563 is acceptable for non-contact recreational use such
as boating but contact recreation like swimming results in epidemiological outbreaks
(Venkiteswaran and Natarajan, 1987).
In general, the average seasonal MPN fecal Coli form count in Periyar water (all
over 2004 and the pre-monsoon of 2005) ranged from 133/100ml to 2487/100ml, except
once during the pre-monsoon of 2004, when the Coli form count was found zero at
station-4B. Count of E. coli was totally absent at station-4B during all the seasons.
However, presence of fecal Coli form in quite high numbers at this station, during the
southwest and the northeast monsoons revealed that this station is also not safe from
bacterial contamination. However, these bacteria might be of animal origin owing to
heavy wildlife stock in the sanctuary.
E. coli was also common in sufficient numbers (18-467/100 ml) in all other
stations during all seasons in 2004 and pre-monsoon in 2005 (Table 171). Though, fecal
indicators are common in water samples from non agricultural or pristine watersheds,
their long periods of survival especially in the sediments points to the fact that if they are
transported to streams during a season, they may effectively degrade in-stream water
quality for several months. Therefore, control must be implemented to minimize bacterial
transport to natural systems such as Periyar Lake. It is well known that if controls fail
during even one rainfall event, surface water quality could be degraded for several
months (Jamieson et al., 2003).
The main sources of fecal Coli form in the Lake are sewage inflow from Kumily
township into the lake at station-5, direct human sources (tribal fishermen and officials
living inside the systems) and also from animal fecal matter. Animal fecal sources can be
ignored because such Coli form bacteria in general are not hazardous to them (Mubiru et
al., 2000). But the human sources of fecal bacteria are dangerous to wild animals. Since
the MPN count is found quite high, danger of spreading human disease to precious
wildlife in the system cannot be underestimated. Therefore, an intensive monitoring of
171

fecal Coli form based on more water samples was found to be very essential in the Lake
water.
5. 11. Primary Productivity in the Lake
Although extensive studies of primary production have been conducted in Africa
and temperate regions of the world, relatively few studies have been conducted in the
South and Southeast Asia (Talling and Limoalle, 1998). Amarasinghe and Viverberg
(2002) made a detailed study of the primary production in Tessawewa reservoir in
Srilanka.
Primary production in tropical lakes is generally three times higher than in
temperate lakes (Limoalle, 1981; Amarasinghe and Viverberg, 2002). High light intensity
during the day and the much higher temperature contribute to the large difference in
primary productivity between tropical and temperate aquatic systems (Lewis, 1987).
Primary production is often affected by nutrient availability in tropical lakes (Talling and
Lemoalle, 1998). Rain induced high primary productivity has been observed in some
African lakes (Melack, 1979; Thomas et al., 2000). In tropical regions the first rains after
the start of the rainy season usually carry a lot of nutrients to the reservoir. If the
residence time of water is very short, most of these nutrients will not remain long in the
system. GPP and NPP show peaks towards the end of inter monsoonal periods.
There are many purposes for studying primary productivity in lakes. The direct
approach that is receiving greater attention in the recent times is the correlation of fish
yields with primary production (Smith and Swingle, 1938; McConnell, 1963; Hrbacek,
1969; Wolny and Grygievek, 1972; Sreenivasan, 1972; Melack, 1976; McConnell et al.,
1977; Oglesby, 1977; Noreiga-Curtis, 1979). One of the common methods of studying
primary productivity in fresh waters is Winkler titration, which has a sensitivity of 0.15
mg O2/L (Hall and Moll, 1975) to 0.02 mg O2/L (Strickland, 1965). In principle, any
measurement of a water sample in a closed glass bottle, even when carried out in situ,
will not guarantee a primary production value which reflects that of the water of the site
of collection.
172

Algal primary production studies are of paramount interest in understanding the
effect of pollution on the system’s efficiency. Pollution affects the production/respiration
ratio, a proper level of which is very essential for the sustenance of the system. In non-
polluted water, production usually exceeds respiration but in organically polluted
systems, respiration exceeds production and no oxygen is left available for the normal
aerobic bioactivity of the system leading to the impairment of the system. In Periyar
Lake, seasonal average of GPP varied from 0.17 to 0.36 mg L-1 of Oxygen/hr (63.75 to
135. mg C/m3/hr) and respiration varied from 0.08 to 0.24 mg L-1 of Oxygen/hr. During
the three-year monthly study, respiration never exceeded the GPP. The seasonal average
of NPP in the Lake varied from 0.03 to 0.19 mg L-1 of Oxygen/hr. Fluctuations in the
GPP over the years (Tables 159 to 161) were insignificant during all the seasons but the
fluctuations across the different stations were significant during the pre-monsoon and the
southwest monsoon. The fluctuations in the three-year average of GPP (Table 162) were
found significant over the seasons and across the different stations during all the seasons.
The fluctuations in NPP over the different years (Tables 163 to 165) and across the
different stations during all the seasons were insignificant in the Lake. Three-year
average of the NPP during the different seasons (Table 166) showed that fluctuations in
NPP over the different seasons and across the different stations during all the seasons
were insignificant. Fluctuations in CR over the different years (Tables 167 to 169) were
insignificant during all the seasons but fluctuations across the different stations were
insignificant during the northeast and the pre-monsoons. In the southwest monsoon
fluctuations in CR across the different stations were significant. Three-year average of
CR during the different seasons (Table 170) showed that fluctuations in it over the
different seasons and across the different stations were insignificant during all the
seasons. In general, the study of primary productivity showed that this Lake system has a
low and stable primary productivity, characteristic to an oligotrophic system.
5.12. Diversity and dynamics of phytoplankton
5. 12. 1. Relevance of the study
There are a number of reasons to look into the phytoplankton component of a
freshwater system. Phytoplanktons are likely to play a key role in solving some
173

environmental problems, in studying photosynthesis, in understanding aquatic
ecosystems and in the production of useful substances (Kurano and Miyachi, 2004).
Biodiversity of all systems forms a vital resource that needs to be carefully conserved for
our future generation, and planktons are especially important as they form the most
sensitive component of the ecosystem and signal environment disturbances. However,
biodiversity in aquatic ecosystems remains neglected (Gopal, 1997)
Algal studies are very essential for the assessment and abatement of water
pollution. Phytoplankton and its seasonal successions can be a better predictor of long-
term environmental changes in the aquatic systems than the more usual descriptors of
biomass and productivity indices (Moline and Prezelin, 1996). Studies on polluted system
with reference to various pollutants have thrown light on the effectiveness of plankton as
bio-indicators (Joseph and Pillai, 1975). Water pollution causes not only changes in
physical and chemical variables, and also in algal species composition (Mercado, 2003).
Algae are sensitive to pollution or other events and are therefore commonly used for
monitoring environmental contamination (Jiunn-Tzong, 1999). Moreover, algal growth in
tropical inland water constitutes one of the principal causes deteriorating the potable
potentials of water (Sedamkar and Angadi, 2003) and hence a study of it is significant to
assess the quality of freshwater. Algae serve as bio-indicator of water quality and
pollution analysis (Saladia, 1997). Palmer (1969) listed 60 genera and 80 species, tolerant
to organic pollution. Toxic algal blooms and avian botulism are linked (Murphy et al.,
2000). Several methods of assessment of water quality based on algal community
composition exist (Coesel, 2001).
Algal community analysis is important to analyze the trophic status of aquatic
systems. Stoyneva (1998) emphasized that the composition of the phytoplankton is
potentially a better indicator of trophic state of aquatic systems. Cronberg (1999) used
plankton studies to explain the progression of Lake Ringsjon from mesotrophic to
hypertrophic status. Bhade et al. (2001) examined the relationship between Limnology
and eutrophication of Tawa reservoir, M.P State, India. According to Busing (1998)
monthly water chemistry analysis and quantitative analysis of phytoplankton are part of
routine monitoring investigations whereas extensive limnological studies such as
174

seasonality of the phytoplankton community and its species composition are significant
steps to understand, resist and reverse eutrophication in Lakes.
Algal studies have certain significant practical applications such as bio-
manipulations to control pollution. Many believe that accurate understanding of the
factors shaping phytoplankton communities and specific responses of different algal
classes to top down forces is required by lake managers prior to the development of bio-
manipulation protocols for any particular water body since water transparency is directly
related to the type of algal classes present (Bergquist et al., 1985; Carpenter et al., 1987).
Phytoplankton analysis enables us to learn the peculiarities of sensitive
communities in very sensitive environments in general. Changes in phytoplankton
community structure–diversity, dominance and biomass–driven by perturbations caused
by turbulence and environmental variability have been emphasized by Harris (1986).
Reynolds (1997) considers aquatic systems as extremely sensitive to environment
changes and therefore, community organization there is usually fragile and primitive
because the system is frequently disorganized.
Long-term study of phytoplankton component in relation to fluctuations of water
quality parameters is useful in developing and evaluating significant general ecological
ideas. Species composition of phytoplankton communities changes in response to
environmental variation (Naselli-Flores, 2000). Study of aquatic communities and the
factors affecting its stabilities is one of the central challenges of ecology since water
bodies have always been of great importance for mankind as sources of water and food
from fisheries (Kamenir et al., 2004). In Ecology the study of patterns of community
structure, underlying control mechanisms and resilience when subjected to ever-growing
external climatic and anthropogenic impacts are significant from both theoretical and
practical point of view (Odum, 1971; Begon et al., 1996). Temporal variability in the
structure and function of a phytoplankton community is of fundamental importance to
aquatic system metabolism (Calijuri et al., 2002). According to Wani (1998) since
phytoplankton are the primary producers forming the first trophic level of food chain in
lake systems, investigation of the phytoplankton community is very significant in the
monitoring of such systems.
175

Algal studies are also important to understand the degree of anthropogenic
impacts on aquatic systems. Hutchinson (1967) found that the nutrient increase in a lake
due to human activities in the catchments lead to change of lake flora from diatom
assemblage to those of greens and blue greens. Vollenweider et al. (1974) observed that
the effect of anthropogenic influence in a Lake can be traced by the study of
phytoplankton and its production. Similarly, knowledge of the bio-volume and
composition of phytoplankton, which is one of the central themes in the study of pelagic
ecosystem of lakes, is essential to understand the natural variation in the lake ecosystem
(Brettum and Halvorsen, 2004).
Phytoplankton community structure and species type indicate some of the crucial
environmental developments in aquatic systems. Pollution may be measured by either
chemical or biological means (Sweeting, 1994). The role of a bio-indicator has been well
established in aquatic ecosystems. Unlike terrestrial counterparts, aquatic organisms are
more than often solely dependent and immersed in their water bodies (Miller, 1996).
Sampling is costly and sampling frequently with sophisticated equipment, is still more
costly. Therefore measurement of aquatic biota to identify structural or functional
integrity of ecosystems is gaining wide acceptance (Norris and Thoms, 1999). Algal
communities may be good representatives for monitoring general long term succession
processes, as they have distinct ecological requirements and tolerances related to a range
of water quality parameters (Hughs et al., 1992). Water quality changes may affect
community structure, cellular features or bioactivities of the organisms. In tropical and
Mediterranean climates different species of algae dominance indicate eutrophication
(Sullivan et al., 1988; Fernandez-Pinas et al., 1991; Siva, 1996).
The plankton on which whole of aquatic life depends directly or indirectly are
governed by a number of physical, chemical and biological conditions, their interactions,
and tolerance of organisms to variations of these conditions. Limnological studies are
therefore significant in the understanding of aquatic community structure, algal
biodiversity, trophic and pollution status, nature and degree of anthropogenic impacts on
aquatic systems. This information is essential to the conservation of precious water
resources as well as wildlife in relation to such systems. Therefore, quantitative and
qualitative aspects of algal component, and its seasonal dynamics in relation to water
176

quality parameters of Periyar Lake are discussed in detail. Station wise monthly analysis
of total algal count as well as density of different species of algae was carried out to
assess the phytoplankton structure of the whole system. From these station wise monthly
results, average of the total density and density of all the species of algae in the Lake in
the different seasons as well as yearly average of all the stations and the Lake as a whole
for the different years were derived and compared.
5. 12. 2. Seasonal changes in phytoplankton density
Monthly variations in density of phytoplankton of surface waters at different
sampling stations of Periyar Lake were done for three years. From the monthly data
seasonal, annual and the three-year average values for both were calculated Chart-2.
The fluctuations in algal density over the different years (Tables 172 to 174) were
significant during the pre-monsoon and the southwest monsoon only whereas such
fluctuations were insignificant during the northeast monsoon. Similarly fluctuations in
algal density across the different stations were significant during the pre-monsoon and the
northeast monsoon but insignificant during the southwest monsoon. The three-year
average of algal density during the different seasons (Table 175) showed that its
fluctuations over the different seasons and across the different stations were significant
always. The yearly average of total phytoplankton density of the Lake for 2003 was 289
cells L-1and that for 2004 was 423 cells L-1. The average phytoplankton density of the
Lake during the entire study period was 356 cells L-1; average for the pre-monsoon
season was 391 cells L-1, for southwest monsoon was 324 cells L-1and for the northeast
monsoon was 344 cells L-1.
Average seasonal density of phytoplankton of the three year period of study
varied from 250 cells L-1 (southwest monsoon of 2003) to 496 cells L-1 (pre-monsoon of
2004). In general higher phytoplankton density was much more pronounced during the
pre-monsoon than the monsoon periods in the Lake. However, variations between years
were visible in the system. In 2003 the average phytoplankton density of the Lake
remained 289 cells L-1 and 255 cells L-1during the pre-monsoon and 250 cells L-1 during
the southwest monsoon respectively, but it went up to 363 cells L-1in the northeast
monsoon. In 2004 the average phytoplankton density of the Lake was 496 cells L-1during
177

the pre-monsoon, 432 cells L-1during the southwest monsoon and 340 cells L-1during the
northeast monsoon. Since the water level of the Lake fluctuates quite random, changes in
algal densities may not be visible in systems like Periyar.
Comparisons of seasonal algal density of the three years showed quite random
fluctuations. During the three year period of study, the highest algal count noticed was
610 (Table-173) cells L-1in the southwest monsoon of 2004 at station-1 and the lowest
count noticed was 120 cells L-1 at station-4B in the pre-monsoon of 2003. In 2003, the
highest algal density was found in the northeast-monsoon at all the stations except at
station-5. At station-5 the highest algal density of the year was noticed during the pre-
monsoon. The lowest density at most of these stations during the year was in the pre-
monsoon except at stations-1 and 5 where the lowest density of the year was observed in
the southwest monsoon. In 2004 the highest algal density was in the pre-monsoon at all
stations except at station-1, at which the highest density was noticed during the southwest
monsoon. The lowest algal density of 2004 was during the northeast monsoon at all the
stations. Since the northeast monsoon is a continuation of the southwest monsoon and it
continues gradually into the pre-monsoon period and fluctuations in rainfall between
seasons was usual, seasonal changes were not much pronounced. The highest density
season at most of the internal zones was related to a balance between inflow and outflow
which naturally contributed to excess nutrient input or nutrient accumulation in the
system. The point to be noted is that at stations-5 and station-1 the highest algal density
of the Lake varied from general tendencies which may be attributed to external impact of
tourism visible at these stations. The average phytoplankton density of the Lake and
phytoplankton density at different stations suggested that the nutrient impact on the
system in general is low, characteristic to oligotrophic systems which is quite similar to
previous observations in other regions in the Western Ghats such as Murugavel and
Pandian (2000),who reported an yearly mean of total phytoplankton density of 159 L-1 +
23 L-1 in Upper Kodayar lake- a south Indian lake located in the Western Ghats and the
phytoplankton density of 412 L-1 + 155 L-1 in a reservoir situated below.
178

Chart-2.Three-year average density of phytoplankton of the Lake (2002-2005)
0
50
100
150
200
250
300
350
400
450
500
PLS - 1 PLS - 2 PLS - 3 PLS - 4A PLS - 4B PLS - 5
Stations
PremonsonSouthwest monsoonNortheast monson
Den
sity
(No.
/ L
)
5. 12. 3. Phytoplankton community structure
Diversity of algae is an indication of purity and the use of community structure to
assess pollution is conditioned by four assumptions: the natural community will evolve
towards greater species complexity which eventually stabilizes; this process increases the
functional complexity of the system; complex communities are more stable than simple
communities, and pollution stress simplifies a complex community by eliminating the
more sensitive species (Cairns, 1974). Periyar Lake with annual phytoplankton diversity
of 69 species may be considered as a sufficiently complex community, characteristic to
systems of less pollution stress. The fluctuations in diversity of species at certain stations
may be attributed to the impact of anthropogenial influence.
Komarkova (1998) observed that indices of phytoplankton diversity are weak
indicators of trophic status and factors which influence diversity are seldom governed by
trophic state. According to Bomans and Condie (1998) Physical environment (light
intensity and temperature) influences the distribution of algal populations in lakes and
179

rivers. The principal influences on phytoplankton assemblages in an aquatic ecosystem
include nutrients (Mortensen et al., 1992), Carbon dioxide (Shapiro, 1997), light
availability, and composition and abundance of zooplankton (Carpenter and Kitchell,
1993). However, the factors influencing phytoplankton assemblages in an aquatic system
are related to its trophic status; nutrient availability in oligotrophic environments,
zooplankton grazing in mesotrophic systems and underwater light climate and carbon
dioxide availability in eutrophic systems (Naselli-Flores, 2000). Seasonal changes and
station-wise fluctuations give much more explanation of the ecological tendencies of
phytoplankton community in the Lake.
During the pre-monsoon a total of 49 species of phytoplankton were identified of
which 24 were identified up to the species level and the rest up to the genus level only. In
this season, phytoplankton of the Lake belonged to four classes – the Cyanophyceae (4
species belonging to 4 genera - 8% of the total diversity; 10% density) Euglenophyceae
(5 species belonging to 4 genera, 10% of the total diversity; 4% density),
Bacillariophyceae (19 species belonging to 9 genera – 39% of total diversity; 38%
density) and the Chlorophyceae (21species belonging to 11 genera- 43% of total
diversity; 48% density). Among 21 species of Chlorophyceae, 12 species belonging to 8
genera (57% of Chlorophyceae or 24% of total diversity; 23% density) were
Chlorococcales and 9 species belonging to 4 genera (43% of Chlorophyceae or 18 % of
total diversity; 25% density) were Desmids. Station-wise analysis showed that at all the
stations except at station-4B Chlorophyta formed the dominant group (43 – 60%); at
station-4B the Diatoms formed the major group of algae (58%). The highest percentage
(60%) of Chlorophyta was found at station-5 and the lowest percentage of Chlorophyta
was found at station-4B (38%) (Chart-3).
180
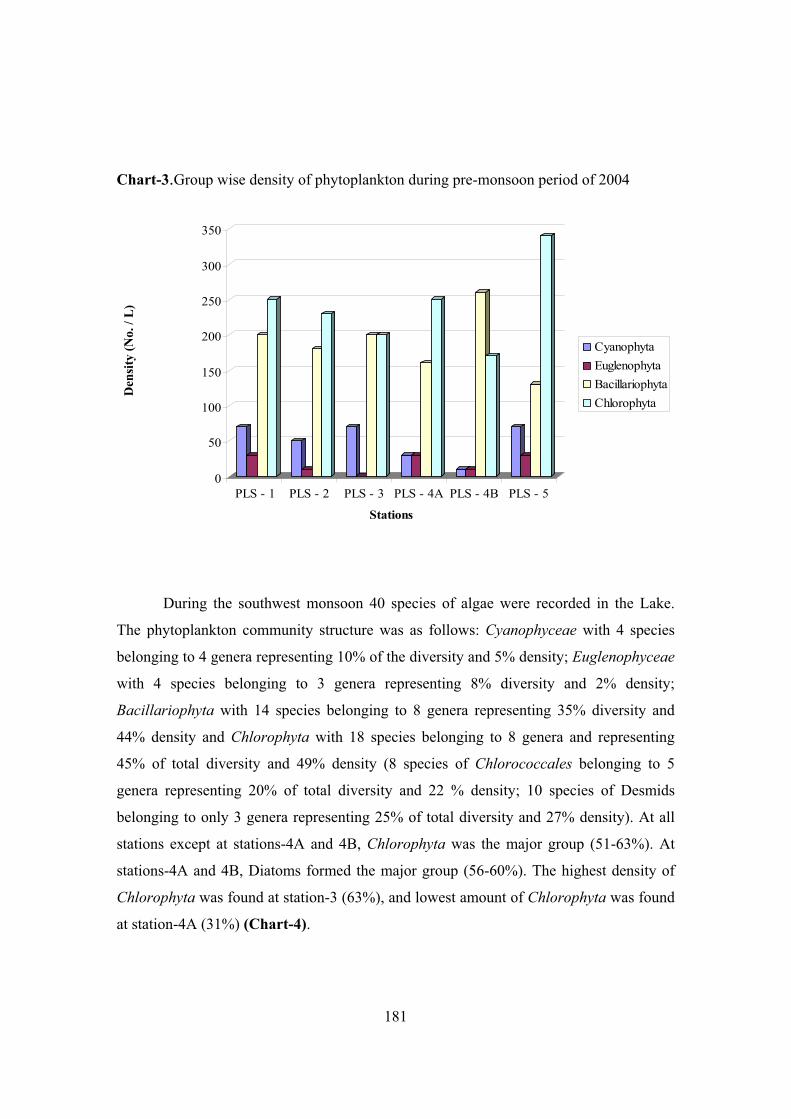
Chart-3.Group wise density of phytoplankton during pre-monsoon period of 2004
0
50
100
150
200
250
300
350
PLS - 1 PLS - 2 PLS - 3 PLS - 4A PLS - 4B PLS - 5
Stations
CyanophytaEuglenophytaBacillariophytaChlorophyta
Den
sity
(No.
/ L
)
During the southwest monsoon 40 species of algae were recorded in the Lake.
The phytoplankton community structure was as follows: Cyanophyceae with 4 species
belonging to 4 genera representing 10% of the diversity and 5% density; Euglenophyceae
with 4 species belonging to 3 genera representing 8% diversity and 2% density;
Bacillariophyta with 14 species belonging to 8 genera representing 35% diversity and
44% density and Chlorophyta with 18 species belonging to 8 genera and representing
45% of total diversity and 49% density (8 species of Chlorococcales belonging to 5
genera representing 20% of total diversity and 22 % density; 10 species of Desmids
belonging to only 3 genera representing 25% of total diversity and 27% density). At all
stations except at stations-4A and 4B, Chlorophyta was the major group (51-63%). At
stations-4A and 4B, Diatoms formed the major group (56-60%). The highest density of
Chlorophyta was found at station-3 (63%), and lowest amount of Chlorophyta was found
at station-4A (31%) (Chart-4).
181

Chart-4. Group wise density of phytoplankton during southwest monsoon period of 2004
0
50
100
150
200
250
300
350
PLS - 1 PLS - 2 PLS - 3 PLS - 4A PLS - 4B PLS - 5
Stations
CyanophytaEuglenophytaBacillariophytaChlorophytaD
ensi
ty(N
o. /
L)
In the northeast monsoon there were about 42 species of phytoplankton in the
Lake. The phytoplankton community of the season included Cyanophyta with 5 species
belonging to just 2 genera representing 10% of diversity and 12% density; Euglenophyta
with 5 species belonging to 3 genera representing 12% diversity and 5% density;
Bacillariophyta with 14 species belonging to 8 genera; and Chlorophyta with 18 species
belonging to 8 (Chlorococcales with 8 species belonging to 5 genera; Desmids with 10
species belonging to 3 genera. At all the stations except at station-4B Chlorophyta
formed the major group (42-65%). At station-4B, Diatoms formed the major group
(70%). The highest density of Chlorophyta during this season was found at station-4A
(65%) and the lowest density of Chlorophyta was at station-4B (22%) (Chart-5).
182

Chart-5.Group wise density of phytoplankton during northeast monsoon of 2004
0
20
40
60
80
100
120
140
160
Den
sity
(No.
/ L
)
Cyanophyta
Euglenophyta
Bacillariophyta
PLS-1 PLS-2 PLS-3 PLS-4A PLS-4B PLS-5
Stations
Throughout the seasons Chlorophyta dominated at all the stations except station-4B and
4A in the Lake. At station-4B the dominant group was always the Bacillariophyta
whereas at station 4A, only during the southwest monsoon the Chlorophyta was
superceded by Diatoms. But during the northeast monsoon this station showed the
highest density of Chlorophyta in the Lake. In general at station-5, the percentage of
Chlorophyta was around 50% or above throughout the study period. Moreover, density of
Cyanophyta was also more than 10% at this station during most of the study period.
Another significant tendency noticed was the dominance of Desmids over
Chlorococcales among Chlorophyta throughout the seasons at most of the stations.
Wani (1998) reported about 89 species of phytoplankton in Trigamsar Lake,
Kashmir and the species structure described is comparable to that of Periyar Lake. The
Compound Quotient (Naganandini and Hosmani, 1998) i.e., total number of species of
Blue greens + Diatoms + Chlorococcales + Euglenophyta divided by the number of
Desmids for Periyar Lake was 4.9 which were close to upper limit of weak eutrophic
system.
Station wise comparison of seasonal changes in diversity of different groups
revealed that the changes at the different stations were random. This agrees with the
183

observations of Naselli-Flores (2000) that environments of different trophic states may
share very similar phytoplankton assemblages and conversely environments which were
ranked in the same trophic category may differ strongly in the structure of their
assemblages. However, the presence and dominance of certain groups and species at
different stations throughout the period of study showed certain significant ecological
tendencies of the Lake. Seasonal changes may favor particular species and such species
may dominate the ecosystem at a specific time of the year (Patrick, 1970).
5. 12. 4. Chlorophyta in the Lake
Annual average density of Chlorophyta in the Lake was 48%; seasonal average
also did not vary much and remained 48-49% throughout the seasons. Among
Chlorophyta, density percentage of Desmids was always slightly higher than that of
Chlorococcales at most of the stations; in the pre-monsoon the percentage of
Chlorococcales and Desmids were 23% and 25%, and during the southwest monsoon the
percentage of them were 22% and 27%. But there was a significant increase in density
percentage of Desmids (29%) over Chlorococcales (20%) during the northeast monsoon.
Desmids are hardly or not to be expected in polluted waters and the reason for the
absence of Desmids in polluted waters is attributed to the fact that under nutrient-rich
conditions they cannot grow as fast as other algae, so lose in competition. However,
station-wise analysis showed exceptional variations in density percentage of the two
groups of Chlorophyta at station-4B where the Desmids were just 11%, whereas the
Chlorococcales were around 20 %. This may be due to consistently low water level in
the station which contributed more access to nutrients in the bottom sediments.
Chlococcalean algae are known to prefer inorganic nutrients providing alkaline pH and
moderately high temperature (Sharma et al., 1999). Philipose (1967) found that
Chlorococcales thrived well in water rich in NO3 than phosphates. Sharma et al. (1999)
reported that Chlorococcales were dominating plankton of the lake Jai Mahal, Jaipur,
Rajastan, where they are found mixed with Desmids, Diatoms and Blue-greens and
according to the author Chlorococcales thrive well in hard water and rich growth of
Chlorococcalean genera is a sign of pollution. Species of Scenedesmus (Busing, 1998)
are well known for their adaptability to organic pollution. Large number of species and
184

the greater quantities of Chlorococcal green algae present in summer are indicative of
eutrophic ecosystems (Rott, 1984). Seasonal and station wise fluctuations in Chlorophyta
revealed that developing tendencies of trophic changes in the Lake require further long
term specific monitoring of the same.
There were fluctuations in the seasonal average density of Chlorophyta at
stations-3 and 4A; at station-3 the highest density percentage of Chlorophyta (63%) was
noticed in the southwest monsoon, followed by the northeast monsoon (61%) and the pre-
monsoon (43%). At station-4A the density percentage of Chlorophyta was found
maximum (65%) during the northeast monsoon followed by the pre-monsoon (54%) and
the southwest monsoon (31%). At station-5 the highest Chlorophyta density percentage
noticed was (60%) during the pre-monsoon followed by the southwest monsoon (51%)
and the northeast monsoon (48%). Density percentage of Chlorophyta was lowest at
station-4B during all the three seasons. The maximum of Chlorophyta was 41 % during
the southwest monsoon followed by 38 % during the pre-monsoon and 26% during the
northeast monsoon. The highest Chlorophyta density percentage noticed in the Lake was
(65%) at station-4A during the northeast monsoon and the lowest noticed was (26%) at
station-4B during the northeast monsoon.
Among the seasons, the pre-monsoon showed highest diversity of Chlorophyta
(21 species), whereas during the northeast and the southwest monsoons there were 18
species of Chlorophyta and 17 species during northeast monsoon in the Lake.
Closteriopsis longissima (of the order Chlorococcales) was one of the species of
Chlorophyta found at all the stations of the Lake throughout the three seasons.
Closterium parvulum was found at all the stations during the southwest monsoon, but the
species was found absent at station-4B during the northeast monsoon season, and also
found absent at station-1 and 5 during the pre-monsoon. Staurastrum leptocladium and
Staurastrum paradoxum were the Desmids found at all stations during the pre-monsoon
and southwest monsoons. Staurastrum paradoxum was absent during northeast monsoon
at all the stations. However, certain other species of the same genus–Staurastrum
chaetoceras was observed in the Lake at all stations except at station-4B during the
season. Selenastrum westii was found only at station-4B during the pre-monsoon whereas
it was found at stations-1 and 2 during the northeast monsoon.
185

The dominance of Chlorophyta, both density wise and diversity wise suggested
organic pollution because certain authors suggested that in cold climates an increase in
organic load commonly leads to a shift in the ecosystem from Diatom-dominated flora to
green algae-dominated flora (Patrick, 1970). Hutchinson (1967) also had the view that the
nutrient increase in a lake due to human activities in the catchments lead to change of
lake flora from Diatom assemblage to those of greens and blue greens. However, Rojo
and Rodriguez (1994) were of the view that while Diatoms are important in temperate
rivers; tropical rivers were mainly dominated by Chlorophyceae. Pediastrum,
Staurastrum, Cosmarium, Euastrum were all species of Chlorophyceae found in the
Lake, also reported in other south Indian lakes. However, typical species of nutrient rich
waters such as Mougeotia, Oocystis, Ulothrix, Spirogyra, Micractinium (Sreenivasan et
al., 1997) were not found in most part of the Periyar Lake. The algal community
structure thus suggested that the system is still under natural control as was evidenced by
the dominance of sensitive species. However, the general occurrence of certain pollution
tolerant species such as Selenestrum (Alam et al., 1996) and Scenedesmus (Tewari and
Srivastava, 2004), and the rare occurrence of Spirogyra, Ulothrix, Oedogonium at some
parts of the Lake is a tendency to be monitored intensively.
Dominance of Desmids in the Lake was a good sign, but this observation needs
further verifications and continuous monitoring. Study of Desmid flora would be useful
in managing the pristine quality of this Lake. Sufficient literature exists towards this
reason. Desmids in general indicate good quality of water (Hosmani et al., 2002). The
establishment of the Diatom-Desmid assemblage is typical for mesotrophic ecosystems
(Reynolds, 1980) and absence of Desmids is an indication of heavy pollution of water
(Hosmani et al., 2002). Among aquatic microbes, Desmids lend themselves particularly
well for the assessment of water quality and nature conservation value and the algae
indicate a tendency of oligotrophication and acidification of aquatic habitat (Coesel,
2003). Low nutrient contents, low EC and a slightly acid pH are known to promote an
optimal development of the Desmid flora (Coesel, 2001). According to Coesel (1997)
Desmids are ecologically highly sensitive microorganisms and is a useful tool in aquatic
conservation management especially in those cases where macro-organisms fail.
186

Traditionally Desmids are associated with oligotrophic fresh waters (Hutchinson,
1967). But when the biomass is taken into account, Desmids play only a minor role in the
composition of plankton (Rawson, 1956; Rosen, 1981). Desmids of oligotrophic waters
may be an important food source for herbivorous fish. The food chain relations of
endemic and endangered species of fishes may include specific phytoplankton species.
Therefore, it is important to work out the food chain relations of such endemic and
endangered species in Periyar Lake. The Lake with sufficient representation of
Cosmarium, Closterium, and Staurasturm, offers a typical system for depth study of
Desmids and their interrelationships with endemic fish fauna. Moreover, the dominance
of Desmids over Chlorococcales in the Lake may be considered as a positive biological
sign to suggest that the trophic characteristics of the system are still within control.
(Plate-7 & 8)
5. 12. 5. Bacillariophyta (Diatoms) in the Lake It is well known that a combination of physical, chemical and biological factors
determine the distribution of the Diatom communities in Lakes (Fabricus et al., 2003).
Bacillariophyta is the major algae with the highest density at station-4B during all the
seasons, whereas it was the second major algal species at other stations during all the
seasons. At station-1 the Diatom density percentage was 36% during the pre-monsoon
and 37 during the northeast monsoon, and it was 34% during the southwest monsoon. At
station-2 the Diatom density percentage was 43% during the southwest monsoon
followed by 38% during the pre-monsoon, and 32% in the northeast monsoon. At station-
3 the Diatom density percentage was highest (43%) during the pre-monsoon followed by
34% during the southwest monsoon, and 18% during the northeast monsoon. At station-
4A there was an extra ordinary increase of Diatom density percentage (to about 61%)
during the southwest monsoon, followed by 34% during the pre-monsoon, and an extra
ordinary decline in Diatom percentage to about 18% during the northeast monsoon.
Density percentage of Diatoms was 38% (southwest monsoon), 23% (pre-monsoon) and
32% (northeast monsoon) at station-5. Compared to the other stations, the Diatom density
percentage in general remained very high at station-4B–70% during the northeast
monsoon, 58 % during the pre-monsoon and 56 % during the southwest monsoon. These
observations agree with the findings of Burton et al. (1990) who found that the higher
187

Diatom densities were detected in the river system with the low N and P levels in the
stream water combined with alkaline pH. In Periyar Lake the pH tended to be alkaline
throughout the study period indicating the existence of a buffer system. According to
Owen et al. (2004) pH, EC and NO3 appear to be particularly closely related to Diatom
development and some species show good potential as indicators of habitat, pH, EC, and
temperature. Diatoms need at least 2 micro mol. silicate/L for successful development
(Escavarage and Prins, 2002). Diatoms have high tolerance capacity to varied changes in
the water (Hosmani et al., 2002). Medium nutrient content perhaps may be the factor that
limits the growth and the slightly alkaline pH might be one of the factors which favored
the species of Diatoms in Periyar Lake.
The highest density percentage of Diatoms noticed in the lake was 70% at station-
4B during the northeast monsoon and the lowest of Diatom reported (17%) was at
station-4A during the same season. Diatoms are stationary and are therefore less able to
avoid harmful conditions, and therefore the fluctuations in Diatom percentage at various
stations during the different seasons indicated the local and seasonal impact of significant
changes in water quality conditions in the Lake.
Diatoms are ecologically diverse and colonize virtually all microhabitats in
marine and freshwater. Dixit et al. (1992) considered Diatoms as a good tool for
environmental monitoring because indices based on Diatom composition give more
accurate and valid predictions as they react directly to pollutants. A variety of indices
like, Commission for Economical Community Index–CEC (Descy and Coste, 1991),
Overall Practical Index (Lenoir and Coste, 1996), Diatom Assemblage Index for organic
pollution –D Alpo (Watanabe et al., 1986) and Trophic Diatom Index (Kelly and
Whitton, 1995) use Diatoms as bio-indicators. Diatoms can provide valuable information
for monitoring rivers, particularly on organic pollution (Sladecek, 1986).
Bacillariophyta (Diatoms) was the second most diverse group of algae in the Lake
with a total of about 26 species belonging to 11 genera representing 38% of the total
phytoplankton diversity of the Lake. Among the seasons, pre-monsoon showed the
maximum species diversity of 19 whereas during the southwest and the northeast
monsoons there were 14 species each. During the pre-monsoon the highest diversity of
188

Bacillariophyta was at station-3 with 11 species, but during the northeast monsoon this
station showed low diversity. During the southwest and the northeast monsoon periods
the diversity of station-2 and 1 was 8-9 species, which was higher than that at other
stations. Melosira granulata was the Diatom found at all the stations in all the seasons
throughout the period of study. Anand (2000) reported the dominance of species of
Melosira varians in a stream in Jammu and Kashmir, India, and noticed its affinity
towards clear, fast moving water with low water temperature.
Cyclotella meneghiniana, one of the universally known pollution tolerant Diatom
(Unni and Pawar, 2000) was present at all the stations during the northeast and in the
southwest monsoon also it was found at all the stations, except at station-4B. However
during the pre-monsoon it was found at station-2 and 3 alone. Another species of
Cyclotella and Melosira were found at all stations during the southwest monsoon.
Cocconies placentula was found at station-3 alone during the pre-monsoon and at station-
5 alone during the southwest monsoon. Stauronies anceps was found at stations-4A and
4B alone during the southwest monsoon, but at stations-1 and 2 alone during northeast
monsoon. Nitzchia palea, which is also universally considered as pollution tolerant
species (Unni and Pawar, 2000) was found in the southwest monsoon at station-2 alone.
According to Sladecek (1973), Nitzchia palea is an indicator Diatom taxon of alpha
mesosaprobic system. Navicula and Pinnularia were the species mostly found at stations-
1and 5 during all the seasons throughout the study. (Plate-6)
5. 12. 6. Cyanophyta (Blue-green Algae) in the Lake
Specific investigation of Cyanophyta in Lake waters is very significant because
many authors have pointed out that toxin producing Cyanobacteria in lakes and
reservoirs form a threat to humans (Carmichael, 1996; Chorus and Bartram, 1999; Codd
et al., 1999; Chorus 2001), bird and fish as well as various other forms of aquatic life
(Lampert, 1981; Kotak et al., 1996; Pflugmacher et al., 1998). ‘Microcystins’ are potent
liver toxins and tumor promoters from Cyanobacteria. They are produced by several
common freshwater Cyanobacteria including Microcystis, Anabaena and Planktothrix.
Toxic Cyanobacteria are very abundant in large number of Lakes, causing a potential
threat to humans and animals (Chorus and Bartram, 1999).
189

Density wise, Cyanophyta formed a minor group of phytoplankton in the Lake.
Annual average density of Cyanophyta in the Lake was 9% and there was marked
fluctuations in the percentage of Cyanophyta during different seasons. The maximum
percentage density of Cyanophyta was noticed during northeast monsoon in the Lake and
the minimum was during the southwest monsoon. The percentage of density of
Cyanophyta was quite low (3-8%) at all the stations during the southwest monsoon. The
density percentage of Cyanophyta during the pre-monsoon was 10%. There were
fluctuations in the percentage of this group between the different stations during all the
three seasons. In general, during most of the seasons, station-5 (outlet) showed a higher
percentage density of Blue-greens than at the other stations and station-4B (the major
inlet) showed a lower percentage density than the others. The highest density percentage
of Blue-greens (15 %) noticed was at station-5 and the lowest percentage (2%) noticed
was at station-4B during the pre-monsoon. Water turbulence - different degree,
magnitudes and durations - is a determining factor in phytoplankton growth, especially in
Cyanophyceae dominance (Reynolds and Walsby, 1975). Lakes that become eutrophied
primarily because of an excess of P are typically characterized by a shift towards the
dominance of phytoplankton by Cyanobacteria including noxious forms several of which
are toxin producers. Since the influence of Cyanobacteria in Periyar Lake was not much,
the role of P may be ignored as a growth stimulator in it.
In Periyar Lake, Cyanophyta group was represented by only 7 species belonging
to 4 genera representing 10 % of total diversity. All throughout the seasons the species
diversity was 4 or 5. During the pre-monsoon and northeast monsoon, Microcystis
aeruginosa was found at all the stations except at station-4B. According to Reynolds
(1988), Microcystis aeruginosa is an S-strategist, which is stress tolerant having low
growth rate, low metabolic activity, high nutrient storage capacity with enhanced
resistance to sinking and grazing losses and apparently characteristic of waters with
phosphate oscillations, is a specialist in phosphate storage and efficient in regulating its
density. According to Kilham and Hecky 1988, and Kromkamp et al. (1992) this species
requires high temperatures, tolerates low light intensity and is not subject to predation by
herbivores. According to Brunberg and Blomqvist (2002) Microcystis is a widely
distributed organism, which dominates the phytoplankton community in nutrient rich
190

lakes. Microcystis aeruginosa is one of the main microcystin producers of lakes
(Lindholm et al., 2003). Hence presence of this alga in the lake poses a threat to the
wildlife in the sanctuary; the degree to which they may be affected by this alga must
therefore be well monitored.
Station wise analysis showed that the lowest species diversity and density of
Cyanophyta was observed at station-4B (the inlet), whereas the maximum diversity and
density of the group was found at stations-1, 2, 3 and 5. Blooms of Cyanobacteria in
fresh water ecosystems are attributed to nutrients, particularly to phosphorus enrichment.
Increased detection of ‘cyano-toxins’ in water bodies generates a complex challenge for
water resource managers all over the world (Johnston and Jacoby, 2003). Other factors
are high water temperature, stable water column, low light availability, high pH, low
dissolved CO2, and low total N to P ratio - TN: P ratio (Welch, 1992; Pearl, 1998;
Hyenstrand et al., 1998). Impact of Cyanophyceae are unsightly surface scum, decreased
water column transparency, unpalatable drinking water with noxious odour and some
produce toxins (Carmichael, 1996, Chorus, 2001) and ‘cyanotoxins’ in general are
hepato-toxins which are known tumor promoters and have been associated with high
rates of primary liver cancer in people drinking water with high concentrations of
microcystins (Yu, 1989). Hence, though density wise insignificant, the presence of the
species such as Microcystis in Periyar Lake is a definite pollution signal. (Plate-5)
5. 12. 7. Euglenophyta in the Lake Euglenophyta was the group represented in the lowest density percentage in the
Lake. No member of this group was observed at stations-4B during the southwest and the
northeast monsoons, at station-3 during the pre-monsoon and the southwest monsoon,
and at station-2 during the southwest monsoon. The annual average density percentage of
this group in the Lake was just 4%. The highest percentage of Euglenophyta noticed in
the Lake was 7% at station-1 during the southwest monsoon and at station-3 during the
northeast monsoon. Though temperature conditions and pH of the Lake, in general, are
slightly favorable to Euglenophyta, an excess growth of this group could not be observed
in any part of the Lake during the study period.
191

There were only 6 species of Euglenophyta belonging to 4 genera representing
just 9% of the total diversity of species in the Lake. Three species of Euglena were found
in the Lake of which Euglena viridis and Euglena acus were the most common in the
three seasons. One or both of these species was always present at stations-1 and 5 during
the entire seasons throughout the study period. Dinobryon was found at station-5 in the
pre-monsoon alone, whereas it was observed at station-1 during the southwest and the
northeast monsoon periods. Phacus acuminatus was found in the pre-monsoon at station-
1and 5 alone. Trachelomonas armata was found at stations-2 and 4A during the pre-
monsoon, but found at station-1 alone during the southwest monsoon. It was found at
stations-4A and 5 during the northeast monsoon.
However, presence of Euglena and Phacus, especially at station-5 and station-1
was a simple and direct indication of higher pollution load at these sites in the system,
because both these species, in general, are considered to be dominant tolerant genera of
polluted ponds (Alam et al., 1996). However, Tiwari and Srivastava (2004) found
Euglena and Phacus in industrially polluted and non polluted waters in North India and
also observed that they are species with greater ecological amplitude to their occurrence
in aquatic systems exhibiting varying levels of pollution load. Sreenivasan et al. (1997)
reported these genera in a shallow polluted lake in TN. (Plate-4)
5.13. Periphyton
The periphyton is a thin bio-derm in the interface between aquatic substrata and
the surrounding water, which are important autotrophic component of aquatic ecosystems
(Moschini-Carlos et al., 2001). Accounting of periphyton in aquatic ecosystems is done
for understanding complex biological chain of events in them (Chellappa, 1989). Diatoms
form the bulk of the periphytic communities in most of the streams (Patrick et al., 1954).
Periphyton forms a dominant ecological feature of oligotrophic lakes. It provides habitat
and food for invertebrates and fishes, and changes in the structure and function of this
assemblage may affect several other processes in wetlands. Periphyton provides one of
the earliest reliable indicators of eutrophication (Browder et al., 1994; McCormick et al.,
1998). Species diversity of periphyton increases with increased nutrient content and
diversity of chemical environment and decrease of its number in winter over that of
192

summer is attributed to decreased sunlight and low water temperature of the season
(Ennis and Albright, 1982). The rate of activity and growth of periphytic algae depends
on substrata as well as physico-chemical conditions of water and on morphometric
characteristics of aquatic systems (Wetzel, 1983). The substrate characteristics play a key
role in periphyton development, and the living organisms in the sediment represent a
substantial nutrient source for them (Kahlert and Pettersson, 2002).In tropical waters
many organic and inorganic nutrients originate from anthropogenic activities known to
contribute high or low diversity of micro algal species (Chellappa, 1990). In aquatic
systems periphytic community is known to be a significant contributor to primary
productivity, but is also a controller of the nutrient fluxes (Wetzel, 1990; Engle and
Melack, 1993).
Periphyton plays key role in nutrient storage (McCormick et al., 1998) in lakes.
Loss of periphyton assemblage provides an early indication that P assimilative capacity
of wetlands has been exceeded and that the integrity of ecosystem is being degraded
(McCormick et al., 2001). Water quality and light determine periphyton bio-film
development in rivers and organic or inorganic toxicants are likely show a widely
different interaction with such bio-films (Guasch et al., 2003). The biomass and
productivity of the periphytic community are controlled mainly by hydrological regime
(fluctuation in water level) or physical parameters such as water transparency and
conductivity or chemical variables such as alkalinity, ammonium and silica (Moschini-
Carlos, 2001). Among physico-chemical parameters TDS and temperature mostly control
spatial and temporal pattern of periphyton, but in general, the periphyton distribution is
controlled by complex of factors including shading, current velocity and biotic
interactions (Chessman, 1985).
In order to make the present investigation holistic, the periphyton characteristics
of Periyar Lake, preliminary investigation of them were also carried out at two sites–
station-4A (one of the major inlets) and station-1 (the only outlet). This study was carried
out during all the seasons of the year 2004 only. Altogether 15 species of periphyton
algae were recorded in the Lake of which 6 were Chlorophyceae, 5 were Diatoms, 2 were
Cyanophyta and 2 were Euglenophyta. Moore (1980) reported about 48 species of
attached plankton in Great Bear Lake, compared to which the species diversity of
193

periphyton community at Periyar Lake was very low. In the literature there are diverse
views on the interrelationships of periphyton community and nutrient status of lakes.
Many studies indicate that the relationship between diversity and environmental quality is
very complex (Podani, 1992). Maznah and Mansor (2002) observed more diversity at
polluted sites than clean sites in a river basin in Malaysia. According to Ho and Peng
(1997) high diversity indices cannot be interpreted as being a reflection of high quality
habitat. Archibald (1990) stated that to accurately estimate water quality using species
diversity, it is necessary to define precisely the species that compose the community. Cox
(1988) is of the view that to explain such relationships, thorough knowledge of the
autecologies of the algal species is essential. According to (Chellappa, 2001) the main
effect of nutrient enrichment on aquatic epiphytic algae is generally a decrease in overall
species richness. Morgan (1987) observed that with increase in nitrate some species tend
to dominate the community or an increase in species richness occurs in aquatic systems.
Quantitative analysis of Periphyton community in the lake (Chart-6) showed that
Chlorophyta dominated at station-1 (46% density) during the pre-monsoon, but during
the southwest and northeast monsoons, Diatoms was the dominant group of periphyton
community at this station. At station 4-A, Diatoms were the dominant group during the
pre-monsoon and the northeast monsoon, whereas in the southwest monsoon Diatoms
and Chlorophyta were almost equal (20-27%) and Cyanophyta was the most dominant
group (53%). Euglenophyta were found at station-1 throughout the seasons where as it
was absent at station-4A. In station-4A, Diatoms were higher than Chlorophyta during all
the seasons. But at station-1, except in the northeast monsoon season, Chlorophyta
dominated the benthic community. In the northeast monsoon, Diatoms dominated this
station as well. The relative abundance and differences in specific sensitivity of certain
Diatom species to pollution are reliable and useful means in assessing the degree of
pollution in river systems, but diversity of diatom associations is not directly related to
water quality (Maznah and Mansor, 2002).
Among Chlorophyta filamentous species such as Oedogonium and Spirogyra
were found at sation-1 only. Melosira granulata was the Diatom found at both stations
during all the seasons. Staurastrum paradoxum, Cosmarium contractum and Closterium
sp. was the species of green algae found at both the stations throughout the seasons. Most
194

of the Diatoms such as Navicula sp. Pinnularia sp and Cyclotella sp. were found at both
the stations throughout the seasons. Cyclotella sp are characteristic species of
oligotrophic waters (Hutchinson, 1967, Moore 1978). Synedra sp. was found at station-1
alone, especially during the pre-monsoon and the southwest monsoon alone. Ecologist
generally accepts the view that certain groups of species can be used as bio-indicators
when their precise autecologies are known. Taxonomic indicators based on Diatom
assemblages provide a useful estimate of ecosystem change and were recommended as a
standard mean in biological monitoring (McCormick and Cairns, 1994). Nitzchia palea
one of most tolerant species and a strong indicator of polluted water (Lange-Bertalot,
1979) are dominant at polluted sites (Maznah and Mansor, 2002). In Periyar Lake,
Nitzchia palea was found among phytoplankton, but they were not encountered among
the periphytic community, which indicated that the species did not favor periphytic
habitat in the Lake.
Chart-6. Percentage distribution of different groups of periphyton in PLS-1 & 4A during three different seasons (pre-monsoon, southwest monsoon and northeast monsoon)- 2004.
0
10
20
30
40
50
60
PM-PLS1
PM-PLS4A
SWM-PLS1
SWM-PLS4A
NEM-PLS1
NEM-PLS4A
PLS 1 & 4A during different seasons
CyanophytaEuglenophytaBacillariophytaChlorophyta
Perc
enta
ge w
ise
dist
ribu
tion
of
per
iphy
ton
Pollution tolerant species thrive at sites with high levels of nutrients and organic
pollution (Kelly et al., 1995). They can live at low oxygen levels and are resistant to
putrescent substances (Mason, 1996). Thus in general the periphytic community also
explains the oligotrophic nature of the Lake. However, the presence of some pollution
tolerant species belonging to Chlorophyta, Diatoms, Cyanophyta and Blue-greens among
periphytic component of the alga suggested the necessity of a detailed and long term
195

monitoring of the hydrobiology of the Lake as a means to protect it from catastrophic
degeneration due to anthropogenic impacts.
5. 14. Benthon
Benthic algae play an important role in lake ecosystems (Wetzel, 1983). The
trophic level of water plays an important role in governing the structure of benthic algal
assemblages (Vilbaste and Tru, 2003). Benthic flora may form a buffer for the surface
populations and the mechanism by which these algae survive in the anaerobic zone of the
sediment is not yet understood, and it is assumed that the survival properties depend on
depressed metabolic activity (Hunding, 1971). Hakanson and Boulion (2004) emphasized
the urgent need of researches on benthic algae in lake ecosystems. Therefore we included
the preliminaries of the benthic community structure also in our investigations. Benthic
species were identified monthly and the three seasonal characteristics of the community
structure at three different stations–station-1, station-4A and 4B were calculated for the
year 2004.
In the pre-monsoon, altogether 41 species of algae (17 species of diatoms, 15
species of Chlorophyceae, 7 species of Cyanophyceae and 2 species of Euglenophyceae)
were identified in station-1. The diversity of benthic algae got reduced to 32 species (18
species of Diatoms, 12 species of Chlorophyceae and 1 species each of Cyanophyceae
and Euglenophyceae) at station-4A. At station 4B, only 29 species of algae (18 species of
Diatoms and 11 species of Chlorophyceae) were noticed. Cyanophyceae and
Euglenophyceae were completely absent (Chart-7).
In the southwest monsoon also there were 41 species of benthic algae at station-1,
but only 30 species at station- 4A and 22 species at station-4B. In the northeast monsoon
the total algal species at station-1 were 31, at station-4A 21 and at station-4B only 15
species. Thus there was a visible reduction in the diversity of benthic algae during the
northeast monsoon in the Lake (Chart-8).
During the pre-monsoon and southwest monsoon the percentage content of
Diatom species at station-4B was much higher than at other stations (41% at station-1,
53-57% at station-4A and 62- 63% at station-4B). The percentage of Chlorophyta at all
the three stations was 33-39% during the pre-monsoon and the southwest monsoon.
196

Percentage of Cyanophyta was 15-18% at station-1, 3-7% at station-4A and 0 at station-
4B during the pre-monsoon and northeast monsoon and 1% during the southwest
monsoon (Chart-9). Percentage of Euglenophyta was 5-10% at station 1, 3-6 % at
station-4A and 1 at station-4B during southwest monsoon and 0 during the other seasons.
In the northeast monsoon the species diversity noticed was the lowest at all stations. At
station-1, only 31 species of algae were observed (39% of Diatoms, 29% of Chlorophyta
and 22% of Cyanophyta and 10% of Euglenophyta). At station-4A there were only 21
species of algae (52% Diatoms, 38% Chlorophyta and 4% each of Cyanophyta and
Euglenophyta). At station-4B there were only 15 species of algae (67% Diatoms and 33%
Chlorophyta; Cyanophyta and Euglenophyta were totally absent). Thus it was clear that
as we moved towards the inlet in the Lake the benthic algal diversity decreased with an
increasing trend in the percentage content of Diatoms over other groups and extreme
decline of Cyanophyta and Euglenophyta.
In Periyar Lake, Microcystis aeruginosa was an alga found among benthic algae
at station-1 and 4A, throughout the year 2004. Microcystis is a typical species of nutrient
rich lakes, the life cycle of which include both pelagic and benthic stages (Brunberg and
Blomqvist, 2002). They may remain in substantial numbers in the sediment depth of
several years of age (Bostrom et al., 1989) and are capable of restart of growth after
extended periods of ‘resting’ (Reynolds et al., 1981). Considering its potentials to cause
toxic blooms, the various factors related to such an outbreak of this species must be well
monitored; otherwise it would become catastrophic to the precious wildlife which always
depends on the waters of this Lake.
197

Chart-7. Percentage density of benthic algae during pre-monsoon-2004
PLS 1
18%36% 5%
41%
CyanophytaEuglenophytaBacillariophytaChlorophyta
CyanophytaEuglenophyta
PLS 4A
38%3% 3%
57%
BacillariophytaChlorophyta
PLS 4B
037%
0
62%
CyanophytaEuglenophytaBacillariophytaChlorophyta
198

Chart-8. Percentage density of benthic algae during southwest monsoon - 2004
PLS1
39%15%
7.3%
41%
CyanophytaEuglenophytaBacillariophytaChlorophyta
PLS1
39%15%
7.3%
41%
CyanophytaEuglenophytaBacillariophytaChlorophyta
PLS 4A
33.3%7% 6.6%
53%
CyanophytaEuglenophytaBacillariophytaChlorophyta
PLS 4A
33.3%7% 6.6%
53%
CyanophytaEuglenophytaBacillariophytaChlorophyta
PLS 4B
032%
4.5%
63%
CyanophytaEuglenophytaBacillariophytaChlorophyta
PLS 4B
032%
4.5%
63%
CyanophytaEuglenophytaBacillariophytaChlorophyta
199

Chart-9. Percentage density of benthic algae during northeast monsoon - 2004
PLS1
32%22%
39%
10%
CyanophytaEuglenophytaBacillariophytaChlorophyta
PLS 4A
38%
4% 4%
52%
CyanophytaEuglenophytaBacillariophytaChlorophyta
PLS 4B
033%
0
67%
CyanophytaEuglenophytaBacillariophytaChlorophyta
200

5.15.Correlations- phytoplankton density and water quality parameters
Physical factors within all the natural biological systems interact among
themselves and with the biotic factors resulting in the formation of a complex
relationship which is usually called as the environmental complex. Species and their
natural assemblages called communities are quite inseparable from this complex of
interacting factors. Therefore, analyses of environmental factors individually are
insufficient to trace the exact role of each factor affecting the existence of species
population or communities. In such circumstances correlation analyses would be much
more fruitful. Correlation analyses of physical environmental factors with community
characteristics are important to identify certain key relationships crucial to the sustainable
management of natural ecosystems. However, correlations of different factors may
appear quite contradictory at different situations in highly complex natural systems. But
such observations of interactions may reveal certain important trends as well.
Quite naturally, correlations of phytoplankton density and the density of different
algal groups with the different physico-chemical parameters in the Periyar Lake showed
certain contradictory relations at different stations. However, certain general trends were
also visible in these correlations (Table-184 and 185).
5.15.1. Correlation of phytoplankton density with water temperature, TS, pH and transparency
Significant positive correlations were noticed between surface water temperature
and total plankton density at all stations in the Lake except at station-4A. Total plankton
density at station 4A showed a negative correlation with water temperature. Many reports
on positive correlations between density of specific groups of phytoplankton and
temperature are available (Sarojini, 1996; Unni and Pawar, 2000). However, the negative
correlations of phytoplankton density observed at station-4A might be due to the
unidentified interactions of certain factors operating in the region. Correlation analysis of
density of different algal classes and temperature at different stations revealed that the
relationship of such groups with temperature was positive at certain stations but negative
201

at certain other stations. It may be noted that at station-4A, where Bacillariophyta was the
dominant group, it showed a positive correlation with temperature. But, Bhatt et al.
(1999) observed negative correlations of Cyanophyceae and Bacillariophyceae with
temperature. According to Palmer (1980) various classes as well as individual species of
algae have minimum, optimum and maximum temperatures for growth. The author has
reported optimum temperature for Diatoms as 18-30 C, for Green-algae 30-35 C and for 0 0
Blue-green algae 35-40 C. Since the surface water temperature fluctuations in Periyar0
Lake varied from 24 to 29 C, temperature regime in the Lake is not very favorable for 0
Cyanophycean and Chlorophycean growth.
In the Lake significant correlations between total solids and algal densities were
observed at different stations. However, this observation does not agree with the fact that
the Lake is dominated in general by Chlorophyceae and Bacillariophyceae, which
usually show a negative correlation with TS (Bhatt et al., 1999). According to An and
Jones (2000) Cyanophyceae dominate phytoplankton communities under reduced light
environment. Contrary to these observations Cyanophyta showed positive correlations
with transparency at stations 3 and 4A in Periyar Lake. Bhatt et al. (1999) reported a
positive correlation of Bacillariophyceae and Chlorophyceae with transparency.
However, Periyar Lake with dominating populations of Bacillariophyceae and
Chlorophyceae, no positive correlations of density of these groups with transparency was
observed. These contradictions also might be due to unidentified interactions of different
environmental factors.
Correlation coefficient for pH was found negative with and Cyanophyceae
Chlorophyceae Bacillariophyceae et aland positive with (Bhatt ., 1999). However, such a
clear tendency in correlations of total phytoplankton density or density of different algal
groups and pH was not observed in different stations of the Lake. According to Palmer
(1980) majority of algae grow best in water at or near neutral point of pH, but some Blue-
greens grow best at high pH. The neutral or slightly alkaline pH observed in Periyar
202

waters is therefore suitable for the community structure dominated by Bacillariophyta
and Chlorophyta as was revealed in the present investigations of the Lake.
5.15.2. Correlation of phytoplankton density with hardness, alkalinity, salinity and EC
In general, phytoplankton density was found correlated only positively with
hardness in the Lake. However, such positive correlations were observed at stations 1,4B
and 5. Group wise correlation analysis showed varied trends with different algal groups
at different stations. In station-1 Cyanophyta and Bacillariophyta correlated with total
hardness. In station-2 and 3 Bacillariophyta and Chlorophyta showed positive relations.
In station-4A Bacillariophyta only showed a positive correlation with hardness.
Significant positive correlations were noticed between Euglenophyta, Bacillariophyta
and Chlorophyta and total hardness at station 4B. Many authors have (Iqbal and Katariya,
1995; Bhade et al., 2001) observed positive correlations of Cyanophyta and total
hardness of freshwater systems.
Total alkalinity showed a very significant positive correlation with the total
plankton density of the lake in all the stations and seasons except at station-3. At station-3
there was a significant negative correlation of plankton density and total alkalinity, the
reason of which of course might be due to an unidentified interaction of different factors.
At many stations (1, 2, and 5) showed a significant positive correlation with Cyanophyta
total alkalinity. At stations 3, 4A, 4B and 5 there were significant positive correlations of
Chlorophyta and total alkalinity. Bhatt et al. (1999) observed similar positive correlation
of Chlorophyta and Cyanophyta in Taudaha Lake, Katmandu. Correlations of
Bacillariophyta and alkalinity at station-1 and 4B were positive, correlations of
Euglenophyta and alkalinity at stations 4A and 4B were found to be positive.
Plankton density showed a positive correlation with salinity in all the stations of
the Lake except stations-2 and 5. As in the case of hardness different algal groups showed
different trends of correlations at different stations. At station-1 density of Cyanophyta
showed positive trend with salinity, at station-2 Bacillariophyta and Chlorophyta
203

exhibited such trends, but at station-3 all the four groups were positively correlated with
salinity. Euglenophyta and Chlorophyta showed positive correlation with salinity at 4A.
At 4B all groups except Cyanophyta were positively correlated with salinity. In station-5
only Bacillariophyta showed a positive correlation. Sarojini (1996) observed that
Bacillariophyta in general are saline tolerant.
Positive correlations of plankton density and EC were observed at stations 1, 3,
4A, and 5. There were very good positive correlation with all plankton group except
Cyanophyta at station-5. However, Cyanophyta showed positive correlations with EC at
stations-2 and 3. Apart from station-5, Bacillariophyta showed a positive correlation at
station-3; Euglenophyta at stations-4A and 4B and 5, whereas Chlorophyta at 4A and 5.
Coesel (2001) is of the opinion that low EC promotes optimal development of Desmid
flora. However, in Periyar Lake at station-4B with low EC showed a dominance of
Chlorococcales. There are reports of positive correlations of Bacillariophyta and EC in
the literature (Sarojini, 1996; Owen et al., 2004).
5.15.3. Correlation of phytoplankton density with dissolved CO2 and DO
Phytoplankton density showed significant correlations with dissolved CO2 at
stations-1, 2 and 4A. At stations1, 2, and 3, Cyanophyta showed significant positive
correlations with dissolved CO2. Johnston and Jacoby (2003) are of the opinion that low
dissolved CO2 favours growth of Cyanophyta. However, significant difference in this
factor was not observed in the surface waters at stations 1, 2 or 4A from that of other
stations. Therefore, the factors contributing to the positive correlations of dissolved CO2
and Cyanophyta might be some others. Euglenophyta showed a positive correlation with
dissolved CO2 at stations 2, 3 and 4A.
No significant positive correlations were noticed between plankton density of the
lake and DO at any station. However, group wise correlation studies showed different
trends. At stations-1 and 3 positive correlations between Euglenophyta and DO were
observed positive which was contradictory to the report of Heide (1982), who found a
204

low DO highly favorable to the growth of Euglenophyta. At station-5 the positive
correlation was between Bacillariophyta and DO. Sarojini (1996) observed positive
correlation between Bacillariophyta and DO. At other stations no definite trend was
observed. Bhatt et al. (1999) observed a positive correlation of Chlorophyceae and
Bacillariophyceae with DO whereas a negative correlation of Cyanophyceae with DO in
Taudaha Lake. However, in Periyar Lake Chlorophyceae and Cyanophyceae did not
show such a trend. Since DO and temperature are interrelated factors, their interaction
with each other and with other factors contribute greatly to the growth of phytoplankton
species in general, the exact role of DO on phytoplankton density may not be easily
identified.
5.15.4. Correlation of phytoplankton density with minerals
At all stations except at stations-1 and 3, there were positive correlations between
total plankton density and Cl ion in Periyar waters. Cyanophyta showed a positive
correlation with Cl at stations 2, 4A and 5. However Euglenophyta showed a positive
correlation with Cl at all stations except at station-1. Bacillariophyta showed positive
correlations at station-1 and 4B whereas Chlorophyta showed positive correlations with
Cl at stations 1, 4A and 5. One of the interesting observations was that at stations-4A and
5 the three algal groups Cyanophyta, Euglenophyta and Chlorophyta showed positive
correlations with Cl.
Total phytoplankton density and Ca were found negatively correlated at most of
the stations whereas at stations-4B and 5 the correlations were positive. Group wise
analysis showed that Chlorophyta and Ca were positively correlated at stations 1, 3, 4B
and 5 and negative correlations at station-4A. Other algal groups and Ca showed positive
trend at certain stations but negative trends at other stations. Observation of Heide
(1982) -1that Ca above 1 mgL inhibits multiplication of most species of algae in Indian
ponds might have been the reason for negative correlations between algal density and Ca
observed at many stations in Periyar Lake, where the content of Ca was above 2 mgL in -1
general. Correlations between Mg and plankton density were positive at most of the
205

stations except at stations-2 and 4A. In general, correlations between Cyanophyta and Mg
were negative but positive for Euglenophyta. Correlations of Bacillariophyta with Mg
were always positive whereas that of Chlorophyta with Mg was mostly neutral.
Highly significant positive correlations were observed between plankton density
and Na at all stations. At stations-1, 3 and 5 Cyanophyta showed positive correlations
with Na. Euglenophyta showed a positive trend at stations-4A, 4B and 5, but a negative
trend at 3. Bacillariophyta showed positive trend with Na at stations-1, 2, 3 and 4B.
Correlations of Chlorophyta with Na was positive at stations-2, 4A, 4B, and 5 but neutral
at stations-1 and 3. Correlations of phytoplankton density with K were either negative or
neutral in the Lake. Group wise analyses showed positive trend of Euglenophyta at
stations-1, 2 and 4B; Bacillariophyta at stations-1,4A and 5, Chlorophyta at stations 1, 3,
4B and 5. Unlike the observations of Izaguirre et al. (2004) no positive correlation of
Cyanophyta with K was observed in Periyar Lake, but the case of diatoms were similar
to the author’s observations.
5.15.5. Correlation of phytoplankton density with nutrients
Correlations of phytoplankton density and P were significantly positive at
stations-1,4B and 5 but neutral at other stations. Significant positive correlations between
Bacillariophyta and P was observed at stations 1, 3, 4A and 4B, Chlorophyta and P at
station-2 , 3 4B and 5; all groups and P at station 4B; Cyanophyta and P at station-5.
Since positive correlation between Cyanobacteria and P was observed at station 5 alone,
the belief that P highly stimulates Cyanophycean growth (Iqbal and Katariya, 1995;
Sarojini, 1996; Gulati and Donk, 2002; Calijuri et al., 2002; Johnston and Jacoby, 2003;
Izaguirre et al., 2004) appears relative to other factors as well.
Phytoplankton density and total N showed very good positive correlation at all
stations in the Lake. This observation agrees with the observations of Gulati and Donk
(2002) that N has the greatest impact on algal growth in freshwaters. Chlorophyta
showed positive correlation with total N at stations 4A, 4B and 5 but Bacillariophyta
showed positive correlation with total N at station-4B only. Cyanophyta showed positive
206

correlations with total N at all the stations, whereas Euglenophyta showed positive
correlations at stations-2, 4A, 4B and 5. The positive correlation of Cyanophyta with N
observed in Periyar Lake does not agree with the report of Johnston and Jacoby (2003)
that low total N favours Cyanobacterial growth. However, the range of total N content of
the Lake in general was very low and hence at such levels the positive influence is quite
reasonable.
Phytoplankton and higher plants utilize different forms of Nitrogen and may
differentially influence phytoplankton growth, size structure and community composition
(Rabalais, 2002). Therefore, correlations of NO3N with phytoplankton characteristics also
were interesting. Correlations of phytoplankton density and NO3N were also positive or
neutral; positive at most of the stations such as 2, 3, 4A and 5. As in the case of total N,
relationship between Cyanophyta and NO3N was positive at stations 3, 4A and 5.
Euglenophyta showed a positive correlation with NO3N at stations 2, 3, 4B and 5
but Bacillariophyta showed positive correlations at 1 and 2 only. Relationship of
Chlorophyta and NO3N was positive at stations 1, 2 and 5. It was interesting to note that
except Cyanophyta, all the other groups showed negative correlations with NO3N at one
or many stations. Bandela et al. (1999) reported a positive correlation between NO3N and
Cyanophyta in Barul dam. Similar positive correlations of other algal groups such as
Bacillariophyta and NO3N (Sarojini, 1996; Bhatt et al., 1999; Owen et al., 2004)
Chlorophyta and NO3N (Sarojini, 1996; Bhatt et al., 1999) are found in the literature.
There were no positive correlation between total phytoplankton density and
Silica. Cyanophyta and Euglenophyta never showed a positive relationship with Silica in
the Lake. However, Bacillariophyta exhibited significant positive correlations with Silica
at staions-1, 2, 3, 4A, 5, and at other stations the relations were insignificant. This
observation of positive correlation between Diatoms and Silica agrees with the finding of
Escavarage and Prins (2002) that Diatom development is strictly controlled by silicate
availability. Chlorophyta also showed a positive relationship with Silica at stations-1, 2,
3, 4B, but showed negative correlation at station-4A.
207

5.15. 6. Correlation of phytoplankton density with COD and BOD
Correlations of COD and total phytoplankton density were found positively
correlated at stations 1,4B and 5; at other stations the relationships were either neutral or
negative. Positive correlations of Bacillariophyta and COD were observed at stations 1,
3,4A and 4B; Cyanophyta and COD at stations 1 and 5; Euglenophyta and COD at
stations 4A, 4B and 5; Chlorophyta at stations 3, 4B and 5. Correlations of BOD and total
density were positive at all stations, except station-2. BOD showed positive trends for
Cyanophyta at stations 3, 4A and 5; Euglenophyta at stations 4A, 4B and 5;
Bacillariophyta at stations 3, and 4B; Chlorophyta at stations 4A, 4B and 5.
5.15.7. Correlation of phytoplankton density with Oil and Grease
Plankton density showed a significant positive relationship with oil and grease at
stations 1, 3, 4B and 5 but at other stations the relationships were neutral. Cyanophyta
showed only significant negative correlations with oil and grease in Lake at stations 3 and
4A; but at other stations the relationships were neutral. Euglenophyta showed positive
correlations with oil and grease at stations-3 and 5. But the group showed negative
correlations at other stations. One of the interesting observations was that correlations
between Bacillariophyta and, oil and grease were always positive at all stations.
Correlations of Chlorophyta with oil grease were positive at stations 1, 2, 4B, and 5 but
neutral at other stations.
5.16. Conclusion - Phytoplankton density and water quality parameters
The three-year average phytoplankton density of the Lake and that at different
stations suggested that the nutrient impact on the system in general was quite low,
characteristic to oligotrophic systems. In general, algal density fluctuations across
different stations were significant during the pre-monsoon and northeast monsoon but
insignificant during the southwest monsoon. Throughout the seasons Chlorophyta
dominated at all stations except at station 4A and 4B in the Lake; at station 4B the
dominant group was always the Bacillariophyta. Another significant tendency noticed
208

was the dominance of Desmids over Chlorococcales among Chlorophyta throughout the
seasons at most of the stations which suggested a normal trophic structure expected of a
typical unpolluted freshwater system. The Lake is famous for its endemic fish fauna. The
system therefore offers a typical system for depth study of Desmids and their
interrelationships with endemic fish fauna.
Correlation studies of hydrobiology with physico-chemical parameters revealed
that the relationship between phytoplankton density in general and that of the specific
groups are highly complex and often controlled by interactions of different factors, some
of which are unidentified. However, certain groups were found to be positively correlated
with certain parameter, while certain other groups were found negatively correlated with
certain parameters. In developing definite and clear trends of interaction between
different factors and hydrobiology of water body three-year monitoring is minimal. In
developing such trends a long term monitoring is essential.
209