Embed Size (px)
Citation preview
Studies on the Surface Properties of Biodegradable Polymer
Carriers in Respiratory Delivery of Drug from
Dry Powder Inhaler Formulations
Rinku Tuli
B.Pharm, M.Pharm
This thesis is submitted in fulfilment of the requirements for the degree of
Doctor of Philosophy
Institute of Health and Biomedical Innovation
School of Clinical Sciences
Faculty of Health
Queensland University of Technology
Brisbane, Australia
2012

Abstract
III
Abstract
Dry Powder Inhaler (DPI) technology has a significant impact in the treatment of
various respiratory disorders. DPI formulations consist of a micronized drug (<5µm)
blended with an inert coarse carrier, for which lactose is widely used to date. DPIs
are one of the inhalation devices which are used to target the delivery of drugs to the
lungs. Drug delivery via DPI formulations is influenced by the physico-chemical
characteristics of lactose particles such as size, shape, surface roughness and
adhesional forces. Commercially available DPI formulations, which utilise lactose as
the carrier, are not efficient in delivering drug to the lungs. The reasons for this are
the surface morphology, adhesional properties and surface roughness of lactose.
Despite several attempts to modify lactose, the maximum efficient drug delivery to
the lungs remains limited; hence, exploring suitable alternative carriers for DPIs is of
paramount importance. Therefore, the objective of the project was to study the
performance of spherical polymer microparticles as drug carriers and the factors
controlling their performance.
This study aimed to use biodegradable polymer microspheres as alternative carriers
to lactose in DPIs for achieving efficient drug delivery into the lungs. This project
focused on fabricating biodegradable polymer microparticles with reproducible
surface morphology and particle shape. The surface characteristics of polymeric
carriers and the adhesional forces between the drug and carrier particles were
investigated in order to gain a better understanding of their influence on drug
dispersion. For this purpose, two biodegradable polymers- polycaprolactone (PCL)
and poly (DL-lactide-co-glycolide) (PLGA) were used as the carriers to deliver the
anti-asthmatic drug - Salbutamol Sulphate (SS).
The first study conducted for this dissertation was the aerosolization of SS from
mixtures of SS and PCL or PLGA microparticles. The microparticles were fabricated
using an emulsion technique and were characterized by laser diffraction for particle
size analysis, Scanning Electron Microscopy (SEM) for surface morphology and X-
ray Photoelectron Spectroscopy (XPS) to obtain surface elemental composition. The
dispersion of the drug from the DPI formulations was determined by using a Twin
Stage Impinger (TSI). The Fine particle Fraction (FPF) of SS from powder mixtures
was analyzed by High Performance Liquid Chromatography (HPLC).
Abstract
IV
It was found that the drug did not detach from the surface of PCL microspheres. To
overcome this, the microspheres were coated with anti-adherent agents such as
magnesium stearate and leucine to improve the dispersion of the drug from the
carrier surfaces. It was found that coating the PCL microspheres helped in
significantly improving the FPF of SS from the PCL surface. These results were in
contrast to the PLGA microspheres which readily allowed detachment of the SS from
their surface. However, coating PLGA microspheres with antiadherent agents did not
further improve the detachment of the drug from the surface. Thus, the first part of
the study demonstrated that the surface-coated PCL microspheres and PLGA
microspheres can be potential alternatives to lactose as carriers in DPI formulations;
however, there was no significant improvement in the FPF of the drug.
The second part of the research studied the influence of the size of the microspheres
on the FPF of the drug. For this purpose, four different sizes (25 µm, 48 µm, 100 µm
and 150 µm) of the PCL and PLGA microspheres were fabricated and characterized.
The dispersion of the drug from microspheres of different sizes was determined. It
was found that as the size of the carrier increased there was a significant increase in
the FPF of SS. This study suggested that the size of the carrier plays an important
role in the dispersion of the drug from the carrier surface.
Subsequent experiments in the third part of the dissertation studied the surface
properties of the polymeric carrier. The adhesion forces existing between the drug
particle and the polymer surfaces, and the surface roughness of the carriers were
quantified using Atomic Force Microscopy (AFM). A direct correlation between
adhesion forces and dispersion of the drug from the carrier surface was observed
suggesting that adhesion forces play an important role in determining the detachment
potential of the drug from the carrier surface. However, no direct relationship
between the surface roughness of the PCL or PLGA carrier and the FPF of the drug
was observed.
In conclusion, the body of work presented in this dissertation demonstrated the
potential of coated PCL microspheres and PLGA microspheres to be used in DPI
formulations as an alternative carrier to sugar based carriers. The study also
emphasized the role of the size of the carrier particles and the forces of interaction
Abstract
V
prevailing between the drug and the carrier particle surface on the aerosolization
performances of the drug.
Keywords
VI
Keywords
Dry Powder Inhalers
Biodegradable polymers
Polycaprolactone
Poly (DL-lactide-co-glycolide)
Polymeric drug carrier
Adhesion forces
Microparticles
Table of Contents
VII
Table of Contents
Abstract III
Keywords VI
Table of Contents VII
List of Figures XV
List of Tables XX
List of Abbreviations XXII
Statement of Original Authorship XXV
Acknowledgements XXVI
Dedications XXVIII
Journal Publications XXIX
Chapter 1 Introduction 1
1.1. Background 3
1.2. Aims of the project 6
1.2.1. Key aims 6
1.2.2. Specific aims 7
Chapter 2 Literature Review 9
2.1. Introduction 11
2.2. Respiratory delivery 11
2.2.1. Introduction 11
2.2.2. Organization of the Respiratory System 11
2.2.3. Bronchial Asthma 13
2.2.3.1. Background on asthma 13
2.2.3.2. Drugs commonly used to treat asthma 13
2.2.4. Drug deposition 14
Table of Contents
VIII
2.2.4.1. Inertial impaction 14
2.2.4.2. Gravitational sedimentation 15
2.2.4.3. Brownian diffusion 15
2.2.4.4. Electrostatic precipitation 15
2.2.4.5. Interception 15
2.3. Drug delivery from dry powder inhalers 15
2.3.1. Devices 16
2.3.2. Formulation 17
2.3.3. Drug detachment 18
2.3.3.1. Impact based detachment (Mechanical forces) 18
2.3.3.2. Fluid based detachment 19
2.3.4. Particle characteristics 19
2.3.4.1. Size of the drug 19
2.3.4.1.1. Aerodynamic diameter and Dynamic shape factor 19
2.3.4.2. Carrier size 20
2.3.4.2.1. Polydispersity 21
2.3.4.3. Carrier shape 22
2.3.4.4. Crystallinity and Polymorphism 22
2.3.4.5. Moisture Content and Hygroscopicity 22
2.4. Surface properties 22
2.4.1. Surface area 22
2.4.2. Surface Morphology and Roughness 23
2.4.3. Adhesion force / Forces of Interaction 24
2.4.3.1. Electrical forces 24
2.4.3.1.1. Contact potential 24
2.4.3.1.2. Coulombic forces 25
2.4.3.2. Non-electrical forces 25
Table of Contents
IX
2.4.3.2.1. Intermolecular forces 25
2.4.3.2.2. Capillary forces 26
2.4.3.2.3. Solid bridging between particles 26
2.4.4. Measurement of adhesion forces 27
2.4.4.1. Atomic Force Microscope (AFM) 27
2.4.4.2. Factors affecting adhesion force and drug dispersion 32
2.4.4.2.1. Particle size and shape 32
2.4.4.2.2. Surface free energy 33
2.4.4.2.3. Relative Humidity (RH) 34
2.4.4.2.4. Surface roughness 35
2.5. Ternary components 38
2.5.1. Magnesium stearate 38
2.5.2. Leucine 39
2.5.3. Other ternary components 40
2.6. Use of modified lactose as carriers in DPIs 40
2.7. Reasons for inefficient drug delivery with lactose 42
2.8. Alternative carriers 44
2.8.1. Sugars other than lactose 44
2.8.2. Lipidic vehicles 45
2.9. Proposing polymers as alternative to sugars 45
2.10. Polymers in pulmonary drug delivery 46
2.11. Hypothesis that polymers can fill in the gap 49
Chapter 3 General Methods 51
3.1. Materials 53
3.1.1. Model drug 53
3.1.2. Carrier 54
3.1.2.1. Polycaprolactone (PCL) 54
Table of Contents
X
3.1.2.2. Poly (DL-lactide-co- glycolide) (PLGA) 54
3.1.2.3. Lactose 55
3.1.3. Ternary Components 56
3.1.4. Solvents and Chemicals 56
3.2. General methods 56
3.2.1. Microparticle preparation 56
3.2.1.1. Oil in water solvent evaporation technique 56
3.2.1.1.1. Using an overhead stirrer 56
3.2.1.1.2. Using a homogenizer 57
3.2.1.2. Electrospraying 57
3.2.2. Coating of microspheres 58
3.2.2.1. Dry powder coating 58
3.2.2.2. Solution coating 58
3.2.3. Particle size measurement 58
3.2.3.1. For microspheres prepared by emulsion technique 58
3.2.3.2. For microspheres prepared by electrospraying 59
3.2.4. Scanning electron microscopy (SEM) 59
3.2.5. Energy Dispersive X-ray Analysis (EDX) 59
3.2.6. X-Ray Photoelectron Spectroscopy (XPS) 60
3.2.7. Adhesion force 60
3.2.7.1. Measurement of spring constant 60
3.2.7.2. Sample preparation 60
3.2.7.2.1. Plasma cleaning of the cover slips 60
3.2.7.2.2. Cleaning of the glass slides 61
3.2.7.2.3. Polymer microspheres 61
3.2.7.2.4. Polymer films (Spin coating) 61
3.2.7.2.5. Functionalization of silica probe with SS 62
Table of Contents
XI
3.2.7.3. Force Measurement 62
3.2.8. Surface Roughness 63
3.2.8.1. Imaging of polymer particles and films 63
3.2.8.2. Roughness measurement 63
3.2.9. Surface energy determination 64
3.3. Analytical methods 65
3.3.1. UV spectrophotometric assay 65
3.3.2. HPLC assay 65
3.4. Powder formulation 65
3.4.1. Powder mixing 65
3.4.2. Homogeneity tests 65
3.4.3. In vitro aerosol deposition 66
3.4.4. Statistical Analysis 67
Chapter 4 Method Validation 69
4.1. Summary 71
4.2. Analytical validation 71
4.2.1. Spectrophotometric assay 71
4.2.2. HPLC 72
4.3. Powder Formulations 74
4.3.1. Homogeneity test by UV 74
4.3.2. In vitro aerosol deposition 75
4.3.2.1. Inter-batch and intra-batch variability 75
4.4. Adhesion Force measurements 76
4.4.1. Functionalization of silica probe with SS 76
4.4.2. Individual adhesion forces by silica probe 79
4.4.3. Individual adhesion forces by SS probe 80
Table of Contents
XII
Chapter 5 Drug Dispersion from PCL and PLGA Microspheres 83
5.1. Introduction 85
5.2. Results and Discussion 85
5.2.1. Particle sizing and drug dispersion from lactose 85
5.2.2. Characterization of microspheres and drug dispersion 92
5.2.2.1. PCL microspheres 92
5.2.2.2. PLGA microspheres 93
5.2.3. XPS analysis of microspheres 93
5.2.3.1. PCL microspheres 94
5.2.3.2. PLGA microspheres 99
5.2.4. Characterization of microspheres after surface-coating and drug
dispersion 101
5.2.4.1. PCL microspheres 101
5.2.4.2. PLGA microspheres 107
5.3. Conclusion 111
Chapter 6 Effect of the Size of the Carrier on the Dispersion of SS
113
6.1. Introduction 115
6.2. Results and Discussion 115
6.2.1. Particle size and Morphology 115
6.2.1.1. Salbutamol Sulfate (SS) 115
6.2.1.2. Carriers 116
6.2.1.2.1. PCL microspheres 116
6.2.1.2.2. PLGA microspheres 119
6.2.1.3. Interactive mixtures of SS and Carriers 121
6.2.1.3.1. Interactive mixtures of SS and PCL carrier 121
6.2.1.3.2. Interactive mixtures of SS and PLGA carriers 123
Table of Contents
XIII
6.2.2. Effect of carrier size on drug dispersion 127
6.2.2.1. In vitro TSI deposition of SS from the carrier 127
6.2.2.1.1. Drug dispersion from PCL carrier 127
6.2.2.1.2. Drug dispersion from PLGA carrier 130
6.2.2.2. Influence of inherent carrier size on dispersion 131
6.3. Conclusion 133
Chapter 7 Characterization of PCL and PLGA Surfaces and their
Relationship with SS dispersion 135
7.1. Introduction 137
7.2. Results and Discussion 137
7.2.1. Determination of adhesion forces 138
7.2.1.1. Adhesion forces with the PCL carrier 139
7.2.1.2. Adhesion forces with the PLGA carrier 143
7.2.2. XPS analysis of the films 147
7.2.2.1. XPS analysis of coated PCL films 147
7.2.2.2. XPS analysis of coated PLGA films 148
7.2.3. Relationship between adhesion force and FPF 149
7.2.3.1. PCL carriers 149
7.2.3.2. PLGA carriers 151
7.2.4. Surface Roughness 151
7.2.4.1. Surface roughness of PCL microspheres 152
7.2.4.2. Surface roughness of PCL films 153
7.2.4.3. Surface roughness of PLGA microspheres 154
7.2.4.4. Surface roughness of PLGA films 156
7.2.5. Relationship between FPF and RMS 157
7.2.5.1. PCL carriers 157
7.2.5.2. PLGA carriers 158
Table of Contents
XIV
7.2.6. Surface free energy determination 158
7.2.7. Difference between the PCL and PLGA polymers 160
7.2.7.1. Surface free energy 161
7.2.7.2. Glass transition temperature (Tg) 161
7.2.7.3. Elasticity of the polymer and the inhaler wall 162
7.3. Conclusion 162
Chapter 8 Overall Conclusions and Further Directions 163
8.1. Summary and Conclusions 165
8.2. Future Directions 167
Bibliography 169
List of Figures
XV
List of Figures
Figure 2.1. The Components of the Respiratory System [58] ..................................12
Figure 2.2 Principles of DPI design ........................................................................17
Figure 2.3 Schematic diagram of AFM where (1) Laser diode, (2) Cantilever, (3)
Mirror, (4) Position sensitive photodetector, (5) Electronics and (6)
Scanner with sample .............................................................................29
Figure 2.4 Anatomy of a force-distance curve [131] ...............................................30
Figure 2.5 The effect of surface roughness on the contact area between particles and
surfaces. (a)The ideal sphere on flat surface (b) Asperities much smaller
than the particle lead to reduction in the contact area (c) Asperities
comparable in size to the particles can lead to increase or decrease in the
actual contact area [166] .......................................................................36
Figure 3.1 Chemical structure of Salbutamol Sulfate (SS) ......................................53
Figure 3.2 Structure of Polycaprolactone (PCL) .....................................................54
Figure 3.3 Structure of Poly (DL-lactide-co- glycolide) (PLGA) ............................55
Figure 3.4 Structure of Lactose ..............................................................................55
Figure 3.5 Twin Stage Impinger (TSI) apparatus ....................................................67
Figure 4.1 Ultraviolet scan of SS in water over the range of 190-400 nm for the
determination of the wavelength of maximum absorbance (λmax= 276
nm) .......................................................................................................71
Figure 4.2 Beer‟s Law calibration curve of SS (n=3) ..............................................72
Figure 4.3 A representative HPLC chromatogram of Salbutamol Sulfate (0.6 µg/ml)
showing retention time at 4.224 minutes ...............................................73
Figure 4.4 A representative HPLC chromatogram of Salbutamol Sulfate (100 µg/ml)
showing retention time at 4.314 minutes ...............................................73
Figure 4.5 HPLC calibration curve of SS (n=5) ......................................................74
Figure 4.6 Inter-batch comparison of TSI deposition of SS for 2.5% mixture of SS
and PCL microspheres coated with 1% magnesium stearate solution
(n=5).....................................................................................................76
Figure 4.7 Intra-batch comparison of TSI deposition of SS for 2.5% mixture of SS
and PCL microspheres coated with 1% magnesium stearate solution
(n=5).....................................................................................................76
List of Figures
XVI
Figure 4.8 XPS survey scan of (A) Silica spheres (B) Silica spheres coated with SS
for 5 minutes (C) Silica spheres coated with SS for 10 minutes and (D)
Silica spheres coated with SS for 30 minutes ........................................ 77
Figure 4.9 SEM images of (A)Silica sphere at 6250×, (B)Silica sphere coated with
SS for 5 minutes at 10,000×, (C) Silica sphere coated with SS for 10
minutes at 10,000× and (D) Silica sphere coated with SS for 30 minutes
at 9375× ............................................................................................... 78
Figure 4.10 SEM image of the uncoated cantilever ................................................ 79
Figure 4.11 SEM image of the cantilever coated with SS ....................................... 79
Figure 4.12 Adhesion forces measured at a particular site on three different PCL
microspheres over a period of 30 minutes determined by AFM using
3.5 µm silica probe ............................................................................. 80
Figure 4.13 Adhesion forces measured at a particular site on three different PCL
microspheres over a period of 30 minutes determined by AFM using
3.5 µm silica probe functionalized with SS ......................................... 81
Figure 5.1 Particle size distribution of Lactose particles, PCL microspheres and
PLGA microspheres ........................................................................... 86
Figure 5.2 SEM images of (A) Lactose (Aeroflo-95) at 500X , (B) SS at 10,000X
and (C) SS-Lactose mixture at 4000X .................................................. 87
Figure 5.3 EDX spectrum of SS-Lactose mixture ................................................... 88
Figure 5.4 SEM images of (A) PCL microspheres at 2188X and (B) SS-PCL mixture
at 2187X. Note the high surface coverage of SS on the PCL particle
compared to the lactose particle in Figure 5.2C..................................... 92
Figure 5.5 SEM images of (A) PLGA microspheres at 2344X and (B) SS- PLGA
mixture at 2813X. Note that the surface coverage of SS on the PLGA
particle which is to a lesser extent than the PCL particle in Figure
5.4C..........................................................................................................93
Figure 5.6 XPS scan of (A) PCL powder and (B) PCL microspheres ..................... 94
Figure 5.7 Particle size distribution of PCL microspheres fabricated by
electrospraying ..................................................................................... 96
Figure 5.8 SEM images of (A) PCL microspheres prepared by electrospraying at
15,994X and (B) SS- PCL mixture at 8000X. ....................................... 97
Figure 5.9 XPS scan of (A) PLGA powder and (B) PLGA microspheres ............. 100
List of Figures
XVII
Figure 5.10 SEM images of (A) 1% MgSt solution coated PCL microspheres at
1852X, (B) 2% MgSt solution coated PCL microspheres at 1250X, (C)
1% Leucine solution coated PCL microspheres at 1250X, (D) 2%
Leucine solution coated PCL microspheres at 938X, (E) 1% MgSt
powder coated PCL microspheres at 1000X (F) 2% MgSt powder
coated PCL microspheres at 700X, (G) 1% Leucine powder coated PCL
microspheres at 1099X and (H) 2% Leucine powder coated PCL
microspheres at 1583X ..................................................................... 103
Figure 5.11 SEM images of mixtures of 2.5% SS and (A) 1% MgSt solution coated
PCL microspheres at 1500X, (B) 2% MgSt solution coated PCL
microspheres at 1875X, (C) 1% Leucine solution coated PCL
microspheres at 1327X, (D) 2% Leucine solution coated PCL
microspheres at 2400X, (E) 1% MgSt powder coated PCL microspheres
at 1500X, (F) 2% MgSt powder coated PCL microspheres at 1828X,
(G) 1% Leucine powder coated PCL microspheres at 938X and (H) 2%
Leucine powder coated PCL microspheres at 847X .......................... 104
Figure 5.12 EDX spectrum of interactive mixture of 2.5% SS and PCL microspheres
coated with 1% MgSt solution .......................................................... 105
Figure 5.13 FPF of coated PCL microspheres ....................................................... 107
Figure 5.14 SEM images of (A) 1% MgSt solution coated PLGA microspheres at
3906X, (B) 1% Leucine solution coated PLGA microspheres at 8000X,
(C) 1% MgSt powder coated PLGA microspheres at 4405X and (D) 1%
Leucine powder coated PLGA microspheres at 2400X ..................... 108
Figure 5.15 SEM images of mixtures of 2.5% SS and (A) 1% MgSt solution coated
PLGA microspheres at 4501X, (B) 1% Leucine solution coated PLGA
microspheres at 3750X, (C) ) 1% MgSt powder coated PLGA
microspheres at 5244X and (D) 1% Leucine powder coated PLGA
microspheres at 5859X........................................................................109
Figure 5.16 FPF of uncoated and coated PLGA microspheres .............................. 110
Figure 6.1 Particle size distribution of SS, n=5 ..................................................... 116
Figure 6.2 SEM images of SS powder at 2000× and 10,000× respectively ............ 116
Figure 6.3 Particle size distribution of four different batches of PCL microspheres,
n=5 ..................................................................................................... 117
List of Figures
XVIII
Figure 6.4 SEM images of PCL microspheres coated with MgSt of various sizes: (A)
25 µm (4687×), (B) 48 µm (4442×), (C) 104 µm (1852×) and (D) 150
µm (946×) .......................................................................................... 118
Figure 6.5 SEM images of PCL microspheres coated with leucine of various sizes:
(A) 25 µm (6392×), (B) 48 µm (10,535×), (C) 104 µm (1250×) and (D)
150 µm (1200×) ................................................................................. 119
Figure 6.6 Particle size distribution of four different batches of PLGA microspheres,
n=5 ..................................................................................................... 120
Figure 6.7 SEM images of PLGA microspheres of various sizes: (A) 20 µm
(10,000×), (B) 45 µm (3662×), (C) 90 µm (2344×) and (D) 150 µm
(1500×) ............................................................................................ 120
Figure 6.8 SEM images of interactive mixtures of 2.5% SS and PCL microspheres
coated with MgSt of various sizes: (A) 25 µm (3418×), (B) 48 µm
(4194×), (C) 104 µm (1500×) and (D) 150 µm (800×) ........................ 122
Figure 6.9 SEM images of interactive mixtures of 2.5% SS and PCL microspheres
coated with leucine of various sizes: (A) 25 µm (7786×), (B) 48 µm
(6662×), (C) 104 µm (1327×) and (D) 150 µm (1131×) ...................... 123
Figure 6.10 SEM images of interactive mixtures of 2.5% SS and PLGA
microspheres of various sizes: (A) 20 µm (7500×),(B) 45 µm
(4000×), (C) 90 µm (2813×) and (D) 150 µm (1200×) ................... 124
Figure 6.11 The relationship between the FPF of SS and the size of the PCL
microspheres coated with 1% and 2% MgSt solution respectively, n=5
...................................................................................................... 130
Figure 6.12 The relationship between the FPF of SS and the size of the PCL
microspheres coated with 1% and 2% leucine solution respectively,
n=5 ................................................................................................ 130
Figure 6.13 The relationship between the FPF of SS and the size of the PLGA
microspheres, n=5 .......................................................................... 131
Figure 7.1 Force distribution map of the adhesion forces from AFM with (A) 8X8
force points for films and (B) 32X32 force points for microspheres .... 138
Figure 7.2 An example of force-distance curve obtained from AFM. .................. 138
Figure 7.3 Adhesion force measurements of (A) Uncoated silica sphere and PCL
microspheres, (B) Silica sphere coated with SS and PCL microspheres,
List of Figures
XIX
(C) Uncoated silica sphere and PCL films and (D) Silica sphere coated
with SS and PCL films, n=5 ............................................................. 139
Figure 7.4 Adhesion force measurements of (A) Uncoated silica sphere and PLGA
microspheres, (B) Silica sphere coated with SS and PLGA microspheres,
(C) Uncoated silica sphere and PLGA films and (D) Silica sphere coated
with SS and PLGA films, n=5 ............................................................. 144
Figure 7.5 Survey spectra of (A) three layered film of PCL, PVA and MgSt and (B)
three layered film of PCL, PVA and Leucine ...................................... 148
Figure 7.6 Survey spectra of (A) three layered film of PLGA, PVA and MgSt and
(B) three layered film of PLGA, PVA and Leucine ............................ 149
Figure 7.7 Surface topography of PCL microspheres in (A) 2D view, (B) 3D view
and (C) Section view........................................................................... 153
Figure 7.9 Surface topography of PLGA microspheres in (A) 2D view, (B) 3D view,
(C) Section view and (D) Close view of the specs on the surface of the
PLGA microspheres............................................................................ 156
Figure 7.10 Surface roughness measurements of coated PLGA films and
microspheres, n=5.....................................................................................................157
Figure 7.11 Dispersive surface free energies of PCL and PLGA microspheres ..... 159
List of Tables
XX
List of Tables
Table 3.1 Speed of the spin coater and time intervals of spinning of each sample....62
Table 4.1 Accuracy and precision of the UV assay for SS (n=3)..............................72
Table 4.2 Accuracy and precision of the HPLC assay for SS (n=5)..........................74
Table 4.3 Homogeneity tests on five batches of 2.5% Drug-Carrier mixture (n=20)
.............................................................................................................................. .75
Table 5.1 Homogeneity tests on different batches of 2.5% Drug-Carrier mixture
(n=20)..........................................................................................................................88
Table 5.2 Fine Particle Fraction (FPF) of SS .......................................................... 90
Table 5.3 TSI data of SS from different carriers ..................................................... 91
Table 5.4 XPS results of PCL and PLGA microspheres coated with MgSt and
Leucine solution ................................................................................... 99
Table 6.1 Homogeneity tests on different batches of 2.5% Drug-Carrier mixture
(n=20) .................................................................................................................. 125
Table 6.2 The % FPF of SS from 1% and 2% MgSt coated PCL microspheres of four
different sizes having different surface areas ......................................... 126
Table 6.3 The % FPF of SS from 1% and 2% Leucine coated PCL microspheres of
four different sizes having different surface areas ................................. 126
Table 6.4 The % FPF of SS from PLGA microspheres of four different sizes having
different surface areas ........................................................................... 127
Table 6.5 TSI data of SS from different carriers ................................................... 129
Table 7.1 Adhesion force measurements of PCL and coated PCL microspheres with
uncoated and coated silica sphere, n=5 ............................................... 143
Table 7.2 Adhesion force measurements of PCL and coated PCL films with
uncoated and coated silica sphere, n=5 ............................................... 143
Table 7.3 Adhesion force measurements of PLGA and coated PLGA microspheres
with uncoated and coated silica sphere, n=5 ....................................... 146
Table 7.4 Adhesion force measurements of PLGA and coated PLGA films with
uncoated and coated silica sphere, n=5 ............................................... 147
Table 7.5 Surface roughness measurements of the PCL and coated PCL
microspheres, n=5..................................................................................153
List of Tables
XXI
Table 7.6 Surface roughness measurements of the PCL and coated PCL films, n=5
............................................................................................................................. 154
Table 7.7 Surface roughness measurements of the PLGA and coated PLGA
microspheres, n=5 ............................................................................... 155
Table 7.8 Surface roughness measurements of the PLGA and coated PLGA films,
n=5 ..................................................................................................... 157
List of Abbreviations
XXII
List of Abbreviations
% Percent
µ Micron
µg Microgram
µL Microliter
µm Micrometer
AFM Atomic Force Microscopy
BDP Beclomethasone dipropionate
BP British Pharmacopoeia
cm centimetre
CM Chitosan Microparticles
CV Coefficient of Variation
DCM Dichloromethane
DPI Dry Powder Inhaler
DSCG Disodium Cromoglycate
ED Emitted Dose
EDX Energy Dispersive X-ray Analysis
E-SPART Electrical Single Particle Aerodynamic Relaxation Time
eV Electron Volts
FCA Force Control Agents
FDA Food and Drug Administration
FPF Fine Particle Fraction
gm Gram
HPLC High Performance Liquid Chromatography
IGC Inverse Gas Chromatography
IPA Isopropyl Alcohol
IR Infrared
k Spring Constant
kV kilovolts
List of Abbreviations
XXIII
LMWH Low Molecular Weight Heparin
LOD Limit of Detection
LOQ Limit of Quantification
m Meter
MDI Metered Dose Inhaler
MgSt Magnesium stearate
min minute
mL Millilitre
MMAD Mass Median Aerodynamic Diameter
MSLI Multi-Stage Liquid Impinger
MW Molecular Weight
N Particle Number
nm Nanometre
nN Nano Newton
o/w Oil in Water
PCL Polycaprolactone
PGA Poly (glycolic acid)
PLA Poly (lactic acid)
PLGA Poly (DL-lactide-co-glycolide)
PVA Polyvinyl Alcohol
r2 Regression Coefficient
RD Recovered Dose
RF Respirable Fraction
RH Relative Humidity
RMS Root Mean Square
rpm Revolution Per Minute
S1 Stage one
S2 Stage two
sccm Standard Cubic Centimetre per Minute
List of Abbreviations
XXIV
SCFH Standard Cubic Feet per Hour
SEM Scanning Electron Microscopy
SLM Solid Lipid Microparticles
SS Salbutamol Sulfate
SX Salmeterol Xinafoate
Tg Glass transition temperature
TSI Twin Stage Impinger
UV Ultraviolet
VMD Volume Mean Diameter
WHO World Health Organization
XPS X-Ray Photoelectron Spectroscopy
XRD X-Ray Diffraction
λmax Wavelength of maximum absorbance
Statement of Original Authorship
XXV
Statement of Original Authorship
The work contained in this thesis has not been previously submitted to meet
requirements for an award at this or any other higher education institution. To the
best of my knowledge and belief, the thesis contains no material previously
published or written by another person except where due reference is made.
Rinku Tuli
Date:
Acknowledgements
XXVI
Acknowledgements
Knowledge is in the end based on acknowledgement
- Ludwig Wittgenstein
This piece of work would not have seen the light of the day without the support of
many individuals who have been instrumental in the completion of this project and
whom I would like to acknowledge.
First and foremost I thank Lord Almighty with folded hands for showering all His
blessings on me without which I would have not been what I am today.
I owe my deepest gratitude to my principal supervisor, Dr. Nazrul Islam for
providing me with an opportunity to pursue a PhD under him. I am thankful to him
for providing me with his constant support, encouragement and constructive criticism
to overcome the challenges encountered during this period. His help for securing the
scholarship from the University and his valuable inputs throughout the research is
highly appreciated. I am deeply indebted to Prof. Graeme George for his assiduous
guidance, inspiration and motivation throughout the tenure of my research work. He
is an embodiment of knowledge and his presence during our regular meetings and
discussions were of extreme help to me. His ideas, undying spirit and infusing the
positivity in the environment always charged me up during my low moments. The
organizational and analytical abilities and enthusiasm of Dr. Tim Dargaville inspired
me tremendously. I am highly grateful to him to help me getting initiated in the lab
during the beginning of my PhD when I was new to all the things around. He always
advised me to strike a balance between work and life. Mere words of thanks would
never be equated to the help and guidance which I have received from my
supervisory team time and again.
My earnest thanks to Queensland University of Technology (QUT) for providing me
with the opportunity and facilities to carry out research work. My heartfelt gratitude
to Faculty of Science and Technology for providing me the financial support for
undertaking this research work.
Many thanks to Mr. Matthew Mackay and Mr. Nathaniel Raup for training me on the
Malvern Mastersizer instrument for particle size analysis. I would also like to thank
Acknowledgements
XXVII
Dr. Chris Carvalho for inducting me on the HPLC instrument. My special thanks and
gratitude to Dr. Llew Rintoul for his expertise rendered in the IR analysis of the
samples. I offer my thanks to Miss Aurelie Muller for her help offered in the
electrospraying technique. My sincere thanks are due to Dr. Shayamal Das from
Monash University for conducting the IGC experiments of the samples.
I am grateful to Dr. Thor Bostrom, Dr. Loc Duong and Dr. Christina Theodoropoulos
for their help with SEM and Dr. Peter Hines for his help with EDX analysis of the
samples.
I am indebted to Dr. Barry Wood from University of Queensland (UQ) for his help
with the XPS analysis and data interpretation of the samples. My sincere thanks to
Mr. George Ganakas from UQ for all his support and help provided during the AFM
experiments.
My thanks are due to the technical staff in QUT especially Mr. David Smith for the
co-operation rendered to me.
My acknowledgment will be incomplete if I do not thank all my peers and my dear
friends for their constant support and their valuable help throughout my research
project. Their presence during the ups and downs of PhD journey was extremely
important to me.
Last but not the least I thank my family members who have been with me always as
pillars of support through the thick and thin of life. I owe my deepest gratitude for
their unflagging and unconditional support throughout my life. Without their support
I would have not reached this stage of my life.
It‟s my pleasure to thank all those who made this thesis possible. My gratitude,
respect and thanks to one and all who have helped me directly or indirectly and have
co-operated with me in my research work.

Dedications
XXVIII
Dedications
To,
Lord Almighty
and
My very loving family
Journal Publications
XXIX
Journal Publications
1. Tuli R, Dargaville T, George G, Islam N, Polycaprolactone Microspheres as
Carriers for Dry Powder Inhalers: Effect of Surface Coating on
Aerosolization of Salbutamol Sulfate, Journal of Pharmaceutical Sciences,
2012, 101 (2), 733-745.
2. Tuli R, George G, Dargaville T, Islam N, Studies on the Effect of the Size of
Polycaprolactone Microspheres for the Dispersion of Salbutamol Sulfate
from Dry Powder Inhaler Formulations, Pharmaceutical Research, DOI
10.1007/s1 1095-012-0772-y
Conference Abstracts
1. Poster presentation entitled “Effect of the Size of the Polycaprolactone
Carrier on the Dispersion of Salbutamol Sulfate in Dry Powder Inhalers” in
IHBI Inspires Postgraduate Student Conference 2011 held from 24th-25
th
November 2011 at Brisbane, Australia.
2. Poster presentation entitled “Surface coated Polycaprolactone Microspheres
as Carriers for Dry Powder Inhalers” in 2011 American Association of
Pharmaceutical Scientists (AAPS) Annual Meeting and Exposition held
from 23rd
-27th
October 2011 at Washington DC, USA
3. Oral presentation entitled “Polycaprolactone Microspheres as Carrier for Dry
Powder Inhalers: Effect of Surface Coating on Aerosolization of Salbutamol
Sulfate” was presented in Australian Pharmaceutical Science Association
(APSA) Annual Conference 2010 held from 6th
-9th December, 2010 at
Brisbane, Australia.
4. Oral presentation entitled “Studies on Efficient Respiratory Delivery of Drugs
Using Biodegradable Polycaprolactone Microspheres as Carriers for Dry
Powder Inhalers” was presented in IHBI Inspires Postgraduate Student
Conference 2010 held from 25th
-26th November 2010 at Gold Coast,
Australia.


Chapter 1 Introduction
1
CChhaapptteerr 11
IInnttrroodduuccttiioonn
Chapter 1 Introduction

Chapter 1 Introduction
3
1.1. Background
Pulmonary drug delivery is an important research area in the field of drug delivery
technology. It is the preferred mode of drug delivery in the treatment of various
disorders such as asthma and chronic obstructive pulmonary disease. The alveoli
region in the lungs has a large surface area and a highly permeable membrane for the
absorption of drugs into the blood. An advantage of pulmonary drug delivery
includes direct access of the drug to the lungs, hence it is one of the routes of choice
of drug administration of large molecules which degrade in the gastrointestinal fluid
and are subjected to first-pass metabolism in the liver. Pulmonary delivery also
utilizes minimal drug dose to produce the desired effect and provides a rapid
pharmacological response with minimal side effects [1]. It is a needle-free delivery
system capable of administering a variety of therapeutic substances [2].
Lung delivery is applicable not only for pulmonary disorders but also finds
application in the treatment of various diseases such as cancer, cystic fibrosis,
diabetes, osteoporosis and thrombosis [3-10]. Recently Islam et al have reviewed the
strategies and future prospects of pulmonary drug delivery for the management of
various neurological disorders including Parkinson‟s and Alzheimer‟s disease [11].
There are large numbers of devices available to target the delivery of drugs to the
lungs. Currently three major types of inhalers that are widely used for pulmonary
drug delivery are Nebulizers, Metered Dose Inhalers (MDIs) and Dry Powder
Inhalers (DPIs) and these devices use different mechanisms of delivering the drug
into the lungs [12].
The majority of dry powder inhalers are breath-actuated devices [13]. They are easy
to use and do not require co-ordination of actuation and inhalation. Unlike other
inhalers, DPIs do not use liquid propellants. They are portable, patient friendly and
do not require spacers [14-15]. DPIs today are an expanding area of interest of
pharmaceutical companies and are seen as the most promising mechanism for
pulmonary drug delivery.
A DPI formulation may consist of either only the drug as agglomerates or
agglomerates of drug and fine excipients with controlled flow property or the drug
blended with a suitable large carrier i.e. lactose. One of the major advantages of
formulating the system with the carrier includes increasing the bulk of the
Chapter 1 Introduction
4
formulation. This helps in delivering accurate doses of potent drugs. It contributes to
overcoming the cohesiveness of the micronized drug and improving the flow
properties of the drug-carrier mixture [16]. In carrier-based interactive mixtures the
drug particles are adhered onto the surface of lactose [17]. Efficient delivery of the
powder into the lungs from these interactive mixtures depends on decreased adhesion
between the carrier and drug, increased dispersion of the drug particles and
deposition of these drug particles into the lungs [18]. Hence, pulmonary delivery of
pharmacological agents from DPIs is dependent on the design of the device, the
formulation and the inhalation manoeuvres of the patient [19-20].
Most commercially available carrier-based DPI formulations only deliver about 20–
30% of the total dose to the lungs [21-22]. This low efficiency of DPIs is attributed
to the complex physiology of the respiratory tract, the characteristics of the powder
formulations for inhalation and the inhalation devices. In interactive mixtures,
micronized particles adhere to the surface of the carriers and produce agglomerates.
There is poor detachment of drug particles from the surface of the carrier particles
resulting in poor delivery efficiency. Effective respiratory delivery requires the
dispersion of drug from these agglomerates [23].
In the formulation aspects, drug delivery is influenced by the physico-chemical
characteristics of carrier particles such as particle size, shape and surface
morphology. Therefore, any disparities in the physical properties of the carrier lead
to variability in the Fine Particle Fraction (FPF) of the drug from the DPI
formulation which may, in turn, lead to variability in clinical performances. Thus the
physicochemical properties of carriers are important parameters in efficient delivery
of drugs from DPIs [24-26].
Commercially available inhalation grade lactose is irregular in shape with rough
surfaces which affects drug detachment during inspiration. Controlling the size,
shape and surface roughness of the lactose particles is difficult, and in turn, affects
the detachment of drug from the particles [24-26]. Thus, lactose as a carrier has its
own limitations. Hence, a number of studies have been conducted to improve the
delivery of drugs into the lung. These studies have focused on improving dispersion
of the drugs by optimizing the physico-chemical properties of the lactose carrier.
Such studies have included optimizing the carrier size [27], smoothing the carrier
Chapter 1 Introduction
5
surface [24], mixing different grades of carriers [28-29] and using lactose carriers
with different surface morphologies [24, 30]. Alternatively, modification of the
particle surfaces have been reported to improve the dispersibility of the drug from the
carrier surface using different technologies. One of the approaches is to coat the
surface of the coarse lactose by blending it with fine lactose, magnesium stearate
(MgSt) or leucine [31-35]. Common techniques for surface modification of carrier
particles include spray drying [36], encapsulation using supercritical carbon dioxide
[37], physical vapour deposition of particles in an aerosol flow reactor [38-39] and
dry process like mechanofusion [40]. However, drug dispersion from these powders
is still not satisfactory.
One of the formulation strategies is to use alternative sugars such as mannitol and
maltitol in DPIs [41]. Other sugars such as glucose, sorbitol and xylitol have also
been explored but they are hygroscopic and are not able to efficiently generate the
desirable FPF of the drug. Solid lipid microparticles (SLM) have also been
investigated in pulmonary administration as vehicles wherein the drug is
incorporated within the SLM. The traditional approach in DPI formulations is that
the drug is on the surface of the carrier but in SLMs the drug is incorporated within
the carrier thereby it acts as vehicle. However, these SLMs are preferable for high
entrapment of hydrophobic drugs and are suitable for long term treatments with an
aim to sustain the release of the drug into the lungs [42-43].
Currently, all DPI products existing in the market or which are to be launched in the
market utilize lactose as a carrier material [44]. Owing to the limitations of lactose
there is a pressing need to explore alternative carriers for DPI formulations which
may markedly improve the respiratory delivery of drugs into the lungs.
It is well-known that a curved surface with small asperities and low surface energy
generally reduces the contact area between adjacent surfaces [45-48]. Irregularly
shaped particle have more points of contact, which, in turn, leads to an increase in
cohesive and frictional forces in comparison to spherical and smooth particles.
Irregularly shaped particles also have a greater tendency for mechanical interlocking
of particles, which leads to a decrease in powder fluidity. Spherical particles have
minimal interparticulate contact, which will improve flow properties. Therefore,
spherical particles may be useful as carrier particles in DPI formulations. Indeed,
Chapter 1 Introduction
6
spherical spray-dried lactose particles have been shown to have higher deposition of
the drug prankulast hydrate (FPF: 17.8%) as compared with non-spherical lactose
with irregular surface morphologies (FPF: 3.4% - 14.7%) [30]. Hence, engineering of
carrier particles to provide a well-defined shape will be one of the important
strategies to improvise the efficacy of drug delivery with DPIs [24].
Polymers have long been used in various drug delivery technologies [49]. However,
the use of polymers as carriers in DPIs is still an unexplored area. As alternative
materials for use as carriers in DPI formulations, polymers are an attractive option.
Controlling the particle size, shape and surface roughness of polymers is much easier
[50] as compared to sugars. There are no DPIs in the market currently using
biodegradable polymers as carriers. Hence, the use of polymeric systems is an
approach that holds promise for improving the effectiveness of inhaled drugs for
both local and systemic action. They have been investigated widely in pulmonary
drug delivery to sustain the release of drugs [51-55] but have not been exploited as
carriers in DPIs. Thus, it would be worthwhile to research the use of biodegradable
polymers with controlled surface functionality as carriers for the pulmonary delivery
of drugs from powder formulation.
1.2. Aims of the project
1.2.1. Key aims
The principal aim of this study is to explore the potential of biodegradable polymers
as an alternative carrier to lactose with a view to gain a better understanding on the
polymer carrier surfaces for the development of dry powder inhaler formulations for
achieving efficient and maximum drug delivery deep into the lungs. The specific
objective of this research is to formulate microparticles of the polymers and to
investigate the effect of size and surface characteristics (morphology, surface
roughness and adhesional properties of the carriers) on the dispersion of the drug
from powder formulations where the drug is adhered on the surface of the large
polymer carriers.
Chapter 1 Introduction
7
1.2.2. Specific aims
This project focuses on the following objectives:
To produce microparticles of biodegradable polymer carrier with controlled
surface properties (size, shape, surface roughness, adhesional properties)
To investigate the surface properties of polymer carriers and relate the
outcome to drug dispersion
To investigate intrinsic adhesional forces of the polymer and drug using
Atomic Force Microscopy
In order to achieve these objectives, an anti-asthmatic drug, Salbutamol Sulfate (SS)
(inhalation grade) and biodegradable polymers, polycaprolactone (PCL) and poly
(DL-lactide-co-glycolide) (PLGA), were used. These two polymers were selected
because of the differences in their physicochemical properties.

Chapter 2 Literature Review
9
CChhaapptteerr 22
LLiitteerraattuurree RReevviieeww
Chapter 2 Literature Review

Chapter 2 Literature Review
11
2.1. Introduction
This chapter provides a review of the literature pertinent to the pulmonary delivery of
drugs. It outlines the organization of respiratory system and discusses the mechanism
of drug deposition. It also talks about the asthma disease and the drugs commonly
used to treat it. This chapter also details the drug delivery aspects from dry powder
inhalers which include the device and formulation aspects. It outlines the important
particle surface characteristics which affect drug delivery. It discusses the ternary
components used in DPI formulations and details the use of modified lactose as
carriers in DPIs. This chapter explores the reasons for not achieving maximum drug
delivery with lactose and describes the alternative carriers which have been used in
DPIs. It proposes the use of polymers as alternative to sugars, outlines various
polymers which have been used till date in pulmonary drug delivery and finally state
the hypothesis of the study.
2.2. Respiratory delivery
2.2.1. Introduction
Research in the field of pulmonary drug delivery has generated interest in the last
decade by using the lung as a means of delivering drugs systemically. The lung is
believed to be an ideal target for drug delivery because of its large surface area, good
vascularization, thinness of the alveolar epithelium and good capacity for solute
exchange. However the absorption of the inhaled substances depends on the
molecular weight of the substance, pH value, electrical charge, solubility and
stability of the inhaled substance [56-57].
2.2.2. Organization of the Respiratory System
The respiratory system can be divided into two components: Upper respiratory
system and Lower respiratory system (Figure 2.1). The upper respiratory system
consists of nose, nasal cavity, paranasal sinuses and pharynx. These passageways
filter, warm and humidify incoming air thereby protecting the more delicate surfaces
of the lower respiratory system and it cools and dehumidifies outgoing air. The lower
respiratory system includes the larynx, trachea, bronchi, bronchioles and alveoli of
the lungs [58].
Chapter 2 Literature Review
12
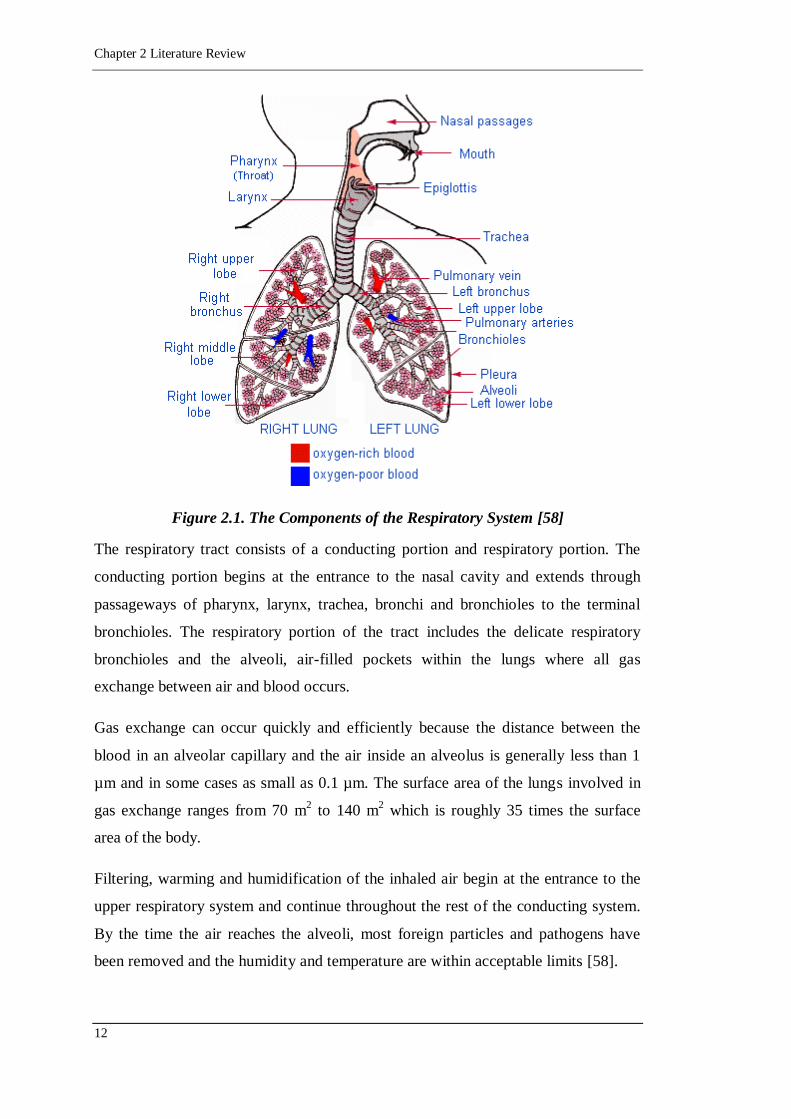
Figure 2.1. The Components of the Respiratory System [58]
The respiratory tract consists of a conducting portion and respiratory portion. The
conducting portion begins at the entrance to the nasal cavity and extends through
passageways of pharynx, larynx, trachea, bronchi and bronchioles to the terminal
bronchioles. The respiratory portion of the tract includes the delicate respiratory
bronchioles and the alveoli, air-filled pockets within the lungs where all gas
exchange between air and blood occurs.
Gas exchange can occur quickly and efficiently because the distance between the
blood in an alveolar capillary and the air inside an alveolus is generally less than 1
µm and in some cases as small as 0.1 µm. The surface area of the lungs involved in
gas exchange ranges from 70 m2 to 140 m
2 which is roughly 35 times the surface
area of the body.
Filtering, warming and humidification of the inhaled air begin at the entrance to the
upper respiratory system and continue throughout the rest of the conducting system.
By the time the air reaches the alveoli, most foreign particles and pathogens have
been removed and the humidity and temperature are within acceptable limits [58].
Chapter 2 Literature Review
13
The main function of the respiratory system is to provide an extensive surface area
for gas exchange between air and circulating blood and moving air to and fro from
the exchange surfaces of the lungs across the respiratory passageways (Martini
2006). Thus the disorders and diseases associated with the lungs essentially restrict
or impair the ability to breathe. Respiratory diseases range from mild and self-
limiting such as the common cold to life-threatening disorders such as bacterial
pneumonia or pulmonary embolism. However the scope of this project is confined to
anti-asthmatic drug Salbutamol Sulfate (SS) and hence asthma disease will be
discussed in the next section.
2.2.3. Bronchial Asthma
Asthma is a chronic disease characterized by recurrent attacks of breathlessness and
wheezing. It is a reversible obstructive airway disease that reverses either
spontaneously or with treatment. Attacks are brought on by spasms of smooth muscle
that lie in the walls of the smaller bronchi and bronchioles causing the passageways
to close partially. The patient has trouble exhaling and the alveoli may remain
inflated during expiration. Usually the mucous membranes which line the respiratory
passageways become irritated and secrete excessive amounts of mucus that may clog
the bronchi and bronchioles and worsen the attack [59].
Asthma varies in severity and frequency from person to person. Symptoms may
occur several times in a day or week in affected individuals, and for some people
become worse during physical activity or at night.
2.2.3.1. Background on asthma
According to World Health Organization (WHO), around 235 million people suffer
from asthma and about 255,000 cases of deaths have been reported in 2005 because
of asthma attacks. It is the most common chronic disease among children. It is not
just a public health problem for high income countries; in fact it is prevalent in all the
countries regardless of their level of development. Besides, it is a disorder which is
under-diagnosed and under-treated and hence it is a substantial burden to individuals
and families.
2.2.3.2. Drugs commonly used to treat asthma
Drugs used to treat asthma are bronchodilators and are classified as β2 adrenoreceptor
agonists, Xanthines, Muscarinic receptor antagonists and Corticosteroids.
Chapter 2 Literature Review
14
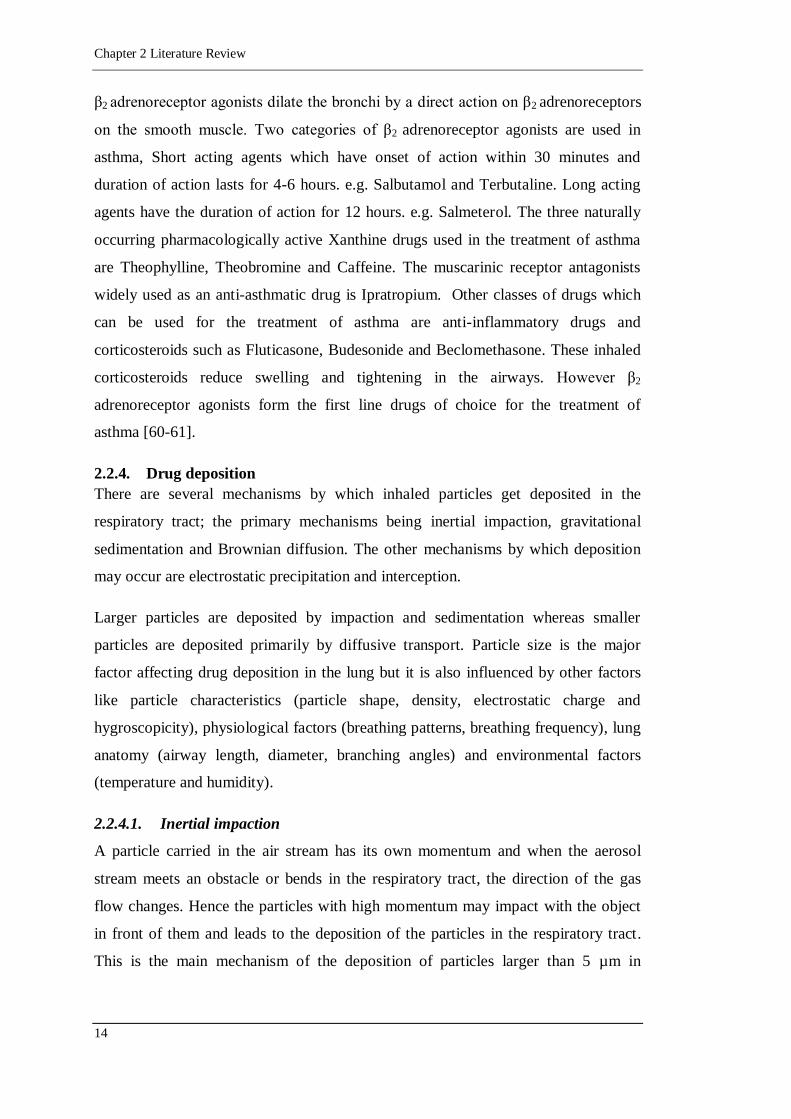
β2 adrenoreceptor agonists dilate the bronchi by a direct action on β2 adrenoreceptors
on the smooth muscle. Two categories of β2 adrenoreceptor agonists are used in
asthma, Short acting agents which have onset of action within 30 minutes and
duration of action lasts for 4-6 hours. e.g. Salbutamol and Terbutaline. Long acting
agents have the duration of action for 12 hours. e.g. Salmeterol. The three naturally
occurring pharmacologically active Xanthine drugs used in the treatment of asthma
are Theophylline, Theobromine and Caffeine. The muscarinic receptor antagonists
widely used as an anti-asthmatic drug is Ipratropium. Other classes of drugs which
can be used for the treatment of asthma are anti-inflammatory drugs and
corticosteroids such as Fluticasone, Budesonide and Beclomethasone. These inhaled
corticosteroids reduce swelling and tightening in the airways. However β2
adrenoreceptor agonists form the first line drugs of choice for the treatment of
asthma [60-61].
2.2.4. Drug deposition
There are several mechanisms by which inhaled particles get deposited in the
respiratory tract; the primary mechanisms being inertial impaction, gravitational
sedimentation and Brownian diffusion. The other mechanisms by which deposition
may occur are electrostatic precipitation and interception.
Larger particles are deposited by impaction and sedimentation whereas smaller
particles are deposited primarily by diffusive transport. Particle size is the major
factor affecting drug deposition in the lung but it is also influenced by other factors
like particle characteristics (particle shape, density, electrostatic charge and
hygroscopicity), physiological factors (breathing patterns, breathing frequency), lung
anatomy (airway length, diameter, branching angles) and environmental factors
(temperature and humidity).
2.2.4.1. Inertial impaction
A particle carried in the air stream has its own momentum and when the aerosol
stream meets an obstacle or bends in the respiratory tract, the direction of the gas
flow changes. Hence the particles with high momentum may impact with the object
in front of them and leads to the deposition of the particles in the respiratory tract.
This is the main mechanism of the deposition of particles larger than 5 µm in
Chapter 2 Literature Review
15
diameter. It usually occurs in the upper respiratory tract (entrance of trachea) and at
the conducting airway bifurcations [62-64].
2.2.4.2. Gravitational sedimentation
This mechanism means the settling of the particles under the action of gravity. It
occurs primarily for particles with a diameter ranging between 0.5 and 5 µm. It is a
predominant mechanism of deposition in the smaller airways, bronchi, bronchioles
and alveoli but it can also occur in the upper respiratory tract [62-64].
2.2.4.3. Brownian diffusion
Random motion of particles caused by collision with the gas molecules results in
deposition of the inhaled particle by Brownian diffusion. As the particle size
decreases, deposition by Brownian diffusion increases and is the dominant
mechanism of deposition for particles less than 0.5 µm. It mainly occurs in the acinar
region of lung but can also be found in the nose, mouth and pharyngeal airways for
very small particles (< 0.01 µm) [62-64].
2.2.4.4. Electrostatic precipitation
This occurs when the charged particles induces charges of opposite signs onto the
surfaces of the airways that are electrically conducting when normally uncharged.
Hence the charged particles become electrostatically attracted to the walls of
airways. Therefore the deposition of charged particles will be greater than the neutral
particles. It is a less common mechanism of deposition in the lungs [62-64].
2.2.4.5. Interception
This occurs when the dimensions of the particles are similar to the diameter of the
airway through which it is passing. It mostly occurs in small airways and alveoli and
is significant for particles like fibres for which the ratio between the length and
diameter is large. Such elongated particles get captured in the airways and gets
deposited there [62-64].
2.3. Drug delivery from dry powder inhalers
For the treatment of the respiratory disorders it is essential that the drugs reach the
deep lungs to elucidate the therapeutic response. For optimal efficacy the drug
delivery should be reproducible and this can be achieved by the combination of
judicious selection of the inhaler device and formulation metering [65].
Chapter 2 Literature Review
16
2.3.1. Devices
The main function of the DPI device is to provide adequate delivery of inhaled drug
to the lungs. The DPI should be able to deliver high FPF of the drug and the carrier
should ideally remain in the upper airways [66].
Many different devices are available to aid in inhalation delivery. Three major types
of inhalers widely used for pulmonary drug delivery are Nebulizers, Metered Dose
Inhalers (MDIs) and Dry Powder Inhalers (DPIs) and they use different mechanisms
of delivering the drugs into the lungs [1, 12].
The first MDI (Medihaler®, Riker) was introduced in 1956 which used
chlorofluorocarbon propellants [67], later ultrasonic nebulizers dominated the market
in 1960s and about 10 years later the first DPI (Fisons Spinhaler®) was launched in
the market [68]. However, today DPIs are preferred devices for inhalation delivery
because they do not use liquid propellants, do not require spacers, do not require co-
ordination of actuation and inhalation, are portable, easy to use and patient friendly
[14-15, 69].
Based on their design, DPI devices are classified into three generation of DPIs. The
first generation DPIs are breath activated single unit dose systems. The second
generation of DPI is multi-dose DPIs (measurement of dose from a powder reservoir)
or multi-unit dose (they disperse individual doses which are pre-metered into blisters,
disks, dimples, tubes and strip by the manufacturers). The third generation DPIs
known as active devices use compressed gas or motor driven impellers or use
electronic vibration to disperse drug from the formulation [70]. Efficient delivery of
the drug from the DPIs is dependent on the design of the device, inspiratory flow rate
and deagglomeration of the drug particles [71-73].
There are number of DPI devices available on the market and few of them are in the
pipeline. There is not a single DPI device which has been significantly effective in
delivering the drugs from the formulation into the lungs. Hence researchers are trying
to improve this by changing the design of the DPI device and also by improving the
formulation [70].
Chapter 2 Literature Review
17
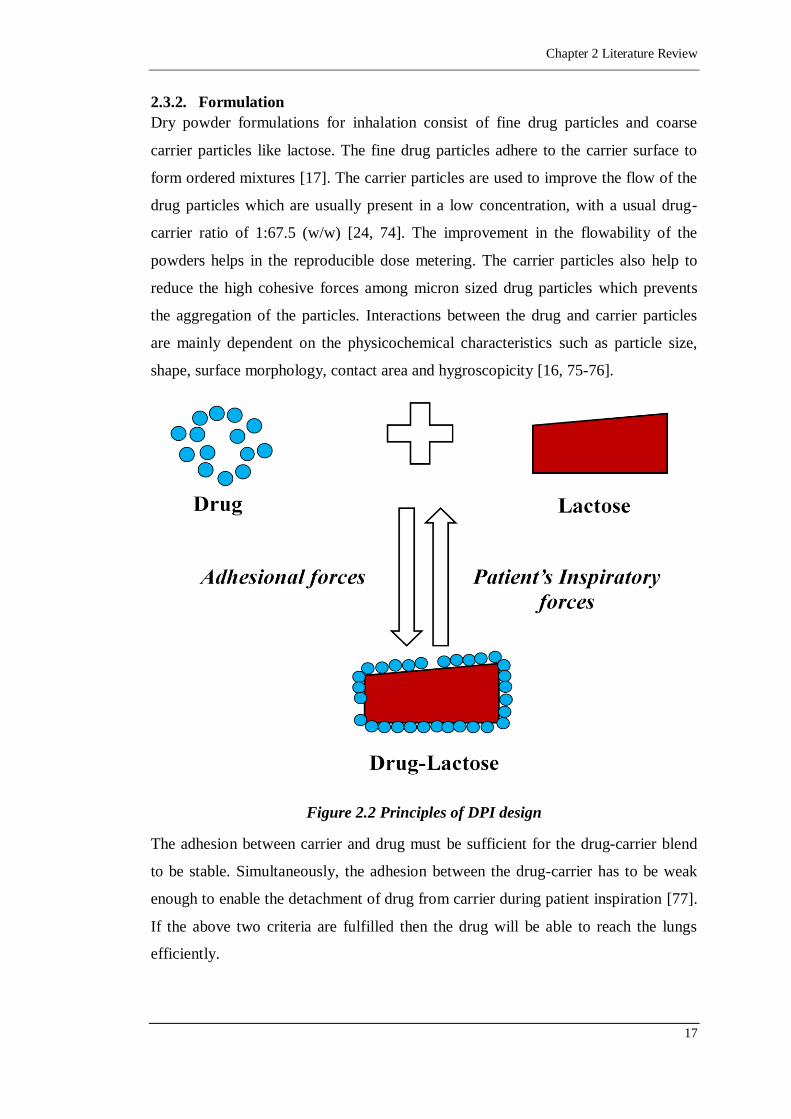
2.3.2. Formulation
Dry powder formulations for inhalation consist of fine drug particles and coarse
carrier particles like lactose. The fine drug particles adhere to the carrier surface to
form ordered mixtures [17]. The carrier particles are used to improve the flow of the
drug particles which are usually present in a low concentration, with a usual drug-
carrier ratio of 1:67.5 (w/w) [24, 74]. The improvement in the flowability of the
powders helps in the reproducible dose metering. The carrier particles also help to
reduce the high cohesive forces among micron sized drug particles which prevents
the aggregation of the particles. Interactions between the drug and carrier particles
are mainly dependent on the physicochemical characteristics such as particle size,
shape, surface morphology, contact area and hygroscopicity [16, 75-76].
Figure 2.2 Principles of DPI design
The adhesion between carrier and drug must be sufficient for the drug-carrier blend
to be stable. Simultaneously, the adhesion between the drug-carrier has to be weak
enough to enable the detachment of drug from carrier during patient inspiration [77].
If the above two criteria are fulfilled then the drug will be able to reach the lungs
efficiently.
Chapter 2 Literature Review
18
The carrier widely used in DPI formulations is lactose monohydrate [17, 27]. Lactose
in solid form can be crystalline or amorphous. Crystalline lactose can exist in one of
two distinct forms: β-lactose and α-lactose monohydrate. Crystals of α-lactose
monohydrate have a characteristic tomahawk-like shape. Crystals of pure β-lactose
have a characteristic kite-like form. They do not contain crystal water and often
referred to as anhydrous lactose. The advantages of lactose as a carrier are its ease of
availability, low price, its well-investigated toxicity profile and well-established
stability profile [65, 78].
2.3.3. Drug detachment
There are two major mechanisms by which the particles of drugs are detached from
the surface of the carrier particles. They are classified as impact based detachment
and fluid based detachment [79-82].
2.3.3.1. Impact based detachment (Mechanical forces)
This type of detachment of the drug from the carrier surface occurs when collisions
occurs between the carrier particles and the inhaler wall. As the particle impinges on
the wall surface and rebounds, it experiences a normal force due to the elasticity of
the wall and carrier material and it also experiences a tangential force due to friction.
This force is usually transmitted to the adhered drug particle through the carrier-drug
bond to impose acceleration.
The location of the drug particle on the carrier surface is an important factor which
determines the amount of force that will be required to detach the drug particle from
the carrier surface. For example if a carrier particle is travelling vertically downward
to collide with the horizontal wall of the inhaler then the acceleration is upwards.
Hence the drug particle which is adhered on the top of the carrier particle will be
pressed further onto the surface. If the drug particle is located near the bottom of the
carrier particle but not colliding with the wall then the drug particle can be
effectively detached from the carrier surface on account of the tensile force. If the
drug particle is located on the equator of the carrier particle, it will experience an
upward acceleration due to shear of carrier-drug bond and then the drug particles will
detach by shearing or twisting of the carrier [79-80].
Chapter 2 Literature Review
19
2.3.3.2. Fluid based detachment
The fluid based detachment occurs when the flow stream (air) has unobstructed path
to access and remove the drug from the carrier surface. The mechanisms which can
help in the detachment of the drug from the carrier particles are described below.
Drag: If the drug-carrier mixture has a different velocity from the surrounding fluid,
then the airflow will cause a velocity gradient at the surface of the carrier particle
which in turn will generate the forces on the drug particles called as drag force. The
tangential drag force tends to shear or twist the drug particle away from the carrier.
Acceleration: If the carrier particle accelerates due to the fluid forces then a force is
created on the drug particle which enables it to remain attached on the carrier
surface. The direction of this force is opposite to the drag force.
Shear: If the drug-carrier particle is in the region of fluid shear, then the carrier
particle experiences it on its surface as the velocity gradient which causes the force
on the drug particles called as normal lift force. The normal lift forces tend to pull the
drug particle away from the carrier. This force is similar to drag forces [79, 82].
2.3.4. Particle characteristics
The physicochemical properties of the powder have a profound effect on the drug
dispersion and these properties are discussed below.
2.3.4.1. Size of the drug
Particle size of the drug plays a very important role in the formulation of dry powder
inhalers. Separate studies have been carried out to determine the optimal particle size
of the aerosol in patients with varying degree of asthma and with different drugs. It
was found that the optimum particle size for the dry powder inhalers should be
between 1-5 µm. If the particles are smaller than 0.5 µm then they may not deposit
because of the Brownian motion and if the particles are larger than 5 µm, they may
impact in the pharynx from where they are easily cleared [83-87].
2.3.4.1.1. Aerodynamic diameter and Dynamic shape factor
In general pharmaceutical powders are irregular in shape and are not spherical; hence
measurement of the actual geometric diameters of the irregular particles is difficult.
Any deviation from the sphericity is called as the dynamic shape factor.
Aerodynamic diameter (Dae) is the diameter of an equivalent volume sphere of unit
Chapter 2 Literature Review
20
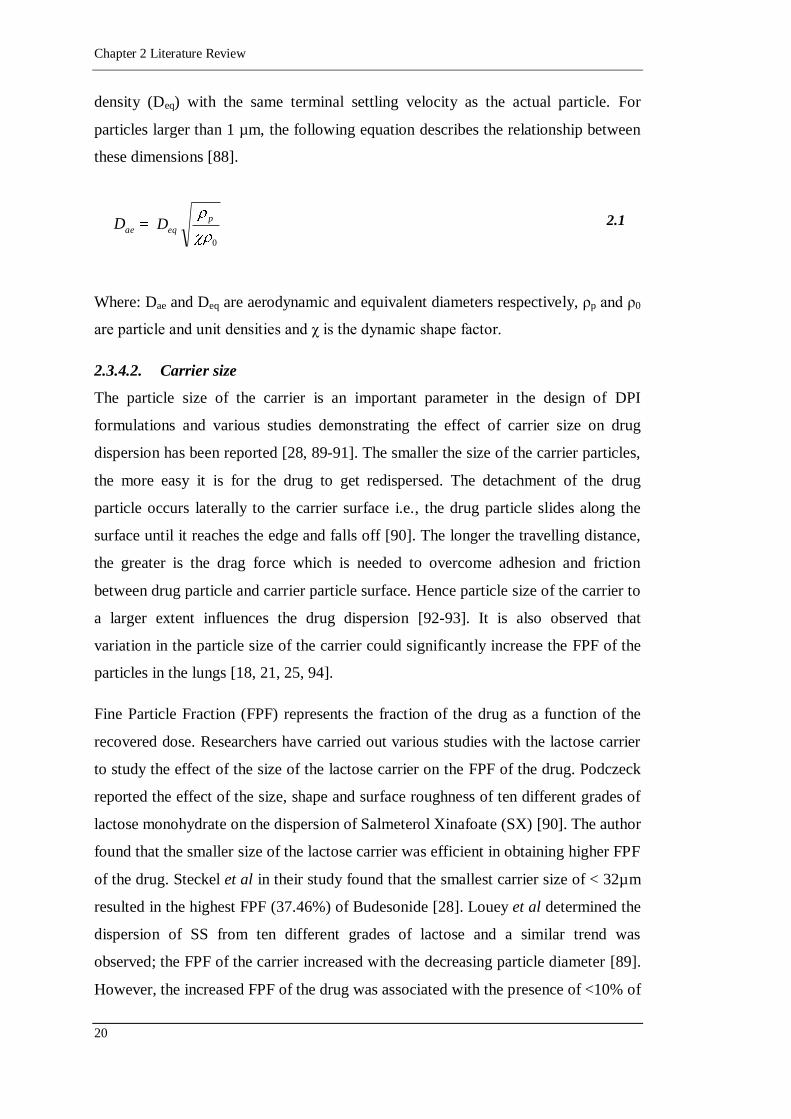
density (Deq) with the same terminal settling velocity as the actual particle. For
particles larger than 1 µm, the following equation describes the relationship between
these dimensions [88].
aeD eqD0
p 2.1
Where: Dae and Deq are aerodynamic and equivalent diameters respectively, ρp and ρ0
are particle and unit densities and χ is the dynamic shape factor.
2.3.4.2. Carrier size
The particle size of the carrier is an important parameter in the design of DPI
formulations and various studies demonstrating the effect of carrier size on drug
dispersion has been reported [28, 89-91]. The smaller the size of the carrier particles,
the more easy it is for the drug to get redispersed. The detachment of the drug
particle occurs laterally to the carrier surface i.e., the drug particle slides along the
surface until it reaches the edge and falls off [90]. The longer the travelling distance,
the greater is the drag force which is needed to overcome adhesion and friction
between drug particle and carrier particle surface. Hence particle size of the carrier to
a larger extent influences the drug dispersion [92-93]. It is also observed that
variation in the particle size of the carrier could significantly increase the FPF of the
particles in the lungs [18, 21, 25, 94].
Fine Particle Fraction (FPF) represents the fraction of the drug as a function of the
recovered dose. Researchers have carried out various studies with the lactose carrier
to study the effect of the size of the lactose carrier on the FPF of the drug. Podczeck
reported the effect of the size, shape and surface roughness of ten different grades of
lactose monohydrate on the dispersion of Salmeterol Xinafoate (SX) [90]. The author
found that the smaller size of the lactose carrier was efficient in obtaining higher FPF
of the drug. Steckel et al in their study found that the smallest carrier size of < 32µm
resulted in the highest FPF (37.46%) of Budesonide [28]. Louey et al determined the
dispersion of SS from ten different grades of lactose and a similar trend was
observed; the FPF of the carrier increased with the decreasing particle diameter [89].
However, the increased FPF of the drug was associated with the presence of <10% of

Chapter 2 Literature Review
21
fine particles of lactose (< 5 µm). Similarly an increased dispersion of SS was
observed with decreasing size of coarse lactose [91]. Recently Ooi et al have
demonstrated the use of different sizes of polystyrene spheres as the carriers for the
aerosolization of SS. They also found that as the size of the carrier was increased the
aerosol performance decreased [48]. Hence in most of the studies, increased
dispersion of the drugs from the interactive mixtures was observed with the
decreased carrier size [94-97]. Islam et al also found that the dispersion of SX
increased with decrease in the size of the lactose carrier [18]. However the drug
dispersion from these mixtures is complicated by the fact that the FPF is not solely
dependent on the size of the lactose carrier but is also dependent on the presence of
associated fine particles of lactose on the surface of coarse carrier [23]. Other
parameters such as morphology, surface roughness, surface area and surface energy
of the carrier particles come into play in controlling the dispersion of the drug [30,
98-99].
On the other hand, in one of the study, a higher respirable fraction of terbutaline
sulfate was obtained from coarser lactose as compared to fine particles of lactose
[100]. Hamishehkar et al found that increasing the size of the sieved mannitol
(carrier) increased the aerosolization properties of insulin-loaded PLGA
microcapsules. Thus an increase in the size of the mannitol carrier increased the FPF
of the insulin-loaded PLGA. This occurred due to the presence of larger surface
discontinuities on the surface of the mannitol carrier. These surface discontinuities
provided the active site on the surface of the carrier for deagglomeration of PLGA
microcapsules and their deposition on the carrier surface [101].
Therefore some researchers found that a decrease in the size of the carrier resulted in
an increase in the FPF of the drug but some contradictory results have also been
reported in the literature.
2.3.4.2.1. Polydispersity
Along with the particle size, the degree of polydispersity is also important which is
defined as the range of the particle sizes around the mode. The difference in the
carrier sizes will lead to differences in the regional drug deposition which results in
variation in the therapeutic response of the drug [102].
Chapter 2 Literature Review
22
2.3.4.3. Carrier shape
The shape of the particles is another important variable in dry powder inhalers
because it influences aerodynamic behaviour of the particle [103]. The shape of the
carrier particles might influence the mixing force due to increased friction and thus
indirectly affect the dispersion of the drug due to increased or decreased adhesion
forces [104].
2.3.4.4. Crystallinity and Polymorphism
A crystal is a solid in which the molecules or ions are arranged in an ordered,
repeating pattern. The ability of the solid to exist in more than one crystal form is
called polymorphism. Different polymorphs have different solubility, stability,
density, melting point, bioavailability and different energy states. A non crystalline
material is amorphous material and it has higher free energy than crystals. Crystal
habit describes the morphology of the particles and is important parameter as the
particle shape affects the aerodynamic behaviour and finally the lung deposition of
the particles [65].
2.3.4.5. Moisture Content and Hygroscopicity
Hygroscopicity is the intrinsic capability of the material to absorb moisture from its
surroundings. This in turn is affected by the crystallinity of the material and the
morphology of the particles. Moisture uptake leads to the aggregation of the particles
through solid bridge formation [105] which adversely affects the dispersion of the
particles and finally the lung deposition [106]. Hygroscopicity can increase the
particle size by aggregation of the particle and it can also alter the adhesive and
cohesive properties of the powder [107]. Thus the moisture content of the powder
influences flow and dispersion of the drug from the carrier [71].
2.4. Surface properties
The surfaces of particles are important factors in the determination of particle
interactions and the ease of dispersion.
2.4.1. Surface area
If the particles are small, the total surface area of the powder is very large. Also
surface morphology contributes to the surface area of the particles. Rough or
corrugated particles will have more surface area as compared to smooth particles. A
larger surface area renders the particles to greater potential for charging and moisture
Chapter 2 Literature Review
23
uptake which in turn affects drug dispersion [65]. Low surface energy is needed to
avoid particle agglomeration in the DPI formulation [108].
2.4.2. Surface Morphology and Roughness
Particle morphology refers to the external shape and surface texture of a particle
[109]. The carrier morphology and the surface roughness are the major contributing
factors to affect the FPF of the drug in various studies.
It was observed by Ganderton that decrease in the lactose surface roughness resulted
in an increase in the respirable fraction of SS [95]. Another study by Zeng et al
showed that increasing the surface smoothness of lactose crystals increases the
respirable fraction of SS from DPIs [24]. Heng et al determined that the rougher
grades of lactose led to lower delivery of the SS because the rougher particles
hindered with the detachment of the SS from the lactose carrier surfaces [110].
Larhrib et al crystallized lactose under various conditions to obtain variations in the
morphologies of lactose. It was observed that the smooth surfaces of lactose provided
with an efficient drug delivery as compared to rougher surfaces [111]. Another
investigation by Young et al proved that the “particle smoothing” of lactose surfaces
led to an improvement in the FPF of the drug Beclomethasone dipropionate [112]. A
study conducted by Kawashima et al proved that spherical spray dried lactose
particles had higher deposition of the drug Prankulast hydrate (FPF: 17.8%)
compared with non-spherical lactose with irregular surface morphologies (FPF: 3.4%
- 14.7%) [30]. Thus, according to these above-listed investigations, decrease in the
surface roughness improved the aerosolization efficiency of a drug-carrier blend.
However, contrary results have been reported in the literature regarding the surface
roughness of the carrier particle. Chan et al observed higher deposition of SS with
increased surface roughness of the lactose carrier. They deposited fine particles of
lactose on the surface of the large lactose carrier which made microscopic
undulations on the surface of particles. These undulations were not able to
accommodate drug particles on their surface thereby facilitating easier detachment of
SS and improvised drug dispersion [113]. Extensive studies carried out by Adi et al
proved that changing the morphology of the drug particle to a rough surface,
decreases the contact area between drug and carrier which in turn decreases the
adhesion and increases the liberation of the drug particle from the carrier [114]. It
Chapter 2 Literature Review
24
was found that when disodium cromoglycate powders were treated with lauric acid it
changed the morphology of the drug particles which in turn improved the FPF of the
drug [103, 115]. In a separate study, enhanced drug delivery of BSA was achieved
from corrugated particles as compared to smooth particles. The surface asperities
helped in reducing the contact area between the adjacent particles and this in turn
helped in the reduction of cohesion [116]. The particle surface corrugation was
further quantified in a separate study and it was found that a certain small degree of
roughness led to considerably enhanced performance of the DPI formulations by
reducing the contact area between the drug and the carrier [117]. Kawashima and his
co-workers modified the surface of the drug Prankulast hydrate by coating it with
ultrafine hydrophilic hydroxypropylymethyl cellulose phthalate. These surface
modified particles led to three-fold increase in the delivery of the drugs to the lungs
as compared to unmodified powder due to increased surface roughness and
hydrophilicity of the particles [118].
Thus, some studies support that the smooth carrier particles will help in improving
the drug delivery while some researchers consider that a certain amount of surface
roughness is a desirable feature for achieving better drug dispersion. However no
consensus has been achieved with respect to this aspect.
2.4.3. Adhesion force / Forces of Interaction
The most important factor influencing the behaviour of the formulation is the
adhesion force acting between the active ingredient and the carrier particles [75,
119]. Adhesion force is defined as the forces of interaction between two unlike
particles whereas cohesion is the forces of interaction between two similar particles.
Particle adhesion occurs when the forces of interaction between the particle and the
surface exceeds the detachment forces exerted on the particle. The types of solid
interactions occurring between the particles are broadly classified as electrical and
non-electrical forces and include contact potential, coulombic forces, intermolecular
forces, capillary forces and forces due to solid bridge formation.
2.4.3.1. Electrical forces
2.4.3.1.1. Contact potential
This type of particle interaction occurs between contiguous bodies which are
dissimilar and uncharged. Electrons have different energy levels. The difference in
Chapter 2 Literature Review
25
the energy states between the outermost conduction band of electrons and the
vacuum energy level is called as work function (φ). The transfer of electrons between
two dissimilar materials occurs upon contact with each other until the equilibrium is
established. This produces the contact potential between the two which is the
difference between the work functions of the two materials. The force of interaction
occurring due to contact potential can be given by the following equation [120]:
S
qFe
22 2.2
Where:
Fe: Interactive force due to contact, q is the particle charge on detachment and S is
the contact area between the particle and the carrier surface.
2.4.3.1.2. Coulombic forces
This type of particle interaction occurs between charged particle and an uncharged
surface. Charged particles induces equal and opposite charges on the surface. The
Coulombic force of interaction is expressed by the following equation [120]:
2
2
l
QFim 2.3
Where Fim is the Coulombic image force, Q is the charge on the particle and l is the
distance between the centres of these charges.
2.4.3.2. Non-electrical forces
2.4.3.2.1. Intermolecular forces
These types of forces include van der Waals forces (dipole-dipole, dipole-induced
dipole and induced dipole-induced dipole forces), ion-dipole and ion-induced dipole
forces and hydrogen bonding. This interactive force between the two bodies
(spherical particle-plane interaction) can be represented by the following equation
[120]:
Chapter 2 Literature Review
26
33
4
d
rBFm
2.4
Where Fm: Molecular forces of interaction (van der Waals forces), r is the radius of
the approaching spherical particle, d is the distance of separation, B is the constant of
molecular interaction with allowance of electromagnetic lag.
Thus the van der Waals adhesion force is inversely proportional to the distance of the
separation and will be most significant over the very short separation distances.
2.4.3.2.2. Capillary forces
Condensation of water vapour between adjacent particles leads to formation of the
liquid bridge and the surface tension force arising due to this produces an adhesive
force called capillary forces.
These forces can be represented by the following equation [120]:
rCosFc 4 2.5
Where:
Fc is the capillary interactive force between particles; r is the radius of the particle, γ
is the surface tension and θ is the contact angle between particular solids and liquids.
These interactions do not occur immediately on contact but it increases with time to
its maximum value. Also hydrophilic compounds will experience higher capillary
interaction than the hydrophobic compounds.
2.4.3.2.3. Solid bridging between particles
This type of interaction is not the primary interaction mechanism but occurs over a
period of time. Solid bridge interactions occurs between particles in different ways
like direct chemical interaction between the particles or reaction of particulate solids,
partial melting of low melting point solids caused by friction of heat and subsequent
cooling, crystallization of solid in the liquid film separating particles due to
temperature fluctuations or formation of mineral bridges between particles of the
same materials.
Chapter 2 Literature Review
27
Thus the total adhesional force (F) is given by the following equation [120]:
smimec FFFFFF 2.6
Where:
Fc, Fe, Fim, Fm and Fs are capillary, contact potential, coulombic, intermolecular and
solid bridge interaction force component respectively.
Of all the above listed forces, van der Waals forces are considered to be the principal
force existing between drugs and carrier or the container surfaces [75]. In humid
environments, the adhesion forces increase due to the capillary force. When the
relative humidity (RH) is above 50% then the capillary forces dominate [121].
2.4.4. Measurement of adhesion forces
There are various techniques to determine the adhesion force between the particles.
The methods which have been used are vibration [122], centrifugation [123-124] and
impact separation methods [125]. These methods determine the forces of adhesion
between the two bodies by measuring the amount or number of particles detached
from the surface. However one disadvantage of these methods is that the adhesion
force between a single particle and the substrate cannot be determined. Hence in
order to measure this other methods like microbalance [126] and AFM colloid probe
techniques [127] are available. Currently, AFM is the most sophisticated and widely
used technique for determining adhesion forces between an individual particle and
the substrate and this is discussed in detail in the following section.
2.4.4.1. Atomic Force Microscope (AFM)
AFM technique was first invented by Binnig, Quate and Gerber in 1986 and is used
for exploring the sample surfaces by means of mechanical scanning [128]. Tri-
dimensional mapping of the surfaces is possible with the resolution available in the
subnanometer range. This technique is widely used to determine the surface
roughness of various samples and the forces of adhesion between two samples [129-
130]. AFM can be used to investigate various materials like ceramics, composites,
glass, synthetic and biological membranes, metals, polymers and semiconductors. It
can be used to study various phenomena like abrasion, adhesion, cleaning, corrosion,
etching, friction, lubrication, plating and polishing [129]. The advantages of this
Chapter 2 Literature Review
28
technique are high magnification and superior resolution as compared to electron
microscopes. Also no expensive sample preparation is required as compared to SEM.
e.g. Gold coating of the sample is required to make the sample electrically
conductive in SEM.
Basic principles of AFM
A schematic diagram of AFM is shown in Figure 2.3. The microscope consists of
sharp tips, flexible cantilevers, a sensitive deflection sensor and high resolution tip
sample positioning.
Tip and cantilever: The tip is mounted at the end of a small cantilever. The tip is in
close contact with the sample and gives rise to image through its force interaction
with the surface of the sample.
Deflection sensor: The vertical deflection of the cantilever can be measured by AFM
with picometer resolution. A laser beam is reflected from the backside of the
cantilever onto a position sensitive photodetector consisting of two side by side
photodiodes. Even a small deflection of the cantilever will tilt the reflected beam and
change the position of the beam on the photodetector. The difference between the
two photodiode signals indicates the position of the laser spot on the detector and
thus the angular deflection of the cantilever.
Image formation: Images are formed by recording the effects of the interaction
forces between the tip and surface as the cantilever is scanned over the sample. The
scanner and the electronic feedback circuit together with sample, cantilever and
optical lever form a feedback loop set up for the purpose. This feedback system
ensures that the AFM measures not only the force of the sample but also controls it,
allowing acquisition of images at very low tip-to-sample forces.
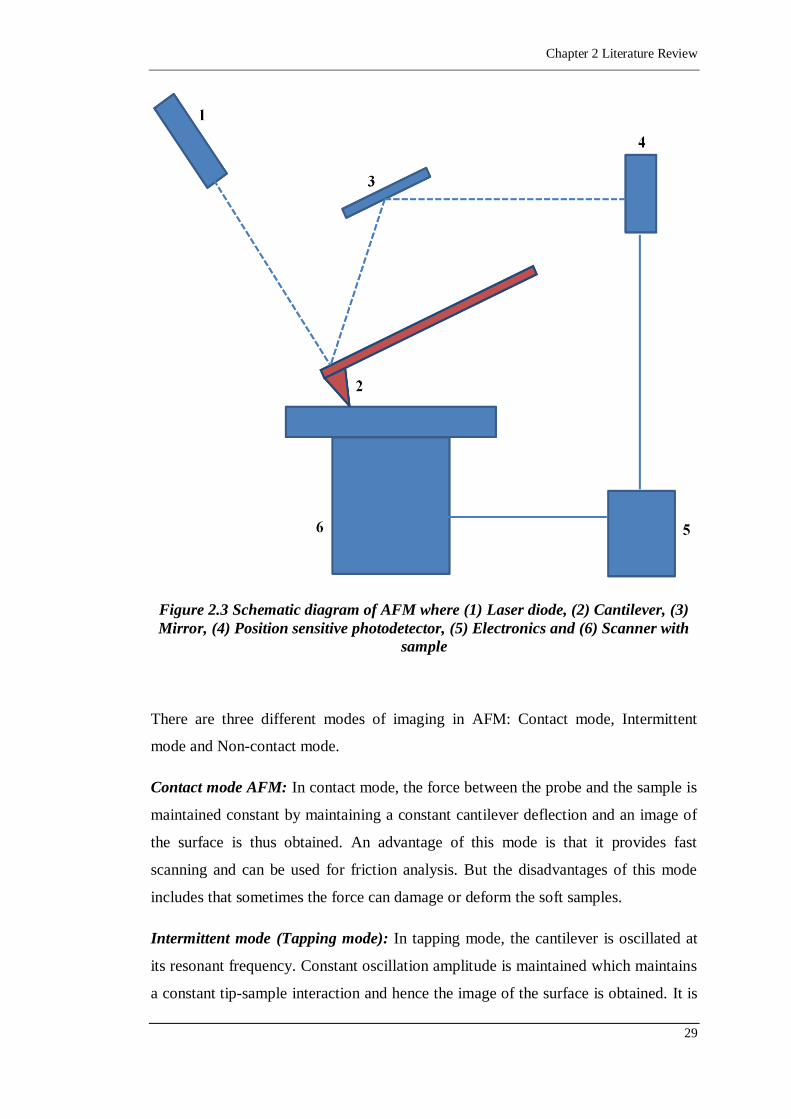
Chapter 2 Literature Review
29
Figure 2.3 Schematic diagram of AFM where (1) Laser diode, (2) Cantilever, (3)
Mirror, (4) Position sensitive photodetector, (5) Electronics and (6) Scanner with
sample
There are three different modes of imaging in AFM: Contact mode, Intermittent
mode and Non-contact mode.
Contact mode AFM: In contact mode, the force between the probe and the sample is
maintained constant by maintaining a constant cantilever deflection and an image of
the surface is thus obtained. An advantage of this mode is that it provides fast
scanning and can be used for friction analysis. But the disadvantages of this mode
includes that sometimes the force can damage or deform the soft samples.
Intermittent mode (Tapping mode): In tapping mode, the cantilever is oscillated at
its resonant frequency. Constant oscillation amplitude is maintained which maintains
a constant tip-sample interaction and hence the image of the surface is obtained. It is
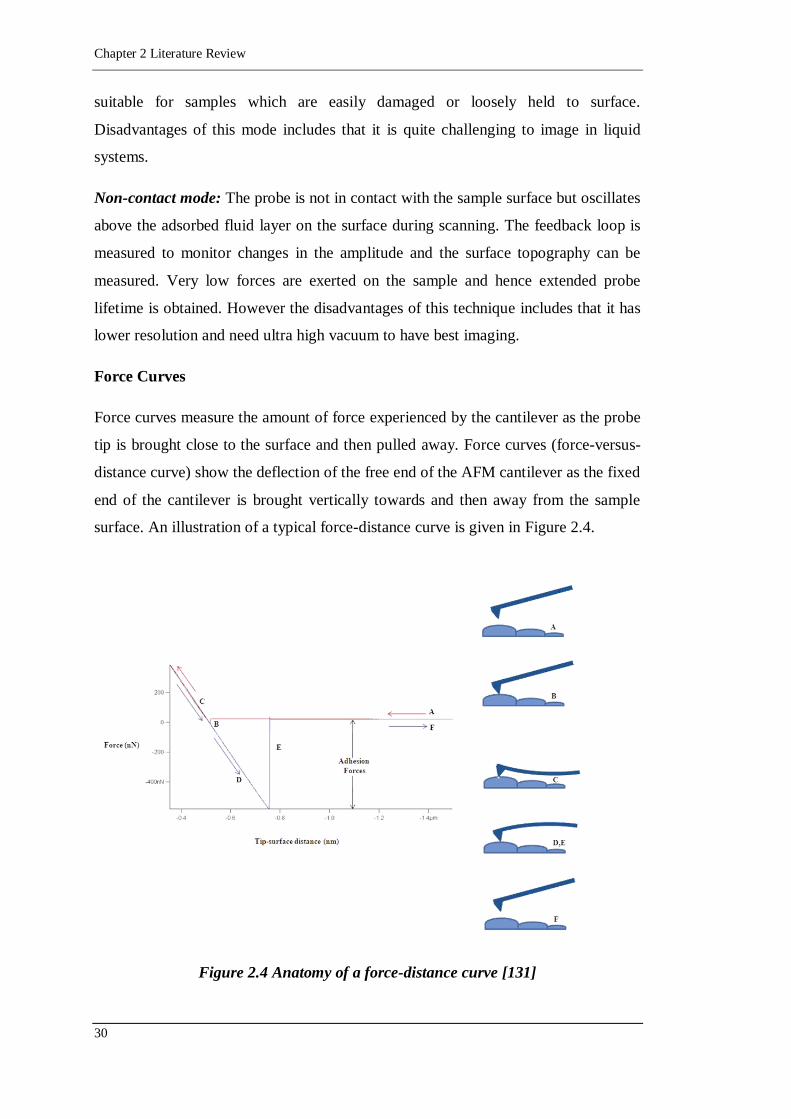
Chapter 2 Literature Review
30
suitable for samples which are easily damaged or loosely held to surface.
Disadvantages of this mode includes that it is quite challenging to image in liquid
systems.
Non-contact mode: The probe is not in contact with the sample surface but oscillates
above the adsorbed fluid layer on the surface during scanning. The feedback loop is
measured to monitor changes in the amplitude and the surface topography can be
measured. Very low forces are exerted on the sample and hence extended probe
lifetime is obtained. However the disadvantages of this technique includes that it has
lower resolution and need ultra high vacuum to have best imaging.
Force Curves
Force curves measure the amount of force experienced by the cantilever as the probe
tip is brought close to the surface and then pulled away. Force curves (force-versus-
distance curve) show the deflection of the free end of the AFM cantilever as the fixed
end of the cantilever is brought vertically towards and then away from the sample
surface. An illustration of a typical force-distance curve is given in Figure 2.4.
Figure 2.4 Anatomy of a force-distance curve [131]
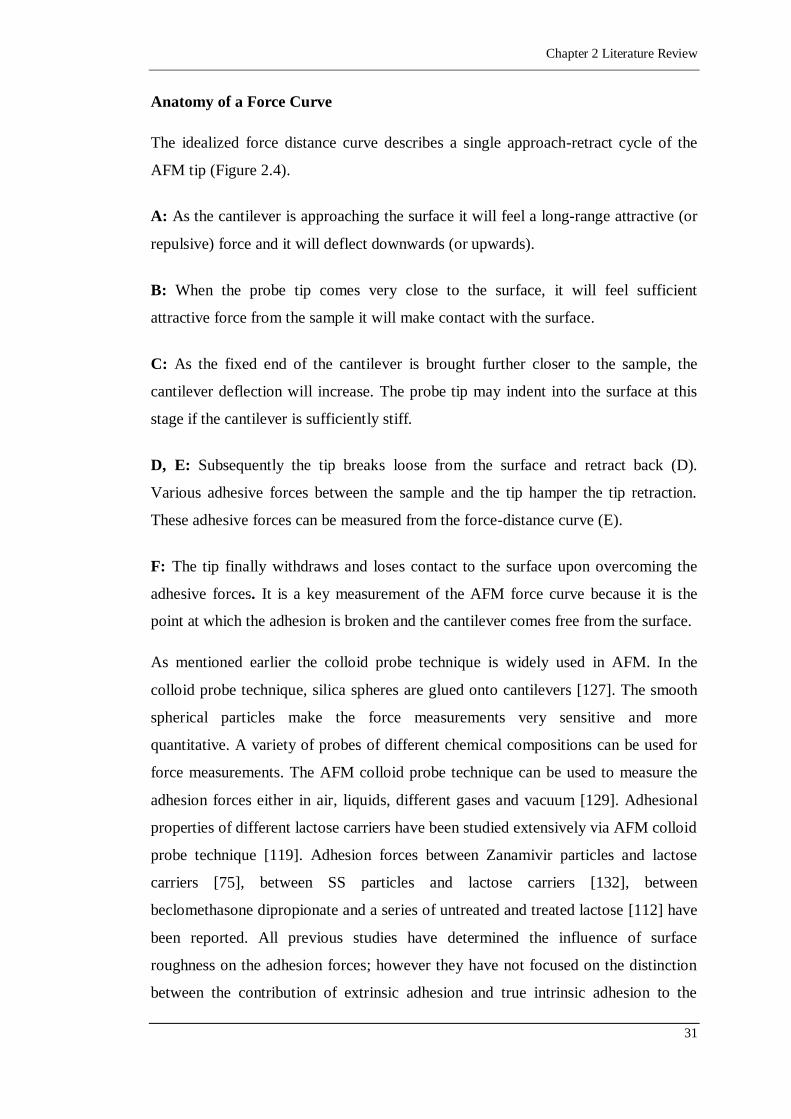
Chapter 2 Literature Review
31
Anatomy of a Force Curve
The idealized force distance curve describes a single approach-retract cycle of the
AFM tip (Figure 2.4).
A: As the cantilever is approaching the surface it will feel a long-range attractive (or
repulsive) force and it will deflect downwards (or upwards).
B: When the probe tip comes very close to the surface, it will feel sufficient
attractive force from the sample it will make contact with the surface.
C: As the fixed end of the cantilever is brought further closer to the sample, the
cantilever deflection will increase. The probe tip may indent into the surface at this
stage if the cantilever is sufficiently stiff.
D, E: Subsequently the tip breaks loose from the surface and retract back (D).
Various adhesive forces between the sample and the tip hamper the tip retraction.
These adhesive forces can be measured from the force-distance curve (E).
F: The tip finally withdraws and loses contact to the surface upon overcoming the
adhesive forces. It is a key measurement of the AFM force curve because it is the
point at which the adhesion is broken and the cantilever comes free from the surface.
As mentioned earlier the colloid probe technique is widely used in AFM. In the
colloid probe technique, silica spheres are glued onto cantilevers [127]. The smooth
spherical particles make the force measurements very sensitive and more
quantitative. A variety of probes of different chemical compositions can be used for
force measurements. The AFM colloid probe technique can be used to measure the
adhesion forces either in air, liquids, different gases and vacuum [129]. Adhesional
properties of different lactose carriers have been studied extensively via AFM colloid
probe technique [119]. Adhesion forces between Zanamivir particles and lactose
carriers [75], between SS particles and lactose carriers [132], between
beclomethasone dipropionate and a series of untreated and treated lactose [112] have
been reported. All previous studies have determined the influence of surface
roughness on the adhesion forces; however they have not focused on the distinction
between the contribution of extrinsic adhesion and true intrinsic adhesion to the
Chapter 2 Literature Review
32
surface roughness. Islam et al reported the adhesion forces between SX and lactose
carriers and they took into account the forces due to intrinsic and extrinsic adhesion.
The estimate of the intrinsic force distribution was done by eliminating the effects of
surface roughness by spin coating the lactose samples to produce atomically smooth
surfaces. They found that the adhesion force distributions on the spin-coated films
were much narrower as compared to the lactose particles indicating that the surface
roughness of the lactose particles played a major role in affecting the adhesion forces
[133]. The adhesion forces between various sugar carriers (β cyclodextrin, lactose,
raffinose, trehalose and xylitol) and SS have been determined using AFM and the
adhesion force data was used to correlate with the in vitro delivery performance of
the drug from these sugar carriers [134]. The adhesion forces between lactose and
erythritol carriers and SS have been investigated using AFM. Less aerosolization of
SS was observed from erythritol carrier when compared to lactose carrier which was
attributed to the high adhesiveness of SS to erythritol [135]. Forces of interaction
between insulin microspheres and five different polymer surfaces which are used as
device materials for DPI have been determined using colloidal probe AFM [136].
All these studies addressed the application of AFM techniques as a tool for the
characterization of particle interaction in pharmaceutical powders.
2.4.4.2. Factors affecting adhesion force and drug dispersion
Adhesion force between the drug and carrier is affected by various parameters like
particle size and shape [137], surface roughness, surface free energy, geometry of
contact area [138], relative humidity [92], electrostatic charge [139], temperature
[140], contact time [141] and applied load [142] which in turn affects drug
dispersion. The major factors affecting the drug dispersion are explained below.
2.4.4.2.1. Particle size and shape
It was observed by Corn using the centrifuge technique that as the particle size
increased the adhesion force also increased [126]. In an another investigation using a
microbalance method Corn found that the forces of detachment of a particle from the
surface was directly proportional to particle diameter (d) and using air jet methods
and centrifugation methods it was found proportional to d2 and d
3 respectively [143].
Lam et al studied the effect of the particle size on the adhesion behaviour of
powders. They found that the adhesive forces between the steel substrate and starch
Chapter 2 Literature Review
33
and spray dried particles in the increasing size range of 32-75 µm determined by
centrifugation method is directly proportional to the radius of the particles [137].
Kulvanich et al used the centrifuge technique and found that as the particle size of
the adherent increased, the adhesive tendency of the powders decreased [144].
Another study by Katainen et al confirmed that the particle size had a significant
effect on the adhesion forces between the two substrates [45]. Podczeck determined
that as the particle size of the carrier decreased the adhesion forces in an interactive
mixture increases [145].
2.4.4.2.2. Surface free energy
The effect of surface free energy on the adhesion forces has been investigated by
many researchers [112, 146-151]. Modification of the lactose surface by smoothing it
with magnesium stearate (MgSt) resulted in the decrease in the surface free energy of
the lactose carriers which lowers the energy barrier between the drug
Beclomethasone dipropionate (BDP) and the carrier and hence resulted in increased
FPF of BDP [112]. It was found that supercritically produced SX particles possessed
lower surface free energy which was measured by Inverse Gas Chromatography
(IGC) and this resulted in better FPF of the drug when compared with micronized SX
[146, 149-150]. In a study by Vasu et al, increased FPF from Rifampicin was
observed than Rifampicin loaded PLGA microparticles due to decreased surface
energy of Rifampicin [148]. James et al characterized two excipients, sub-micron α
lactose and sub-micron sucrose and found that the surface free energy of sub-micron
sucrose was higher when compared with sub-micron α lactose and hence the lactose
had lower adhesive interactions with the active drugs [147]. Traini et al studied the
surface characteristics of different pseudopolymorphs of lactose which had different
surface chemistries and surface energies and correlated it with aerosolization studies.
They established that an inverse relationship existed between the surface energy and
aerosolization studies due to increased carrier particle adhesion which reduced the
detachment of drug during aerosolization process [151]. Similarly an inverse
relationship was observed between the surface free energies of supercritical fluid
engineered albuterol or budesonide particles and their aerosolization from the lactose
blends. The reduced surface free energies from these powders minimized the drug-
carrier particle interactions which resulted in efficient drug detachment from the
carrier surface during aerosolization [152]. A similar kind of relationship was also
Chapter 2 Literature Review
34
observed between three SX samples (SX, SX-I and SX-II) [153] and lactose and
between lactose and a new drug (IFNa-2b) [154]. The negative correlation between
surface free energy of spray dried and milled lactose and FPF of budesonide and
fluoroscein was observed [155]. Recently, Das et al investigated the relationship
between surface free energy of lactose and SX and its dispersibility from mixtures at
75% relative humidity (RH). It was observed that increase in the RH, caused an
increase in the surface free energies of both the powders due to surface moisture and
this in turn decreased the FPF of SX due to increased capillary interaction and/or
solid bridging [156].
In all the above investigations a decrease in the surface energy of the carrier resulted
in an increase in the FPF of the drug which was attributed to the fewer interactions
between the drug and the carrier. On the contrary, in a separate study by Cline et al
an increased FPF of Albuterol and Ipratropium bromide was observed when it was
blended with carriers (trehalose, lactose and mannitol carriers) in increasing order of
the magnitude of surface energies. This anomaly was explained by the authors that a
certain amount of minimum surface energy interaction was necessary between carrier
and drug particles to pull the highly cohesive drug particles apart during the blending
and aerosolization process [98].
2.4.4.2.3. Relative Humidity (RH)
Relative humidity plays an important role in affecting the adhesion forces which
subsequently affects the dispersion of the drug from the surface. Berard et al
investigated the effect of increasing humidity on the adhesion forces between lactose
and Zanamivir crystals. It was found that as the RH increased from 0% to 85%, the
surface topology of both the materials was modified progressively due to capillary
forces which led to the increased adhesion forces between the two [75, 157]. Tsukada
et al studied the effect of humidity on the adhesion forces between a spherical
polycrystalline drug particle and lactose monohydrate. It was found that as the
humidity increased from 30% to 90%, the adhesion forces also increased between the
two materials [158]. Price et al determined the adhesion forces between lactose
carrier and SS and Budesonide drugs using the AFM colloid probe technique at 15%
and 75% RH. They observed that the adhesion forces increased with the increase in
RH due to the capillary forces acting between then which can reduce the
deaggregation and dispersion of the drug [159]. The thickness of the adsorbed
Chapter 2 Literature Review
35
moisture layers on the surface of lactose were also measured by AFM which in turn
affected the adhesion force [160]. Podczeck et al investigated the influence of
changing humidity on the autoadhesion of lactose and SX particles. It was observed
that the increase in humidity caused an increase in the autoadhesion forces [161].
Hooton et al studied the influence of different humidity (<10% to 65%) on the
adhesion forces of SS prepared by two different methods which yielded different
surface chemistries and geometry. They observed that as the humidity increased
there can be an increase or decrease in the adhesion forces which is attributed to the
varying geometry of the surfaces and the distribution of water on those asperities
[162]. Young et al determined the cohesion between drugs as a function of humidity
using the AFM. They observed increased cohesion as the humidity was raised from
15% to 75%. It depended on the type of drug, the presence of predominant capillary
forces at high RH or the presence of the attractive electrostatic interactions which
were dissipated at high RH [163-164]. Young et al later investigated the cohesion
forces between the three drugs (SS, Triamcinolone acetonide, Di-sodium
cromoglycate) as a function of RH and correlated the separation energy
measurements with the aerosolization performance. It was observed that the adhesion
forces were inversely proportional to aerosolization performance which was
measured as FPF of the drug [165].
Thus all these studies indicated that the relative humidity is capable of influencing
the forces of adhesion between two materials predominantly due to capillary forces
acting between the two which can in turn affect the FPF of the drug.
2.4.4.2.4. Surface roughness
Surface roughness is another important factor to be considered in particle to surface
adhesion. The increased surface roughness can increase the force of adhesion
between particles and surfaces if the particles are small, as they are able to slip into
the valleys between individual asperities. This was very well demonstrated by Beach
et al who had carried out adhesion force measurements between pharmaceutical
particles (Beclomethasone dipropionate, lactose) and rough polymeric surfaces of
polypropylene coatings, polycarbonate and acrylonitrile-butadiene-styrene. The
measurements revealed that roughness of the interacting surfaces had a significant
impact on the pull-off forces [166] (Figure 2.5). Meine et al also measured the
adhesion forces between polymer balls of polyethylene and silicon wafer under ultra
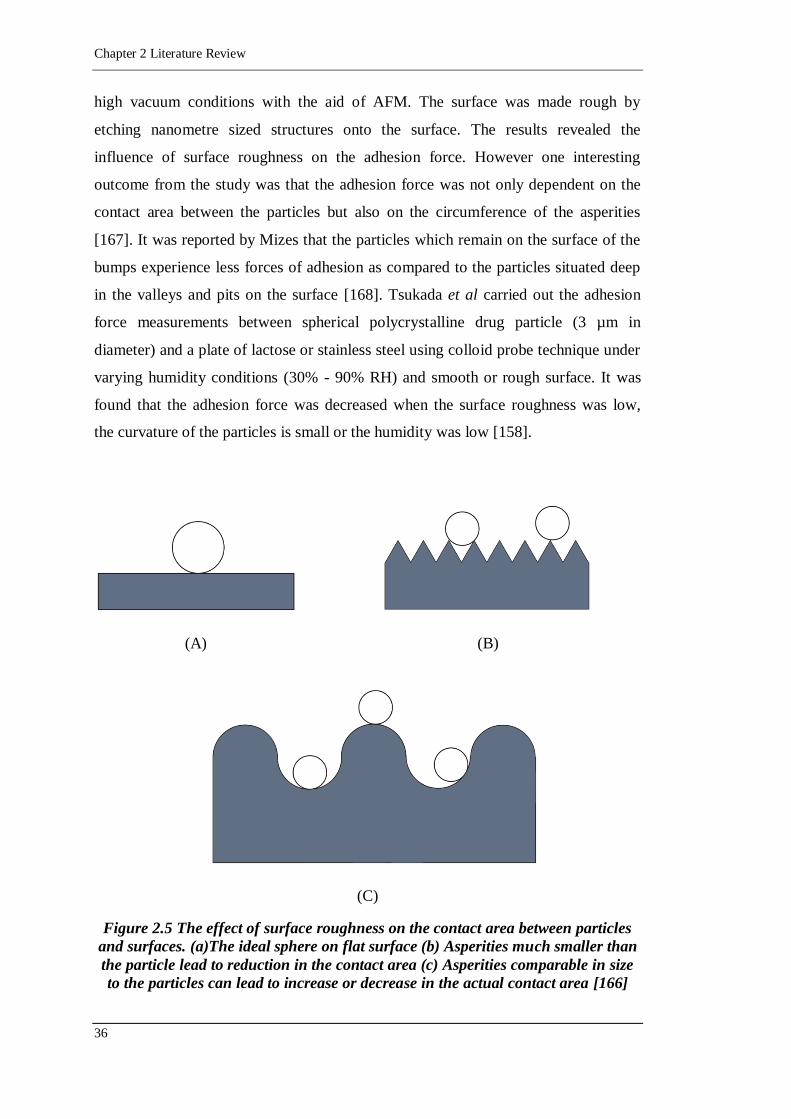
Chapter 2 Literature Review
36
high vacuum conditions with the aid of AFM. The surface was made rough by
etching nanometre sized structures onto the surface. The results revealed the
influence of surface roughness on the adhesion force. However one interesting
outcome from the study was that the adhesion force was not only dependent on the
contact area between the particles but also on the circumference of the asperities
[167]. It was reported by Mizes that the particles which remain on the surface of the
bumps experience less forces of adhesion as compared to the particles situated deep
in the valleys and pits on the surface [168]. Tsukada et al carried out the adhesion
force measurements between spherical polycrystalline drug particle (3 µm in
diameter) and a plate of lactose or stainless steel using colloid probe technique under
varying humidity conditions (30% - 90% RH) and smooth or rough surface. It was
found that the adhesion force was decreased when the surface roughness was low,
the curvature of the particles is small or the humidity was low [158].
(A) (B)
(C)
Figure 2.5 The effect of surface roughness on the contact area between particles
and surfaces. (a)The ideal sphere on flat surface (b) Asperities much smaller than
the particle lead to reduction in the contact area (c) Asperities comparable in size
to the particles can lead to increase or decrease in the actual contact area [166]
Chapter 2 Literature Review
37
Adi et al conducted a study to examine the effect of surface morphology and particle
adhesion on the FPF of the spherical model drug particles of bovine serum albumin
with different degrees of surface corrugation. It was found that as the degree of
corrugation (surface roughness) increased the particle adhesion was reduced which
resulted in a concomitant increase in the FPF of the drug [169]. Eve et al determined
the adhesion forces between Salbutamol and four different substrates and it was
found that surface roughness was a dominant factor in controlling the adhesion of
salbutamol to either lactose or salbutamol [170]. In a separate study by Young et al,
the lactose particles were made smooth and they resulted in lower energy of
separation and increased FPF of the drug as compared to rougher particles suggesting
that the smoother particles yielded better dispersion of the drug [112]. Rabinovich et
al determined the adhesion forces between glass spheres and silicon wafer substrate
and found that as the surface roughness of the silicon wafer substrate increased the
adhesion forces between the two decreased [171-172]. However increased surface
roughness increased the adhesion forces between gold and mica in presence of high
relative humidity due to capillary forces acting between them [173].
Podczeck et al determined the area of contact between SX and lactose and flat
surfaces of polyethylene, polyoxyethylene and aluminium and found out that rough
irregular particles had smaller areas of contact and hence preferred for DPI
formulations [174]. Iida et al found out that increasing the smoothness of the carrier
particle (from 0.70 µm to 0.42 µm) increased the FPF of the drug but only up to a
certain level, any further increase in the smoothness of the carrier (0.37 µm) later
resulted in the decrease in the FPF of the drug. This could be because initially as the
macroscopic roughness decreased the number of drug particles remaining in
macroscopic depressions decreased which facilitated drug separation from the carrier
particles. As the carrier particles became smoother there was a larger in-contact area
between drug particles and lactose carrier which resulted in lower FPF of the drug
[175]. Flament et al studied the influence of surface roughness of lactose carrier on
the adhesion of terbutaline sulfate and found that as the surface roughness increased
there was a decrease in the FPF of the drug. This occurred because the smoother
surfaces were capable of detaching higher percentage of drug from their surfaces
[176]. Podczeck et al determined the adhesion forces between lactose and SX using
the centrifugation technique and found that the surface morphology played an
Chapter 2 Literature Review
38
important role in the contribution to the adhesion forces however they could not
assess quantitatively the effect of surface roughness on the adhesion forces [145,
177-179].
Hence the drug delivery from DPIs is influenced by the physicochemical
characteristics of carrier particles such as surface texture, particle size and particle
shape and the adhesion forces existing between the drug and the carrier [180].
2.5. Ternary components
Improvement in the dispersibility of the drug from the carrier surface has been
reported by modification of the particle surfaces using different technologies. One of
the approaches is to coat the surface of the coarse lactose by blending it with fine
lactose, MgSt or leucine [31-35].
2.5.1. Magnesium stearate
The inclusion of MgSt in the DPI formulation as a ternary additive helped in
improving the performance of the formulations [95]. Stewart found that the addition
of MgSt in DPI formulations helped in improving the performance by modifying the
interaction between carrier surface and drug particles [181]. Bolhuis et al found that
MgSt can form film layers which can adhere to drug-excipient particles and can
interfere with inter-particle bonding as a result of hydrophobic coating [182]. Gold et
al found that MgSt can reduce adhesion between the particles in powder bed [183].
Guchardi et al reported that the addition of 0.5% MgSt to the lactose blend helped in
increasing the FPF of Formoterol fumarate by 10% [184]. This occurred probably
because MgSt has a higher affinity to lactose (no electrostatic repulsion) [185].
Hence the active sites on lactose were readily occupied with MgSt and hence caused
easy liberation of drug from the lactose surface. The lubricant activity of MgSt had
been quantified using AFM [186]. Begat et al had proposed the co-processing of
Force Control Agents (FCA) (MgSt, leucine or lecithin) with SS or Budesonide by
mechanofusion process. They found that the FPF of the drugs increased considerably
because the FCAs helped in deagglomeration and aerosolization of the cohesive
powders in the system [187]. AFM studies conducted later suggested that the
processing of lactose with these FCA helped in significantly reducing the adhesive
interactions between SS and modified lactose samples [40]. Recently Islam et al
reported that there was an increase in the FPF of SS (18-33%) with the increase in
Chapter 2 Literature Review
39
concentrations of ternary component MgSt from 0.1 to 1.5%, however, the FPF of SS
decreased with further increase in the concentrations of MgSt over 2% [188]. Young
et al reported a significant increase in the FPF of Beclomethasone dipropionate when
the surface of the lactose was modified by smoothing it with MgSt [112]. Similarly
Iida et al reported an increase in the FPF of SS by layering the surface of the lactose
with MgSt [189]. The improved dispersion in the above studies was obtained as a
result of smoothing because of the high affinity of MgSt on the active sites of lactose
which forms a layer to cover the depressions and hence aid in drug separation.
Recently Tay et al in his comprehensive review has proposed three various
mechanisms by which MgSt can increase the dispersion of SS. They proposed that
MgSt can form micro-interactive units containing adhered SS and the detachment of
SS from these micro-interactive units is more favourable than SS deagglomeration.
Secondly it can be that the coating of SS particles with nano-laminates of MgSt
decreased SS particle interaction which enhances deagglomeration of SS. Thirdly the
presence of fine particles of MgSt within SS agglomerate acts as an agglomerate
modifier and improves the dispersion of SS [190].
2.5.2. Leucine
The use of leucine in the DPI formulation as a ternary additive has helped in
improving the performance of the DPI formulations [31, 191]. This is possibly due to
antiadherent action of the material [192]. Lucas et al found that the addition of spray
dried leucine to lactose carrier helped in the improvement of FPF of SS [32].
Najafabadi et al co-spray dried disodium cromoglycate (DSCG) with L-leucine
which resulted in improved deposition profiles of the drug due to anti-adherent
properties of leucine [193]. Chew et al found that co-spray drying of disodium
cromoglycate (DSCG) powders with hydrophobic amino acids (leucine,
phenylalanine, tryptophan, methionine, asparagine and arginine) helped in improving
the dispersion of DSCG. The FPF increased significantly with leucine which is
attributed to reduced intermolecular interactions between leucine and DSCG
molecules [36]. Leucine has been co-spray dried with various drugs like insulin
[194], Ambroxol hydrochloride [195] and Naringin [196] which helped in the
improvement of the aerosolization properties of the drugs. Raula et al have coated
the SS particles with leucine by using the gas-phase coating technique in an aerosol
Chapter 2 Literature Review
40
flow reactor which helped in improving the aerosolization properties of the drug
[197-200].
2.5.3. Other ternary components
In addition to the above listed ternary components, some researchers have also used
other ternary components which had resulted in improvement in the dispersion of
drug and its delivery.
It was found by Tee et al that the use of mannitol and sorbitol as ternary components
for DPIs increased the FPF of SS. In fact mannitol and sorbitol were found to
improve the FPF better as compared to the fine particles of lactose [41]. Similarly
micronized glucose were found to increase the FPF of SS [201]. The addition of fines
of erythritol [202] and polyethylene glycol [73] have also helped in the improvement
of the dispersion of the drugs.
Contrary finding was reported by Hamishehkar et al which established that the
addition of spray dried fine mannitol and spray dried leucine as ternary agents
decreased the dispersibility and deposition of PLGA microcapsules. This occurred
because spray dried mannitol or leucine particles formed agglomerates with the
PLGA microcapsules, entrapped them forming a massive net and consequently
inhibited the microcapsules to deposit in the air stream as the single particles [101].
Common techniques for surface modification of carrier particles include spray drying
[36], encapsulation using supercritical carbon dioxide [37], physical vapour
deposition of particles in an aerosol flow reactor [38-39] and dry coating of active
drug particles such as mechanofusion [40]. However, drug dispersion from these
powders is still not satisfactory.
2.6. Use of modified lactose as carriers in DPIs
As discussed above, the surface properties of lactose in inhalation products are very
critical. Lactose by itself has a highly irregular surface which affects the dispersion
of drugs from DPIs. To date various modifications have been carried out on the
lactose particles to provide efficient drug dispersion from the DPIs which are as
discussed below:
Iida et al carried out extensive studies to smooth the surfaces of the lactose carrier
particles. In one of the technique the protuberances on the surfaces of the lactose
Chapter 2 Literature Review
41
particles were smoothed by stirring the mixture of lactose in 70% v/v ethanolic
solution. In another technique, the surface of the lactose particles was covered with
sucrose tristearate or with MgSt. Another modification of the method involved
application of intermittent shear force to the core particle surface for uniform surface
processing using a high speed elliptical rotor type powder. The in vitro deposition
was tested using a Twin Stage Impinger (TSI) apparatus and Spinhaler® DPI device
or Jethaler® DPI device. An improved in vitro deposition of the drug was obtained
with surface treated lactose particles as compared to untreated lactose particles
indicating improved inhalation properties of DPI [175, 189, 203-204]. Young et al
smoothed the surface of lactose by etching it with a wetting solvent (water:ethanol =
5:3) with and without the presence of MgSt in a high speed mixer. The drug and
treated lactose blends were tested for aerosolization efficiency using the TSI and
multidose DPI. It was found that the engineered lactose provided an improved
aerosolization efficiency as compared to untreated lactose which was confirmed by
AFM studies [112]. In another technique, lactose was smoothed by the process of
surface dissolution by using the saturated solution of lactose in water and by ramping
the temperature in the dissolution vessel at controlled rate. SS-carrier blends were
tested using TSI and Cyclohaler® DPI device. The surface smoothing of lactose
resulted in increased aerosolization performance at lower drug concentrations [205].
In another attempt to modify lactose, composite carriers of lactose were prepared by
spray drying aqueous lactose solution which provided homogenous surface
roughness to the particles. The aerosol performance of these composite carriers was
tested with micronized SS using the Next Generation Impactor (NGI) (eight stage
inertial impactor) and Cyclohaler® DPI device. The FPF varied between 21.3 ± 5.4%
and 31.3 ± 1.3% between regular lactose and the composite lactose [206].
Some researchers have worked on the technique of developing a new method of
crystallizing lactose to obtain crystals with desirable size (63-90 µm), better particle
size distribution, regular shape, smooth surface, higher elongation ration and better
flow. Dhumal et al developed a new method for engineering lactose crystals with the
aid of ultrasound under different crystallization conditions whereas Zeng et al
developed a new technique for crystallization of lactose from carbopol gel. The
aerosol performance of ultrasound engineered carriers was tested with micronized SS
Chapter 2 Literature Review
42
using the Anderson cascade impactor (eight stage impactor) and Rotahaler® DPI
device and the results indicated improved aerosol performance [180, 207-208].
One important study by Zeng et al brought into light the fact that particle size and
surface smoothness of the carrier are not the sole factors for improving the dispersion
of drugs from dry powder inhalers. In fact the addition of a fine fraction of lactose
and its characteristics (micronized lactose or recrystallized fine lactose) had a
dominant effect in controlling the drug dispersion in DPI formulations. Addition of
micronized lactose increased the FPF of albuterol sulfate from 14.6 and 17.1% to
20.8 and 21.6% for the solvent-treated and untreated lactose respectively which was
determined using a TSI and a Rotahaler® DPI device [209]. This was further proved
by Islam et al in a study where the addition of fine lactose improved the dispersion of
SX and played a dominating role in controlling FPF of the drug [23].
All the above listed studies indicate the attempts made by various researchers to
smooth the surface of the lactose particles or the addition of ternary components in
an attempt to achieve efficient drug delivery. However there are a number of
variables and the data could not be considered conclusive because different
researchers have used different apparatus (TSI, 8-stage Next Generation Impactor, 8-
stage Anderson cascade impactor and 5-stage Marple Miller Impactor) and various
devices (Spinhaler®, Jethaler®, Cyclohaler®, Rotahaler® and Aerolizer®) for
determining drug dispersion.
Nevertheless as stated earlier, the aim of a DPI formulation is to have a pulmonary
drug with uniform distribution, limited dose variation, good flowability, adequate
physical stability in the device and good performance in terms of emitted dose and
FPF. A great deal of research has focused on fabricating particles with reduced
interparticulate adhesion and increased stability to improve the performance of dry
powder aerosol systems [114]. Thus it is evident that many modifications are
required to be carried out on lactose carrier particles to obtain an efficient drug
delivery. However there is a further scope for improvement in terms of drug delivery
efficiency.
2.7. Reasons for inefficient drug delivery with lactose
Most commercially available carrier-based dry powder inhalers deliver only about
20–30% of the total dose to the lungs and the rest of the drug remain adhered on the
Chapter 2 Literature Review
43
carrier surface and is subsequently swallowed, resulting in poor performance of DPI
devices with respect to drug delivery [21]. The reasons for this inefficient delivery
have not been fully elucidated. It could be attributed to irregular shape and rough
surfaces of commercially available inhalation grade lactose which affects drug
detachment during inspiration. However the difficulty associated with the use of
sugars as carriers is controlling the size, shape and surface roughness of the particle
which in turn affects the detachment of drug from the particle [25].
Another common issue with DPIs is the sensitivity of the carrier formulation to
elevated temperature and humidity. Although α-lactose monohydrate is not a
hygroscopic material, moisture ingress into DPI formulations will influence
formulation performance by various mechanisms. As the coarse carrier particles in a
DPI formulation are typically <100 µm, whereas the drug particles are 1–10 µm, the
adsorbed moisture layers will promote cohesion between particles in the bulk
formulation. Another factor to consider is the presence of amorphous regions on the
surface or within the bulk of a particle. Produced by comminution, or as a natural
feature of the production process for the material, amorphous material represents a
metastable thermodynamic state with high free energy which means a high amount
of energy would be needed to separate drug particles from carrier surfaces [210]. In
addition, lactose cannot be used for compounds that interact with the reducing sugar
function of the lactose, such as formoterol, budesonide or peptides and proteins [44].
Additionally, a number of different grades or brands of lactose are currently available
in the market. A study has been conducted by Larhrib et al and they found that
different grades of lactose produced varying delivery profiles of the inhaled drug
(SS) thereby indicating that the source and grade of lactose has a substantial effect
on the drug delivery [27]. A study by Podczeck investigated the relationship between
the physical properties of the lactose monohydrate carrier particles and the
aerodynamic behaviour of the adhered drug particles. It was found that the
relationship was very complex and any interchange of the carrier material with
respect to brand or grade was not feasible [90].
The other contributing factor to the above problem is the complex physiology of the
respiratory tract. The characteristics of the powder formulations for inhalation and a
variety of inhalation devices further aggravate the problem. Further research in this
Chapter 2 Literature Review
44
field is being conducted to improve the performance characteristics of the DPI device
in an attempt to achieve better drug dispersion [70]. To add to this, micronized drug
particles adhere around the surface of carriers and produce agglomerates and there is
poor detachment of the drug particles from the carrier surface. All these factors result
in poor delivery of the drug from the DPI.
Thus lactose as a carrier has its own limitations. The majority of previous studies
have focused on lactose-based formulations. These formulation challenges have
resulted in a significant research focus on DPI carrier technology. Hence it is
pertinent to study the potential application of other entities as carriers for dry powder
for inhalation.
2.8. Alternative carriers
2.8.1. Sugars other than lactose
Due to several drawbacks of lactose and modified lactose as a carrier for dry powder
inhalers, there is an urgent need to find suitable alternative carriers for better drug
dispersibility in DPIs.
Steckel et al explored alternative carriers like mannitol, glucose, sorbitol, maltitol
and xylitol as potential carriers in DPI formulations. Of all the sugars evaluated,
mannitol seemed to be a promising carrier for DPIs whereas sorbitol, maltitol and
xylitol sugars were not able to generate desirable FPF due to their hygroscopic
nature. However the problem of supplier variability was observed in all the carriers
evaluated which led to significant variations in the fine particle fraction of the drug
[44].
Lorant et al studied four different carriers‟ viz. crystallized mannitol (Pearlitol 110
C), spray-dried mannitol (Pearlitol 100 SD), crystallized maltitol (Maltisorb P90) and
spray-dried lactose (Lactopress SD 250) for two drugs: micronized terbutaline sulfate
and micronized formoterol fumarate. It was found that crystallized forms of the
carrier offered lower adhesion and better release of the active ingredient than spray-
dried forms. The crystallized mannitol produced maximal fine particle dose [78].
Tee et al have investigated the use of lactose, mannitol and sorbitol in the coarse and
fine form as carriers for DPI formulations for the delivery of SS [41]. Momin et al
explored the use of mannitol, dextrose, sorbitol, xylitol and maltitol for the
Chapter 2 Literature Review
45
pulmonary delivery of Budesonide and found that mannitol was the favourable
carrier for the dispersion of the drug [211].
2.8.2. Lipidic vehicles
Some researchers have investigated the use of solid lipid microparticles (SLM) as
vehicles for pulmonary administration wherein the drug was incorporated within the
SLM and was not on the surface of SLM [42-43, 212]. Sanna et al proposed that
SLM may be used as a potential carrier for antiasthmatic or antimicrobial drugs.
They formulated SLM using Compitrol® (glyceryl behenate) as the lipophilic
component and Poloxamer as the emulsifying agent. However these type of
formulations are suitable for long term treatments [43]. Jaspart et al also formulated
SLM using Compitrol® as the lipid with an aim to sustain the release of the drug into
the lungs and they propose that these formulations can be used to prepare inhalation
powders containing suitable excipients. However these SLMs are suitable for high
entrapment of the hydrophobic drugs. Hydrophilic drugs like widely used anti-
asthmatic drug SS cannot be incorporated into the lipid matrix and hence it needed to
be converted into a hydrophobic derivative like Salbutamol acetonide [42]. SLM of
Budesonide drug and cholesterol and phospholipon as the lipidic carriers have been
prepared by means of spray drying. This formulation has been tested using Multi
stage liquid impinger and Cyclohaler ® as the inhalation device. However they
propose that additional studies needs to be conducted to determine the stability of
such products [212].
2.9. Proposing polymers as alternative to sugars
All DPI formulations available in the market today utilize lactose as carrier material
[44]. The culmination of the formulation challenges with the use of lactose and its
modified counterparts have led to the exploration of new efficient alternative carriers
for inhaled therapy.
Polymers have long been used in various drug delivery technologies due to their
versatility. Polymers have been used for decades as excipient in tablet and capsule
formulations and now they are being essentially used for advanced functions like
drug targeting. They have found widespread use in drug delivery systems such as
matrices, microparticles, hydrogels and dendrimers [213]. Advanced pharmaceutical
dosage forms utilize polymers for taste masking, drug protection, increased drug
Chapter 2 Literature Review
46
bioavailability, as rheology modifiers in liquid dosage forms and as implants in
biomedical arena.
Several polymers that have been investigated for drug-delivery applications can be
broadly classified into natural and synthetic, biodegradable and non-biodegradable
polymers. Varieties of biodegradable polymers have been synthesized to deliver
drugs, macromolecules, cells and enzymes. The biodegradability of these polymers
can be manipulated by incorporating a variety of labile groups such as esters,
orthoesters, anhydrides, carbonate, amides, ureas, and urethanes in their backbone
structure [214-215]. Polyester-based polymers are one of the most widely
investigated for drug delivery. Poly(lactic acid) (PLA), poly(glycolic acid) (PGA)
and their copolymers poly(lactic acid-co-glycolic acid) are widely used biomaterials
in terms of design and performance for drug-delivery applications [214, 216]. Other
synthetic polymers used for pulmonary applications include polyanhydrides [217-
219]. Zhang et al have used polybutylcyanoacrylate to prepare nanoparticles for
intratracheal delivery [220].
Recently a large number of biodegradable polymer nanoparticles were reported to be
used in improving pulmonary delivery of drugs from powder formulations [221].
Over ten years ago the use of controlled release polymeric systems was proposed
improving the duration and effectiveness of inhaled drugs for both local and systemic
action [222] but as yet there are no DPIs on the market using biodegradable polymers
as carriers.
2.10. Polymers in pulmonary drug delivery
The below listed studies discuss the use of polymers for drug delivery to the lungs.
Polycaprolactone (PCL) polymer has been widely used in drug delivery because it is
biodegradable and undergoes hydrolysis by degradation of its ester linkages. PCL
nanoparticles have been used to encapsulate variety of drugs by nanoprecipitation,
solvent displacement and solvent evaporation techniques. Drugs such as anticancer
(Tamoxifen [223], Taxol [224], Vinblastine [225] and Docetaxel [226]), peptide
(insulin) [227], antiretroviral (Saquinavir) [228] and antifungal (Amphotericin B)
[229] have been incorporated within PCL. Recently Kho et al have formulated
nanoparticle aggregates of antibiotic-loaded PCL by a spray drying technique for
pulmonary delivery. Mannitol, lactose and leucine were used as drying adjuvants in
Chapter 2 Literature Review
47
this process to maintain the structural integrity of PCL and aqueous re-dispersibility
of the aggregates formed. Further they proposed that these Levofloxacin-loaded PCL
nanoparticle aggregates could be potentially employed for inhaled therapy. The
spherical aggregates were produced in the size range of approximately 270 nm; the
drug was encapsulated inside the nano-aggregates formed and was intended to
exhibit a longer retention time in the lungs [230]. Thus the drug was dissolved in
PCL and was not used as a surface carrier for the drug as in our present study.
Poly (lactic acid-co-glycolic acid) is a widely investigated polymer in drug delivery.
PLGA 50/50 (MW 10.6kDa) has been used as a biodegradable polymeric carrier for
pulmonary delivery of low molecular weight heparin (LMWH). The in vitro drug-
release properties of the microspheres were tested using an eight stage Anderson
Cascade impactor and the results revealed that these porous microspheres of LMWH
could be delivered via DPI as an alternative to multiple parenteral administrations of
LMWH [231]. Microspheres of SS with PLGA 85/15, PLGA 50/50 (MW: 83,000
Da) and PLGA 75/25 (MW: 151,000 Da) (particle size: 92-207 µm) have been
formulated to achieve controlled drug delivery (extended release for 96 hours with
one formulation) but the polymer has not been evaluated for the purpose of carrier in
a DPI device [52, 54]. In another study, Ciprofloxacin nanoparticles (nanoCipro)
were encapsulated in large porous PLGA particles [PLGA 50/50 (MW 31,000)]
which resulted in a steady release of ciprofloxacin in the lungs. [51]. In another
attempt, Poly lactic acid (PLA) (MW 75,000-125,000 Da) polymer was used to
incorporate two glucocorticoid drugs Triamcinolone acetonide and Budesonide for a
slow-release formulation for pulmonary targeting. The powders were coated with
nanometre-thin layers of biodegradable polymers prepared using pulse laser
deposition technique. The respirable fraction of the micronized particles of the drugs
coated using optimum laser energy density were determined using an eight stage
cascade impactor and Aerolizer® inhaler device [53, 55]. Insulin had been
successfully encapsulated in the PLGA 75/25 nanospheres and intended for
administration via the lungs [232]. PLGA microspheres have been formulated in the
respirable size range of 3-7 µm and treated with polyamino acids and isopropanol to
obtain particles of surface charge suitable for use in DPIs [233-234]. The
electrostatic charge on the microspheres was determined by Electrical single particle
aerodynamic relaxation time (E-SPART) analysis and it was found that isopropanol-
Chapter 2 Literature Review
48
treated PLGA microspheres exhibited the highest surface charge and also the higher
respirable fraction than untreated and the polyamino acids-treated microspheres.
Recombinant tuberculosis antigen has been encapsulated in PLGA 75/25
microparticles (3.3 µm) to extend the release of the antigen up to 10 days [235].
Chitosan is another polymer which has been extensively studied in pulmonary drug
delivery. Learoyd et al prepared a DPI formulation by spray drying 30% v/v aqueous
ethanol formulation containing terbutaline sulfate, lactose, leucine and chitosan. The
aerosolization of the powder was investigated using a Multi-Stage Liquid Impinger
(MSLI) aerosolized from a Spinhaler® DPI device. The FPF of the drug was found
to be dependent on the molecular weight of chitosan. The low MW formulation
exhibited an FPF of 64% whereas the high MW formulation demonstrated an FPF of
54%. The higher MW chitosan increased the viscosity of spray dried solution which
influenced the ability of the leucine to migrate to the surface during the spray drying
process. This in turn affected the interparticulate cohesion and decreased the
deaggregation of the particles during aerosolization [236]. In another study by
Corrigan et al, salbutamol sulfate/chitosan systems with and without the crosslinking
agent formaldehyde were prepared using spray drying. Chitosan–salbutamol sulfate
composites were compressed into discs and the drug release was quantified which
demonstrated delayed release of the drug. TSI analysis indicated good in vitro
deposition of the microparticulates as the respirable fraction obtained was 36.4%
[237]. Huang et al carried out in vivo studies on Betamethasone-loaded
microparticles which were prepared by a spray drying method using chitosan as raw
material, type-A gelatin and ethylene oxide-propylene oxide block copolymer
(Pluronic F68) as modifiers. In vivo studies in rats were carried out and the drug
treatment to the rats was provided by using Dry Powder Insufflators (Penn-Century,
DP-4). Reductions in the inflammatory biochemical parameters were observed which
indicated that the drug was efficiently delivered in the pulmonary tissues by this
technique [238-240].
Salama et al prepared a series of co-spray dried microparticles containing the anti-
asthmatic drug di-sodium cromoglycate and different concentrations of polyvinyl
alcohol as controlled release vehicles for drug delivery to the respiratory tract. The in
vitro performance was tested using a 5-stage Marple Miller Impactor and
Chapter 2 Literature Review
49
Cyclohaler® DPI device and resulted in the FPF of 16.71±0.73% to 30.76±1.5%
from increasing concentrations of PVA (0% to 90%) [241].
The literature indicates that polymer matrices have been used in pulmonary drug
delivery to control or sustain the release of drugs of which PLGA and chitosan have
been widely investigated. PLGA microspheres incorporating SS have been reported
but they have been used for achieving sustained drug release into the lungs and not
for the purpose of carrier in DPIs. Composites of SS and chitosan have also been
reported but they were formulated with the perspective of achieving controlled drug
release. Thus there have been no reports of the use of polymers (PCL or PLGA) as
carriers for SS in DPIs per se and our work revolves round the use of PCL and PLGA
polymers as carriers for dry powder inhalers.
2.11. Hypothesis that polymers can fill in the gap
The use of polymeric systems to achieve controlled drug delivery in the pulmonary
system is still in its infancy and their use as carriers in DPIs is still an unexplored
arena. Hence it is important to evaluate potential polymer candidates as alternative
carriers in DPI products. Controlling the particle size, shape and surface roughness of
polymers is much easier [50] as compared to sugars. Thus it will be worthwhile to
research biodegradable polymers with controlled surface functionality which can be
used as carriers for the pulmonary delivery of drugs from powder formulation.
Thus our work involved producing microparticles of PCL and PLGA polymers with
controlled size and shape and extensively studying the surface properties of carrier
particles. It would involve thorough investigation of the surface roughness of the
polymeric carrier particle and the measurement of adhesional forces between the
drug and the carrier particles. Adhesion force measurements between the polymer
film and silica sphere, polymer film and the drug coated silica sphere, polymer
particle and silica sphere and finally polymer particle and drug coated silica sphere
will be measured. These data would largely help us to understand the nature of the
surface of the polymer carrier and its role in influencing the adhesion to the drug and
thereby finally influencing the dispersion of the drug from the carrier.

Chapter 3 General Methods
51
CChhaapptteerr 33
GGeenneerraall MMeetthhooddss
Chapter 3 General Methods

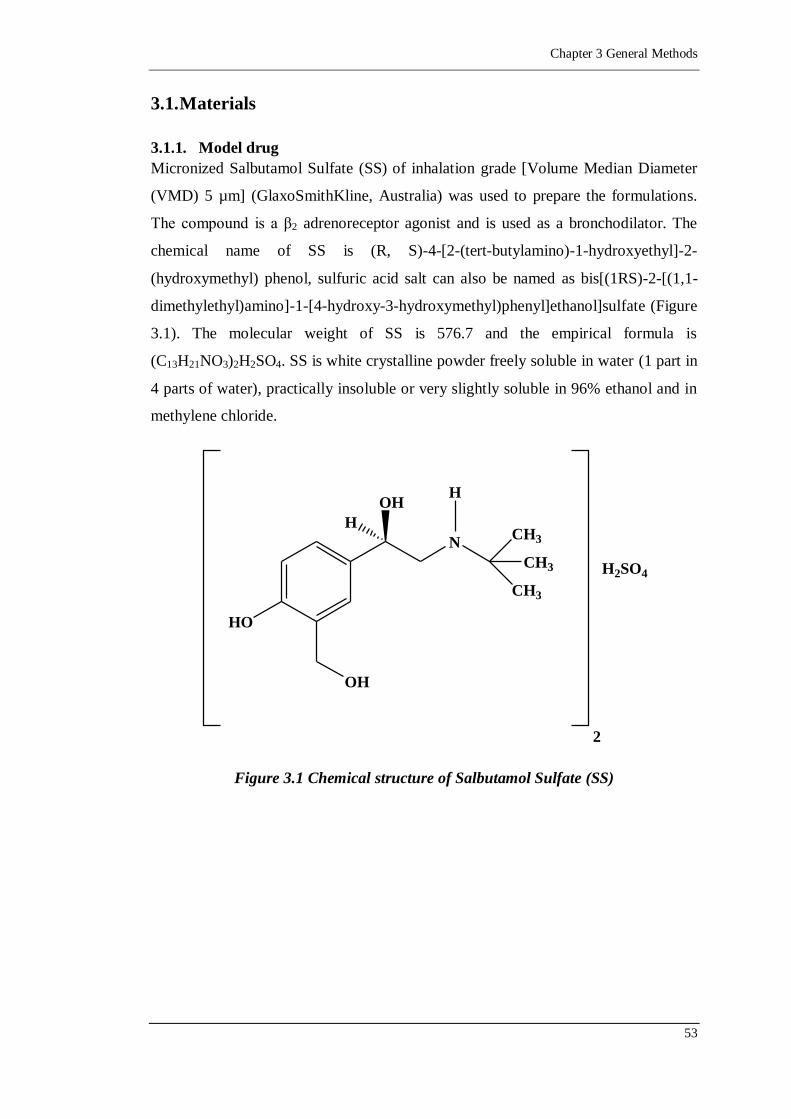
Chapter 3 General Methods
53
3.1. Materials
3.1.1. Model drug
Micronized Salbutamol Sulfate (SS) of inhalation grade [Volume Median Diameter
(VMD) 5 µm] (GlaxoSmithKline, Australia) was used to prepare the formulations.
The compound is a β2 adrenoreceptor agonist and is used as a bronchodilator. The
chemical name of SS is (R, S)-4-[2-(tert-butylamino)-1-hydroxyethyl]-2-
(hydroxymethyl) phenol, sulfuric acid salt can also be named as bis[(1RS)-2-[(1,1-
dimethylethyl)amino]-1-[4-hydroxy-3-hydroxymethyl)phenyl]ethanol]sulfate (Figure
3.1). The molecular weight of SS is 576.7 and the empirical formula is
(C13H21NO3)2H2SO4. SS is white crystalline powder freely soluble in water (1 part in
4 parts of water), practically insoluble or very slightly soluble in 96% ethanol and in
methylene chloride.
HO
OH
N
OH
H
H
CH3
CH3
CH3
2
H2SO4
Figure 3.1 Chemical structure of Salbutamol Sulfate (SS)
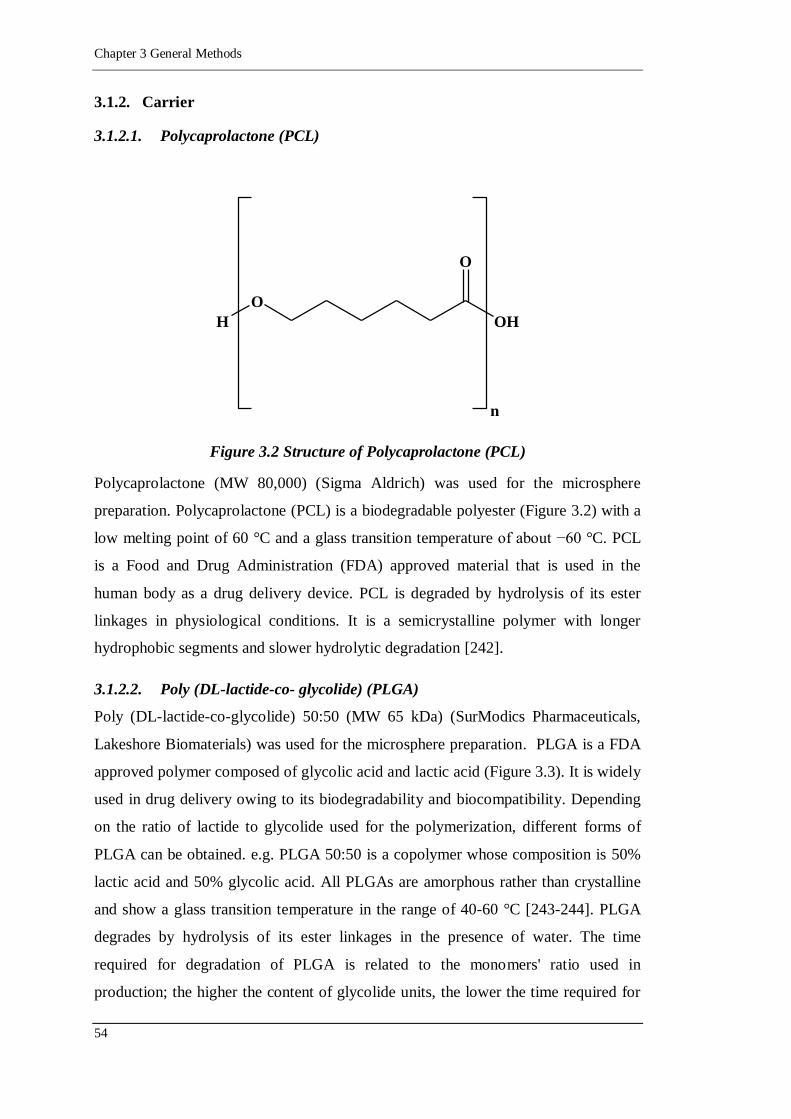
Chapter 3 General Methods
54
3.1.2. Carrier
3.1.2.1. Polycaprolactone (PCL)
H
O
OH
O
n
Figure 3.2 Structure of Polycaprolactone (PCL)
Polycaprolactone (MW 80,000) (Sigma Aldrich) was used for the microsphere
preparation. Polycaprolactone (PCL) is a biodegradable polyester (Figure 3.2) with a
low melting point of 60 °C and a glass transition temperature of about −60 °C. PCL
is a Food and Drug Administration (FDA) approved material that is used in the
human body as a drug delivery device. PCL is degraded by hydrolysis of its ester
linkages in physiological conditions. It is a semicrystalline polymer with longer
hydrophobic segments and slower hydrolytic degradation [242].
3.1.2.2. Poly (DL-lactide-co- glycolide) (PLGA)
Poly (DL-lactide-co-glycolide) 50:50 (MW 65 kDa) (SurModics Pharmaceuticals,
Lakeshore Biomaterials) was used for the microsphere preparation. PLGA is a FDA
approved polymer composed of glycolic acid and lactic acid (Figure 3.3). It is widely
used in drug delivery owing to its biodegradability and biocompatibility. Depending
on the ratio of lactide to glycolide used for the polymerization, different forms of
PLGA can be obtained. e.g. PLGA 50:50 is a copolymer whose composition is 50%
lactic acid and 50% glycolic acid. All PLGAs are amorphous rather than crystalline
and show a glass transition temperature in the range of 40-60 °C [243-244]. PLGA
degrades by hydrolysis of its ester linkages in the presence of water. The time
required for degradation of PLGA is related to the monomers' ratio used in
production; the higher the content of glycolide units, the lower the time required for
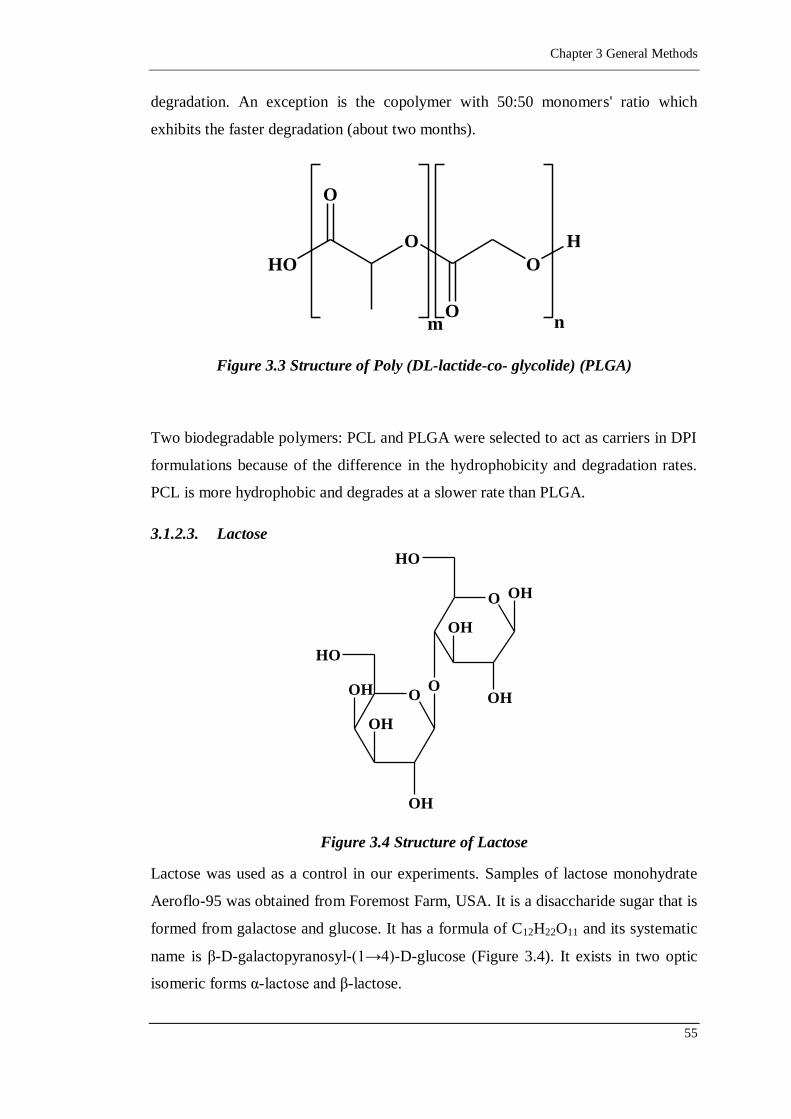
Chapter 3 General Methods
55
degradation. An exception is the copolymer with 50:50 monomers' ratio which
exhibits the faster degradation (about two months).
HO
O
O
H
O
Om n
Figure 3.3 Structure of Poly (DL-lactide-co- glycolide) (PLGA)
Two biodegradable polymers: PCL and PLGA were selected to act as carriers in DPI
formulations because of the difference in the hydrophobicity and degradation rates.
PCL is more hydrophobic and degrades at a slower rate than PLGA.
3.1.2.3. Lactose
O
HO
OH
OH
OH
O
O
HO
OH
OH
OH
Figure 3.4 Structure of Lactose
Lactose was used as a control in our experiments. Samples of lactose monohydrate
Aeroflo-95 was obtained from Foremost Farm, USA. It is a disaccharide sugar that is
formed from galactose and glucose. It has a formula of C12H22O11 and its systematic
name is β-D-galactopyranosyl-(1→4)-D-glucose (Figure 3.4). It exists in two optic
isomeric forms α-lactose and β-lactose.
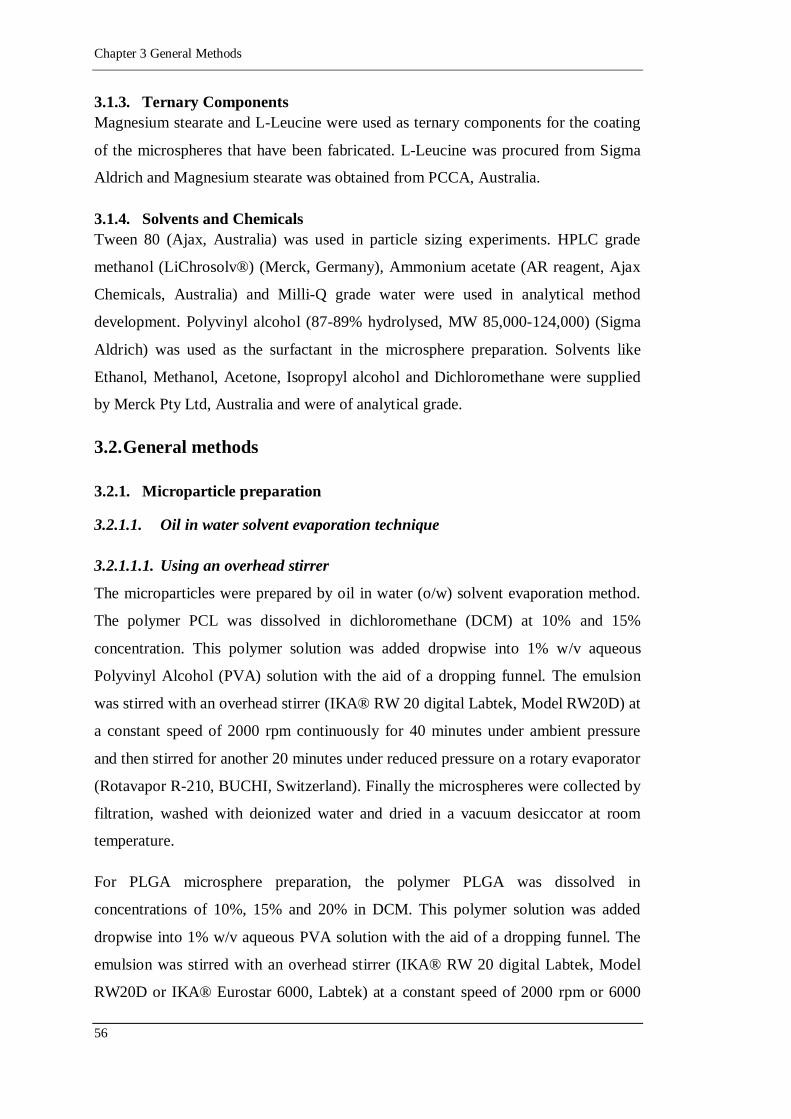
Chapter 3 General Methods
56
3.1.3. Ternary Components
Magnesium stearate and L-Leucine were used as ternary components for the coating
of the microspheres that have been fabricated. L-Leucine was procured from Sigma
Aldrich and Magnesium stearate was obtained from PCCA, Australia.
3.1.4. Solvents and Chemicals
Tween 80 (Ajax, Australia) was used in particle sizing experiments. HPLC grade
methanol (LiChrosolv®) (Merck, Germany), Ammonium acetate (AR reagent, Ajax
Chemicals, Australia) and Milli-Q grade water were used in analytical method
development. Polyvinyl alcohol (87-89% hydrolysed, MW 85,000-124,000) (Sigma
Aldrich) was used as the surfactant in the microsphere preparation. Solvents like
Ethanol, Methanol, Acetone, Isopropyl alcohol and Dichloromethane were supplied
by Merck Pty Ltd, Australia and were of analytical grade.
3.2. General methods
3.2.1. Microparticle preparation
3.2.1.1. Oil in water solvent evaporation technique
3.2.1.1.1. Using an overhead stirrer
The microparticles were prepared by oil in water (o/w) solvent evaporation method.
The polymer PCL was dissolved in dichloromethane (DCM) at 10% and 15%
concentration. This polymer solution was added dropwise into 1% w/v aqueous
Polyvinyl Alcohol (PVA) solution with the aid of a dropping funnel. The emulsion
was stirred with an overhead stirrer (IKA® RW 20 digital Labtek, Model RW20D) at
a constant speed of 2000 rpm continuously for 40 minutes under ambient pressure
and then stirred for another 20 minutes under reduced pressure on a rotary evaporator
(Rotavapor R-210, BUCHI, Switzerland). Finally the microspheres were collected by
filtration, washed with deionized water and dried in a vacuum desiccator at room
temperature.
For PLGA microsphere preparation, the polymer PLGA was dissolved in
concentrations of 10%, 15% and 20% in DCM. This polymer solution was added
dropwise into 1% w/v aqueous PVA solution with the aid of a dropping funnel. The
emulsion was stirred with an overhead stirrer (IKA® RW 20 digital Labtek, Model
RW20D or IKA® Eurostar 6000, Labtek) at a constant speed of 2000 rpm or 6000
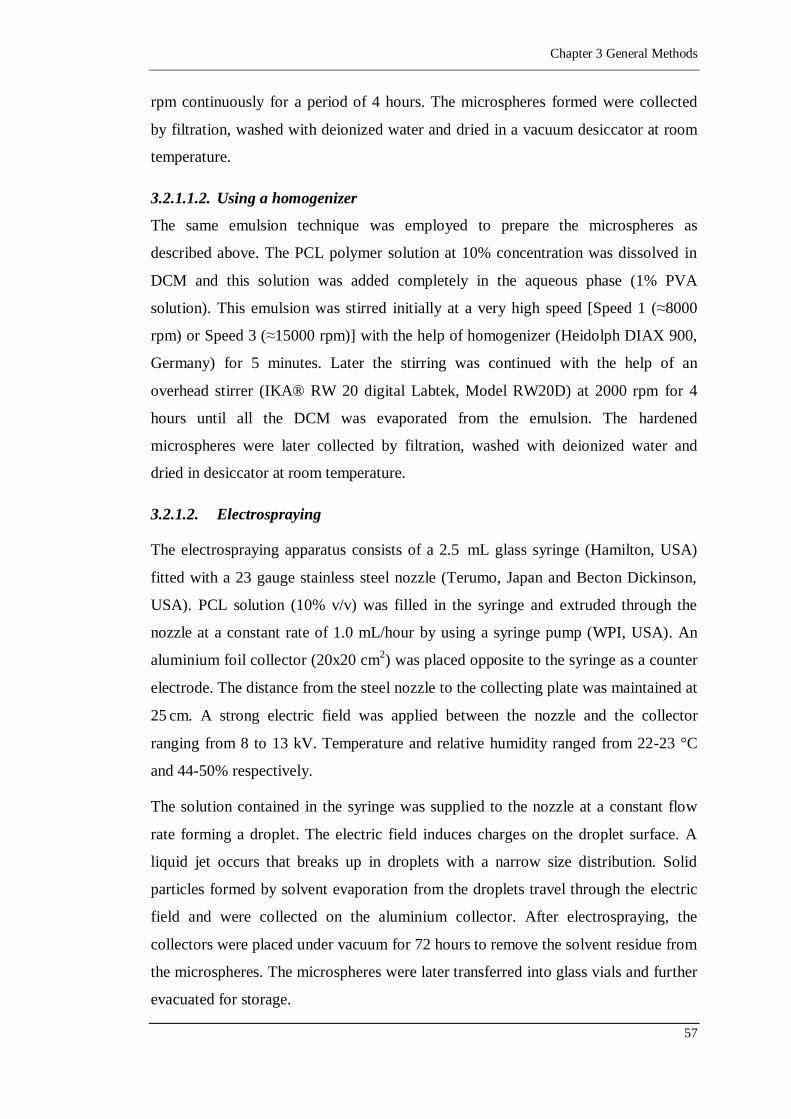
Chapter 3 General Methods
57
rpm continuously for a period of 4 hours. The microspheres formed were collected
by filtration, washed with deionized water and dried in a vacuum desiccator at room
temperature.
3.2.1.1.2. Using a homogenizer
The same emulsion technique was employed to prepare the microspheres as
described above. The PCL polymer solution at 10% concentration was dissolved in
DCM and this solution was added completely in the aqueous phase (1% PVA
solution). This emulsion was stirred initially at a very high speed [Speed 1 (≈8000
rpm) or Speed 3 (≈15000 rpm)] with the help of homogenizer (Heidolph DIAX 900,
Germany) for 5 minutes. Later the stirring was continued with the help of an
overhead stirrer (IKA® RW 20 digital Labtek, Model RW20D) at 2000 rpm for 4
hours until all the DCM was evaporated from the emulsion. The hardened
microspheres were later collected by filtration, washed with deionized water and
dried in desiccator at room temperature.
3.2.1.2. Electrospraying
The electrospraying apparatus consists of a 2.5 mL glass syringe (Hamilton, USA)
fitted with a 23 gauge stainless steel nozzle (Terumo, Japan and Becton Dickinson,
USA). PCL solution (10% v/v) was filled in the syringe and extruded through the
nozzle at a constant rate of 1.0 mL/hour by using a syringe pump (WPI, USA). An
aluminium foil collector (20x20 cm2) was placed opposite to the syringe as a counter
electrode. The distance from the steel nozzle to the collecting plate was maintained at
25 cm. A strong electric field was applied between the nozzle and the collector
ranging from 8 to 13 kV. Temperature and relative humidity ranged from 22-23 °C
and 44-50% respectively.
The solution contained in the syringe was supplied to the nozzle at a constant flow
rate forming a droplet. The electric field induces charges on the droplet surface. A
liquid jet occurs that breaks up in droplets with a narrow size distribution. Solid
particles formed by solvent evaporation from the droplets travel through the electric
field and were collected on the aluminium collector. After electrospraying, the
collectors were placed under vacuum for 72 hours to remove the solvent residue from
the microspheres. The microspheres were later transferred into glass vials and further
evacuated for storage.
Chapter 3 General Methods
58
3.2.2. Coating of microspheres
3.2.2.1. Dry powder coating
The coating of the PCL or PLGA microspheres with MgSt or leucine was done by a
hand mixing method [245-246]. Mixtures of MgSt (1% and 2%) or leucine (1% and
2%) and PCL or PLGA microspheres were prepared in 5.0 g batches. The powder
was placed between two layers of microspheres in a glass test tube along with three
ceramic beads of approximately 10 mm in diameter. The test tube was vigorously
shaken by hand for 5 minutes to ensure proper mixing. During this process ceramic
beads provided a ball milling effect for breaking up the agglomerates formed during
mixing. This same technique was used to prepare mixture of SS (2.5%) with various
carriers i.e. PCL or PLGA microspheres or lactose monohydrate (Aeroflo-95). These
mixtures were finally used for homogeneity test and in vitro aerosol deposition tests
as mentioned in Sections 3.4.2 and 3.4.3
3.2.2.2. Solution coating
The solution of MgSt was prepared in ethanol (1% and 2%) with the aid of heat and
the aqueous solution of leucine was prepared in milliQ water (1% and 2%).
Approximately 4.0 g of PCL or PLGA microspheres was coated with 10 mL of either
concentrations of MgSt solution or leucine solution by stirring for a period of 24
hours. Finally the coated microspheres were collected by filtration and dried in a
vacuum desiccator at room temperature.
3.2.3. Particle size measurement
3.2.3.1. For microspheres prepared by emulsion technique
The particle size of the carrier particles was measured by laser diffraction (Malvern
Mastersizer, Malvern Instruments Ltd, UK) using the small volume dispersion unit
(capacity 150 mL). The carrier particles were dispersed in water containing Tween
80 with the aid of sonication in a water bath for 5 minutes. This sonicated sample
was added dropwise to the sample cell containing 100 ml of distilled water until an
obscuration between 15-30% was obtained. The average particle size distribution
was measured from five replicates of each sample. The VMD is the parameter used
to characterize the size distributions of the polymeric carrier.
Particle size of SS was determined by dispersing SS in Isopropyl alcohol (IPA) with
the aid of Tween 80. A suspension of the above solution was sonicated for 5 minutes.
Chapter 3 General Methods
59
This sonicated sample was added dropwise to the sample cell containing 100 mL of
IPA until an obscuration between 15-30% was obtained. The VMD was measured
from five replicates of each sample. For lactose carrier, ethanol was used as a
solvent.
3.2.3.2. For microspheres prepared by electrospraying
In order to determine the particle size of the electrosprayed microspheres a
microscope glass slide was introduced in the electrospraying box and held in contact
with the collector in the centre of the spraying zone for 5 minutes. The slide was then
removed and analyzed by light microscopy (AxioVision, Carl Zeiss MicroImaging,
Germany). The particle size was determined from three replicates and the size was
assessed using Image J analysis software.
The laser diffraction technique for particle sizing requires approximately 100-200 mg
of the carrier particles for size measurements. As electrospraying technique is a low
throughput technique of producing microspheres, the microscopy technique was used
to measure the size as it does not require large quantities of the sample for size
determination.
3.2.4. Scanning electron microscopy (SEM)
For surface morphological studies of the carrier particles and the drug-carrier
mixture, samples were glued onto aluminium stubs using double-sided carbon sticky
tape. Particles were then sputtered with gold (thickness ~ 15-20 nm) with a sputter
coater (BIORAD SC-500) using an electrical current of 15 mA for 3 minutes.
Several photomicrographs of the samples were taken at different magnifications
using a Scanning Electron Microscope (FEI Quanta 200 SEM).
3.2.5. Energy Dispersive X-ray Analysis (EDX)
Elemental composition analysis of the carrier particles mixed with the drug was
carried out using Energy Dispersive X-ray Analysis in an SEM (Quanta 3D FIB
instrument). Samples were transferred onto aluminium stubs with the help of double-
sided carbon sticky tape. Particles were then carbon coated with a Cressington
Carbon coater using an electrical current of 100 A for 2 minutes and 10-4
mbar
pressure. Samples were analyzed for sulfur that was present as the salt of the
Salbutamol powder and magnesium for MgSt coated microspheres.
Chapter 3 General Methods
60
3.2.6. X-Ray Photoelectron Spectroscopy (XPS)
The surface composition of the uncoated and coated PCL or PLGA microspheres
was analyzed by XPS. Samples were mounted onto stainless steel sample holders
using double-sided adhesive tape. XPS analysis was performed with a Kratos Axis
Ultra spectrometer (Kratos Analytical, Manchester, UK) equipped with
monochromatized aluminium X-ray source (powered at 10 mA and 15 kV) and an
eight-channeltron detector. The analyzed area was 800 x 200 µm. The constant pass
energy was set at 160 eV for the survey spectrum and 20 eV for the narrow spectrum.
The following sequence of spectra was recorded: Survey spectrum, O1s, N1s, C1s, and
Mg2p multiplex spectra. The elemental compositions of each material were
determined using Casa XPS software Version 2.3.14.
3.2.7. Adhesion force
The adhesion forces of the polymer microspheres and the films with the uncoated
and coated silica sphere were determined by Atomic Force Microscopy (AFM) using
a colloid probe technique [127, 247]. The silicon nitride cantilever (225 ± 10 µm
long, 28 ± 7.5 µm wide and 3 ± 1 µm thick) used for the determination of adhesion
forces had a single silica particle (sphere of diameter 3.5 ± 0.1 µm) attached on the
tip of the cantilever (CP-FM-SiO-B-5, NanoAndMore, Germany). The cantilevers
have resonance frequencies ranging from 45-115 kHz and force constants ranging
from 0.5-9.5 N/m.
3.2.7.1. Measurement of spring constant
The spring constant (k) for each cantilever used was determined using the thermal
noise method [248-249]. The spring constant was found to vary from 1.12 - 2.55
N/m.
3.2.7.2. Sample preparation
3.2.7.2.1. Plasma cleaning of the cover slips
Cover slips of the size 22 x 22 mm were used (Menzel Glaser, Germany) for the
deposition of films. Harrick Plasma Cleaner (Model: PDC-002, Ithaca, NY) was used
to eliminate possible contamination from the coverslips and to make them
hydrophilic. The vacuum was attained with the help of dry oxygen service pump
(Model XDS5, Edward, USA). Oxygen flow was kept at 0.1 SCFH (Standard Cubic
Feet per Hour) using a plasma flow controller. The cleaning step consisted of 30
Chapter 3 General Methods
61
seconds oxygen plasma clean at 380 mTorr pressure and 29.6 W of discharge power
at high RF level.
3.2.7.2.2. Cleaning of the glass slides
Microscope glass slides 25.4 mm x 76.2 mm x 1 mm (Sail brand, China) were used.
The glass slides were first washed with acetone and then with ethanol to remove the
impurities and contaminants from the surface. Later the slides were blown with
nitrogen to ensure complete drying.
3.2.7.2.3. Polymer microspheres
The polymer microspheres were glued on a clean glass slide with Araldite five-
minute epoxy resin glue (Selleys Chemical Company, Australia). A uniform thin
smear of the glue was made in the centre of the clean glass slide. The microspheres
were sprinkled on the resin glue and allowed to dry for five minutes. The excess
microsphere particles were removed from the slide by blowing with nitrogen.
3.2.7.2.4. Polymer films (Spin coating)
The cover slips were used as a substrate and Spin coater (Model PWM-32, Headway
Research, Inc., Texas) was used for the deposition of films on the cover slip.
Approximately 1 mL of the sample solution was placed on the centre of the cover
slip and was spun at a constant speed until all the solvent was evaporated and a thin
film was deposited on it. These samples were stored in a desiccator and later used for
adhesion force measurements and imaging.
The PCL film was formed by spinning the 10% PCL solution in DCM at 1000 rpm
for 20 seconds. The PCL + PVA film was formed by depositing the layer of PCL
film as described above and allowing it to dry for 30 minutes. Later the PCL layer
was covered with 1% PVA solution and spun at 2000 rpm for 60 seconds. The 3
layer film of PCL + PVA + MgSt was prepared by depositing the first 2 layers in the
similar manner as described above and later 1% MgSt solution was deposited and
spun for 1000 rpm for 60 seconds. Similarly the 3 layered film of PCL + PVA +
Leucine was prepared by depositing the first 2 layers as described above and later
spinning 1% leucine solution at 5000 rpm for 60 seconds. The PLGA film was
formed by spinning the 10% PLGA solution in DCM at 500 rpm for 120 seconds.
The deposition of PVA, MgSt and leucine layer on PLGA film were done at similar
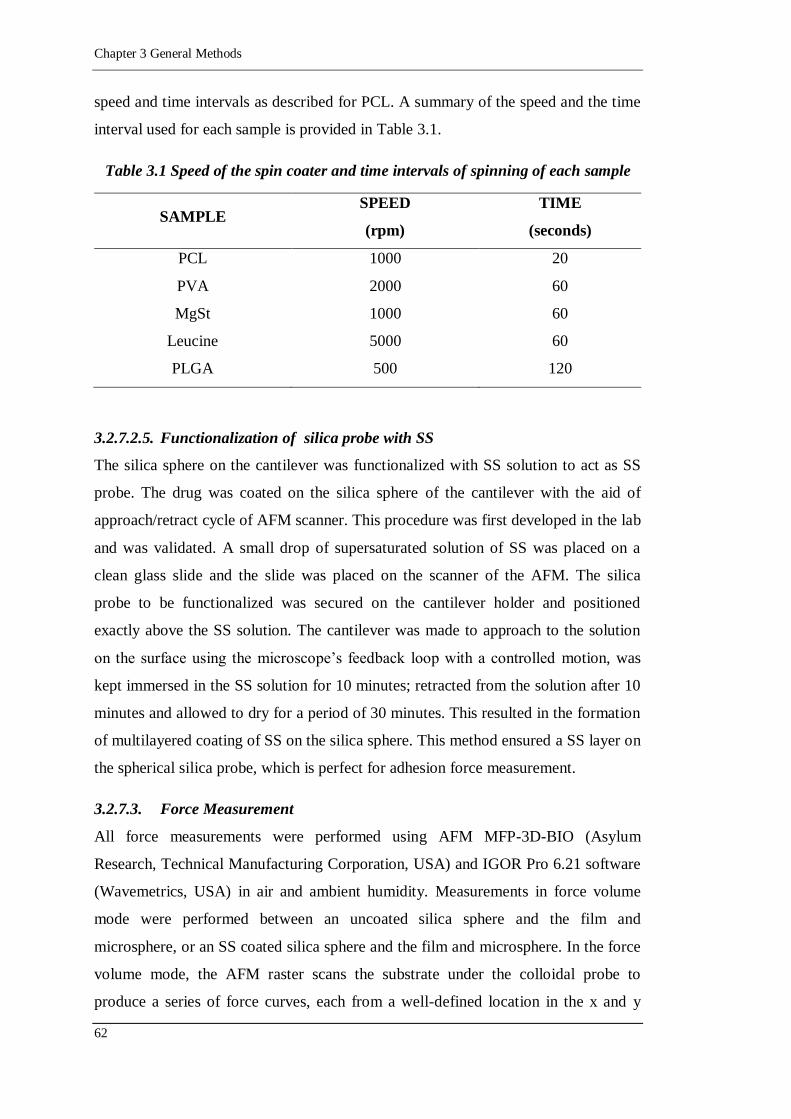
Chapter 3 General Methods
62
speed and time intervals as described for PCL. A summary of the speed and the time
interval used for each sample is provided in Table 3.1.
Table 3.1 Speed of the spin coater and time intervals of spinning of each sample
SAMPLE SPEED
(rpm)
TIME
(seconds)
PCL 1000 20
PVA 2000 60
MgSt 1000 60
Leucine 5000 60
PLGA 500 120
3.2.7.2.5. Functionalization of silica probe with SS
The silica sphere on the cantilever was functionalized with SS solution to act as SS
probe. The drug was coated on the silica sphere of the cantilever with the aid of
approach/retract cycle of AFM scanner. This procedure was first developed in the lab
and was validated. A small drop of supersaturated solution of SS was placed on a
clean glass slide and the slide was placed on the scanner of the AFM. The silica
probe to be functionalized was secured on the cantilever holder and positioned
exactly above the SS solution. The cantilever was made to approach to the solution
on the surface using the microscope‟s feedback loop with a controlled motion, was
kept immersed in the SS solution for 10 minutes; retracted from the solution after 10
minutes and allowed to dry for a period of 30 minutes. This resulted in the formation
of multilayered coating of SS on the silica sphere. This method ensured a SS layer on
the spherical silica probe, which is perfect for adhesion force measurement.
3.2.7.3. Force Measurement
All force measurements were performed using AFM MFP-3D-BIO (Asylum
Research, Technical Manufacturing Corporation, USA) and IGOR Pro 6.21 software
(Wavemetrics, USA) in air and ambient humidity. Measurements in force volume
mode were performed between an uncoated silica sphere and the film and
microsphere, or an SS coated silica sphere and the film and microsphere. In the force
volume mode, the AFM raster scans the substrate under the colloidal probe to
produce a series of force curves, each from a well-defined location in the x and y
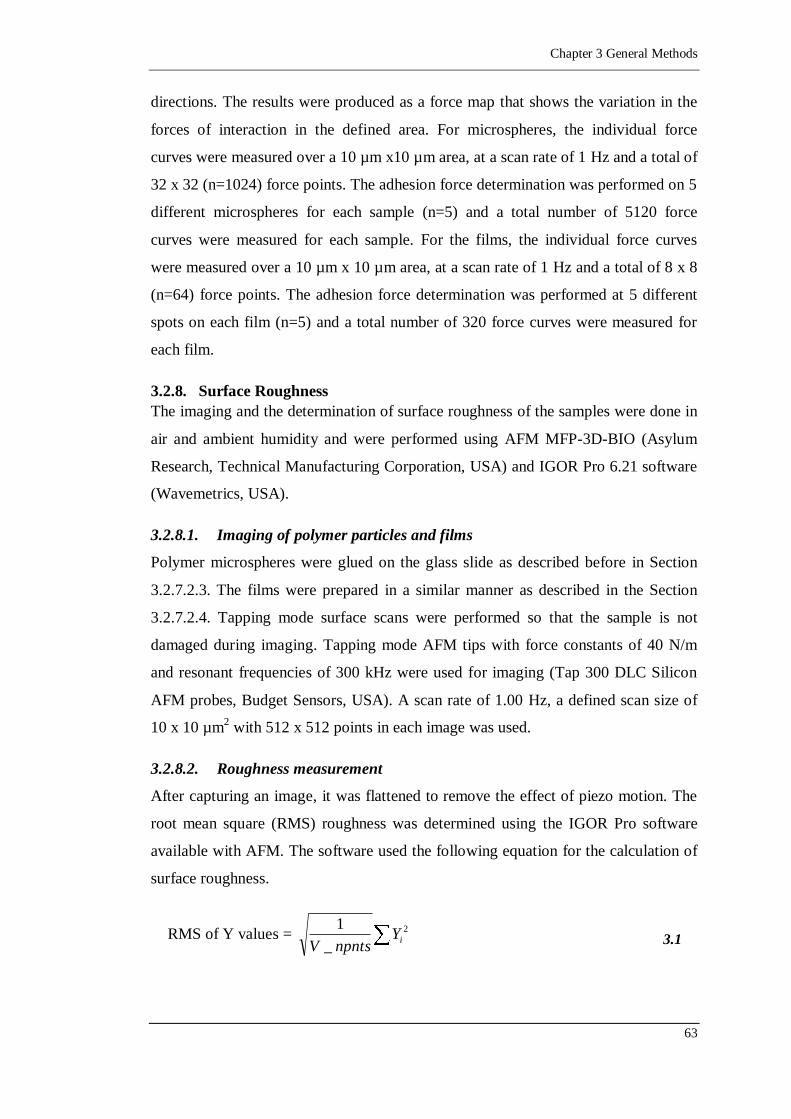
Chapter 3 General Methods
63
directions. The results were produced as a force map that shows the variation in the
forces of interaction in the defined area. For microspheres, the individual force
curves were measured over a 10 µm x10 µm area, at a scan rate of 1 Hz and a total of
32 x 32 (n=1024) force points. The adhesion force determination was performed on 5
different microspheres for each sample (n=5) and a total number of 5120 force
curves were measured for each sample. For the films, the individual force curves
were measured over a 10 µm x 10 µm area, at a scan rate of 1 Hz and a total of 8 x 8
(n=64) force points. The adhesion force determination was performed at 5 different
spots on each film (n=5) and a total number of 320 force curves were measured for
each film.
3.2.8. Surface Roughness
The imaging and the determination of surface roughness of the samples were done in
air and ambient humidity and were performed using AFM MFP-3D-BIO (Asylum
Research, Technical Manufacturing Corporation, USA) and IGOR Pro 6.21 software
(Wavemetrics, USA).
3.2.8.1. Imaging of polymer particles and films
Polymer microspheres were glued on the glass slide as described before in Section
3.2.7.2.3. The films were prepared in a similar manner as described in the Section
3.2.7.2.4. Tapping mode surface scans were performed so that the sample is not
damaged during imaging. Tapping mode AFM tips with force constants of 40 N/m
and resonant frequencies of 300 kHz were used for imaging (Tap 300 DLC Silicon
AFM probes, Budget Sensors, USA). A scan rate of 1.00 Hz, a defined scan size of
10 x 10 µm2 with 512 x 512 points in each image was used.
3.2.8.2. Roughness measurement
After capturing an image, it was flattened to remove the effect of piezo motion. The
root mean square (RMS) roughness was determined using the IGOR Pro software
available with AFM. The software used the following equation for the calculation of
surface roughness.
RMS of Y values = 2
_
1iY
npntsV 3.1
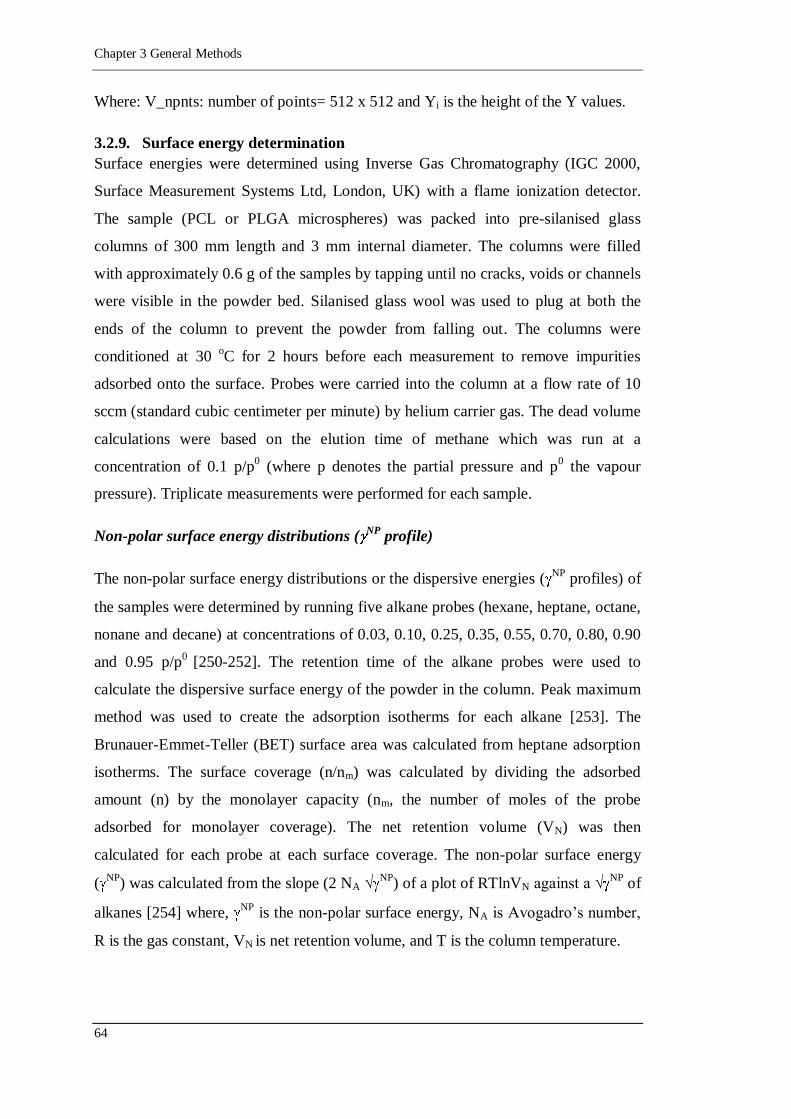
Chapter 3 General Methods
64
Where: V_npnts: number of points= 512 x 512 and Yi is the height of the Y values.
3.2.9. Surface energy determination
Surface energies were determined using Inverse Gas Chromatography (IGC 2000,
Surface Measurement Systems Ltd, London, UK) with a flame ionization detector.
The sample (PCL or PLGA microspheres) was packed into pre-silanised glass
columns of 300 mm length and 3 mm internal diameter. The columns were filled
with approximately 0.6 g of the samples by tapping until no cracks, voids or channels
were visible in the powder bed. Silanised glass wool was used to plug at both the
ends of the column to prevent the powder from falling out. The columns were
conditioned at 30 oC for 2 hours before each measurement to remove impurities
adsorbed onto the surface. Probes were carried into the column at a flow rate of 10
sccm (standard cubic centimeter per minute) by helium carrier gas. The dead volume
calculations were based on the elution time of methane which was run at a
concentration of 0.1 p/p0 (where p denotes the partial pressure and p
0 the vapour
pressure). Triplicate measurements were performed for each sample.
Non-polar surface energy distributions (NP
profile)
The non-polar surface energy distributions or the dispersive energies (NP
profiles) of
the samples were determined by running five alkane probes (hexane, heptane, octane,
nonane and decane) at concentrations of 0.03, 0.10, 0.25, 0.35, 0.55, 0.70, 0.80, 0.90
and 0.95 p/p0
[250-252]. The retention time of the alkane probes were used to
calculate the dispersive surface energy of the powder in the column. Peak maximum
method was used to create the adsorption isotherms for each alkane [253]. The
Brunauer-Emmet-Teller (BET) surface area was calculated from heptane adsorption
isotherms. The surface coverage (n/nm) was calculated by dividing the adsorbed
amount (n) by the monolayer capacity (nm, the number of moles of the probe
adsorbed for monolayer coverage). The net retention volume (VN) was then
calculated for each probe at each surface coverage. The non-polar surface energy
(NP
) was calculated from the slope (2 NA √NP
) of a plot of RTlnVN against a √NP
of
alkanes [254] where, NP
is the non-polar surface energy, NA is Avogadro‟s number,
R is the gas constant, VN is net retention volume, and T is the column temperature.
Chapter 3 General Methods
65
3.3. Analytical methods
3.3.1. UV spectrophotometric assay
A spectrophotometric (UV) assay was used for the determination of SS in the
homogeneity studies. The UV spectrum of SS in water was analyzed over a
wavelength range of 190-400 nm by a UV spectrophotometer (U-2800
spectrophotometer, Hitachi) using 10 mm quartz cells to measure the wavelength of
maximum absorbance (λmax). The Beer-Lambert calibration curve was prepared at a
wavelength of 276 nm using concentrations ranging from 0-500 µg/mL. Three
replicates of the measurements were done. The accuracy and the precision of the
assay were determined at three concentrations (high, medium and low) using three
replicates of each concentration. The Limit of Detection (LOD) and Limit of
Quantification (LOQ) were determined.
3.3.2. HPLC assay
SS was analyzed by HPLC (Agilent HP1100) using a C18 column (µBondapak®, 3.9
x 300 mm, Waters) and an UV Diode Array detector (Agilent) at a wavelength of
276 nm. A mixture of methanol and 0.2% w/v ammonium acetate solution (45:55)
was used as a mobile phase at a flow rate of 1.0 mL/minute by a HPLC pump (Quat
pump, Agilent). An injection volume of 100 µL was used. The peak area was
recorded by integration. The retention time of SS was found to be 4.3 minutes. A
HPLC calibration curve was prepared with concentrations ranging between 0 - 100
µg/mL. Five replicates of the measurements were done. The accuracy and the
precision of the assay were determined at three concentrations (high, medium and
low) using five replicates of each concentration. The LOD and LOQ were
determined.
3.4. Powder formulation
3.4.1. Powder mixing
The drug-carrier mixture was prepared by a hand mixing method [245-246] in a
similar manner as described in Section 3.2.2.1
3.4.2. Homogeneity tests
The homogeneity of each drug-carrier mixture prepared in the Section 3.4.1 was
determined by sampling 20 x 20 mg samples from the mixtures and assaying for SS
content. The samples were dissolved in 10 mL of water and the amount of SS was
Chapter 3 General Methods
66
quantified based on UV absorbance in triplicates. An acceptable degree of
homogeneity is achieved when the mean drug content is 95%-105% of the theoretical
value and the Coefficient of variation (CV) is less than 5% which indicates that 95%
of the samples would fall within 10% of the mean [255].
3.4.3. In vitro aerosol deposition
The in vitro aerosol deposition of the powder formulations was determined by a
Twin Stage Impinger (TSI apparatus, Apparatus A, Glass Impinger, British
Pharmacopoeia, 2009) (Copley, UK) (Figure 3.5). Rotahaler® (Glaxo Wellcome)
was the DPI device used and the collection liquid used for the study was water. 7 and
30 mL of water was placed in stage one (S1) and stage two (S2) of the TSI,
respectively. The air flow was drawn through the TSI using a vacuum pump (D-
63150, Erweka, Germany) and the air flow rate was adjusted to 60 ± 5 L/min at the
mouthpiece, prior to each measurement (Fisher and Porter, Model 10A3567SAX,
UK).
The powder formulations were loaded (about 20.0 mg) into hard gelatin capsules
(size 3, Fawns and McAllan Pty Ltd.; Australia). The filled capsule was inserted into
the Rotahaler® which was placed into a moulded mouthpiece attached to the TSI.
The Rotahaler® was twisted to release the powder into the body of the device and an
air volume of 5 litres (5 seconds at 60 L/min) was drawn for each measurement
which produces a cut-off mass median aerodynamic diameter of 6.4 µm between the
two stages [256]. Each section (Inhaler, S1 and S2) was rinsed with water and the
liquid was collected and volume was adjusted to 100 mL. The SS content was
measured by HPLC analysis. Five replicates of each mixture were performed for TSI
measurement.
The recovered dose (RD) was the total amount of drug collected from the inhaler, S1
and S2. The emitted dose (ED) was the fraction of the RD delivered from the inhaler
expressed as a percentage.
10021
RD
SSED 3.2
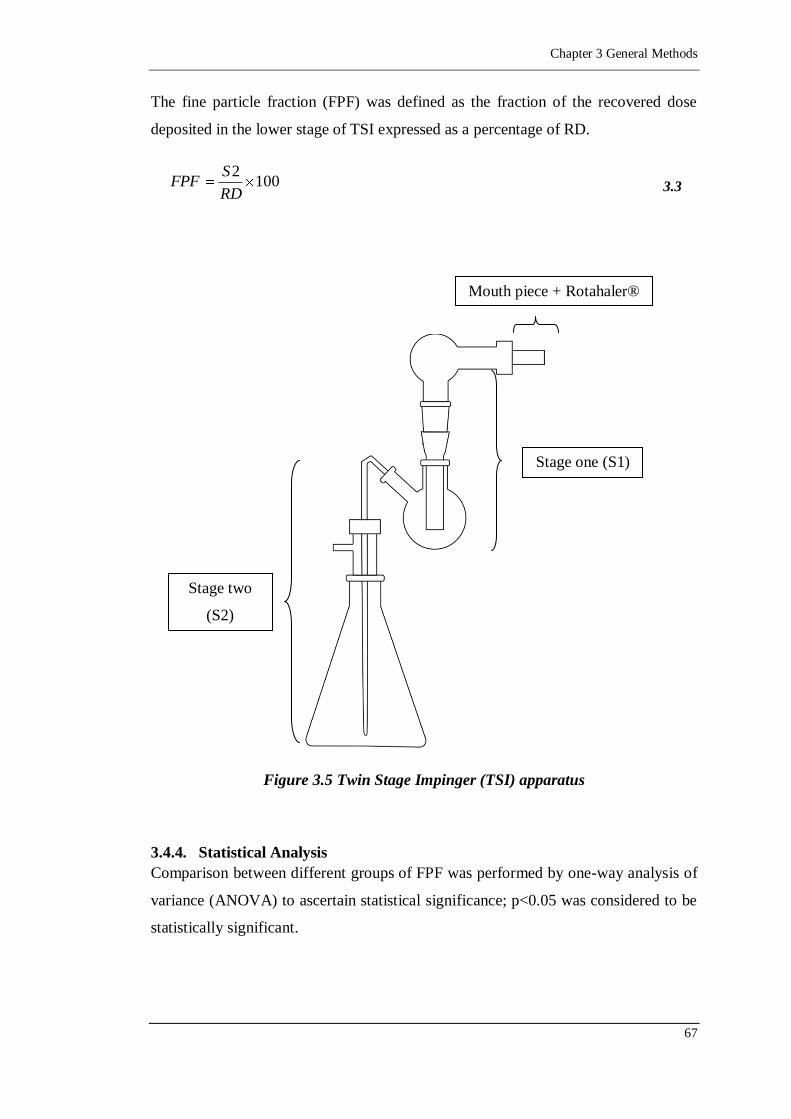
Chapter 3 General Methods
67
The fine particle fraction (FPF) was defined as the fraction of the recovered dose
deposited in the lower stage of TSI expressed as a percentage of RD.
1002
RD
SFPF 3.3
Figure 3.5 Twin Stage Impinger (TSI) apparatus
3.4.4. Statistical Analysis
Comparison between different groups of FPF was performed by one-way analysis of
variance (ANOVA) to ascertain statistical significance; p<0.05 was considered to be
statistically significant.
Mouth piece + Rotahaler®
Stage one (S1)
Stage two
(S2)


Chapter 4 Method Validation
69
CChhaapptteerr 44
MMeetthhoodd VVaalliiddaattiioonn
Chapter 4 Method Validation

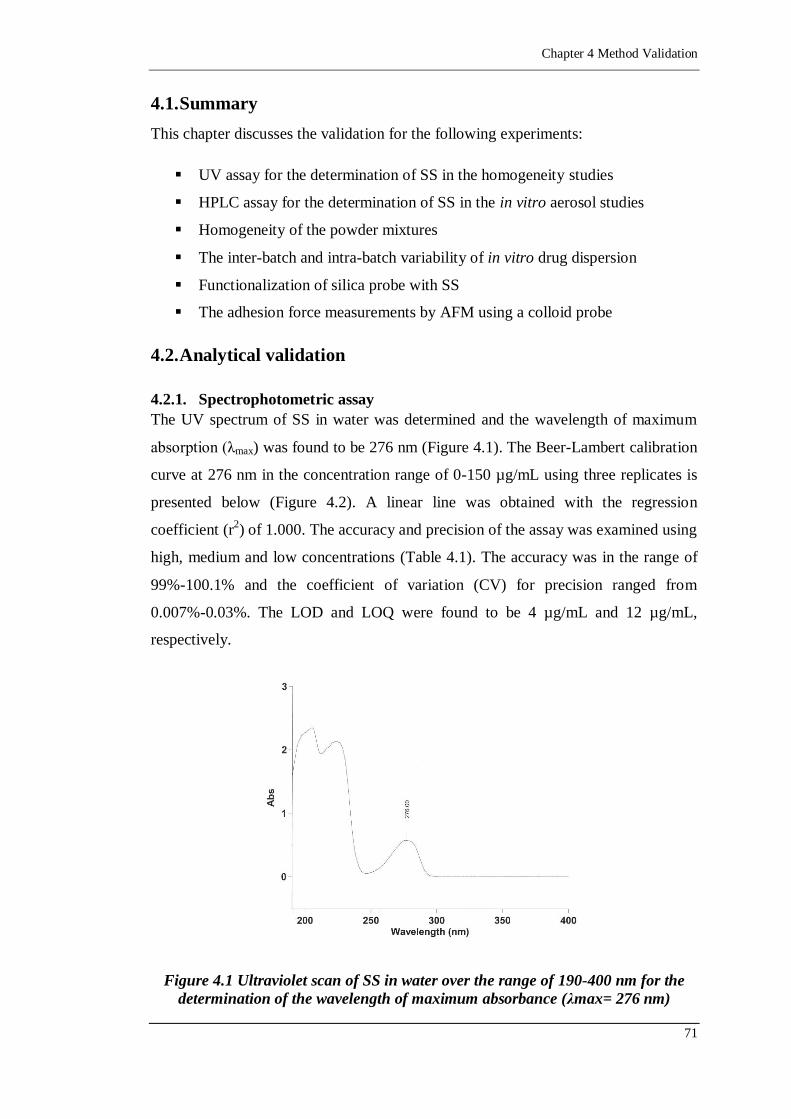
Chapter 4 Method Validation
71
4.1. Summary
This chapter discusses the validation for the following experiments:
UV assay for the determination of SS in the homogeneity studies
HPLC assay for the determination of SS in the in vitro aerosol studies
Homogeneity of the powder mixtures
The inter-batch and intra-batch variability of in vitro drug dispersion
Functionalization of silica probe with SS
The adhesion force measurements by AFM using a colloid probe
4.2. Analytical validation
4.2.1. Spectrophotometric assay
The UV spectrum of SS in water was determined and the wavelength of maximum
absorption (λmax) was found to be 276 nm (Figure 4.1). The Beer-Lambert calibration
curve at 276 nm in the concentration range of 0-150 µg/mL using three replicates is
presented below (Figure 4.2). A linear line was obtained with the regression
coefficient (r2) of 1.000. The accuracy and precision of the assay was examined using
high, medium and low concentrations (Table 4.1). The accuracy was in the range of
99%-100.1% and the coefficient of variation (CV) for precision ranged from
0.007%-0.03%. The LOD and LOQ were found to be 4 µg/mL and 12 µg/mL,
respectively.
Figure 4.1 Ultraviolet scan of SS in water over the range of 190-400 nm for the
determination of the wavelength of maximum absorbance (λmax= 276 nm)
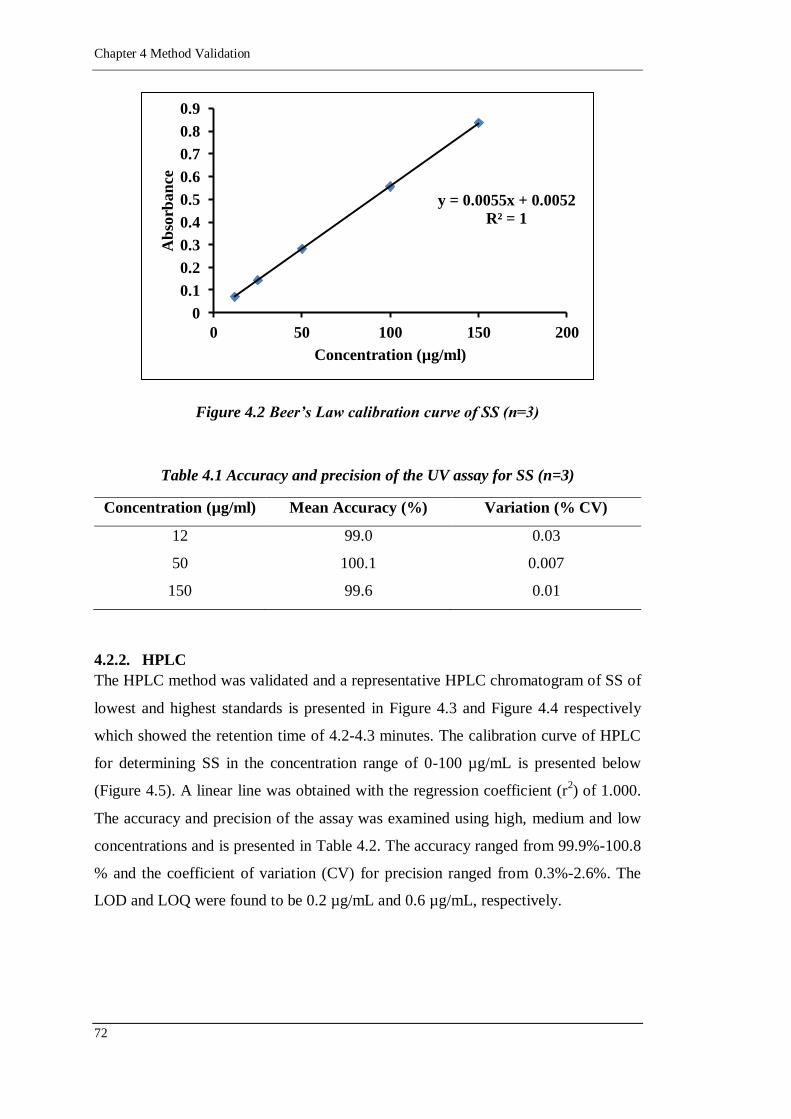
Chapter 4 Method Validation
72
Figure 4.2 Beer’s Law calibration curve of SS (n=3)
Table 4.1 Accuracy and precision of the UV assay for SS (n=3)
Concentration (µg/ml) Mean Accuracy (%) Variation (% CV)
12 99.0 0.03
50 100.1 0.007
150 99.6 0.01
4.2.2. HPLC
The HPLC method was validated and a representative HPLC chromatogram of SS of
lowest and highest standards is presented in Figure 4.3 and Figure 4.4 respectively
which showed the retention time of 4.2-4.3 minutes. The calibration curve of HPLC
for determining SS in the concentration range of 0-100 µg/mL is presented below
(Figure 4.5). A linear line was obtained with the regression coefficient (r2) of 1.000.
The accuracy and precision of the assay was examined using high, medium and low
concentrations and is presented in Table 4.2. The accuracy ranged from 99.9%-100.8
% and the coefficient of variation (CV) for precision ranged from 0.3%-2.6%. The
LOD and LOQ were found to be 0.2 µg/mL and 0.6 µg/mL, respectively.
y = 0.0055x + 0.0052
R² = 1
0
0.1
0.2
0.3
0.4
0.5
0.6
0.7
0.8
0.9
0 50 100 150 200
Ab
sorb
an
ce
Concentration (µg/ml)
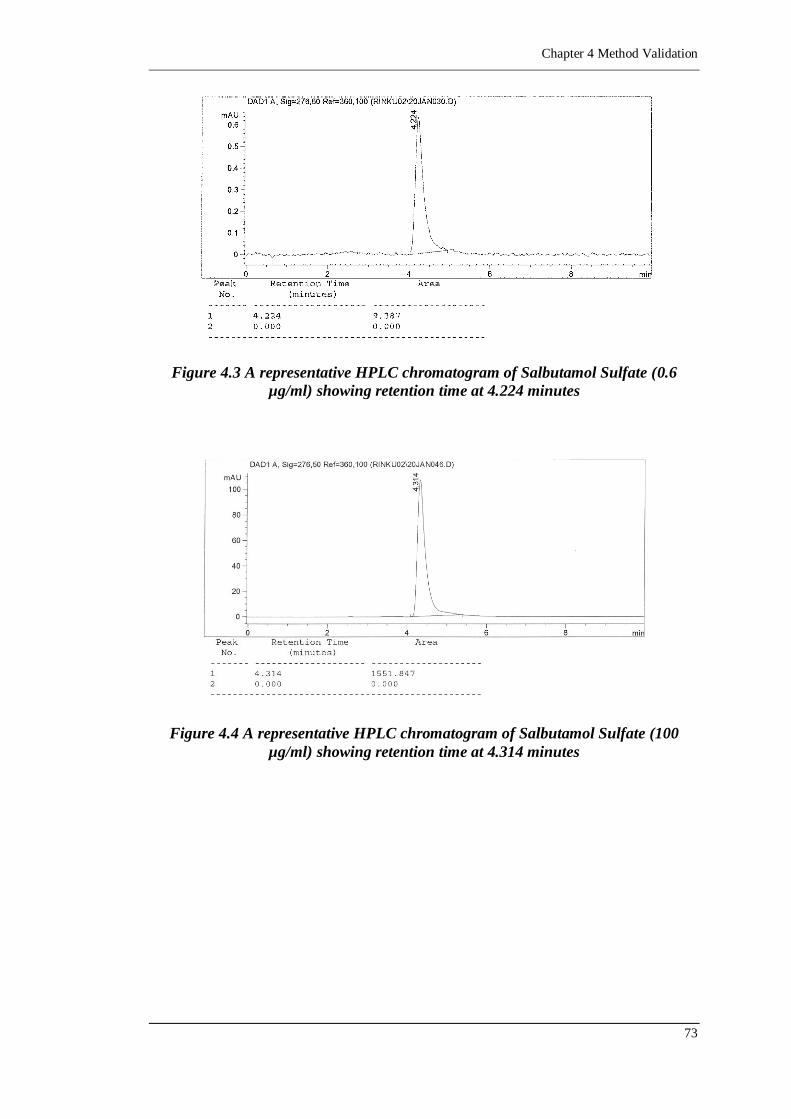
Chapter 4 Method Validation
73
Figure 4.3 A representative HPLC chromatogram of Salbutamol Sulfate (0.6
µg/ml) showing retention time at 4.224 minutes
Figure 4.4 A representative HPLC chromatogram of Salbutamol Sulfate (100
µg/ml) showing retention time at 4.314 minutes
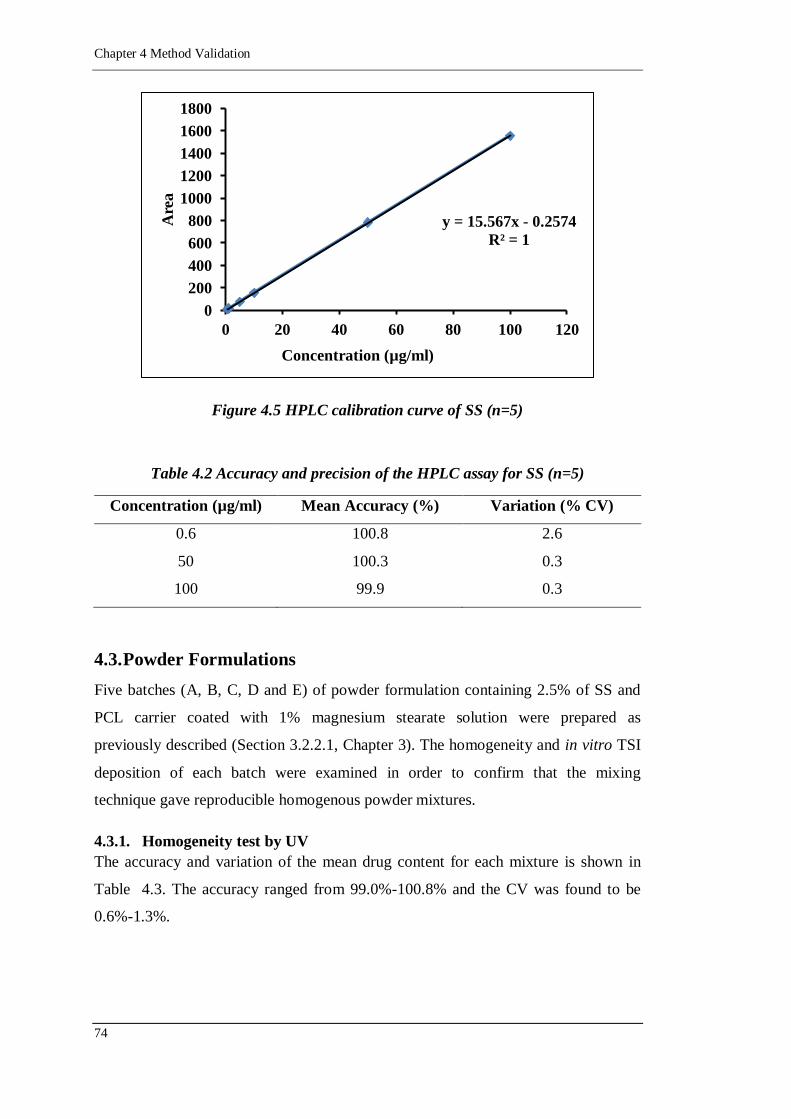
Chapter 4 Method Validation
74
Figure 4.5 HPLC calibration curve of SS (n=5)
Table 4.2 Accuracy and precision of the HPLC assay for SS (n=5)
Concentration (µg/ml) Mean Accuracy (%) Variation (% CV)
0.6 100.8 2.6
50 100.3 0.3
100 99.9 0.3
4.3. Powder Formulations
Five batches (A, B, C, D and E) of powder formulation containing 2.5% of SS and
PCL carrier coated with 1% magnesium stearate solution were prepared as
previously described (Section 3.2.2.1, Chapter 3). The homogeneity and in vitro TSI
deposition of each batch were examined in order to confirm that the mixing
technique gave reproducible homogenous powder mixtures.
4.3.1. Homogeneity test by UV
The accuracy and variation of the mean drug content for each mixture is shown in
Table 4.3. The accuracy ranged from 99.0%-100.8% and the CV was found to be
0.6%-1.3%.
y = 15.567x - 0.2574
R² = 1
0
200
400
600
800
1000
1200
1400
1600
1800
0 20 40 60 80 100 120
Are
a
Concentration (µg/ml)
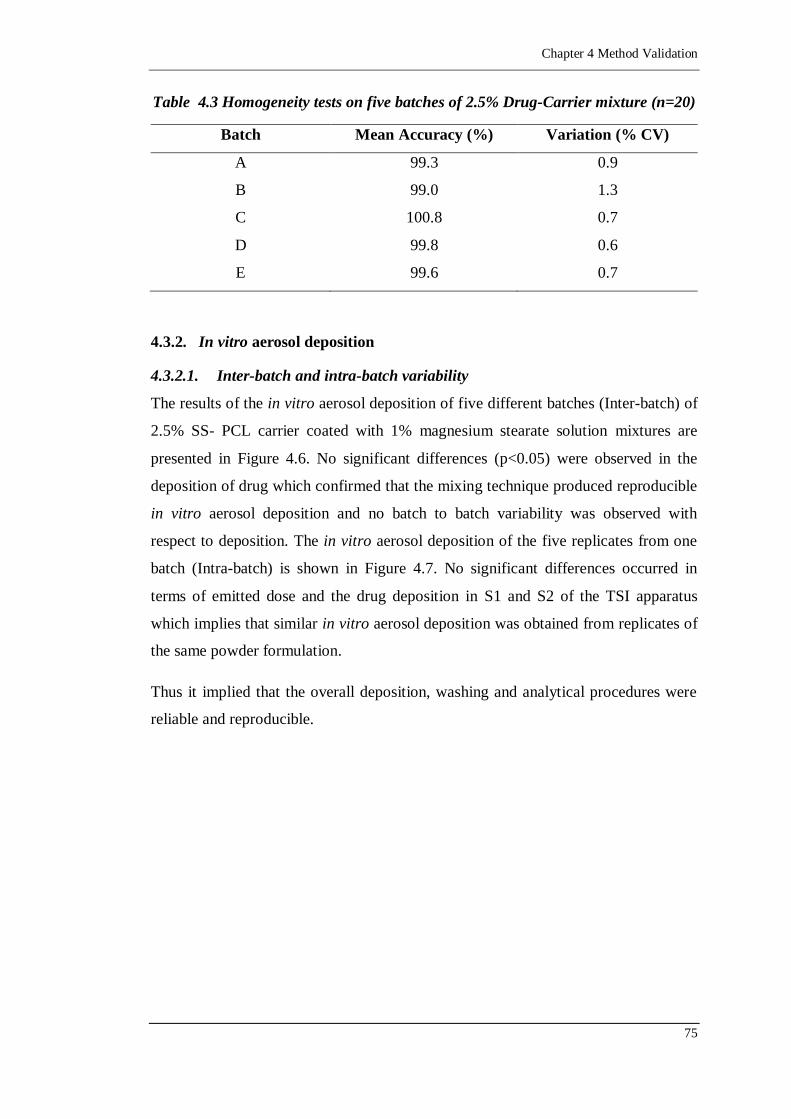
Chapter 4 Method Validation
75
Table 4.3 Homogeneity tests on five batches of 2.5% Drug-Carrier mixture (n=20)
Batch Mean Accuracy (%) Variation (% CV)
A 99.3 0.9
B 99.0 1.3
C 100.8 0.7
D 99.8 0.6
E 99.6 0.7
4.3.2. In vitro aerosol deposition
4.3.2.1. Inter-batch and intra-batch variability
The results of the in vitro aerosol deposition of five different batches (Inter-batch) of
2.5% SS- PCL carrier coated with 1% magnesium stearate solution mixtures are
presented in Figure 4.6. No significant differences (p<0.05) were observed in the
deposition of drug which confirmed that the mixing technique produced reproducible
in vitro aerosol deposition and no batch to batch variability was observed with
respect to deposition. The in vitro aerosol deposition of the five replicates from one
batch (Intra-batch) is shown in Figure 4.7. No significant differences occurred in
terms of emitted dose and the drug deposition in S1 and S2 of the TSI apparatus
which implies that similar in vitro aerosol deposition was obtained from replicates of
the same powder formulation.
Thus it implied that the overall deposition, washing and analytical procedures were
reliable and reproducible.
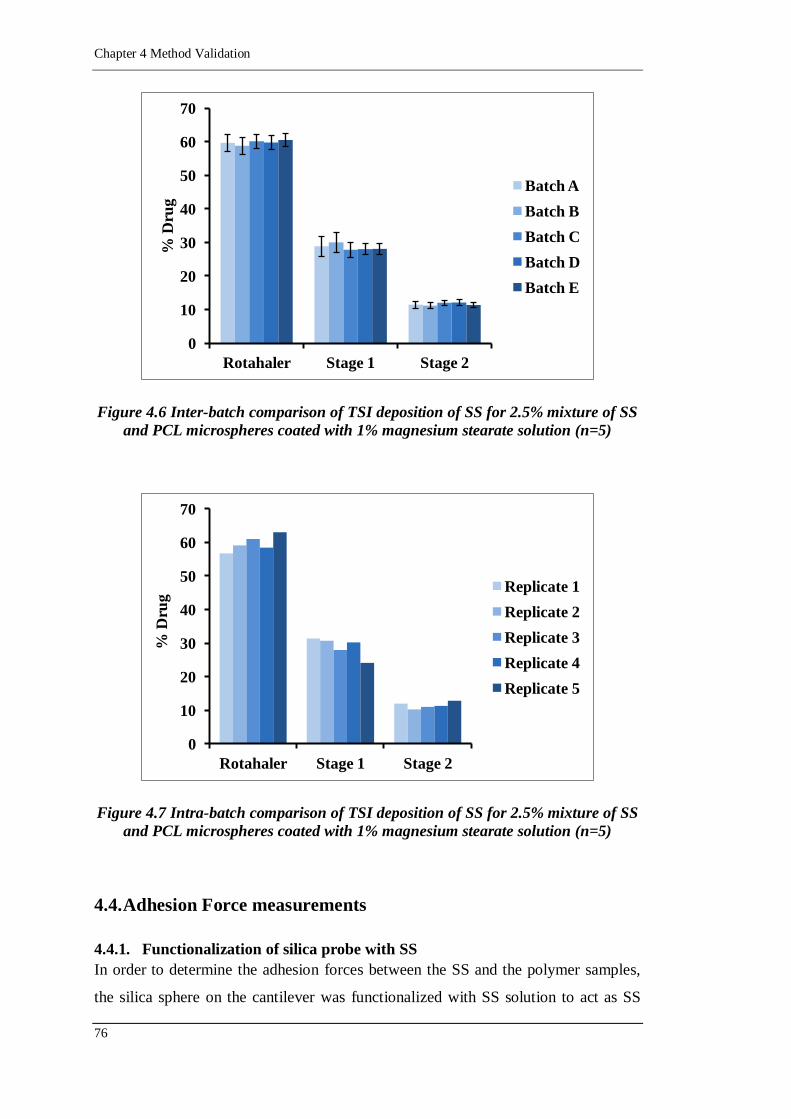
Chapter 4 Method Validation
76
Figure 4.6 Inter-batch comparison of TSI deposition of SS for 2.5% mixture of SS
and PCL microspheres coated with 1% magnesium stearate solution (n=5)
Figure 4.7 Intra-batch comparison of TSI deposition of SS for 2.5% mixture of SS
and PCL microspheres coated with 1% magnesium stearate solution (n=5)
4.4. Adhesion Force measurements
4.4.1. Functionalization of silica probe with SS
In order to determine the adhesion forces between the SS and the polymer samples,
the silica sphere on the cantilever was functionalized with SS solution to act as SS
0
10
20
30
40
50
60
70
Rotahaler Stage 1 Stage 2
% D
rug
Batch A
Batch B
Batch C
Batch D
Batch E
0
10
20
30
40
50
60
70
Rotahaler Stage 1 Stage 2
% D
rug
Replicate 1
Replicate 2
Replicate 3
Replicate 4
Replicate 5
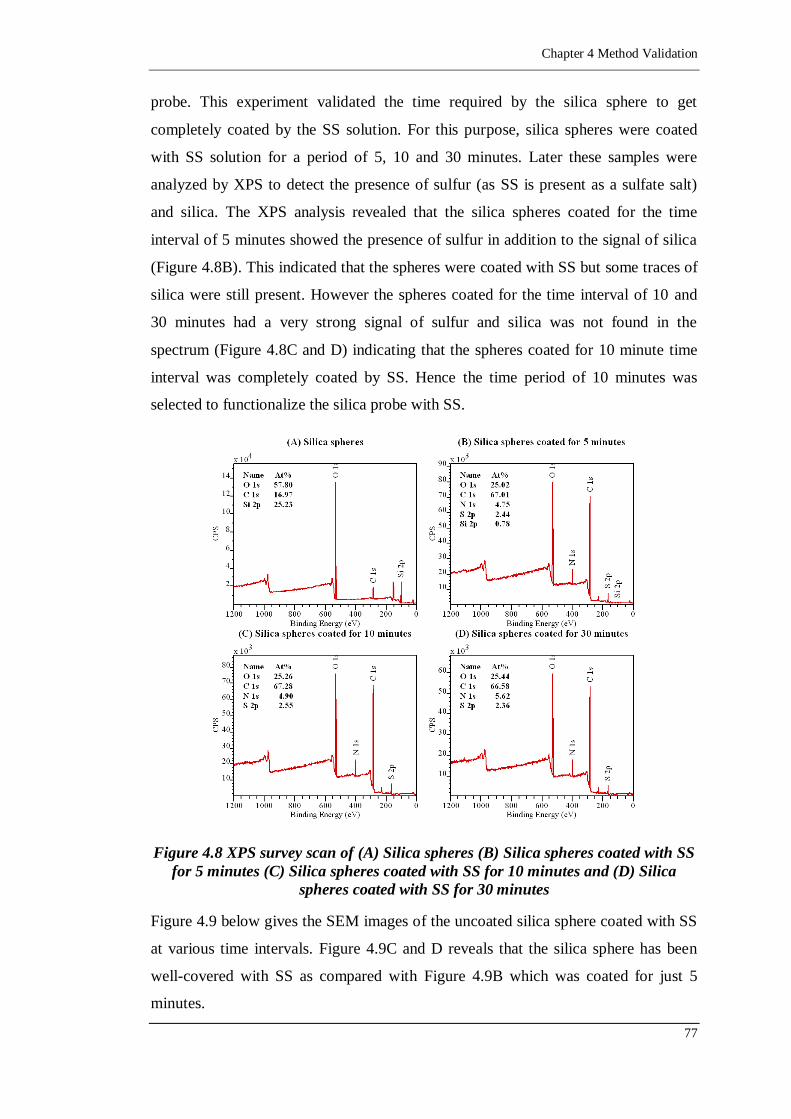
Chapter 4 Method Validation
77
probe. This experiment validated the time required by the silica sphere to get
completely coated by the SS solution. For this purpose, silica spheres were coated
with SS solution for a period of 5, 10 and 30 minutes. Later these samples were
analyzed by XPS to detect the presence of sulfur (as SS is present as a sulfate salt)
and silica. The XPS analysis revealed that the silica spheres coated for the time
interval of 5 minutes showed the presence of sulfur in addition to the signal of silica
(Figure 4.8B). This indicated that the spheres were coated with SS but some traces of
silica were still present. However the spheres coated for the time interval of 10 and
30 minutes had a very strong signal of sulfur and silica was not found in the
spectrum (Figure 4.8C and D) indicating that the spheres coated for 10 minute time
interval was completely coated by SS. Hence the time period of 10 minutes was
selected to functionalize the silica probe with SS.
Figure 4.8 XPS survey scan of (A) Silica spheres (B) Silica spheres coated with SS
for 5 minutes (C) Silica spheres coated with SS for 10 minutes and (D) Silica
spheres coated with SS for 30 minutes
Figure 4.9 below gives the SEM images of the uncoated silica sphere coated with SS
at various time intervals. Figure 4.9C and D reveals that the silica sphere has been
well-covered with SS as compared with Figure 4.9B which was coated for just 5
minutes.
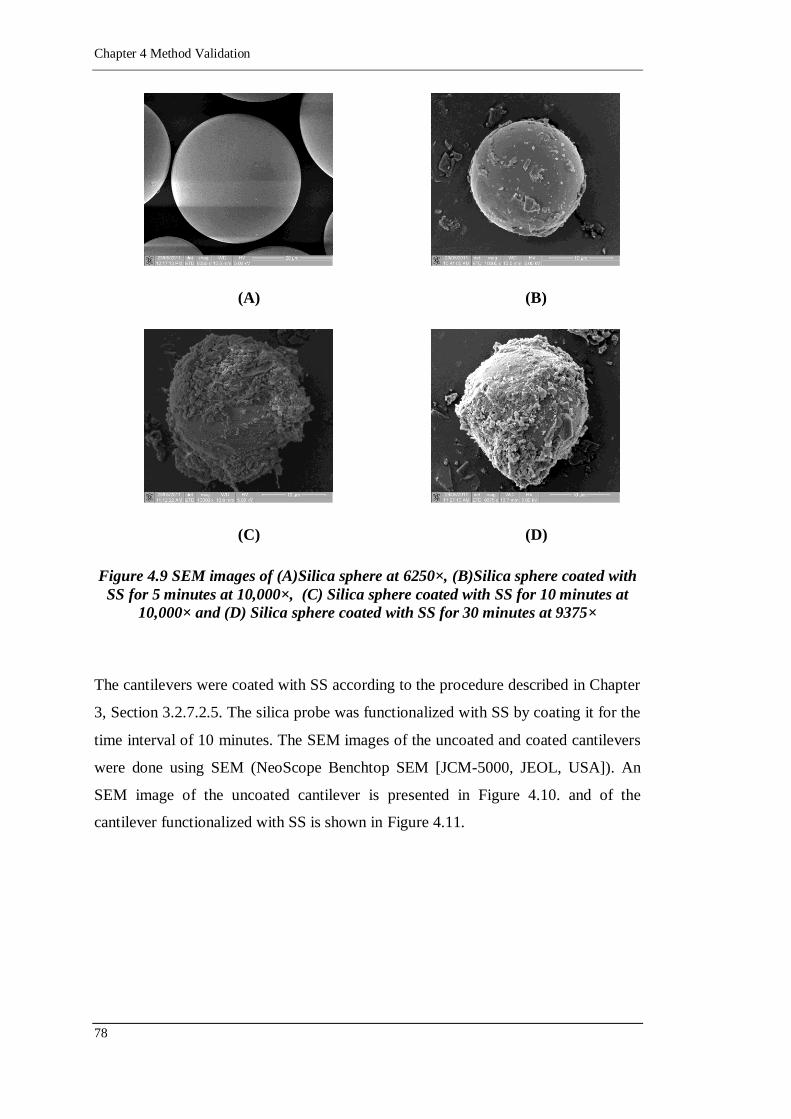
Chapter 4 Method Validation
78
(A) (B)
(C) (D)
Figure 4.9 SEM images of (A)Silica sphere at 6250×, (B)Silica sphere coated with
SS for 5 minutes at 10,000×, (C) Silica sphere coated with SS for 10 minutes at
10,000× and (D) Silica sphere coated with SS for 30 minutes at 9375×
The cantilevers were coated with SS according to the procedure described in Chapter
3, Section 3.2.7.2.5. The silica probe was functionalized with SS by coating it for the
time interval of 10 minutes. The SEM images of the uncoated and coated cantilevers
were done using SEM (NeoScope Benchtop SEM [JCM-5000, JEOL, USA]). An
SEM image of the uncoated cantilever is presented in Figure 4.10. and of the
cantilever functionalized with SS is shown in Figure 4.11.
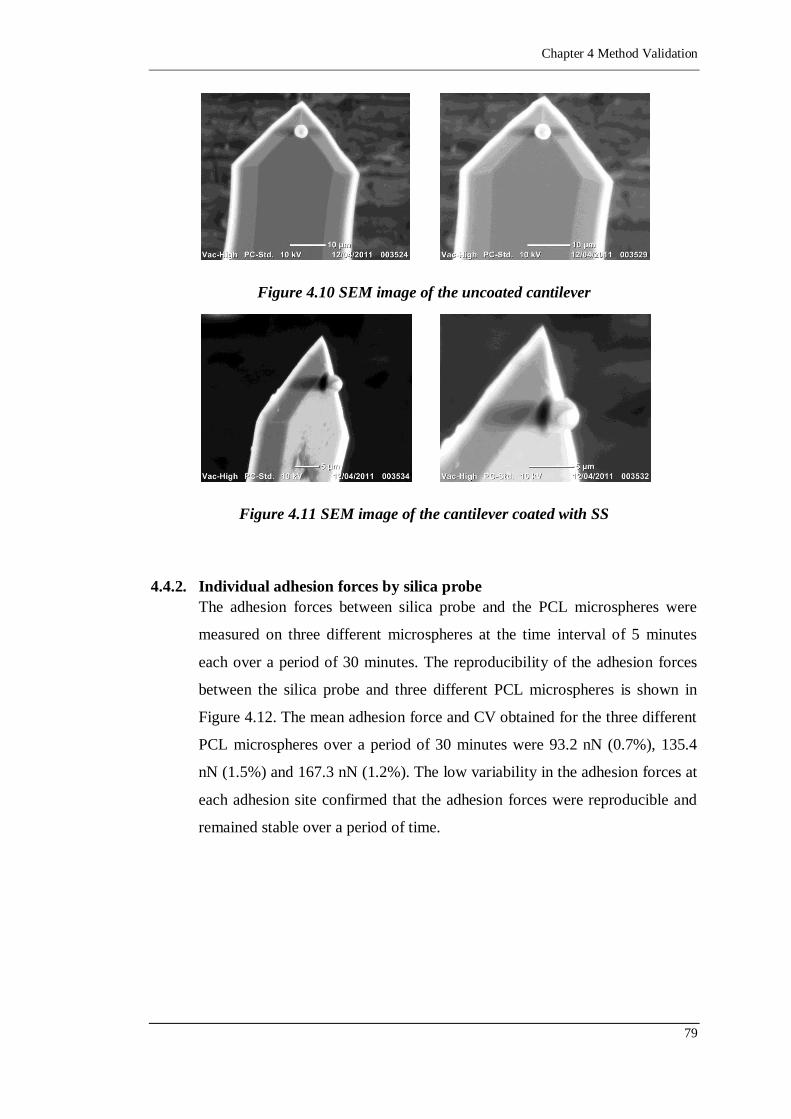
Chapter 4 Method Validation
79
Figure 4.10 SEM image of the uncoated cantilever
Figure 4.11 SEM image of the cantilever coated with SS
4.4.2. Individual adhesion forces by silica probe
The adhesion forces between silica probe and the PCL microspheres were
measured on three different microspheres at the time interval of 5 minutes
each over a period of 30 minutes. The reproducibility of the adhesion forces
between the silica probe and three different PCL microspheres is shown in
Figure 4.12. The mean adhesion force and CV obtained for the three different
PCL microspheres over a period of 30 minutes were 93.2 nN (0.7%), 135.4
nN (1.5%) and 167.3 nN (1.2%). The low variability in the adhesion forces at
each adhesion site confirmed that the adhesion forces were reproducible and
remained stable over a period of time.
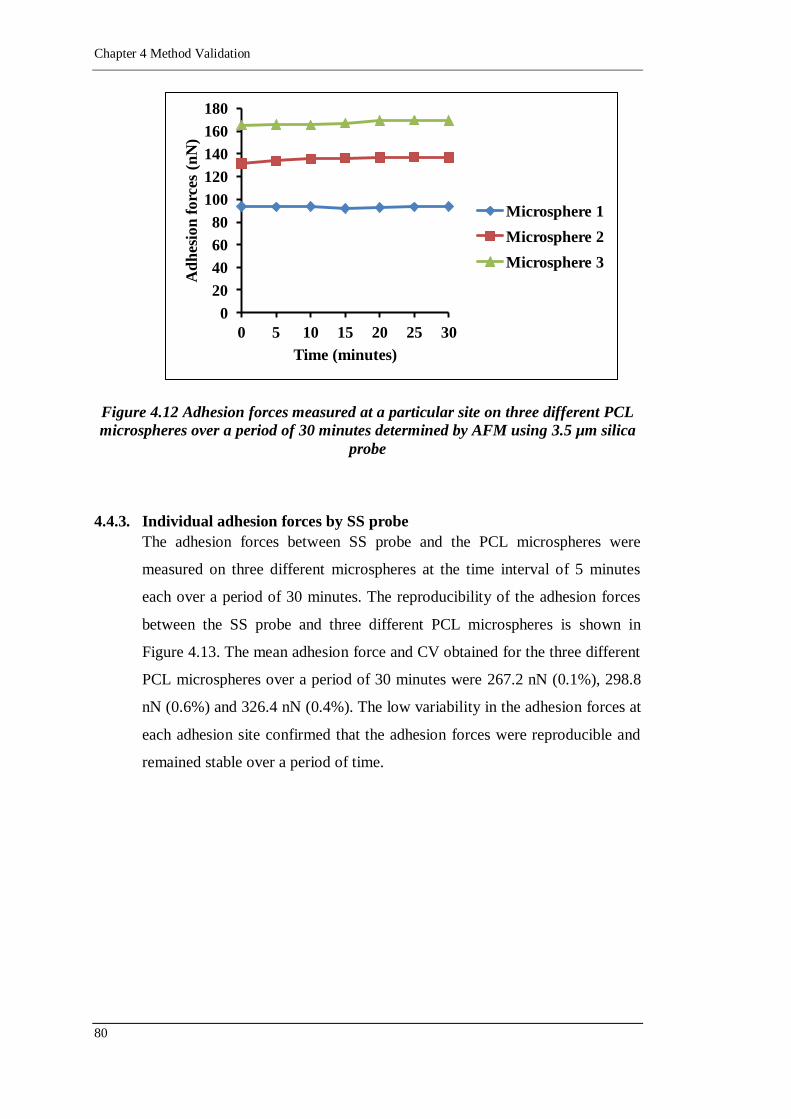
Chapter 4 Method Validation
80
Figure 4.12 Adhesion forces measured at a particular site on three different PCL
microspheres over a period of 30 minutes determined by AFM using 3.5 µm silica
probe
4.4.3. Individual adhesion forces by SS probe
The adhesion forces between SS probe and the PCL microspheres were
measured on three different microspheres at the time interval of 5 minutes
each over a period of 30 minutes. The reproducibility of the adhesion forces
between the SS probe and three different PCL microspheres is shown in
Figure 4.13. The mean adhesion force and CV obtained for the three different
PCL microspheres over a period of 30 minutes were 267.2 nN (0.1%), 298.8
nN (0.6%) and 326.4 nN (0.4%). The low variability in the adhesion forces at
each adhesion site confirmed that the adhesion forces were reproducible and
remained stable over a period of time.
0
20
40
60
80
100
120
140
160
180
0 5 10 15 20 25 30
Ad
hes
ion
forc
es (
nN
)
Time (minutes)
Microsphere 1
Microsphere 2
Microsphere 3
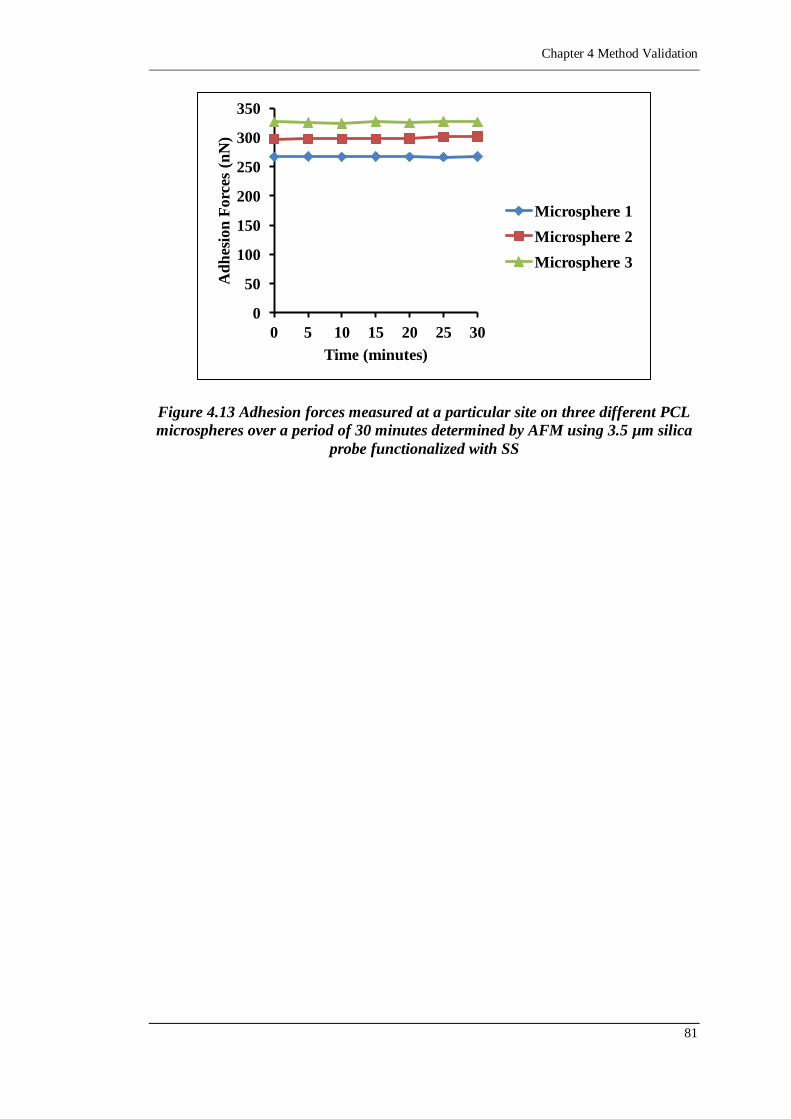
Chapter 4 Method Validation
81
Figure 4.13 Adhesion forces measured at a particular site on three different PCL
microspheres over a period of 30 minutes determined by AFM using 3.5 µm silica
probe functionalized with SS
0
50
100
150
200
250
300
350
0 5 10 15 20 25 30
Ad
hes
ion
Forc
es (
nN
)
Time (minutes)
Microsphere 1
Microsphere 2
Microsphere 3


Chapter 5 Drug Dispersion from PCL and PLGA Microspheres
83
CChhaapptteerr 55
DDrruugg DDiissppeerrssiioonn ffrroomm PPCCLL aanndd PPLLGGAA
MMiiccrroosspphheerreess
Chapter 5 Drug Dispersion from PCL and PLGA
Microspheres

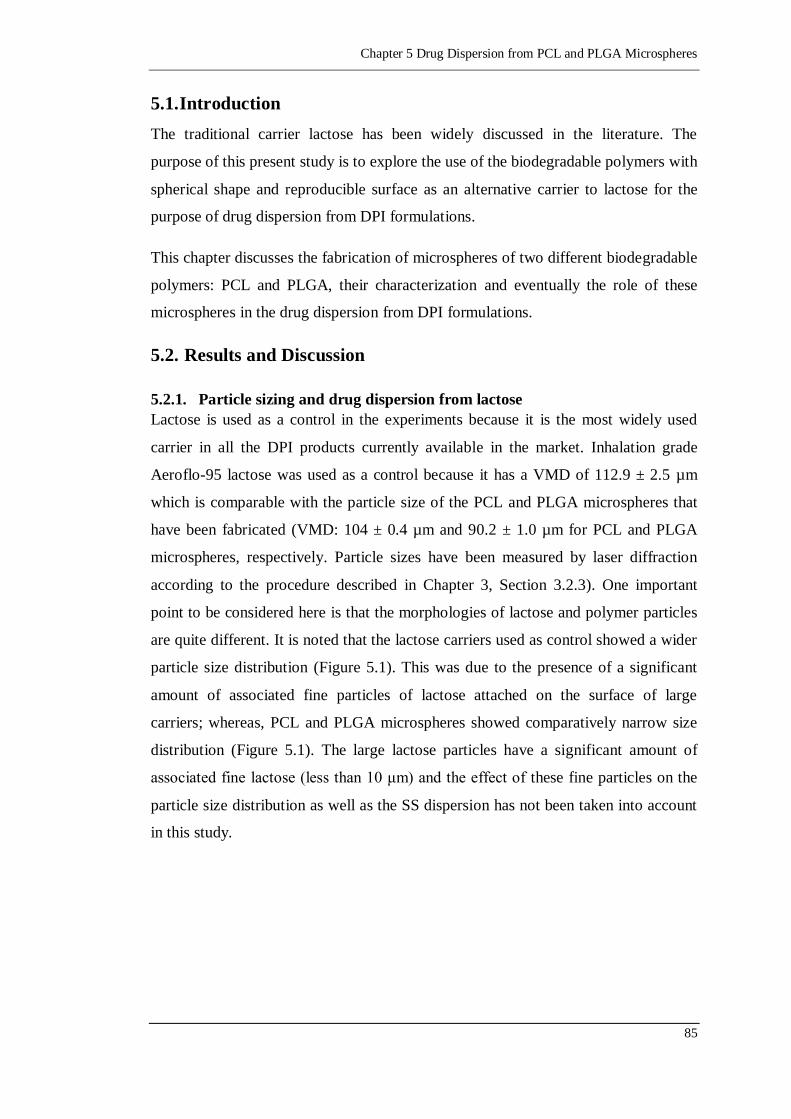
Chapter 5 Drug Dispersion from PCL and PLGA Microspheres
85
5.1. Introduction
The traditional carrier lactose has been widely discussed in the literature. The
purpose of this present study is to explore the use of the biodegradable polymers with
spherical shape and reproducible surface as an alternative carrier to lactose for the
purpose of drug dispersion from DPI formulations.
This chapter discusses the fabrication of microspheres of two different biodegradable
polymers: PCL and PLGA, their characterization and eventually the role of these
microspheres in the drug dispersion from DPI formulations.
5.2. Results and Discussion
5.2.1. Particle sizing and drug dispersion from lactose
Lactose is used as a control in the experiments because it is the most widely used
carrier in all the DPI products currently available in the market. Inhalation grade
Aeroflo-95 lactose was used as a control because it has a VMD of 112.9 ± 2.5 µm
which is comparable with the particle size of the PCL and PLGA microspheres that
have been fabricated (VMD: 104 ± 0.4 µm and 90.2 ± 1.0 µm for PCL and PLGA
microspheres, respectively. Particle sizes have been measured by laser diffraction
according to the procedure described in Chapter 3, Section 3.2.3). One important
point to be considered here is that the morphologies of lactose and polymer particles
are quite different. It is noted that the lactose carriers used as control showed a wider
particle size distribution (Figure 5.1). This was due to the presence of a significant
amount of associated fine particles of lactose attached on the surface of large
carriers; whereas, PCL and PLGA microspheres showed comparatively narrow size
distribution (Figure 5.1). The large lactose particles have a significant amount of
associated fine lactose (less than 10 μm) and the effect of these fine particles on the
particle size distribution as well as the SS dispersion has not been taken into account
in this study.
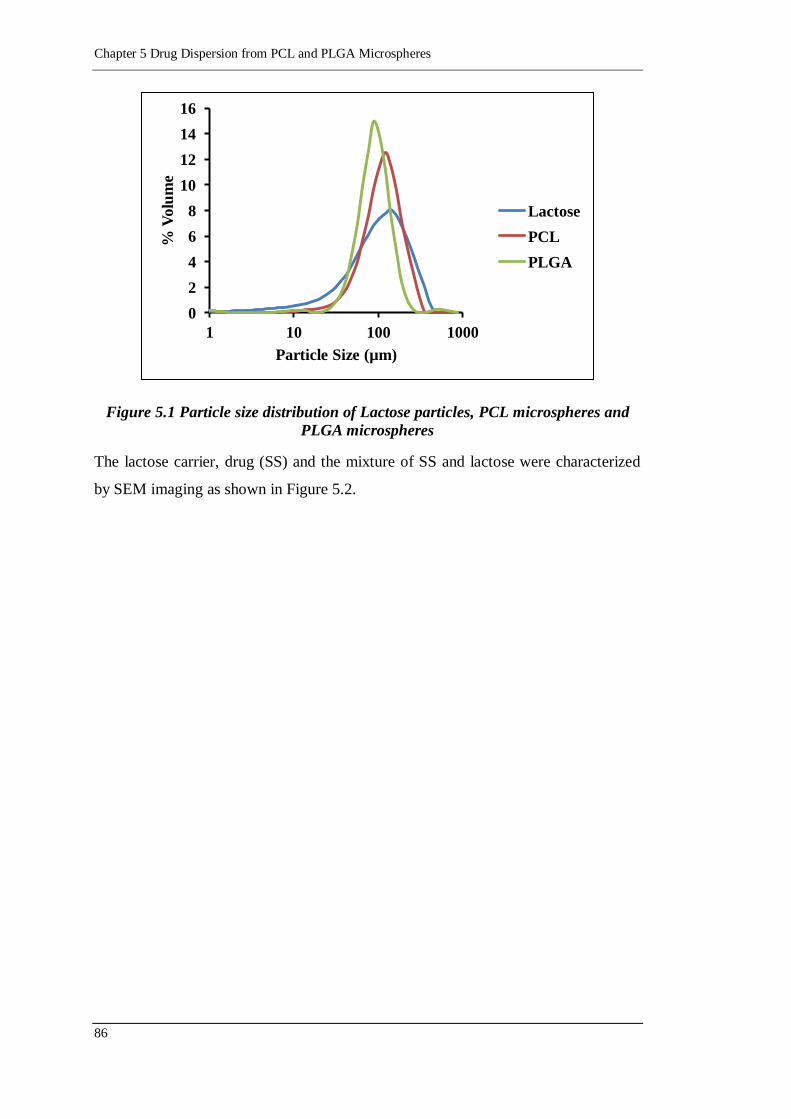
Chapter 5 Drug Dispersion from PCL and PLGA Microspheres
86
Figure 5.1 Particle size distribution of Lactose particles, PCL microspheres and
PLGA microspheres
The lactose carrier, drug (SS) and the mixture of SS and lactose were characterized
by SEM imaging as shown in Figure 5.2.
0
2
4
6
8
10
12
14
16
1 10 100 1000
% V
olu
me
Particle Size (µm)
Lactose
PCL
PLGA
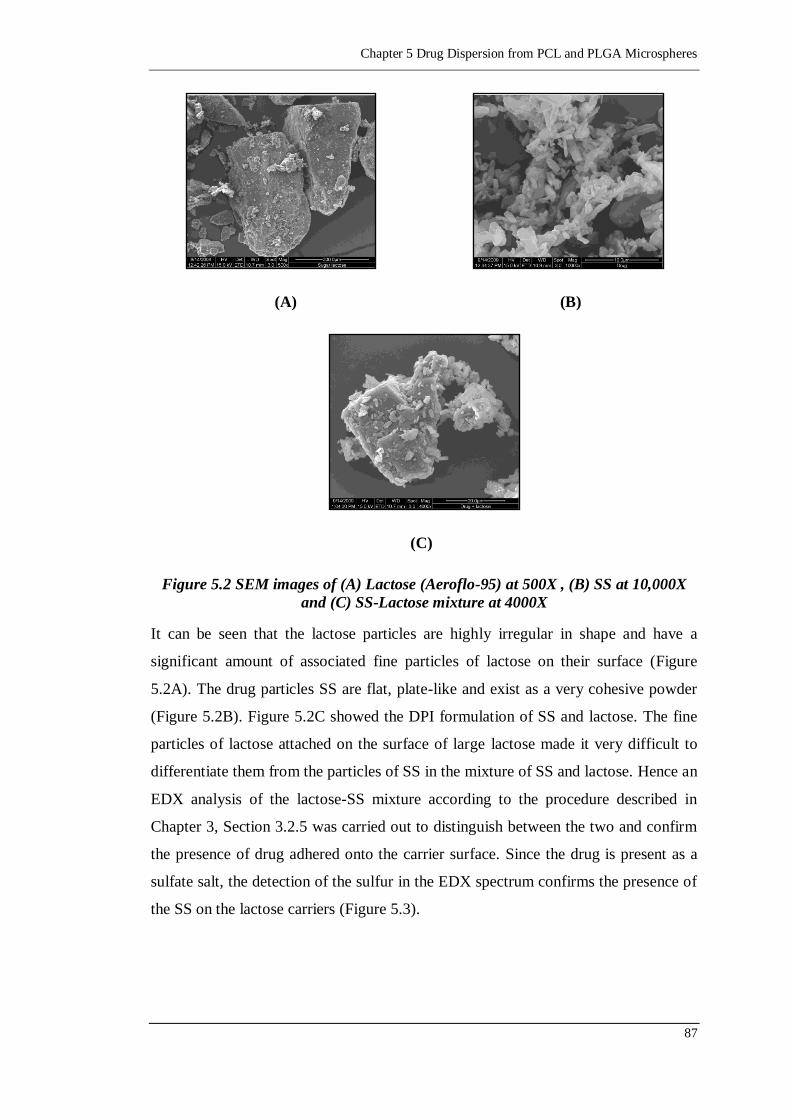
Chapter 5 Drug Dispersion from PCL and PLGA Microspheres
87
(A) (B)
(C)
Figure 5.2 SEM images of (A) Lactose (Aeroflo-95) at 500X , (B) SS at 10,000X
and (C) SS-Lactose mixture at 4000X
It can be seen that the lactose particles are highly irregular in shape and have a
significant amount of associated fine particles of lactose on their surface (Figure
5.2A). The drug particles SS are flat, plate-like and exist as a very cohesive powder
(Figure 5.2B). Figure 5.2C showed the DPI formulation of SS and lactose. The fine
particles of lactose attached on the surface of large lactose made it very difficult to
differentiate them from the particles of SS in the mixture of SS and lactose. Hence an
EDX analysis of the lactose-SS mixture according to the procedure described in
Chapter 3, Section 3.2.5 was carried out to distinguish between the two and confirm
the presence of drug adhered onto the carrier surface. Since the drug is present as a
sulfate salt, the detection of the sulfur in the EDX spectrum confirms the presence of
the SS on the lactose carriers (Figure 5.3).
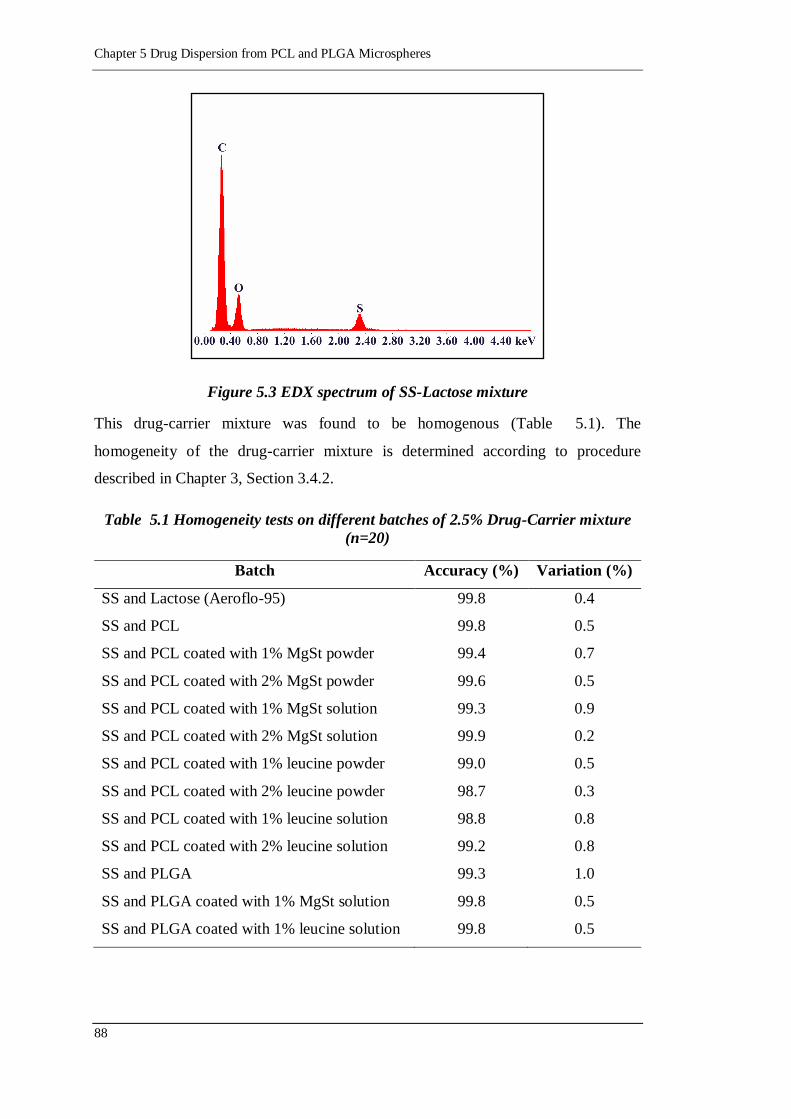
Chapter 5 Drug Dispersion from PCL and PLGA Microspheres
88
Figure 5.3 EDX spectrum of SS-Lactose mixture
This drug-carrier mixture was found to be homogenous (Table 5.1). The
homogeneity of the drug-carrier mixture is determined according to procedure
described in Chapter 3, Section 3.4.2.
Table 5.1 Homogeneity tests on different batches of 2.5% Drug-Carrier mixture
(n=20)
Batch Accuracy (%) Variation (%)
SS and Lactose (Aeroflo-95) 99.8 0.4
SS and PCL 99.8 0.5
SS and PCL coated with 1% MgSt powder 99.4 0.7
SS and PCL coated with 2% MgSt powder 99.6 0.5
SS and PCL coated with 1% MgSt solution 99.3 0.9
SS and PCL coated with 2% MgSt solution 99.9 0.2
SS and PCL coated with 1% leucine powder 99.0 0.5
SS and PCL coated with 2% leucine powder 98.7 0.3
SS and PCL coated with 1% leucine solution 98.8 0.8
SS and PCL coated with 2% leucine solution 99.2 0.8
SS and PLGA 99.3 1.0
SS and PLGA coated with 1% MgSt solution 99.8 0.5
SS and PLGA coated with 1% leucine solution 99.8 0.5
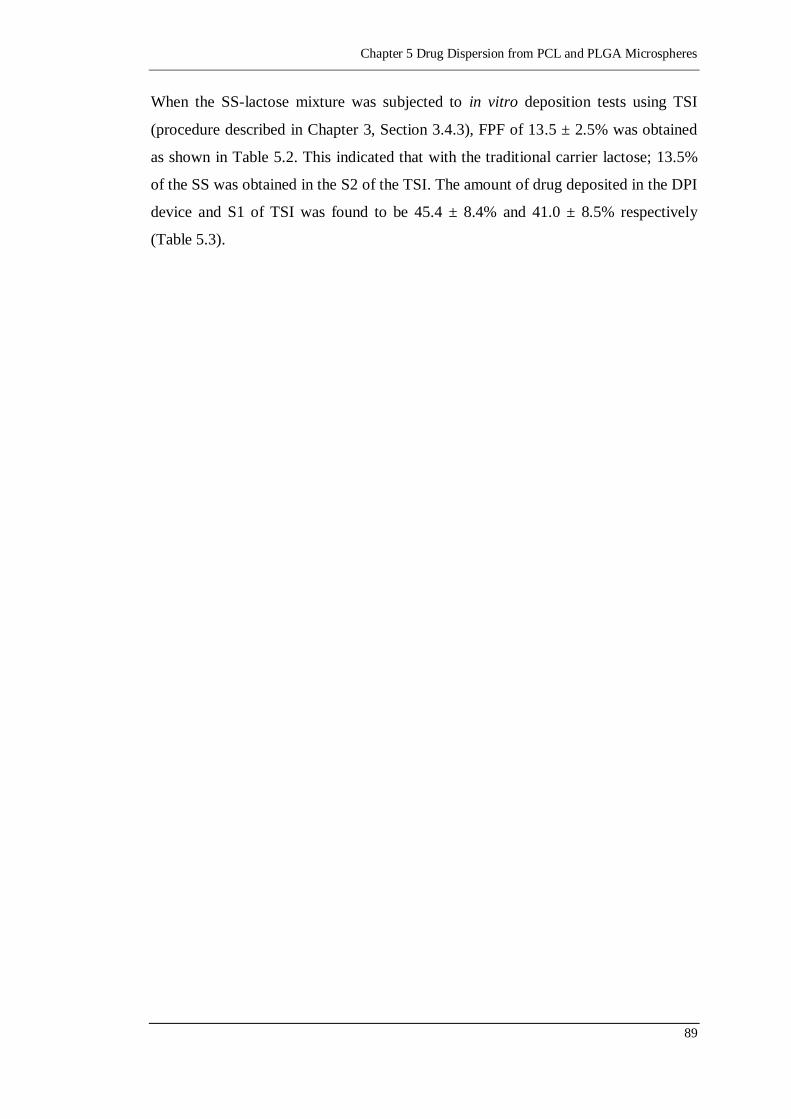
Chapter 5 Drug Dispersion from PCL and PLGA Microspheres
89
When the SS-lactose mixture was subjected to in vitro deposition tests using TSI
(procedure described in Chapter 3, Section 3.4.3), FPF of 13.5 ± 2.5% was obtained
as shown in Table 5.2. This indicated that with the traditional carrier lactose; 13.5%
of the SS was obtained in the S2 of the TSI. The amount of drug deposited in the DPI
device and S1 of TSI was found to be 45.4 ± 8.4% and 41.0 ± 8.5% respectively
(Table 5.3).
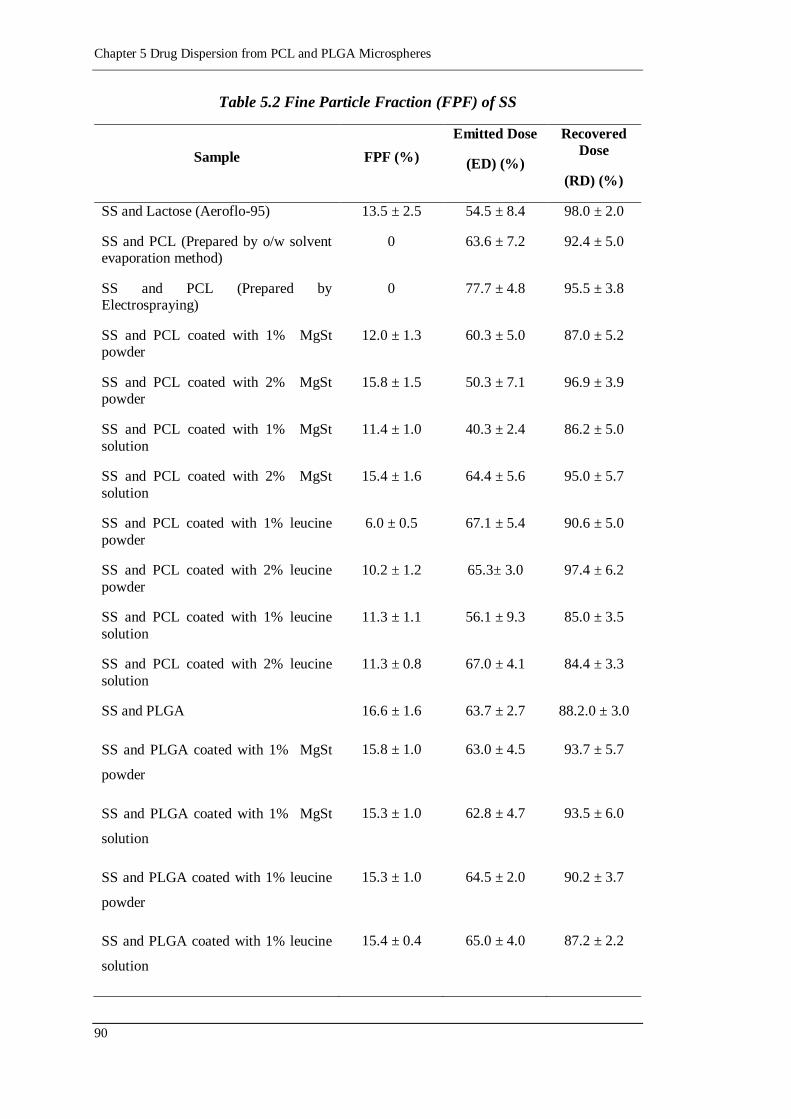
Chapter 5 Drug Dispersion from PCL and PLGA Microspheres
90
Table 5.2 Fine Particle Fraction (FPF) of SS
Sample FPF (%)
Emitted Dose
(ED) (%)
Recovered
Dose
(RD) (%)
SS and Lactose (Aeroflo-95) 13.5 ± 2.5 54.5 ± 8.4 98.0 ± 2.0
SS and PCL (Prepared by o/w solvent evaporation method)
0 63.6 ± 7.2 92.4 ± 5.0
SS and PCL (Prepared by Electrospraying)
0 77.7 ± 4.8 95.5 ± 3.8
SS and PCL coated with 1% MgSt powder
12.0 ± 1.3 60.3 ± 5.0 87.0 ± 5.2
SS and PCL coated with 2% MgSt powder
15.8 ± 1.5 50.3 ± 7.1 96.9 ± 3.9
SS and PCL coated with 1% MgSt
solution
11.4 ± 1.0 40.3 ± 2.4 86.2 ± 5.0
SS and PCL coated with 2% MgSt
solution
15.4 ± 1.6 64.4 ± 5.6 95.0 ± 5.7
SS and PCL coated with 1% leucine
powder
6.0 ± 0.5 67.1 ± 5.4 90.6 ± 5.0
SS and PCL coated with 2% leucine
powder
10.2 ± 1.2 65.3± 3.0 97.4 ± 6.2
SS and PCL coated with 1% leucine
solution
11.3 ± 1.1 56.1 ± 9.3 85.0 ± 3.5
SS and PCL coated with 2% leucine
solution
11.3 ± 0.8 67.0 ± 4.1 84.4 ± 3.3
SS and PLGA 16.6 ± 1.6 63.7 ± 2.7 88.2.0 ± 3.0
SS and PLGA coated with 1% MgSt
powder
15.8 ± 1.0 63.0 ± 4.5 93.7 ± 5.7
SS and PLGA coated with 1% MgSt
solution
15.3 ± 1.0 62.8 ± 4.7 93.5 ± 6.0
SS and PLGA coated with 1% leucine
powder
15.3 ± 1.0 64.5 ± 2.0 90.2 ± 3.7
SS and PLGA coated with 1% leucine
solution
15.4 ± 0.4 65.0 ± 4.0 87.2 ± 2.2
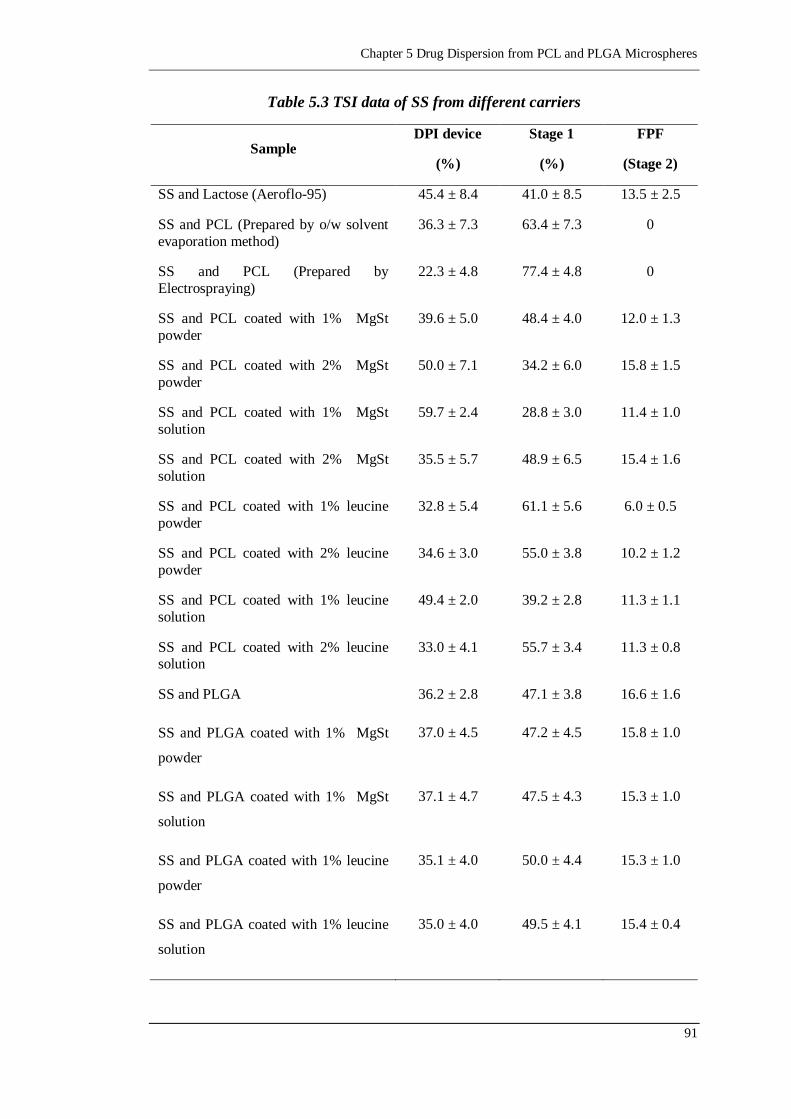
Chapter 5 Drug Dispersion from PCL and PLGA Microspheres
91
Table 5.3 TSI data of SS from different carriers
Sample DPI device
(%)
Stage 1
(%)
FPF
(Stage 2)
SS and Lactose (Aeroflo-95) 45.4 ± 8.4 41.0 ± 8.5 13.5 ± 2.5
SS and PCL (Prepared by o/w solvent
evaporation method)
36.3 ± 7.3 63.4 ± 7.3 0
SS and PCL (Prepared by
Electrospraying)
22.3 ± 4.8 77.4 ± 4.8 0
SS and PCL coated with 1% MgSt
powder
39.6 ± 5.0 48.4 ± 4.0 12.0 ± 1.3
SS and PCL coated with 2% MgSt
powder
50.0 ± 7.1 34.2 ± 6.0 15.8 ± 1.5
SS and PCL coated with 1% MgSt
solution
59.7 ± 2.4 28.8 ± 3.0 11.4 ± 1.0
SS and PCL coated with 2% MgSt
solution
35.5 ± 5.7 48.9 ± 6.5 15.4 ± 1.6
SS and PCL coated with 1% leucine
powder
32.8 ± 5.4 61.1 ± 5.6 6.0 ± 0.5
SS and PCL coated with 2% leucine
powder
34.6 ± 3.0 55.0 ± 3.8 10.2 ± 1.2
SS and PCL coated with 1% leucine
solution
49.4 ± 2.0 39.2 ± 2.8 11.3 ± 1.1
SS and PCL coated with 2% leucine solution
33.0 ± 4.1 55.7 ± 3.4 11.3 ± 0.8
SS and PLGA 36.2 ± 2.8 47.1 ± 3.8 16.6 ± 1.6
SS and PLGA coated with 1% MgSt
powder
37.0 ± 4.5 47.2 ± 4.5 15.8 ± 1.0
SS and PLGA coated with 1% MgSt
solution
37.1 ± 4.7 47.5 ± 4.3 15.3 ± 1.0
SS and PLGA coated with 1% leucine
powder
35.1 ± 4.0 50.0 ± 4.4 15.3 ± 1.0
SS and PLGA coated with 1% leucine
solution
35.0 ± 4.0 49.5 ± 4.1 15.4 ± 0.4
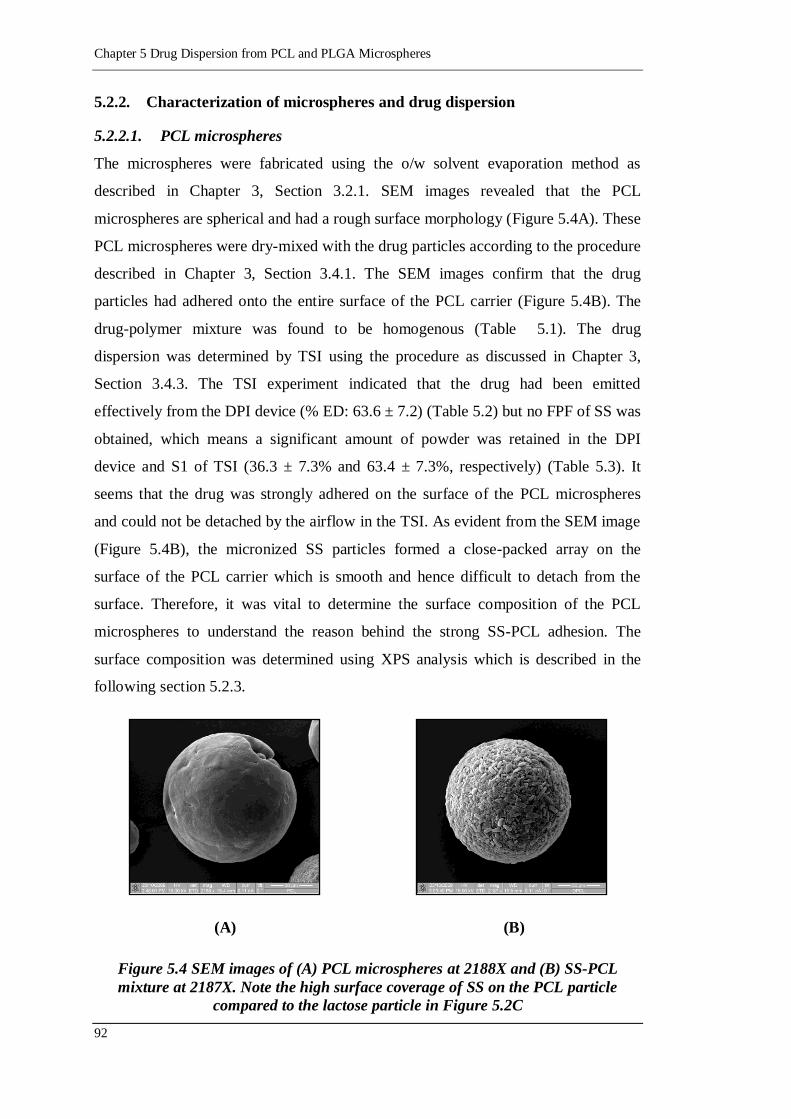
Chapter 5 Drug Dispersion from PCL and PLGA Microspheres
92
5.2.2. Characterization of microspheres and drug dispersion
5.2.2.1. PCL microspheres
The microspheres were fabricated using the o/w solvent evaporation method as
described in Chapter 3, Section 3.2.1. SEM images revealed that the PCL
microspheres are spherical and had a rough surface morphology (Figure 5.4A). These
PCL microspheres were dry-mixed with the drug particles according to the procedure
described in Chapter 3, Section 3.4.1. The SEM images confirm that the drug
particles had adhered onto the entire surface of the PCL carrier (Figure 5.4B). The
drug-polymer mixture was found to be homogenous (Table 5.1). The drug
dispersion was determined by TSI using the procedure as discussed in Chapter 3,
Section 3.4.3. The TSI experiment indicated that the drug had been emitted
effectively from the DPI device (% ED: 63.6 ± 7.2) (Table 5.2) but no FPF of SS was
obtained, which means a significant amount of powder was retained in the DPI
device and S1 of TSI (36.3 ± 7.3% and 63.4 ± 7.3%, respectively) (Table 5.3). It
seems that the drug was strongly adhered on the surface of the PCL microspheres
and could not be detached by the airflow in the TSI. As evident from the SEM image
(Figure 5.4B), the micronized SS particles formed a close-packed array on the
surface of the PCL carrier which is smooth and hence difficult to detach from the
surface. Therefore, it was vital to determine the surface composition of the PCL
microspheres to understand the reason behind the strong SS-PCL adhesion. The
surface composition was determined using XPS analysis which is described in the
following section 5.2.3.
(A) (B)
Figure 5.4 SEM images of (A) PCL microspheres at 2188X and (B) SS-PCL
mixture at 2187X. Note the high surface coverage of SS on the PCL particle
compared to the lactose particle in Figure 5.2C
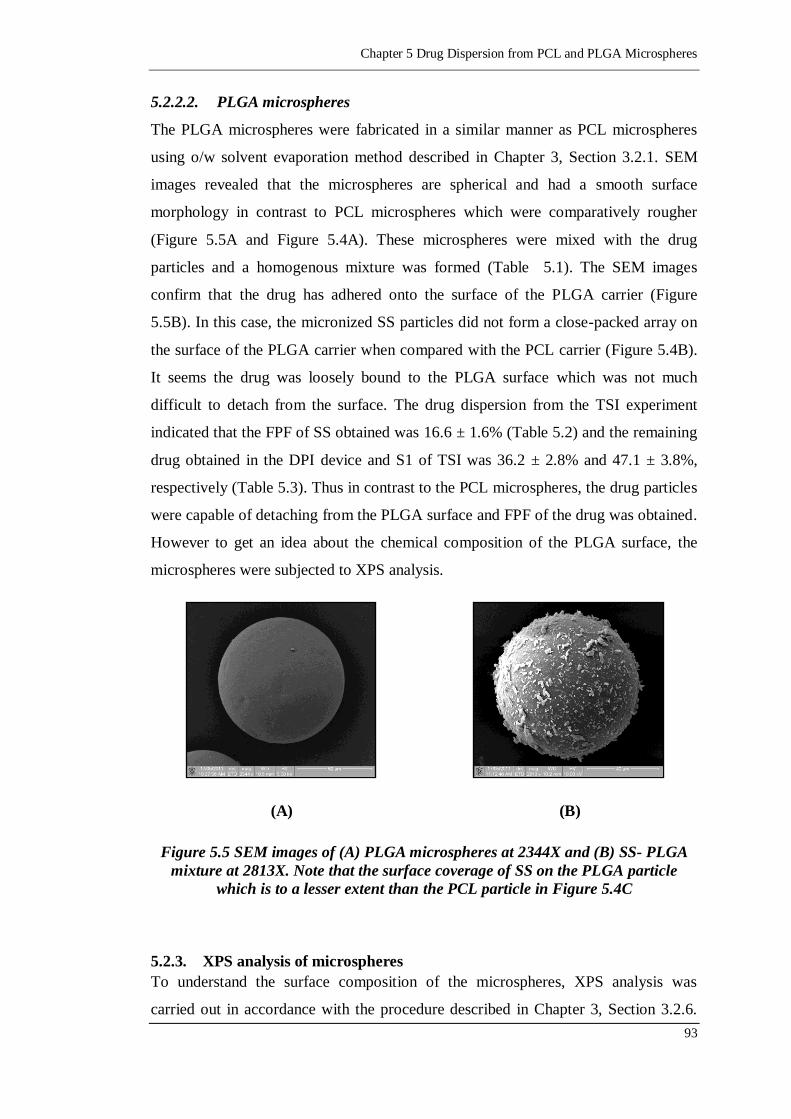
Chapter 5 Drug Dispersion from PCL and PLGA Microspheres
93
5.2.2.2. PLGA microspheres
The PLGA microspheres were fabricated in a similar manner as PCL microspheres
using o/w solvent evaporation method described in Chapter 3, Section 3.2.1. SEM
images revealed that the microspheres are spherical and had a smooth surface
morphology in contrast to PCL microspheres which were comparatively rougher
(Figure 5.5A and Figure 5.4A). These microspheres were mixed with the drug
particles and a homogenous mixture was formed (Table 5.1). The SEM images
confirm that the drug has adhered onto the surface of the PLGA carrier (Figure
5.5B). In this case, the micronized SS particles did not form a close-packed array on
the surface of the PLGA carrier when compared with the PCL carrier (Figure 5.4B).
It seems the drug was loosely bound to the PLGA surface which was not much
difficult to detach from the surface. The drug dispersion from the TSI experiment
indicated that the FPF of SS obtained was 16.6 ± 1.6% (Table 5.2) and the remaining
drug obtained in the DPI device and S1 of TSI was 36.2 ± 2.8% and 47.1 ± 3.8%,
respectively (Table 5.3). Thus in contrast to the PCL microspheres, the drug particles
were capable of detaching from the PLGA surface and FPF of the drug was obtained.
However to get an idea about the chemical composition of the PLGA surface, the
microspheres were subjected to XPS analysis.
(A) (B)
Figure 5.5 SEM images of (A) PLGA microspheres at 2344X and (B) SS- PLGA
mixture at 2813X. Note that the surface coverage of SS on the PLGA particle
which is to a lesser extent than the PCL particle in Figure 5.4C
5.2.3. XPS analysis of microspheres
To understand the surface composition of the microspheres, XPS analysis was
carried out in accordance with the procedure described in Chapter 3, Section 3.2.6.
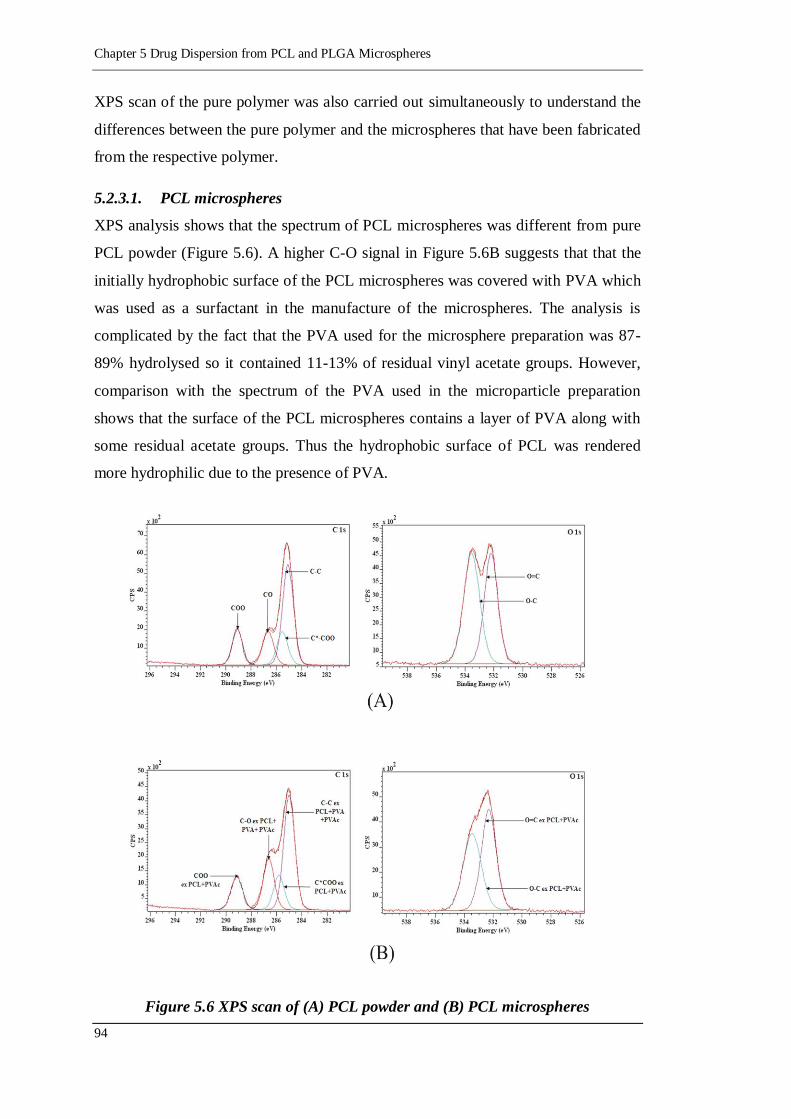
Chapter 5 Drug Dispersion from PCL and PLGA Microspheres
94
XPS scan of the pure polymer was also carried out simultaneously to understand the
differences between the pure polymer and the microspheres that have been fabricated
from the respective polymer.
5.2.3.1. PCL microspheres
XPS analysis shows that the spectrum of PCL microspheres was different from pure
PCL powder (Figure 5.6). A higher C-O signal in Figure 5.6B suggests that that the
initially hydrophobic surface of the PCL microspheres was covered with PVA which
was used as a surfactant in the manufacture of the microspheres. The analysis is
complicated by the fact that the PVA used for the microsphere preparation was 87-
89% hydrolysed so it contained 11-13% of residual vinyl acetate groups. However,
comparison with the spectrum of the PVA used in the microparticle preparation
shows that the surface of the PCL microspheres contains a layer of PVA along with
some residual acetate groups. Thus the hydrophobic surface of PCL was rendered
more hydrophilic due to the presence of PVA.
Figure 5.6 XPS scan of (A) PCL powder and (B) PCL microspheres
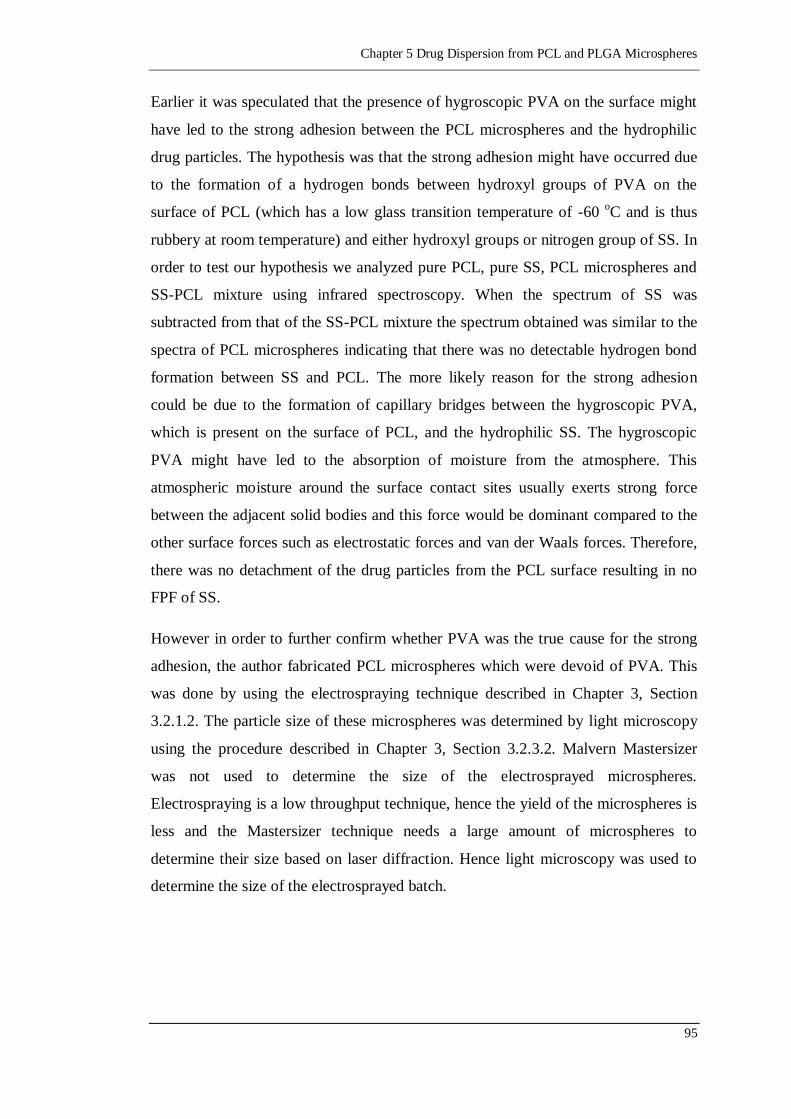
Chapter 5 Drug Dispersion from PCL and PLGA Microspheres
95
Earlier it was speculated that the presence of hygroscopic PVA on the surface might
have led to the strong adhesion between the PCL microspheres and the hydrophilic
drug particles. The hypothesis was that the strong adhesion might have occurred due
to the formation of a hydrogen bonds between hydroxyl groups of PVA on the
surface of PCL (which has a low glass transition temperature of -60 oC and is thus
rubbery at room temperature) and either hydroxyl groups or nitrogen group of SS. In
order to test our hypothesis we analyzed pure PCL, pure SS, PCL microspheres and
SS-PCL mixture using infrared spectroscopy. When the spectrum of SS was
subtracted from that of the SS-PCL mixture the spectrum obtained was similar to the
spectra of PCL microspheres indicating that there was no detectable hydrogen bond
formation between SS and PCL. The more likely reason for the strong adhesion
could be due to the formation of capillary bridges between the hygroscopic PVA,
which is present on the surface of PCL, and the hydrophilic SS. The hygroscopic
PVA might have led to the absorption of moisture from the atmosphere. This
atmospheric moisture around the surface contact sites usually exerts strong force
between the adjacent solid bodies and this force would be dominant compared to the
other surface forces such as electrostatic forces and van der Waals forces. Therefore,
there was no detachment of the drug particles from the PCL surface resulting in no
FPF of SS.
However in order to further confirm whether PVA was the true cause for the strong
adhesion, the author fabricated PCL microspheres which were devoid of PVA. This
was done by using the electrospraying technique described in Chapter 3, Section
3.2.1.2. The particle size of these microspheres was determined by light microscopy
using the procedure described in Chapter 3, Section 3.2.3.2. Malvern Mastersizer
was not used to determine the size of the electrosprayed microspheres.
Electrospraying is a low throughput technique, hence the yield of the microspheres is
less and the Mastersizer technique needs a large amount of microspheres to
determine their size based on laser diffraction. Hence light microscopy was used to
determine the size of the electrosprayed batch.
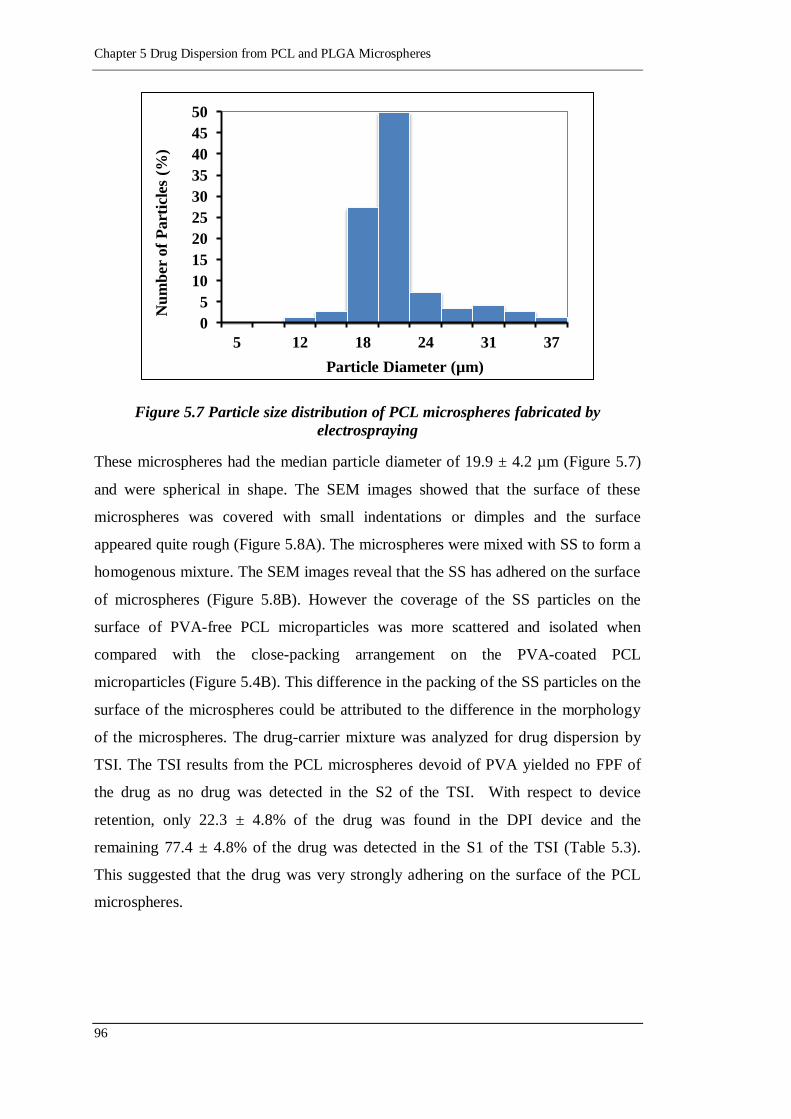
Chapter 5 Drug Dispersion from PCL and PLGA Microspheres
96
Figure 5.7 Particle size distribution of PCL microspheres fabricated by
electrospraying
These microspheres had the median particle diameter of 19.9 ± 4.2 µm (Figure 5.7)
and were spherical in shape. The SEM images showed that the surface of these
microspheres was covered with small indentations or dimples and the surface
appeared quite rough (Figure 5.8A). The microspheres were mixed with SS to form a
homogenous mixture. The SEM images reveal that the SS has adhered on the surface
of microspheres (Figure 5.8B). However the coverage of the SS particles on the
surface of PVA-free PCL microparticles was more scattered and isolated when
compared with the close-packing arrangement on the PVA-coated PCL
microparticles (Figure 5.4B). This difference in the packing of the SS particles on the
surface of the microspheres could be attributed to the difference in the morphology
of the microspheres. The drug-carrier mixture was analyzed for drug dispersion by
TSI. The TSI results from the PCL microspheres devoid of PVA yielded no FPF of
the drug as no drug was detected in the S2 of the TSI. With respect to device
retention, only 22.3 ± 4.8% of the drug was found in the DPI device and the
remaining 77.4 ± 4.8% of the drug was detected in the S1 of the TSI (Table 5.3).
This suggested that the drug was very strongly adhering on the surface of the PCL
microspheres.
0
5
10
15
20
25
30
35
40
45
50
5 12 18 24 31 37
Nu
mb
er o
f P
art
icle
s (%
)
Particle Diameter (µm)
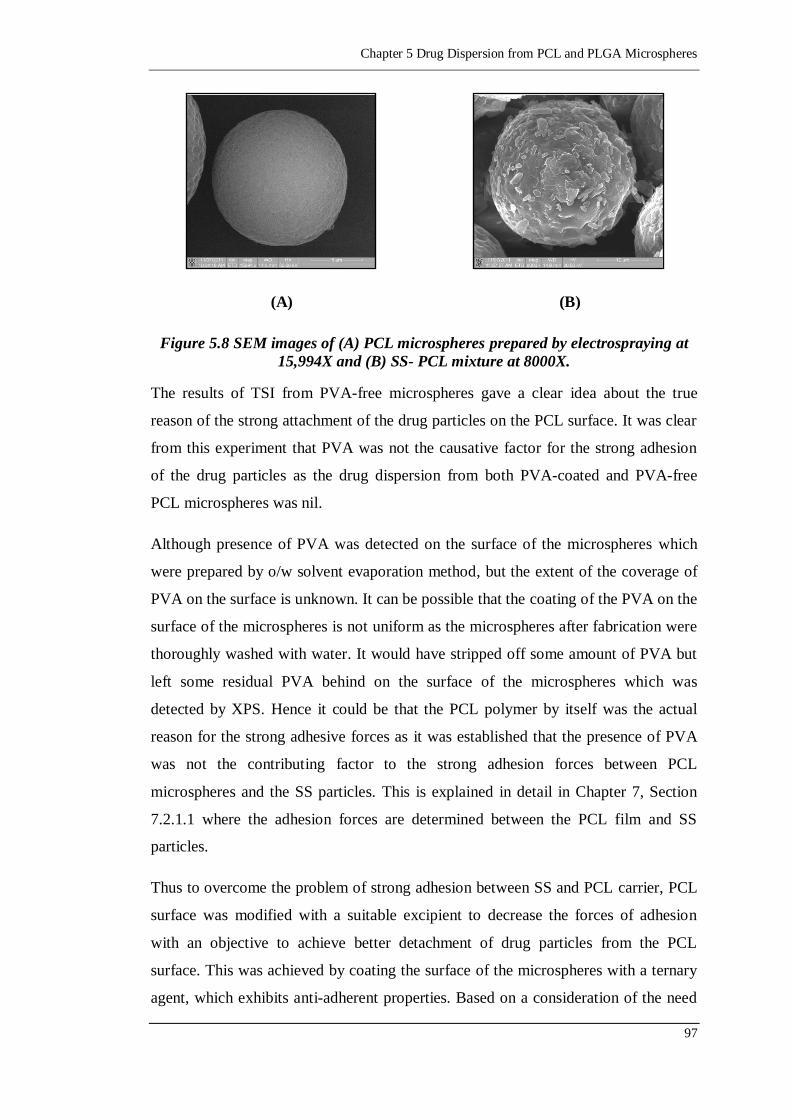
Chapter 5 Drug Dispersion from PCL and PLGA Microspheres
97
(A) (B)
Figure 5.8 SEM images of (A) PCL microspheres prepared by electrospraying at
15,994X and (B) SS- PCL mixture at 8000X.
The results of TSI from PVA-free microspheres gave a clear idea about the true
reason of the strong attachment of the drug particles on the PCL surface. It was clear
from this experiment that PVA was not the causative factor for the strong adhesion
of the drug particles as the drug dispersion from both PVA-coated and PVA-free
PCL microspheres was nil.
Although presence of PVA was detected on the surface of the microspheres which
were prepared by o/w solvent evaporation method, but the extent of the coverage of
PVA on the surface is unknown. It can be possible that the coating of the PVA on the
surface of the microspheres is not uniform as the microspheres after fabrication were
thoroughly washed with water. It would have stripped off some amount of PVA but
left some residual PVA behind on the surface of the microspheres which was
detected by XPS. Hence it could be that the PCL polymer by itself was the actual
reason for the strong adhesive forces as it was established that the presence of PVA
was not the contributing factor to the strong adhesion forces between PCL
microspheres and the SS particles. This is explained in detail in Chapter 7, Section
7.2.1.1 where the adhesion forces are determined between the PCL film and SS
particles.
Thus to overcome the problem of strong adhesion between SS and PCL carrier, PCL
surface was modified with a suitable excipient to decrease the forces of adhesion
with an objective to achieve better detachment of drug particles from the PCL
surface. This was achieved by coating the surface of the microspheres with a ternary
agent, which exhibits anti-adherent properties. Based on a consideration of the need
Chapter 5 Drug Dispersion from PCL and PLGA Microspheres
98
for excipients that would reduce the bonding to SS, MgSt and leucine were chosen.
Both these agents are hydrophobic and may act as lubricants between surfaces thus
improving the dispersibility of the powders.
Solution coating and dry mixing were both used for coating the microspheres. The
coating of the microspheres was carried out according to the procedure described in
Chapter 3, Section 3.2.2. The coated polymer microspheres were further subjected to
XPS analysis to confirm the presence of the MgSt and leucine on the PCL
microspheres. The XPS data (Table 5.4) confirmed the presence of magnesium and
nitrogen elements on the PCL microspheres which indicated that the PCL particles
were successfully coated with these two agents. Also this technique was used to
determine the thickness of the coating on the surface of the PCL microspheres [257].
If a uniform layer is formed, the thickness of the MgSt or leucine coating obtained
from solution may be determined using the following equation:
I
Il
dn 1 5.1
Where d is the thickness of the layer on the substrate, λ is the photoelectron mean
free path in the overlayer, I is the signal intensity of the overlayer (intensity of
magnesium or nitrogen obtained from coated PCL microspheres) and I∞ is the signal
intensity from a homogenous infinitely thick sample of the overlayer (intensity of
magnesium or nitrogen obtained from pure MgSt and leucine powders respectively).
According to Table 5.4, I∞= 2.1 and 11.17 for MgSt and leucine powder samples,
respectively. The mean free path (λ) for a magnesium photoelectron was unavailable
and Si-2p was taken as a reference element because both photoelectrons have similar
kinetic energies. λ was taken to be 40 Å on average for a silicon layer (Si-2p) on
polyester or polystyrene material. λ was taken to be 32 Å for nitrogen which is the
reference value of N-1s on polyester or polystyrene material [258].Using this
equation and the I values in Table 5.4, the thickness of MgSt coating on the surface
of the PCL microspheres was determined to be 10 Å and 38 Å when deposited from
1% and 2% MgSt solutions, respectively. In contrast, it was found by the same
method of analysis that 1% and 2% leucine solution coating provided 5 Å and 8 Å
layers on the surface of PCL microspheres. It should be noted that these calculations
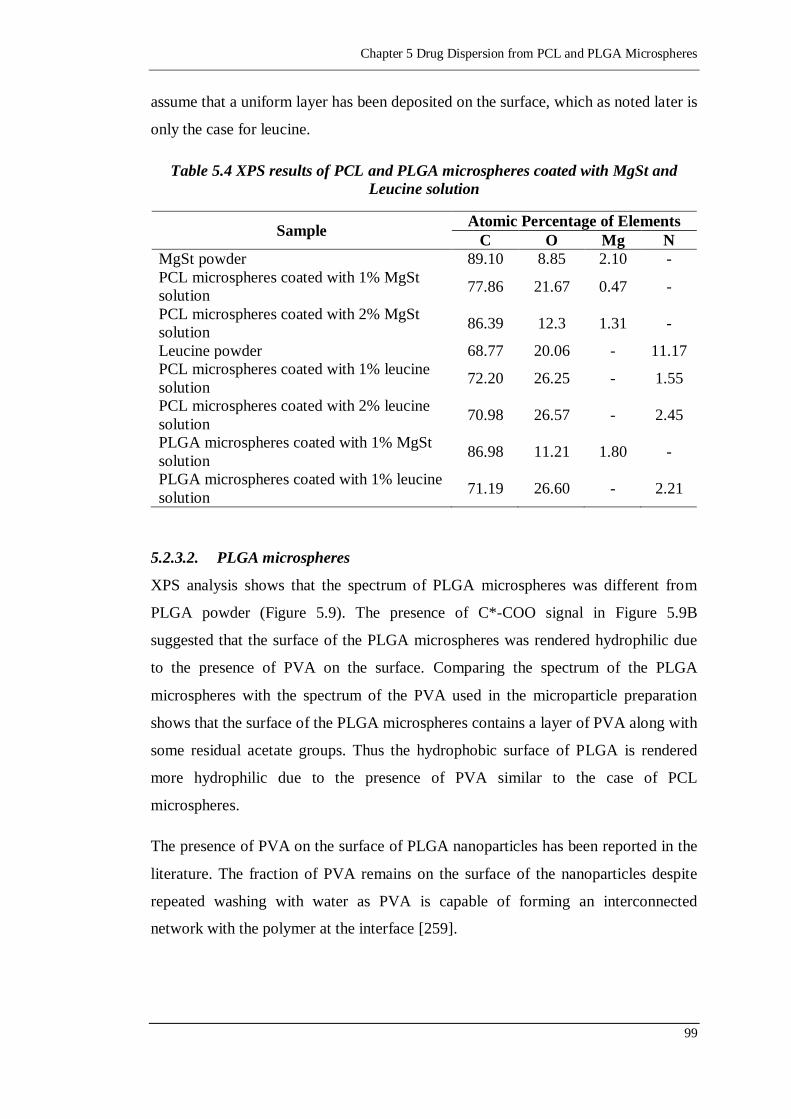
Chapter 5 Drug Dispersion from PCL and PLGA Microspheres
99
assume that a uniform layer has been deposited on the surface, which as noted later is
only the case for leucine.
Table 5.4 XPS results of PCL and PLGA microspheres coated with MgSt and
Leucine solution
Sample Atomic Percentage of Elements
C O Mg N
MgSt powder 89.10 8.85 2.10 -
PCL microspheres coated with 1% MgSt
solution 77.86 21.67 0.47 -
PCL microspheres coated with 2% MgSt
solution 86.39 12.3 1.31 -
Leucine powder 68.77 20.06 - 11.17
PCL microspheres coated with 1% leucine
solution 72.20 26.25 - 1.55
PCL microspheres coated with 2% leucine
solution 70.98 26.57 - 2.45
PLGA microspheres coated with 1% MgSt
solution 86.98 11.21 1.80 -
PLGA microspheres coated with 1% leucine
solution 71.19 26.60 - 2.21
5.2.3.2. PLGA microspheres
XPS analysis shows that the spectrum of PLGA microspheres was different from
PLGA powder (Figure 5.9). The presence of C*-COO signal in Figure 5.9B
suggested that the surface of the PLGA microspheres was rendered hydrophilic due
to the presence of PVA on the surface. Comparing the spectrum of the PLGA
microspheres with the spectrum of the PVA used in the microparticle preparation
shows that the surface of the PLGA microspheres contains a layer of PVA along with
some residual acetate groups. Thus the hydrophobic surface of PLGA is rendered
more hydrophilic due to the presence of PVA similar to the case of PCL
microspheres.
The presence of PVA on the surface of PLGA nanoparticles has been reported in the
literature. The fraction of PVA remains on the surface of the nanoparticles despite
repeated washing with water as PVA is capable of forming an interconnected
network with the polymer at the interface [259].
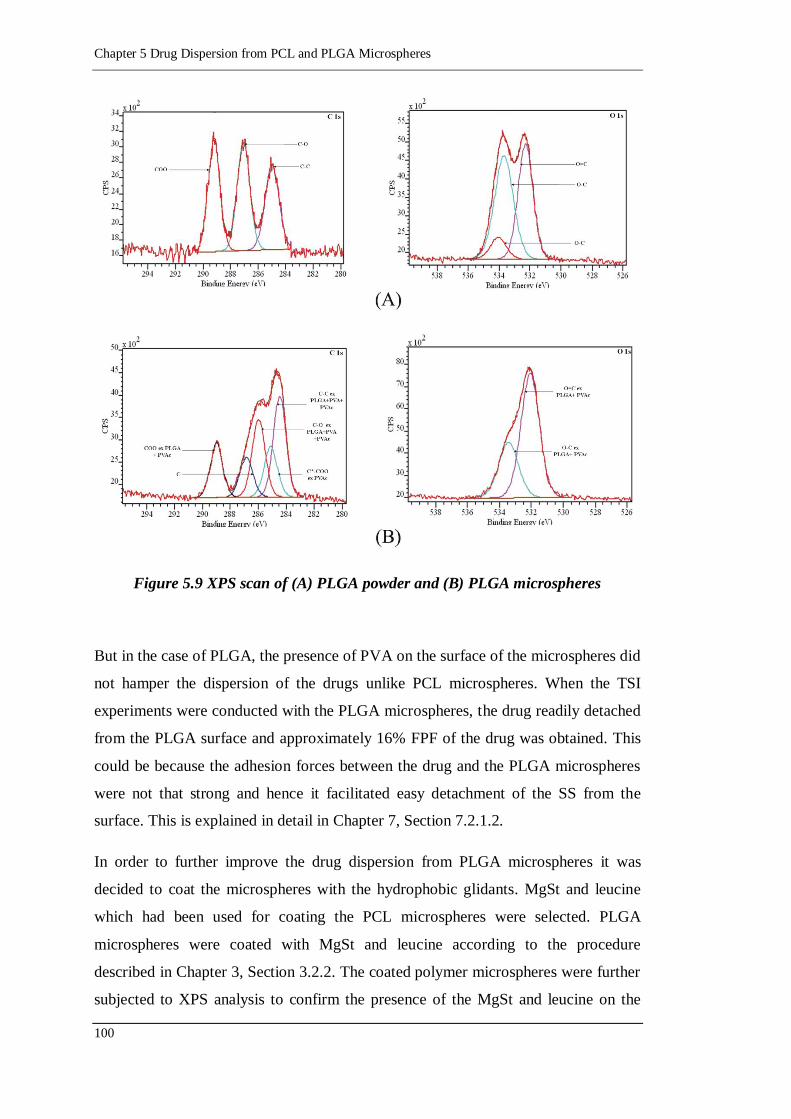
Chapter 5 Drug Dispersion from PCL and PLGA Microspheres
100
Figure 5.9 XPS scan of (A) PLGA powder and (B) PLGA microspheres
But in the case of PLGA, the presence of PVA on the surface of the microspheres did
not hamper the dispersion of the drugs unlike PCL microspheres. When the TSI
experiments were conducted with the PLGA microspheres, the drug readily detached
from the PLGA surface and approximately 16% FPF of the drug was obtained. This
could be because the adhesion forces between the drug and the PLGA microspheres
were not that strong and hence it facilitated easy detachment of the SS from the
surface. This is explained in detail in Chapter 7, Section 7.2.1.2.
In order to further improve the drug dispersion from PLGA microspheres it was
decided to coat the microspheres with the hydrophobic glidants. MgSt and leucine
which had been used for coating the PCL microspheres were selected. PLGA
microspheres were coated with MgSt and leucine according to the procedure
described in Chapter 3, Section 3.2.2. The coated polymer microspheres were further
subjected to XPS analysis to confirm the presence of the MgSt and leucine on the
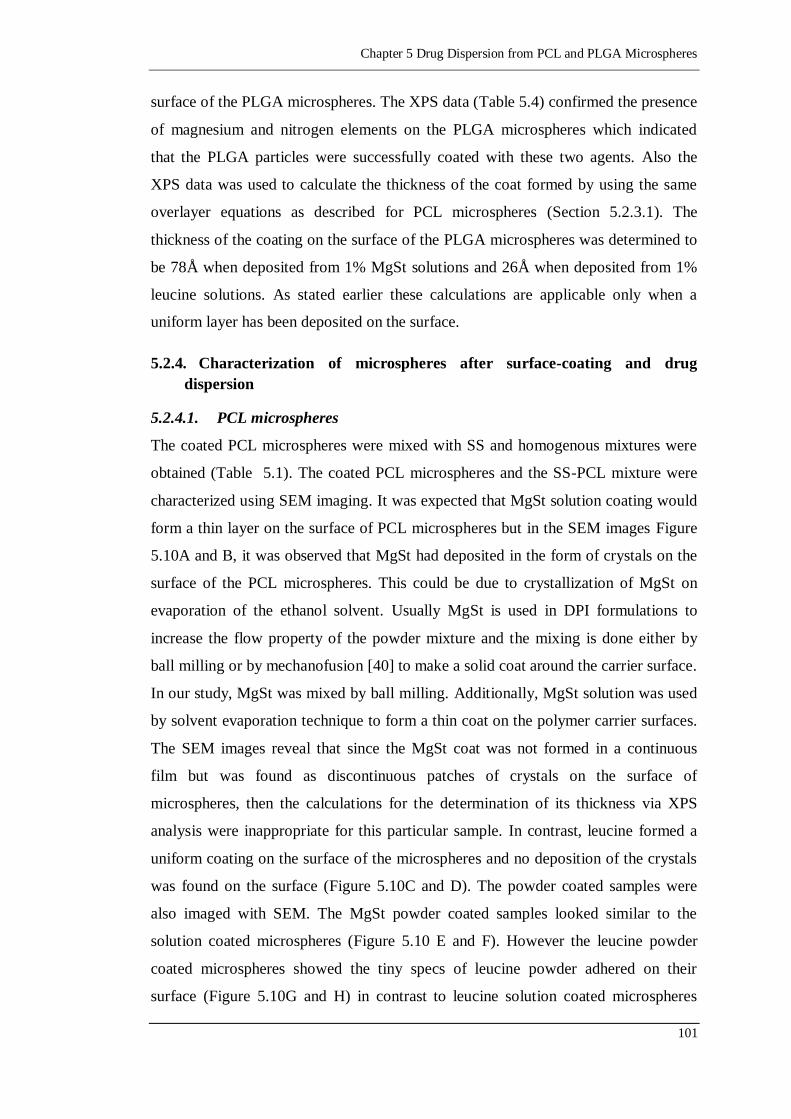
Chapter 5 Drug Dispersion from PCL and PLGA Microspheres
101
surface of the PLGA microspheres. The XPS data (Table 5.4) confirmed the presence
of magnesium and nitrogen elements on the PLGA microspheres which indicated
that the PLGA particles were successfully coated with these two agents. Also the
XPS data was used to calculate the thickness of the coat formed by using the same
overlayer equations as described for PCL microspheres (Section 5.2.3.1). The
thickness of the coating on the surface of the PLGA microspheres was determined to
be 78Å when deposited from 1% MgSt solutions and 26Å when deposited from 1%
leucine solutions. As stated earlier these calculations are applicable only when a
uniform layer has been deposited on the surface.
5.2.4. Characterization of microspheres after surface-coating and drug
dispersion
5.2.4.1. PCL microspheres
The coated PCL microspheres were mixed with SS and homogenous mixtures were
obtained (Table 5.1). The coated PCL microspheres and the SS-PCL mixture were
characterized using SEM imaging. It was expected that MgSt solution coating would
form a thin layer on the surface of PCL microspheres but in the SEM images Figure
5.10A and B, it was observed that MgSt had deposited in the form of crystals on the
surface of the PCL microspheres. This could be due to crystallization of MgSt on
evaporation of the ethanol solvent. Usually MgSt is used in DPI formulations to
increase the flow property of the powder mixture and the mixing is done either by
ball milling or by mechanofusion [40] to make a solid coat around the carrier surface.
In our study, MgSt was mixed by ball milling. Additionally, MgSt solution was used
by solvent evaporation technique to form a thin coat on the polymer carrier surfaces.
The SEM images reveal that since the MgSt coat was not formed in a continuous
film but was found as discontinuous patches of crystals on the surface of
microspheres, then the calculations for the determination of its thickness via XPS
analysis were inappropriate for this particular sample. In contrast, leucine formed a
uniform coating on the surface of the microspheres and no deposition of the crystals
was found on the surface (Figure 5.10C and D). The powder coated samples were
also imaged with SEM. The MgSt powder coated samples looked similar to the
solution coated microspheres (Figure 5.10 E and F). However the leucine powder
coated microspheres showed the tiny specs of leucine powder adhered on their
surface (Figure 5.10G and H) in contrast to leucine solution coated microspheres
Chapter 5 Drug Dispersion from PCL and PLGA Microspheres
102
which had a uniform coating. The SEM images further confirm that the drug has
adhered onto the surface of the coated PCL carrier but not to the same extent as
compared with the uncoated PCL microspheres. It is noted that in case of coated
microspheres the attachment of the SS particles on the carrier is scattered and more
isolated and the surface corona is rougher as compared to the uncoated PCL carrier
(Figure 5.11 and Figure 5.4B).
(A) (B)
(C) (D)
(E) (F)
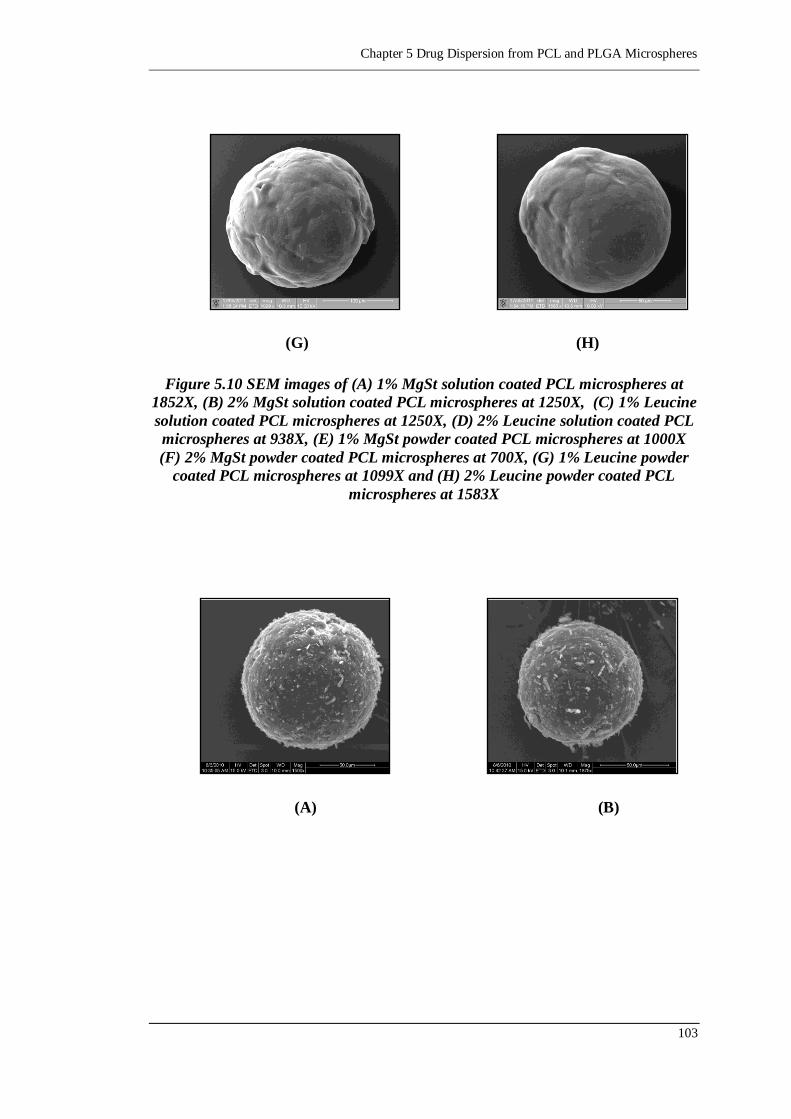
Chapter 5 Drug Dispersion from PCL and PLGA Microspheres
103
(G) (H)
Figure 5.10 SEM images of (A) 1% MgSt solution coated PCL microspheres at
1852X, (B) 2% MgSt solution coated PCL microspheres at 1250X, (C) 1% Leucine
solution coated PCL microspheres at 1250X, (D) 2% Leucine solution coated PCL
microspheres at 938X, (E) 1% MgSt powder coated PCL microspheres at 1000X
(F) 2% MgSt powder coated PCL microspheres at 700X, (G) 1% Leucine powder
coated PCL microspheres at 1099X and (H) 2% Leucine powder coated PCL
microspheres at 1583X
(A) (B)
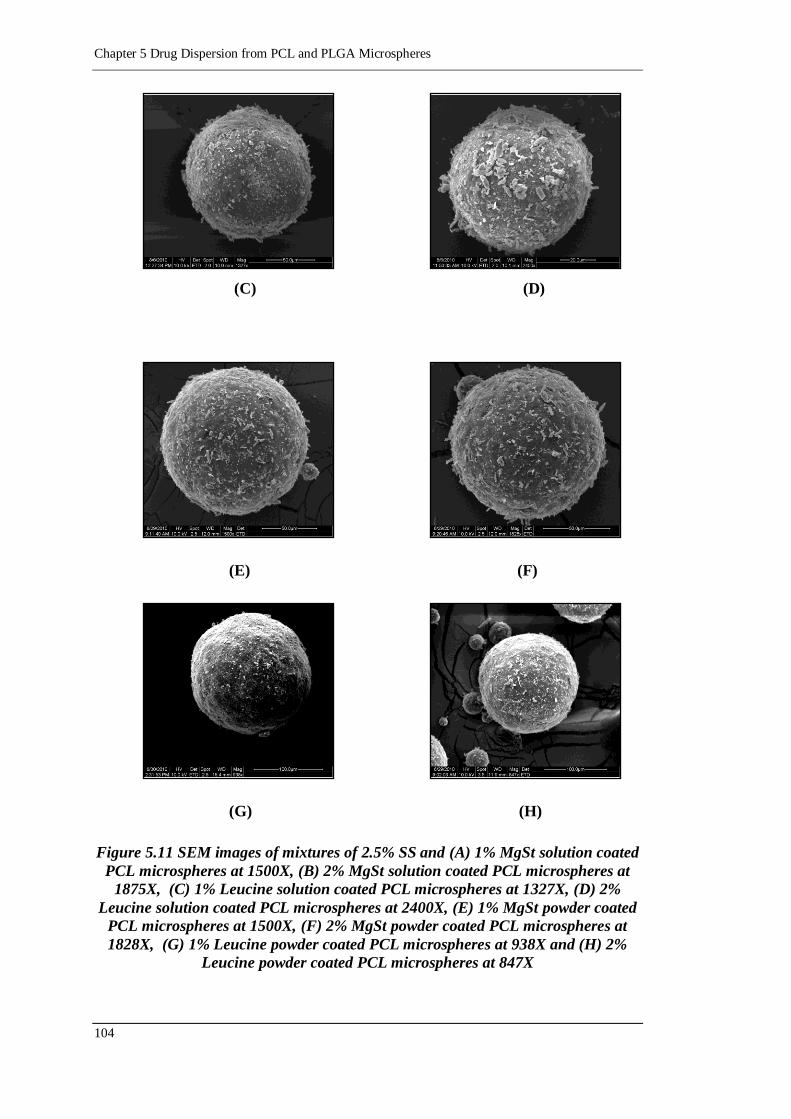
Chapter 5 Drug Dispersion from PCL and PLGA Microspheres
104
(C) (D)
(E) (F)
(G) (H)
Figure 5.11 SEM images of mixtures of 2.5% SS and (A) 1% MgSt solution coated
PCL microspheres at 1500X, (B) 2% MgSt solution coated PCL microspheres at
1875X, (C) 1% Leucine solution coated PCL microspheres at 1327X, (D) 2%
Leucine solution coated PCL microspheres at 2400X, (E) 1% MgSt powder coated
PCL microspheres at 1500X, (F) 2% MgSt powder coated PCL microspheres at
1828X, (G) 1% Leucine powder coated PCL microspheres at 938X and (H) 2%
Leucine powder coated PCL microspheres at 847X
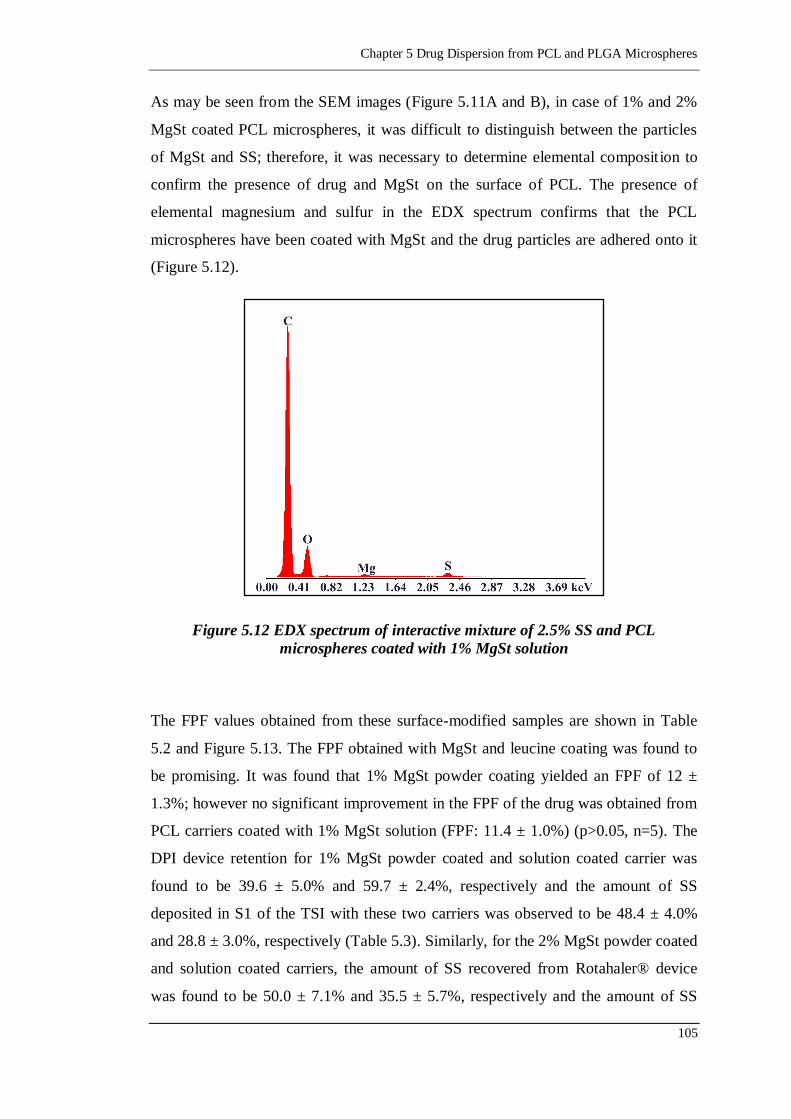
Chapter 5 Drug Dispersion from PCL and PLGA Microspheres
105
As may be seen from the SEM images (Figure 5.11A and B), in case of 1% and 2%
MgSt coated PCL microspheres, it was difficult to distinguish between the particles
of MgSt and SS; therefore, it was necessary to determine elemental composition to
confirm the presence of drug and MgSt on the surface of PCL. The presence of
elemental magnesium and sulfur in the EDX spectrum confirms that the PCL
microspheres have been coated with MgSt and the drug particles are adhered onto it
(Figure 5.12).
Figure 5.12 EDX spectrum of interactive mixture of 2.5% SS and PCL
microspheres coated with 1% MgSt solution
The FPF values obtained from these surface-modified samples are shown in Table
5.2 and Figure 5.13. The FPF obtained with MgSt and leucine coating was found to
be promising. It was found that 1% MgSt powder coating yielded an FPF of 12 ±
1.3%; however no significant improvement in the FPF of the drug was obtained from
PCL carriers coated with 1% MgSt solution (FPF: 11.4 ± 1.0%) (p>0.05, n=5). The
DPI device retention for 1% MgSt powder coated and solution coated carrier was
found to be 39.6 ± 5.0% and 59.7 ± 2.4%, respectively and the amount of SS
deposited in S1 of the TSI with these two carriers was observed to be 48.4 ± 4.0%
and 28.8 ± 3.0%, respectively (Table 5.3). Similarly, for the 2% MgSt powder coated
and solution coated carriers, the amount of SS recovered from Rotahaler® device
was found to be 50.0 ± 7.1% and 35.5 ± 5.7%, respectively and the amount of SS
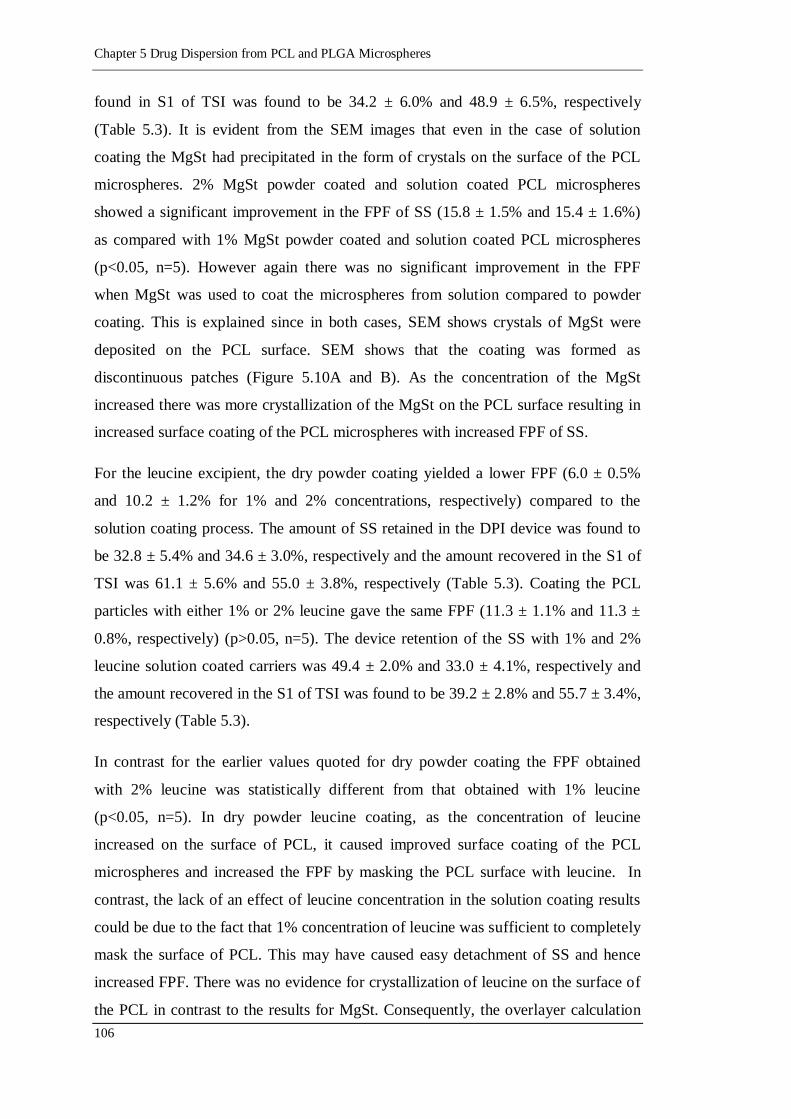
Chapter 5 Drug Dispersion from PCL and PLGA Microspheres
106
found in S1 of TSI was found to be 34.2 ± 6.0% and 48.9 ± 6.5%, respectively
(Table 5.3). It is evident from the SEM images that even in the case of solution
coating the MgSt had precipitated in the form of crystals on the surface of the PCL
microspheres. 2% MgSt powder coated and solution coated PCL microspheres
showed a significant improvement in the FPF of SS (15.8 ± 1.5% and 15.4 ± 1.6%)
as compared with 1% MgSt powder coated and solution coated PCL microspheres
(p<0.05, n=5). However again there was no significant improvement in the FPF
when MgSt was used to coat the microspheres from solution compared to powder
coating. This is explained since in both cases, SEM shows crystals of MgSt were
deposited on the PCL surface. SEM shows that the coating was formed as
discontinuous patches (Figure 5.10A and B). As the concentration of the MgSt
increased there was more crystallization of the MgSt on the PCL surface resulting in
increased surface coating of the PCL microspheres with increased FPF of SS.
For the leucine excipient, the dry powder coating yielded a lower FPF (6.0 ± 0.5%
and 10.2 ± 1.2% for 1% and 2% concentrations, respectively) compared to the
solution coating process. The amount of SS retained in the DPI device was found to
be 32.8 ± 5.4% and 34.6 ± 3.0%, respectively and the amount recovered in the S1 of
TSI was 61.1 ± 5.6% and 55.0 ± 3.8%, respectively (Table 5.3). Coating the PCL
particles with either 1% or 2% leucine gave the same FPF (11.3 ± 1.1% and 11.3 ±
0.8%, respectively) (p>0.05, n=5). The device retention of the SS with 1% and 2%
leucine solution coated carriers was 49.4 ± 2.0% and 33.0 ± 4.1%, respectively and
the amount recovered in the S1 of TSI was found to be 39.2 ± 2.8% and 55.7 ± 3.4%,
respectively (Table 5.3).
In contrast for the earlier values quoted for dry powder coating the FPF obtained
with 2% leucine was statistically different from that obtained with 1% leucine
(p<0.05, n=5). In dry powder leucine coating, as the concentration of leucine
increased on the surface of PCL, it caused improved surface coating of the PCL
microspheres and increased the FPF by masking the PCL surface with leucine. In
contrast, the lack of an effect of leucine concentration in the solution coating results
could be due to the fact that 1% concentration of leucine was sufficient to completely
mask the surface of PCL. This may have caused easy detachment of SS and hence
increased FPF. There was no evidence for crystallization of leucine on the surface of
the PCL in contrast to the results for MgSt. Consequently, the overlayer calculation
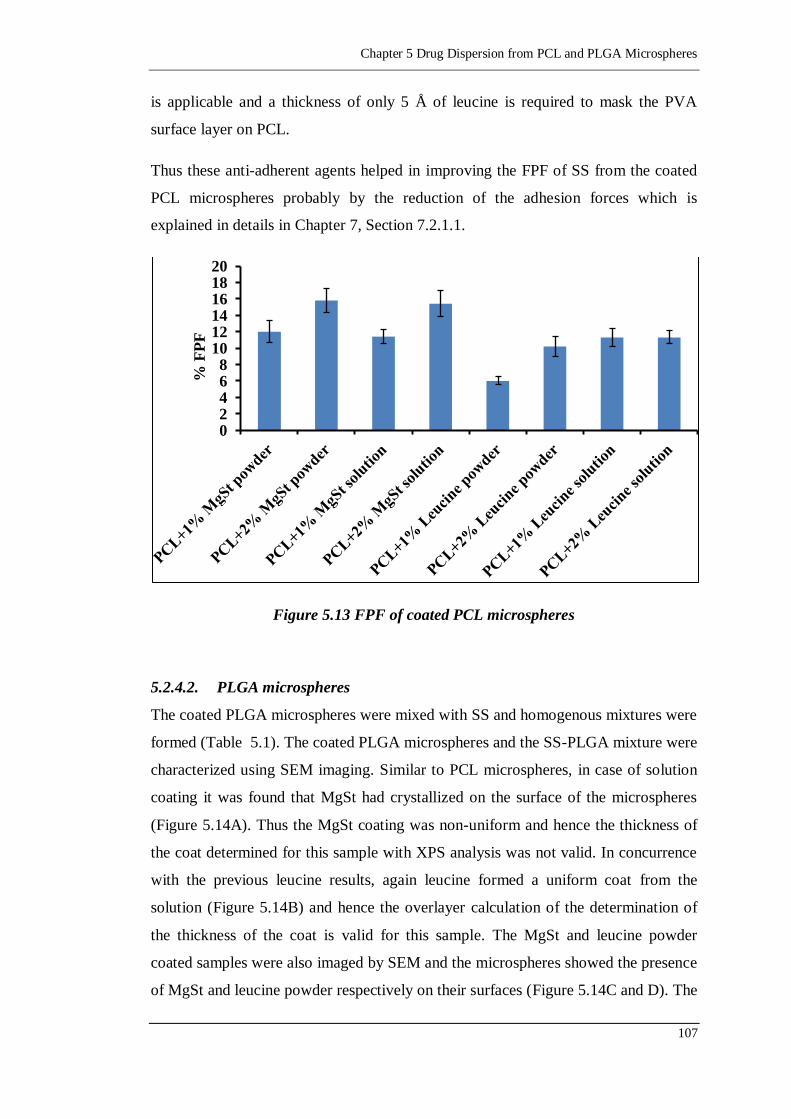
Chapter 5 Drug Dispersion from PCL and PLGA Microspheres
107
is applicable and a thickness of only 5 Å of leucine is required to mask the PVA
surface layer on PCL.
Thus these anti-adherent agents helped in improving the FPF of SS from the coated
PCL microspheres probably by the reduction of the adhesion forces which is
explained in details in Chapter 7, Section 7.2.1.1.
Figure 5.13 FPF of coated PCL microspheres
5.2.4.2. PLGA microspheres
The coated PLGA microspheres were mixed with SS and homogenous mixtures were
formed (Table 5.1). The coated PLGA microspheres and the SS-PLGA mixture were
characterized using SEM imaging. Similar to PCL microspheres, in case of solution
coating it was found that MgSt had crystallized on the surface of the microspheres
(Figure 5.14A). Thus the MgSt coating was non-uniform and hence the thickness of
the coat determined for this sample with XPS analysis was not valid. In concurrence
with the previous leucine results, again leucine formed a uniform coat from the
solution (Figure 5.14B) and hence the overlayer calculation of the determination of
the thickness of the coat is valid for this sample. The MgSt and leucine powder
coated samples were also imaged by SEM and the microspheres showed the presence
of MgSt and leucine powder respectively on their surfaces (Figure 5.14C and D). The
0 2 4 6 8
10 12 14 16 18 20
% F
PF
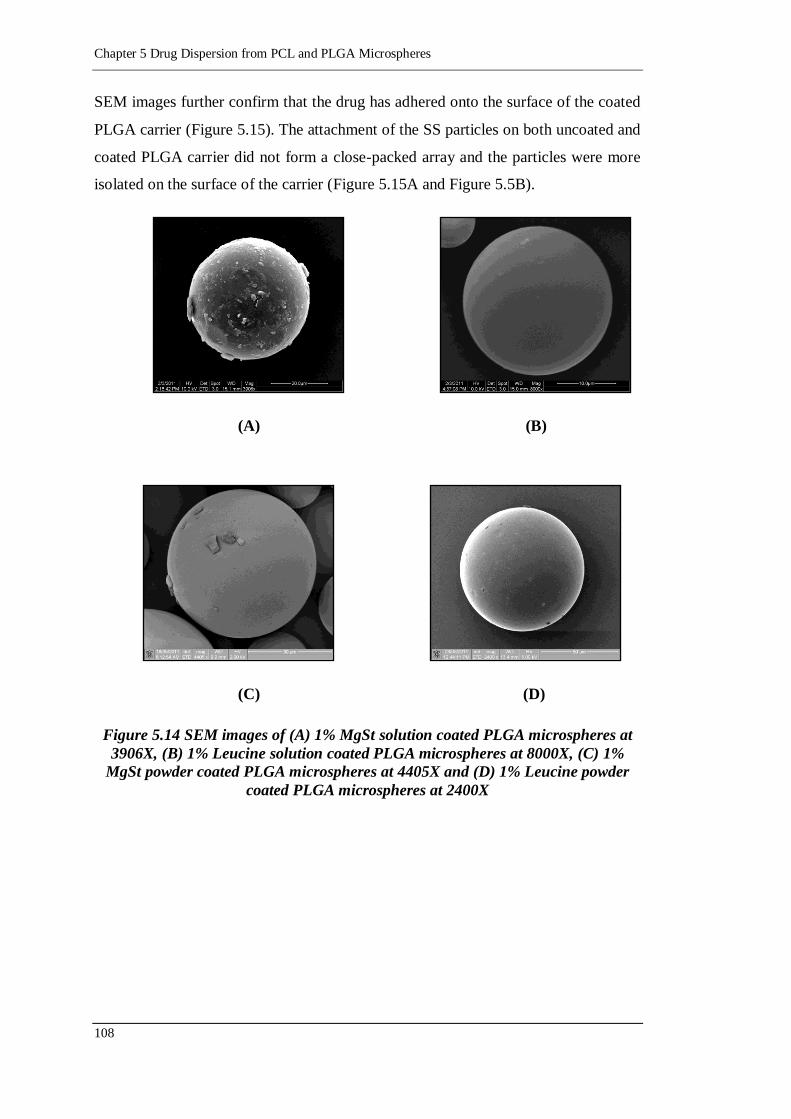
Chapter 5 Drug Dispersion from PCL and PLGA Microspheres
108
SEM images further confirm that the drug has adhered onto the surface of the coated
PLGA carrier (Figure 5.15). The attachment of the SS particles on both uncoated and
coated PLGA carrier did not form a close-packed array and the particles were more
isolated on the surface of the carrier (Figure 5.15A and Figure 5.5B).
(A) (B)
(C) (D)
Figure 5.14 SEM images of (A) 1% MgSt solution coated PLGA microspheres at
3906X, (B) 1% Leucine solution coated PLGA microspheres at 8000X, (C) 1%
MgSt powder coated PLGA microspheres at 4405X and (D) 1% Leucine powder
coated PLGA microspheres at 2400X
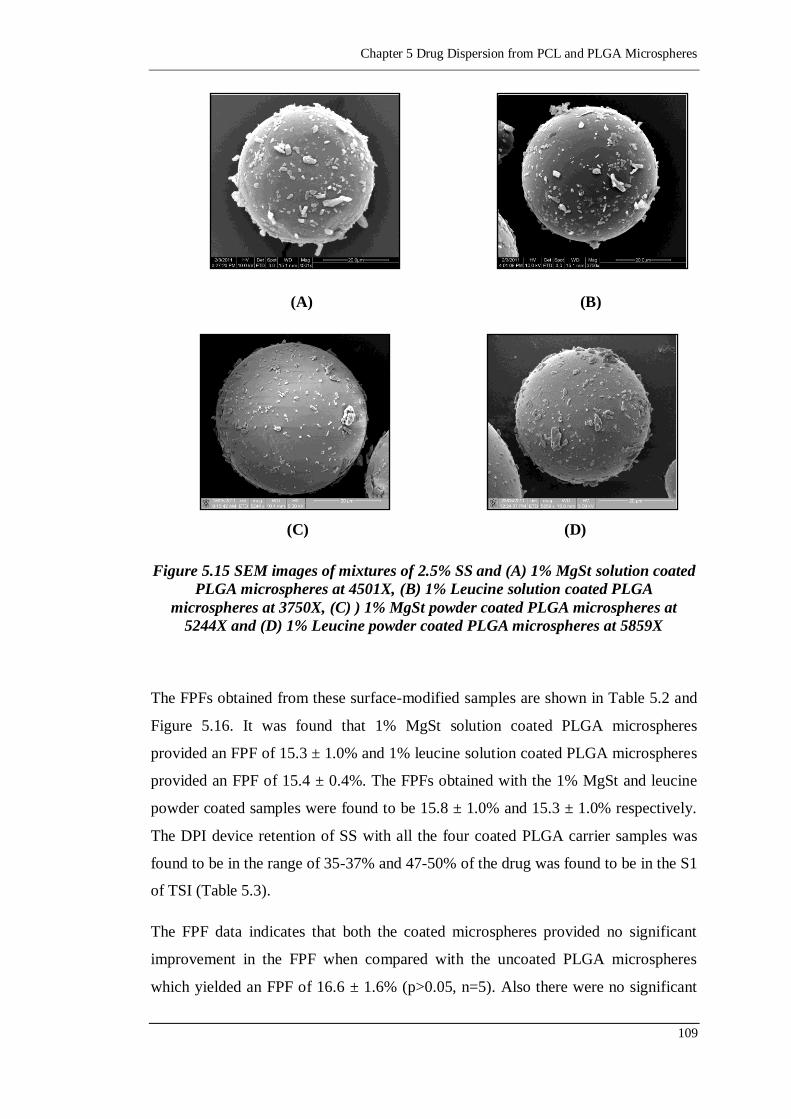
Chapter 5 Drug Dispersion from PCL and PLGA Microspheres
109
(A) (B)
(C) (D)
Figure 5.15 SEM images of mixtures of 2.5% SS and (A) 1% MgSt solution coated
PLGA microspheres at 4501X, (B) 1% Leucine solution coated PLGA
microspheres at 3750X, (C) ) 1% MgSt powder coated PLGA microspheres at
5244X and (D) 1% Leucine powder coated PLGA microspheres at 5859X
The FPFs obtained from these surface-modified samples are shown in Table 5.2 and
Figure 5.16. It was found that 1% MgSt solution coated PLGA microspheres
provided an FPF of 15.3 ± 1.0% and 1% leucine solution coated PLGA microspheres
provided an FPF of 15.4 ± 0.4%. The FPFs obtained with the 1% MgSt and leucine
powder coated samples were found to be 15.8 ± 1.0% and 15.3 ± 1.0% respectively.
The DPI device retention of SS with all the four coated PLGA carrier samples was
found to be in the range of 35-37% and 47-50% of the drug was found to be in the S1
of TSI (Table 5.3).
The FPF data indicates that both the coated microspheres provided no significant
improvement in the FPF when compared with the uncoated PLGA microspheres
which yielded an FPF of 16.6 ± 1.6% (p>0.05, n=5). Also there were no significant
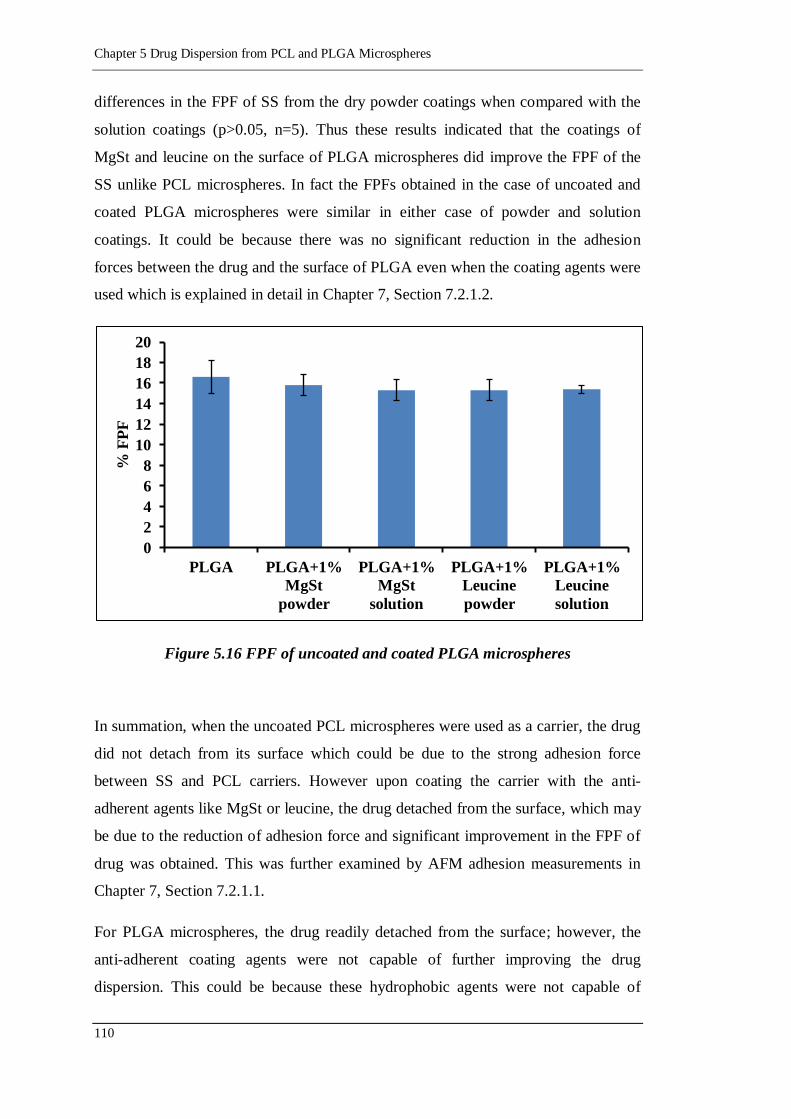
Chapter 5 Drug Dispersion from PCL and PLGA Microspheres
110
differences in the FPF of SS from the dry powder coatings when compared with the
solution coatings (p>0.05, n=5). Thus these results indicated that the coatings of
MgSt and leucine on the surface of PLGA microspheres did improve the FPF of the
SS unlike PCL microspheres. In fact the FPFs obtained in the case of uncoated and
coated PLGA microspheres were similar in either case of powder and solution
coatings. It could be because there was no significant reduction in the adhesion
forces between the drug and the surface of PLGA even when the coating agents were
used which is explained in detail in Chapter 7, Section 7.2.1.2.
Figure 5.16 FPF of uncoated and coated PLGA microspheres
In summation, when the uncoated PCL microspheres were used as a carrier, the drug
did not detach from its surface which could be due to the strong adhesion force
between SS and PCL carriers. However upon coating the carrier with the anti-
adherent agents like MgSt or leucine, the drug detached from the surface, which may
be due to the reduction of adhesion force and significant improvement in the FPF of
drug was obtained. This was further examined by AFM adhesion measurements in
Chapter 7, Section 7.2.1.1.
For PLGA microspheres, the drug readily detached from the surface; however, the
anti-adherent coating agents were not capable of further improving the drug
dispersion. This could be because these hydrophobic agents were not capable of
0
2
4
6
8
10
12
14
16
18
20
PLGA PLGA+1%
MgSt
powder
PLGA+1%
MgSt
solution
PLGA+1%
Leucine
powder
PLGA+1%
Leucine
solution
% F
PF
Chapter 5 Drug Dispersion from PCL and PLGA Microspheres
111
reducing further the adhesion forces existing between the PLGA polymer and the
drug which is discussed in Chapter 7, Section 7.2.1.2.
5.3. Conclusion
The work presented in this chapter highlighted the potential of surface coated
biodegradable PCL microparticles and PLGA microspheres as carriers for pulmonary
drug delivery system. The surface coating of PCL microparticles carriers helped in
significantly increasing the aerosolization of SS from the carrier based DPI
formulation. Without surface coating, the drug adhering on the PCL carrier has been
efficiently emitted from the device but showed no FPF. The solution coatings of
MgSt and leucine facilitated the easy detachment of the drug particles from the PCL
surface with a concomitant increase in drug deposition. On the other hand, PLGA
microspheres readily allowed the detachment of the drug from the surface and hence
no surface coating of the PLGA microspheres was essential. These results suggested
that the surface coated biodegradable PCL microspheres and the uncoated PLGA
microspheres can act as potential carriers in DPI formulations.

Chapter 6 Effect of the Size of the Carrier on the Dispersion of SS
113
CChhaapptteerr 66
EEffffeecctt ooff tthhee SSiizzee ooff tthhee CCaarrrriieerr oonn tthhee
DDiissppeerrssiioonn ooff SSSS
Chapter 6 Effect of the Size of the Carrier on the
Dispersion of SS

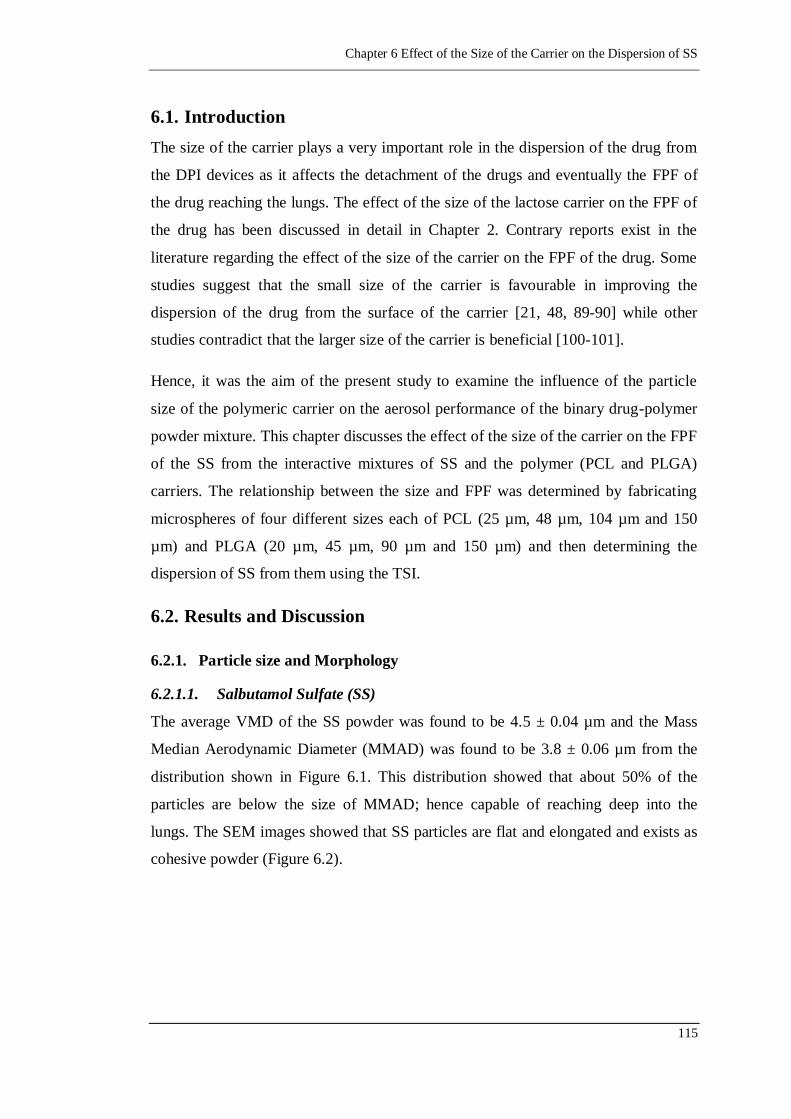
Chapter 6 Effect of the Size of the Carrier on the Dispersion of SS
115
6.1. Introduction
The size of the carrier plays a very important role in the dispersion of the drug from
the DPI devices as it affects the detachment of the drugs and eventually the FPF of
the drug reaching the lungs. The effect of the size of the lactose carrier on the FPF of
the drug has been discussed in detail in Chapter 2. Contrary reports exist in the
literature regarding the effect of the size of the carrier on the FPF of the drug. Some
studies suggest that the small size of the carrier is favourable in improving the
dispersion of the drug from the surface of the carrier [21, 48, 89-90] while other
studies contradict that the larger size of the carrier is beneficial [100-101].
Hence, it was the aim of the present study to examine the influence of the particle
size of the polymeric carrier on the aerosol performance of the binary drug-polymer
powder mixture. This chapter discusses the effect of the size of the carrier on the FPF
of the SS from the interactive mixtures of SS and the polymer (PCL and PLGA)
carriers. The relationship between the size and FPF was determined by fabricating
microspheres of four different sizes each of PCL (25 µm, 48 µm, 104 µm and 150
µm) and PLGA (20 µm, 45 µm, 90 µm and 150 µm) and then determining the
dispersion of SS from them using the TSI.
6.2. Results and Discussion
6.2.1. Particle size and Morphology
6.2.1.1. Salbutamol Sulfate (SS)
The average VMD of the SS powder was found to be 4.5 ± 0.04 µm and the Mass
Median Aerodynamic Diameter (MMAD) was found to be 3.8 ± 0.06 µm from the
distribution shown in Figure 6.1. This distribution showed that about 50% of the
particles are below the size of MMAD; hence capable of reaching deep into the
lungs. The SEM images showed that SS particles are flat and elongated and exists as
cohesive powder (Figure 6.2).
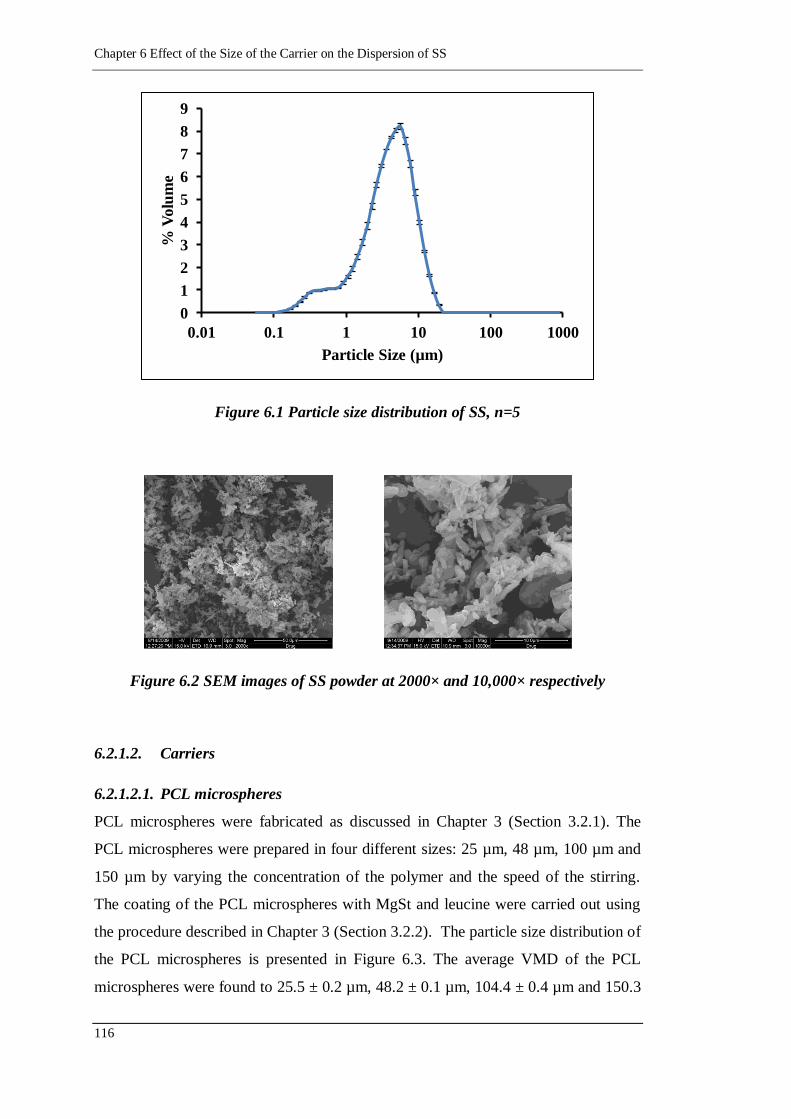
Chapter 6 Effect of the Size of the Carrier on the Dispersion of SS
116
Figure 6.1 Particle size distribution of SS, n=5
Figure 6.2 SEM images of SS powder at 2000× and 10,000× respectively
6.2.1.2. Carriers
6.2.1.2.1. PCL microspheres
PCL microspheres were fabricated as discussed in Chapter 3 (Section 3.2.1). The
PCL microspheres were prepared in four different sizes: 25 µm, 48 µm, 100 µm and
150 µm by varying the concentration of the polymer and the speed of the stirring.
The coating of the PCL microspheres with MgSt and leucine were carried out using
the procedure described in Chapter 3 (Section 3.2.2). The particle size distribution of
the PCL microspheres is presented in Figure 6.3. The average VMD of the PCL
microspheres were found to 25.5 ± 0.2 µm, 48.2 ± 0.1 µm, 104.4 ± 0.4 µm and 150.3
0
1
2
3
4
5
6
7
8
9
0.01 0.1 1 10 100 1000
% V
olu
me
Particle Size (µm)
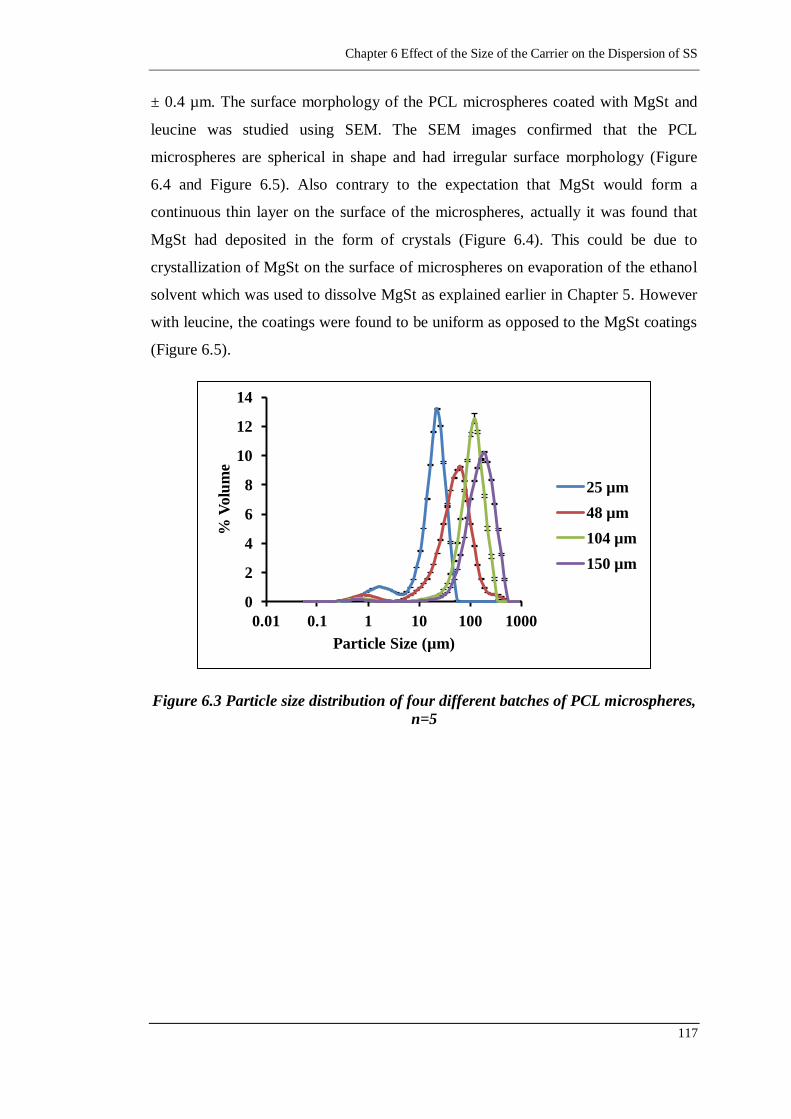
Chapter 6 Effect of the Size of the Carrier on the Dispersion of SS
117
± 0.4 µm. The surface morphology of the PCL microspheres coated with MgSt and
leucine was studied using SEM. The SEM images confirmed that the PCL
microspheres are spherical in shape and had irregular surface morphology (Figure
6.4 and Figure 6.5). Also contrary to the expectation that MgSt would form a
continuous thin layer on the surface of the microspheres, actually it was found that
MgSt had deposited in the form of crystals (Figure 6.4). This could be due to
crystallization of MgSt on the surface of microspheres on evaporation of the ethanol
solvent which was used to dissolve MgSt as explained earlier in Chapter 5. However
with leucine, the coatings were found to be uniform as opposed to the MgSt coatings
(Figure 6.5).
Figure 6.3 Particle size distribution of four different batches of PCL microspheres,
n=5
0
2
4
6
8
10
12
14
0.01 0.1 1 10 100 1000
% V
olu
me
Particle Size (µm)
25 µm
48 µm
104 µm
150 µm

Chapter 6 Effect of the Size of the Carrier on the Dispersion of SS
118
(A) (B)
(C) (D)
Figure 6.4 SEM images of PCL microspheres coated with MgSt of various sizes:
(A) 25 µm (4687×), (B) 48 µm (4442×), (C) 104 µm (1852×) and (D) 150 µm
(946×)
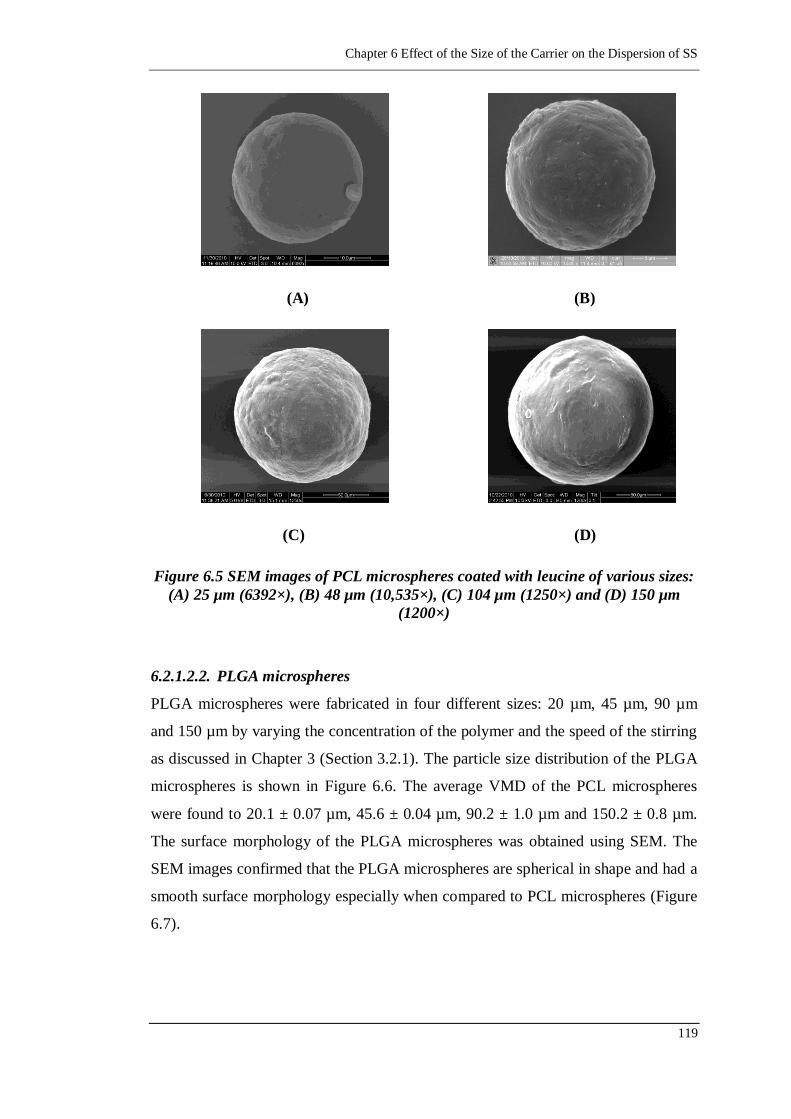
Chapter 6 Effect of the Size of the Carrier on the Dispersion of SS
119
(A) (B)
(C) (D)
Figure 6.5 SEM images of PCL microspheres coated with leucine of various sizes:
(A) 25 µm (6392×), (B) 48 µm (10,535×), (C) 104 µm (1250×) and (D) 150 µm
(1200×)
6.2.1.2.2. PLGA microspheres
PLGA microspheres were fabricated in four different sizes: 20 µm, 45 µm, 90 µm
and 150 µm by varying the concentration of the polymer and the speed of the stirring
as discussed in Chapter 3 (Section 3.2.1). The particle size distribution of the PLGA
microspheres is shown in Figure 6.6. The average VMD of the PCL microspheres
were found to 20.1 ± 0.07 µm, 45.6 ± 0.04 µm, 90.2 ± 1.0 µm and 150.2 ± 0.8 µm.
The surface morphology of the PLGA microspheres was obtained using SEM. The
SEM images confirmed that the PLGA microspheres are spherical in shape and had a
smooth surface morphology especially when compared to PCL microspheres (Figure
6.7).
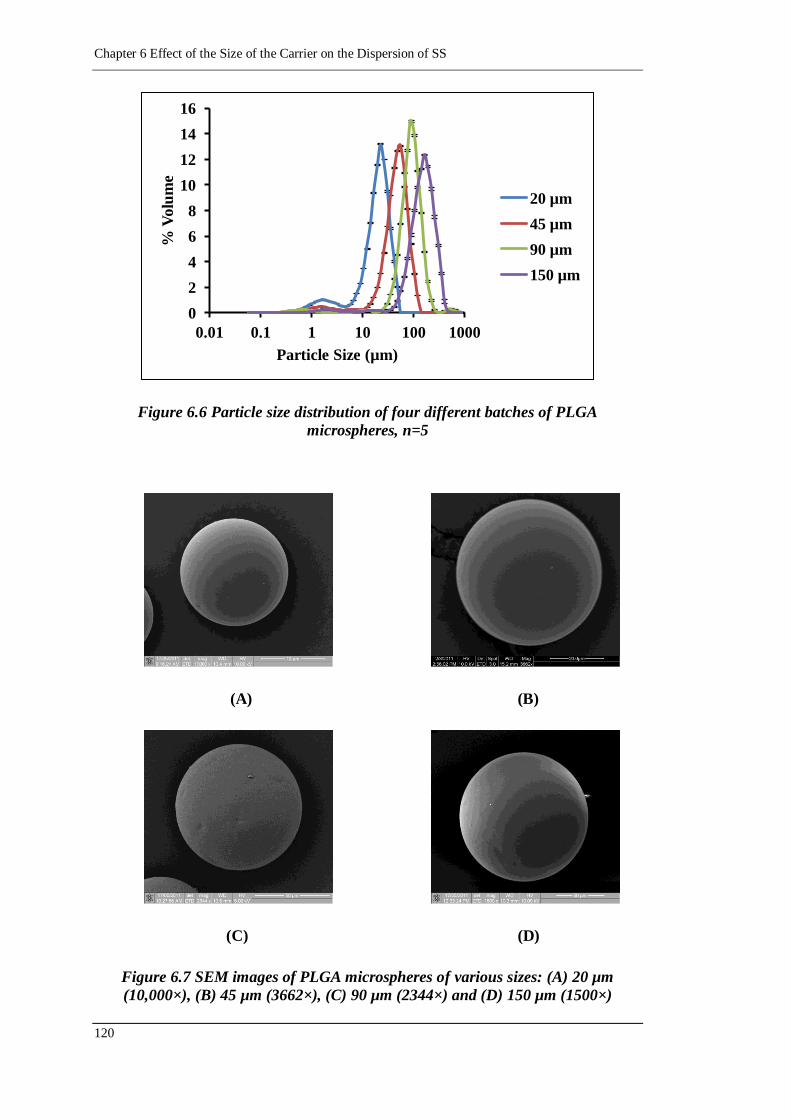
Chapter 6 Effect of the Size of the Carrier on the Dispersion of SS
120
Figure 6.6 Particle size distribution of four different batches of PLGA
microspheres, n=5
(A) (B)
(C) (D)
Figure 6.7 SEM images of PLGA microspheres of various sizes: (A) 20 µm
(10,000×), (B) 45 µm (3662×), (C) 90 µm (2344×) and (D) 150 µm (1500×)
0
2
4
6
8
10
12
14
16
0.01 0.1 1 10 100 1000
% V
olu
me
Particle Size (µm)
20 µm
45 µm
90 µm
150 µm
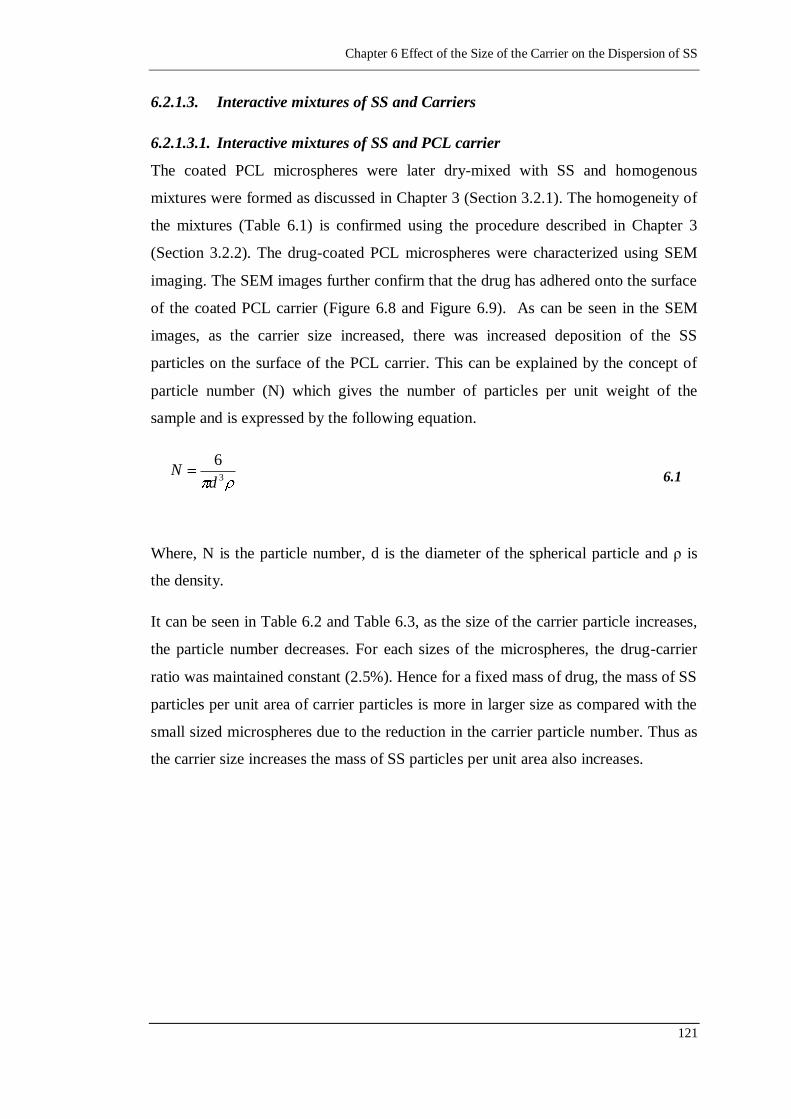
Chapter 6 Effect of the Size of the Carrier on the Dispersion of SS
121
6.2.1.3. Interactive mixtures of SS and Carriers
6.2.1.3.1. Interactive mixtures of SS and PCL carrier
The coated PCL microspheres were later dry-mixed with SS and homogenous
mixtures were formed as discussed in Chapter 3 (Section 3.2.1). The homogeneity of
the mixtures (Table 6.1) is confirmed using the procedure described in Chapter 3
(Section 3.2.2). The drug-coated PCL microspheres were characterized using SEM
imaging. The SEM images further confirm that the drug has adhered onto the surface
of the coated PCL carrier (Figure 6.8 and Figure 6.9). As can be seen in the SEM
images, as the carrier size increased, there was increased deposition of the SS
particles on the surface of the PCL carrier. This can be explained by the concept of
particle number (N) which gives the number of particles per unit weight of the
sample and is expressed by the following equation.
3
6
dN 6.1
Where, N is the particle number, d is the diameter of the spherical particle and ρ is
the density.
It can be seen in Table 6.2 and Table 6.3, as the size of the carrier particle increases,
the particle number decreases. For each sizes of the microspheres, the drug-carrier
ratio was maintained constant (2.5%). Hence for a fixed mass of drug, the mass of SS
particles per unit area of carrier particles is more in larger size as compared with the
small sized microspheres due to the reduction in the carrier particle number. Thus as
the carrier size increases the mass of SS particles per unit area also increases.
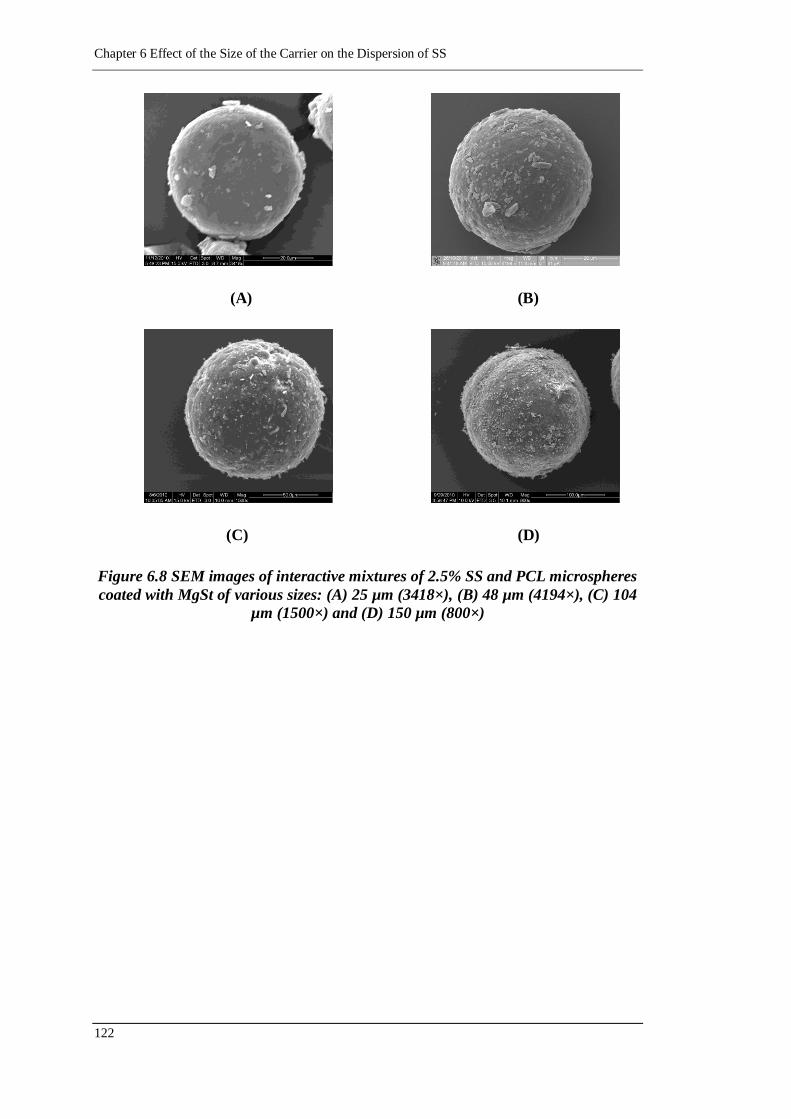
Chapter 6 Effect of the Size of the Carrier on the Dispersion of SS
122
(A) (B)
(C) (D)
Figure 6.8 SEM images of interactive mixtures of 2.5% SS and PCL microspheres
coated with MgSt of various sizes: (A) 25 µm (3418×), (B) 48 µm (4194×), (C) 104
µm (1500×) and (D) 150 µm (800×)
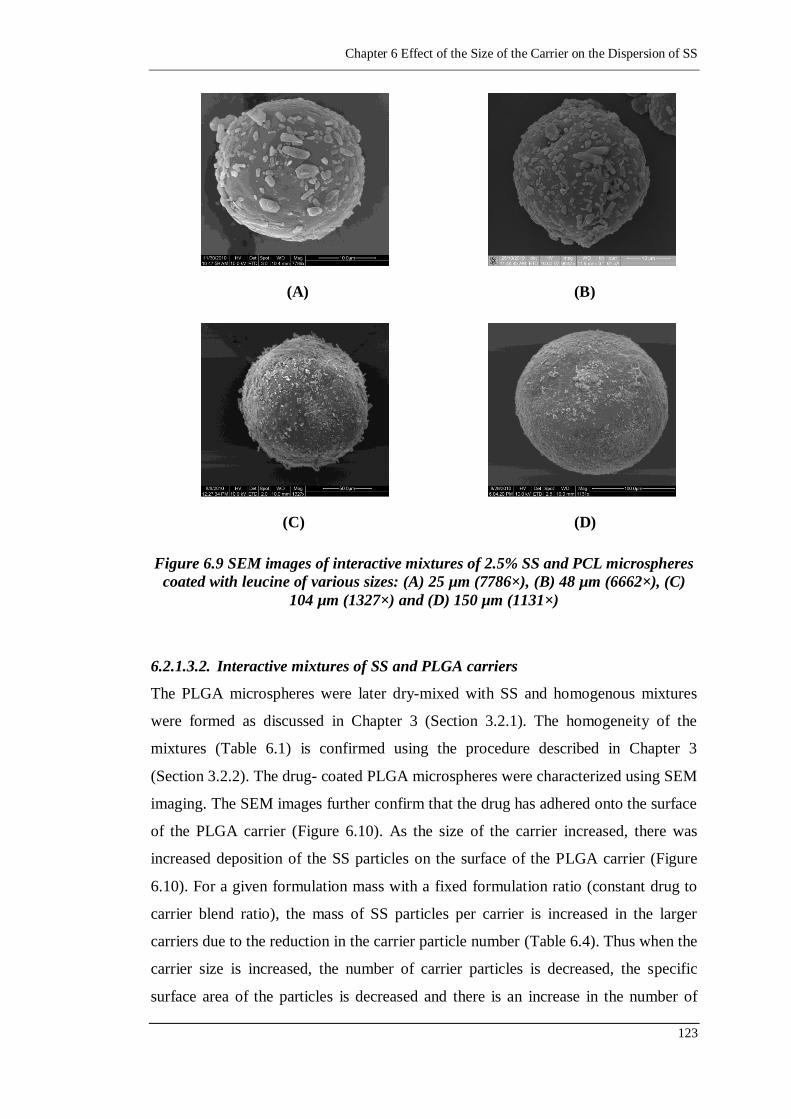
Chapter 6 Effect of the Size of the Carrier on the Dispersion of SS
123
(A) (B)
(C) (D)
Figure 6.9 SEM images of interactive mixtures of 2.5% SS and PCL microspheres
coated with leucine of various sizes: (A) 25 µm (7786×), (B) 48 µm (6662×), (C)
104 µm (1327×) and (D) 150 µm (1131×)
6.2.1.3.2. Interactive mixtures of SS and PLGA carriers
The PLGA microspheres were later dry-mixed with SS and homogenous mixtures
were formed as discussed in Chapter 3 (Section 3.2.1). The homogeneity of the
mixtures (Table 6.1) is confirmed using the procedure described in Chapter 3
(Section 3.2.2). The drug- coated PLGA microspheres were characterized using SEM
imaging. The SEM images further confirm that the drug has adhered onto the surface
of the PLGA carrier (Figure 6.10). As the size of the carrier increased, there was
increased deposition of the SS particles on the surface of the PLGA carrier (Figure
6.10). For a given formulation mass with a fixed formulation ratio (constant drug to
carrier blend ratio), the mass of SS particles per carrier is increased in the larger
carriers due to the reduction in the carrier particle number (Table 6.4). Thus when the
carrier size is increased, the number of carrier particles is decreased, the specific
surface area of the particles is decreased and there is an increase in the number of
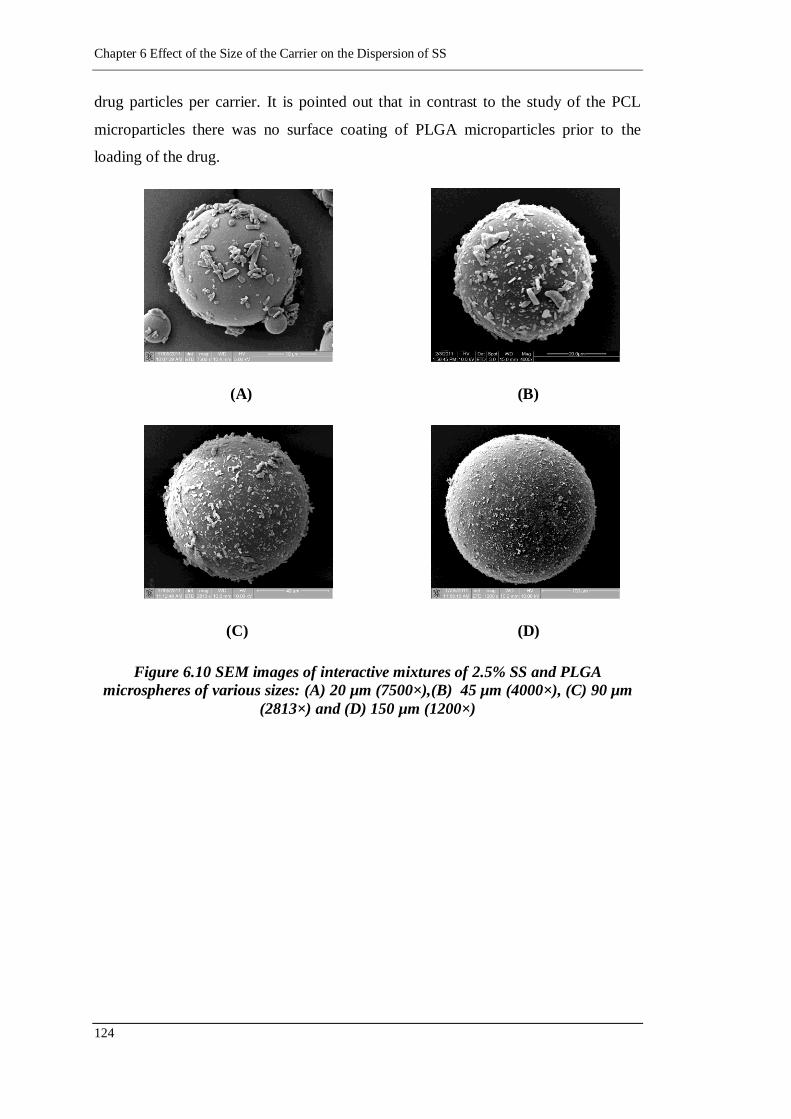
Chapter 6 Effect of the Size of the Carrier on the Dispersion of SS
124
drug particles per carrier. It is pointed out that in contrast to the study of the PCL
microparticles there was no surface coating of PLGA microparticles prior to the
loading of the drug.
(A) (B)
(C) (D)
Figure 6.10 SEM images of interactive mixtures of 2.5% SS and PLGA
microspheres of various sizes: (A) 20 µm (7500×),(B) 45 µm (4000×), (C) 90 µm
(2813×) and (D) 150 µm (1200×)
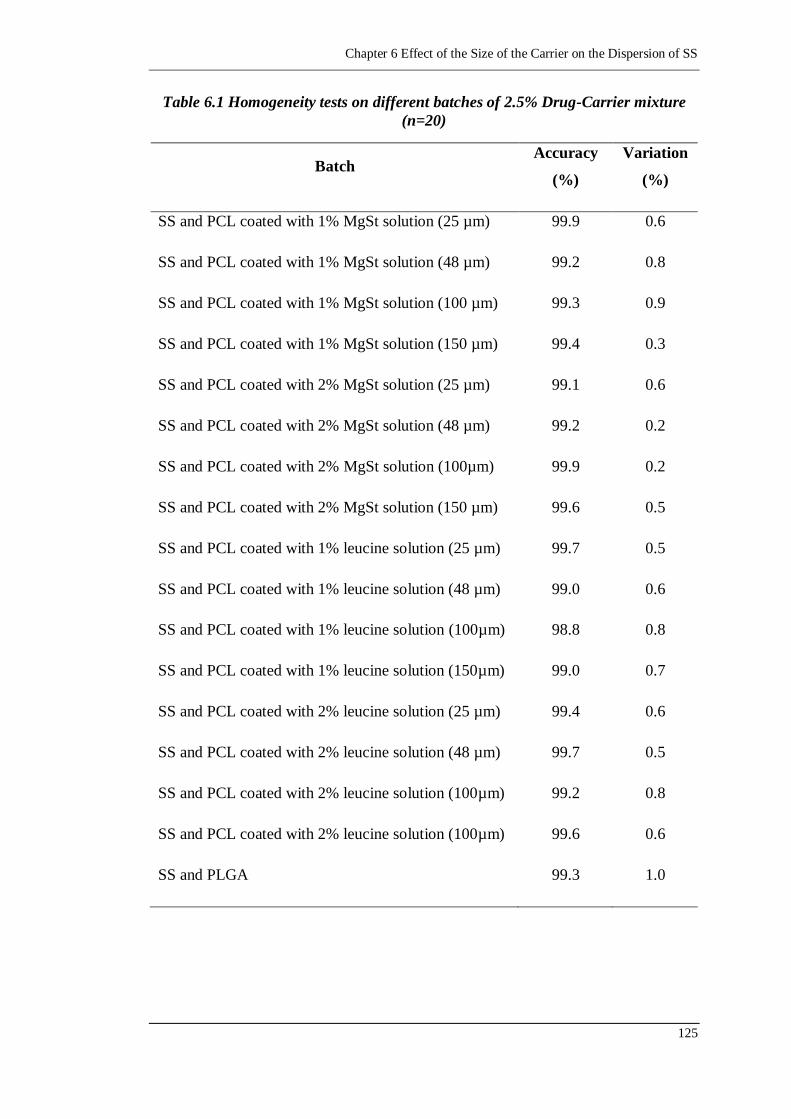
Chapter 6 Effect of the Size of the Carrier on the Dispersion of SS
125
Table 6.1 Homogeneity tests on different batches of 2.5% Drug-Carrier mixture
(n=20)
Batch Accuracy
(%)
Variation
(%)
SS and PCL coated with 1% MgSt solution (25 µm) 99.9 0.6
SS and PCL coated with 1% MgSt solution (48 µm) 99.2 0.8
SS and PCL coated with 1% MgSt solution (100 µm) 99.3 0.9
SS and PCL coated with 1% MgSt solution (150 µm) 99.4 0.3
SS and PCL coated with 2% MgSt solution (25 µm) 99.1 0.6
SS and PCL coated with 2% MgSt solution (48 µm) 99.2 0.2
SS and PCL coated with 2% MgSt solution (100µm) 99.9 0.2
SS and PCL coated with 2% MgSt solution (150 µm) 99.6 0.5
SS and PCL coated with 1% leucine solution (25 µm) 99.7 0.5
SS and PCL coated with 1% leucine solution (48 µm) 99.0 0.6
SS and PCL coated with 1% leucine solution (100µm) 98.8 0.8
SS and PCL coated with 1% leucine solution (150µm) 99.0 0.7
SS and PCL coated with 2% leucine solution (25 µm) 99.4 0.6
SS and PCL coated with 2% leucine solution (48 µm) 99.7 0.5
SS and PCL coated with 2% leucine solution (100µm) 99.2 0.8
SS and PCL coated with 2% leucine solution (100µm) 99.6 0.6
SS and PLGA 99.3 1.0
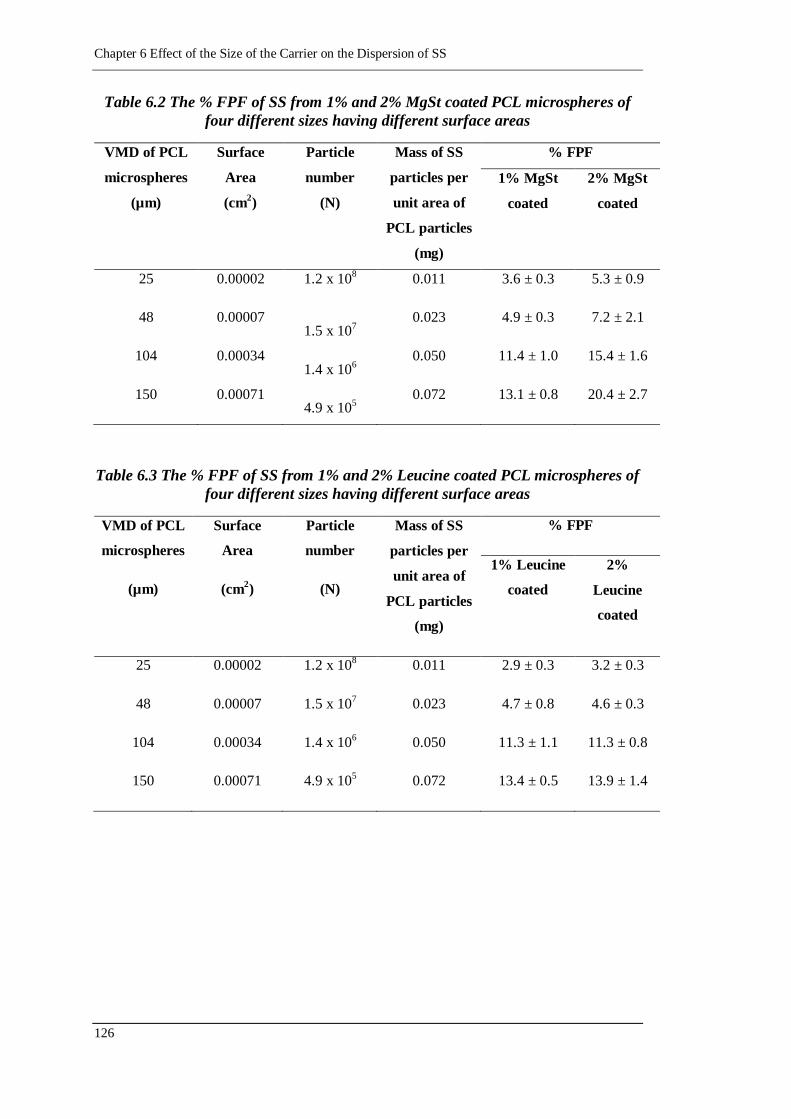
Chapter 6 Effect of the Size of the Carrier on the Dispersion of SS
126
Table 6.2 The % FPF of SS from 1% and 2% MgSt coated PCL microspheres of
four different sizes having different surface areas
VMD of PCL
microspheres
(µm)
Surface
Area
(cm2)
Particle
number
(N)
Mass of SS
particles per
unit area of
PCL particles
(mg)
% FPF
1% MgSt
coated
2% MgSt
coated
25 0.00002 1.2 x 10⁸ 0.011 3.6 ± 0.3 5.3 ± 0.9
48 0.00007 1.5 x 10
7
0.023 4.9 ± 0.3 7.2 ± 2.1
104 0.00034 1.4 x 10
6
0.050 11.4 ± 1.0 15.4 ± 1.6
150 0.00071 4.9 x 10
5
0.072 13.1 ± 0.8 20.4 ± 2.7
Table 6.3 The % FPF of SS from 1% and 2% Leucine coated PCL microspheres of
four different sizes having different surface areas
VMD of PCL
microspheres
(µm)
Surface
Area
(cm2)
Particle
number
(N)
Mass of SS
particles per
unit area of
PCL particles
(mg)
% FPF
1% Leucine
coated
2%
Leucine
coated
25 0.00002 1.2 x 10⁸ 0.011 2.9 ± 0.3 3.2 ± 0.3
48 0.00007 1.5 x 10⁷ 0.023 4.7 ± 0.8 4.6 ± 0.3
104 0.00034 1.4 x 10⁶ 0.050 11.3 ± 1.1 11.3 ± 0.8
150 0.00071 4.9 x 10⁵ 0.072 13.4 ± 0.5 13.9 ± 1.4
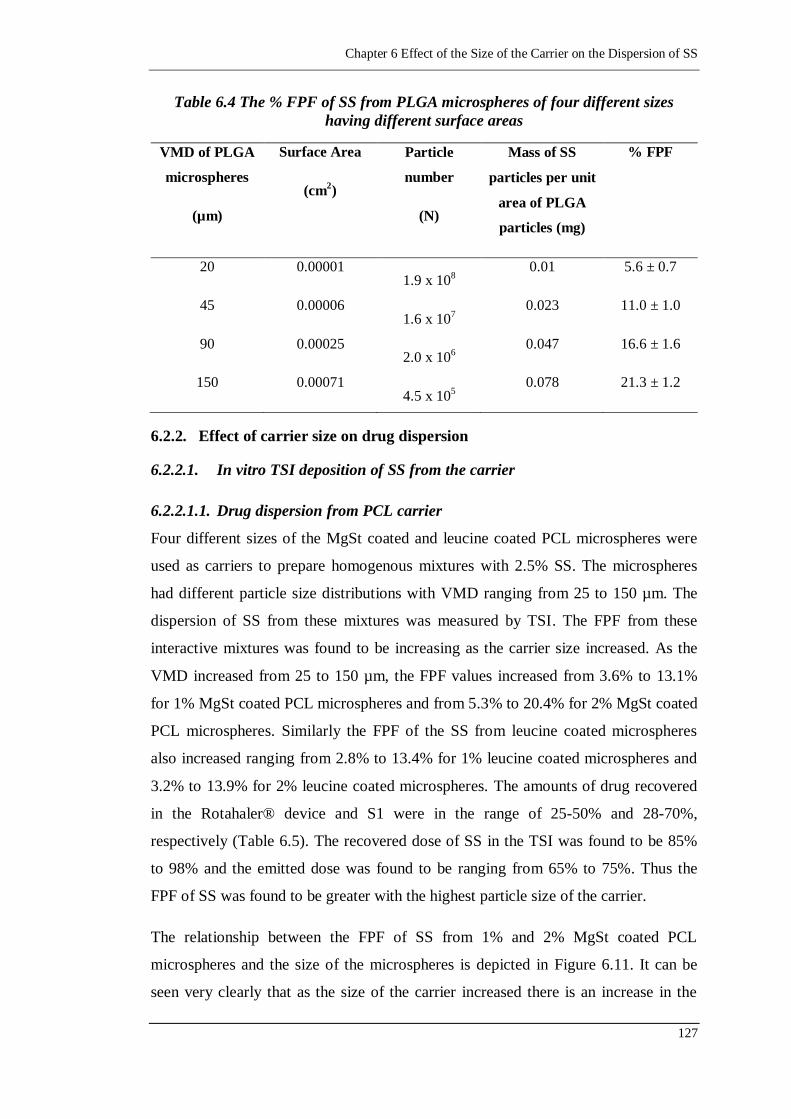
Chapter 6 Effect of the Size of the Carrier on the Dispersion of SS
127
Table 6.4 The % FPF of SS from PLGA microspheres of four different sizes
having different surface areas
VMD of PLGA
microspheres
(µm)
Surface Area
(cm2)
Particle
number
(N)
Mass of SS
particles per unit
area of PLGA
particles (mg)
% FPF
20 0.00001 1.9 x 10
8
0.01 5.6 ± 0.7
45 0.00006 1.6 x 10
7
0.023 11.0 ± 1.0
90 0.00025 2.0 x 10
6
0.047 16.6 ± 1.6
150 0.00071 4.5 x 10
5
0.078 21.3 ± 1.2
6.2.2. Effect of carrier size on drug dispersion
6.2.2.1. In vitro TSI deposition of SS from the carrier
6.2.2.1.1. Drug dispersion from PCL carrier
Four different sizes of the MgSt coated and leucine coated PCL microspheres were
used as carriers to prepare homogenous mixtures with 2.5% SS. The microspheres
had different particle size distributions with VMD ranging from 25 to 150 µm. The
dispersion of SS from these mixtures was measured by TSI. The FPF from these
interactive mixtures was found to be increasing as the carrier size increased. As the
VMD increased from 25 to 150 µm, the FPF values increased from 3.6% to 13.1%
for 1% MgSt coated PCL microspheres and from 5.3% to 20.4% for 2% MgSt coated
PCL microspheres. Similarly the FPF of the SS from leucine coated microspheres
also increased ranging from 2.8% to 13.4% for 1% leucine coated microspheres and
3.2% to 13.9% for 2% leucine coated microspheres. The amounts of drug recovered
in the Rotahaler® device and S1 were in the range of 25-50% and 28-70%,
respectively (Table 6.5). The recovered dose of SS in the TSI was found to be 85%
to 98% and the emitted dose was found to be ranging from 65% to 75%. Thus the
FPF of SS was found to be greater with the highest particle size of the carrier.
The relationship between the FPF of SS from 1% and 2% MgSt coated PCL
microspheres and the size of the microspheres is depicted in Figure 6.11. It can be
seen very clearly that as the size of the carrier increased there is an increase in the
Chapter 6 Effect of the Size of the Carrier on the Dispersion of SS
128
FPF of the drug from both 1% and 2% MgSt coated PCL microspheres. There is also
significant difference in the FPF of SS amongst the two concentrations of MgSt
coatings. Similarly the relationship between the FPF of SS from 1% and 2% leucine
coated PCL microspheres and the size of the microspheres is depicted in Figure 6.12.
As in the case of MgSt coatings, the FPF of the drug from both 1% and 2% leucine
coated PCL microspheres increased with the increase in the carrier size; however
there was no significant difference in the FPF of SS amongst the two concentrations
of leucine coatings suggesting again that the FPF of SS is independent of the
concentration of the leucine coatings (over the values studied of 1% and 2%).
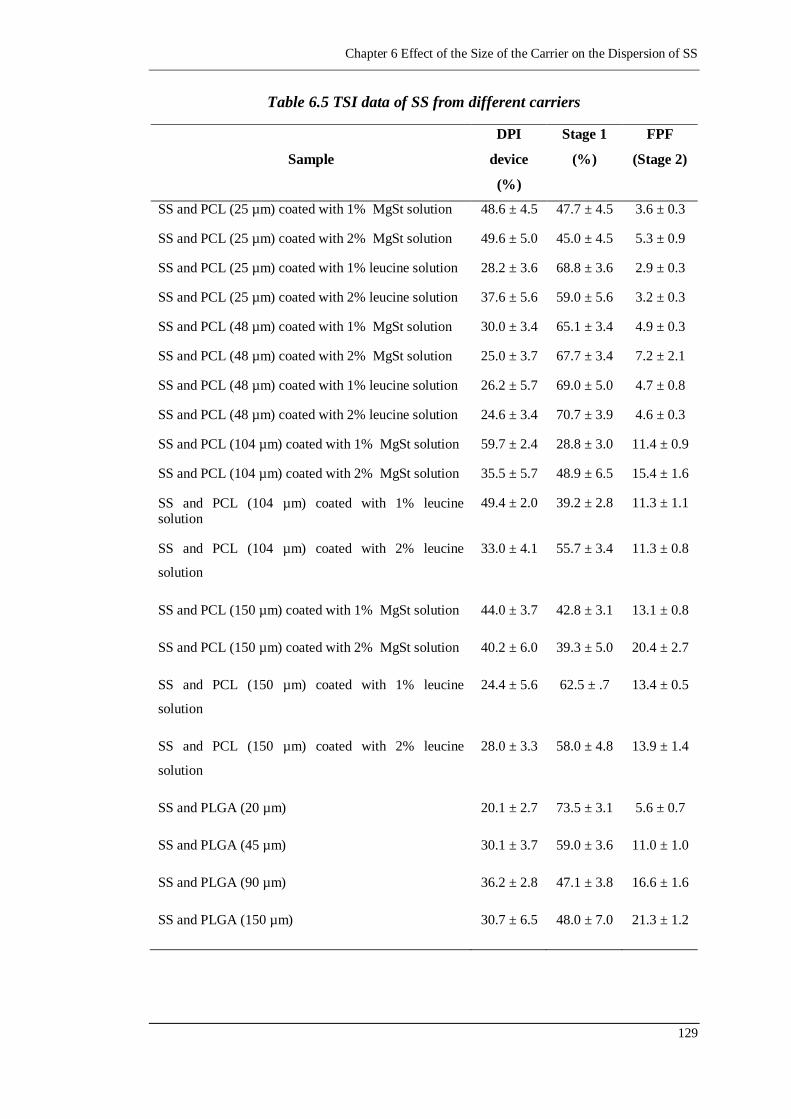
Chapter 6 Effect of the Size of the Carrier on the Dispersion of SS
129
Table 6.5 TSI data of SS from different carriers
Sample
DPI
device
(%)
Stage 1
(%)
FPF
(Stage 2)
SS and PCL (25 µm) coated with 1% MgSt solution 48.6 ± 4.5 47.7 ± 4.5 3.6 ± 0.3
SS and PCL (25 µm) coated with 2% MgSt solution 49.6 ± 5.0 45.0 ± 4.5 5.3 ± 0.9
SS and PCL (25 µm) coated with 1% leucine solution 28.2 ± 3.6 68.8 ± 3.6 2.9 ± 0.3
SS and PCL (25 µm) coated with 2% leucine solution 37.6 ± 5.6 59.0 ± 5.6 3.2 ± 0.3
SS and PCL (48 µm) coated with 1% MgSt solution 30.0 ± 3.4 65.1 ± 3.4 4.9 ± 0.3
SS and PCL (48 µm) coated with 2% MgSt solution 25.0 ± 3.7 67.7 ± 3.4 7.2 ± 2.1
SS and PCL (48 µm) coated with 1% leucine solution 26.2 ± 5.7 69.0 ± 5.0 4.7 ± 0.8
SS and PCL (48 µm) coated with 2% leucine solution 24.6 ± 3.4 70.7 ± 3.9 4.6 ± 0.3
SS and PCL (104 µm) coated with 1% MgSt solution 59.7 ± 2.4 28.8 ± 3.0 11.4 ± 0.9
SS and PCL (104 µm) coated with 2% MgSt solution 35.5 ± 5.7 48.9 ± 6.5 15.4 ± 1.6
SS and PCL (104 µm) coated with 1% leucine solution
49.4 ± 2.0 39.2 ± 2.8 11.3 ± 1.1
SS and PCL (104 µm) coated with 2% leucine
solution
33.0 ± 4.1 55.7 ± 3.4 11.3 ± 0.8
SS and PCL (150 µm) coated with 1% MgSt solution 44.0 ± 3.7 42.8 ± 3.1 13.1 ± 0.8
SS and PCL (150 µm) coated with 2% MgSt solution 40.2 ± 6.0 39.3 ± 5.0 20.4 ± 2.7
SS and PCL (150 µm) coated with 1% leucine
solution
24.4 ± 5.6 62.5 ± .7 13.4 ± 0.5
SS and PCL (150 µm) coated with 2% leucine
solution
28.0 ± 3.3 58.0 ± 4.8 13.9 ± 1.4
SS and PLGA (20 µm) 20.1 ± 2.7 73.5 ± 3.1 5.6 ± 0.7
SS and PLGA (45 µm) 30.1 ± 3.7 59.0 ± 3.6 11.0 ± 1.0
SS and PLGA (90 µm) 36.2 ± 2.8 47.1 ± 3.8 16.6 ± 1.6
SS and PLGA (150 µm) 30.7 ± 6.5 48.0 ± 7.0 21.3 ± 1.2
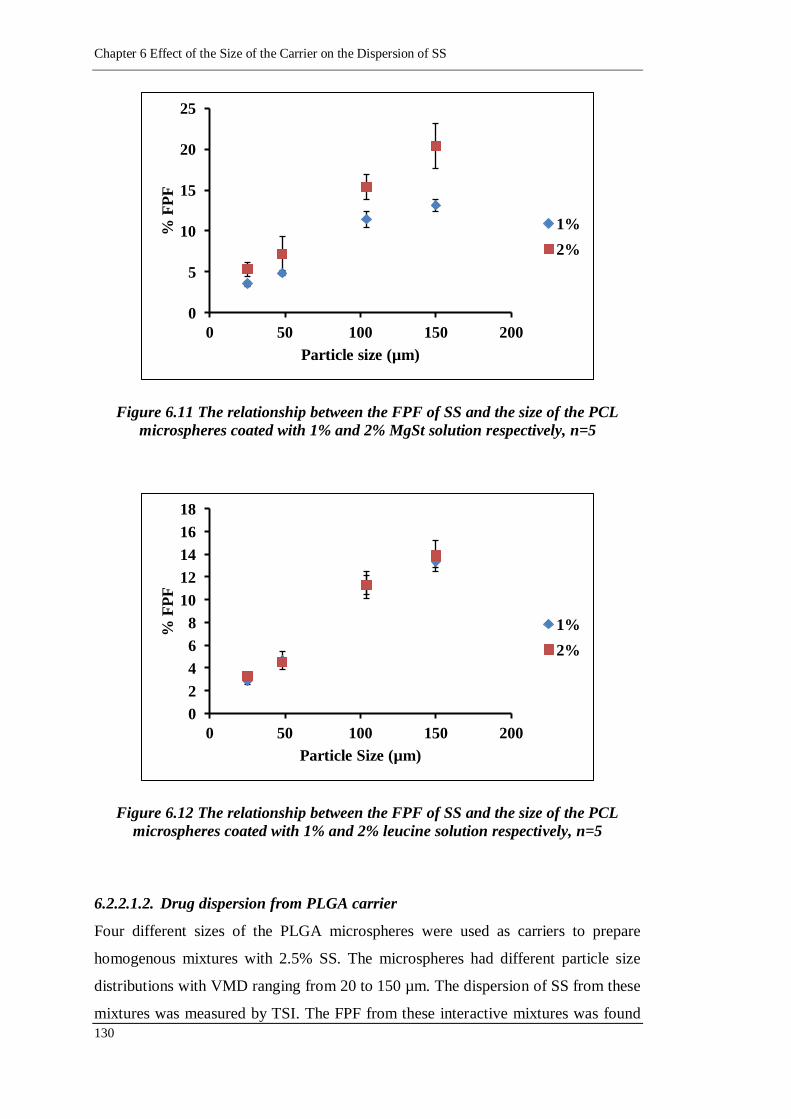
Chapter 6 Effect of the Size of the Carrier on the Dispersion of SS
130
Figure 6.11 The relationship between the FPF of SS and the size of the PCL
microspheres coated with 1% and 2% MgSt solution respectively, n=5
Figure 6.12 The relationship between the FPF of SS and the size of the PCL
microspheres coated with 1% and 2% leucine solution respectively, n=5
6.2.2.1.2. Drug dispersion from PLGA carrier
Four different sizes of the PLGA microspheres were used as carriers to prepare
homogenous mixtures with 2.5% SS. The microspheres had different particle size
distributions with VMD ranging from 20 to 150 µm. The dispersion of SS from these
mixtures was measured by TSI. The FPF from these interactive mixtures was found
0
5
10
15
20
25
0 50 100 150 200
% F
PF
Particle size (µm)
1%
2%
0
2
4
6
8
10
12
14
16
18
0 50 100 150 200
% F
PF
Particle Size (µm)
1%
2%
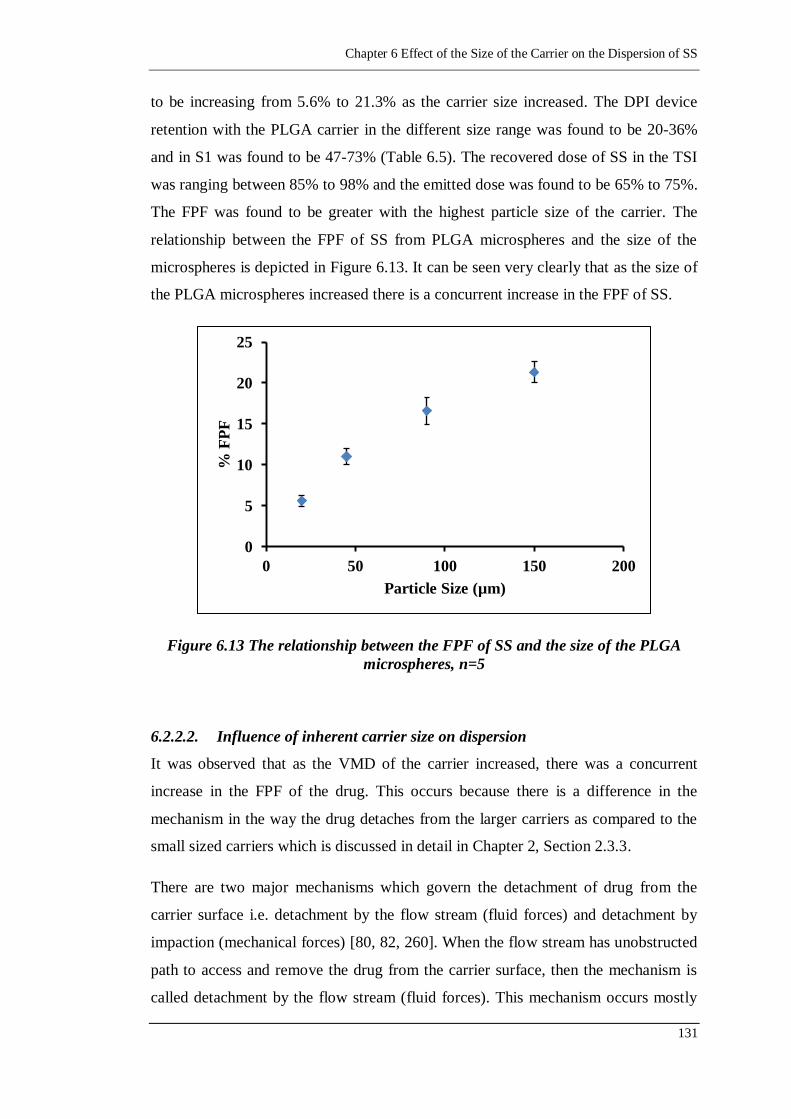
Chapter 6 Effect of the Size of the Carrier on the Dispersion of SS
131
to be increasing from 5.6% to 21.3% as the carrier size increased. The DPI device
retention with the PLGA carrier in the different size range was found to be 20-36%
and in S1 was found to be 47-73% (Table 6.5). The recovered dose of SS in the TSI
was ranging between 85% to 98% and the emitted dose was found to be 65% to 75%.
The FPF was found to be greater with the highest particle size of the carrier. The
relationship between the FPF of SS from PLGA microspheres and the size of the
microspheres is depicted in Figure 6.13. It can be seen very clearly that as the size of
the PLGA microspheres increased there is a concurrent increase in the FPF of SS.
Figure 6.13 The relationship between the FPF of SS and the size of the PLGA
microspheres, n=5
6.2.2.2. Influence of inherent carrier size on dispersion
It was observed that as the VMD of the carrier increased, there was a concurrent
increase in the FPF of the drug. This occurs because there is a difference in the
mechanism in the way the drug detaches from the larger carriers as compared to the
small sized carriers which is discussed in detail in Chapter 2, Section 2.3.3.
There are two major mechanisms which govern the detachment of drug from the
carrier surface i.e. detachment by the flow stream (fluid forces) and detachment by
impaction (mechanical forces) [80, 82, 260]. When the flow stream has unobstructed
path to access and remove the drug from the carrier surface, then the mechanism is
called detachment by the flow stream (fluid forces). This mechanism occurs mostly
0
5
10
15
20
25
0 50 100 150 200
% F
PF
Particle Size (µm)
Chapter 6 Effect of the Size of the Carrier on the Dispersion of SS
132
on a relatively flat carrier surface with minimal asperities. Detachment by
mechanical forces occurs when the collisions occurs between the carrier particles and
the inhaler wall and in between the carrier particles. This generally occurs in those
carrier surfaces which have increased amount of surface roughness [80, 260]. Due to
the collisions, there is a transfer of momentum which leads to the detachment of the
drug from the surfaces. The momentum of any particle is dependent on the mass and
the velocity of the carrier. The larger particles will have greater mass. The force of
mechanical detachment would be directly proportional to the cube of carrier particle
diameter (Force = Mass*Acceleration, Mass = Density*Volume and Volume =
4/3πr3). Thus larger particles will have greater mass which in turn will lead to
generation of greater detachment forces due to impaction. Hence as the magnitude of
the detachment forces increases with the carrier size, there is more detachment of
drugs from the carrier surface and consequently increase in the FPF of the drug.
Therefore the larger carriers will increase the mechanical detachment forces due to
the stronger particle-inhaler and particle-particle collisions [260]. This was further
confirmed in a study by Concession et al [261]. The study determined the
relationship between the impact forces and particle detachment. They found that as
the diameters of the lactose or maltodextrin carrier particles decreased, greater
magnitude of forces were required to separate the SS particles from the surface. In
addition the greater drag forces encountered by the larger carriers in the turbulent air
stream will contribute to a greater detachment force [48]. Hence the larger carrier
demonstrates better performance in terms of FPF as compared to their smaller
counterparts.
It is also known that as the size of the carrier decreases, there in an increase in the
specific surface area of the carrier particles with subsequent increase in the overall
surface energy. This increase in surface energy results in higher adhesive forces
between drug and the lactose carrier particles [96]. As the particle size decreases,
cohesive and frictional resistance increases due to more points of contact arising
from the increase in surface area-to-volume ratio [262]. In addition, a large surface
area with decreased particle size renders the particles subject to greater potential for
charging and moisture uptake. Also the size of the particles renders them more
susceptible to the influence of van der Waals forces [65].
Chapter 6 Effect of the Size of the Carrier on the Dispersion of SS
133
Hence, all these factors might have contributed to the decreased detachment of the
drug from the smaller carrier as compared to the larger carrier. Therefore, as the
mechanical forces increased with the larger carrier particles, the role of the increased
size of the carrier particles was confirmed in improving the dispersion performance
of the drug from the carrier.
The author found that increasing the size of both PCL and PLGA carrier, increased
the aerosol performance of the drug. However, these observations were inverse to the
observations by Ooi et al who used spherical polystyrene as a carrier for SS [48].
Contrary to their expectation, they found that increasing the size of the carrier
particle in fact, decreases the FPF of the drug which was attributed to the increased
press-on forces when the drug-carrier blend was prepared. Futher the glass carrier
was used to confirm the contribution of press-on forces to the aerosolization
performance of the carrier. As no significant difference in the FPF of SS was
obtained with the glass carrier, it was concluded that the press-on forces were not a
governing factor for the aerosolization performance of the drug. It should be noted
that the materials employed in these studies are totally different. The previous study
used polystyrene and glass as spherical carrier and the present study utilized PCL and
PLGA as the carrier. These materials will vary widely in their surface chemistry and
Young‟s modulus and this explains the difference obtained in the FPF of the drug.
The maximum particle size employed in the present study was 150 µm. It is not
known whether the particle size higher than 150 µm will further improve the drug
delivery. As the carrier mass continues to increase it will encounter reduced velocity
due to its increasing mass which can hamper the drug dispersion. As a consequence,
it is speculated that further increase in the size of the microspheres may inhibit the
dispersion of drug from the carrier.
6.3. Conclusion
The work presented in this chapter emphasized the importance of the size of the
carrier in the dispersion and the detachment of the drug from the carrier surface in
DPI formulations. It was observed that the smaller size of the carrier resulted in
lower FPF of the SS. As the carrier size increased, there was an increased mechanical
force experienced by larger carriers which resulted in more detachment of the drug
from the surfaces and eventually increased FPF of the drug. These results suggested
Chapter 6 Effect of the Size of the Carrier on the Dispersion of SS
134
that the larger size of the PCL and PLGA carriers were effective in improving the
dispersion of the drug from the carrier surfaces.
Chapter 7 Characterization of PCL and PLGA Surfaces and their Relationship with SS dispersion
135
CChhaapptteerr 77
CChhaarraacctteerriizzaattiioonn ooff PPCCLL aanndd PPLLGGAA
SSuurrffaacceess aanndd tthheeiirr RReellaattiioonnsshhiipp wwiitthh
SSSS DDiissppeerrssiioonn
Chapter 7 Characterization of PCL and PLGA Surfaces
and their Relationship with SS dispersion

Chapter 7 Characterization of PCL and PLGA Surfaces and their Relationship with SS dispersion
137
7.1. Introduction
The surface characteristics (adhesional forces, surface roughness and surface free
energy) of the carrier play a crucial role in the dispersion of the drug from the DPI
devices and thereby affect the efficiency of DPI systems. The adhesion forces
between the drug and the carrier have to be overcome by the concomitant efforts of
the patient‟s inhalation and the mechanical forces from the device so that the drug is
detached from the surface and is available to the lungs. The various factors affecting
the adhesion forces and the relationship between the surface properties and drug
dispersion have been discussed in Chapter 2. Researchers have carried out various
studies with the lactose carrier to investigate the effect of its surface roughness on the
FPF of the drug and have also measured the adhesion forces. All these studies have
been discussed earlier in Chapter 2.
It was the aim of the present study to investigate the influence of the surface
roughness of the polymeric carrier, surface free energy and the adhesion forces
between the drug and the polymeric carrier on the aerosol performance of the drug.
This chapter will discuss the correlation of the adhesional properties, surface
roughness and surface free energies of the PCL and PLGA carrier with the dispersion
of the SS from the interactive mixtures of SS and carriers.
7.2. Results and Discussion
The adhesion forces between the silica probe and microspheres and the drug probe
(silica probe coated with SS) and microspheres were measured by AFM. As
discussed in Chapter 2, the surface roughness of the sample is a predominant factor
affecting the adhesion forces. The adhesion forces experienced by the drug particle at
the top of the peak on the surface of the carrier would be certainly less as compared
with the drug particle which is situated deep in the valley of the carrier surface
(Chapter 2, Figure 2.5). This occurred because the particles had different areas of
contact [166]. Hence in order to eliminate the effect of surface roughness on the
determination of adhesion forces, spin-coated films were prepared in this study.
Similar sets of adhesion force experiments were done with films instead of the
microspheres as the films are flat, smooth and have minimized surface roughness.
The surface roughness of both the films and microspheres were determined by AFM.
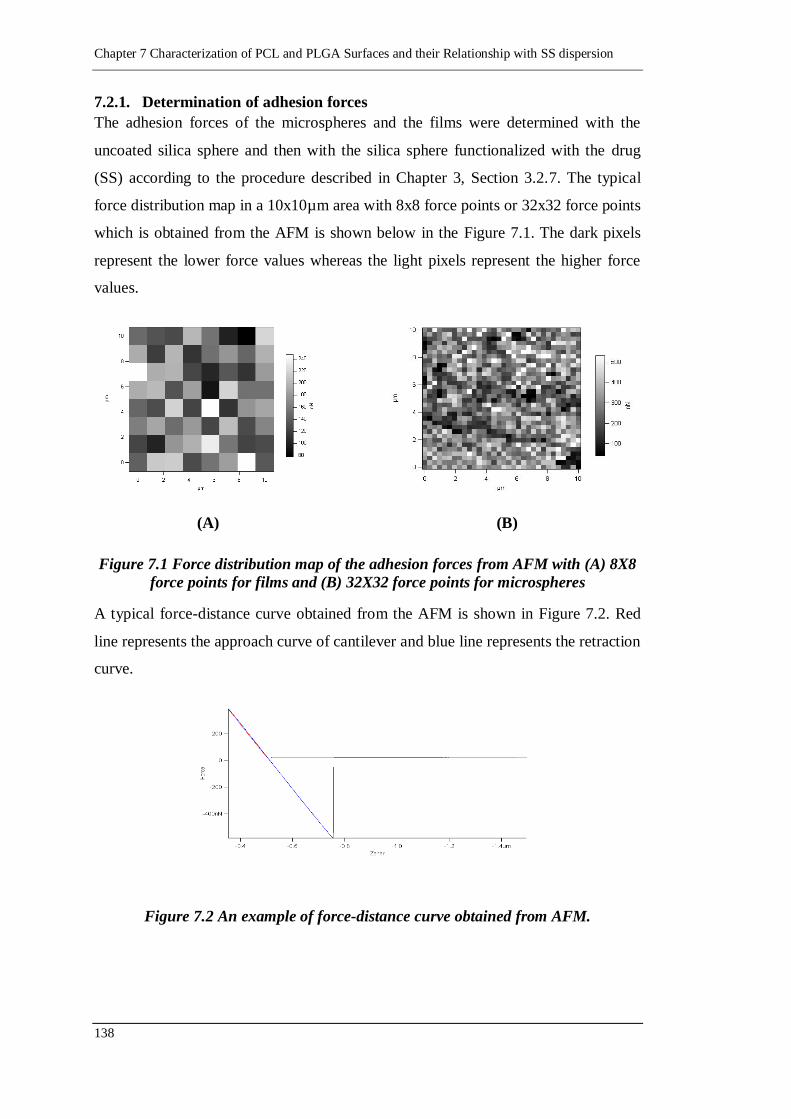
Chapter 7 Characterization of PCL and PLGA Surfaces and their Relationship with SS dispersion
138
7.2.1. Determination of adhesion forces
The adhesion forces of the microspheres and the films were determined with the
uncoated silica sphere and then with the silica sphere functionalized with the drug
(SS) according to the procedure described in Chapter 3, Section 3.2.7. The typical
force distribution map in a 10x10µm area with 8x8 force points or 32x32 force points
which is obtained from the AFM is shown below in the Figure 7.1. The dark pixels
represent the lower force values whereas the light pixels represent the higher force
values.
(A) (B)
Figure 7.1 Force distribution map of the adhesion forces from AFM with (A) 8X8
force points for films and (B) 32X32 force points for microspheres
A typical force-distance curve obtained from the AFM is shown in Figure 7.2. Red
line represents the approach curve of cantilever and blue line represents the retraction
curve.
Figure 7.2 An example of force-distance curve obtained from AFM.
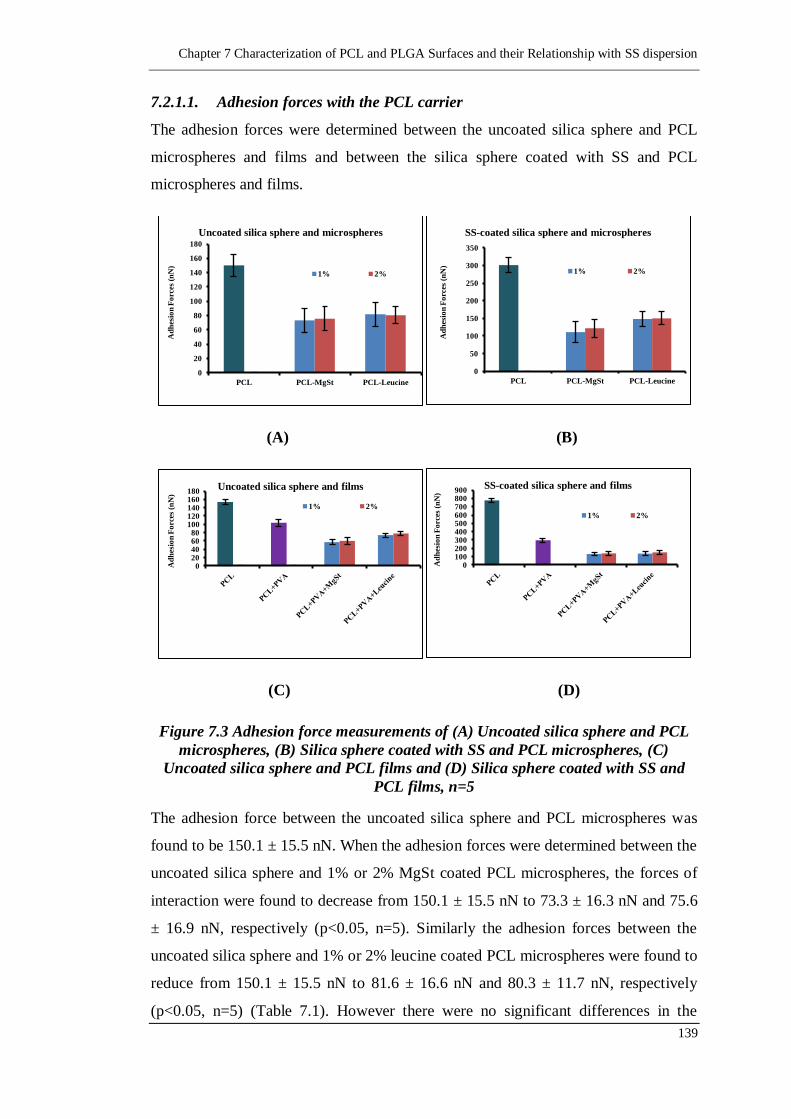
Chapter 7 Characterization of PCL and PLGA Surfaces and their Relationship with SS dispersion
139
7.2.1.1. Adhesion forces with the PCL carrier
The adhesion forces were determined between the uncoated silica sphere and PCL
microspheres and films and between the silica sphere coated with SS and PCL
microspheres and films.
(A) (B)
(C) (D)
Figure 7.3 Adhesion force measurements of (A) Uncoated silica sphere and PCL
microspheres, (B) Silica sphere coated with SS and PCL microspheres, (C)
Uncoated silica sphere and PCL films and (D) Silica sphere coated with SS and
PCL films, n=5
The adhesion force between the uncoated silica sphere and PCL microspheres was
found to be 150.1 ± 15.5 nN. When the adhesion forces were determined between the
uncoated silica sphere and 1% or 2% MgSt coated PCL microspheres, the forces of
interaction were found to decrease from 150.1 ± 15.5 nN to 73.3 ± 16.3 nN and 75.6
± 16.9 nN, respectively (p<0.05, n=5). Similarly the adhesion forces between the
uncoated silica sphere and 1% or 2% leucine coated PCL microspheres were found to
reduce from 150.1 ± 15.5 nN to 81.6 ± 16.6 nN and 80.3 ± 11.7 nN, respectively
(p<0.05, n=5) (Table 7.1). However there were no significant differences in the
0
20
40
60
80
100
120
140
160
180
PCL PCL-MgSt PCL-Leucine
Ad
hes
ion
Fo
rces
(n
N)
Uncoated silica sphere and microspheres
1% 2%
0
50
100
150
200
250
300
350
PCL PCL-MgSt PCL-Leucine
Ad
hes
ion
Fo
rces
(n
N)
SS-coated silica sphere and microspheres
1% 2%
0 20 40 60 80
100 120 140 160 180
Ad
hes
ion
Fo
rces
(n
N)
Uncoated silica sphere and films
1% 2%
0 100 200 300 400 500 600 700 800 900
Ad
hes
ion
Fo
rces
(n
N)
SS-coated silica sphere and films
1% 2%
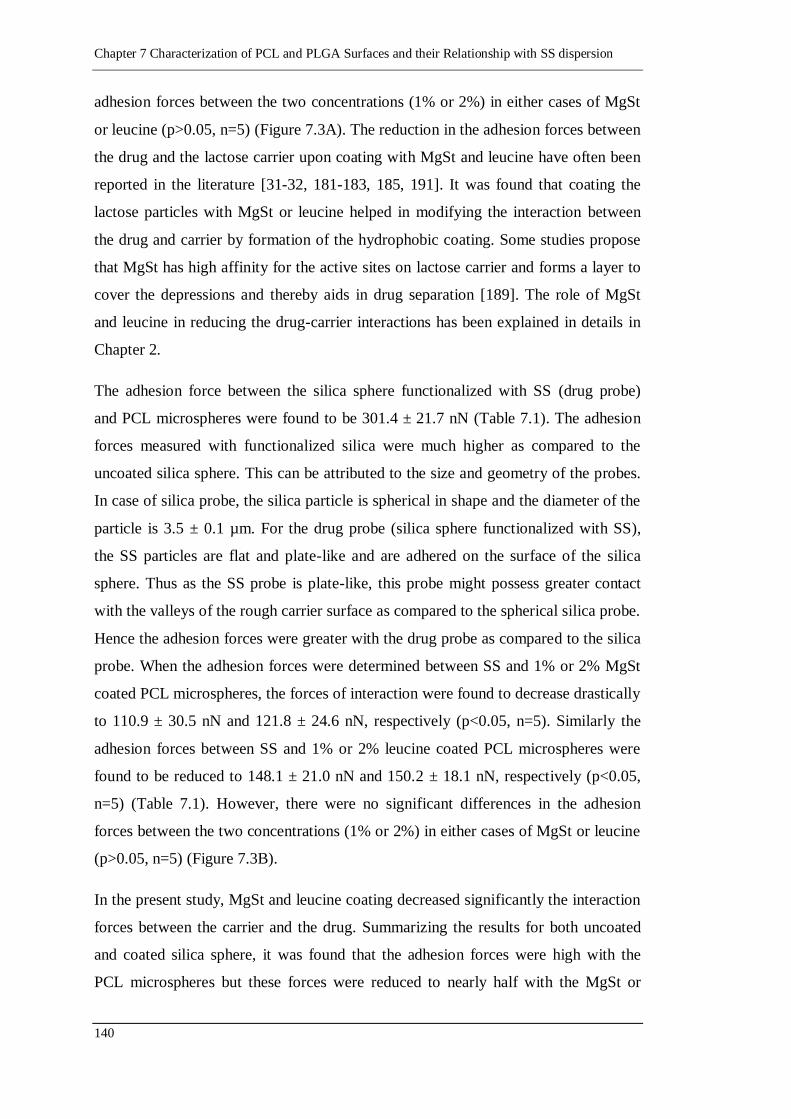
Chapter 7 Characterization of PCL and PLGA Surfaces and their Relationship with SS dispersion
140
adhesion forces between the two concentrations (1% or 2%) in either cases of MgSt
or leucine (p>0.05, n=5) (Figure 7.3A). The reduction in the adhesion forces between
the drug and the lactose carrier upon coating with MgSt and leucine have often been
reported in the literature [31-32, 181-183, 185, 191]. It was found that coating the
lactose particles with MgSt or leucine helped in modifying the interaction between
the drug and carrier by formation of the hydrophobic coating. Some studies propose
that MgSt has high affinity for the active sites on lactose carrier and forms a layer to
cover the depressions and thereby aids in drug separation [189]. The role of MgSt
and leucine in reducing the drug-carrier interactions has been explained in details in
Chapter 2.
The adhesion force between the silica sphere functionalized with SS (drug probe)
and PCL microspheres were found to be 301.4 ± 21.7 nN (Table 7.1). The adhesion
forces measured with functionalized silica were much higher as compared to the
uncoated silica sphere. This can be attributed to the size and geometry of the probes.
In case of silica probe, the silica particle is spherical in shape and the diameter of the
particle is 3.5 ± 0.1 µm. For the drug probe (silica sphere functionalized with SS),
the SS particles are flat and plate-like and are adhered on the surface of the silica
sphere. Thus as the SS probe is plate-like, this probe might possess greater contact
with the valleys of the rough carrier surface as compared to the spherical silica probe.
Hence the adhesion forces were greater with the drug probe as compared to the silica
probe. When the adhesion forces were determined between SS and 1% or 2% MgSt
coated PCL microspheres, the forces of interaction were found to decrease drastically
to 110.9 ± 30.5 nN and 121.8 ± 24.6 nN, respectively (p<0.05, n=5). Similarly the
adhesion forces between SS and 1% or 2% leucine coated PCL microspheres were
found to be reduced to 148.1 ± 21.0 nN and 150.2 ± 18.1 nN, respectively (p<0.05,
n=5) (Table 7.1). However, there were no significant differences in the adhesion
forces between the two concentrations (1% or 2%) in either cases of MgSt or leucine
(p>0.05, n=5) (Figure 7.3B).
In the present study, MgSt and leucine coating decreased significantly the interaction
forces between the carrier and the drug. Summarizing the results for both uncoated
and coated silica sphere, it was found that the adhesion forces were high with the
PCL microspheres but these forces were reduced to nearly half with the MgSt or
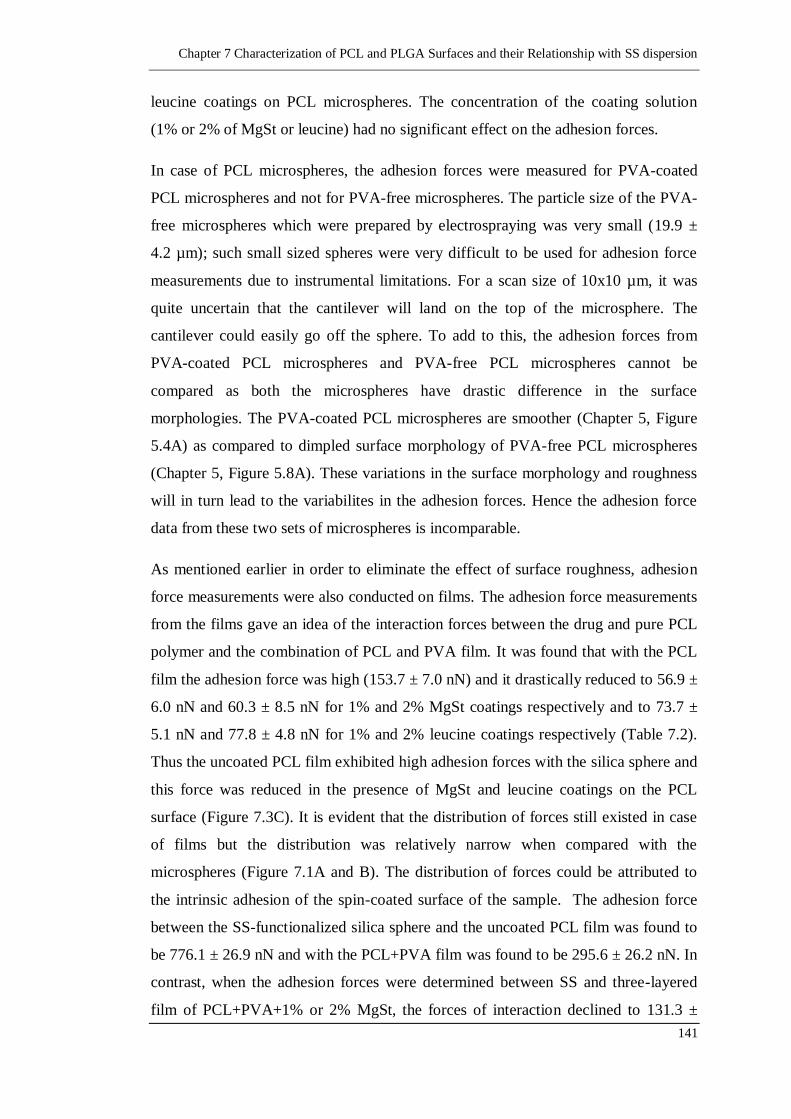
Chapter 7 Characterization of PCL and PLGA Surfaces and their Relationship with SS dispersion
141
leucine coatings on PCL microspheres. The concentration of the coating solution
(1% or 2% of MgSt or leucine) had no significant effect on the adhesion forces.
In case of PCL microspheres, the adhesion forces were measured for PVA-coated
PCL microspheres and not for PVA-free microspheres. The particle size of the PVA-
free microspheres which were prepared by electrospraying was very small (19.9 ±
4.2 µm); such small sized spheres were very difficult to be used for adhesion force
measurements due to instrumental limitations. For a scan size of 10x10 µm, it was
quite uncertain that the cantilever will land on the top of the microsphere. The
cantilever could easily go off the sphere. To add to this, the adhesion forces from
PVA-coated PCL microspheres and PVA-free PCL microspheres cannot be
compared as both the microspheres have drastic difference in the surface
morphologies. The PVA-coated PCL microspheres are smoother (Chapter 5, Figure
5.4A) as compared to dimpled surface morphology of PVA-free PCL microspheres
(Chapter 5, Figure 5.8A). These variations in the surface morphology and roughness
will in turn lead to the variabilites in the adhesion forces. Hence the adhesion force
data from these two sets of microspheres is incomparable.
As mentioned earlier in order to eliminate the effect of surface roughness, adhesion
force measurements were also conducted on films. The adhesion force measurements
from the films gave an idea of the interaction forces between the drug and pure PCL
polymer and the combination of PCL and PVA film. It was found that with the PCL
film the adhesion force was high (153.7 ± 7.0 nN) and it drastically reduced to 56.9 ±
6.0 nN and 60.3 ± 8.5 nN for 1% and 2% MgSt coatings respectively and to 73.7 ±
5.1 nN and 77.8 ± 4.8 nN for 1% and 2% leucine coatings respectively (Table 7.2).
Thus the uncoated PCL film exhibited high adhesion forces with the silica sphere and
this force was reduced in the presence of MgSt and leucine coatings on the PCL
surface (Figure 7.3C). It is evident that the distribution of forces still existed in case
of films but the distribution was relatively narrow when compared with the
microspheres (Figure 7.1A and B). The distribution of forces could be attributed to
the intrinsic adhesion of the spin-coated surface of the sample. The adhesion force
between the SS-functionalized silica sphere and the uncoated PCL film was found to
be 776.1 ± 26.9 nN and with the PCL+PVA film was found to be 295.6 ± 26.2 nN. In
contrast, when the adhesion forces were determined between SS and three-layered
film of PCL+PVA+1% or 2% MgSt, the forces of interaction declined to 131.3 ±
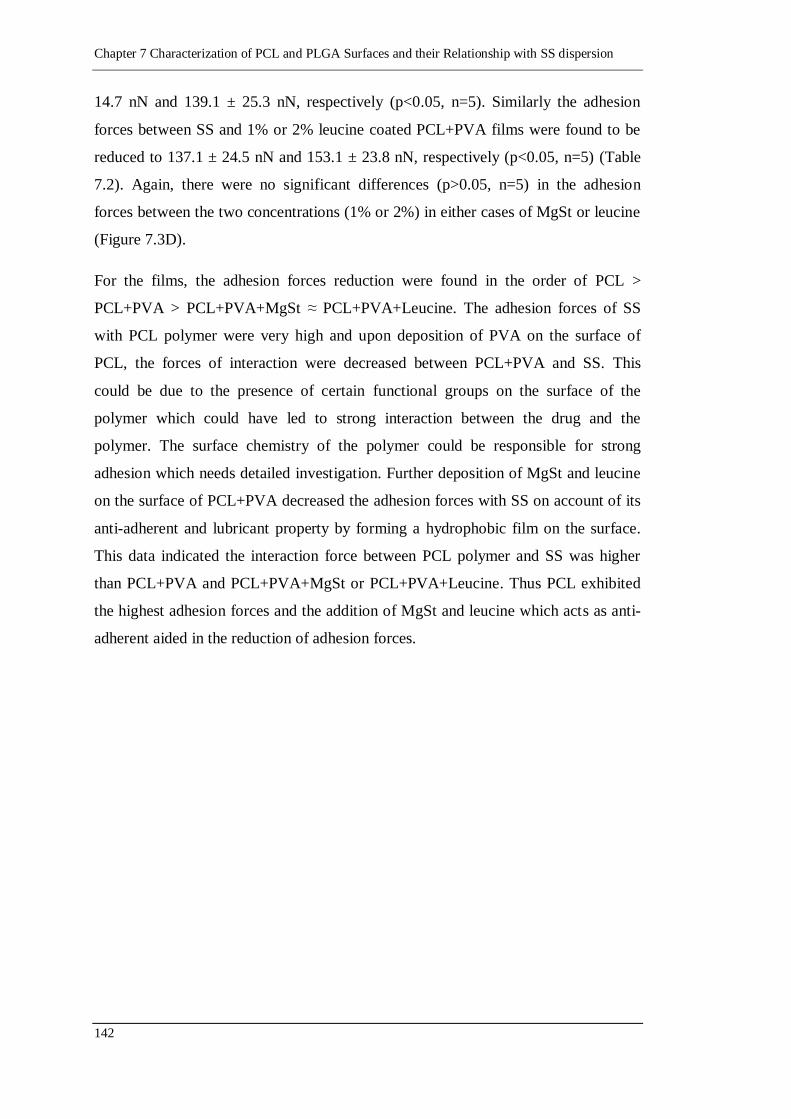
Chapter 7 Characterization of PCL and PLGA Surfaces and their Relationship with SS dispersion
142
14.7 nN and 139.1 ± 25.3 nN, respectively (p<0.05, n=5). Similarly the adhesion
forces between SS and 1% or 2% leucine coated PCL+PVA films were found to be
reduced to 137.1 ± 24.5 nN and 153.1 ± 23.8 nN, respectively (p<0.05, n=5) (Table
7.2). Again, there were no significant differences (p>0.05, n=5) in the adhesion
forces between the two concentrations (1% or 2%) in either cases of MgSt or leucine
(Figure 7.3D).
For the films, the adhesion forces reduction were found in the order of PCL >
PCL+PVA > PCL+PVA+MgSt ≈ PCL+PVA+Leucine. The adhesion forces of SS
with PCL polymer were very high and upon deposition of PVA on the surface of
PCL, the forces of interaction were decreased between PCL+PVA and SS. This
could be due to the presence of certain functional groups on the surface of the
polymer which could have led to strong interaction between the drug and the
polymer. The surface chemistry of the polymer could be responsible for strong
adhesion which needs detailed investigation. Further deposition of MgSt and leucine
on the surface of PCL+PVA decreased the adhesion forces with SS on account of its
anti-adherent and lubricant property by forming a hydrophobic film on the surface.
This data indicated the interaction force between PCL polymer and SS was higher
than PCL+PVA and PCL+PVA+MgSt or PCL+PVA+Leucine. Thus PCL exhibited
the highest adhesion forces and the addition of MgSt and leucine which acts as anti-
adherent aided in the reduction of adhesion forces.
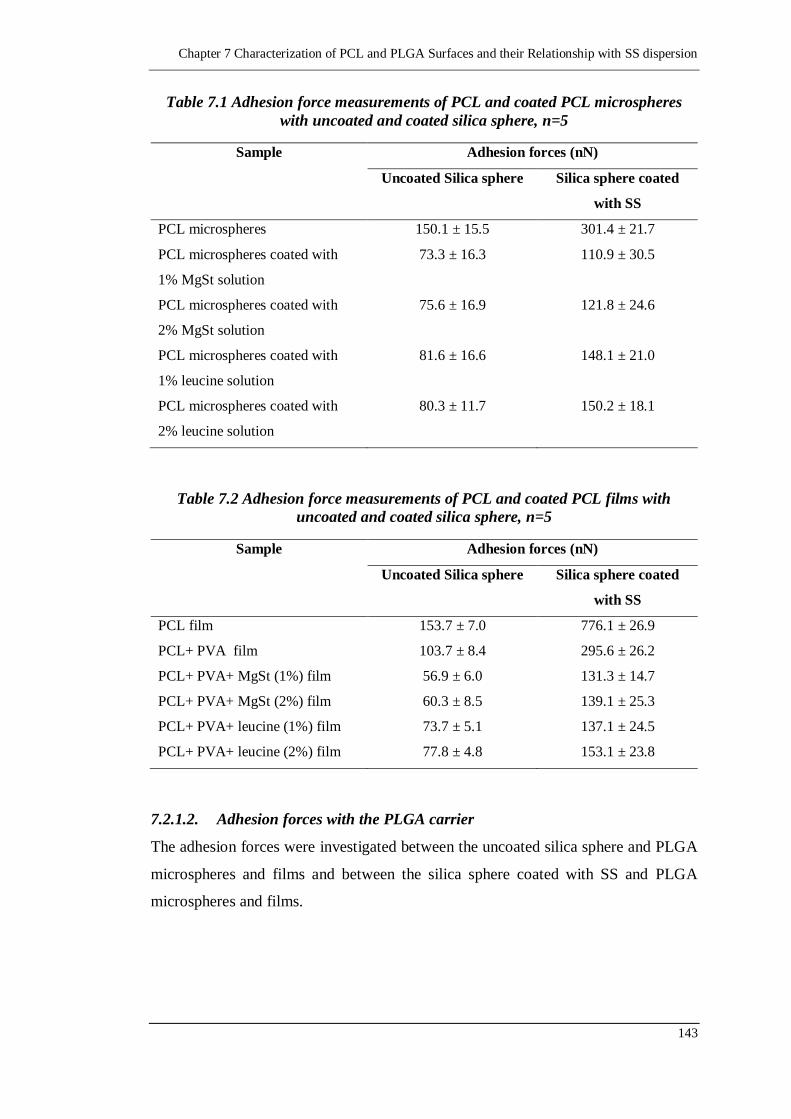
Chapter 7 Characterization of PCL and PLGA Surfaces and their Relationship with SS dispersion
143
Table 7.1 Adhesion force measurements of PCL and coated PCL microspheres
with uncoated and coated silica sphere, n=5
Sample Adhesion forces (nN)
Uncoated Silica sphere Silica sphere coated
with SS
PCL microspheres 150.1 ± 15.5 301.4 ± 21.7
PCL microspheres coated with
1% MgSt solution
73.3 ± 16.3 110.9 ± 30.5
PCL microspheres coated with
2% MgSt solution
75.6 ± 16.9 121.8 ± 24.6
PCL microspheres coated with
1% leucine solution
81.6 ± 16.6 148.1 ± 21.0
PCL microspheres coated with
2% leucine solution
80.3 ± 11.7 150.2 ± 18.1
Table 7.2 Adhesion force measurements of PCL and coated PCL films with
uncoated and coated silica sphere, n=5
Sample Adhesion forces (nN)
Uncoated Silica sphere Silica sphere coated
with SS
PCL film 153.7 ± 7.0 776.1 ± 26.9
PCL+ PVA film 103.7 ± 8.4 295.6 ± 26.2
PCL+ PVA+ MgSt (1%) film 56.9 ± 6.0 131.3 ± 14.7
PCL+ PVA+ MgSt (2%) film 60.3 ± 8.5 139.1 ± 25.3
PCL+ PVA+ leucine (1%) film 73.7 ± 5.1 137.1 ± 24.5
PCL+ PVA+ leucine (2%) film 77.8 ± 4.8 153.1 ± 23.8
7.2.1.2. Adhesion forces with the PLGA carrier
The adhesion forces were investigated between the uncoated silica sphere and PLGA
microspheres and films and between the silica sphere coated with SS and PLGA
microspheres and films.
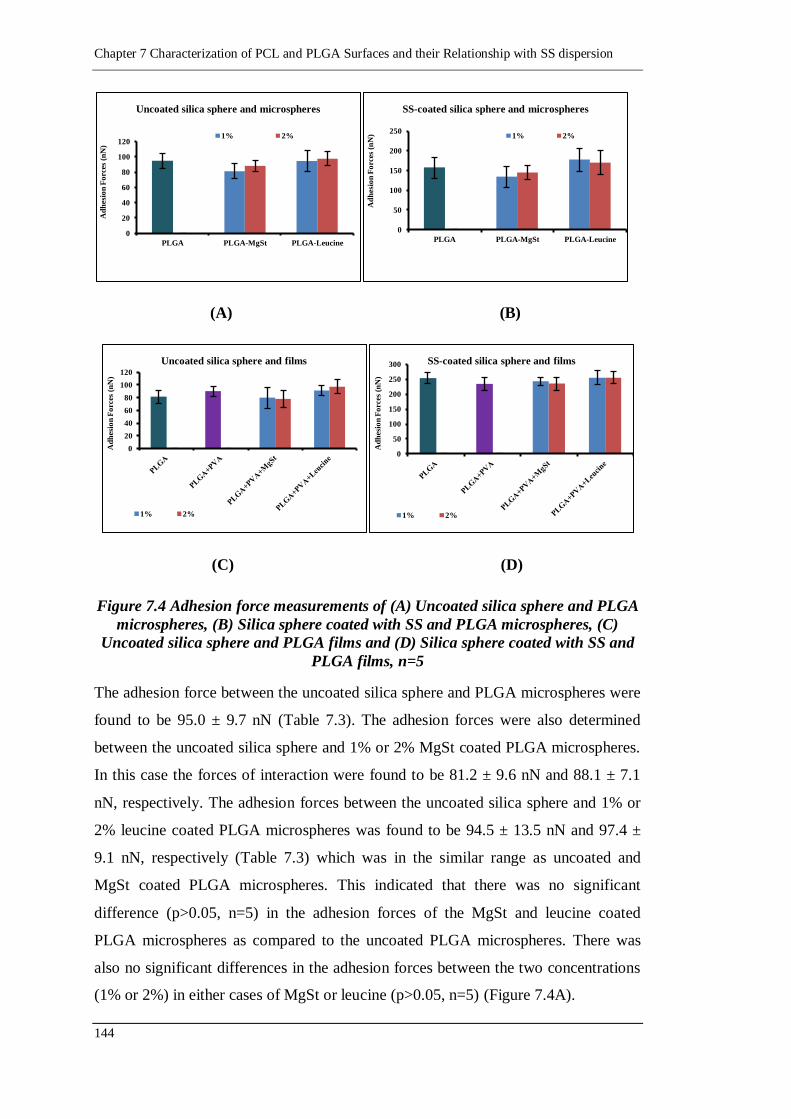
Chapter 7 Characterization of PCL and PLGA Surfaces and their Relationship with SS dispersion
144
(A) (B)
(C) (D)
Figure 7.4 Adhesion force measurements of (A) Uncoated silica sphere and PLGA
microspheres, (B) Silica sphere coated with SS and PLGA microspheres, (C)
Uncoated silica sphere and PLGA films and (D) Silica sphere coated with SS and
PLGA films, n=5
The adhesion force between the uncoated silica sphere and PLGA microspheres were
found to be 95.0 ± 9.7 nN (Table 7.3). The adhesion forces were also determined
between the uncoated silica sphere and 1% or 2% MgSt coated PLGA microspheres.
In this case the forces of interaction were found to be 81.2 ± 9.6 nN and 88.1 ± 7.1
nN, respectively. The adhesion forces between the uncoated silica sphere and 1% or
2% leucine coated PLGA microspheres was found to be 94.5 ± 13.5 nN and 97.4 ±
9.1 nN, respectively (Table 7.3) which was in the similar range as uncoated and
MgSt coated PLGA microspheres. This indicated that there was no significant
difference (p>0.05, n=5) in the adhesion forces of the MgSt and leucine coated
PLGA microspheres as compared to the uncoated PLGA microspheres. There was
also no significant differences in the adhesion forces between the two concentrations
(1% or 2%) in either cases of MgSt or leucine (p>0.05, n=5) (Figure 7.4A).
0
20
40
60
80
100
120
PLGA PLGA-MgSt PLGA-Leucine
Ad
hes
ion
Fo
rces
(n
N)
Uncoated silica sphere and microspheres
1% 2%
0
50
100
150
200
250
PLGA PLGA-MgSt PLGA-Leucine
Ad
hes
ion
Fo
rces
(n
N)
SS-coated silica sphere and microspheres
1% 2%
0
20
40
60
80
100
120
Ad
hes
ion
Fo
rces
(n
N)
Uncoated silica sphere and films
1% 2%
0
50
100
150
200
250
300
Ad
hes
ion
Fo
rces
(n
N)
SS-coated silica sphere and films
1% 2%
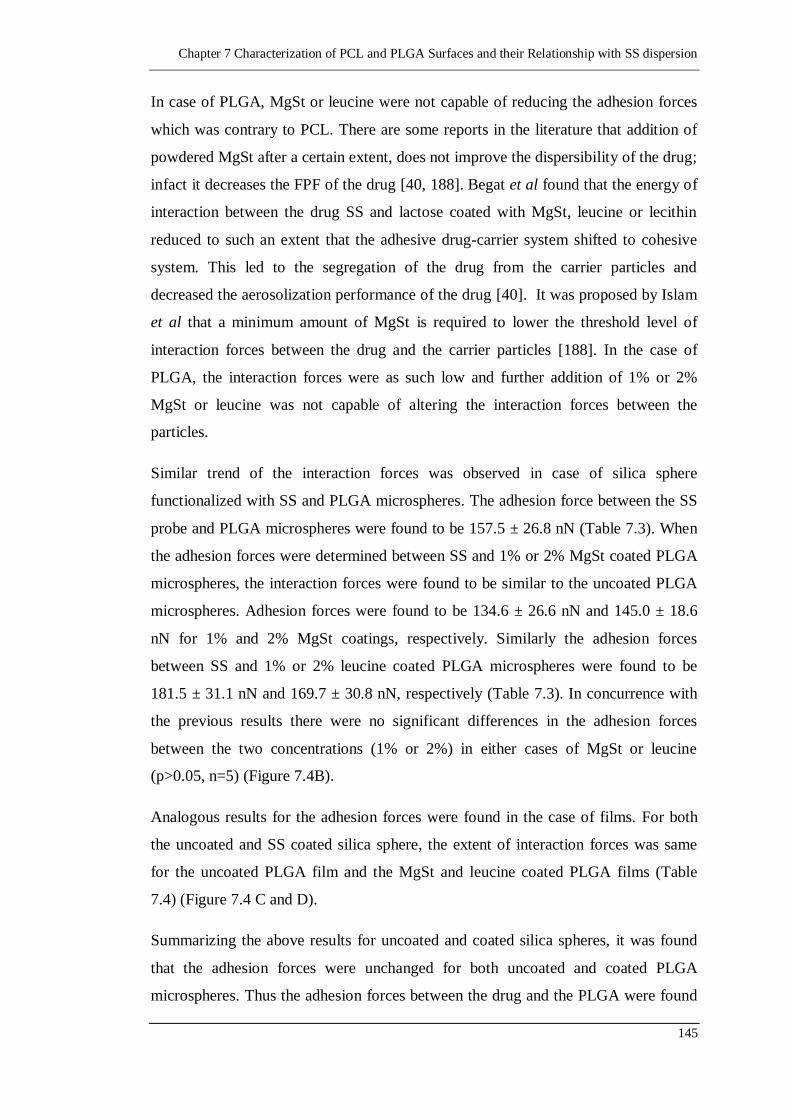
Chapter 7 Characterization of PCL and PLGA Surfaces and their Relationship with SS dispersion
145
In case of PLGA, MgSt or leucine were not capable of reducing the adhesion forces
which was contrary to PCL. There are some reports in the literature that addition of
powdered MgSt after a certain extent, does not improve the dispersibility of the drug;
infact it decreases the FPF of the drug [40, 188]. Begat et al found that the energy of
interaction between the drug SS and lactose coated with MgSt, leucine or lecithin
reduced to such an extent that the adhesive drug-carrier system shifted to cohesive
system. This led to the segregation of the drug from the carrier particles and
decreased the aerosolization performance of the drug [40]. It was proposed by Islam
et al that a minimum amount of MgSt is required to lower the threshold level of
interaction forces between the drug and the carrier particles [188]. In the case of
PLGA, the interaction forces were as such low and further addition of 1% or 2%
MgSt or leucine was not capable of altering the interaction forces between the
particles.
Similar trend of the interaction forces was observed in case of silica sphere
functionalized with SS and PLGA microspheres. The adhesion force between the SS
probe and PLGA microspheres were found to be 157.5 ± 26.8 nN (Table 7.3). When
the adhesion forces were determined between SS and 1% or 2% MgSt coated PLGA
microspheres, the interaction forces were found to be similar to the uncoated PLGA
microspheres. Adhesion forces were found to be 134.6 ± 26.6 nN and 145.0 ± 18.6
nN for 1% and 2% MgSt coatings, respectively. Similarly the adhesion forces
between SS and 1% or 2% leucine coated PLGA microspheres were found to be
181.5 ± 31.1 nN and 169.7 ± 30.8 nN, respectively (Table 7.3). In concurrence with
the previous results there were no significant differences in the adhesion forces
between the two concentrations (1% or 2%) in either cases of MgSt or leucine
(p>0.05, n=5) (Figure 7.4B).
Analogous results for the adhesion forces were found in the case of films. For both
the uncoated and SS coated silica sphere, the extent of interaction forces was same
for the uncoated PLGA film and the MgSt and leucine coated PLGA films (Table
7.4) (Figure 7.4 C and D).
Summarizing the above results for uncoated and coated silica spheres, it was found
that the adhesion forces were unchanged for both uncoated and coated PLGA
microspheres. Thus the adhesion forces between the drug and the PLGA were found
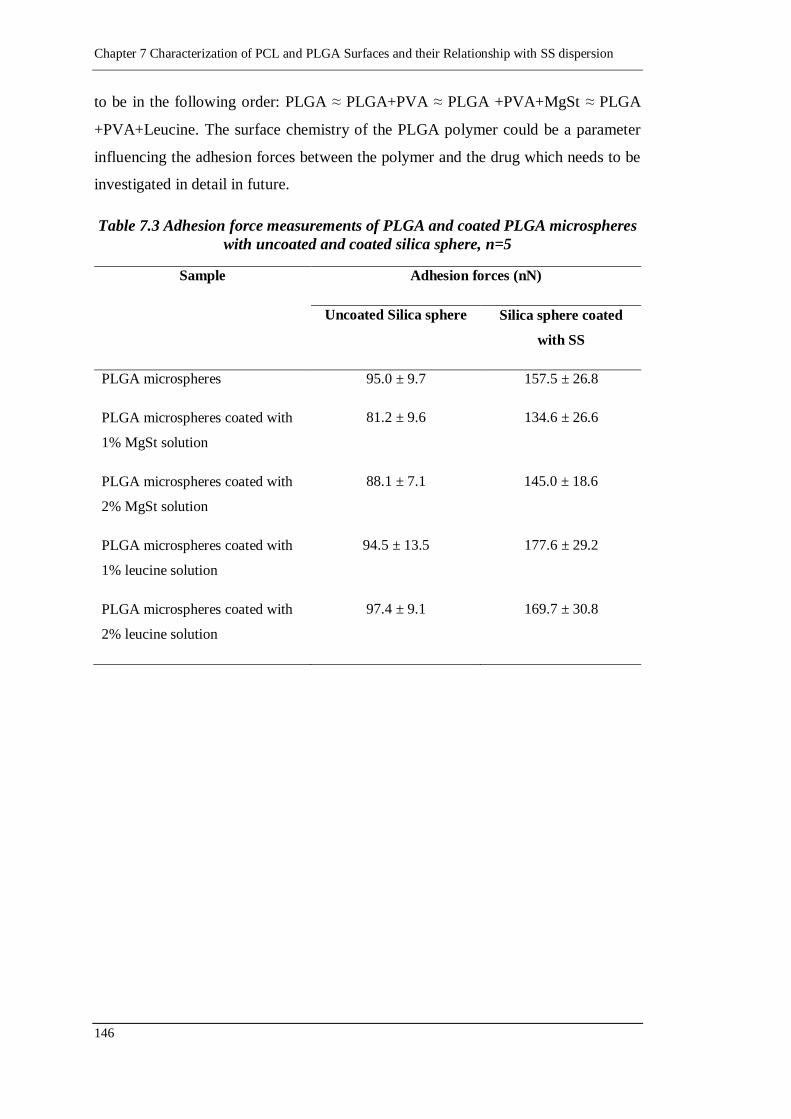
Chapter 7 Characterization of PCL and PLGA Surfaces and their Relationship with SS dispersion
146
to be in the following order: PLGA ≈ PLGA+PVA ≈ PLGA +PVA+MgSt ≈ PLGA
+PVA+Leucine. The surface chemistry of the PLGA polymer could be a parameter
influencing the adhesion forces between the polymer and the drug which needs to be
investigated in detail in future.
Table 7.3 Adhesion force measurements of PLGA and coated PLGA microspheres
with uncoated and coated silica sphere, n=5
Sample Adhesion forces (nN)
Uncoated Silica sphere Silica sphere coated
with SS
PLGA microspheres 95.0 ± 9.7 157.5 ± 26.8
PLGA microspheres coated with
1% MgSt solution
81.2 ± 9.6 134.6 ± 26.6
PLGA microspheres coated with
2% MgSt solution
88.1 ± 7.1 145.0 ± 18.6
PLGA microspheres coated with
1% leucine solution
94.5 ± 13.5 177.6 ± 29.2
PLGA microspheres coated with
2% leucine solution
97.4 ± 9.1 169.7 ± 30.8
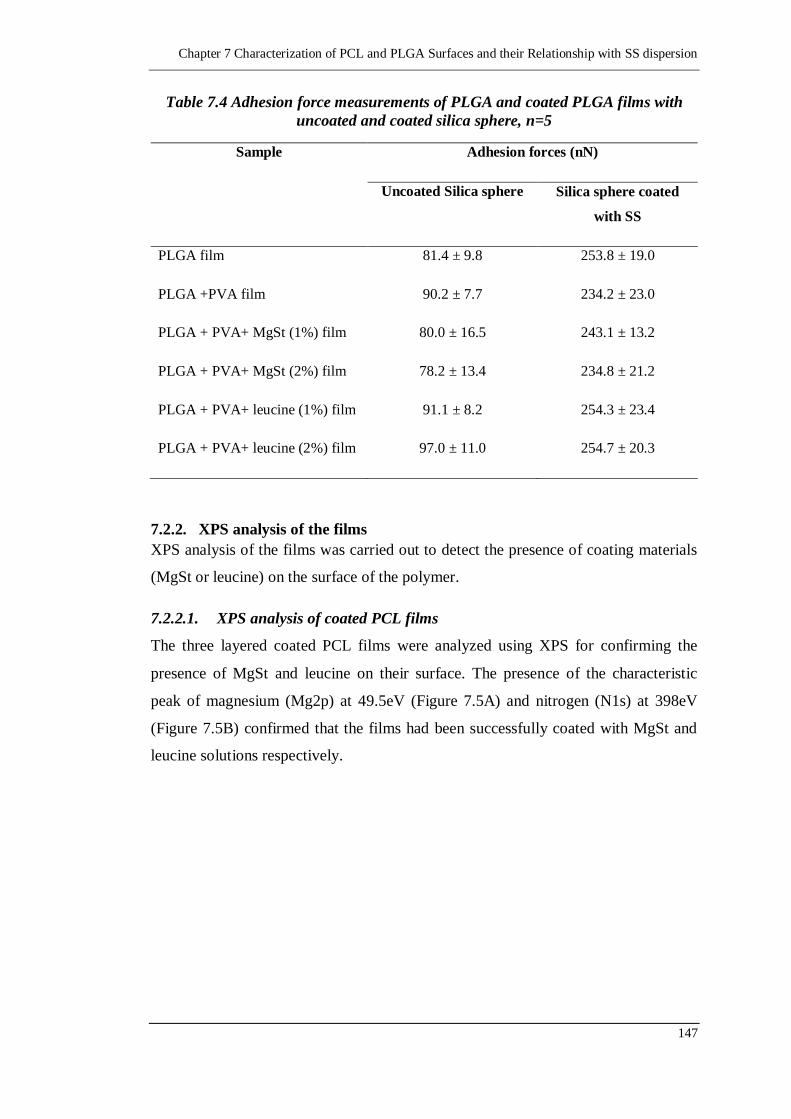
Chapter 7 Characterization of PCL and PLGA Surfaces and their Relationship with SS dispersion
147
Table 7.4 Adhesion force measurements of PLGA and coated PLGA films with
uncoated and coated silica sphere, n=5
Sample Adhesion forces (nN)
Uncoated Silica sphere Silica sphere coated
with SS
PLGA film 81.4 ± 9.8 253.8 ± 19.0
PLGA +PVA film 90.2 ± 7.7 234.2 ± 23.0
PLGA + PVA+ MgSt (1%) film 80.0 ± 16.5 243.1 ± 13.2
PLGA + PVA+ MgSt (2%) film 78.2 ± 13.4 234.8 ± 21.2
PLGA + PVA+ leucine (1%) film 91.1 ± 8.2 254.3 ± 23.4
PLGA + PVA+ leucine (2%) film 97.0 ± 11.0 254.7 ± 20.3
7.2.2. XPS analysis of the films
XPS analysis of the films was carried out to detect the presence of coating materials
(MgSt or leucine) on the surface of the polymer.
7.2.2.1. XPS analysis of coated PCL films
The three layered coated PCL films were analyzed using XPS for confirming the
presence of MgSt and leucine on their surface. The presence of the characteristic
peak of magnesium (Mg2p) at 49.5eV (Figure 7.5A) and nitrogen (N1s) at 398eV
(Figure 7.5B) confirmed that the films had been successfully coated with MgSt and
leucine solutions respectively.
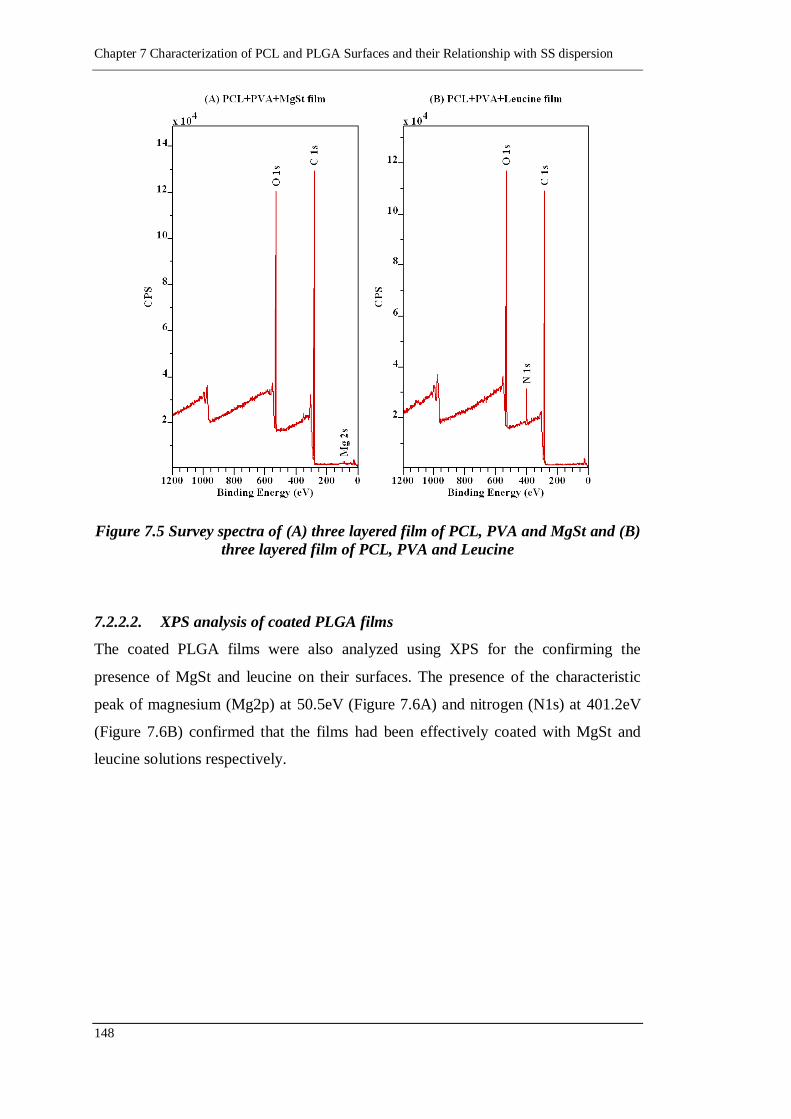
Chapter 7 Characterization of PCL and PLGA Surfaces and their Relationship with SS dispersion
148
Figure 7.5 Survey spectra of (A) three layered film of PCL, PVA and MgSt and (B)
three layered film of PCL, PVA and Leucine
7.2.2.2. XPS analysis of coated PLGA films
The coated PLGA films were also analyzed using XPS for the confirming the
presence of MgSt and leucine on their surfaces. The presence of the characteristic
peak of magnesium (Mg2p) at 50.5eV (Figure 7.6A) and nitrogen (N1s) at 401.2eV
(Figure 7.6B) confirmed that the films had been effectively coated with MgSt and
leucine solutions respectively.
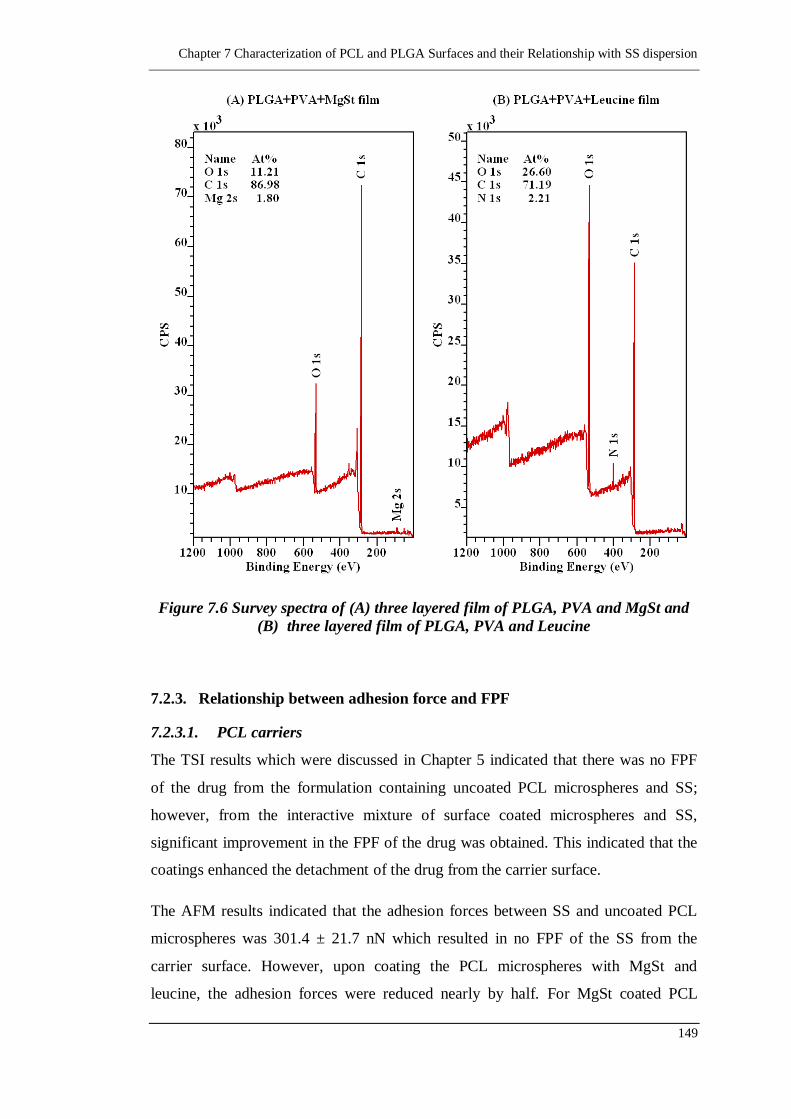
Chapter 7 Characterization of PCL and PLGA Surfaces and their Relationship with SS dispersion
149
Figure 7.6 Survey spectra of (A) three layered film of PLGA, PVA and MgSt and
(B) three layered film of PLGA, PVA and Leucine
7.2.3. Relationship between adhesion force and FPF
7.2.3.1. PCL carriers
The TSI results which were discussed in Chapter 5 indicated that there was no FPF
of the drug from the formulation containing uncoated PCL microspheres and SS;
however, from the interactive mixture of surface coated microspheres and SS,
significant improvement in the FPF of the drug was obtained. This indicated that the
coatings enhanced the detachment of the drug from the carrier surface.
The AFM results indicated that the adhesion forces between SS and uncoated PCL
microspheres was 301.4 ± 21.7 nN which resulted in no FPF of the SS from the
carrier surface. However, upon coating the PCL microspheres with MgSt and
leucine, the adhesion forces were reduced nearly by half. For MgSt coated PCL
Chapter 7 Characterization of PCL and PLGA Surfaces and their Relationship with SS dispersion
150
microspheres (104 µm) the adhesion forces were reduced from 301.4 ± 21.7 nN to
110.9 ± 30.5 nN and 121.8 ± 24.6 nN for 1% and 2% coatings, respectively which
increased the FPF from zero to 12 ± 1.3% and 15.8 ± 1.5% with the powder coatings
(1% and 2% respectively) and to 11.4 ± 0.9% and 15.4 ± 1.6% with the solution
coatings (1% and 2% respectively). For leucine coated PCL microspheres, the
adhesion forces were reduced from 301.4 ± 21.7 nN to 148.1 ± 21.0 nN and 150.2±
18.1 nN for 1% and 2% coatings, respectively, which increased the FPF from zero to
6.0 ± 0.5% and 10.2 ± 1.2% (1% and 2% respectively) with the powder coatings and
to 11.3 ± 1.1% and 11.3 ± 0.8% with the solution coatings (1% and 2% respectively).
The AFM results indicated that the adhesion forces were reduced nearly by half in
case of MgSt and leucine coated microspheres when compared with the uncoated
PCL microspheres. Thus this reduction in the adhesion forces must have contributed
to the increasing FPF of SS with the coated PCL microspheres.
Although adhesion forces reduction between 1% MgSt coated PCL and SS was
similar to that of 2% MgSt coated PCL carriers, the latter carrier provided a
significant improvement in the FPF over 1% MgSt coating. This would have
occurred due to the fact that when 2% MgSt solution was used, a significant amount
of MgSt had crystallized on the surface of the PCL microspheres (discussed earlier in
Chapter 5, Section 5.2.4.1), which led to increased coating on the surface resulting in
easy detachment of the SS from the surface of microspheres. In addition, MgSt is a
highly hydrophobic glidant, which contributed to reduced adhesion between
hydrophilic SS and coated carriers, resulting in increasing FPF of SS. In contrast,
leucine coated PCL microspheres, although showed to reduce adhesion forces and
significantly increased the FPF of SS; there was no difference in the FPF of SS in
both concentrations (1% or 2%) of leucine. It was explained previously that the
solution coating was uniform in case of leucine and 1% concentration was enough to
coat the entire surface of PCL microspheres (Chapter 5, Section 5.2.4.1). In addition,
leucine is relatively hydrophobic and hence reduced adhesion forces between
hydrophilic SS and coated carriers; however, the reduction of adhesion force is less
than that of the forces between hydrophilic SS and hydrophobic MgSt coated PCL
carriers. In addition, leucine plays an important role as an aerosolization enhancer
and thus leucine coating contributed to the enhanced aerosolization leading to
increased FPF of SS. Thus both the MgSt and the leucine coating may be
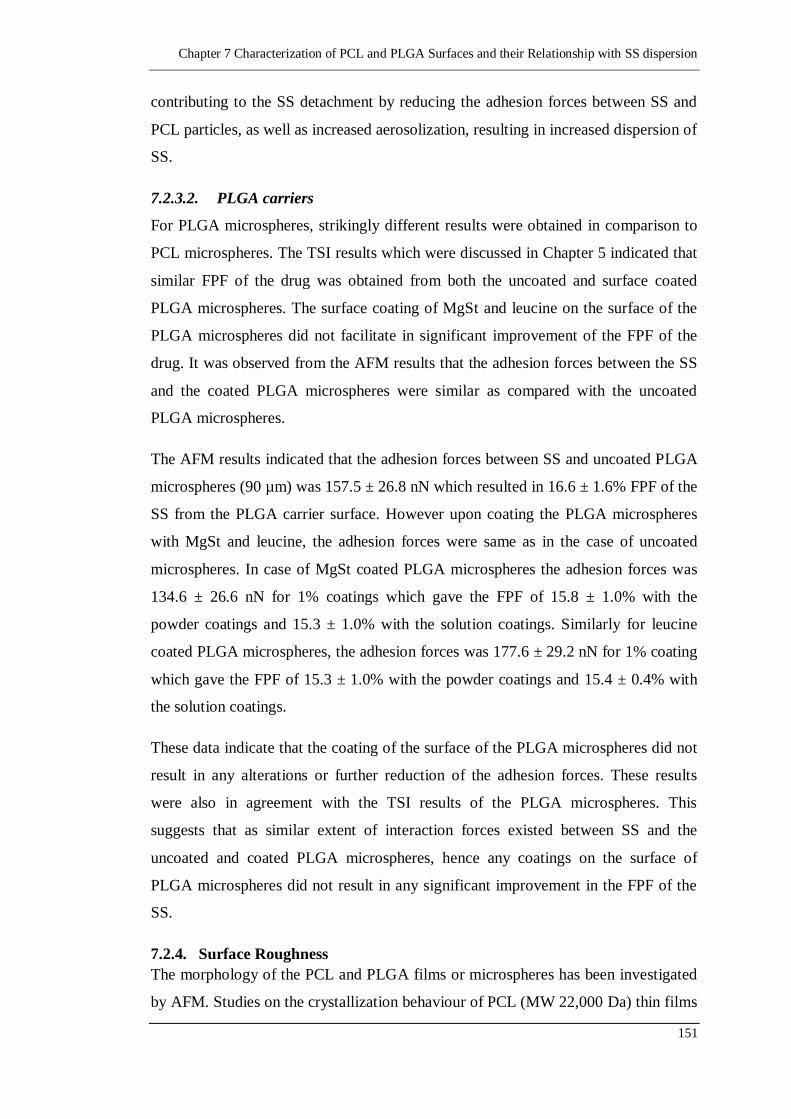
Chapter 7 Characterization of PCL and PLGA Surfaces and their Relationship with SS dispersion
151
contributing to the SS detachment by reducing the adhesion forces between SS and
PCL particles, as well as increased aerosolization, resulting in increased dispersion of
SS.
7.2.3.2. PLGA carriers
For PLGA microspheres, strikingly different results were obtained in comparison to
PCL microspheres. The TSI results which were discussed in Chapter 5 indicated that
similar FPF of the drug was obtained from both the uncoated and surface coated
PLGA microspheres. The surface coating of MgSt and leucine on the surface of the
PLGA microspheres did not facilitate in significant improvement of the FPF of the
drug. It was observed from the AFM results that the adhesion forces between the SS
and the coated PLGA microspheres were similar as compared with the uncoated
PLGA microspheres.
The AFM results indicated that the adhesion forces between SS and uncoated PLGA
microspheres (90 µm) was 157.5 ± 26.8 nN which resulted in 16.6 ± 1.6% FPF of the
SS from the PLGA carrier surface. However upon coating the PLGA microspheres
with MgSt and leucine, the adhesion forces were same as in the case of uncoated
microspheres. In case of MgSt coated PLGA microspheres the adhesion forces was
134.6 ± 26.6 nN for 1% coatings which gave the FPF of 15.8 ± 1.0% with the
powder coatings and 15.3 ± 1.0% with the solution coatings. Similarly for leucine
coated PLGA microspheres, the adhesion forces was 177.6 ± 29.2 nN for 1% coating
which gave the FPF of 15.3 ± 1.0% with the powder coatings and 15.4 ± 0.4% with
the solution coatings.
These data indicate that the coating of the surface of the PLGA microspheres did not
result in any alterations or further reduction of the adhesion forces. These results
were also in agreement with the TSI results of the PLGA microspheres. This
suggests that as similar extent of interaction forces existed between SS and the
uncoated and coated PLGA microspheres, hence any coatings on the surface of
PLGA microspheres did not result in any significant improvement in the FPF of the
SS.
7.2.4. Surface Roughness
The morphology of the PCL and PLGA films or microspheres has been investigated
by AFM. Studies on the crystallization behaviour of PCL (MW 22,000 Da) thin films
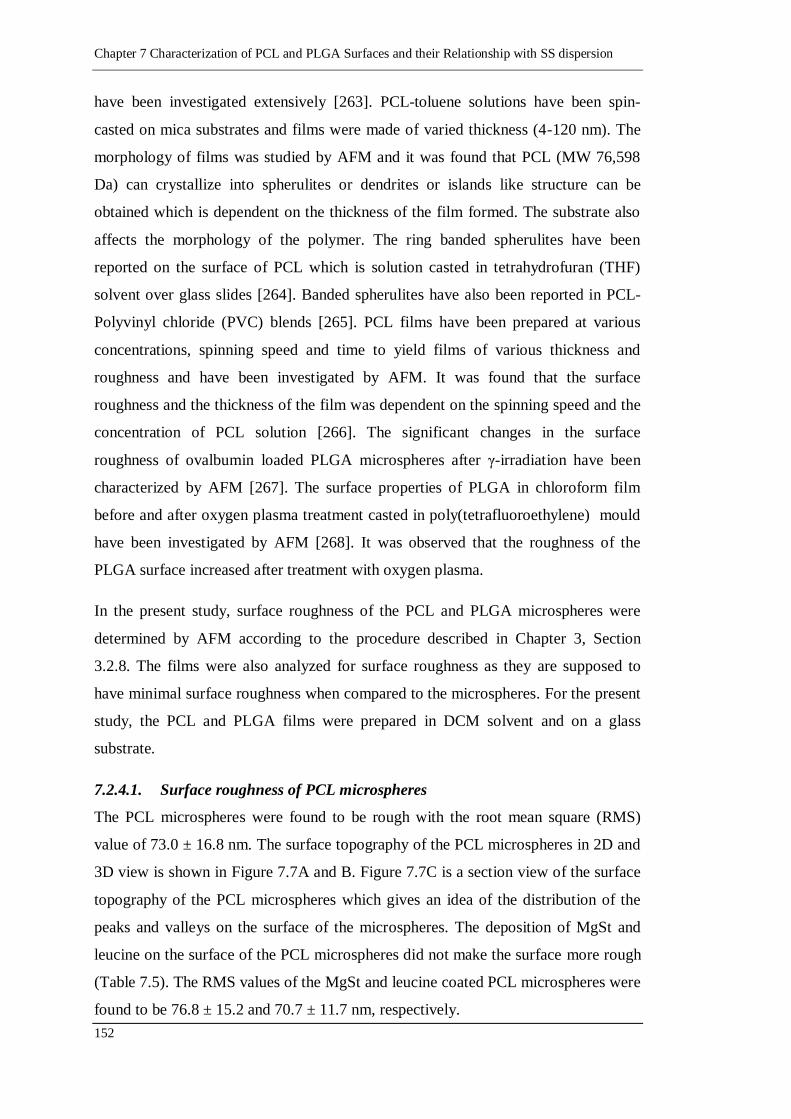
Chapter 7 Characterization of PCL and PLGA Surfaces and their Relationship with SS dispersion
152
have been investigated extensively [263]. PCL-toluene solutions have been spin-
casted on mica substrates and films were made of varied thickness (4-120 nm). The
morphology of films was studied by AFM and it was found that PCL (MW 76,598
Da) can crystallize into spherulites or dendrites or islands like structure can be
obtained which is dependent on the thickness of the film formed. The substrate also
affects the morphology of the polymer. The ring banded spherulites have been
reported on the surface of PCL which is solution casted in tetrahydrofuran (THF)
solvent over glass slides [264]. Banded spherulites have also been reported in PCL-
Polyvinyl chloride (PVC) blends [265]. PCL films have been prepared at various
concentrations, spinning speed and time to yield films of various thickness and
roughness and have been investigated by AFM. It was found that the surface
roughness and the thickness of the film was dependent on the spinning speed and the
concentration of PCL solution [266]. The significant changes in the surface
roughness of ovalbumin loaded PLGA microspheres after γ-irradiation have been
characterized by AFM [267]. The surface properties of PLGA in chloroform film
before and after oxygen plasma treatment casted in poly(tetrafluoroethylene) mould
have been investigated by AFM [268]. It was observed that the roughness of the
PLGA surface increased after treatment with oxygen plasma.
In the present study, surface roughness of the PCL and PLGA microspheres were
determined by AFM according to the procedure described in Chapter 3, Section
3.2.8. The films were also analyzed for surface roughness as they are supposed to
have minimal surface roughness when compared to the microspheres. For the present
study, the PCL and PLGA films were prepared in DCM solvent and on a glass
substrate.
7.2.4.1. Surface roughness of PCL microspheres
The PCL microspheres were found to be rough with the root mean square (RMS)
value of 73.0 ± 16.8 nm. The surface topography of the PCL microspheres in 2D and
3D view is shown in Figure 7.7A and B. Figure 7.7C is a section view of the surface
topography of the PCL microspheres which gives an idea of the distribution of the
peaks and valleys on the surface of the microspheres. The deposition of MgSt and
leucine on the surface of the PCL microspheres did not make the surface more rough
(Table 7.5). The RMS values of the MgSt and leucine coated PCL microspheres were
found to be 76.8 ± 15.2 and 70.7 ± 11.7 nm, respectively.
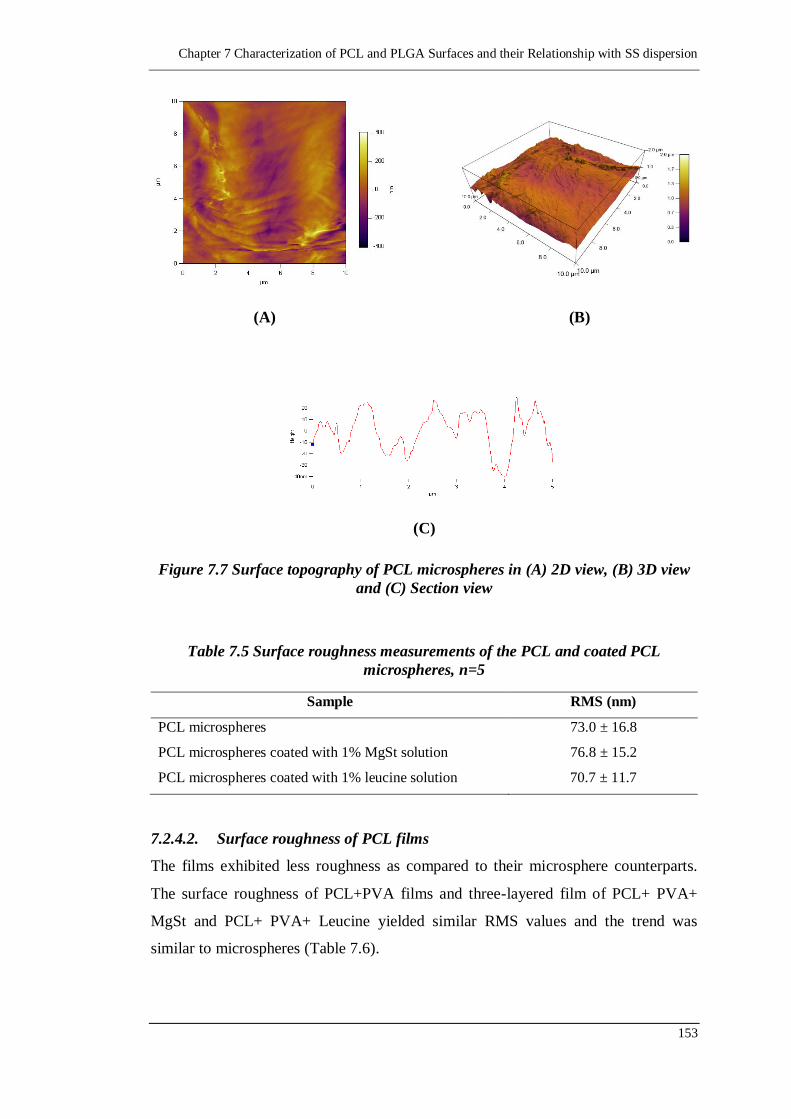
Chapter 7 Characterization of PCL and PLGA Surfaces and their Relationship with SS dispersion
153
(A) (B)
(C)
Figure 7.7 Surface topography of PCL microspheres in (A) 2D view, (B) 3D view
and (C) Section view
Table 7.5 Surface roughness measurements of the PCL and coated PCL
microspheres, n=5
Sample RMS (nm)
PCL microspheres 73.0 ± 16.8
PCL microspheres coated with 1% MgSt solution 76.8 ± 15.2
PCL microspheres coated with 1% leucine solution 70.7 ± 11.7
7.2.4.2. Surface roughness of PCL films
The films exhibited less roughness as compared to their microsphere counterparts.
The surface roughness of PCL+PVA films and three-layered film of PCL+ PVA+
MgSt and PCL+ PVA+ Leucine yielded similar RMS values and the trend was
similar to microspheres (Table 7.6).
Chapter 7 Characterization of PCL and PLGA Surfaces and their Relationship with SS dispersion
154
Table 7.6 Surface roughness measurements of the PCL and coated PCL films, n=5
Sample RMS (nm)
PCL + PVA film 12.7 ± 1.2
PCL + PVA+ MgSt film 13.0 ± 1.6
PCL + PVA+ leucine film 14.0 ± 0.5
Thus it can be seen that the coatings of MgSt and leucine on the surface of PCL did
not significantly increase the roughness of the surface as compared with their
uncoated counterparts in case of both the microspheres and the films (p>0.05, n=5)
(Figure 7.8).
Figure 7.8 Surface roughness measurements of coated PCL films and
microspheres, n=5
7.2.4.3. Surface roughness of PLGA microspheres
In contrast to PCL microspheres, the PLGA microspheres were found to be very
smooth. This is also proved by the SEM images which visually confirm that the
surface of PLGA microspheres is very smooth as compared to the PCL microspheres
(Chapter 5, Section 5.2.2.2). However the surface of the PLGA microspheres showed
a very distinct flower-like pattern which appeared as specs on the surface (Figure
7.9). This could be due to the phase separation of the polymer during the evaporation
of solvent which could have led to the formation of these patterns on the surface of
0 10 20 30 40 50 60 70 80 90
100
RM
S (
nm
)
Films
Microspheres
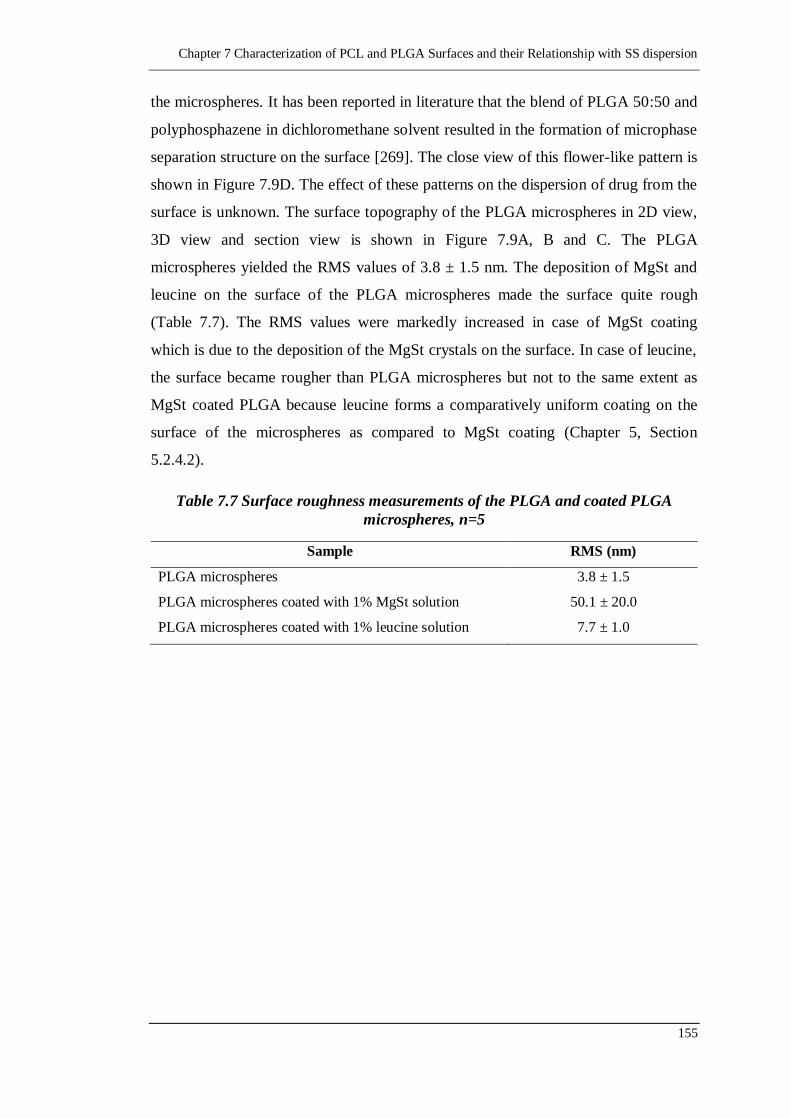
Chapter 7 Characterization of PCL and PLGA Surfaces and their Relationship with SS dispersion
155
the microspheres. It has been reported in literature that the blend of PLGA 50:50 and
polyphosphazene in dichloromethane solvent resulted in the formation of microphase
separation structure on the surface [269]. The close view of this flower-like pattern is
shown in Figure 7.9D. The effect of these patterns on the dispersion of drug from the
surface is unknown. The surface topography of the PLGA microspheres in 2D view,
3D view and section view is shown in Figure 7.9A, B and C. The PLGA
microspheres yielded the RMS values of 3.8 ± 1.5 nm. The deposition of MgSt and
leucine on the surface of the PLGA microspheres made the surface quite rough
(Table 7.7). The RMS values were markedly increased in case of MgSt coating
which is due to the deposition of the MgSt crystals on the surface. In case of leucine,
the surface became rougher than PLGA microspheres but not to the same extent as
MgSt coated PLGA because leucine forms a comparatively uniform coating on the
surface of the microspheres as compared to MgSt coating (Chapter 5, Section
5.2.4.2).
Table 7.7 Surface roughness measurements of the PLGA and coated PLGA
microspheres, n=5
Sample RMS (nm)
PLGA microspheres 3.8 ± 1.5
PLGA microspheres coated with 1% MgSt solution 50.1 ± 20.0
PLGA microspheres coated with 1% leucine solution 7.7 ± 1.0
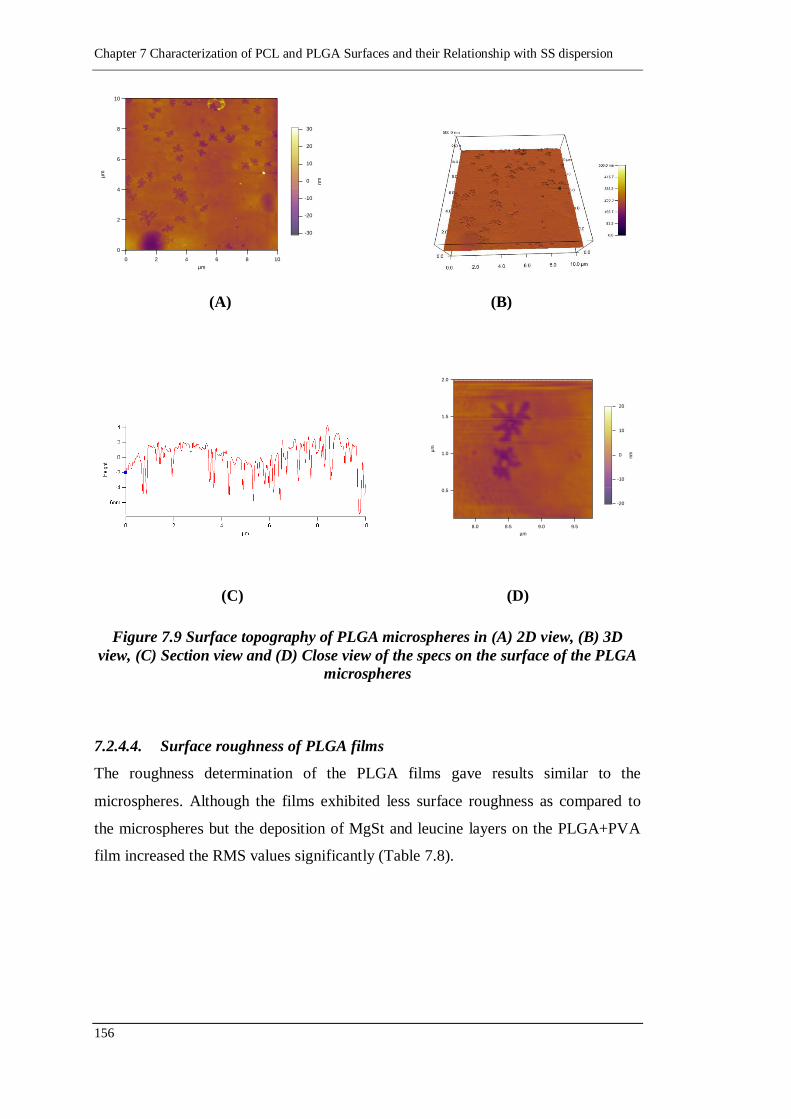
Chapter 7 Characterization of PCL and PLGA Surfaces and their Relationship with SS dispersion
156
(A) (B)
(C) (D)
Figure 7.9 Surface topography of PLGA microspheres in (A) 2D view, (B) 3D
view, (C) Section view and (D) Close view of the specs on the surface of the PLGA
microspheres
7.2.4.4. Surface roughness of PLGA films
The roughness determination of the PLGA films gave results similar to the
microspheres. Although the films exhibited less surface roughness as compared to
the microspheres but the deposition of MgSt and leucine layers on the PLGA+PVA
film increased the RMS values significantly (Table 7.8).
10
8
6
4
2
0
µm
1086420
µm
-30
-20
-10
0
10
20
30
nm
2.0
1.5
1.0
0.5
µm
9.59.08.58.0
µm
-20
-10
0
10
20
nm
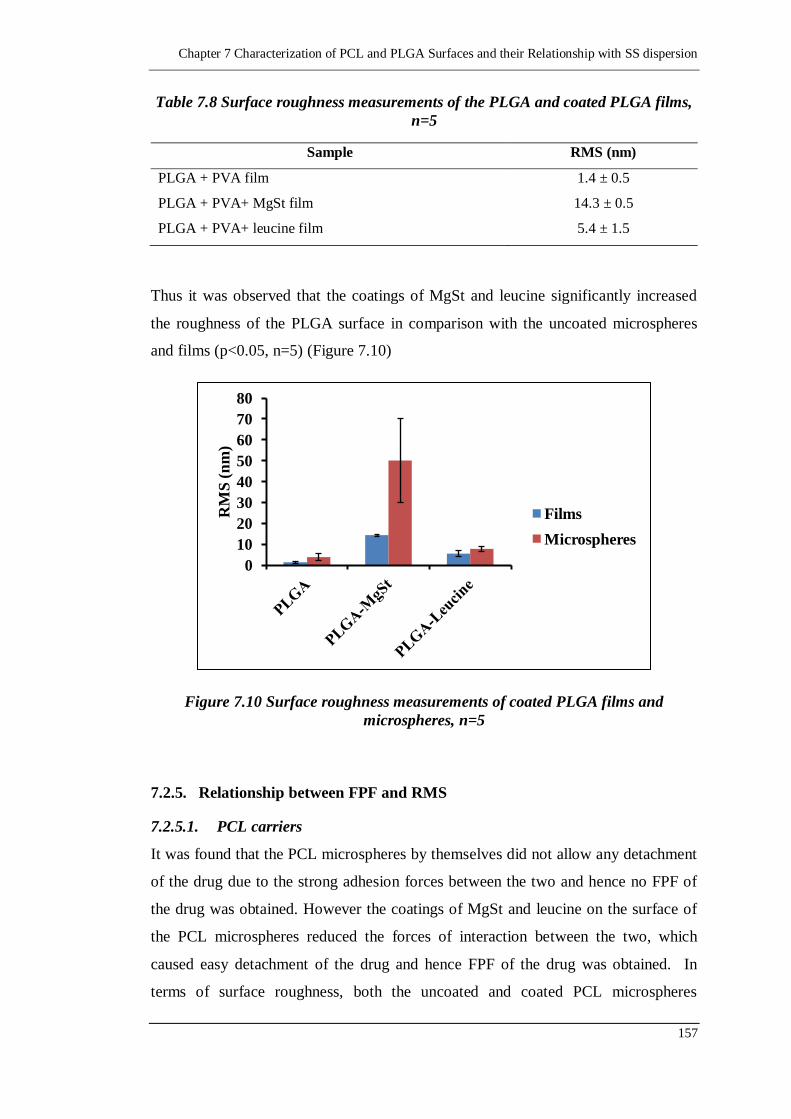
Chapter 7 Characterization of PCL and PLGA Surfaces and their Relationship with SS dispersion
157
Table 7.8 Surface roughness measurements of the PLGA and coated PLGA films,
n=5
Sample RMS (nm)
PLGA + PVA film 1.4 ± 0.5
PLGA + PVA+ MgSt film 14.3 ± 0.5
PLGA + PVA+ leucine film 5.4 ± 1.5
Thus it was observed that the coatings of MgSt and leucine significantly increased
the roughness of the PLGA surface in comparison with the uncoated microspheres
and films (p<0.05, n=5) (Figure 7.10)
Figure 7.10 Surface roughness measurements of coated PLGA films and
microspheres, n=5
7.2.5. Relationship between FPF and RMS
7.2.5.1. PCL carriers
It was found that the PCL microspheres by themselves did not allow any detachment
of the drug due to the strong adhesion forces between the two and hence no FPF of
the drug was obtained. However the coatings of MgSt and leucine on the surface of
the PCL microspheres reduced the forces of interaction between the two, which
caused easy detachment of the drug and hence FPF of the drug was obtained. In
terms of surface roughness, both the uncoated and coated PCL microspheres
0
10
20
30
40
50
60
70
80
RM
S (
nm
)
Films
Microspheres
Chapter 7 Characterization of PCL and PLGA Surfaces and their Relationship with SS dispersion
158
exhibited similar surface roughness but the coated microspheres yielded better FPF
of SS as compared to no FPF from the uncoated microspheres.
7.2.5.2. PLGA carriers
In case of PLGA microspheres it was found that the drug readily detached from the
surface and FPF of the drug was obtained. But the coating of the surface of the
PLGA microspheres with MgSt and leucine was not capable of improving the FPF of
the drug. The FPF of the SS remained similar in uncoated and coated PLGA
microspheres due to the same extent of adhesion forces prevailing between them. In
terms of surface roughness, the PLGA surface was found to be very smooth but the
MgSt and leucine coatings made the surface of the microspheres very rough. Thus
for PLGA microspheres there was an increase in the surface roughness of the
microspheres but there was no improvement in the FPF of the drug.
Thus it was found that both uncoated and coated PCL microspheres had similar kind
of surface roughness but improvement in the FPF of the SS was observed with the
coatings. However, in case of PLGA, there was an increase in the roughness of the
microspheres with the deposition of coatings but no significant improvement in the
FPF of the drug was obtained. Thus this data provided no evidence that a correlation
exists between the surface roughness of the microspheres and the FPF of the drug.
7.2.6. Surface free energy determination
Surface energy is defined as the amount of energy required to create a unit area of
solid surface. It can also be defined as the excess energy at the surface of the material
compared to the bulk. The surface free energy of the PCL and PLGA microspheres
were determined in accordance with the procedure described in Chapter 3, Section
3.2.9. It was measured for approximately the same size of PCL and PLGA
microspheres (104 µm and 90 µm respectively). Surface free energy consists of two
components: Dispersive component or non-polar energy and acid-base component or
polar energy. The magnitude of the dispersive component of the surface free energies
are based on the interaction of the alkane probes with the sample; the stronger the
interaction, the higher the energy values.
Researchers have utilized IGC technique to measure the surface free energies of PCL
and PLGA. Dispersive component of the surface free energy of the pellets of PCL
biopolymer has been measured and is reported to be 40 mJ/m2 [270]. It should be
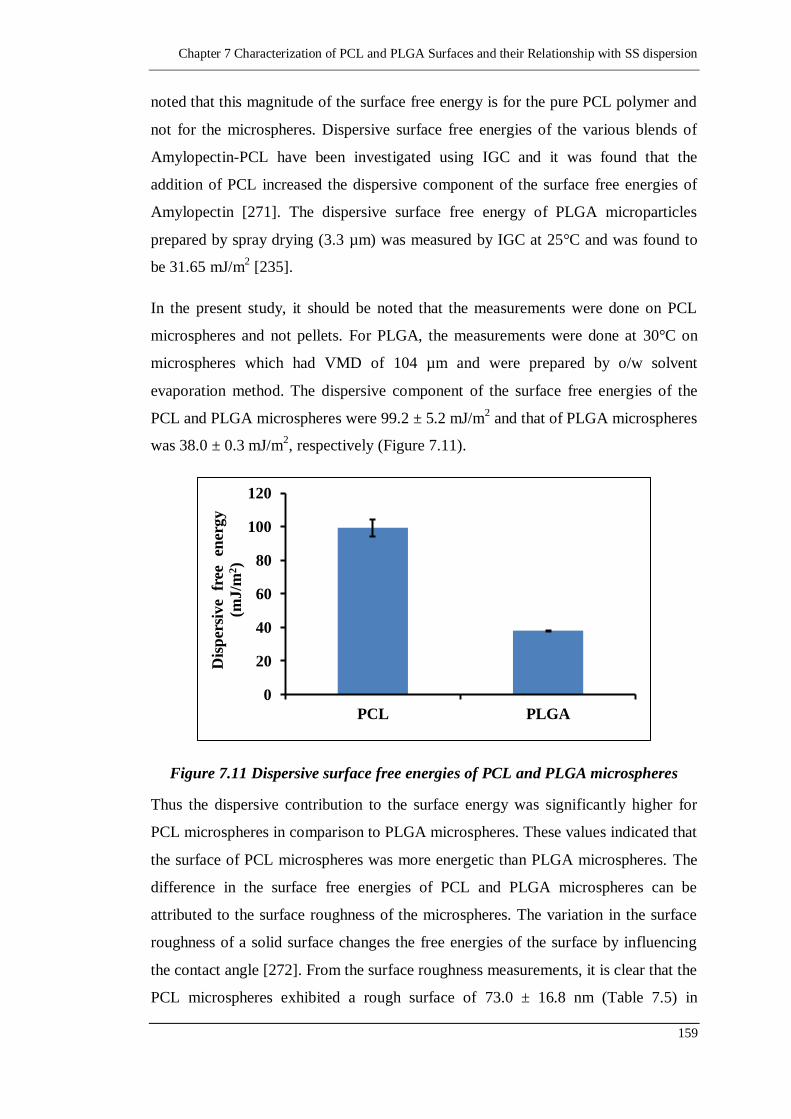
Chapter 7 Characterization of PCL and PLGA Surfaces and their Relationship with SS dispersion
159
noted that this magnitude of the surface free energy is for the pure PCL polymer and
not for the microspheres. Dispersive surface free energies of the various blends of
Amylopectin-PCL have been investigated using IGC and it was found that the
addition of PCL increased the dispersive component of the surface free energies of
Amylopectin [271]. The dispersive surface free energy of PLGA microparticles
prepared by spray drying (3.3 µm) was measured by IGC at 25°C and was found to
be 31.65 mJ/m2 [235].
In the present study, it should be noted that the measurements were done on PCL
microspheres and not pellets. For PLGA, the measurements were done at 30°C on
microspheres which had VMD of 104 µm and were prepared by o/w solvent
evaporation method. The dispersive component of the surface free energies of the
PCL and PLGA microspheres were 99.2 ± 5.2 mJ/m2 and that of PLGA microspheres
was 38.0 ± 0.3 mJ/m2, respectively (Figure 7.11).
Figure 7.11 Dispersive surface free energies of PCL and PLGA microspheres
Thus the dispersive contribution to the surface energy was significantly higher for
PCL microspheres in comparison to PLGA microspheres. These values indicated that
the surface of PCL microspheres was more energetic than PLGA microspheres. The
difference in the surface free energies of PCL and PLGA microspheres can be
attributed to the surface roughness of the microspheres. The variation in the surface
roughness of a solid surface changes the free energies of the surface by influencing
the contact angle [272]. From the surface roughness measurements, it is clear that the
PCL microspheres exhibited a rough surface of 73.0 ± 16.8 nm (Table 7.5) in
0
20
40
60
80
100
120
PCL PLGA
Dis
per
sive
fre
e e
ner
gy
(mJ/m
2)
Chapter 7 Characterization of PCL and PLGA Surfaces and their Relationship with SS dispersion
160
comparison to PLGA microspheres which were very smooth (3.8 ± 1.5 nm) (Table
7.7). Thus these variations in the roughness of the surface of the microspheres have
contributed to the difference in the surface free energies of the two which further
affected the detachment of the drug from the surface.
The surface free energy differences detected by IGC are dependent on the size [273],
crystal morphology [146], optical forms [274], preparation route [275]and relative
humidity [276]. Even on the same crystal form, every crystal face and edge could
experience different forces pulling from bulk and hence have different surface
energy. Even different physical forms of the same drug have different surface
energies. For amorphous forms, the molecules at the surface have greater freedom to
move and reorientate than the molecules in the crystal surface, so the amorphous
surfaces can have changes in the surface energy with time [277]. All these factors
can contribute to the variations in the free energies of the two surfaces.
7.2.7. Difference between the PCL and PLGA polymers
The above discussion indicate that there is a difference in the adhesion forces,
surface roughness, surface free energies and the drug dispersion from the two
biodegradable polymers: PCL and PLGA. The uncoated PCL surface had high
surface roughness (73.0 ± 16.8 nm), high dispersive component of surface free
energy (99.2 ± 5.2 mJ/m2) and exhibited high adhesion forces (301.4 ± 21.7 nN) with
the drug which resulted in no FPF of the drug. The PCL microspheres were coated
with antiadherent agents, MgSt and leucine to reduce the adhesion forces with the
drug; although they exhibited similar surface roughness to uncoated PCL
microspheres but led to easy detachment of the drug from their surface. On the other
hand, in case of PLGA microspheres, the uncoated PLGA microparticles exhibited
minimal surface roughness (3.8 ± 1.5 nm), less dispersive component of surface free
energy (38.0 ± 0.3 mJ/m2) and less adhesion forces (157.5 ± 26.8 nN) in comparison
to PCL microspheres and they easily allowed detachment of the drug from their
surface. The FPF of the drug obtained from PLGA was 16.6 ± 1.6%. Coating of the
microspheres with MgSt and leucine increased the surface roughness of the polymer
but did not lead to significant improvement of the drug delivery because similar kind
of adhesion forces existed between the uncoated and coated polymers and the drug.
Chapter 7 Characterization of PCL and PLGA Surfaces and their Relationship with SS dispersion
161
It should be noted that the dispersion of the drug from the surface is a complex
process. This difference in the dispersion of drug from the surface of PCL and PLGA
polymers can be attributed to the surface, thermal and mechanical properties of the
polymers which are described below.
7.2.7.1. Surface free energy
The interparticular interactions are influenced by surface energies of the individual
components and hence they are capable of affecting the dispersibility of the drug
from the carrier surface [278]. The relationship between surface free energy and the
detachment or the dispersibilty of the drug from the carrier surface was established in
a number of studies [148, 152-153, 155, 279]. In these investigations, a negative
correlation was established between the dispersibility of the aerosol and the surface
free energy which indicates that the decrease in surface energy led to an increase in
the FPF of the drug. This is discussed in details in Section 2.4.4.2.2, Chapter 2. As
measured the dispersive component of surface free energy of PCL microspheres was
much higher than the PLGA microspheres. This indicated that the surface of PCL
microspheres were more energetic than PLGA microspheres. This energetic surface
led to increased interaction of the PCL surface with SS and hence it contributed to no
detachment of the drug from the surface. In contrast, the surface of PLGA
microspheres was less energetic than the PCL microspheres, hence SS readily
detached from the surface.
7.2.7.2. Glass transition temperature (Tg)
The glass transition temperature (Tg) is the critical temperature at which the material
changes its behavior from being „glassy‟ to being „rubbery‟. Glassy in this context
means hard and brittle and therefore relatively easy to break, while „rubbery‟ means
elastic and flexible. Hence at temperatures below Tg, the polymers are hard, stiff and
glassy and at temperatures well above the Tg, the polymers are rubbery and they
might flow.
As mentioned earlier in Chapter 3, Section 3.1.2.1 and Section 3.1.2.2, the Tg of PCL
is -60 °C and that of PLGA is 40-60 °C. This indicates that at room temperature, the
PCL polymer is rubbery and elastic while the PLGA polymer is hard, stiff and
glassy. This difference in the Tg of PCL and PLGA polymers can lead to the
variability in the way the drug detaches from the rubbery surface in comparison to
Chapter 7 Characterization of PCL and PLGA Surfaces and their Relationship with SS dispersion
162
the glassy surface. For a rubbery surface, the particle-particle impact will be
characterised by large elastic deformations which will lead to increased contact area
between the drug and the carrier particles and higher drug-carrier forces of
interaction and lower FPF of the drug. On the other hand, the elastic deformations in
the case of glassy surface will be less which will lead to less contact between the two
particles and lowered interaction forces and higher FPF of the drug. The particle-
particle impact, the elastic deformations and eventually the adhesion forces will
affect the detachment potential of the drug from the surface and eventually the FPF
of the drug.
7.2.7.3. Elasticity of the polymer and the inhaler wall
The elastic modulus of the polymer and the wall of the DPI device will have a major
influence on the carrier-carrier and carrier-inhaler collisions which in turn will
influence the impact based detachment from the surface of the carrier. This mode of
detachment is explained in details in Chapter 2, Section 2.3.3.1 which will eventually
influence the FPF of the drug. The effect of the wall material on the collision process
has been analyzed by Sommerfeld et al. They found that the roughness of the wall
material is capable of altering the rebound behaviour of the particles and causes the
reduction of the gravitational settling of the particles which keeps the particles
redispersed [280].
Thus these surfaces, thermal and mechanical properties of the PCL and PLGA
polymer might have led to the differences in the way the drug detaches from their
surface.
7.3. Conclusion
A good correlation was observed with AFM force measurements and the TSI studies.
The extent of the interaction forces existing between the drug and the polymeric
carrier was a major controlling factor in affecting the detachment of the drug from
the surface in TSI studies. No direct relationship was observed between the surface
roughness of the microspheres and the FPF of the drug. An inverse correlation
between dispersive component of surface free energy and the FPF of the drug was
established. Thus it can be concluded that the adhesion forces between the drug and
the polymer surfaces played a very important role in the detachment of the drugs
from the carrier surface and the subsequent FPF of the drugs.
Chapter 8 Overall Conclusions and Further Directions
163
CChhaapptteerr 88
OOvveerraallll CCoonncclluussiioonnss aanndd FFuurrtthheerr
DDiirreeccttiioonnss
Chapter 8 Overall Conclusions and Further Directions

Chapter 8 Overall Conclusions and Further Directions
165
8.1. Summary and Conclusions
The overall objective of this research project was to study the surface properties of
the biodegradable polymer as a carrier in DPI formulations with an aim to achieve
efficient drug dispersion goals. Hence, this project focused on the formulation
development of DPIs.
The currently used traditional carrier in DPI formulations, lactose, poses many
challenges with respect to dispersion of drug from its surface. The lactose carrier
allows only 20-30% of the total dose to reach the lungs. This has been attributed
primarily to the irregular shape and morphology of lactose. There are reports in the
literature which suggests that the spherical carriers can be of help in improving the
dispersion of the drug from the surface. Hence, this research project proposed the use
of biodegradable polymers as an alternative carrier to lactose for DPI formulation as
they can be easily fabricated as microspheres. For this purpose, we selected PCL and
PLGA, two biodegradable polymers, to be used as carriers for delivery of the anti-
asthmatic drug, SS. Characterization strategies for the formulations were undertaken.
In order to gain a better insight into drug dispersion from DPI formulations, an
understanding of surface chemistry was essential. Hence, thorough investigations on
the surface properties of the DPI formulations were made by analysing adhesion
forces and surface roughness.
The first step in the project was to fabricate microspheres from the polymer, and then
later characterize them with various surface analytical techniques and eventually
determine drug dispersion from the formulation. When the PCL microspheres were
used for drug dispersion, no drug detached from the surface. This was because of the
high adhesion forces prevailing between PCL and SS which was determined using
AFM. In order to improve drug dispersion, the microspheres were coated with anti-
adherent agents: MgSt and leucine. These anti-adherent agents helped in reducing the
strong adhesion forces between PCL and SS. This helped SS to readily detach from
the surface due to reduced adhesion between them and helped in improving drug
dispersion.
In contrast, in the case of PLGA microspheres, the drug detached from the surface of
the uncoated microspheres and the FPF of the drug was obtained. To test any further
improvement in drug delivery, the PLGA microspheres were coated with MgSt and
Chapter 8 Overall Conclusions and Further Directions
166
leucine, but there was no significant improvement in the FPF of SS obtained when
compared with uncoated microspheres. This was because the adhesion forces
existing between PLGA and SS were present to the same extent as the interaction
forces existing between MgSt or leucine coated PLGA microspheres and SS. Hence
no further improvement in the FPF of the drug was obtained with the coated PLGA
microspheres.
Secondly, this project established the effect of the size of the spherical carrier in the
aerosolization and dispersion of the drug from the carrier surface. The FPF of the
drug was obtained from four different sizes of the carrier. It was found that as the
size of the PCL and PLGA microspheres increased, there was a subsequent increase
in the FPF of the drug. Thus, it was concluded that the larger size of the PCL and
PLGA carrier provided efficient drug delivery when compared with their smaller
counterparts due to a higher magnitude of impaction detachment as experienced by
the larger carriers.
Thirdly, a comprehensive investigation into the surface properties of the polymeric
carriers was done using the AFM. Determining the adhesion properties and surface
roughness of the polymeric carrier helped to correlate the aerosolization results with
the surface properties. With respect to interaction forces, a very good correlation was
established. It was found that as the adhesion forces decreased between the PCL
carrier and the drug due to the coating with anti-adherent agents, there was an
increased detachment of the drug from the surface and, subsequently a high FPF of
the drug was obtained in the TSI experiments. In the case of the PLGA microspheres,
there were similar kind of adhesion forces between the SS and the uncoated and
coated PLGA microspheres; therefore the drug detached to a similar extent in the
cases of both the uncoated and coated PLGA. On the contrary, no correlation was
observed between the aerosolization of SS and the surface roughness of PCL or the
PLGA carrier. Thus, it was concluded that the adhesion forces between the carrier
and the drug played a major role in controlling the dispersion of the drug from the
surface.
This study successfully proved that coated PCL microspheres and PLGA
microspheres can be used as alternative carriers to lactose in DPI formulations. The
author agrees that there has been no significant enhancement in the FPF of SS from
Chapter 8 Overall Conclusions and Further Directions
167
PCL and PLGA microspheres as compared with lactose. In fact, the FPF obtained
from the lactose and polymeric microspheres are comparable. However, the author
would like to emphasize that the production of microspheres with a particular surface
morphology is reproducible as compared with lactose, which has highly irregular
surfaces. There are various grades and brands of lactose currently available in the
market which have different surface morphologies and variable amounts of fine
lactose associated with it. All these, in turn, lead to variability in the dispersion of the
drug from the lactose surface. In the case of polymeric microspheres, reproducible
surfaces are achieved and this subsequently leads to reproducible drug delivery.
8.2. Future Directions
The author has been successful in matching drug delivery from polymeric
microspheres to the current gold standard, lactose; however there are still a few
challenges which can be addressed.
Further investigations are recommended to explore novel hydrophobic anti-adherent
agents other than MgSt or leucine. Hydrophobic agents should be such that they can
help in reducing the adhesion forces to such an extent that more detachment of the
drug is achieved from the carrier surfaces and, eventually, better drug dispersion is
obtained.
The PCL microspheres can be used for delivery of hydrophobic drugs rather than the
hydrophilic drug SS, with which it exhibited highly interactive forces. It could be
possible that these PCL microspheres are a much more suitable candidate for
aerosolizing the hydrophobic drug as they will exhibit less adhesive interactions
between them when compared with hydrophilic drugs. An example of an anti-
asthmatic hydrophobic drug is SX.
Future research should be conducted to obtain a better understanding of the influence
of the drug to carrier ratio on aerosolization performance. This can be done by
mixing the carrier with varying concentrations of drug and conducting in vitro
aerosolization experiments. In the current study, the author has used one fixed drug
to carrier ratio (2.5% SS) for the increasing sizes of the carrier microspheres. Thus,
varying ratios of drug and carrier can be used for different sizes of carrier
microspheres to study its effect on the FPF of the drug.
Chapter 8 Overall Conclusions and Further Directions
168
Also the surface free energies of various sizes of the microspheres can be measured
using the IGC technique. This will provide an idea of the free energy of the
microspheres which can be correlated to the in vitro dispersion of the drug from their
surfaces.
In order to understand whether the presence of PVA on PCL microspheres
contributes to the highly adhesion forces between the microspheres and the drug and,
eventually, the dispersion of drug from the polymer surface, PVA-free microspheres
were fabricated in the present study. This was done by electrospraying PCL and
evaluating the drug dispersion from these PCL microspheres which were devoid of
PVA. One of the limitations of this study was that the morphology from these two
sets of microspheres was quite different. PVA containing PCL microspheres were
smoother when compared with the „dimpled‟ surface morphology of the PCL
microspheres, which were prepared by electrospraying. This posed the challenge that
the adhesion force data from these microspheres of varied morphologies is not
comparable. In order to obtain PCL microspheres with the same morphology but
devoid of PVA, the microspheres could be fabricated using the same o/w emulsion
technique but with a different emulsifier other than PVA. One possibility is to use
Hydroxypropyl methyl cellulose (HPMC) to make PVA-free PCL microspheres
using the emulsion technique. These microspheres can be further used to determine
drug dispersion.
Other polymers can be screened which do not exhibit higher adhesion forces with the
drug. These polymers can be used as effective carriers for DPI formulations.
The electrosprayed PCL microspheres which are PVA-free could be coated with
MgSt and leucine and could be tested for drug dispersion. It would be interesting to
compare and contrast the FPFs of the SS from the PVA-free and PVA bound PCL
microspheres as the morphologies of both microspheres are quite different.
The molecular modelling of the PCL and PLGA polymer could be conducted to gain
an understanding of the functional groups that are present on the surface of the
polymer, which leads to the difference in the way both the polymers interact with the
drug.

Bibliography
169
BBiibblliiooggrraapphhyy
Bibliography

Bibliography
171
1. Byron, P.R. and J.S. Patton, Drug delivery via the respiratory tract. J Aerosol
Med, 1994. 7(1): p. 49-75.
2. Daniher, D.I. and J. Zhu, Dry powder platform for pulmonary drug delivery.
Particuology, 2008. 6(4): p. 225-238.
3. Haynes, A., M.S. Shaik, A. Chatterjee, and M. Singh, Evaluation of an
aerosolized selective COX-2 inhibitor as a potentiator of doxorubicin in a
non-small-cell lung cancer cell line. Pharm Res, 2003. 20(9): p. 1485-95.
4. Tian, Y., M.E. Klegerman, and A.J. Hickey, Evaluation of microparticles
containing doxorubicin suitable for aerosol delivery to the lungs. PDA J
Pharm Sci Technol, 2004. 58(5): p. 266-75.
5. Chougule, M.B., B.K. Padhi, and A. Misra, Nano-liposomal dry powder
inhaler of Amiloride Hydrochloride. J Nanosci Nanotechnol, 2006. 6(9-10):
p. 3001-9.
6. Thomas, S.H., M.J. O'Doherty, A. Graham, C.J. Page, P. Blower, D.M.
Geddes, and T.O. Nunan, Pulmonary deposition of nebulised amiloride in
cystic fibrosis: comparison of two nebulisers. Thorax, 1991. 46(10): p. 717-
21.
7. Laube, B.L., Treating diabetes with aerosolized insulin. Chest, 2001. 120(3
Suppl): p. 99S-106S.
8. Laube, B.L., Advances in treating diabetes with aerosolized insulin. Diabetes
Technol Ther, 2002. 4(4): p. 515-8.
9. Yamamoto, H., Y. Kuno, S. Sugimoto, H. Takeuchi, and Y. Kawashima,
Surface-modified PLGA nanosphere with chitosan improved pulmonary
delivery of calcitonin by mucoadhesion and opening of the intercellular tight
junctions. Journal of Control Release, 2005. 102(2): p. 373-81.
10. Yang, T., F. Mustafa, S. Bai, and F. Ahsan, Pulmonary delivery of low
molecular weight heparins. Pharm Res, 2004. 21(11): p. 2009-16.
Bibliography
172
11. Islam, N. and R. Shafiqur, Pulmonary drug delivery: Implication for new
strategy for pharmacotherapy for neurodegenerative disorders. Drug
Discoveries and Therapeutics, 2008a. 2(5): p. 264-276.
12. Groneberg, D.A., C. Witt, U. Wagner, K.F. Chung, and A. Fischer,
Fundamentals of pulmonary drug delivery. Respir Med, 2003. 97(4): p. 382-
7.
13. Brocklebank, D., F. Ram, J. Wright, P. Barry, C. Cates, L. Davies, G.
Douglas, M. Muers, D. Smith, and J. White, Comparison of the effectiveness
of inhaler devices in asthma and chronic obstructive airways disease: a
systematic review of the literature. Health Technol Assess, 2001. 5(26): p. 1-
149.
14. Siddiqui, M.A. and G.L. Plosker, The Novolizer: a multidose dry powder
inhaler. Treat Respir Med, 2005. 4(1): p. 63-9.
15. Bunnag, C., R. Fuangtong, C. Pothirat, and P. Punyaratabandhu, A
comparative study of patients' preferences and sensory perceptions of three
forms of inhalers among Thai asthma and COPD patients. Asian Pac J
Allergy Immunol, 2007. 25(2-3): p. 99-109.
16. Prime, D., P.J. Atkins, A. Slater, and B. Sumby, Review of dry powder
inhalers. Advanced Drug Delivery Reviews, 1997. 26(1): p. 51-58.
17. Hersey, J.A., Letter: Powder mixing by frictional pressure: specific example
of use of ordered mixing. J Pharm Sci, 1974. 63(12): p. 1960-1.
18. Islam, N., P. Stewart, I. Larson, and P. Hartley, Effect of carrier size on the
dispersion of salmeterol xinafoate from interactive mixtures. J Pharm Sci,
2004a. 93(4): p. 1030-8.
19. Frijlink, H.W. and A.H. de Boer, Trends in the technology-driven
development of new inhalation devices. Drug Discovery Today:
Technologies, 2005. 2(1): p. 47-57.
Bibliography
173
20. Chougule, M.B., B.K. Padhi, K.A. Jinturkar, and A. Misra, Development of
Dry Powder Inhalers. Recent Patents on Drug Delivery & Formulation,
2007(1): p. 11-21.
21. Steckel, H. and B.W. Muller, In vitro evaluation of dry powder inhalers I:
drug deposition of commonly used devices. International Journal of
Pharmaceutics, 1997. 154(1): p. 19-29.
22. Smith, I.J. and M. Parry-Billings, The inhalers of the future? A review of dry
powder devices on the market today. Pulmonary Pharmacology &
Therapeutics, 2003. 16(2): p. 79-95.
23. Islam, N., P. Stewart, I. Larson, and P. Hartley, Lactose surface modification
by decantation: are drug-fine lactose ratios the key to better dispersion of
salmeterol xinafoate from lactose-interactive mixtures? Pharm Res, 2004b.
21(3): p. 492-9.
24. Zeng, X.M., G.P. Martin, C. Marriott, and J. Pritchard, The influence of
carrier morphology on drug delivery by dry powder inhalers. International
Journal of Pharmaceutics, 2000. 200(1): p. 93-106.
25. French, D.L., D.A. Edwards, and R.W. Niven, The influence of formulation
on emission, deaggregation and deposition of dry powders for inhalation.
Journal of Aerosol Science, 1996. 27(5): p. 769-783.
26. Steckel, H. and B.W. Müller, In vitro evaluation of dry powder inhalers II:
influence of carrier particle size and concentration on in vitro deposition.
International Journal of Pharmaceutics, 1997. 154(1): p. 31-37.
27. Larhrib, H., X.M. Zeng, G.P. Martin, C. Marriott, and J. Pritchard, The use of
different grades of lactose as a carrier for aerosolised salbutamol sulphate.
International Journal of Pharmaceutics, 1999. 191(1): p. 1-14.
28. Steckel, H. and B.W. Muller, In vitro evaluation of dry powder inhalers II:
influence of carrier particle size and concentration on in vitro deposition.
International Journal of Pharmaceutics, 1997. 154(1): p. 31-37.
Bibliography
174
29. Karhu, M., J. Kuikka, T. Kauppinen, K. Bergström, and M. Vidgren,
Pulmonary deposition of lactose carriers used in inhalation powders.
International Journal of Pharmaceutics, 2000. 196(1): p. 95-103.
30. Kawashima, Y., T. Serigano, T. Hino, H. Yamamoto, and H. Takeuchi, Effect
of surface morphology of carrier lactose on dry powder inhalation property
of pranlukast hydrate. International Journal of Pharmaceutics, 1998. 172(1-
2): p. 179-188.
31. Ganderton, D., D.A.V. Morton, and P. Lucas, Improvements in or relating to
powders. International patent WO/ 00/33811, 2000.
32. Lucas, P., K. Anderson, U.J. Potter, and J.N. Staniforth, Enhancement of
Small Particle Size Dry Powder Aerosol Formulations using an Ultra Low
Density Additive. Pharmaceutical Research, 1999. 16(10): p. 1643-1647.
33. Staniforth, J.N., Performance-Modifying Influences in Dry Powder Inhalation
Systems. Aerosol Science and Technology, 1995. 22(4): p. 346 - 353.
34. Staniforth, J.N., Carrier particles for use in dry powder inhalers.
International patent WO/ 96/23485, 1996.
35. Staniforth, J.N., Improvements in or relating to powders for use in dry
powder inhalers. International patent WO/ 97/03649, 1997.
36. Chew, N.Y., B.Y. Shekunov, H.H. Tong, A.H. Chow, C. Savage, J. Wu, and
H.K. Chan, Effect of amino acids on the dispersion of disodium cromoglycate
powders. Journal of Pharmaceutical Sciences, 2005. 94(10): p. 2289-2300.
37. Yue, B., J. Yang, Y. Wang, C.-Y. Huang, R. Dave, and R. Pfeffer, Particle
encapsulation with polymers via in situ polymerization in supercritical CO2.
Powder Technology, 2004. 146(1-2): p. 32-45.
38. Lahde, A., J. Raula, and E. Kauppinen, I. , Production of L-leucine
nanoparticles under various conditions using an aerosol flow reactor method.
J. Nanomaterials, 2008. 2008: p. 1-9.
Bibliography
175
39. Raula, J., A. Kuivanen, A. Lahde, and E.I. Kauppinen, Gas-phase synthesis of
l-leucine-coated micrometer-sized salbutamol sulphate and sodium chloride
particles. Powder Technology, 2008. 187(3): p. 289-297.
40. Begat, P., R. Price, H. Harris, D. Morton, and J. Staniforth, The Influence of
Force Control Agents on the Cohesive-Adhesive Balance in Dry Powder
Inhaler Formulations. KONA, 2005. 23: p. 109-121.
41. Tee, S.K., C. Marriott, X.M. Zeng, and G.P. Martin, The use of different
sugars as fine and coarse carriers for aerosolised salbutamol sulphate.
International Journal of Pharmaceutics, 2000. 208(1-2): p. 111-123.
42. Jaspart, S., P. Bertholet, G. Piel, J.-M. Dogné, L. Delattre, and B. Evrard,
Solid lipid microparticles as a sustained release system for pulmonary drug
delivery. European Journal of Pharmaceutics and Biopharmaceutics, 2007.
65(1): p. 47-56.
43. Sanna, V., N. Kirschvink, P. Gustin, E. Gavini, I. Roland, L. Delattre, and B.
Evrard, Preparation and in vivo toxicity study of solid lipid microparticles as
carrier for pulmonary administration. AAPS PharmSciTech, 2004. 5(2): p.
27.
44. Steckel, H. and N. Bolzen, Alternative sugars as potential carriers for dry
powder inhalations. International Journal of Pharmaceutics, 2004. 270(1-2):
p. 297-306.
45. Katainen, J., M. Paajanen, E. Ahtola, V. Pore, and J. Lahtinen, Adhesion as
an interplay between particle size and surface roughness. Journal of Colloid
and Interface Science, 2006. 304(2): p. 524-529.
46. Li, Q., V. Rudolph, and W. Peukert, London-van der Waals adhesiveness of
rough particles. Powder Technology, 2006. 161(3): p. 248-255.
47. Podczeck, F., The Influence of Particle Size Distribution and Surface
Roughness of Carrier Particles on the in vitro Properties of Dry Powder
Inhalations. Aerosol Science and Technology, 1999. 31(4): p. 301 - 321.
Bibliography
176
48. Ooi, J., D. Traini, S. Hoe, W. Wong, and P.M. Young, Does carrier size
matter? A fundamental study of drug aerosolisation from carrier based dry
powder inhalation systems. International Journal of Pharmaceutics, 2011.
413(1-2): p. 1-9.
49. Liechty, W.B., D.R. Kryscio, B.V. Slaughter, and N.A. Peppas, Polymers for
Drug Delivery Systems. Annual Review of Chemical and Biomolecular
Engineering, 2010. 1(1): p. 149-173.
50. Emami, J., H. Hamishehkar, A.R. Najafabadi, K. Gilani, M. Minaiyan, H.
Mahdavi, H. Mirzadeh, A. Fakhari, and A. Nokhodchi, Particle size design of
PLGA microspheres for potential pulmonary drug delivery using response
surface methodology. Journal of Microencapsulation, 2009. 26(1): p. 1-8.
51. Arnold, M.M., E.M. Gorman, L.J. Schieber, E.J. Munson, and C. Berkland,
NanoCipro encapsulation in monodisperse large porous PLGA
microparticles. Journal of Controlled Release, 2007. 121(1-2): p. 100-109.
52. Celebi, N., N. Erden, and A. Türkyilmaz, The preparation and evaluation of
salbutamol sulphate containing poly(lactic acid-co-glycolic acid)
microspheres with factorial design-based studies. International Journal of
Pharmaceutics, 1996. 136(1-2): p. 89-100.
53. Coowanitwong, I., V. Arya, G. Patel, W.S. Kim, V. Craciun, J.R. Rocca, R.
Singh, and G. Hochhaus, Laser-ablated nanofunctional polymers for the
formulation of slow-release powders for dry powder inhalers:
physicochemical characterization and slow-release characteristics. J Pharm
Pharmacol, 2007. 59(11): p. 1473-84.
54. Erden, N. and N. Celebi, Factors influencing release of salbutamol sulphate
from poly(lactide-co-glycolide) microspheres prepared by water-in-oil-in-
water emulsion technique. International Journal of Pharmaceutics, 1996.
137(1): p. 57-66.
55. Singh, R.K., W.S. Kim, M. Ollinger, V. Craciun, I. Coowantwong, G.
Hochhaus, and N. Koshizaki, Laser based synthesis of nanofunctionalized
Bibliography
177
particulates for pulmonary based controlled drug delivery applications.
Applied Surface Science, 2002. 197-198: p. 610-614.
56. Scheuch, G., M.J. Kohlhaeufl, P. Brand, and R. Siekmeier, Clinical
perspectives on pulmonary systemic and macromolecular delivery. Advanced
Drug Delivery Reviews, 2006. 58(9-10): p. 996-1008.
57. Byron, P.R., Prediction of drug residence times in regions of the human
respiratory tract following aerosol inhalation. J Pharm Sci, 1986. 75(5): p.
433-8.
58. Martini, F.H., Ober W.C., Garrison, C.W., Hutchings, R.T., Fundamentals of
anatomy and physiology. 7th edition ed. 2006, San Francisco: Pearson
Education Inc, Benjamin Cummings. 814-815.
59. Tortora, G., Principles of Human Anatomy. 5th edition ed. 1989, New York:
Harper Collins. 636.
60. Rang, H.P., M.M. Dale, and J.M. Ritter, Pharmacology. 4th edition ed. The
Respiratory System. 1999, Edinburgh: Harcourt Publishers Ltd. 338-350.
61. Sweetman, S.C., Martindale-The Complete Drug reference. 35th ed, London:
Pharmaceutical Press. 997.
62. Darquenne, C., Particle deposition in the lung, in Encyclopedia of
Respiratory Medicine, J.L. Geoffrey and D.S. Steven, Editors. 2006,
Academic Press: Oxford. p. 300-304.
63. Gonda, I., Aerosols for delivery of therapeutic and diagnostic agents to the
respiratory tract. Critical Reviews in Therapeutic Drug Carrier Systems,
1990. 6(4): p. 273-313.
64. Stuart, B.O., Deposition and clearance of inhaled particles. Environmental
Health Perspectives, 1984. 55: p. 369-90.
65. Telko, M.J. and A.J. Hickey, Dry powder inhaler formulation. Respir Care,
2005. 50(9): p. 1209-27.
Bibliography
178
66. Srichana, T., G.P. Martin, and C. Marriott, Dry powder inhalers: The
influence of device resistance and powder formulation on drug and lactose
deposition in vitro. European Journal of Pharmaceutical Sciences, 1998. 7(1):
p. 73-80.
67. Freedman, T., Medihaler therapy for bronchial asthma; a new type of aerosol
therapy. Postgrad Med, 1956. 20(6): p. 667-73.
68. Altounyan, R.E.C., Inhibition of experimental asthma by a new compound-
disodium cromoglycate. Intal. Acta Allergol 1967(22): p. 487-489.
69. Geller, D.E., Comparing clinical features of the nebulizer, metered-dose
inhaler, and dry powder inhaler. Respir Care, 2005. 50(10): p. 1313-21;
discussion 1321-2.
70. Islam, N. and E. Gladki, Dry powder inhalers (DPIs)--A review of device
reliability and innovation. International Journal of Pharmaceutics, 2008b.
360(1-2): p. 1-11.
71. Hickey, A.J. and N.M. Concessio, Descriptors of irregular particle
morphology and powder properties. Advanced Drug Delivery Reviews, 1997.
26(1): p. 29-40.
72. Zeng, X.M., G.P. Martin, S.-K. Tee, and C. Marriott, The role of fine particle
lactose on the dispersion and deaggregation of salbutamol sulphate in an air
stream in vitro. International Journal of Pharmaceutics, 1998. 176(1): p. 99-
110.
73. Lucas, P., K. Anderson, and J.N. Staniforth, Protein Deposition from Dry
Powder Inhalers: Fine Particle Multiplets as Performance Modifiers.
Pharmaceutical Research, 1998. 15(4): p. 562-569.
74. Timsina, M.P., G.P. Martin, C. Marriott, D. Ganderton, and M. Yianneskis,
Drug delivery to the respiratory tract using dry powder inhalers.
International Journal of Pharmaceutics, 1994. 101(1-2): p. 1-13.
Bibliography
179
75. Bérard, V., E. Lesniewska, C. Andrès, D. Pertuy, C. Laroche, and Y.
Pourcelot, Dry powder inhaler: influence of humidity on topology and
adhesion studied by AFM. International Journal of Pharmaceutics, 2002a.
232(1-2): p. 213-224.
76. Ferron, G.A., Aerosol properties and lung deposition. Eur Respir J, 1994.
7(8): p. 1392-4.
77. Aiache, J.M., Les préparations pour inhalation. S. T. P. Pharma, 1990. 6(10):
p. 753-761.
78. Saint-Lorant, G., P. Leterme, A. Gayot, and M.P. Flament, Influence of
carrier on the performance of dry powder inhalers. International Journal of
Pharmaceutics, 2007. 334(1-2): p. 85-91.
79. Wynn, E. and S. Nichols, Importance of Wall Collisions for Particle-Particle
Detachment in Dry Powder Inhalers and Advanced Wall Collision Models, in
Drug Delivery to the lungs 19. 2008: Scotland, UK.
80. de Boer, A.H., P. Hagedoorn, D. Gjaltema, J. Goede, and H.W. Frijlink, Air
classifier technology (ACT) in dry powder inhalation: Part 1. Introduction of
a novel force distribution concept (FDC) explaining the performance of a
basic air classifier on adhesive mixtures. International Journal of
Pharmaceutics, 2003a. 260(2): p. 187-200.
81. Donovan, M.J., S.H. Kim, V. Raman, and H.D. Smyth, Dry powder inhaler
device influence on carrier particle performance. Journal of Pharmaceutical
Sciences, 2011.
82. Voss, A. and W.H. Finlay, Deagglomeration of dry powder pharmaceutical
aerosols. International Journal of Pharmaceutics, 2002. 248(1-2): p. 39-50.
83. Zanen, P., L.T. Go, and J.-W.J. Lammers, The optimal particle size for
parasympathicolytic aerosols in mild asthmatics. International Journal of
Pharmaceutics, 1995. 114(1): p. 111-115.
Bibliography
180
84. Zanen, P., L.T. Go, and J.W. Lammers, Optimal particle size for beta 2
agonist and anticholinergic aerosols in patients with severe airflow
obstruction. Thorax, 1996. 51(10): p. 977-80.
85. Usmani, O.S., M.F. Biddiscombe, J.A. Nightingale, S.R. Underwood, and P.J.
Barnes, Effects of bronchodilator particle size in asthmatic patients using
monodisperse aerosols. J Appl Physiol, 2003. 95(5): p. 2106-2112.
86. Zanen, P., L.T. Go, and J.-W.J. Lammers, The optimal particle size for
[beta]-adrenergic aerosols in mild asthmatics. International Journal of
Pharmaceutics, 1994. 107(3): p. 211-217.
87. Bates, D.V., B.R. Fish, T.F. Hatch, T.T. Mercer, and P.E. Morrow,
Deposition and retention models for internal dosimetry of the human
respiratory tract. Task group on lung dynamics. Health Physics, 1966. 12(2):
p. 173-207.
88. Carvalho, T.C., J.I. Peters, and R.O. Williams Iii, Influence of particle size on
regional lung deposition - What evidence is there? International Journal of
Pharmaceutics, 2011. 406(1-2): p. 1-10.
89. Louey, M.D., S. Razia, and P.J. Stewart, Influence of physico-chemical
carrier properties on the in vitro aerosol deposition from interactive
mixtures. International Journal of Pharmaceutics, 2003. 252(1-2): p. 87-98.
90. Podczeck, F., The relationship between physical properties of lactose
monohydrate and the aerodynamic behaviour of adhered drug particles.
International Journal of Pharmaceutics, 1998. 160(1): p. 119-130.
91. Srichana, T., G.P. Martin, and C. Marriott, On the relationship between drug
and carrier deposition from dry powder inhalers in vitro. International
Journal of Pharmaceutics, 1998. 167(1-2): p. 13-23.
92. Corn, M., The adhesion of solid particles to solid surfaces. I. A review. J Air
Pollut Control Assoc, 1961a. 11: p. 523-8.
Bibliography
181
93. Kendall, K., Adhesion: Molecules and Mechanics. Science, 1994. 263(5154):
p. 1720-1725.
94. Bell, J.H., P.S. Hartley, and J.S.G. Cox, Dry powder aerosols I: A new
powder inhalation device. Journal of Pharmaceutical Sciences, 1971. 60(10):
p. 1559-1564.
95. Ganderton, D., The generation of respirable clouds from coarse powder
aggregates. Journal of Biopharmaceutical Sciences, 1992. 3: p. 101-105.
96. Gilani, K., A.R. Najafabadi, M. Darabi, M. Barghi, and M. Rafiee-Tehrani,
Influence of formulation variables and inhalation device on the deposition
profiles of cromolyn sodium dry powder aerosols DARU 2004. 12(3): p. 123-
130.
97. Kassem, N.M., K.K.L. Ho, and D. Ganderton, The effect of air flow and
carrier size on the characteristics of an inspirable cloud. J. Pharm.
Pharmacol. , 1989. 41: p. 14P.
98. Cline, D. and R. Dalby, Predicting the Quality of Powders for Inhalation
from Surface Energy and Area. Pharmaceutical Research, 2002. 19(9): p.
1274-1277.
99. de Boer, A.H., P. Hagedoorn, D. Gjaltema, J. Goede, K.D. Kussendrager, and
H.W. Frijlink, Air classifier technology (ACT) in dry powder inhalation Part
2. The effect of lactose carrier surface properties on the drug-to-carrier
interaction in adhesive mixtures for inhalation. International Journal of
Pharmaceutics, 2003b. 260(2): p. 201-216.
100. Byron, P., Jashnani, R. and Germain, S., Efficiency of aerosolization from dry
powder blends of terbutaline sulfate and lactose NF with different particle
size distribution. Pharm. Res, 1980. 7: p. S81.
101. Hamishehkar, H., J. Emami, A.R. Najafabadi, K. Gilani, M. Minaiyan, H.
Mahdavi, and A. Nokhodchi, Influence of carrier particle size, carrier ratio
and addition of fine ternary particles on the dry powder inhalation
Bibliography
182
performance of insulin-loaded PLGA microcapsules. Powder Technology,
2010. 201(3): p. 289-295.
102. Chew, N.Y. and H.K. Chan, Effect of powder polydispersity on aerosol
generation. Journal of Pharmacy and Pharmaceutical Sciences, 2002. 5(2): p.
162-8.
103. Fults, K.A., I.F. Miller, and A.J. Hickey, Effect of Particle Morphology on
Emitted Dose of Fatty Acid-Treated Disodium Cromoglycate Powder
Aerosols. Pharmaceutical Development and Technology, 1997. 2(1): p. 67-
79.
104. Rumpf, H., Particle Technology. 1990, London: Chapman and hall. 162-163.
105. Dunbar, C.A.H., A. J.; Holzner, P., Dispersion and Characterization of
Pharmaceutical Dry Powder Aerosols. Kona, 1998. 16: p. 7-45.
106. Braun, M.A., R. Oschmann, and P.C. Schmidt, Influence of excipients and
storage humidity on the deposition of disodium cromoglycate (DSCG) in the
Twin Impinger. International Journal of Pharmaceutics, 1996. 135(1-2): p. 53-
62.
107. Maggi, L., R. Bruni, and U. Conte, Influence of the moisture on the
performance of a new dry powder inhaler. International Journal of
Pharmaceutics, 1999. 177(1): p. 83-91.
108. Shoyele, S.A. and S. Cawthorne, Particle engineering techniques for inhaled
biopharmaceuticals. Advanced Drug Delivery Reviews, 2006. 58(9-10): p.
1009-1029.
109. Chan, H.-K., What is the role of particle morphology in pharmaceutical
powder aerosols? Expert Opinion on Drug Delivery, 2008. 5(8): p. 909-914.
110. Heng, P.W., L.W. Chan, and L.T. Lim, Quantification of the surface
morphologies of lactose carriers and their effect on the in vitro deposition of
salbutamol sulphate. Chemical and Pharmaceutical Bulletin, 2000. 48(3): p.
393-8.
Bibliography
183
111. Larhrib, H., G.P. Martin, C. Marriott, and D. Prime, The influence of carrier
and drug morphology on drug delivery from dry powder formulations.
International Journal of Pharmaceutics, 2003. 257(1-2): p. 283-296.
112. Young, P.M., D. Cocconi, P. Colombo, R. Bettini, R. Price, D.F. Steele, and
M.J. Tobyn, Characterization of a surface modified dry powder inhalation
carrier prepared by "particle smoothing". Journal of Pharmacy and
Pharmacology, 2002. 54: p. 1339-1344.
113. Chan, L.W., L.T. Lim, and P.W. Heng, Immobilization of fine particles on
lactose carrier by precision coating and its effect on the performance of dry
powder formulations. Journal of Pharmaceutical Sciences, 2003. 92(5): p.
975-84.
114. Adi, H., D. Traini, H.-K. Chan, and P. M.Young, The influence of drug
morphology on aerosolisation efficiency of dry powder inhaler formulations.
Journal of Pharmaceutical Sciences, 2008. 97(7): p. 2780-2788.
115. Hickey, A.J., K.A. Fults, and R.S. Pillai, Use of particle morphology to
influence the delivery of drugs from dry powder aerosols. Journal of
Biopharmaceutical Sciences, 1992. 3: p. 107-113.
116. Chew, N.Y.K. and H.-K. Chan, Use of Solid Corrugated Particles to
Enhance Powder Aerosol Performance. Pharmaceutical Research, 2001.
18(11): p. 1570-1577.
117. Chew, N.Y., P. Tang, H.K. Chan, and J.A. Raper, How much particle surface
corrugation is sufficient to improve aerosol performance of powders?
Pharmaceutical Research, 2005. 22(1): p. 148-52.
118. Kawashima, Y., T. Serigano, T. Hino, H. Yamamoto, and H. Takeuchi, A
New Powder Design Method to Improve Inhalation Efficiency of Pranlukast
Hydrate Dry Powder Aerosols by Surface Modification with
Hydroxypropylmethylcellulose Phthalate Nanospheres. Pharmaceutical
Research, 1998. 15(11): p. 1748-1752.
Bibliography
184
119. Louey, M.D., P. Mulvaney, and P.J. Stewart, Characterisation of adhesional
properties of lactose carriers using atomic force microscopy. Journal of
Pharmaceutical and Biomedical Analysis, 2001. 25(3-4): p. 559-567.
120. Stewart, P.J., Particle interaction in pharmaceutical systems. Pharmacy
International, 1986. 7(6): p. 146-149.
121. Finot, E.L., J.-C Mutin, S.H. Hosain and J.-P. Goudonnet, Contact force
dependence on relative humidity: investigation using atomic force Scanning
Microscopy, 1996. 10: p. 697-708.
122. Ripperger, S. and K. Hein, Measurement of adhesion forces between particles
and rough substrates in air with the vibration method. KONA, 2004. 22: p.
121-133.
123. Okada, J., Y. Matsuda, and Y. Fukumori, Measurement of the adhesive force
of pharmaceutical powders by the centrifugal method. I. Yakugaku Zasshi,
1969. 89(11): p. 1539-44.
124. Okada, J., Y. Matsuda, and Y. Fukumori, Measurement of the adhesive force
of pharmaceutical powders by the centrifugal method. II. Relation between
the surface condition of substrates and the separation force-particle residue
curves. Yakugaku Zasshi, 1971. 91(11): p. 1207-10.
125. Otsuka, A., Iida, K. , Danjo, K. , Sunada, H., Measurements of the adhesive
force between particles of powdered organic substances and a glass substrate
by means of the impact separation method. II. Effect of addition of light
anhydrous silicic acid on the adhesive force of potato starch. Chemical
pharmaceutical bulletin, 1985. 33(9): p. 4054-4056.
126. Corn, M., The adhesion of solid particles to solid surfaces. II. Journal of the
Air Pollution Control Association, 1961a. 11: p. 566-75.
127. Ducker, W.A., T.J. Senden, and R.M. Pashley, Direct measurement of
colloidal forces using an atomic force microscope. Nature, 1991. 353(6341):
p. 239-241.
Bibliography
185
128. Binnig, G., C.F. Quate, and C. Gerber, Atomic force microscope. Physical
Review Letters, 1986. 56(9): p. 930-933.
129. Butt, H.-J., B. Cappella, and M. Kappl, Force measurements with the atomic
force microscope: Technique, interpretation and applications. Surface
Science Reports, 2005. 59(1-6): p. 1-152.
130. Nanda, K.K., S.N. Sarangi, and S.N. Sahu, Measurement of surface
roughness by atomic force microscopy and Rutherford backscattering
spectrometry of CdS nanocrystalline films. Applied Surface Science, 1998.
133(4): p. 293-297.
131. Bunker, M., M. Davies, and C. Roberts, Towards screening of inhalation
formulations: measuring interactions with atomic force microscopy. Expert
Opinion on Drug Delivery, 2005. 2(4): p. 613-624.
132. Begat, P., P. Young, M. , S. Edge, J.S. Kaerger, and R. Price The effect of
mechanical processing on surface stability of pharmaceutical powders:
Visualization by atomic force microscopy. Journal of Pharmaceutical
Sciences, 2003. 92(3): p. 611-620.
133. Islam, N., P. Stewart, I. Larson, and P. Hartley, Surface roughness
contribution to the adhesion force distribution of salmeterol xinafoate on
lactose carriers by atomic force microscopy. Journal of Pharmaceutical
Sciences, 2005. 94(7): p. 1500-1511.
134. Hooton, J.C., M.D. Jones, and R. Price, Predicting the behavior of novel
sugar carriers for dry powder inhaler formulations via the use of a cohesive–
adhesive force balance approach. Journal of Pharmaceutical Sciences, 2006.
95(6): p. 1288-1297.
135. Traini, D., P.M. Young, M. Jones, S. Edge, and R. Price, Comparative study
of erythritol and lactose monohydrate as carriers for inhalation: Atomic force
microscopy and in vitro correlation. European Journal of Pharmaceutical
Sciences, 2006. 27(2-3): p. 243-251.
Bibliography
186
136. Strathmann, S.C., M.A. Murphy, B.A. Goeckner, P.W. Carter, and J.-B.D.
Green, Forces between insulin microspheres and polymers surfaces for a dry
powder inhaler. International Journal of Pharmaceutics, 2009. 372(1-2): p.
147-153.
137. Lam, K.K. and J.M. Newton, Influence of particle size on the adhesion
behaviour of powders, after application of an initial press-on force. Powder
technology 1992a. 73(2): p. 117-125.
138. Mullins , M.E., L.P. Michaels, V. Menon, B. Locke, and M.B. Ranade, Effect
of Geometry on Particle Adhesion Aerosol Science and Technology, 1992.
17(2): p. 105 - 118
139. Rowley, G., Quantifying electrostatic interactions in pharmaceutical solid
systems. International Journal of Pharmaceutics, 2001. 227(1-2): p. 47-55.
140. Lam, K.K. and J.M. Newton Effect of temperature on particulate solid
adhesion to a substrate surface. Powder Technology 1992b. 73(3): p. 267-
274.
141. Lam, K.K. and J.M. Newton, The influence of the time of application of
contact pressure on particle adhesion to a substrate surface
Powder Technology, 1993. 76(2): p. 149-154.
142. Attard, P. and J.L. Parker, Deformation and adhesion of elastic bodies in
contact. Physical Review A, 1992. 46(12): p. 7959.
143. Corn, M., The adhesion of solid particles to solid surfaces. I. A review.
Journal of the Air Pollution Control Association, 1961b. 11: p. 523-8.
144. Kulvanich, P. and P.J. Stewart, The effect of particle size and concentration
on the adhesive characteristics of a model drug-carrier interactive system.
Journal of Pharmacy and Pharmacology, 1987. 39(9): p. 673-678.
145. Podczeck, F., The relationship between particulate properties of carrier
materials and the adhesion force of drug particles in interactive powder
Bibliography
187
mixtures. Journal of Adhesion Science and Technology, 1997. 11: p. 1089-
1104.
146. Grimsey, I.M., J.C. Feeley, and P. York, Analysis of the surface energy of
pharmaceutical powders by inverse gas chromatography. Journal of
Pharmaceutical Sciences, 2002. 91(2): p. 571-583.
147. James, J., B. Crean, M. Davies, R. Toon, P. Jinks, and C.J. Roberts, The
surface characterisation and comparison of two potential sub-micron, sugar
bulking excipients for use in low-dose, suspension formulations in metered
dose inhalers. International Journal of Pharmaceutics, 2008. 361(1-2): p. 209-
221.
148. Sethuraman, V.V. and A.J. Hickey, Powder properties and their influence on
dry powder inhaler delivery of an antitubercular drug. AAPS PharmSciTech,
2002. 3(4): p. E28.
149. Shekunov, B., P. Chattopadhyay, H. Tong, and A. Chow, Particle Size
Analysis in Pharmaceutics: Principles, Methods and Applications.
Pharmaceutical Research, 2007. 24(2): p. 203-227.
150. Shekunov, B.Y., J.C. Feeley, A.H.L. Chow, H.H.Y. Tong, and P. York,
Physical properties of supercritically-processed and micronised powders for
respiratory drug delivery. KONA, 2002. 20: p. 178-187.
151. Traini, D., P.M. Young, F. Thielmann, and M. Acharya, The Influence of
Lactose Pseudopolymorphic Form on Salbutamol Sulfate-Lactose
Interactions in DPI Formulations. Drug Development and Industrial
Pharmacy, 2008. 34(9): p. 992 - 1001.
152. Schiavone, H., S. Palakodaty, A. Clark, P. York, and S.T. Tzannis,
Evaluation of SCF-engineered particle-based lactose blends in passive dry
powder inhalers. International Journal of Pharmaceutics, 2004. 281(1-2): p.
55-66.
153. Tong, H.H., B.Y. Shekunov, P. York, and A.H. Chow, Predicting the aerosol
performance of dry powder inhalation formulations by interparticulate
Bibliography
188
interaction analysis using inverse gas chromatography. Journal of
Pharmaceutical Sciences, 2006. 95(1): p. 228-33.
154. Jiang, R.G., P.W. Zhang, L.Q. Wang, H. Liu, W.S. Pan, and C.L. Wang,
Effect of surface modification on surface energy of lactose and performance
of dry powder inhalations. Yao Xue Xue Bao (Acta Pharmaceutica Sinica),
2005. 40(4): p. 373-6.
155. Saleem, I., H. Smyth, and M. Telko, Prediction of Dry Powder Inhaler
Formulation Performance From Surface Energetics and Blending Dynamics.
Drug Development and Industrial Pharmacy, 2008. 34(9): p. 1002-1010.
156. Das, S., I. Larson, P. Young, and P. Stewart, Surface energy changes and
their relationship with the dispersibility of salmeterol xinafoate powders for
inhalation after storage at high RH. European Journal of Pharmaceutical
Sciences, 2009. 38(4): p. 347-354.
157. Bérard, V., E. Lesniewska, C. Andrès, D. Pertuy, C. Laroche, and Y.
Pourcelot, Affinity scale between a carrier and a drug in DPI studied by
atomic force microscopy. International Journal of Pharmaceutics, 2002b.
247(1-2): p. 127-137.
158. Tsukada, M., R. Irie, Y. Yonemochi, R. Noda, H. Kamiya, W. Watanabe, and
E.I. Kauppinen, Adhesion force measurement of a DPI size pharmaceutical
particle by colloid probe atomic force microscopy. Powder Technology,
2004. 141(3): p. 262-269.
159. Price, R., P.M. Young, S. Edge, and J.N. Staniforth, The influence of relative
humidity on particulate interactions in carrier-based dry powder inhaler
formulations. International Journal of Pharmaceutics, 2002. 246(1-2): p. 47-
59.
160. Dey, F.K., J.A.S. Cleaver, and P.A. Zhdan, Atomic force microscopy study of
adsorbed moisture on lactose particles. Advanced Powder Technology, 2000.
11(4): p. 401-413.
Bibliography
189
161. Podczeck, F., J.M. Newton, and M.B. James, The influence of constant and
changing relative humidity of the air on the autoadhesion force between
pharmaceutical powder particles. International Journal of Pharmaceutics,
1996. 145(1-2): p. 221-229.
162. Hooton, J., C. German, S. Allen, M. Davies, C. Roberts, S. Tendler, and P.
Williams, An Atomic Force Microscopy Study of the Effect of Nanoscale
Contact Geometry and Surface Chemistry on the Adhesion of Pharmaceutical
Particles. Pharmaceutical Research, 2004. 21(6): p. 953-961.
163. Young, P.M., R. Price, M.J. Tobyn, M. Buttrum, and F. Dey, The influence of
relative humidity on the cohesion properties of micronized drugs used in
inhalation therapy. Journal of Pharmaceutical Sciences, 2004. 93(3): p. 753-
761.
164. Young, P.M., R. Price, M.J. Tobyn, M. Buttrum, and F. Dey, Investigation
into the effect of humidity on drug–drug interactions using the atomic force
microscope. Journal of Pharmaceutical Sciences, 2003. 92(4): p. 815-822.
165. Young, P.M., M.J. Tobyn, R. Price, M. Buttrum, and F. Dey, The use of
colloid probe microscopy to predict aerosolization performance in dry
powder inhalers: AFM and in vitro correlation. Journal of Pharmaceutical
Sciences, 2006. 95(8): p. 1800-1809.
166. Beach, E.R., G.W. Tormoen, J. Drelich, and R. Han, Pull-off Force
Measurements between Rough Surfaces by Atomic Force Microscopy. Journal
of Colloid and Interface Science, 2002. 247(1): p. 84-99.
167. Meine, K., K. Kloß, T. Schneider, and D. Spaltmann, The influence of surface
roughness on the adhesion force. Surface and Interface Analysis, 2004. 36(8):
p. 694-697.
168. Mizes, H.A., Surface roughness and particle adhesion. Journal of Adhesion
1995. 51: p. 155-165.
Bibliography
190
169. Adi, S., H. Adi, P. Tang, D. Traini, H.-k. Chan, and P.M. Young, Micro-
particle corrugation, adhesion and inhalation aerosol efficiency. European
Journal of Pharmaceutical Sciences, 2008. 35(1-2): p. 12-18.
170. Eve, J.K., N. Patel, S.Y. Luk, S.J. Ebbens, and C.J. Roberts, A study of single
drug particle adhesion interactions using atomic force microscopy.
International Journal of Pharmaceutics, 2002. 238(1-2): p. 17-27.
171. Rabinovich, Y.I., J.J. Adler, A. Ata, R.K. Singh, and B.M. Moudgil, Adhesion
between Nanoscale Rough Surfaces: I. Role of Asperity Geometry. Journal of
Colloid and Interface Science, 2000a. 232(1): p. 10-16.
172. Rabinovich, Y.I., J.J. Adler, A. Ata, R.K. Singh, and B.M. Moudgil, Adhesion
between Nanoscale Rough Surfaces: II. Measurement and Comparison with
Theory. Journal of Colloid and Interface Science, 2000b. 232(1): p. 17-24.
173. Quon, R.A., A. Ulman, and T.K. Vanderlick, Impact of Humidity on Adhesion
between Rough Surfaces. Langmuir 2000. 16: p. 8912-8916.
174. Podczeck, F., J.M. Newton, and M.B. James, The estimation of the true area
of contact between microscopic particles and a flat surface in adhesion
contact. Journal of Applied Physics, 1996. 79(3): p. 1458-1463.
175. Iida, K., Y. Hayakawa, H. Okamoto, K. Danjo, and H. Leuenberger,
Preparation of dry powder inhalation by surface treatment of lactose carrier
particles. Chem Pharm Bull (Tokyo), 2003a. 51(1): p. 1-5.
176. Flament, M.-P., P. Leterme, and A. Gayot, The influence of carrier roughness
on adhesion, content uniformity and the in vitro deposition of terbutaline
sulphate from dry powder inhalers. International Journal of Pharmaceutics,
2004. 275(1-2): p. 201-209.
177. Podczeck, F., J. Newton, and M. James, Assessment of adhesion and
autoadhesion forces between particles and surfaces: I. The investigation of
autoadhesion phenomena of salmeterol xinafoate and lactose monohydrate
particles using compacted powder surfaces. Journal of Adhesion Science and
Technology, 1994. 8(12): p. 1459-1472.
Bibliography
191
178. Podczeck, F., J.M. Newton, and M.B. James, Assessment of adhesion and
autoadhesion forces between particles and surfaces. Part II. The
investigation of adhesion phenomena of Salmeterol Xinafoate and lactose
monohydrate particles in particle-on-particle and particle-on-surface
contact. Journal of Adhesion Science and Technology, 1995b. 9: p. 475-486.
179. Podczeck, F., Adhesion forces in interactive powder mixtures of a micronized
drug and carrier particles of various particle size distributions. Journal of
Adhesion Science and Technology, 1998. 12: p. 1323-1339.
180. Zeng, M.X., G.P. Martin, C. Marriott, and J. Pritchard, The use of lactose
recrystallised from carbopol gels as a carrier for aerosolised salbutamol
sulphate. European Journal of Pharmaceutics and Biopharmaceutics, 2001.
51(1): p. 55-62.
181. Stewart, P., Infleunce of magnesium stearate on the homogeneity of a
prednisolone-granule ordered mix. Drug Development and Pharmacy, 1981.
7(5): p. 485-495.
182. Bolhuis, G.K., C.F. Lerk, H.T. Zijlstra, and A.H. De Boer, Fil formation by
magnesium stearate during mixing and its effect on tabletting. Pharm.
Weekbl., 1975: p. 110.
183. Gold, G., R.N. Duvall, B.T. Palermo, and J.G. Slater, Powder flow studies III.
Factors affecting the flow of lactose granules. Journal of Pharmaceutical
Sciences, 1968. 57(4): p. 667-671.
184. Guchardi, R., M. Frei, E. John, and J.S. Kaerger, Influence of fine lactose and
magnesium stearate on low dose dry powder inhaler formulations.
International Journal of Pharmaceutics, 2008. 348(1-2): p. 10-17.
185. DesRosiers Lachiver, E., N. Abatzoglou, L. Cartilier, and J.-S. Simard,
Insights into the Role of Electrostatic Forces on the Behavior of Dry
Pharmaceutical Particulate Systems. Pharmaceutical Research, 2006. 23(5):
p. 997-1007.
Bibliography
192
186. Weber, D., Y. Pu, and C.L. Cooney, Quantification of Lubricant Activity of
Magnesium Stearate by Atomic Force Microscopy. Drug Development and
Industrial Pharmacy, 2008. 34(10): p. 1097 - 1099.
187. Begat, P., D.A.V. Morton, J. Shur, P. Kippax, J.N. Staniforth, and R. Price,
The role of force control agents in high-dose dry powder inhaler
formulations. Journal of Pharmaceutical Sciences, 2009. 98(8): p. 2770-2783.
188. Islam, N., A. Rashid, and G. Camm, Effects of magnesium stearate on the
efficient dispersion of Salbutamol Sulfate from carrier-based dry powder
inhaler formulations, in Respiratory Drug Delivery, Europe 2011. 2011.
189. Iida, K., Y. Hayakawa, H. Okamoto, K. Danjo, and H. Luenberger, Effect of
surface layering time of lactose carrier particles on dry powder inhalation
properties of salbutamol sulfate. Chem Pharm Bull (Tokyo), 2004a. 52(3): p.
350-3.
190. Tay, T., S. Das, and P. Stewart, Magnesium stearate increases salbutamol
sulphate dispersion: What is the mechanism? International Journal of
Pharmaceutics, 2010. 383(1-2): p. 62-69.
191. Lechuga-Ballesteros, D. and M.-C. Kuok, Dry powder compositions having
improved dispersivity. International patent WO/ 01/32144, 2001.
192. Staniforth, J.N., S. Cryer, H.A. Ahmed, and S.P. Davies, Aspects of
pharmaceutical tribology. Drug Development and Industrial Pharmacy, 1989.
15: p. 2265-2294.
193. Najafabadi, A.R., K. Gilani, M. Barghi, and M. Rafiee-Tehrani, The effect of
vehicle on physical properties and aerosolisation behaviour of disodium
cromoglycate microparticles spray dried alone or with L-leucine.
International Journal of Pharmaceutics, 2004. 285(1-2): p. 97-108.
194. You, Y., M. Zhao, G. Liu, and X. Tang, Physical characteristics and
aerosolization performance of insulin dry powders for inhalation prepared by
a spray drying method. Journal of Pharmacy and Pharmacology, 2007. 59(7):
p. 927-934.
Bibliography
193
195. Ren, Y., C. Yu, K. Meng, and X. Tang, Influence of formulation and
preparation process on ambroxol hydrochloride dry powder inhalation
characteristics and aerosolization properties. Drug Development and
Industrial Pharmacy, 2008. 34(9): p. 984-91.
196. Prota, L., A. Santoro, M. Bifulco, R.P. Aquino, T. Mencherini, and P. Russo,
Leucine enhances aerosol performance of Naringin dry powder and its
activity on cystic fibrosis airway epithelial cells. International Journal of
Pharmaceutics, 2011. 412(1-2): p. 8-19.
197. Paajanen, M., J. Katainen, J. Raula, E.I. Kauppinen, and J. Lahtinen, Direct
evidence on reduced adhesion of Salbutamol sulphate particles due to L-
leucine coating. Powder Technology, 2009. 192(1): p. 6-11.
198. Raula, J., J.A. Kurkela, D.P. Brown, and E.I. Kauppinen, Study of the
dispersion behaviour of l-leucine containing microparticles synthesized with
an aerosol flow reactor method. Powder Technology, 2007. 177(3): p. 125-
132.
199. Raula, J., A. Lähde, and E.I. Kauppinen, Aerosolization behavior of carrier-
free l-leucine coated salbutamol sulphate powders. International Journal of
Pharmaceutics, 2009. 365(1-2): p. 18-25.
200. Raula, J., F. Thielmann, M. Naderi, V.-P. Lehto, and E.I. Kauppinen,
Investigations on particle surface characteristics vs. dispersion behaviour of
l-leucine coated carrier-free inhalable powders. International Journal of
Pharmaceutics, 2010. 385(1-2): p. 79-85.
201. Louey, M.D. and P.J. Stewart, Particle Interactions Involved in Aerosol
Dispersion of Ternary Interactive Mixtures. Pharmaceutical Research, 2002.
19(10): p. 1524-1531.
202. Jones, M.D., R. Price, J.C. Hooton, M.L. Dawson, and A.R. Ferrie, Using
AFM to investigate how fines improve DPI performance. Proceedings of
Drug Delivery to Lungs, The Aerosol Society, Edinburgh, UK, 2005. 16: p.
11-14.
Bibliography
194
203. Iida, K., Y. Hayakawa, H. Okamoto, K. Danjo, and H. Luenbergerb, Effect of
surface covering of lactose carrier particles on dry powder inhalation
properties of salbutamol sulfate. Chem Pharm Bull (Tokyo), 2003b. 51(12):
p. 1455-7.
204. Iida, K., Y. Inagaki, H. Todo, H. Okamoto, K. Danjo, and H. Luenberger,
Effects of surface processing of lactose carrier particles on dry powder
inhalation properties of salbutamol sulfate. Chem Pharm Bull (Tokyo),
2004b. 52(8): p. 938-42.
205. El-Sabawi, D., S. Edge, R. Price, and P.M. Young, Continued investigation
into the influence of loaded dose on the performance of dry powder inhalers:
surface smoothing effects. Drug Dev Ind Pharm, 2006. 32(10): p. 1135-8.
206. Young, P., P. Kwok, H. Adi, H.-K. Chan, and D. Traini, Lactose Composite
Carriers for Respiratory Delivery. Pharmaceutical Research, 2009. 26(4): p.
802-810.
207. Zeng, X.M., G.P. Martin, C. Marriott, and J. Pritchard, Crystallization of
Lactose from Carbopol Gels. Pharmaceutical Research, 2000a. 17(7): p. 879-
886.
208. Dhumal, R., S. Biradar, A. Paradkar, and P. York, Ultrasound Assisted
Engineering of Lactose Crystals. Pharmaceutical Research, 2008. 25(12): p.
2835-2844.
209. Zeng, X.-M., G.P. Martin, C. Marriott, and J. Pritchard, Lactose as a carrier
in dry powder formulations: The influence of surface characteristics on drug
delivery. Journal of Pharmaceutical Sciences, 2001a. 90(9): p. 1424-1434.
210. Malcolmson, R.J. and J.K. Embleton, Dry powder formulations for
pulmonary delivery. Pharmaceutical Science & Technology Today, 1998.
1(9): p. 394-398.
211. Momin, M.-N., A. Hedayati, and A. Nokhodchi, Investigation into
Alternative Sugars as Potential Carriers for Dry Powder Formulation of
Budesonide. BioImpacts, 2011. 1(2): p. 105-111.
Bibliography
195
212. Sebti, T. and K. Amighi, Preparation and in vitro evaluation of lipidic
carriers and fillers for inhalation. European Journal of Pharmaceutics and
Biopharmaceutics, 2006. 63(1): p. 51-58.
213. Ringsdorf, H., Hermann Staudinger and the Future of Polymer Research
Jubilees - Beloved Occasions for Cultural Piety. Angewandte Chemie
International Edition, 2004. 43(9): p. 1064-1076.
214. Martin del Valle, E.M., M.A. Galan, and R.G. Carbonell, Drug Delivery
Technologies: The Way Forward in the New Decade. Industrial &
Engineering Chemistry Research, 2009. 48(5): p. 2475-2486.
215. Pillai, O. and R. Panchagnula, Polymers in drug delivery. Current Opinion in
Chemical Biology, 2001. 5(4): p. 447-451.
216. Upton, C.E.K., Catherine A; Shakesheff, Kevin M and Howdle, Steven M,
One dose or two? The use of polymers in drug delivery. Polymer
International, 2007. 56: p. 1457-1460.
217. Fiegel, J., J. Fu, and J. Hanes, Poly(ether-anhydride) dry powder aerosols for
sustained drug delivery in the lungs. Journal of Controlled Release, 2004.
96(3): p. 411-423.
218. Fu, J., J. Fiegel, and J. Hanes, Synthesis and Characterization of PEG-Based
Ether Anhydride Terpolymers: Novel Polymers for Controlled Drug Delivery.
Macromolecules, 2004. 37(19): p. 7174-7180.
219. Fu, J., J. Fiegel, E. Krauland, and J. Hanes, New polymeric carriers for
controlled drug delivery following inhalation or injection. Biomaterials,
2002. 23(22): p. 4425-4433.
220. Zhang, Q., Z. Shen, and T. Nagai, Prolonged hypoglycemic effect of insulin-
loaded polybutylcyanoacrylate nanoparticles after pulmonary administration
to normal rats. International Journal of Pharmaceutics, 2001. 218(1-2): p. 75-
80.
Bibliography
196
221. Rytting, E., J. Nguyen, X. Wang, and T. Kissel, Biodegradable polymeric
nanocarriers for pulmonary drug delivery. Expert Opin Drug Deliv, 2008.
5(6): p. 629-39.
222. Edwards, D.A., A. Ben-Jebria, and R. Langer, Recent advances in pulmonary
drug delivery using large, porous inhaled particles. J Appl Physiol, 1998.
85(2): p. 379-85.
223. Shenoy, D.B. and M.M. Amiji, Poly(ethylene oxide)-modified poly([var
epsilon]-caprolactone) nanoparticles for targeted delivery of tamoxifen in
breast cancer. International Journal of Pharmaceutics, 2005. 293(1-2): p.
261-270.
224. Kim, S.Y. and Y.M. Lee, Taxol-loaded block copolymer nanospheres
composed of methoxy poly(ethylene glycol) and poly([var epsilon]-
caprolactone) as novel anticancer drug carriers. Biomaterials, 2001. 22(13):
p. 1697-1704.
225. Prabu, P., A.A. Chaudhari, N. Dharmaraj, M.S. Khil, S.Y. Park, and H.Y.
Kim, Preparation, characterization, in-vitro drug release and cellular uptake
of poly(caprolactone) grafted dextran copolymeric nanoparticles loaded with
anticancer drug. Journal of Biomedical Materials Research Part A, 2009.
90A(4): p. 1128-1136.
226. Zheng, D., X. Li, H. Xu, X. Lu, Y. Hu, and W. Fan, Study on docetaxel-
loaded nanoparticles with high antitumor efficacy against malignant
melanoma. Acta Biochimica et Biophysica Sinica, 2009. 41(7): p. 578-587.
227. Damgé, C., P. Maincent, and N. Ubrich, Oral delivery of insulin associated to
polymeric nanoparticles in diabetic rats. Journal of Controlled Release, 2007.
117(2): p. 163-170.
228. Shah, L.K. and M.M. Amiji, Intracellular delivery of saquinavir in
biodegradable polymeric nanoparticles for HIV/AIDS. Pharmaceutical
Research, 2006. 23(11): p. 2638-45.
Bibliography
197
229. Espuelas, M.S., P. Legrand, P.M. Loiseau, C. Bories, G. Barratt, and J.M.
Irache, In Vitro Antileishmanial Activity of Amphotericin B Loaded in Poly(ε-
Caprolactone) Nanospheres. Journal of Drug Targeting, 2002. 10(8): p. 593-
599.
230. Kho, K., W.S. Cheow, R.H. Lie, and K. Hadinoto, Aqueous re-dispersibility
of spray-dried antibiotic-loaded polycaprolactone nanoparticle aggregates
for inhaled anti-biofilm therapy. Powder Technology, 2010. 203(3): p. 432-
439.
231. Rawat, A., Q.H. Majumder, and F. Ahsan, Inhalable large porous
microspheres of low molecular weight heparin: In vitro and in vivo
evaluation. Journal of Controlled Release, 2008. 128(3): p. 224-232.
232. Kawashima, Y., H. Yamamoto, H. Takeuchi, S. Fujioka, and T. Hino,
Pulmonary delivery of insulin with nebulized -lactide/glycolide copolymer
(PLGA) nanospheres to prolong hypoglycemic effect. Journal of Controlled
Release, 1999. 62(1-2): p. 279-287.
233. Philip, V.A., R.C. Mehta, P.P. Deluca, and M.K. Mazumder, E-SPART
Analysis of Poly (D, L-lactide-co-glycolide) Microspheres Formulated for
Dry Powder Aerosols. Particulate Science and Technology, 1997a. 15(3-4): p.
303-316.
234. Philip, V.A., R.C. Mehta, M.K. Mazumder, and P.P. DeLuca, Effect of
surface treatment on the respirable fractions of PLGA microspheres
formulated for dry powder inhalers. International Journal of Pharmaceutics,
1997b. 151(2): p. 165-174.
235. Shi, S. and A. Hickey, PLGA Microparticles in Respirable Sizes Enhance an
In Vitro T Cell Response to Recombinant Mycobacterium Tuberculosis
Antigen TB10.4-Ag85B. Pharmaceutical Research, 2010. 27(2): p. 350-360.
236. Learoyd, T.P., J.L. Burrows, E. French, and P.C. Seville, Modified release of
beclometasone dipropionate from chitosan-based spray-dried respirable
powders. Powder Technology, 2008. 187(3): p. 231-238.
Bibliography
198
237. Corrigan, D.O., A.M. Healy, and O.I. Corrigan, Preparation and release of
salbutamol from chitosan and chitosan co-spray dried compacts and
multiparticulates. European Journal of Pharmaceutics and Biopharmaceutics,
2006. 62(3): p. 295-305.
238. Huang, Y.C., A. Vieira, M.K. Yeh, and C.H. Chiang, Pulmonary Anti-
inflammatory Effects of Chitosan Microparticles Containing Betamethasone.
Journal of Bioactive and Compatible Polymers, 2007. 22(1): p. 30-41.
239. Huang, Y.C., M.K. Yeh, S.N. Cheng, and C.H. Chiang, The characteristics of
betamethasone-loaded chitosan microparticles by spray-drying method.
Journal of Microencapsulation, 2003. 20(4): p. 459-472.
240. Huang, Y.C., M.K. Yeh, and C.H. Chiang, Formulation factors in preparing
BTM-chitosan microspheres by spray drying method. International Journal of
Pharmaceutics, 2002. 242(1-2): p. 239-242.
241. Salama, R., S. Hoe, H.-K. Chan, D. Traini, and P.M. Young, Preparation and
characterisation of controlled release co-spray dried drug-polymer
microparticles for inhalation 1: Influence of polymer concentration on
physical and in vitro characteristics. European Journal of Pharmaceutics and
Biopharmaceutics, 2008. 69(2): p. 486-495.
242. Sinha, V.R., K. Bansal, R. Kaushik, R. Kumria, and A. Trehan, Poly-
[epsilon]-caprolactone microspheres and nanospheres: an overview.
International Journal of Pharmaceutics, 2004. 278(1): p. 1-23.
243. Engelberg, I. and J. Kohn, Physico-mechanical properties of degradable
polymers used in medical applications: A comparative study. Biomaterials,
1991. 12(3): p. 292-304.
244. Miller, R.A., J.M. Brady, and D.E. Cutright, Degradation rates of oral
resorbable implants (polylactates and polyglycolates): rate modification with
changes in PLA/PGA copolymer ratios. Journal of Biomedical Materials
Research, 1977. 11(5): p. 711-9.
Bibliography
199
245. Alway, B., R. Sangchantra, and P.J. Stewart, Modelling the dissolution of
diazepam in lactose interactive mixtures. International Journal of
Pharmaceutics, 1996. 130(2): p. 213-224.
246. Liu, J. and P.J. Stewart, Deaggregation during the dissolution of
benzodiazepines in interactive mixtures. Journal of Pharmaceutical Sciences,
1998. 87(12): p. 1632-1638.
247. Larson, I., C.J. Drummond, D.Y.C. Chan, and F. Grieser, Direct force
measurements between titanium dioxide surfaces. Journal of the American
Chemical Society, 1993. 115(25): p. 11885-11890.
248. Hutter, J. and J. Bechhoefer, Calibration of atomic force microscope tips
Review of Scientific Instruments, 1993. 64: p. 1868-1873.
249. Senden, T. and W. Ducker, Experimental Determination of Spring Constants
in Atomic Force Microscopy. Langmuir, 1994. 10(4): p. 1003-1004.
250. Ho, R., S.J. Hinder, J.F. Watts, S.E. Dilworth, D.R. Williams, and J.Y. Heng,
Determination of surface heterogeneity of D-mannitol by sessile drop contact
angle and finite concentration inverse gas chromatography. International
Journal of Pharmaceutics, 2010. 387(1-2): p. 79-86.
251. Thielmann, F., D.J. Burnett, and J.Y.Y. Heng, Determination of the Surface
Energy Distributions of Different Processed Lactose. Drug Development and
Industrial Pharmacy, 2007. 33(11): p. 1240-1253.
252. Yla-Maihaniemi, P.P., J.Y. Heng, F. Thielmann, and D.R. Williams, Inverse
gas chromatographic method for measuring the dispersive surface energy
distribution for particulates. Langmuir, 2008. 24(17): p. 9551-7.
253. Thielmann, F. and D. Pearse, Determination of surface heterogeneity profiles
on graphite by finite concentration inverse gas chromatography. Journal of
Chromatography A, 2002. 969(1-2): p. 323-7.
254. Schultz, J., L. Lavielle, and C. Martin, The Role of the Interface in Carbon
Fibre-Epoxy Composites. The Journal of Adhesion, 1987. 23(1): p. 45-60.
Bibliography
200
255. Crooks, M.J. and R. Ho, Ordered mixing in direct compression of tablets.
Powder Technology, 1976. 14(1): p. 161-167.
256. Hallworth, G.W. and D.G. Westmoreland, The twin impinger: a simple device
for assessing the delivery of drugs from metered dose pressurized aerosol
inhalers. J Pharm Pharmacol, 1987. 39(12): p. 966-72.
257. Atanasoska, L., V. Cammarata, B.J. Stallman, W.S.V. Kwan, and L.L. Miller,
Langmuir-Blodgett films of rigid rod oligoimides on gold: An x-ray
photoelectron spectroscopy study. Surface and Interface Analysis, 1992.
18(2): p. 163-172.
258. Andrade, J.D., X-Ray Photoelectron Spectroscopy (XPS), in Surface and
Interfacial aspects of Biomedical polymers, J.D. Andrade, Editor. 1985,
Plenum Publishing Corporation: New York. p. 181.
259. Sahoo, S.K., J. Panyam, S. Prabha, and V. Labhasetwar, Residual polyvinyl
alcohol associated with poly (D,L-lactide-co-glycolide) nanoparticles affects
their physical properties and cellular uptake. Journal of Controlled Release,
2002. 82(1): p. 105-14.
260. Donovan, M.J. and H.D.C. Smyth, Influence of size and surface roughness of
large lactose carrier particles in dry powder inhaler formulations.
International Journal of Pharmaceutics, 2010. 402(1-2): p. 1-9.
261. Concessio, N.M., M.M. VanOort, M.R. Knowles, and A.J. Hickey,
Pharmaceutical Dry Powder Aerosols: Correlation of Powder Properties
with Dose Delivery and Implications for Pharmacodynamic Effect.
Pharmaceutical Research, 1999. 16(6): p. 828-834.
262. Hickey, A.J., H.M. Mansour, M.J. Telko, Z. Xu, H.D.C. Smyth, T. Mulder,
R. McLean, J. Langridge, and D. Papadopoulos, Physical characterization of
component particles included in dry powder inhalers. II. Dynamic
characteristics. Journal of Pharmaceutical Sciences, 2007. 96(5): p. 1302-
1319.
Bibliography
201
263. Qiao, C., S. Jiang, X. Ji, L. An, and B. Jiang, Studies on confined
crystallization behavior of polycaprolactone thin films. Frontiers of
Chemistry in China, 2007. 2(4): p. 343-348.
264. Hua, C., Z. Chen, Q. Xu, and L. He, Ring-banded spherulites in PCL and
PCL/MWCNT solution-casting films and effect of compressed CO2 on them.
Journal of Polymer Science Part B: Polymer Physics, 2009. 47(8): p. 784-
792.
265. Yong, J., L. Yanhong, F. Zefu, W. Xiayu, X. Jun, G. Baohua, and L. Lin,
Obsevation of banded spherulites and lamellar structures by atomic force
microscopy. Science in China (Series B), 2003. 46(2): p. 153-159.
266. Simon, D., A. Holland, and R. Shanks, Poly(caprolactone) thin film
preparation, morphology, and surface texture. Journal of Applied Polymer
Science, 2007. 103(2): p. 1287-1294.
267. Dorati, R., M. Patrini, P. Perugini, F. Pavanetto, A. Stella, T. Modena, I.
Genta, and B. Conti, Surface characterization by atomic force microscopy of
sterilized PLGA microspheres. Journal of Microencapsulation, 2006. 23(2): p.
123-133.
268. Wan, Y., X. Qu, J. Lu, C. Zhu, L. Wan, J. Yang, J. Bei, and S. Wang,
Characterization of surface property of poly(lactide-co-glycolide) after
oxygen plasma treatment. Biomaterials, 2004. 25(19): p. 4777-4783.
269. Study on the phase separation of poly(lactide-co-glycolide)/polyphosphazene
blend film.
270. Cava, D., R. Gavara, J.M. Lagarón, and A. Voelkel, Surface characterization
of poly(lactic acid) and polycaprolactone by inverse gas chromatography.
Journal of Chromatography A, 2007. 1148(1): p. 86-91.
271. Al-Ghamdi, A., M. Melibari, and Z.Y. Al-Saigh, Characterization of
biodegradable polymers by inverse gas chromatography. II. Blends of
amylopectin and poly(ε-caprolactone). Journal of Applied Polymer Science,
2006. 101(5): p. 3076-3089.
Bibliography
202
272. Ahn, H.B., S.J. Ahn, S.J. Lee, T.W. Kim, and D.S. Nahm, Analysis of surface
roughness and surface free energy characteristics of various orthodontic
materials. American Journal of Orthodontics and Dentofacial Orthopedics,
2009. 136(5): p. 668-74.
273. York, P., M.D. Ticehurst, J.C. Osborn, R.J. Roberts, and R.C. Rowe,
Characterisation of the surface energetics of milled dl-propranolol
hydrochloride using inverse gas chromatography and molecular modelling.
International Journal of Pharmaceutics, 1998. 174(1): p. 179-186.
274. Grimsey, I.M., M. Sunkersett, J.C. Osborn, P. York, and R.C. Rowe,
Interpretation of the differences in the surface energetics of two optical forms
of mannitol by inverse gas chromatography and molecular modelling.
International Journal of Pharmaceutics, 1999. 191(1): p. 43-50.
275. Grimsey, J., A. Edwards, B. Shekunov, R. Forbes, and P. York. The effect of
processing on the surface energetics of poly(l-lactide) microparticles as
determined by inverse gas chromatography (IGC), . in Proceedings of the
Annual Conference of American Association of Pharmaceutical Scientists,
PharmSci. 1999.
276. Ticehurst, M.D., P. York, R.C. Rowe, and S.K. Dwivedi, Characterisation of
the surface properties of [alpha]-lactose monohydrate with inverse gas
chromatography, used to detect batch variation. International Journal of
Pharmaceutics, 1996. 141(1-2): p. 93-99.
277. Aulton, M., Aulton's Pharmaceutics: The design and manufacture of
medicines. 3rd ed, ed. K. Taylor. 2007, United Kingdom. 736.
278. Mukhopadhyay, P. and H.P. Schreiber, Aspects of acid-base interactions and
use of inverse gas chromatography. Colloids and surfaces. A,
Physicochemical and engineering aspects 1995. 100(1-3): p. 47-71.
279. Feeley, J.C., P. York, B.S. Sumby, and H. Dicks, Processing effects on the
surface properties of α-lactose monohydrate assessed by inverse gas
chromatography (IGC). Journal of Materials Science, 2002. 37(1): p. 217-
222.
Bibliography
203
280. Sommerfeld, M. and N. Huber, Experimental analysis and modelling of
particle-wall collisions. International Journal of Multiphase Flow, 1999.
25(6-7): p. 1457-1489.