Embed Size (px)
Citation preview
Desalination 333 (2014) 36–44
Contents lists available at ScienceDirect
Desalination
j ourna l homepage: www.e lsev ie r .com/ locate /desa l
Studies on fouling by natural organic matter (NOM) on polysulfonemembranes: Effect of polyethylene glycol (PEG)
Muhamad Zaini Yunos a,b, Zawati Harun a,b,⁎, Hatijah Basri c, Ahmad Fauzi Ismail d
a ENIGMA, Department of Materials and Design, Faculty of Mechanical and Manufacturing, Universiti Tun Hussein Onn Malaysia, Parit Raja, Batu Pahat 86400, Johor, Malaysiab Integrated Material Process, Advanced Materials and Manufacturing Center, Universiti Tun Hussein Onn Malaysia, Parit Raja, Batu Pahat 86400, Johor, Malaysiac Department of Technology and Heritage, Faculty of Science, Technology and Human Development, Universiti Tun Hussein Onn Malaysia, Parit Raja, Batu Pahat 86400, Johor, Malaysiad Advanced Membrane Technology Research Centre, Faculty of Chemical and Natural Resources Engineering, Universiti Teknologi Malaysia, Skudai, 81300 Johor Bahru, Johor, Malaysia
H I G H L I G H T S
• Fouling behaviour of PSf by NOM• Different concentrations and molecular weights of PEG were used as additives in membrane.• Detailed morphology and membrane performance were characterized and measured.• Real river water which possesses hydrophobic and hydrophilic characteristics was used to evaluate membrane fouling.
⁎ Corresponding author at: Integrated Material ProManufacturing Center, Universiti Tun Hussein Onn M86400, Johor, Malaysia. Tel.: +60 74537608; fax: +60 74
E-mail addresses: [email protected] (M.Z. Yunos)(Z. Harun), [email protected] (H. Basri), afauzi@utm.
0011-9164/$ – see front matter © 2013 Elsevier B.V. All rihttp://dx.doi.org/10.1016/j.desal.2013.11.019
a b s t r a c t
a r t i c l e i n f oArticle history:Received 19 July 2013Received in revised form 21 October 2013Accepted 10 November 2013Available online 14 December 2013
Keywords:PSf membranePEGNOMFouling
Polysulfone membranes were prepared via phase inversion technique by using polyethylene glycol withmolecular weights of 400, 1500 and 6000 Da as pore forming agent in dope formulation. The performance ofmembrane was characterized using humic acid and water sample taken from Sembrong River, Johor, Malaysiawas used as natural organic matter sources. Membrane properties were also characterized in terms of meanpore radius, pure water flux, humic acid rejection and fouling resistance. The results indicated that the purewater flux and mean pore radius of membranes increased with the increase of PEG content. Fourier transforminfrared spectroscopy results revealed the presence of hydrophilic component in PSf/PEG blend with the signif-icant appearance of O–H peak at 3418.78 cm−1. Scanning electron microscopy analysis revealed the presence offinger-like structure for all membranes and the structure intensified as PEG content was increased. The resultsobtained from the fouling study indicated that themembranewith the lowest PEG content andmolecularweighthas an excellent performance in mitigating fouling.
© 2013 Elsevier B.V. All rights reserved.
1. Introduction
Natural organic matter (NOM) is one of the major pollutants inacidic and low turbidity water source. In Malaysia, most of the watersources are contaminated with NOM especially that from peat soil.Natural organic compounds such as humic acid and fulvic acid contrib-uted to the natural colour of water (brown to black) which becomesmore visible if the dissolved organic carbon (DOC) exceeds 5 mg/L.Therefore, the removal of NOM is usually known as colour removal.According to Thurman [1], surface water in average contains about45% fulvic acid, 5% humic acid, 25% low molecular weight acid, and the
cess, Advanced Materials andalaysia, Parit Raja, Batu Pahat536080., [email protected] (A.F. Ismail).
ghts reserved.
remaining consists of neutral compounds, bases and contaminants.Although these compounds are relatively harmless, they are able toform carcinogenic disinfection byproducts such as trihalomethanes[2,3]. In order to remove these substances and render environmentalremediation, ultrafiltration (UF) has been recognised as one of theattractive approaches that has been highlighted in many studies dueto its compactness, easy automation, high removal rate of organicmatter and also capability to remove virus [4].
Polysulfone (PSf) is themost commonly used polymer in the fabrica-tion of UFmembrane. PSf is known for its resistance in extreme pH con-dition and high thermal stability [5]. However, one of the majorproblems of polysulfone is its hydrophobic characteristic which oftencauses hydrophobic particle to adsorb on the surface of the PSf mem-brane. This phenomenon had led to membrane fouling and drasticallydecreased the membrane permeability.
Fouling is described as pore-blocking, solute aggregation or adsorp-tion phenomenon. Irreversiblemembrane fouling by proteins, NOMandother biomolecules' adsorption reduces the flux of membrane and
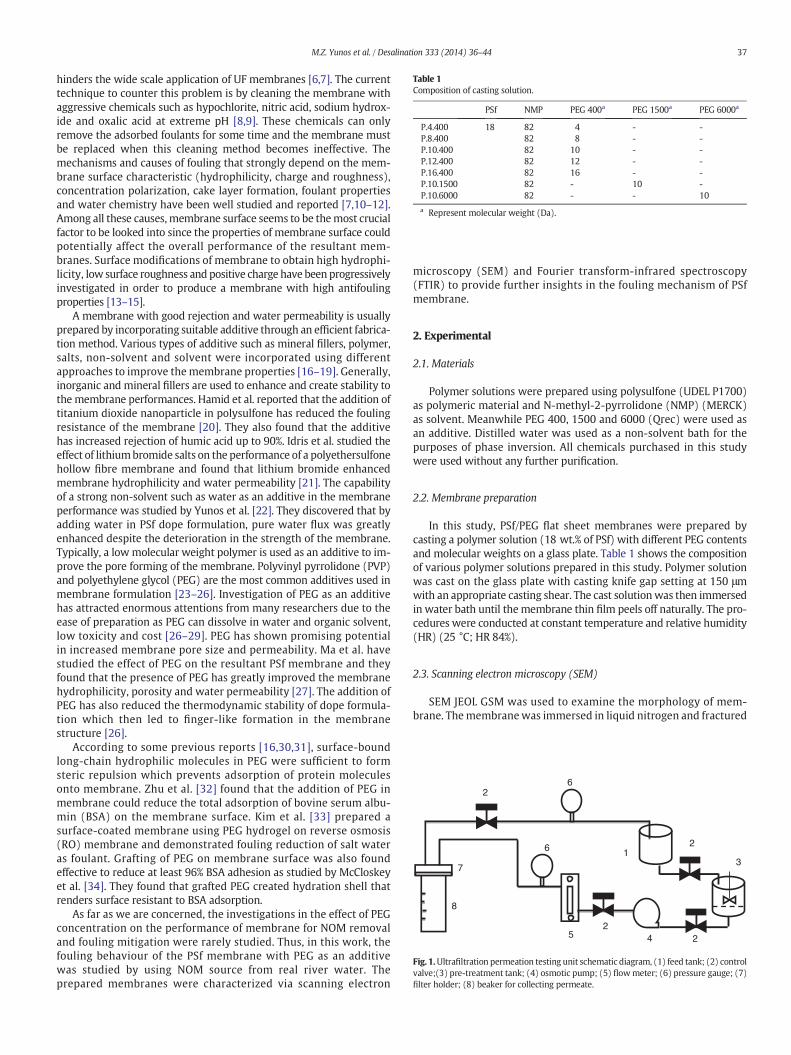
Table 1Composition of casting solution.
PSf NMP PEG 400a PEG 1500a PEG 6000a
P.4.400 18 82 4 - -P.8.400 82 8 - -P.10.400 82 10 - -P.12.400 82 12 - -P.16.400 82 16 - -P.10.1500 82 - 10 -P.10.6000 82 - - 10
a Represent molecular weight (Da).
2
2
6
6
7
8
31
2
2
45
Fig. 1.Ultrafiltration permeation testing unit schematic diagram, (1) feed tank; (2) controlvalve;(3) pre-treatment tank; (4) osmotic pump; (5) flowmeter; (6) pressure gauge; (7)filter holder; (8) beaker for collecting permeate.
37M.Z. Yunos et al. / Desalination 333 (2014) 36–44
hinders the wide scale application of UF membranes [6,7]. The currenttechnique to counter this problem is by cleaning the membrane withaggressive chemicals such as hypochlorite, nitric acid, sodium hydrox-ide and oxalic acid at extreme pH [8,9]. These chemicals can onlyremove the adsorbed foulants for some time and the membrane mustbe replaced when this cleaning method becomes ineffective. Themechanisms and causes of fouling that strongly depend on the mem-brane surface characteristic (hydrophilicity, charge and roughness),concentration polarization, cake layer formation, foulant propertiesand water chemistry have been well studied and reported [7,10–12].Among all these causes, membrane surface seems to be themost crucialfactor to be looked into since the properties of membrane surface couldpotentially affect the overall performance of the resultant mem-branes. Surface modifications of membrane to obtain high hydrophi-licity, low surface roughness and positive charge have been progressivelyinvestigated in order to produce a membrane with high antifoulingproperties [13–15].
A membrane with good rejection and water permeability is usuallyprepared by incorporating suitable additive through an efficient fabrica-tion method. Various types of additive such as mineral fillers, polymer,salts, non-solvent and solvent were incorporated using differentapproaches to improve themembrane properties [16–19]. Generally,inorganic and mineral fillers are used to enhance and create stability tothe membrane performances. Hamid et al. reported that the addition oftitanium dioxide nanoparticle in polysulfone has reduced the foulingresistance of the membrane [20]. They also found that the additivehas increased rejection of humic acid up to 90%. Idris et al. studied theeffect of lithiumbromide salts on the performance of a polyethersulfonehollow fibre membrane and found that lithium bromide enhancedmembrane hydrophilicity and water permeability [21]. The capabilityof a strong non-solvent such as water as an additive in the membraneperformance was studied by Yunos et al. [22]. They discovered that byadding water in PSf dope formulation, pure water flux was greatlyenhanced despite the deterioration in the strength of the membrane.Typically, a lowmolecular weight polymer is used as an additive to im-prove the pore forming of the membrane. Polyvinyl pyrrolidone (PVP)and polyethylene glycol (PEG) are the most common additives used inmembrane formulation [23–26]. Investigation of PEG as an additivehas attracted enormous attentions from many researchers due to theease of preparation as PEG can dissolve in water and organic solvent,low toxicity and cost [26–29]. PEG has shown promising potentialin increased membrane pore size and permeability. Ma et al. havestudied the effect of PEG on the resultant PSf membrane and theyfound that the presence of PEG has greatly improved the membranehydrophilicity, porosity and water permeability [27]. The addition ofPEG has also reduced the thermodynamic stability of dope formula-tion which then led to finger-like formation in the membranestructure [26].
According to some previous reports [16,30,31], surface-boundlong-chain hydrophilic molecules in PEG were sufficient to formsteric repulsion which prevents adsorption of protein moleculesonto membrane. Zhu et al. [32] found that the addition of PEG inmembrane could reduce the total adsorption of bovine serum albu-min (BSA) on the membrane surface. Kim et al. [33] prepared asurface-coated membrane using PEG hydrogel on reverse osmosis(RO) membrane and demonstrated fouling reduction of salt wateras foulant. Grafting of PEG on membrane surface was also foundeffective to reduce at least 96% BSA adhesion as studied by McCloskeyet al. [34]. They found that grafted PEG created hydration shell thatrenders surface resistant to BSA adsorption.
As far as we are concerned, the investigations in the effect of PEGconcentration on the performance of membrane for NOM removaland fouling mitigation were rarely studied. Thus, in this work, thefouling behaviour of the PSf membrane with PEG as an additivewas studied by using NOM source from real river water. Theprepared membranes were characterized via scanning electron
microscopy (SEM) and Fourier transform-infrared spectroscopy(FTIR) to provide further insights in the fouling mechanism of PSfmembrane.
2. Experimental
2.1. Materials
Polymer solutions were prepared using polysulfone (UDEL P1700)as polymeric material and N-methyl-2-pyrrolidone (NMP) (MERCK)as solvent. Meanwhile PEG 400, 1500 and 6000 (Qrec) were used asan additive. Distilled water was used as a non-solvent bath for thepurposes of phase inversion. All chemicals purchased in this studywere used without any further purification.
2.2. Membrane preparation
In this study, PSf/PEG flat sheet membranes were prepared bycasting a polymer solution (18 wt.% of PSf) with different PEG contentsand molecular weights on a glass plate. Table 1 shows the compositionof various polymer solutions prepared in this study. Polymer solutionwas cast on the glass plate with casting knife gap setting at 150 μmwith an appropriate casting shear. The cast solutionwas then immersedin water bath until the membrane thin film peels off naturally. The pro-cedures were conducted at constant temperature and relative humidity(HR) (25 °C; HR 84%).
2.3. Scanning electron microscopy (SEM)
SEM JEOL GSM was used to examine the morphology of mem-brane. Themembranewas immersed in liquid nitrogen and fractured
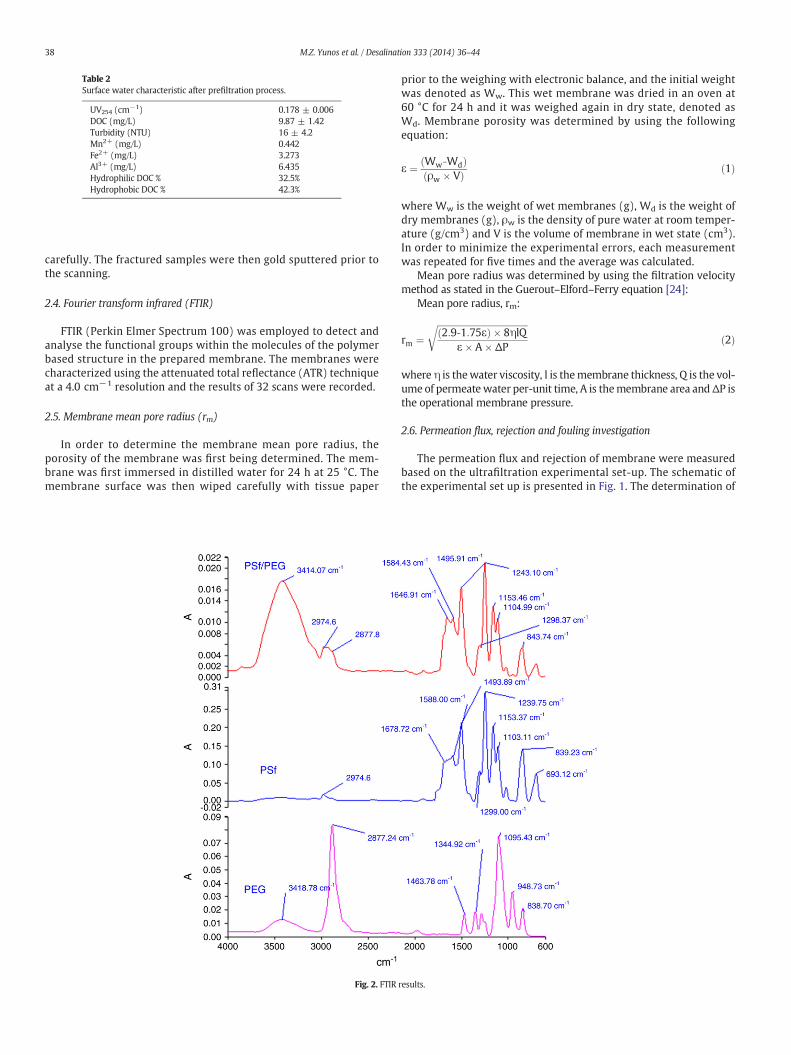
Table 2Surface water characteristic after prefiltration process.
UV254 (cm−1) 0.178 ± 0.006DOC (mg/L) 9.87 ± 1.42Turbidity (NTU) 16 ± 4.2Mn2+ (mg/L) 0.442Fe2+ (mg/L) 3.273Al3+ (mg/L) 6.435Hydrophilic DOC % 32.5%Hydrophobic DOC % 42.3%
38 M.Z. Yunos et al. / Desalination 333 (2014) 36–44
carefully. The fractured samples were then gold sputtered prior tothe scanning.
2.4. Fourier transform infrared (FTIR)
FTIR (Perkin Elmer Spectrum 100) was employed to detect andanalyse the functional groups within the molecules of the polymerbased structure in the prepared membrane. The membranes werecharacterized using the attenuated total reflectance (ATR) techniqueat a 4.0 cm−1 resolution and the results of 32 scans were recorded.
2.5. Membrane mean pore radius (rm)
In order to determine the membrane mean pore radius, theporosity of the membrane was first being determined. The mem-brane was first immersed in distilled water for 24 h at 25 °C. Themembrane surface was then wiped carefully with tissue paper
Fig. 2. FTIR
prior to the weighing with electronic balance, and the initial weightwas denoted as Ww. This wet membrane was dried in an oven at60 °C for 24 h and it was weighed again in dry state, denoted asWd. Membrane porosity was determined by using the followingequation:
ε ¼ Ww‐Wdð Þρw � Vð Þ ð1Þ
where Ww is the weight of wet membranes (g), Wd is the weight ofdry membranes (g), ρw is the density of pure water at room temper-ature (g/cm3) and V is the volume of membrane in wet state (cm3).In order to minimize the experimental errors, each measurementwas repeated for five times and the average was calculated.
Mean pore radius was determined by using the filtration velocitymethod as stated in the Guerout–Elford–Ferry equation [24]:
Mean pore radius, rm:
rm ¼ffiffiffiffiffiffiffiffiffiffiffiffiffiffiffiffiffiffiffiffiffiffiffiffiffiffiffiffiffiffiffiffiffiffiffiffiffiffiffiffiffi2:9‐1:75εð Þ � 8ηlQ
ε� A� ΔP
rð2Þ
where η is thewater viscosity, l is themembrane thickness, Q is the vol-ume of permeatewater per-unit time, A is themembrane area andΔP isthe operational membrane pressure.
2.6. Permeation flux, rejection and fouling investigation
The permeation flux and rejection of membrane were measuredbased on the ultrafiltration experimental set-up. The schematic ofthe experimental set up is presented in Fig. 1. The determination of
results.
Overall view Top crossectiona)
b)
c)
d)
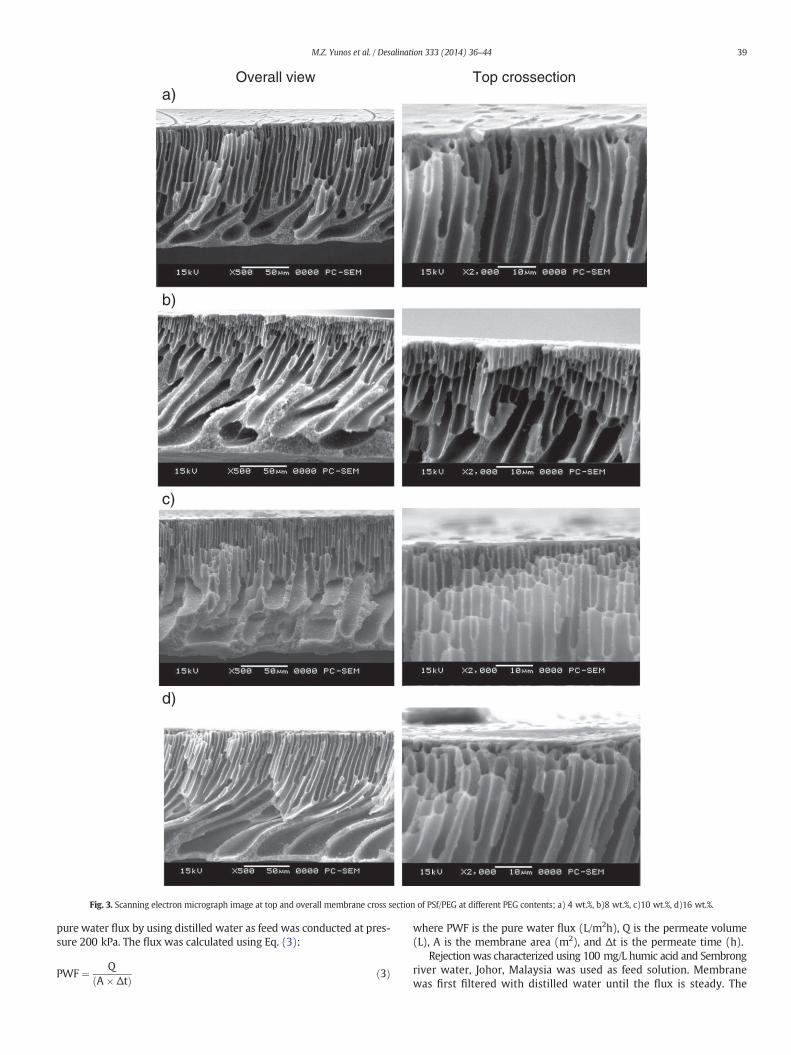
Fig. 3. Scanning electron micrograph image at top and overall membrane cross section of PSf/PEG at different PEG contents; a) 4 wt.%, b)8 wt.%, c)10 wt.%, d)16 wt.%.
39M.Z. Yunos et al. / Desalination 333 (2014) 36–44
pure water flux by using distilled water as feed was conducted at pres-sure 200 kPa. The flux was calculated using Eq. (3):
PWF ¼ QA� Δtð Þ ð3Þ
where PWF is the pure water flux (L/m2h), Q is the permeate volume(L), A is the membrane area (m2), and Δt is the permeate time (h).
Rejection was characterized using 100 mg/L humic acid and Sembrongriver water, Johor, Malaysia was used as feed solution. Membranewas first filtered with distilled water until the flux is steady. The
10 wt% 12 wt % 16 wt %
a)
b)
c)
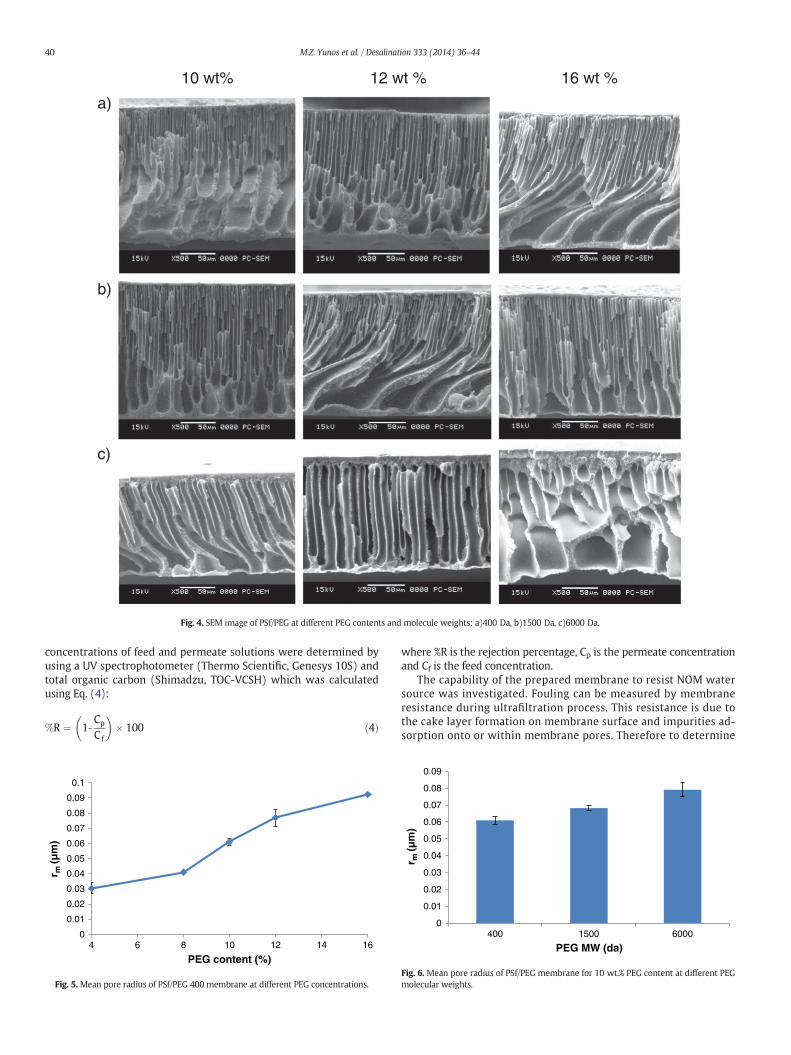
Fig. 4. SEM image of PSf/PEG at different PEG contents and molecule weights: a)400 Da, b)1500 Da, c)6000 Da.
40 M.Z. Yunos et al. / Desalination 333 (2014) 36–44
concentrations of feed and permeate solutions were determined byusing a UV spectrophotometer (Thermo Scientific, Genesys 10S) andtotal organic carbon (Shimadzu, TOC-VCSH) which was calculatedusing Eq. (4):
%R ¼ 1‐Cp
Cf
� �� 100 ð4Þ
0
0.01
0.02
0.03
0.04
0.05
0.06
0.07
0.08
0.09
0.1
4 6 8 10 12 14 16
r m (µ
m)
PEG content (%)
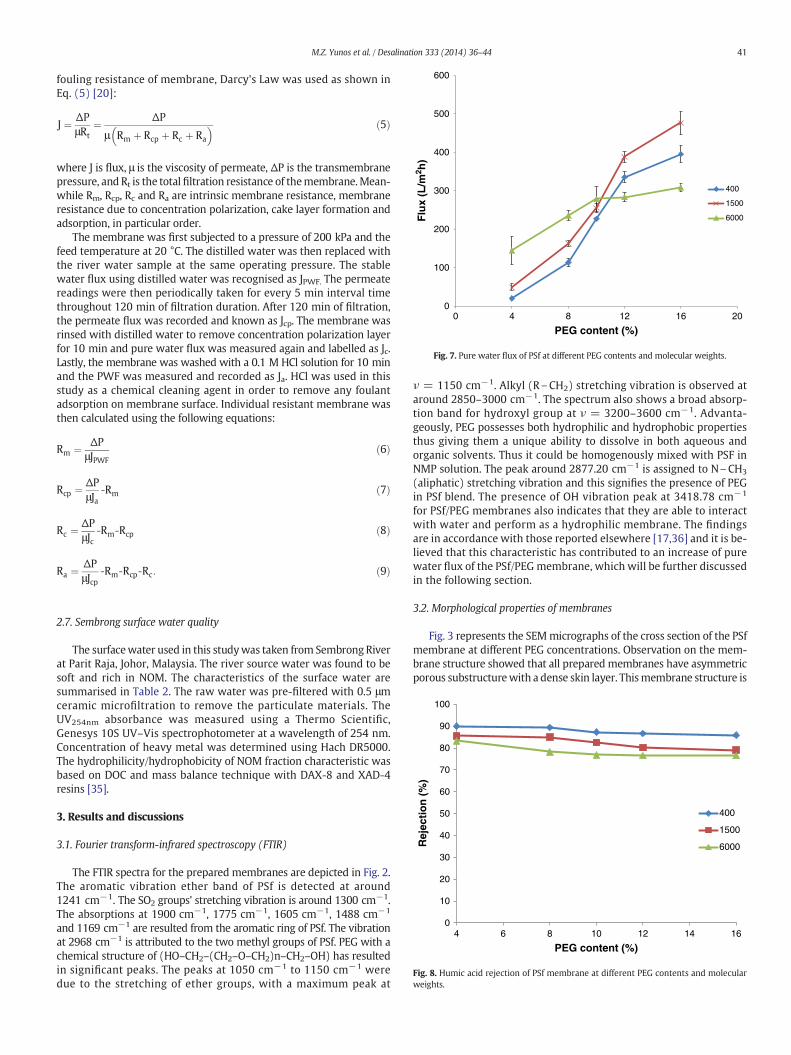
Fig. 5.Mean pore radius of PSf/PEG 400 membrane at different PEG concentrations.
where %R is the rejection percentage, Cp is the permeate concentrationand Cf is the feed concentration.
The capability of the prepared membrane to resist NOM watersource was investigated. Fouling can be measured by membraneresistance during ultrafiltration process. This resistance is due tothe cake layer formation on membrane surface and impurities ad-sorption onto or within membrane pores. Therefore to determine
0
0.01
0.02
0.03
0.04
0.05
0.06
0.07
0.08
0.09
400 1500 6000
r m (µ
m)
PEG MW (da)
Fig. 6. Mean pore radius of PSf/PEG membrane for 10 wt.% PEG content at different PEGmolecular weights.
0
100
200
300
400
500
600
0 4 8 12 16 20
PEG content (%)
400
1500
6000
Fig. 7. Pure water flux of PSf at different PEG contents and molecular weights.
0
10
20
30
40
50
60
70
80
90
100
4 6 8 10 12 14 16
Rej
ecti
on
(%
)
PEG content (%)
400
1500
6000
Fig. 8. Humic acid rejection of PSf membrane at different PEG contents and molecularweights.
41M.Z. Yunos et al. / Desalination 333 (2014) 36–44
fouling resistance of membrane, Darcy's Law was used as shown inEq. (5) [20]:
J ¼ ΔPμRt
¼ ΔP
μ Rm þ Rcp þ Rc þ Ra
� � ð5Þ
where J is flux, μ is the viscosity of permeate, ΔP is the transmembranepressure, and Rt is the total filtration resistance of themembrane.Mean-while Rm, Rcp, Rc and Ra are intrinsic membrane resistance, membraneresistance due to concentration polarization, cake layer formation andadsorption, in particular order.
The membrane was first subjected to a pressure of 200 kPa and thefeed temperature at 20 °C. The distilled water was then replaced withthe river water sample at the same operating pressure. The stablewater flux using distilled water was recognised as JPWF. The permeatereadings were then periodically taken for every 5 min interval timethroughout 120 min of filtration duration. After 120 min of filtration,the permeate flux was recorded and known as Jcp. The membrane wasrinsed with distilled water to remove concentration polarization layerfor 10 min and pure water flux was measured again and labelled as Jc.Lastly, the membrane was washed with a 0.1 M HCl solution for 10 minand the PWF was measured and recorded as Ja. HCl was used in thisstudy as a chemical cleaning agent in order to remove any foulantadsorption on membrane surface. Individual resistant membrane wasthen calculated using the following equations:
Rm ¼ ΔPμJPWF
ð6Þ
Rcp ¼ ΔPμJa
‐Rm ð7Þ
Rc ¼ΔPμJc
‐Rm‐Rcp ð8Þ
Ra ¼ΔPμJcp
‐Rm‐Rcp‐Rc: ð9Þ
2.7. Sembrong surface water quality
The surfacewater used in this studywas taken from Sembrong Riverat Parit Raja, Johor, Malaysia. The river source water was found to besoft and rich in NOM. The characteristics of the surface water aresummarised in Table 2. The raw water was pre-filtered with 0.5 μmceramic microfiltration to remove the particulate materials. TheUV254nm absorbance was measured using a Thermo Scientific,Genesys 10S UV–Vis spectrophotometer at a wavelength of 254 nm.Concentration of heavy metal was determined using Hach DR5000.The hydrophilicity/hydrophobicity of NOM fraction characteristic wasbased on DOC and mass balance technique with DAX-8 and XAD-4resins [35].
3. Results and discussions
3.1. Fourier transform-infrared spectroscopy (FTIR)
The FTIR spectra for the prepared membranes are depicted in Fig. 2.The aromatic vibration ether band of PSf is detected at around1241 cm−1. The SO2 groups' stretching vibration is around 1300 cm−1.The absorptions at 1900 cm−1, 1775 cm−1, 1605 cm−1, 1488 cm−1
and 1169 cm−1 are resulted from the aromatic ring of PSf. The vibrationat 2968 cm−1 is attributed to the two methyl groups of PSf. PEG with achemical structure of (HO–CH2–(CH2–O–CH2)n–CH2–OH) has resultedin significant peaks. The peaks at 1050 cm−1 to 1150 cm−1 weredue to the stretching of ether groups, with a maximum peak at
ν = 1150 cm−1. Alkyl (R\CH2) stretching vibration is observed ataround 2850–3000 cm−1. The spectrum also shows a broad absorp-tion band for hydroxyl group at ν = 3200–3600 cm−1. Advanta-geously, PEG possesses both hydrophilic and hydrophobic propertiesthus giving them a unique ability to dissolve in both aqueous andorganic solvents. Thus it could be homogenously mixed with PSF inNMP solution. The peak around 2877.20 cm−1 is assigned to N\CH3
(aliphatic) stretching vibration and this signifies the presence of PEGin PSf blend. The presence of OH vibration peak at 3418.78 cm−1
for PSf/PEG membranes also indicates that they are able to interactwith water and perform as a hydrophilic membrane. The findingsare in accordance with those reported elsewhere [17,36] and it is be-lieved that this characteristic has contributed to an increase of purewater flux of the PSf/PEG membrane, which will be further discussedin the following section.
3.2. Morphological properties of membranes
Fig. 3 represents the SEMmicrographs of the cross section of the PSfmembrane at different PEG concentrations. Observation on the mem-brane structure showed that all prepared membranes have asymmetricporous substructurewith a dense skin layer. Thismembrane structure is
a)
b)
0
10
20
30
40
50
60
70
4 8 10 12 16
Rej
ecti
on
UV
254 (%
)
PEG content (%)
400 Da
1500 Da
6000 Da
0
5
10
15
20
25
30
35
40
45
50
4 8 10 12 16
Rej
ecti
on
DO
C (
%)
PEG content (%)
400 Da
1500 Da
6000 Da
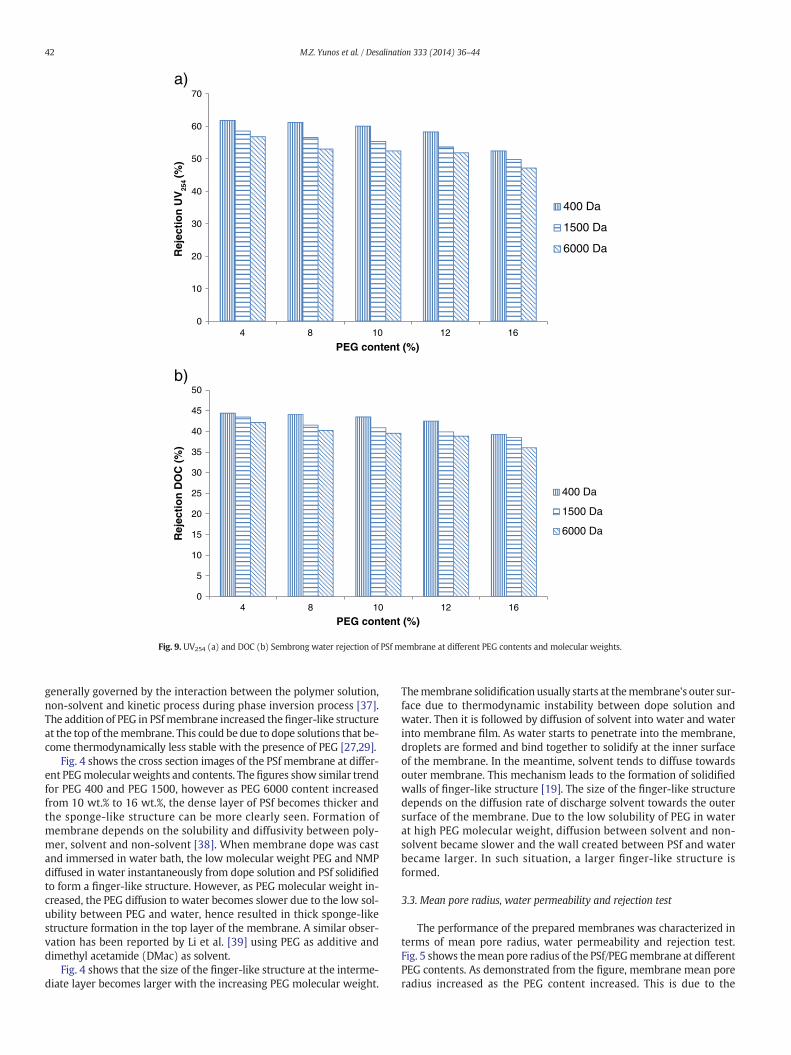
Fig. 9. UV254 (a) and DOC (b) Sembrong water rejection of PSf membrane at different PEG contents and molecular weights.
42 M.Z. Yunos et al. / Desalination 333 (2014) 36–44
generally governed by the interaction between the polymer solution,non-solvent and kinetic process during phase inversion process [37].The addition of PEG in PSfmembrane increased the finger-like structureat the top of themembrane. This could be due to dope solutions that be-come thermodynamically less stable with the presence of PEG [27,29].
Fig. 4 shows the cross section images of the PSf membrane at differ-ent PEGmolecularweights and contents. The figures show similar trendfor PEG 400 and PEG 1500, however as PEG 6000 content increasedfrom 10 wt.% to 16 wt.%, the dense layer of PSf becomes thicker andthe sponge-like structure can be more clearly seen. Formation ofmembrane depends on the solubility and diffusivity between poly-mer, solvent and non-solvent [38]. When membrane dope was castand immersed in water bath, the low molecular weight PEG and NMPdiffused in water instantaneously from dope solution and PSf solidifiedto form a finger-like structure. However, as PEG molecular weight in-creased, the PEG diffusion to water becomes slower due to the low sol-ubility between PEG and water, hence resulted in thick sponge-likestructure formation in the top layer of the membrane. A similar obser-vation has been reported by Li et al. [39] using PEG as additive anddimethyl acetamide (DMac) as solvent.
Fig. 4 shows that the size of the finger-like structure at the interme-diate layer becomes larger with the increasing PEG molecular weight.
Themembrane solidification usually starts at themembrane's outer sur-face due to thermodynamic instability between dope solution andwater. Then it is followed by diffusion of solvent into water and waterinto membrane film. As water starts to penetrate into the membrane,droplets are formed and bind together to solidify at the inner surfaceof the membrane. In the meantime, solvent tends to diffuse towardsouter membrane. This mechanism leads to the formation of solidifiedwalls of finger-like structure [19]. The size of the finger-like structuredepends on the diffusion rate of discharge solvent towards the outersurface of the membrane. Due to the low solubility of PEG in waterat high PEG molecular weight, diffusion between solvent and non-solvent became slower and the wall created between PSf and waterbecame larger. In such situation, a larger finger-like structure isformed.
3.3. Mean pore radius, water permeability and rejection test
The performance of the prepared membranes was characterized interms of mean pore radius, water permeability and rejection test.Fig. 5 shows themean pore radius of the PSf/PEGmembrane at differentPEG contents. As demonstrated from the figure, membrane mean poreradius increased as the PEG content increased. This is due to the
a)
b)
0
0.2
0.4
0.6
0.8
1
0 10 20 30 40 50 60 70 80 90 100 110 120
No
rmal
ized
Flu
x (J
f/Jo)
Time (min)
4% PEG
8% PEG
10% PEG
12% PEG
16% PEG
050
100150200250300350400450
0 10 20 30 40 50 60 70 80 90 100 110 120
Ab
solu
te F
lux
(L/m
2 h))
Time (min)
4% PEG
8% PEG
10% PEG
12% PEG
16% PEG
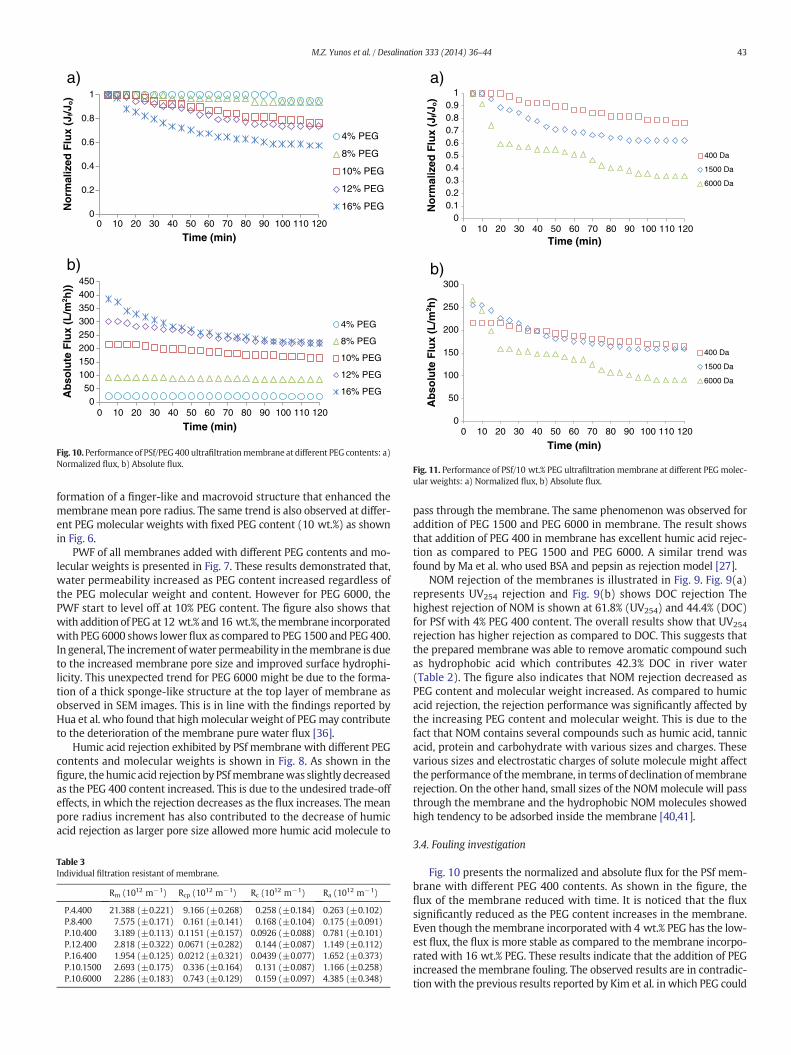
Fig. 10. Performance of PSf/PEG400 ultrafiltrationmembrane at different PEG contents: a)Normalized flux, b) Absolute flux.
a)
b)
00.10.20.30.40.50.60.70.80.9
1
0 10 20 30 40 50 60 70 80 90 100 110 120
No
rmal
ized
Flu
x (J
f/Jo)
Time (min)
400 Da
1500 Da
6000 Da
0
50
100
150
200
250
300
0 10 20 30 40 50 60 70 80 90 100 110 120A
bso
lute
Flu
x (L
/m2 h
)Time (min)
400 Da
1500 Da
6000 Da
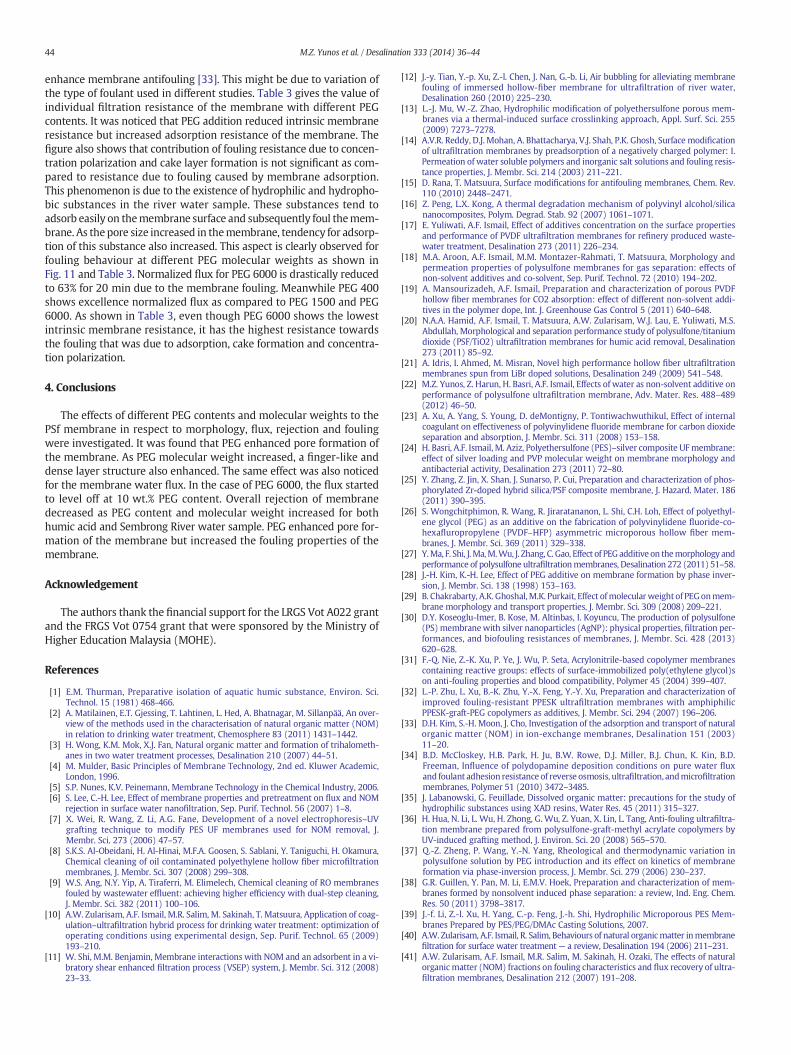
Fig. 11. Performance of PSf/10 wt.% PEG ultrafiltration membrane at different PEGmolec-ular weights: a) Normalized flux, b) Absolute flux.
43M.Z. Yunos et al. / Desalination 333 (2014) 36–44
formation of a finger-like and macrovoid structure that enhanced themembrane mean pore radius. The same trend is also observed at differ-ent PEG molecular weights with fixed PEG content (10 wt.%) as shownin Fig. 6.
PWF of all membranes added with different PEG contents and mo-lecular weights is presented in Fig. 7. These results demonstrated that,water permeability increased as PEG content increased regardless ofthe PEG molecular weight and content. However for PEG 6000, thePWF start to level off at 10% PEG content. The figure also shows thatwith addition of PEG at 12 wt.% and 16 wt.%, themembrane incorporatedwith PEG 6000 shows lowerflux as compared to PEG 1500 and PEG 400.In general, The increment ofwater permeability in themembrane is dueto the increased membrane pore size and improved surface hydrophi-licity. This unexpected trend for PEG 6000 might be due to the forma-tion of a thick sponge-like structure at the top layer of membrane asobserved in SEM images. This is in line with the findings reported byHua et al. who found that highmolecular weight of PEGmay contributeto the deterioration of the membrane pure water flux [36].
Humic acid rejection exhibited by PSf membrane with different PEGcontents and molecular weights is shown in Fig. 8. As shown in thefigure, thehumic acid rejectionby PSfmembranewas slightly decreasedas the PEG 400 content increased. This is due to the undesired trade-offeffects, in which the rejection decreases as the flux increases. The meanpore radius increment has also contributed to the decrease of humicacid rejection as larger pore size allowed more humic acid molecule to
Table 3Individual filtration resistant of membrane.
Rm (1012 m−1) Rcp (1012 m−1) Rc (1012 m−1) Ra (1012 m−1)
P.4.400 21.388 (±0.221) 9.166 (±0.268) 0.258 (±0.184) 0.263 (±0.102)P.8.400 7.575 (±0.171) 0.161 (±0.141) 0.168 (±0.104) 0.175 (±0.091)P.10.400 3.189 (±0.113) 0.1151 (±0.157) 0.0926 (±0.088) 0.781 (±0.101)P.12.400 2.818 (±0.322) 0.0671 (±0.282) 0.144 (±0.087) 1.149 (±0.112)P.16.400 1.954 (±0.125) 0.0212 (±0.321) 0.0439 (±0.077) 1.652 (±0.373)P.10.1500 2.693 (±0.175) 0.336 (±0.164) 0.131 (±0.087) 1.166 (±0.258)P.10.6000 2.286 (±0.183) 0.743 (±0.129) 0.159 (±0.097) 4.385 (±0.348)
pass through the membrane. The same phenomenon was observed foraddition of PEG 1500 and PEG 6000 in membrane. The result showsthat addition of PEG 400 in membrane has excellent humic acid rejec-tion as compared to PEG 1500 and PEG 6000. A similar trend wasfound by Ma et al. who used BSA and pepsin as rejection model [27].
NOM rejection of the membranes is illustrated in Fig. 9. Fig. 9(a)represents UV254 rejection and Fig. 9(b) shows DOC rejection Thehighest rejection of NOM is shown at 61.8% (UV254) and 44.4% (DOC)for PSf with 4% PEG 400 content. The overall results show that UV254
rejection has higher rejection as compared to DOC. This suggests thatthe prepared membrane was able to remove aromatic compound suchas hydrophobic acid which contributes 42.3% DOC in river water(Table 2). The figure also indicates that NOM rejection decreased asPEG content and molecular weight increased. As compared to humicacid rejection, the rejection performance was significantly affected bythe increasing PEG content and molecular weight. This is due to thefact that NOM contains several compounds such as humic acid, tannicacid, protein and carbohydrate with various sizes and charges. Thesevarious sizes and electrostatic charges of solute molecule might affectthe performance of themembrane, in terms of declination ofmembranerejection. On the other hand, small sizes of the NOMmolecule will passthrough the membrane and the hydrophobic NOM molecules showedhigh tendency to be adsorbed inside the membrane [40,41].
3.4. Fouling investigation
Fig. 10 presents the normalized and absolute flux for the PSf mem-brane with different PEG 400 contents. As shown in the figure, theflux of the membrane reduced with time. It is noticed that the fluxsignificantly reduced as the PEG content increases in the membrane.Even though the membrane incorporated with 4 wt.% PEG has the low-est flux, the flux is more stable as compared to the membrane incorpo-rated with 16 wt.% PEG. These results indicate that the addition of PEGincreased themembrane fouling. The observed results are in contradic-tion with the previous results reported by Kim et al. in which PEG could
44 M.Z. Yunos et al. / Desalination 333 (2014) 36–44
enhance membrane antifouling [33]. This might be due to variation ofthe type of foulant used in different studies. Table 3 gives the value ofindividual filtration resistance of the membrane with different PEGcontents. It was noticed that PEG addition reduced intrinsic membraneresistance but increased adsorption resistance of the membrane. Thefigure also shows that contribution of fouling resistance due to concen-tration polarization and cake layer formation is not significant as com-pared to resistance due to fouling caused by membrane adsorption.This phenomenon is due to the existence of hydrophilic and hydropho-bic substances in the river water sample. These substances tend toadsorb easily on themembrane surface and subsequently foul themem-brane. As thepore size increased in themembrane, tendency for adsorp-tion of this substance also increased. This aspect is clearly observed forfouling behaviour at different PEG molecular weights as shown inFig. 11 and Table 3. Normalized flux for PEG 6000 is drastically reducedto 63% for 20 min due to the membrane fouling. Meanwhile PEG 400shows excellence normalized flux as compared to PEG 1500 and PEG6000. As shown in Table 3, even though PEG 6000 shows the lowestintrinsic membrane resistance, it has the highest resistance towardsthe fouling that was due to adsorption, cake formation and concentra-tion polarization.
4. Conclusions
The effects of different PEG contents and molecular weights to thePSf membrane in respect to morphology, flux, rejection and foulingwere investigated. It was found that PEG enhanced pore formation ofthe membrane. As PEG molecular weight increased, a finger-like anddense layer structure also enhanced. The same effect was also noticedfor the membrane water flux. In the case of PEG 6000, the flux startedto level off at 10 wt.% PEG content. Overall rejection of membranedecreased as PEG content and molecular weight increased for bothhumic acid and Sembrong River water sample. PEG enhanced pore for-mation of the membrane but increased the fouling properties of themembrane.
Acknowledgement
The authors thank the financial support for the LRGS Vot A022 grantand the FRGS Vot 0754 grant that were sponsored by the Ministry ofHigher Education Malaysia (MOHE).
References
[1] E.M. Thurman, Preparative isolation of aquatic humic substance, Environ. Sci.Technol. 15 (1981) 468-466.
[2] A. Matilainen, E.T. Gjessing, T. Lahtinen, L. Hed, A. Bhatnagar, M. Sillanpää, An over-view of the methods used in the characterisation of natural organic matter (NOM)in relation to drinking water treatment, Chemosphere 83 (2011) 1431–1442.
[3] H. Wong, K.M. Mok, X.J. Fan, Natural organic matter and formation of trihalometh-anes in two water treatment processes, Desalination 210 (2007) 44–51.
[4] M. Mulder, Basic Principles of Membrane Technology, 2nd ed. Kluwer Academic,London, 1996.
[5] S.P. Nunes, K.V. Peinemann, Membrane Technology in the Chemical Industry, 2006.[6] S. Lee, C.-H. Lee, Effect of membrane properties and pretreatment on flux and NOM
rejection in surface water nanofiltration, Sep. Purif. Technol. 56 (2007) 1–8.[7] X. Wei, R. Wang, Z. Li, A.G. Fane, Development of a novel electrophoresis–UV
grafting technique to modify PES UF membranes used for NOM removal, J.Membr. Sci. 273 (2006) 47–57.
[8] S.K.S. Al-Obeidani, H. Al-Hinai, M.F.A. Goosen, S. Sablani, Y. Taniguchi, H. Okamura,Chemical cleaning of oil contaminated polyethylene hollow fiber microfiltrationmembranes, J. Membr. Sci. 307 (2008) 299–308.
[9] W.S. Ang, N.Y. Yip, A. Tiraferri, M. Elimelech, Chemical cleaning of RO membranesfouled by wastewater effluent: achieving higher efficiency with dual-step cleaning,J. Membr. Sci. 382 (2011) 100–106.
[10] A.W. Zularisam, A.F. Ismail, M.R. Salim, M. Sakinah, T. Matsuura, Application of coag-ulation–ultrafiltration hybrid process for drinking water treatment: optimization ofoperating conditions using experimental design, Sep. Purif. Technol. 65 (2009)193–210.
[11] W. Shi, M.M. Benjamin, Membrane interactions with NOM and an adsorbent in a vi-bratory shear enhanced filtration process (VSEP) system, J. Membr. Sci. 312 (2008)23–33.
[12] J.-y. Tian, Y.-p. Xu, Z.-l. Chen, J. Nan, G.-b. Li, Air bubbling for alleviating membranefouling of immersed hollow-fiber membrane for ultrafiltration of river water,Desalination 260 (2010) 225–230.
[13] L.-J. Mu, W.-Z. Zhao, Hydrophilic modification of polyethersulfone porous mem-branes via a thermal-induced surface crosslinking approach, Appl. Surf. Sci. 255(2009) 7273–7278.
[14] A.V.R. Reddy, D.J. Mohan, A. Bhattacharya, V.J. Shah, P.K. Ghosh, Surface modificationof ultrafiltration membranes by preadsorption of a negatively charged polymer: I.Permeation of water soluble polymers and inorganic salt solutions and fouling resis-tance properties, J. Membr. Sci. 214 (2003) 211–221.
[15] D. Rana, T. Matsuura, Surface modifications for antifouling membranes, Chem. Rev.110 (2010) 2448–2471.
[16] Z. Peng, L.X. Kong, A thermal degradation mechanism of polyvinyl alcohol/silicananocomposites, Polym. Degrad. Stab. 92 (2007) 1061–1071.
[17] E. Yuliwati, A.F. Ismail, Effect of additives concentration on the surface propertiesand performance of PVDF ultrafiltration membranes for refinery produced waste-water treatment, Desalination 273 (2011) 226–234.
[18] M.A. Aroon, A.F. Ismail, M.M. Montazer-Rahmati, T. Matsuura, Morphology andpermeation properties of polysulfone membranes for gas separation: effects ofnon-solvent additives and co-solvent, Sep. Purif. Technol. 72 (2010) 194–202.
[19] A. Mansourizadeh, A.F. Ismail, Preparation and characterization of porous PVDFhollow fiber membranes for CO2 absorption: effect of different non-solvent addi-tives in the polymer dope, Int. J. Greenhouse Gas Control 5 (2011) 640–648.
[20] N.A.A. Hamid, A.F. Ismail, T. Matsuura, A.W. Zularisam, W.J. Lau, E. Yuliwati, M.S.Abdullah, Morphological and separation performance study of polysulfone/titaniumdioxide (PSF/TiO2) ultrafiltration membranes for humic acid removal, Desalination273 (2011) 85–92.
[21] A. Idris, I. Ahmed, M. Misran, Novel high performance hollow fiber ultrafiltrationmembranes spun from LiBr doped solutions, Desalination 249 (2009) 541–548.
[22] M.Z. Yunos, Z. Harun, H. Basri, A.F. Ismail, Effects of water as non-solvent additive onperformance of polysulfone ultrafiltration membrane, Adv. Mater. Res. 488–489(2012) 46–50.
[23] A. Xu, A. Yang, S. Young, D. deMontigny, P. Tontiwachwuthikul, Effect of internalcoagulant on effectiveness of polyvinylidene fluoride membrane for carbon dioxideseparation and absorption, J. Membr. Sci. 311 (2008) 153–158.
[24] H. Basri, A.F. Ismail, M. Aziz, Polyethersulfone (PES)–silver composite UFmembrane:effect of silver loading and PVP molecular weight on membrane morphology andantibacterial activity, Desalination 273 (2011) 72–80.
[25] Y. Zhang, Z. Jin, X. Shan, J. Sunarso, P. Cui, Preparation and characterization of phos-phorylated Zr-doped hybrid silica/PSF composite membrane, J. Hazard. Mater. 186(2011) 390–395.
[26] S. Wongchitphimon, R. Wang, R. Jiraratananon, L. Shi, C.H. Loh, Effect of polyethyl-ene glycol (PEG) as an additive on the fabrication of polyvinylidene fluoride-co-hexafluropropylene (PVDF–HFP) asymmetric microporous hollow fiber mem-branes, J. Membr. Sci. 369 (2011) 329–338.
[27] Y.Ma, F. Shi, J.Ma,M.Wu, J. Zhang, C. Gao, Effect of PEGadditive on themorphology andperformance of polysulfone ultrafiltrationmembranes, Desalination 272 (2011) 51–58.
[28] J.-H. Kim, K.-H. Lee, Effect of PEG additive on membrane formation by phase inver-sion, J. Membr. Sci. 138 (1998) 153–163.
[29] B. Chakrabarty, A.K. Ghoshal,M.K. Purkait, Effect ofmolecularweight of PEGonmem-brane morphology and transport properties, J. Membr. Sci. 309 (2008) 209–221.
[30] D.Y. Koseoglu-Imer, B. Kose, M. Altinbas, I. Koyuncu, The production of polysulfone(PS) membranewith silver nanoparticles (AgNP): physical properties, filtration per-formances, and biofouling resistances of membranes, J. Membr. Sci. 428 (2013)620–628.
[31] F.-Q. Nie, Z.-K. Xu, P. Ye, J. Wu, P. Seta, Acrylonitrile-based copolymer membranescontaining reactive groups: effects of surface-immobilized poly(ethylene glycol)son anti-fouling properties and blood compatibility, Polymer 45 (2004) 399–407.
[32] L.-P. Zhu, L. Xu, B.-K. Zhu, Y.-X. Feng, Y.-Y. Xu, Preparation and characterization ofimproved fouling-resistant PPESK ultrafiltration membranes with amphiphilicPPESK-graft-PEG copolymers as additives, J. Membr. Sci. 294 (2007) 196–206.
[33] D.H. Kim, S.-H. Moon, J. Cho, Investigation of the adsorption and transport of naturalorganic matter (NOM) in ion-exchange membranes, Desalination 151 (2003)11–20.
[34] B.D. McCloskey, H.B. Park, H. Ju, B.W. Rowe, D.J. Miller, B.J. Chun, K. Kin, B.D.Freeman, Influence of polydopamine deposition conditions on pure water fluxand foulant adhesion resistance of reverse osmosis, ultrafiltration, andmicrofiltrationmembranes, Polymer 51 (2010) 3472–3485.
[35] J. Labanowski, G. Feuillade, Dissolved organic matter: precautions for the study ofhydrophilic substances using XAD resins, Water Res. 45 (2011) 315–327.
[36] H. Hua, N. Li, L. Wu, H. Zhong, G. Wu, Z. Yuan, X. Lin, L. Tang, Anti-fouling ultrafiltra-tion membrane prepared from polysulfone-graft-methyl acrylate copolymers byUV-induced grafting method, J. Environ. Sci. 20 (2008) 565–570.
[37] Q.-Z. Zheng, P. Wang, Y.-N. Yang, Rheological and thermodynamic variation inpolysulfone solution by PEG introduction and its effect on kinetics of membraneformation via phase-inversion process, J. Membr. Sci. 279 (2006) 230–237.
[38] G.R. Guillen, Y. Pan, M. Li, E.M.V. Hoek, Preparation and characterization of mem-branes formed by nonsolvent induced phase separation: a review, Ind. Eng. Chem.Res. 50 (2011) 3798–3817.
[39] J.-f. Li, Z.-l. Xu, H. Yang, C.-p. Feng, J.-h. Shi, Hydrophilic Microporous PES Mem-branes Prepared by PES/PEG/DMAc Casting Solutions, 2007.
[40] A.W. Zularisam, A.F. Ismail, R. Salim, Behaviours of natural organicmatter inmembranefiltration for surface water treatment— a review, Desalination 194 (2006) 211–231.
[41] A.W. Zularisam, A.F. Ismail, M.R. Salim, M. Sakinah, H. Ozaki, The effects of naturalorganicmatter (NOM) fractions on fouling characteristics and flux recovery of ultra-filtration membranes, Desalination 212 (2007) 191–208.


![Hydrophilic self-replenishing coatings with long-term ... · organic fouling and biofouling in general [5]. Coatings 2018, 8, 184; ... anti-fouling character of polyethylene glycol](https://img.pdfslide.us/doc/110x75/5e7a20e240d6da658e06f1e5/hydrophilic-self-replenishing-coatings-with-long-term-organic-fouling-and-biofouling.jpg)