Embed Size (px)
Citation preview
STUDIES IN FILTER CAKE CHARACTERISATION AND MODELLING
TEOH SOO KHEAN (B. Eng., Univ. Malaya; M. Eng., NUS)
A THESIS SUBMITTED
FOR THE DEGREE OF DOCTOR OF PHILOSOPHY
DEPARTMENT OF CHEMICAL &
ENVIRONMENTAL ENGINEERING
NATIONAL UNIVERSITY OF SINGAPORE
2003
Dedicated to my lovely son, Chan Herng,Chan Herng,Chan Herng,Chan Herng,
My loving husband, Teik LimTeik LimTeik LimTeik Lim
And my dearest ParentsParentsParentsParents
Constantly loving
Always understanding
i
ACKNOWLEDGEMENTS
First of all, I wish to thank my academic supervisors, Associate Professor Tan
Reginald B. H. and Professor Tien Chi for their invaluable guidance, advice and help
throughout the course of this research study. And, my sincere gratitude to the National
University of Singapore (NUS) and the National Science and Technology Board
(NSTB) for funding this research project.
I also would like to extend my thanks to the Head of Department, Professor
Neoh K. G. and all the staff members in the Department of Chemical and
Environmental Engineering, National University of Singapore. Without their kind and
helpful support, I would not be able to carry out my work smoothly and in good order.
And, my special thanks to Mr. Boey K. H., the Senior Lab Technologist from Lab
E4A-07 where I used to work in, Mr. Ng K. P. from Workshop 2, Mdm. Teo A. P.,
Mdm. Chiang H. J., Mdm. Koh, Mdm. Tay, Ms. Ng, Mdm. Siva, Mdm. Sutini, Ms.
Goh S. P. and many others. Also, I wish to thank Mr. Bernd R. and Ms. Er Y. S. for
providing the computer program on Filtration Model proposed by Stamatakis and
Tien.
To my son, my husband and my family, I am most grateful for their love,
patience, encouragement, and support that enable me to complete this thesis. Last but
not least, in the memory of late Dr. He Daxin, I wish to take this opportunity to
express my sincere gratitude for his kind guidance, advice and help at the initial stage
of this course. May he rest in peace forever.
*** MANY THANKS TO ALL OF YOU ***
ii
TABLE OF CONTENTS
Page
ACKNOWLEDGEMENT i
TABLE OF CONTENTS ii
SUMMARY v
LIST OF TABLES vii
LIST OF FIGURES ix
NOTATION xviii
CHAPTER 1 INTRODUCTION
1.1 Filtration and Solid-liquid Separation 1
1.2 Classification of Filtration 2
1.3 Application of Filtration 4
1.4 Filter Cake Analysis 5
1.5 Scope and Objectives 7
CHAPTER 2 LITERATURE REVIEW
2.1 Cake Filtration Theory 13
2.1.1 Fluid Flow in Porous Media 13
2.1.2 Filter Cake Permeability and Porosity 16
2.1.3 Solid Compressive Pressure, sp and Hydraulic (Pore Liquid)
Pressure, lp 18
2.1.4 Empirical Constitutive Equations Relating Local Cake
Properties and Compressive Pressure 21
2.2 Analysis and Modelling of Cake Filtration
(cake formation and growth) 26
2.2.1 Determination of Empirical Data for Filter Cake Analysis 31
2.2.1.1 The Compression-Permeability Cell 32
2.2.1.2 Filtration Experiment 37
CHAPTER 3 DEVELOPMENT OF A NEW MULTIFUNCTION TEST CELL
3.1 Introduction 46
iii
3.2 Description of the Multifunction Test Cell 47
3.2.1 Multifunction Test Cell used as a C-P Cell 48
3.2.2 Multifunction Test Cell used as a Filtration Unit 50
3.3 Experiments 51
3.3.1 Combined Resistance of Filter Medium and Porous Support Plate 51
3.3.2 Filter Cake Compression and Permeation Test 52
3.3.3 Filtration Test 53
3.4 Results and Discussion 53
3.4.1 Combined Resistance of Filter Medium and Porous Support Plate 53
3.4.2 Correction of Applied Pressure in C-P Cell 54
3.4.3 Filter Cake Compressibility and Permeability 55
3.4.4 Constant Pressure Filtration 56
3.4.5 Correlation of C-P and Filtration Data 60
3.5 Concluding Remarks 62
CHAPTER 4 EFFECT OF THE RELATIONSHIP BETWEEN PORE LIQUID
PRESSURE AND CAKE COMPRESSIVE STRESS ON CAKE FILTRATION
ANALYSIS
4.1 Introduction 91
4.2 Explicit Expressions of lp 92
4.3 Re-derivation of the Parabolic Law for Constant-Pressure Filtration 94
4.4. Experiments 100
4.5 Results and Discussions 100
4.5.1 C-P Cell and Filtration Results 100
4.5.2 Assessing the Effect of the sl pp − Relationships 101
4.5.3 Correspondence between the Specific Cake Resistance
determined from Filtration Data and C-P-cell Measurement Results 102
4.5.4 Correlation of sl pp − Relationship with Cake Characteristics 104
4.6 Concluding Remarks 105
CHAPTER 5 A NEW PROCEDURE OF INTERPRETING FILTRATION DATA
5.1 Introduction 115
iv
5.2 Initial Filtration Period 117
5.2.1 Analysis of Initial Filtration Period 118
5.3 Determination of Cake Characteristics from Filtration Experimental
Data 120
5.3.1 Effect of Medium Resistance 123
5.3.2 New Procedure for Interpreting Filtration Data 126
5.4 Concluding Remarks 129
CHAPTER 6 CONCLUSIONS AND RECOMMENDATIONS FOR 149
FUTURE WORK
REFERENCES 155
APPENDIX A PROPERTIES OF MATERIALS 164
APPENDIX B EXAMPLES TO DEMONSTRATE THE NEW
PROCEDURE OF INTERPRETING FILTRATION
DATA 168
APPENDIX C LIST OF PUBLICATIONS 172
v
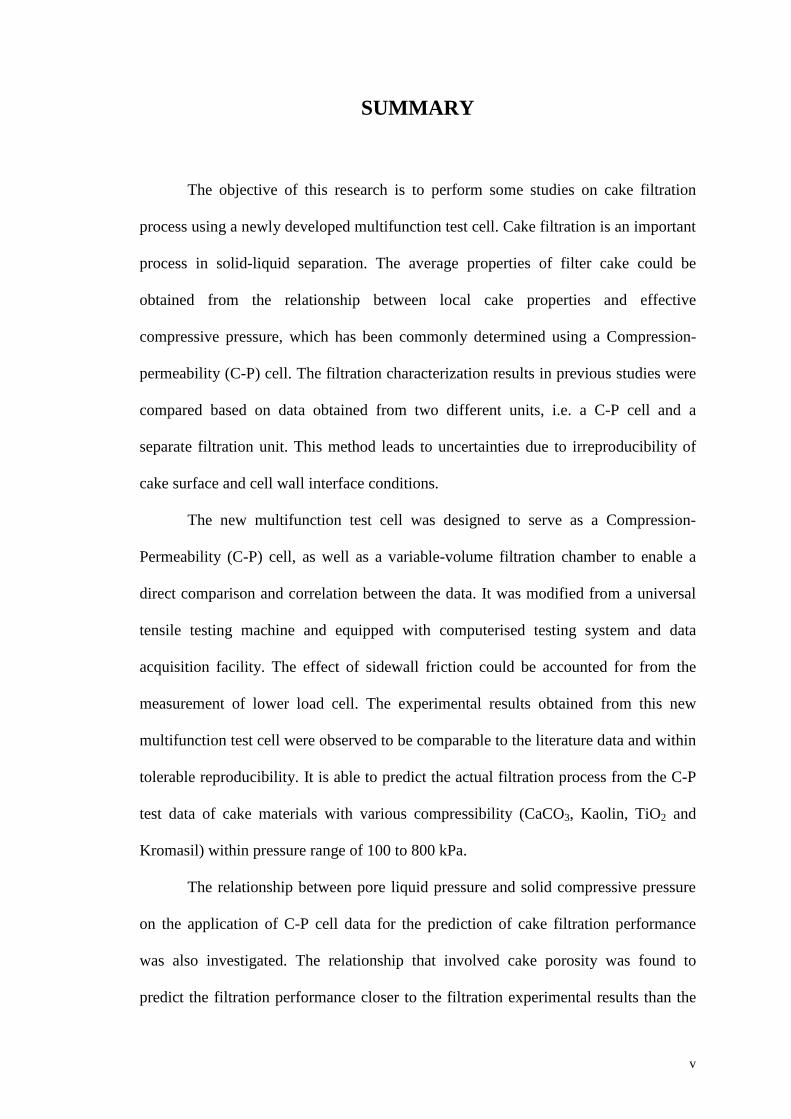
SUMMARY
The objective of this research is to perform some studies on cake filtration
process using a newly developed multifunction test cell. Cake filtration is an important
process in solid-liquid separation. The average properties of filter cake could be
obtained from the relationship between local cake properties and effective
compressive pressure, which has been commonly determined using a Compression-
permeability (C-P) cell. The filtration characterization results in previous studies were
compared based on data obtained from two different units, i.e. a C-P cell and a
separate filtration unit. This method leads to uncertainties due to irreproducibility of
cake surface and cell wall interface conditions.
The new multifunction test cell was designed to serve as a Compression-
Permeability (C-P) cell, as well as a variable-volume filtration chamber to enable a
direct comparison and correlation between the data. It was modified from a universal
tensile testing machine and equipped with computerised testing system and data
acquisition facility. The effect of sidewall friction could be accounted for from the
measurement of lower load cell. The experimental results obtained from this new
multifunction test cell were observed to be comparable to the literature data and within
tolerable reproducibility. It is able to predict the actual filtration process from the C-P
test data of cake materials with various compressibility (CaCO3, Kaolin, TiO2 and
Kromasil) within pressure range of 100 to 800 kPa.
The relationship between pore liquid pressure and solid compressive pressure
on the application of C-P cell data for the prediction of cake filtration performance
was also investigated. The relationship that involved cake porosity was found to
predict the filtration performance closer to the filtration experimental results than the
vi
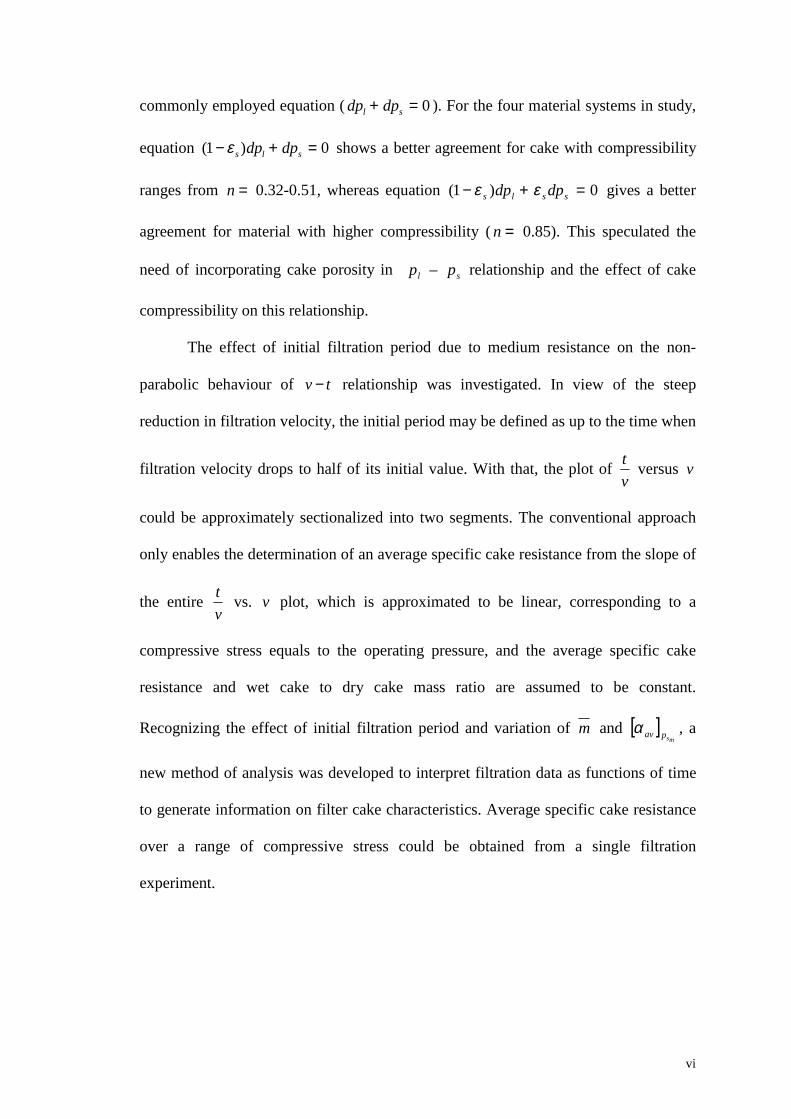
commonly employed equation ( 0=+ sl dpdp ). For the four material systems in study,
equation 0)1( =+− sls dpdpε shows a better agreement for cake with compressibility
ranges from =n 0.32-0.51, whereas equation 0)1( =+− ssls dpdp εε gives a better
agreement for material with higher compressibility ( =n 0.85). This speculated the
need of incorporating cake porosity in lp – sp relationship and the effect of cake
compressibility on this relationship.
The effect of initial filtration period due to medium resistance on the non-
parabolic behaviour of tv − relationship was investigated. In view of the steep
reduction in filtration velocity, the initial period may be defined as up to the time when
filtration velocity drops to half of its initial value. With that, the plot of vt versus v
could be approximately sectionalized into two segments. The conventional approach
only enables the determination of an average specific cake resistance from the slope of
the entire vt vs. v plot, which is approximated to be linear, corresponding to a
compressive stress equals to the operating pressure, and the average specific cake
resistance and wet cake to dry cake mass ratio are assumed to be constant.
Recognizing the effect of initial filtration period and variation of m and [ ]mspavα , a
new method of analysis was developed to interpret filtration data as functions of time
to generate information on filter cake characteristics. Average specific cake resistance
over a range of compressive stress could be obtained from a single filtration
experiment.
vii
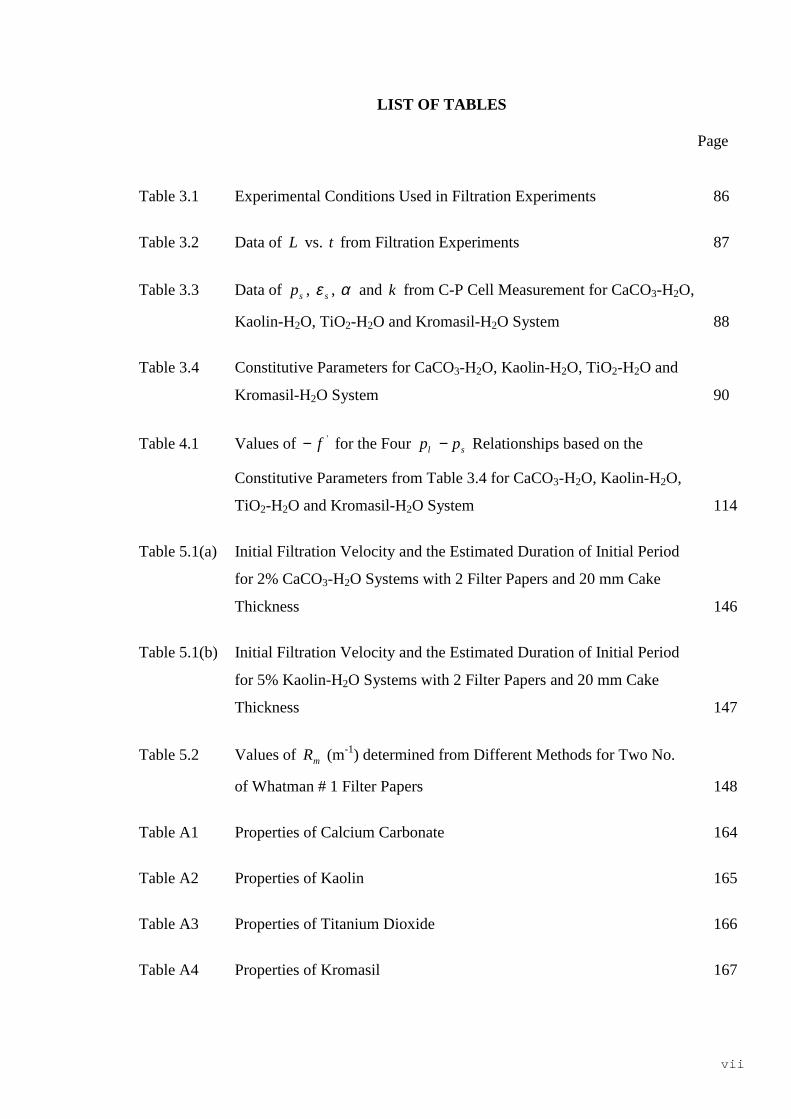
LIST OF TABLES
Page
Table 3.1 Experimental Conditions Used in Filtration Experiments 86
Table 3.2 Data of L vs. t from Filtration Experiments 87
Table 3.3 Data of sp , sε , α and k from C-P Cell Measurement for CaCO3-H2O,
Kaolin-H2O, TiO2-H2O and Kromasil-H2O System 88
Table 3.4 Constitutive Parameters for CaCO3-H2O, Kaolin-H2O, TiO2-H2O and
Kromasil-H2O System 90
Table 4.1 Values of 'f− for the Four sl pp − Relationships based on the
Constitutive Parameters from Table 3.4 for CaCO3-H2O, Kaolin-H2O,
TiO2-H2O and Kromasil-H2O System 114
Table 5.1(a) Initial Filtration Velocity and the Estimated Duration of Initial Period
for 2% CaCO3-H2O Systems with 2 Filter Papers and 20 mm Cake
Thickness 146
Table 5.1(b) Initial Filtration Velocity and the Estimated Duration of Initial Period
for 5% Kaolin-H2O Systems with 2 Filter Papers and 20 mm Cake
Thickness 147
Table 5.2 Values of mR (m-1) determined from Different Methods for Two No.
of Whatman # 1 Filter Papers 148
Table A1 Properties of Calcium Carbonate 164
Table A2 Properties of Kaolin 165
Table A3 Properties of Titanium Dioxide 166
Table A4 Properties of Kromasil 167
viii
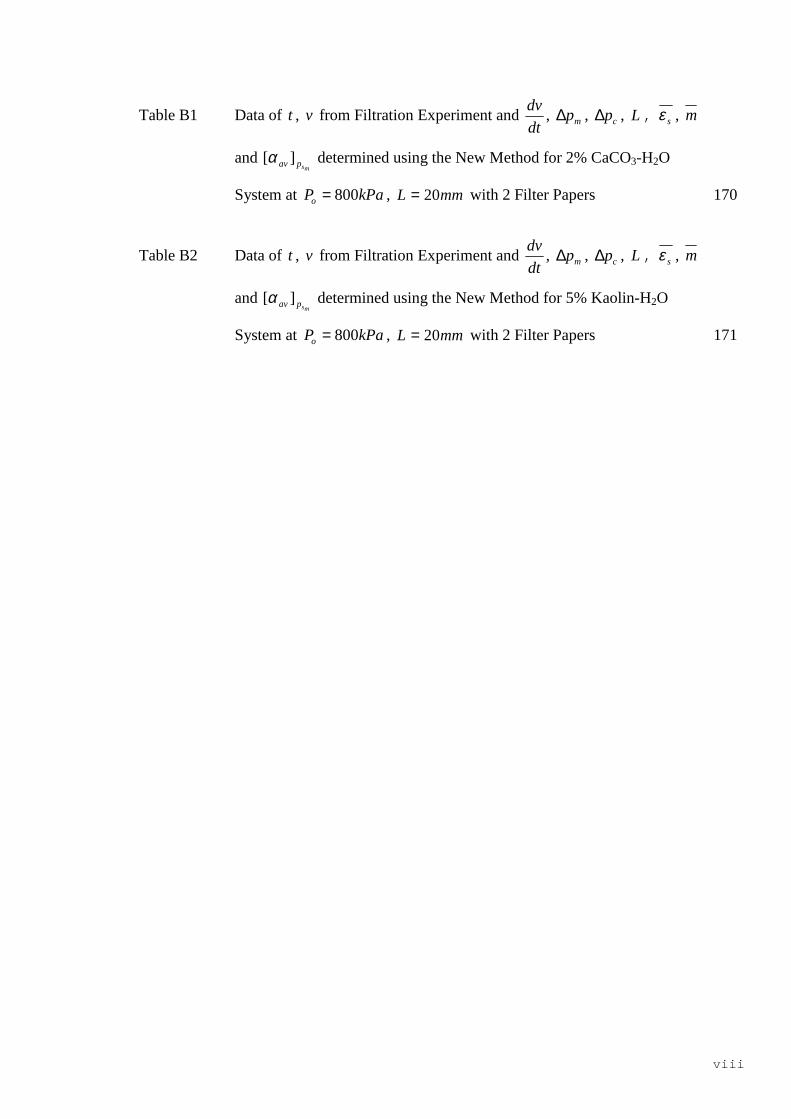
Table B1 Data of t , v from Filtration Experiment and dtdv , mp∆ , cp∆ , L , sε , m
and mspav ][α determined using the New Method for 2% CaCO3-H2O
System at kPaPo 800= , mmL 20= with 2 Filter Papers 170
Table B2 Data of t , v from Filtration Experiment and dtdv , mp∆ , cp∆ , L , sε , m
and mspav ][α determined using the New Method for 5% Kaolin-H2O
System at kPaPo 800= , mmL 20= with 2 Filter Papers 171
ix
LIST OF FIGURES
Page
Figure 1.1 Stages in Solid-liquid Separation (Tiller et al., 1987) 10 Figure 1.2 Deep Bed Filtration versus Cake Filtration (Svarovsky, 1981) 11 Figure 1.3 Classification of Pressure Filtration based on Pumping Mechanism
(Tiller et al., 1987) 12
Figure 2.1 Compressive Force due to Frictional Drag in a Filter Cake (Tiller, 1953) 41
Figure 2.2 Correlation of the ratio c
s
pp
∆ with Porosity (Willis et al., 1974) 42
Figure 2.3 Variation of Filtration Resistance and Wet Cake to Dry Cake Mass
Ratio with Time in Constant Pressure Filtration (Tiller and Cooper, 1960) 43
Figure 2.4 A Typical Compression-Permeability Cell 44
Figure 2.5 Schematic Diagram of Orifice Filter and the Plot of dvdt versus v
(Murase et al., 1987) 45
Figure 3.1 Schematic Diagram of the New Multifunction Test Cell Set-up 65
Figure 3.2 Multifunction Test Cell used as a C-P Cell 66
Figure 3.3 Multifunction Test Cell used as a Filtration Cell 67
Figure 3.4 Filter Septum Resistance vs. Applied Pressure at Various Number of
Filter Papers 68
Figure 3.5 Cumulative Filtrate Volume vs. Time for Filter Septum at Various
Compressive Pressure 68
Figure 3.6 Transmitted Pressure vs. Applied Pressure for 50g CaCO3 in De-ionized
Water 69
x
Figure 3.7 Variation of Cake Thickness with Time in the Compression of 50g
CaCO3 in De-ionized Water at sp = 820 kPa 69
Figure 3.8(a) Specific Cake Resistance vs. Solid Compressive Pressure for CaCO3-H2O
system in C-P Test 70
Figure 3.8(b) Cake Porosity vs. Solid Compressive Pressure for CaCO3-H2O system
in C-P Test 70
Figure 3.9(a) Cake Permeability vs. Cake Porosity for CaCO3-H2O system in C-P Test 71
Figure 3.9(b) Cake Permeability vs. Cake Porosity for Kaolin-H2O system in C-P Test 71
Figure 3.9(c) Cake Permeability vs. Cake Porosity for TiO2-H2O system in C-P Test 72
Figure 3.9(d) Cake Permeability vs. Cake Porosity for Kromasil-H2O system in
C-P Test 72
Figure 3.10(a) Cumulative Filtrate Volume per Unit Area vs. Filtration Time for 2%
CaCO3-H2O Suspension with Preset Cake Thickness = 20 mm and under
Filtration Pressure of 800 kPa 73
Figure 3.10(b) vt vs. v for CaCO3-H2O Suspension with Preset Cake Height = 20 mm
and under Filtration Pressure of 8 x 10⁵ Pa 73
Figure 3.11(a) Cake Thickness vs. Filtration Time for 2% CaCO3-H2O Suspension
at Various Filtration Pressure 74
Figure 3.11(b) Cake Thickness vs. Filtration Time for 5% Kaolin-H2O Suspension
at Various Filtration Pressure 74
Figure 3.12(a) Average Specific Cake Resistance vs. Cake Thickness for CaCO3-H2O
system in Filtration Test 75
Figure 3.12(b) Average Specific Cake Resistance vs. Cake Thickness for Kaolin-H2O
system in Filtration Test 75
xi
Figure 3.13(a) Cumulative Filtrate Volume per Unit Area vs. Filtration Time for 2%
CaCO3-H2O Suspension with Various Cake Thickness Setting and
Filtration Pressure 76
Figure 3.13(b) Cumulative Filtrate Volume per Unit Area vs. Filtration Time for 5%
Kaolin-H2O Suspension with Various Cake Thickness Setting
and Filtration Pressure 76
Figure 3.14(a) Cumulative Filtrate Volume per Unit Area vs. Filtration Time for 2%
CaCO3-H2O Suspension at Filtration Pressure of 100 kPa with Various
Cake Thickness Setting for the first 10mm of Cake Thickness 77
Figure 3.14(b) Cumulative Filtrate Volume per Unit Area vs. Filtration Time for 2%
CaCO3-H2O Suspension at Filtration Pressure of 500 kPa with Various
Cake Thickness Setting for the first 10mm of Cake Thickness 77
Figure 3.14(c) Cumulative Filtrate Volume per Unit Area vs. Filtration Time for 2%
CaCO3-H2O Suspension at Filtration Pressure of 800 kPa with Various
Cake Thickness Setting for the first 10mm of Cake Thickness 78
Figure 3.15 Wet Cake to Dry Cake Mass Ratio vs. Filtration Time for CaCO3-H2O
System at Different Filtration Pressure 78
Figure 3.16(a) Average Specific Cake Resistance vs. Filtration Pressure for CaCO3-H2O
System in Filtration Test 79
Figure 3.16(b) Average Cake Porosity vs. Filtration Pressure for CaCO3-H2O System in
Filtration Test 79
Figure 3.17(a) Specific Cake Resistance vs. Compressive Pressure from C-P Test
for CaCO3-H2O, Kaolin-H2O, TiO2- H2O and Kromasil- H2O System 80
Figure 3.17(b) Cake Porosity vs. Compressive Pressure from C-P Test for CaCO3-H2O,
Kaolin-H2O, TiO2- H2O and Kromasil- H2O System 80
xii
Figure 3.18(a) Comparisons of Average Specific Cake Resistance for CaCO3-H2O
System between Filtration Test and Predictions from C-P Test 81
Figure 3.18(b) Comparisons of Average Specific Cake Resistance for Kaolin-H2O
System between Filtration Test and Predictions from C-P Test 81
Figure 3.18(c) Comparisons of Average Specific Cake Resistance for TiO2-H2O
System between Filtration Test and Predictions from C-P Test 82
Figure 3.18(d) Comparisons of Average Specific Cake Resistance for Kromasil-H2O
System between Filtration Test and Predictions from C-P Test 82
Figure 3.19(a) Comparisons of Average Cake Porosity for CaCO3-H2O System between
Filtration Test and Predictions from C-P Test 83
Figure 3.19(b) Comparisons of Average Cake Porosity for Kaolin-H2O System between
Filtration Test and Predictions from C-P Test 83
Figure 3.19(c) Comparisons of Average Cake Porosity for TiO2-H2O System between
Filtration Test and Predictions from C-P Test 84
Figure 3.19(d) Comparisons of Average Cake Porosity for Kromasil-H2O System
between Filtration Test and Predictions from C-P Test 84
Figure 3.20 Comparisons of Filtrate Volume vs. Time for CaCO3-H2O Slurry
between Filtration Test, Simulation from Stamatakis and Tien and
Conventional Filtration Theory: Equations 2.51 and 2.53 85
Figure 3.21 Comparisons of Cake Thickness vs. Time for CaCO3-H2O Slurry
between Filtration Test, Simulation from Stamatakis and Tien and
Conventional Filtration Theory: Equations 2.51 and 2.53 85
Figure 4.1 Representation of One Dimensional Cake Filtration 107
Figure 4.2(a) Results of lp versus sp for CaCO3 Filter Cakes according to
Cases 1 to 4 at oP = 2 x 10⁵ Pa and 7 x 10⁵ Pa 108
xiii
Figure 4.2(b) Results of lp versus sp for Kaolin Filter Cakes according to
Cases 1 to 4 at oP = 2 x 10⁵ Pa and 7 x 10⁵ Pa 108
Figure 4.2(c) Results of lp versus sp for TiO2 Filter Cakes according to
Cases 1 to 4 at oP = 2 x 10⁵ Pa and 7 x 10⁵ Pa 109
Figure 4.2(d) Results of lp versus sp for Kromasil Filter Cakes according to
Cases 1 to 4 at oP = 2 x 10⁵ Pa and 7 x 10⁵ Pa 109
Figure 4.3(a) Results of
msp versus oP for CaCO3 Filter Cakes according to
Case 1 to Case 4 110
Figure 4.3(b) Results of
msp versus oP for Kaolin Filter Cakes according to
Case 1 to Case 4 110
Figure 4.3(c) Results of
msp versus oP for TiO2 Filter Cakes according to
Case 1 to Case 4 111
Figure 4.3(d) Results of
msp versus oP for Kromasil Filter Cakes according to
Case 1 to Case 4 111
Figure 4.4(a) Comparison of Experimental Determined avα and Estimated Values based
on Different sl pp − Relationships for CaCO3 Cake 112
Figure 4.4(b) Comparison of Experimental Determined avα and Estimated Values based
on Different sl pp − Relationships for Kaolin Cake 112
Figure 4.4(c) Comparison of Experimental Determined avα and Estimated Values based
on Different sl pp − Relationships for TiO2 Cake 113
Figure 4.4(d) Comparison of Experimental Determined avα and Estimated Values based
on Different sl pp − Relationships for Kromasil Cake 113
xiv
Figure 5.1 vt vs. v for Filtration of 2% CaCO3-H2O System at 100 kPa with
pre-set Cake Thickness of 10mm and Various Medium Resistances 132
Figure 5.2(a) vt vs. v for Filtration of 2% CaCO3-H2O System using 2 Filter
Papers with pre-set Cake Thickness of 20mm and Filtration Pressure
of 200 and 800 kPa 133
Figure 5.2(b) vt vs. v for Filtration of 5% Kaolin-H2O System using 2 Filter
Papers with pre-set Cake Thickness of 20mm and Filtration Pressure
of 200 and 800 kPa 133
Figure 5.3(a) Filtration Velocity vs. Time for Filtration of 2% CaCO3-H2O System
at Pre-set Cake Thickness of 20mm with 2 Filter Papers 134
Figure 5.3(b) Filtration Velocity vs. Time for Filtration of 5% Kaolin-H2O System
at Pre-set Cake Thickness of 20mm with 2 Filter Papers 134
Figure 5.4(a) Sectionalized of vt vs. v Plot for Filtration of 2% CaCO3-H2O System
at pre-set Cake Thickness of 20mm with 2 Filter Papers 135
Figure 5.4(b) Sectionalized of vt vs. v Plot for Filtration of 5% Kaolin-H2O System
at pre-set Cake Thickness of 20mm with 2 Filter Papers 135
Figure 5.5(a) Comparisons of mp∆ and cp∆ vs. t determined from
0,
=
tdtdvm
R and
lattermR , for Filtration of 2% CaCO3-H2O System using 2 Filter Papers
with pre-set Cake Thickness of 20mm and Filtration Pressure of
800 kPa 136
Figure 5.5(b) Comparisons of mp∆ and cp∆ vs. t determined from
0,
=
tdtdvm
R and
lattermR , for Filtration of 5% Kaolin-H2O System using 2 Filter Papers
with pre-set Cake Thickness of 20mm and Filtration Pressure of
xv
800 kPa 136
Figure 5.6(a) Comparisons of Average Specific Cake Resistance vs. cp∆ determined
from 0
,=
tdtdvm
R and lattermR , for Filtration of 2% CaCO3-H2O System
using 2 Filter Papers with pre-set Cake Thickness of 20mm and
Filtration Pressure of 300 kPa 137
Figure 5.6(b) Comparisons of Average Specific Cake Resistance vs. cp∆ determined
from 0
,=
tdtdvm
R and lattermR , for Filtration of 2% CaCO3-H2O System
using 2 Filter Papers with pre-set Cake Thickness of 20mm and
Filtration Pressure of 800 kPa 137
Figure 5.7(a) Comparisons of Average Specific Cake Resistance vs. cp∆ determined
from 0
,=
tdtdvm
R and lattermR , for Filtration of 5% Kaolin-H2O System
using 2 Filter Papers with pre-set Cake Thickness of 20mm and
Filtration Pressure of 300 kPa 138
Figure 5.7(b) Comparisons of Average Specific Cake Resistance vs. cp∆ determined
from 0
,=
tdtdvm
R and lattermR , for Filtration of 5% Kaolin-H2O System
using 2 Filter Papers with pre-set Cake Thickness of 20mm and
Filtration Pressure of 800 kPa 138
Figure 5.8(a) Cake Thickness vs. Filtration Time for CaCO3 Cake at Various
Filtration Pressures and Fitting with Equation 5.4 139
Figure 5.8(b) Cake Thickness vs. Filtration Time for Kaolin Cake at Various
Filtration Pressures and Fitting with Equation 5.4 139
Figure 5.9(a) Variation of sε with t for CaCO3 Cake at Filtration Pressure of
800 kPa 140
Figure 5.9(b) Variation of sε with t for Kaolin Cake at Filtration Pressure of
xvi
800 kPa 140
Figure 5.10(a) Variation of m with t for CaCO3 Cake at Filtration Pressure of
800 kPa. 141
Figure 5.10(b) Variation of m with t for Kaolin Cake at Filtration Pressure of
800 kPa. 141
Figure 5.11(a) Comparisons between Average Specific Cake Resistance determined
from the New Procedure using 0
,=
tdtdvm
R and that obtained using
Conventional 0=+ sl dpdp Relationship with Constitutive Parameters
determined from C-P Cell Measurement for 2% CaCO3-H2O System
at Various Filtration Pressures 142
Figure 5.11(b) Comparisons between Average Specific Cake Resistance determined
from the New Procedure using lattermR , and that obtained using
Conventional 0=+ sl dpdp Relationship with Constitutive Parameters
determined from C-P Cell Measurement for 2% CaCO3-H2O System
at Various Filtration Pressures 142
Figure 5.12(a) Comparisons between Average Specific Cake Resistance determined
from the New Procedure using 0
,=
tdtdvm
R and that obtained using
Conventional 0=+ sl dpdp Relationship with Constitutive Parameters
determined from C-P Cell Measurement for 5% Kaolin-H2O System
at Various Filtration Pressures 143
Figure 5.12(b) Comparisons between Average Specific Cake Resistance determined
from the New Procedure using lattermR , and that obtained using
Conventional 0=+ sl dpdp Relationship with Constitutive Parameters
determined from C-P Cell Measurement for 5% Kaolin-H2O System
at Various Filtration Pressures 143
xvii
Figure 5.13(a) Comparisons between Average Specific Cake Resistance determined
from the New Procedure using 0
,=
tdtdvm
R and that obtained using
Different sl pp − Relationship with Constitutive Parameters determined
from C-P Cell Measurement for 2% CaCO3-H2O System at Various
Filtration Pressures 144
Figure 5.13(b) Comparisons between Average Specific Cake Resistance determined
from the New Procedure using lattermR , and that obtained using
Different sl pp − Relationship with Constitutive Parameters determined
from C-P Cell Measurement for 2% CaCO3-H2O System at Various
Filtration Pressures 144
Figure 5.14(a) Comparisons between Average Specific Cake Resistance determined
from the New Procedure using 0
,=
tdtdvm
R and that obtained using
Different sl pp − Relationship with Constitutive Parameters determined
from C-P Cell Measurement for 5% Kaolin-H2O System at Various
Filtration Pressures 145
Figure 5.14(b) Comparisons between Average Specific Cake Resistance determined
from the New Procedure using lattermR , and that obtained using
Different sl pp − Relationship with Constitutive Parameters determined
from C-P Cell Measurement for 5% Kaolin-H2O System at Various
Filtration Pressures 145
Figure A1 Particle Size Distribution for CaCO3 164 Figure A2 Particle Size Distribution for Kaolin 165 Figure A3 Particle Size Distribution for TiO2 166 Figure A4 Particle Size Distribution for Kromasil 167
xviii
NOTATION
a empirical constant
A cross-sectional filtration area
cA area of contact between particles
B empirical constant
c mass of solid per unit volume of suspending liquid
'c proportionality constant
fC cohesive stress along side wall
D cake diameter, capillary diameter (equation 2.7)
hD hydraulic diameter, diameter of hole (Figure 2.5)
e ratio of cake porosity to solidosity, ε
ε−1
E empirical constant
f frictional coefficient along side wall
sF accumulated drag force
g acceleration of gravity
H empirical constant
RJJ , correction factor for variation of liquid flow rate through cake
k cake permeability
ok Rankine constant
K Kozeny constant
L cake thickness
m mass ratio of wet cake to dry cake
n compressibility coefficient
p pressure
ip a low pressure where specific resistance and porosity are constant
lp pore liquid pressure
Mp applied mechanical pressure
sp solid compressive stress
msp solid compressive pressure at cake-media interface
xix
Tp transmitted pressure "p compressibility coefficient
aP empirical constant
oPP, suspension pressure or filtration pressure
lqq, liquid superficial velocity
mlq )( liquid permeation velocity through the medium
sq solid superficial velocity
Q filtrate flow rate
cR cake resistance
mR medium resistance
s solid particle mass fraction in the suspension
S specific surface area of particle
t time
u average fluid velocity
v cumulative filtrate volume per unit medium area
fv cumulative filtrate volume per unit medium area at transition point
w mass of cake solid per unit medium area
sW total mass of dry solid
x distance from medium surface
Greek Letters
ε cake porosity
sε cake solidosity (= ε−1 )
msε cake solidosity at cake-media interface
α specific cake resistance
meanα average specific cake resistance proposed by Kottwitz and Boylan
(1958)
Rα average specific cake resistance defined by Ruth (1935)
µ liquid viscosity
xx
sρ solid particle density
ρ liquid density
"β compressibility coefficient in equation (2.21)
ηβλγ ,,, coefficient
∆H constant liquid head
p∆ pressure gradient
cp∆ pressure drop across cake
mp∆ pressure drop across medium
Subscript
av average cake property for entire cake
avx average cake property between medium and distance x
exp experimental value
i constant cake property at low pressure ip
x distance from medium surface
average value
o cake property at zero stress
1
CHAPTER 1
INTRODUCTION
1.1 Filtration and Solid-liquid Separation
Filtration has been recognized as one of the oldest unit operations, directly or
indirectly related to the wine making industries. The principle underlying filtration
basically involves the separation of a solid from the liquid in which it is suspended by
passing the liquid through a porous medium with pore sizes too small to allow the
passage of the solid particles.
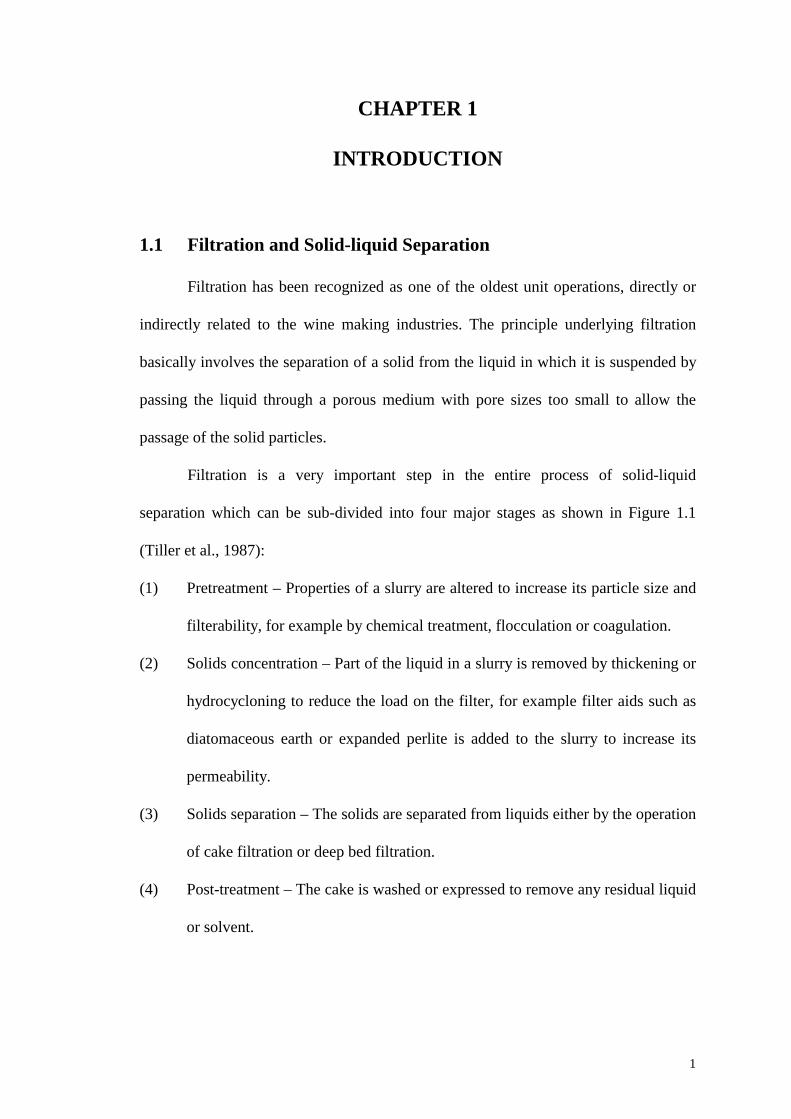
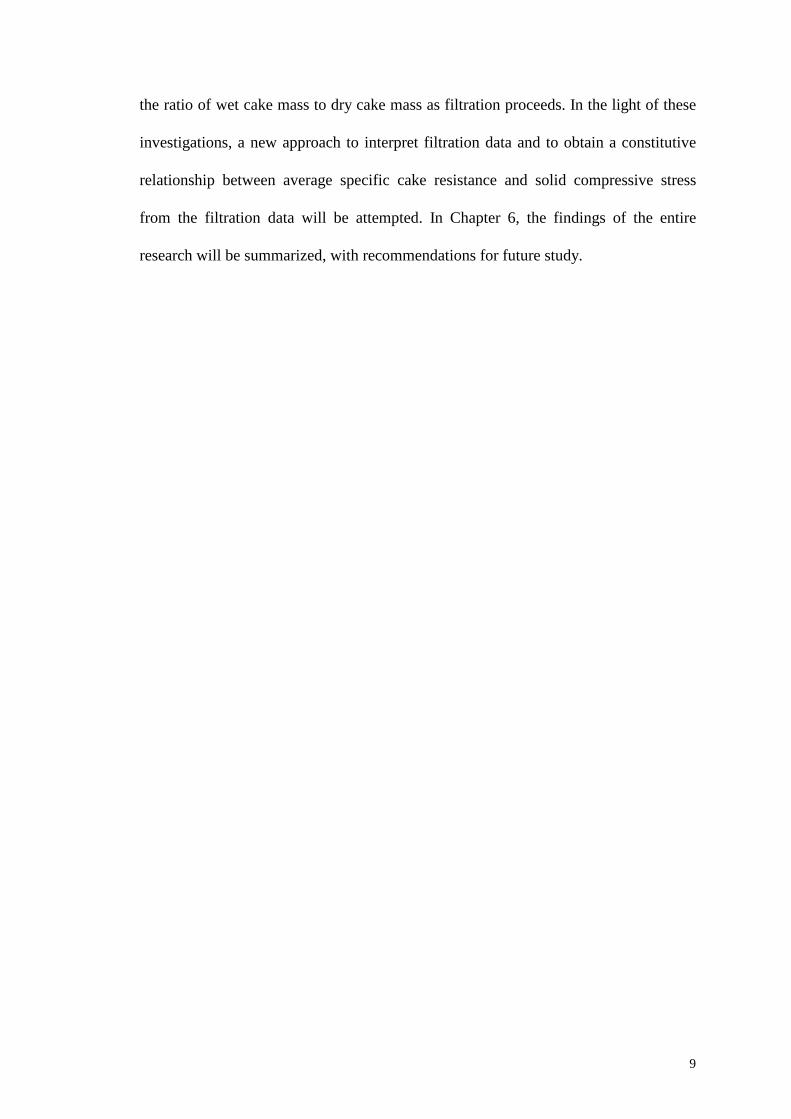
Filtration is a very important step in the entire process of solid-liquid
separation which can be sub-divided into four major stages as shown in Figure 1.1
(Tiller et al., 1987):
(1) Pretreatment – Properties of a slurry are altered to increase its particle size and
filterability, for example by chemical treatment, flocculation or coagulation.
(2) Solids concentration – Part of the liquid in a slurry is removed by thickening or
hydrocycloning to reduce the load on the filter, for example filter aids such as
diatomaceous earth or expanded perlite is added to the slurry to increase its
permeability.
(3) Solids separation – The solids are separated from liquids either by the operation
of cake filtration or deep bed filtration.
(4) Post-treatment – The cake is washed or expressed to remove any residual liquid
or solvent.
2
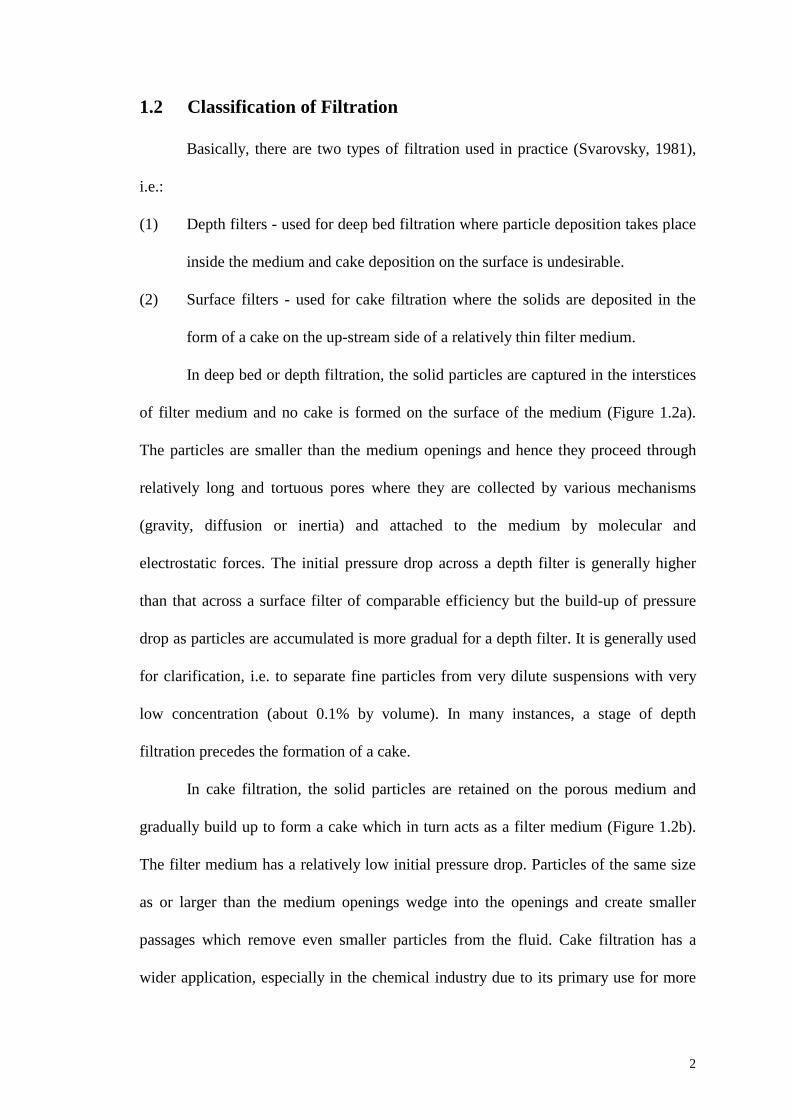
1.2 Classification of Filtration
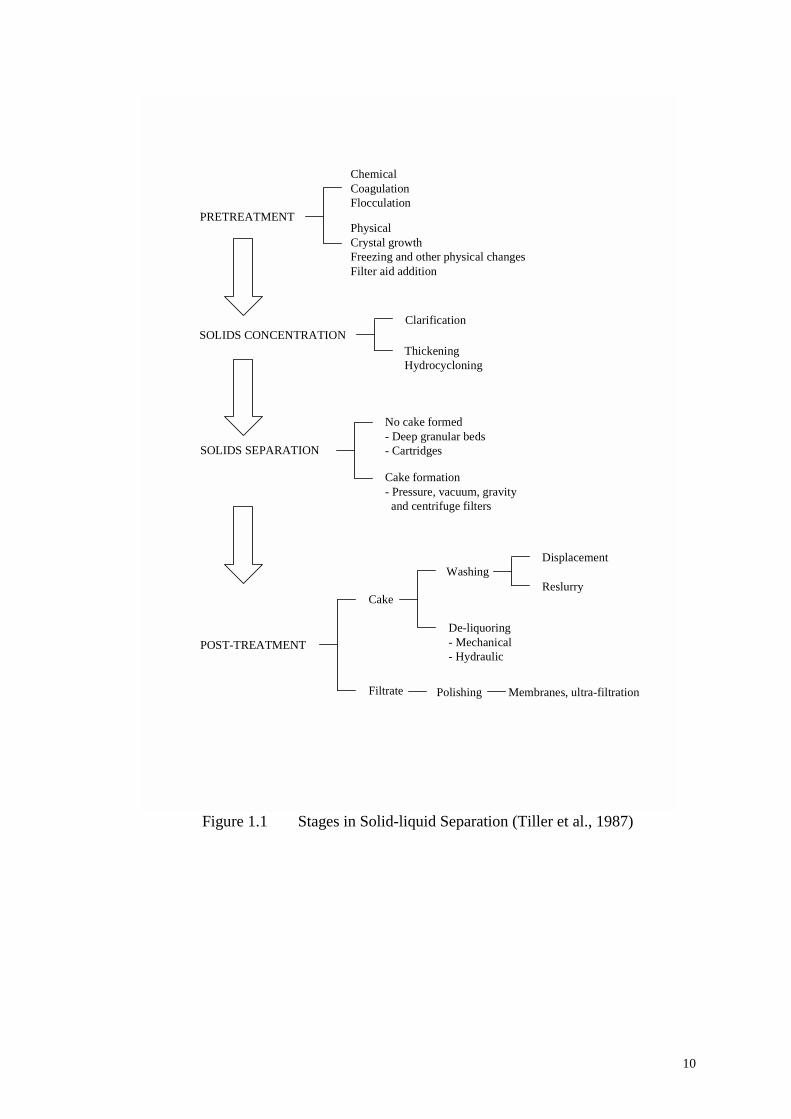
Basically, there are two types of filtration used in practice (Svarovsky, 1981),
i.e.:
(1) Depth filters - used for deep bed filtration where particle deposition takes place
inside the medium and cake deposition on the surface is undesirable.
(2) Surface filters - used for cake filtration where the solids are deposited in the
form of a cake on the up-stream side of a relatively thin filter medium.
In deep bed or depth filtration, the solid particles are captured in the interstices
of filter medium and no cake is formed on the surface of the medium (Figure 1.2a).
The particles are smaller than the medium openings and hence they proceed through
relatively long and tortuous pores where they are collected by various mechanisms
(gravity, diffusion or inertia) and attached to the medium by molecular and
electrostatic forces. The initial pressure drop across a depth filter is generally higher
than that across a surface filter of comparable efficiency but the build-up of pressure
drop as particles are accumulated is more gradual for a depth filter. It is generally used
for clarification, i.e. to separate fine particles from very dilute suspensions with very
low concentration (about 0.1% by volume). In many instances, a stage of depth
filtration precedes the formation of a cake.
In cake filtration, the solid particles are retained on the porous medium and
gradually build up to form a cake which in turn acts as a filter medium (Figure 1.2b).
The filter medium has a relatively low initial pressure drop. Particles of the same size
as or larger than the medium openings wedge into the openings and create smaller
passages which remove even smaller particles from the fluid. Cake filtration has a
wider application, especially in the chemical industry due to its primary use for more
3
concentrated slurries. Cake filtration operation can be classified in terms of driving
force employed, i.e. gravity, pressure, vacuum or centrifugal force. Gravity filtration is
generally applied in municipal water treatment where liquid volume is large and solid
concentrations are in the low parts per million range. In contrast, centrifugal filtration
is more efficient for slurries with higher concentration of solids.
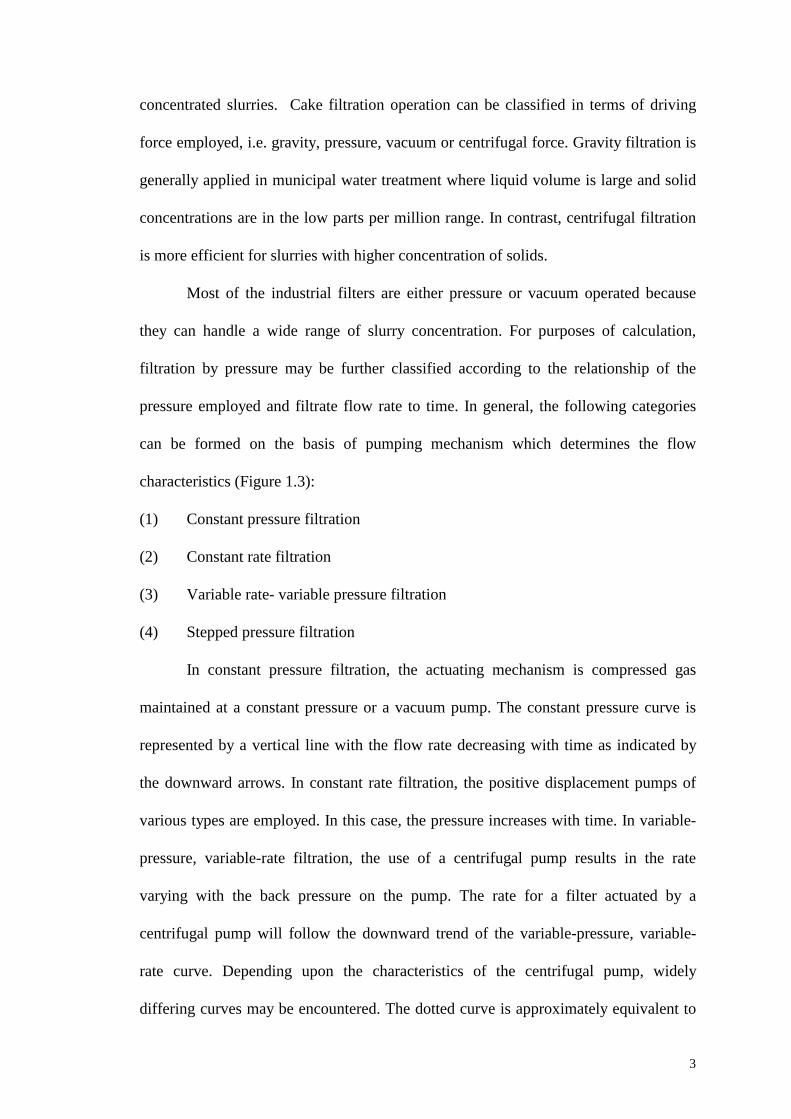
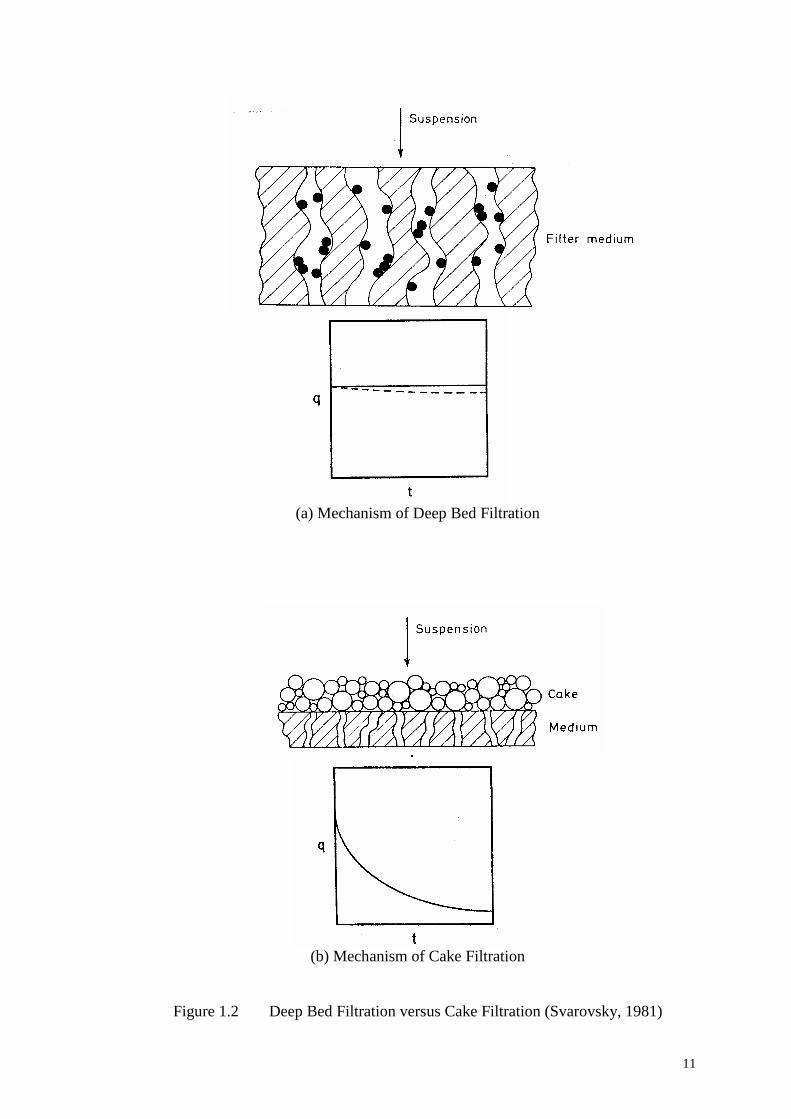
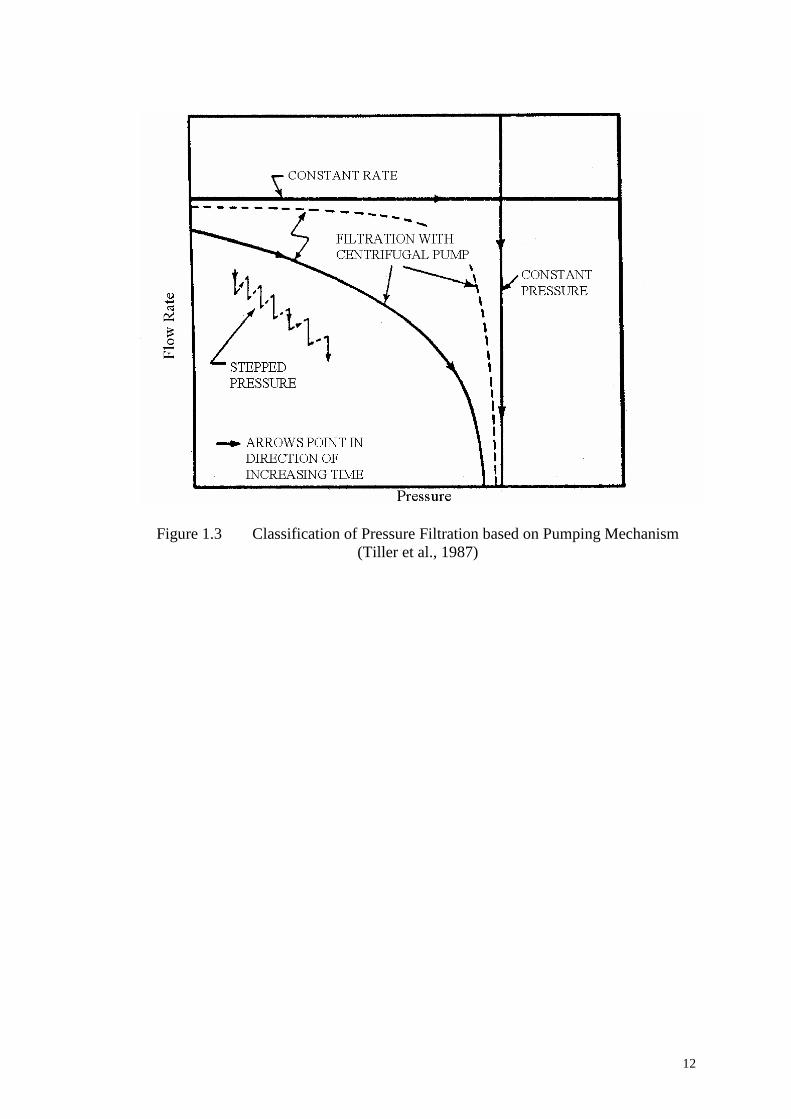
Most of the industrial filters are either pressure or vacuum operated because
they can handle a wide range of slurry concentration. For purposes of calculation,
filtration by pressure may be further classified according to the relationship of the
pressure employed and filtrate flow rate to time. In general, the following categories
can be formed on the basis of pumping mechanism which determines the flow
characteristics (Figure 1.3):
(1) Constant pressure filtration
(2) Constant rate filtration
(3) Variable rate- variable pressure filtration
(4) Stepped pressure filtration
In constant pressure filtration, the actuating mechanism is compressed gas
maintained at a constant pressure or a vacuum pump. The constant pressure curve is
represented by a vertical line with the flow rate decreasing with time as indicated by
the downward arrows. In constant rate filtration, the positive displacement pumps of
various types are employed. In this case, the pressure increases with time. In variable-
pressure, variable-rate filtration, the use of a centrifugal pump results in the rate
varying with the back pressure on the pump. The rate for a filter actuated by a
centrifugal pump will follow the downward trend of the variable-pressure, variable-
rate curve. Depending upon the characteristics of the centrifugal pump, widely
differing curves may be encountered. The dotted curve is approximately equivalent to
4
a filtration carried out first at constant rate and then at constant pressure. Stepped
pressure is normally used for experimental purposes whereby the pressure is increased
manually during filtration to simulate various pumping conditions.
1.3 Application of Filtration
In general, the application of filtration can be found in a wide range of
industries, for example in chemical, petrochemical, food and beverages,
pharmaceutical, pulp and paper, electronics, metallurgical, waste water and other
related industries. Some of the problems arising from industrial practice - for example,
waste management and disposal, the demand for more efficient mineral beneficiation
and resource recovery, the search for new classes of materials or production of fine
chemicals and pharmaceutical products, can often be overcome by better filtration
technology. All these require a more insightful understanding and better information of
the various aspects of filtration process that leads to the development of filtration
studies.
The industrial filtration process can range from a simple straining to a highly
complex separation due to the nature, characteristics, physical properties and process
conditions of the slurries, and also the final cake and filtrate quality. In some cases, the
solid particles may be coarse or fine, rigid or plastic, individual entities or aggregates
with different shapes. Also, the feed slurries may have a very high or very low
concentration of solids. In terms of process conditions, the feed slurries may be under
very high or very low temperature, or even under high pressure or vacuum. In certain
product value requirement, the solid or liquid or both phases may be the valuable
phase. All these complexities have contributed to the development of a multitude of
5
filters to meet the respective requirements. Some of the commonly used industrial
filters are: plate and frame filter press, shell and leaf filter, tubular filter, drum filter
and disc filter. In batch operation, the filtration process proceeds in the order of cake
formation, cake consolidation and possibly cake washing. For operations using rotary
and belt filters, the process may involve cake formation and dewatering by air flow.
Hence, cake formation and growth is undoubtedly the major part of any filtration
process.
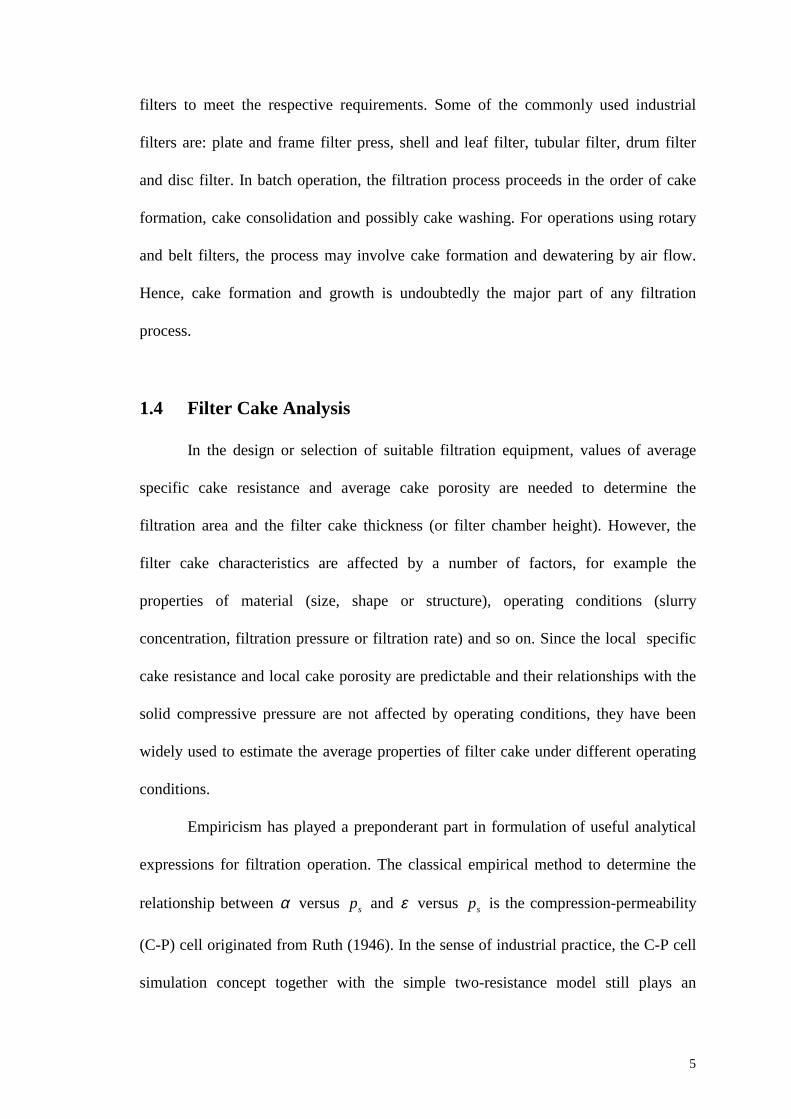
1.4 Filter Cake Analysis
In the design or selection of suitable filtration equipment, values of average
specific cake resistance and average cake porosity are needed to determine the
filtration area and the filter cake thickness (or filter chamber height). However, the
filter cake characteristics are affected by a number of factors, for example the
properties of material (size, shape or structure), operating conditions (slurry
concentration, filtration pressure or filtration rate) and so on. Since the local specific
cake resistance and local cake porosity are predictable and their relationships with the
solid compressive pressure are not affected by operating conditions, they have been
widely used to estimate the average properties of filter cake under different operating
conditions.
Empiricism has played a preponderant part in formulation of useful analytical
expressions for filtration operation. The classical empirical method to determine the
relationship between α versus sp and ε versus sp is the compression-permeability
(C-P) cell originated from Ruth (1946). In the sense of industrial practice, the C-P cell
simulation concept together with the simple two-resistance model still plays an
6
important role in establishing straightforward constitutive relationships to predict the
filter cake formation and growth. For these purposes, efforts have been made to
overcome the drawbacks of the C-P cell tests by using some modification measures,
such as improving the cell design and testing methodology, employing novel
experimental techniques and computerized testing machine, and taking the wall
friction effect of the C-P cell into consideration. These approaches would undoubtedly
improve the validity of constitutive relationships established from the C-P cell data for
cake filtration calculations. As such, it is worthwhile to look into the development of
new C-P cell equipment and tests to provide more accurate and reliable C-P data.
Although filtration theory has been quite established, the design of filtration
equipment still cannot be accurately determined based on simple basic equations such
as is the case for the design of a heat exchanger or distillation column. This is
primarily due to the unstable nature of particles and precipitates forming filter cakes
that cannot be described by a simple and reproducible formula. There have been more
direct approaches to filtration theory which avoid using the C-P cell simulation
concept. However, the numerical solutions of these model equations are usually very
complex and not straightforward in physical meaning. Since manufacturers and plant
engineers often prefer a more direct or simple methodology in designing and sizing
filtration equipment, these approaches have not been popularly adopted in industrial
applications. However, the progresses in these approaches have made great
contributions to an in-depth understanding of internal flow mechanism within filter
cakes and further improvement and development of filtration processes.
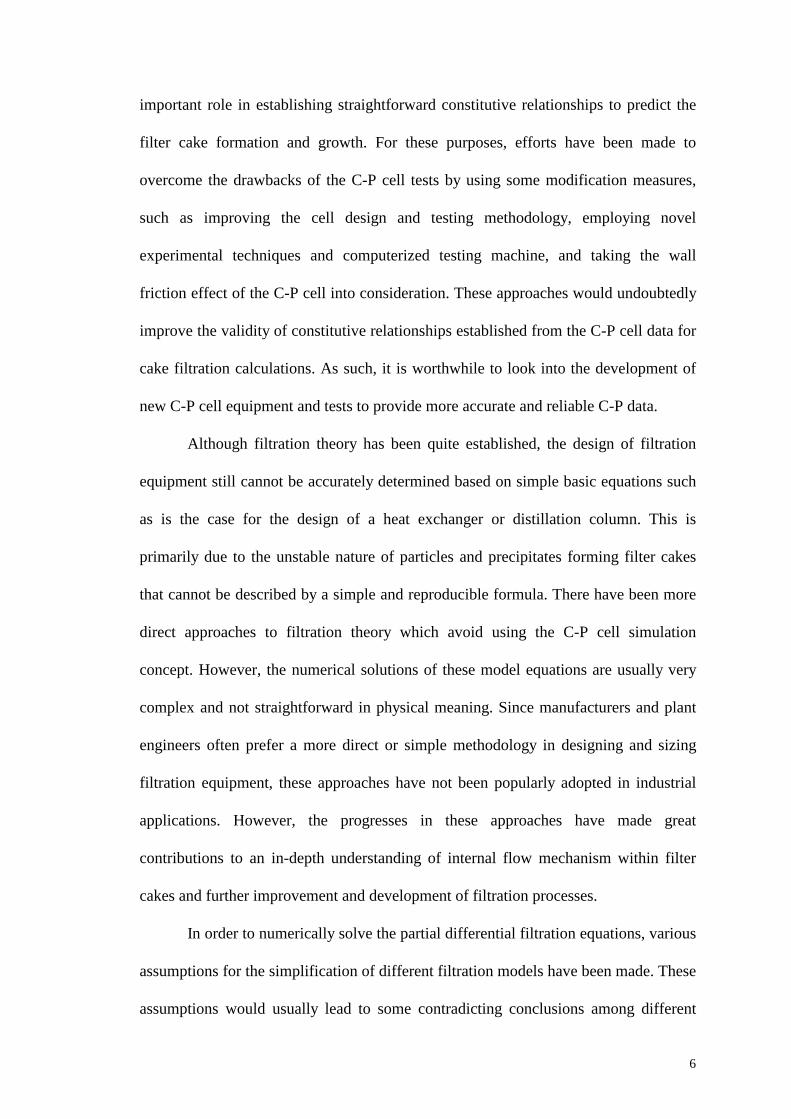
In order to numerically solve the partial differential filtration equations, various
assumptions for the simplification of different filtration models have been made. These
assumptions would usually lead to some contradicting conclusions among different
7
filtration models. On the other hand, some of the assumptions which have served as a
basis for the formulation of filtration equations might be in error or might not be
applicable to certain material or process conditions. Some of these cases have been
pointed out previously but it seems that no further work have been done on them. For
example, Willis et al. (1974) commented that the use of the conventional relationship
between pore liquid pressure and solid compressive pressure, i.e. 0=+ sl dpdp could
not satisfactorily predict the cake filtration performance. Instead, it was claimed that
their proposed relationship with inclusion of cake porosity effect, i.e.
0)1( =+− sls dpdpε could give a better prediction.
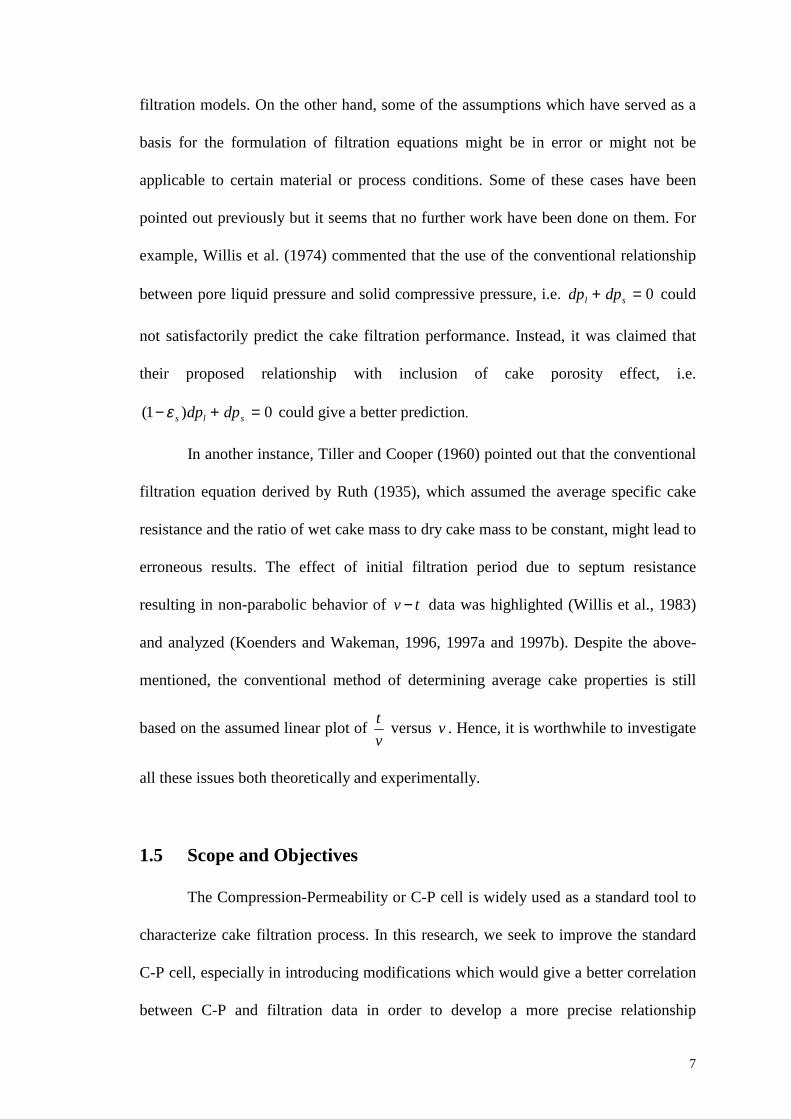
In another instance, Tiller and Cooper (1960) pointed out that the conventional
filtration equation derived by Ruth (1935), which assumed the average specific cake
resistance and the ratio of wet cake mass to dry cake mass to be constant, might lead to
erroneous results. The effect of initial filtration period due to septum resistance
resulting in non-parabolic behavior of tv − data was highlighted (Willis et al., 1983)
and analyzed (Koenders and Wakeman, 1996, 1997a and 1997b). Despite the above-
mentioned, the conventional method of determining average cake properties is still
based on the assumed linear plot of vt versus v . Hence, it is worthwhile to investigate
all these issues both theoretically and experimentally.
1.5 Scope and Objectives
The Compression-Permeability or C-P cell is widely used as a standard tool to
characterize cake filtration process. In this research, we seek to improve the standard
C-P cell, especially in introducing modifications which would give a better correlation
between C-P and filtration data in order to develop a more precise relationship
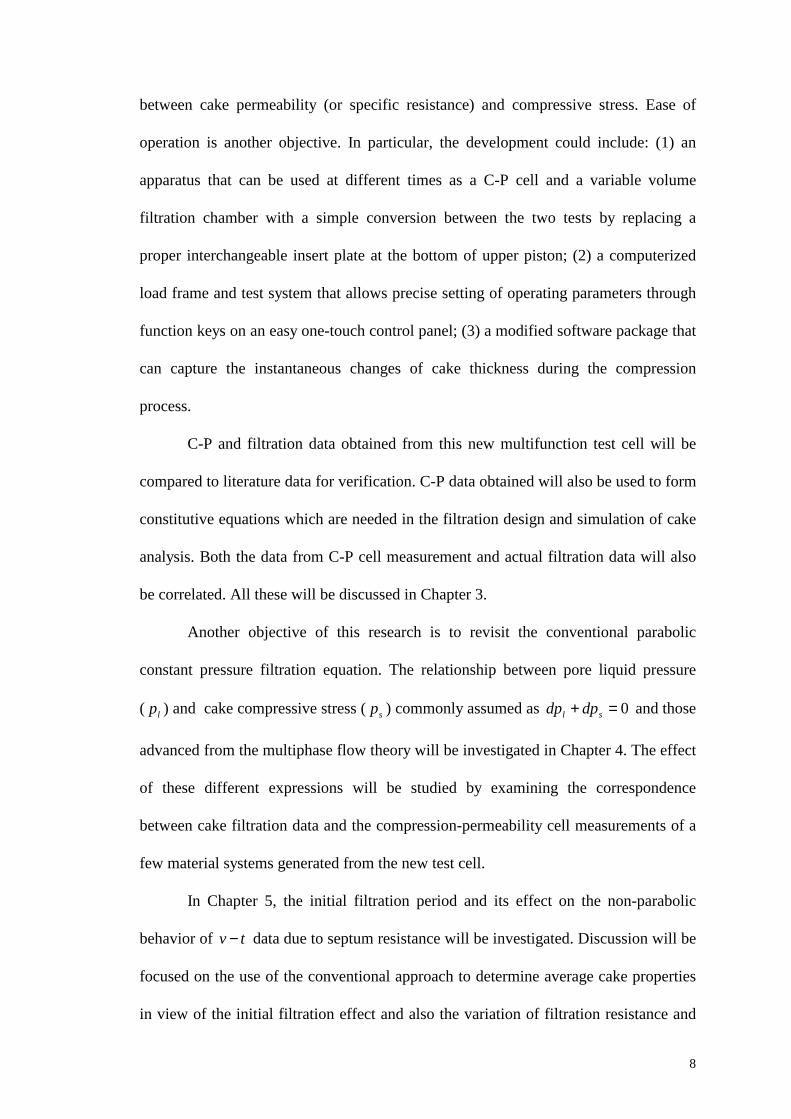
8
between cake permeability (or specific resistance) and compressive stress. Ease of
operation is another objective. In particular, the development could include: (1) an
apparatus that can be used at different times as a C-P cell and a variable volume
filtration chamber with a simple conversion between the two tests by replacing a
proper interchangeable insert plate at the bottom of upper piston; (2) a computerized
load frame and test system that allows precise setting of operating parameters through
function keys on an easy one-touch control panel; (3) a modified software package that
can capture the instantaneous changes of cake thickness during the compression
process.
C-P and filtration data obtained from this new multifunction test cell will be
compared to literature data for verification. C-P data obtained will also be used to form
constitutive equations which are needed in the filtration design and simulation of cake
analysis. Both the data from C-P cell measurement and actual filtration data will also
be correlated. All these will be discussed in Chapter 3.
Another objective of this research is to revisit the conventional parabolic
constant pressure filtration equation. The relationship between pore liquid pressure
( lp ) and cake compressive stress ( sp ) commonly assumed as 0=+ sl dpdp and those
advanced from the multiphase flow theory will be investigated in Chapter 4. The effect
of these different expressions will be studied by examining the correspondence
between cake filtration data and the compression-permeability cell measurements of a
few material systems generated from the new test cell.
In Chapter 5, the initial filtration period and its effect on the non-parabolic
behavior of tv − data due to septum resistance will be investigated. Discussion will be
focused on the use of the conventional approach to determine average cake properties
in view of the initial filtration effect and also the variation of filtration resistance and
9
the ratio of wet cake mass to dry cake mass as filtration proceeds. In the light of these
investigations, a new approach to interpret filtration data and to obtain a constitutive
relationship between average specific cake resistance and solid compressive stress
from the filtration data will be attempted. In Chapter 6, the findings of the entire
research will be summarized, with recommendations for future study.
10
PRETREATMENT
ChemicalCoagulationFlocculation
PhysicalCrystal growthFreezing and other physical changesFilter aid addition
SOLIDS CONCENTRATIONClarification
ThickeningHydrocycloning
SOLIDS SEPARATION
No cake formed- Deep granular beds- Cartridges
Cake formation- Pressure, vacuum, gravity and centrifuge filters
POST-TREATMENT
Cake
Filtrate
WashingDisplacement
Reslurry
De-liquoring- Mechanical- Hydraulic
Polishing Membranes, ultra-filtration
Figure 1.1 Stages in Solid-liquid Separation (Tiller et al., 1987)
11
(a) Mechanism of Deep Bed Filtration
(b) Mechanism of Cake Filtration
Figure 1.2 Deep Bed Filtration versus Cake Filtration (Svarovsky, 1981)
12
Figure 1.3 Classification of Pressure Filtration based on Pumping Mechanism (Tiller et al., 1987)
13
CHAPTER 2
LITERATURE REVIEW
2.1 Cake Filtration Theory
In cake filtration operations, solid particles retained on the filter medium form
a cake with porous structure as filtration proceeds. This cake becomes the true filter
medium and plays a very important role in the filtration process. The mechanism of
flow within the cake and filter medium, and the external conditions imposed on them
are the basis for modelling a filtration process.
The development of filtration theory has been based on differential equations
involving local flow resistance and variable flow rates (Tiller and Cooper, 1960; Tiller
and Shirato, 1962; Tiller and Shirato, 1964; Shirato et al., 1969). Analysis of cake
filtration to obtain these equations is always aimed at providing more detailed
descriptions of the fluid motion through the porous cake under an applied pressure
gradient. The cake structure changes (porosity and permeability or specific resistance)
due to particle rearrangement caused by stresses transmitted at the points of contact
would obviously affect the flow behaviour within the cake. Information about the local
porosity and permeability (or specific resistance), as well as the constitutive relations
for the drag force between the phases and the solid matrix stress are required to obtain
the numerical solution of the equations.
2.1.1 Fluid Flow in Porous Media
The fundamental step in investigating cake filtration behaviour is to obtain a
proper description of the fluid flow mechanism in the porous media. Basic laws
14
governing the flow of liquids through uniform and incompressible beds serve as a
basis in developing formulas for more complex, non-uniform and compressible cakes.
A cake is regarded as incompressible if its internal particle arrangement can sustain the
drag force under a pressure gradient without deformation. However, stresses
developed in the particulate structure normally lead to particle rearrangement and
deformation which characterise a compressible cake.
The development of models for cake formation can be traced back to Darcy's
Law (1856) originally used to describe flow of water through porous sand beds. He
found the flow rate to be proportional to the pressure gradient and developed the
following equation for steady laminar flow through homogeneous and incompressible
porous media:
dxdpkq l
µ= (2.1)
dxdpl is the dynamic (hydraulic) pressure difference across thickness dx of porous
medium with permeability k , q is the superficial velocity of liquid, and µ is the
liquid viscosity which was not included in Darcy's original equation.
For a compressible cake under an applied load or fluid drag, stresses will
develop in the particulate structure to cause deformation and compression with
possibly substantial changes in the flow pattern, cake porosity and permeability. Thus,
k in this case can no longer be regarded as a constant. Compressibility is a measure of
the degree of structural collapse brought about by the compressive stresses. Hence, for
a compressible cake normally encountered in a filtration process, Darcy’s equation
may be rewritten as (Svarovsky, 1981; Tiller et al., 1987):
dxdpkq s
µ−= (2.2)
15
where sp is known as solid compressive pressure.
In filtration, Darcy's Law is often modified to replace the permeability ( k )
with local specific flow resistance (α ), and the pressure gradient (dxdpl ) is replaced
with pressure loss per unit mass of solid deposited (dwdpl ) to give:
dwdpq l
µα1= (2.3)
The total mass of dry solids deposited per unit filter area, w is normally used
in filtration rather than the distance from media, x . The mass dw is related to dx by:
dxdw s )1( ερ −= (2.4)
Substituting Equation (2.4) into Equation (2.3) yields (Tiller et al., 1987):
dxdpq l
s )1(1
εµαρ −= (2.5)
Comparing Equations (2.1) and (2.5), the relationship between permeability, k and
specific flow resistance, α is given by:
)1(1
εαρ −=
s
k (2.6)
The conventional Darcy equation assumed solid velocity to be negligible for
flow through a fixed and incompressible bed. Shirato et al. (1969, 1970) pointed out
that the solid motion is comparable to the liquid velocity for highly concentrated
16
slurries. They incorporated a relative velocity into the Darcy equation to account for
the effect of solid movement.
2.1.2 Filter Cake Permeability and Porosity
The key properties of a filter cake are the cake porosity and permeability. The
cake porosity (ε ) is a measure of the fluid capacity of the formed cake or the fraction
of a porous medium available for fluid flow. The cake permeability ( k ) is an
indication of how easily the fluid can pass through its voids under an applied pressure
gradient. In other words, the extent of permeability is determined by the porosity of
the medium and also the sizes of pores in its internal structure. However, the
complexity of the internal pore structure and geometry render it virtually impossible to
be described with mathematical rigour. Therefore, simplified models relating
permeability to the porosity of a filter cake and to the mean size of the particles
forming the cake have been developed. The earliest theoretical concept of porous
media was attributed to the work of Kozeny (1927) and Carman (1938).
The average velocity (u ) of a fluid moving in laminar flow through a straight
circular capillary of length dx and diameter D is given by Poiseuille's equation
(1840):
232D
udxdpl µ= (2.7)
Assuming the porous medium to be a bundle of irregularly shaped straight
channels, the hydraulic diameter is related to the bed porosity and the mean specific
surface of the particles ( S ) as follows:
SperimeterwettedareationalcrossflowDh
11
4sec4ε
ε−
=−= (2.8)
17
For a circular tube, the hydraulic diameter is identical to the actual diameter:
DD
DDh ==
π
π 2
41
4 (2.9)
The average pore or interstitial velocity (u ) is related to the superficial velocity ( q )
and porosity (ε ) by:
εqu = (2.10)
Substituting Equations (2.8), (2.9) and (2.10) into Equation (2.7) yields Kozeny's
equation:
qKSdxdpl µ
εε3
22 )1( −= (2.11)
K is known as the Kozeny constant which is a function of the shape and size
distribution of the cross-sectional areas of the capillaries and accounts for the
tortuosity of the fluid path where the effective pore length is larger than the apparent
bed length.
Comparing Equation (2.11) and Darcy's equation (2.1), gives:
2
3
2 )1(1
εε−
=KS
k (2.12)
For sand and randomly packed powders ( 5.03.0 −=ε ), K is usually taken as 5
(Carman, 1937). For compressible cakes, the values of K was found to be generally
higher than 5 (Tiller, 1953). Mydlarz and Jones (1989) reported the values of K for
K2SO4 crystals to be 1.5-8. Many researchers have investigated flow through porous
18
media in terms of cake permeability and porosity. Besides the earliest work performed
by Carman (1937) for packed beds, Sullivan (1942), Brownell and Katz (1947), Brown
(1950), Davies (1952), Chen (1955) and Ingmanson et al. (1959) have made valuable
contributions to permeability measurements using a wide variety of porous media.
Poiseuille (1840) and Darcy (1856) discussed theoretical approaches to the
permeability of porous media. Further advancement of knowledge in this field have
been carried out by Muskat and Wyckoff (1946), Happel and Brenner (1965), Philip
(1970), Payatakes et al. (1973), Scheidegger (1974), Rajagopalan and Tien (1976),
Jackson and James (1986) and Dullien (1992).
2.1.3 Solid Compressive Pressure, sp and Hydraulic (Pore Liquid)
Pressure, lp
The origin of the cake compressive stress in cake filtration may be explained as
follows (Walker et al., 1937): The flow of liquid through a filter cake imparts fluid
drag on particles constituting the cake. Since these particles are contiguous, the drag
forces experienced by individual particles are transmitted and accumulated along the
direction of the liquid flow, giving rise to a compressive stress in the cake phase.
Liquid flows through the interstices of the compressible cake in the direction of
decreasing hydraulic pressure. The solids forming the cake are compact and relatively
dry at the medium surface, whereas the interface layer of incoming slurry and cake is
in a wet and soupy condition. As such, the cake porosity changes from its maximum
value at the cake-slurry interface ( Lx = ) to its minimum value at the cake-septum
interface ( 0=x ) (Figure 2.1). The particles are assumed to be in point contact and the
liquid completely bathes each particle. The drag on each particle is transmitted to the
next particle. Consequently, the net solid compressive pressure increases as the
19
medium is approached, thereby accounting for the decreasing porosity (Tiller, 1953;
Tiller et al., 1987). Instances of a minimum porosity at some distance from the filter
medium have been reported when a filter cake collapses after deposition of a critical
amount of solids (Rietema, 1953; Baird and Perry, 1967).
Solid particles in the slurry flow stream are subjected to both skin drag (from
fluid-particle interface) and form drag (from fluid pressure) caused by the friction
developed at the surface of the particles. If inertial forces are neglected, a force
balance over the cake from x to L yields:
)(),(),( tAPxtApxtF ls =+ (2.13)
where P is the applied pressure, which may be a function of time but is independent
of distance x . sF is the accumulated drag on the particles through points of contact. In
this case, the hydraulic pressure at distance x ( lp ) may be assumed to be effective
over the entire cross-sectional area, A of the cake because the area of contact is
negligible.
The compressive drag pressure can be defined as:
AFp s
s = (2.14)
The cross-sectional area is not equal to the surface area of the particles or the contact
area. So, sp is a fictitious or pseudopressure which is introduced for convenience.
Substituting Equation (2.14) into Equation (2.13) and dividing by A gives:
)(),(),( tPxtpxtp ls =+ (2.15)
20
Taking a differential with respect to distance x at constant filtration time t and by
assuming the pressure gradient is a series of quasi-static states, Equation (2.15) yields:
0=+ ls dpdp (2.16)
Based on intuitive reasoning, Ruth (1935) and later Tiller (1953) proposed
Equation (2.16) to describe the relationship between pore liquid pressure and cake
compressive stress (for one-dimensional case). Based upon a macroscopic force
balance, this equation states that the compressive drag pressure increases as the
hydraulic pressure reduces and the cumulative drag stress equals to the cake pressure
drop, with the assumptions that inertial forces are neglected and accumulated drag on
the particles is communicated through the points of contact.
In actual cakes, there is a small area of contact between particles (Tiller and
Huang, 1961), denoted as AcAc'= , where 'c is the proportionality constant. So, for
area contact, Equation (2.16) was modified to 01 =
−+ ls dp
AA
dp c . When 0=AAc , it
reduces to the original form of Equation (2.16). At present, the assumption of 0=AAc
still appears to be justified and Equation (2.16) is widely employed to describe the
relationship between pore liquid pressure and cake compressive stress for cake
filtration studies.
In general, the problem of flow in porous media can be solved either by using a
statistical model or a geometrical model. Another approach is to develop correct
averaged forms of governing differential equations that are valid for any geometry.
Further, results from both the statistical and geometrical models should satisfy the
averaged equations. All these methods lead to unspecified parameters, which must be
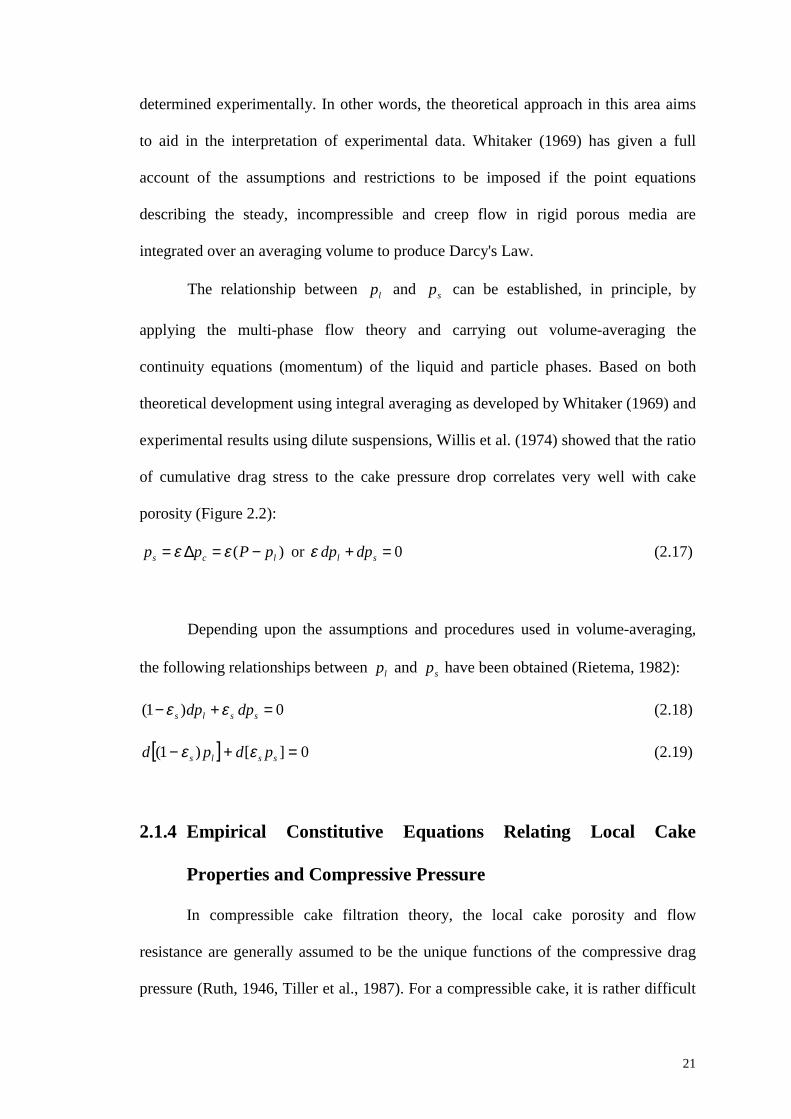
21
determined experimentally. In other words, the theoretical approach in this area aims
to aid in the interpretation of experimental data. Whitaker (1969) has given a full
account of the assumptions and restrictions to be imposed if the point equations
describing the steady, incompressible and creep flow in rigid porous media are
integrated over an averaging volume to produce Darcy's Law.
The relationship between lp and sp can be established, in principle, by
applying the multi-phase flow theory and carrying out volume-averaging the
continuity equations (momentum) of the liquid and particle phases. Based on both
theoretical development using integral averaging as developed by Whitaker (1969) and
experimental results using dilute suspensions, Willis et al. (1974) showed that the ratio
of cumulative drag stress to the cake pressure drop correlates very well with cake
porosity (Figure 2.2):
)( lcs pPpp −=∆= εε or 0=+ sl dpdpε (2.17)
Depending upon the assumptions and procedures used in volume-averaging,
the following relationships between lp and sp have been obtained (Rietema, 1982):
0)1( =+− ssls dpdp εε (2.18)
[ ] 0][)1( =+− ssls pdpd εε (2.19)
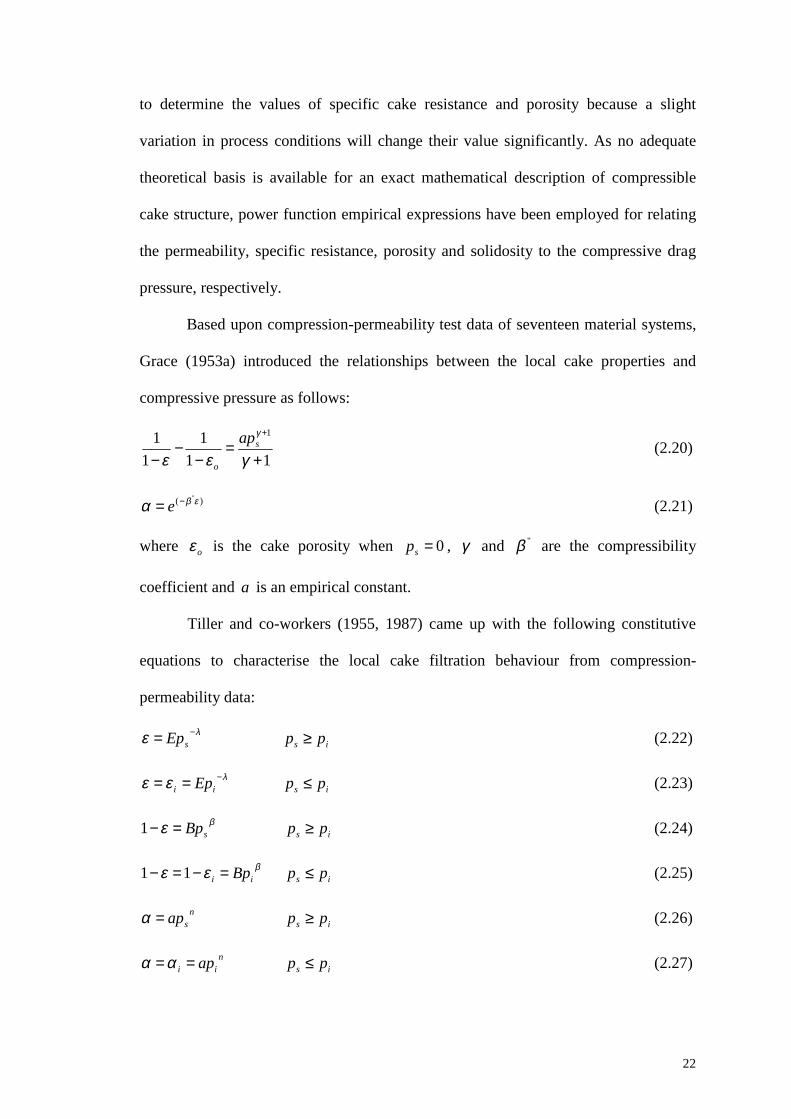
2.1.4 Empirical Constitutive Equations Relating Local Cake
Properties and Compressive Pressure
In compressible cake filtration theory, the local cake porosity and flow
resistance are generally assumed to be the unique functions of the compressive drag
pressure (Ruth, 1946, Tiller et al., 1987). For a compressible cake, it is rather difficult
22
to determine the values of specific cake resistance and porosity because a slight
variation in process conditions will change their value significantly. As no adequate
theoretical basis is available for an exact mathematical description of compressible
cake structure, power function empirical expressions have been employed for relating
the permeability, specific resistance, porosity and solidosity to the compressive drag
pressure, respectively.
Based upon compression-permeability test data of seventeen material systems,
Grace (1953a) introduced the relationships between the local cake properties and
compressive pressure as follows:
111
11 1
+=
−−
−
+
γεε
γs
o
ap (2.20)
)( "εβα −= e (2.21)
where oε is the cake porosity when 0=sp , γ and "β are the compressibility
coefficient and a is an empirical constant.
Tiller and co-workers (1955, 1987) came up with the following constitutive
equations to characterise the local cake filtration behaviour from compression-
permeability data:
λε −= sEp is pp ≥ (2.22)
λεε −== ii Ep is pp ≤ (2.23)
βε sBp=−1 is pp ≥ (2.24)
βεε ii Bp=−=− 11 is pp ≤ (2.25)
nsap=α is pp ≥ (2.26)
nii ap==αα is pp ≤ (2.27)
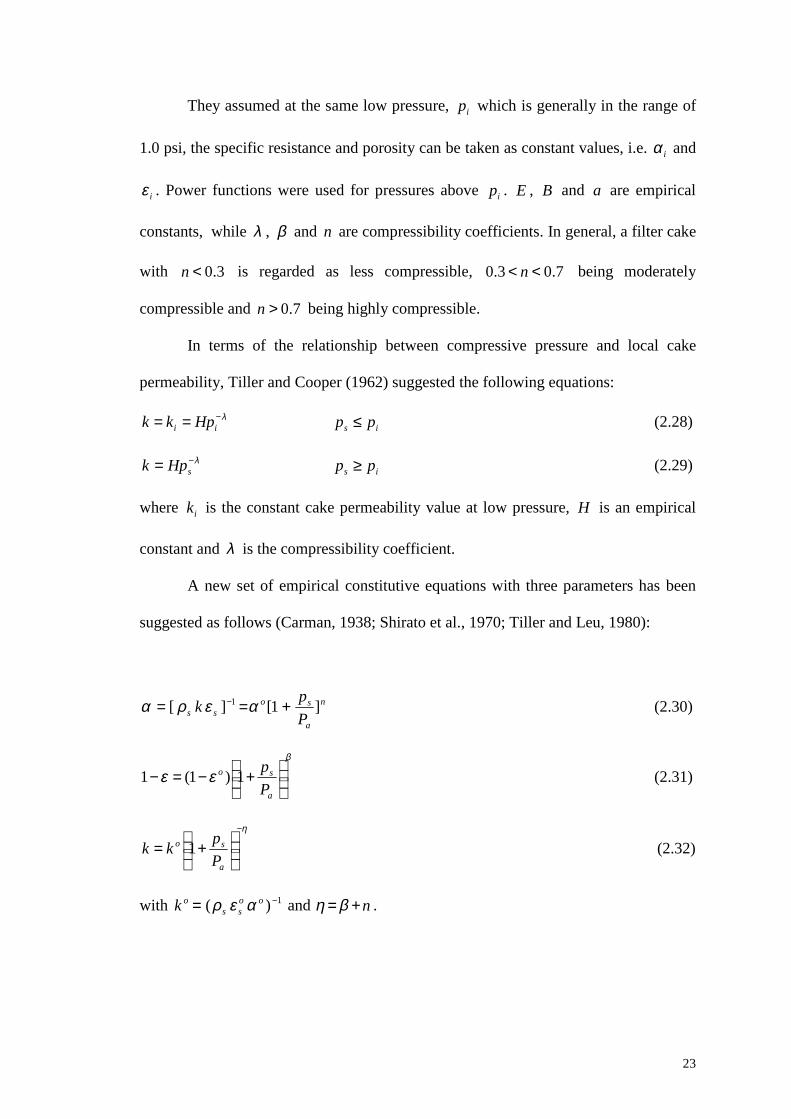
23
They assumed at the same low pressure, ip which is generally in the range of
1.0 psi, the specific resistance and porosity can be taken as constant values, i.e. iα and
iε . Power functions were used for pressures above ip . E , B and a are empirical
constants, while λ , β and n are compressibility coefficients. In general, a filter cake
with 3.0<n is regarded as less compressible, 7.03.0 << n being moderately
compressible and 7.0>n being highly compressible.
In terms of the relationship between compressive pressure and local cake
permeability, Tiller and Cooper (1962) suggested the following equations:
λ−== ii Hpkk is pp ≤ (2.28)
λ−= sHpk is pp ≥ (2.29)
where ik is the constant cake permeability value at low pressure, H is an empirical
constant and λ is the compressibility coefficient.
A new set of empirical constitutive equations with three parameters has been
suggested as follows (Carman, 1938; Shirato et al., 1970; Tiller and Leu, 1980):
n
a
soss P
pk ]1[][ 1 +== − αερα (2.30)
β
εε
+−=−
a
so
Pp1)1(1 (2.31)
η−
+=
a
so
Ppkk 1 (2.32)
with 1)( −= ooss
ok αερ and n+=βη .
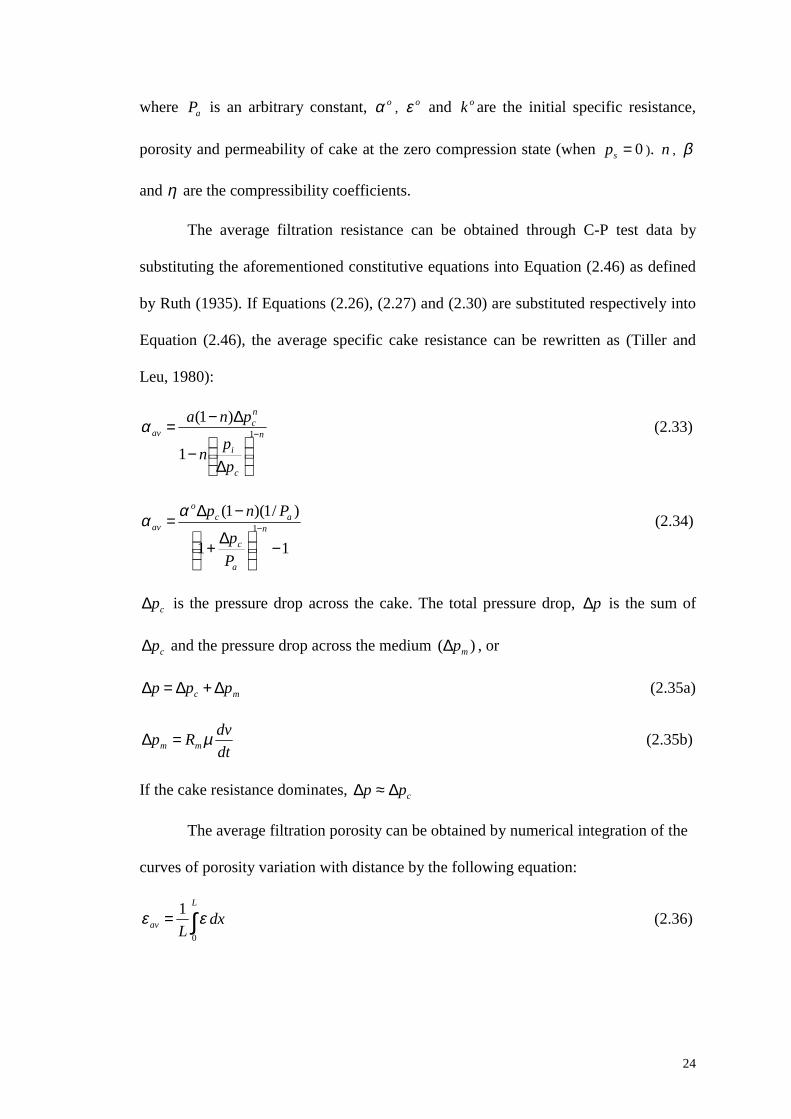
24
where aP is an arbitrary constant, oα , oε and ok are the initial specific resistance,
porosity and permeability of cake at the zero compression state (when 0=sp ). n , β
and η are the compressibility coefficients.
The average filtration resistance can be obtained through C-P test data by
substituting the aforementioned constitutive equations into Equation (2.46) as defined
by Ruth (1935). If Equations (2.26), (2.27) and (2.30) are substituted respectively into
Equation (2.46), the average specific cake resistance can be rewritten as (Tiller and
Leu, 1980):
n
c
i
nc
av
ppn
pna−
∆
−
∆−= 1
1
)1(α
(2.33)
11
)/1)(1(1
−
∆+
−∆= −n
a
c
aco
av
Pp
Pnpαα (2.34)
cp∆ is the pressure drop across the cake. The total pressure drop, p∆ is the sum of
cp∆ and the pressure drop across the medium )( mp∆ , or
mc ppp ∆+∆=∆ (2.35a)
dtdvRp mm µ=∆ (2.35b)
If the cake resistance dominates, cpp ∆≈∆
The average filtration porosity can be obtained by numerical integration of the
curves of porosity variation with distance by the following equation:
∫=L
av dxL 0
1 εε (2.36)
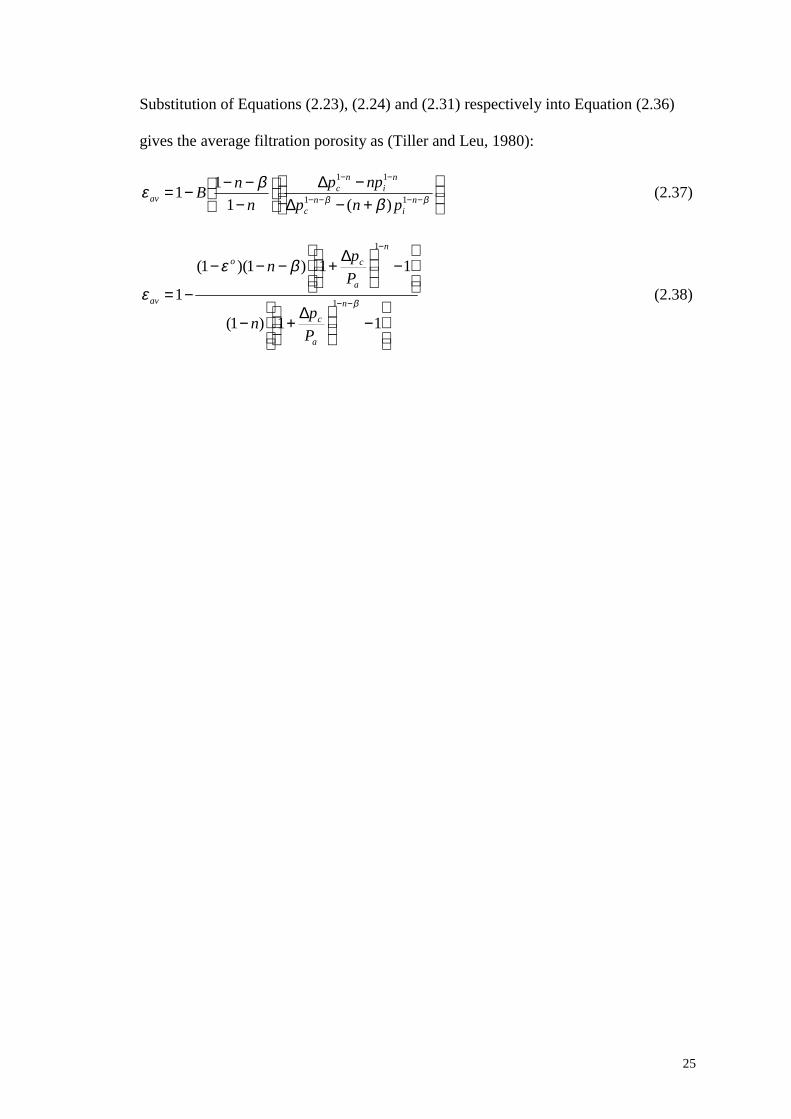
25
Substitution of Equations (2.23), (2.24) and (2.31) respectively into Equation (2.36)
gives the average filtration porosity as (Tiller and Leu, 1980):
+−∆
−∆
−−−−= −−−−
−−
ββ ββε n
in
c
ni
nc
av pnpnpp
nnB 11
11
)(111 (2.37)
−
∆+−
−
∆+−−−
−=−−
−
11)1(
11)1)(1(
11
1
β
βε
εn
a
c
n
a
co
av
Ppn
Ppn
(2.38)
26
2.2 Analysis and Modelling of Cake Filtration (cake formation and
growth)
In cake filtration processes, the liquid undergoes two flow conditions, i.e.: flow
without cake formation at the very initial short period, and flow under cake formation
and growth at the later period. At the beginning of cake filtration, the whole applied
pressure or pressure gradient available is across the clean filter medium itself because
the cake has not been formed yet. As the pores in the filter medium are normally small
and the rate of flow of filtrate is low, laminar flow conditions are almost invariably
obtained. Darcy’s equation (Equation 2.1) can be rewritten in the form of (Svarovsky,
1981) :
mRPq
µ= (2.39)
where mR is the medium resistance ( kL / ).
Non-parabolic filtration behaviour was observed and attributed to the clogged
septum permeability (Willis et al., 1983). According to this view, dips in the reciprocal
filtrate rate during initial stage of filtration were due to the associated sharp rise in
cake pressure drop. An expression relating tv to 5.0t was proposed to interpret the
initial filtration period due to clogged filter septum (Koenders and Wakeman, 1996,
1997a and 1997b; Meeten, 2000). The intercept of the plot was used to describe the
fouled septum at 0=t based on Darcy’s equation while the slope of the plot described
the effect of filtrate flow rate reduction due to subsequent solid deposition on the
septum.
If a clean liquid was passed through the medium, all the parameters in Equation
(2.39) would be constant. For constant pressure operation, the resultant filtrate flow
27
rate will also be constant and consequently the cumulative filtrate volume will increase
linearly with time. However, for a suspension that contains solid particles, as filtration
proceeds, a cake will gradually build up which takes away a greater proportion of the
available pressure drop. This causes an effective increase in the bed resistance that
leads to a gradual drop in the filtrate flow rate and the gradual decrease of cumulative
filtrate volume with time (Svarovsky, 1981).
In this case, the liquid is subjected to two resistances in series, i.e. the medium
resistance, mR and the cake resistance, cR . So, Equation (2.39) was improved to
incorporate the cake resistance:
)( cm RRPq+
=µ
(2.40)
Equation (2.40) is known as the two-resistance filtration model and it is the most
commonly used cake filtration model for describing filtration of incompressible cakes.
In fact, most of the recently developed filtration models are still based on this basic
model despite controversies and criticism associated with the dependency of specific
resistance on the slurry concentration and the slurry-media interactions.
The medium resistance, mR cannot be assumed to be constant if there are
migration and penetration of fine particles into the medium that finally block the pores
of the medium. The specific cake resistance may be assumed to be directly
proportional to the amount of cake deposited (only true for incompressible cakes), i.e.:
wRc α= (2.41)
w is a function of time and can be related to the cumulative filtrate volume per unit
medium area ( v ) with respect to filtration time ( t ) by:
cvw = (2.42)
28
where mssc
−=
1ρ (2.43)
The total flow volume is an integral function of the flow rate (on the basis of per unit
medium area):
dtdvq = (2.44)
Thus, Equation (2.40) can be rewritten as:
mRcvP
dtdv
µαµ += (2.45)
For incompressible cakes, the specific cake resistance is basically constant.
However, it may change with time due to possible flow consolidation of the cake or
variable approach velocity. Most of the cakes encountered in filtration processes are
compressible and their specific resistances change with the pressure drop across the
cake, cp∆ . Thus, an average specific cake resistance, avα should replace α in
Equation (2.45). Ruth (1935) has given a definition for the average specific cake
resistance as follows:
∫∆
∆==cp
s
cRav
dp
p
0
1α
αα (2.46)
Tiller and Cooper (1960) pointed out that the specific filtration resistance and
the ratio of the mass of wet cake to dry cake ( m ) were not constant especially in the
initial period of filtration (Figure 2.3). Since the liquid flow rate was observed to be
29
not constant throughout the cake at any instant especially for thick slurries, they
proposed modification to the conventional constant pressure filtration equation. In
view of this new theory of variation of liquid flow rate with respect to distance through
a filter cake, Tiller and Shirato (1964) further modified the average filtration resistance
with a correction factor to account for the internal variation of liquid flow rate and the
cake porosity. In 1969, Shirato et al. presented a modified definition of filtration
resistance by considering the relative solid-liquid velocity, i.e. RRav J αα = . In general,
the velocity of solids was shown to be comparable to the liquid velocity for highly
concentrated slurry under conditions of short filtration period. For a dilute slurry, RJ
approaches unity and the conventional filtration equation prevails.
A study on mechanisms of cake formation and growth in filtration processes
requires information on filtrate flow rate and cake thickness against filtration time
( tv − and tL − ). Data of tv − can be obtained by performing filtration or C-P test to
collect the flow rate of filtrate as a function of time. Various methods have been
proposed to determine the cake thickness history. Some investigators used conductive
electrodes to measure cake conductivity at different positions in the filtration chamber
and indirectly calculated the local cake porosity (Baird and Perry, 1967; Shirato et al.,
1971 and Wakeman, 1981). Others placed pressure sensors along the surface of
experimental cell at various heights to record the hydraulic pressure histories and
determine L versus t (Okamura and Shirato, 1955; Willis et al., 1983; Fathi-Najafi
and Theliander, 1995). These methods are basically costly and the limited number of
measuring points employed causes incomplete porosity or pressure profiles. The
intrusive measuring device placed within the filter cake also affects the cake growth
and cake internal structure. Based on the principle of sudden flow area reduction in an
30
orifice, Murase et al. (1987) showed that by placing a plate with a small opening at
different heights in the filtration cell, the results of tL − could be established as a
sharp decrease in filtration rate was observed when the growth of cake reached the
plate.
Following the determination of local cake porosity, many studies on analysis
and simulation of cake formation and growth have emerged (Wakeman, 1978, 1981;
Stamatakis and Tien, 1991; Lu and Hwang, 1993; Theliander and Fathi-Najafi, 1996).
All these analyses were based on solutions of the volume-averaged continuity
equations for the fluid and particle phases. Wakeman (1981) first proposed the model
of filter cake growth layer by layer, followed by compression by upper cake layer to
simulate the cake growth. He used ),( txf=ε data determined from electrode
measurement, αε − relationship from Happel cell model (Happel and Brenner, 1965)
with )(tfv = and )(tfL = data from filtration experiments to simulate the local cake
properties through computer programming. Theliander and Fathi-Najafi (1996)
improved his method by using least-square regression to obtain )( spf=ε to avoid
direct measurement of ),( txf=ε .
Computer simulation based on particle dynamics was used to analyze cake
formation and growth. With reference to the concept of cake build-up layer by layer,
Lu and Hwang (1993) used cake surface porosity ( iε ) and tv − data from filtration
tests to estimate local cake properties together with the Kozeny equation to simulate
cake formation. Pressure drop across the medium was assumed to be negligible in their
studies. Huang (1998) further improved the method to incorporate medium resistance
and replaced the Kozeny equation with a power function between α and ε to simulate
the cake formation. The results of such particle dynamic analysis are very dependent
31
on the accuracy and determination of porosity at the cake surface ( iε ) which served as
the input parameter to the simulation program. In aforementioned methods (Wakeman,
1981; Theliander and Fathi-Najafi, 1996; Huang, 1998), medium resistance was
obtained from Darcy’s equation based on filtrate velocity at 0=t , i.e.
0=
=
t
m
dtdvPR
µ.
The effect of initial filtration period was not addressed.
2.2.1 Determination of Empirical Data for Filter Cake Analysis
The flow behaviour within a filter cake is affected by cake structure changes
due to particle rearrangement, which is caused by stress transmitted at the points of
contact. In the design of a filter or a cake filtration process, the determination of
filtration area depends upon the slurry filtration rate and the average values of filter
cake properties. Thus, the flow equation and the particulate constitutive relations
should be involved. In this context, the relationship of local cake properties (porosity,
specific resistance or permeability) with effective compressive pressure (ε vs. sp and
α vs. sp ) is required to obtain the average properties.
The most commonly used tests to obtain data for filter cake characterisation are
classified as: compression-permeability test and filtration test (constant pressure or
constant rate). The overall filtration coefficients can be determined by proper
integration of point or local coefficient values over the entire thickness of the filter
cake. On the other hand, the local coefficients may be obtained directly from a
compression-permeability (C-P) cell.
32
2.2.1.1 The Compression-Permeability Cell
In general, a C-P cell consists of a vertical cylinder with a movable piston
through which a mechanical load or force (pressure) is applied at the top of a confined
bed of solids during the stage of compression (Figure 2.4). Liquid is allowed to
percolate through the compressed filter cake under a low hydrostatic head during the
permeation stage. Local values of permeability (filtration resistance) and porosity
(solidosity) are obtained as a function of applied compressive pressure. This
mechanical compressive stress is assumed to produce the same effect as the cumulative
frictional drag of liquid passing through the filter cake. When the equilibrium state is
attained, the mechanical pressure in the C-P cell is equal to the local effective pressure
in the cake. Under this condition, the local values of filtration resistance and porosity
of a filter cake from actual filtration test and C-P cell are assumed to be identical. The
local filter cake specific resistance and porosity can be calculated as follows:
s
m
s WAR
AQWAHg −∆=
/µρα (from Equation 2.45 and 2.46) (2.47)
AtLW
s
s
ρε
)(1−= (2.48)
The C-P cell concept offers potential for combining laboratory testing and industrial
filtration design practice. The reliability of the C-P cell tests mainly depends on how
closely local conditions in actual filtration can be duplicated in the cell.
Ruth (1946) first introduced the concept of compression-permeability (C-P)
testing for the study of filter cake structure and characteristics. The local cake
properties (porosity and specific resistance) were directly measured as a function of
compressive pressure to provide data for establishing the constitutive relations of a
filter cake. Since then, the C-P cell has served as a significant tool for conducting
33
research on cake filtration. Ruth (1946) reported that specific resistance predicted from
the compression-permeability test was 10-15% lower than the constant pressure
filtration for his CaCO3-water system and concluded that the difference was caused by
the long duration of filter cake compression. However, the effect of side wall friction
was neglected in his studies. Although the local resistance, α varies throughout the
thickness of a compressible cake, an average value can be defined as in Equation 2.46
(Ruth, 1935; Carman, 1938).
Other researchers also have reported that C-P cell data can be used to predict
the average cake resistance. Developments and modifications of the filtration models
utilizing the C-P cell simulation concept have been made (Grace, 1953a,b, Tiller and
co-workers, 1953, 1955, 1958, 1960, 1962, 1964, 1972, 1973, 1980, 1985, Hoffing and
Lockhart, 1951, Ingmanson, 1953, Okamura and Shirato, 1954, 1955, Kottwitz and
Boyland, 1958, Orr and Valle, 1959, Shirato et al., 1968, Willis et al., 1974 and Lu et
al., 1970, 1995).
However, the usefulness and general applicability of the constitutive
relationships derived from C-P cell data have been called into doubt due to several
sources of uncertainties and inaccuracies in C-P cell test. These include the effect of
sidewall friction that leads to cake inhomogeneity (Shirato et al., 1968, Lu et al., 1970,
Tiller et al., 1972, Tiller and Lu, 1972), the lack of direct correlation between
conditions in a C-P cell and in actual cake filtration operations (Willis et al., 1974), lag
in time to reach equilibrium and changes of filter cake characteristics with time.
Wakeman (1978) has critically reviewed the validity of C-P cell data in
predicting and interpreting filtration data. He pointed out that a unique one-to-one
correspondence between the C-P cell data and the filtration data required a priori
34
knowledge of cake porosity. He emphasized the need to develop experimental
technique and theories that would give a further insight into the structure of filter
cakes. Willis and co-workers (Willis et al., 1985) mentioned that the defect of C-P
cells was that the C-P test is static and cannot generate the time-dependent values of
the local cake resistance that are required for the filtration test. Among all, the effect of
side wall friction which causes the loss of effective compressive pressure and cake
non-uniformity has received the most attention and investigation.
Grace (1953a,b) reported that the average specific cake resistance predicted
from compression-permeability data for ten materials agreed within ±10% with values
determined from actual constant pressure filtration and the effect of side-wall friction
was not significant for cake L/D ratio of less than 0.6. However, other researchers have
found that even for a cake with L/D ratio of less than 0.2, the pressure transmitted to
the septum could only be 85% of applied pressure (Shirato et al., 1968, Lu et al., 1970,
Tiller et al., 1972, Fang, 1996).
Okamura and Shirato (1955) used C-P cell data to predict the hydraulic
pressure distribution in a filter cake. They found that the results were not consistent
with those obtained from constant pressure filtration test. However, their results of
average porosity predicted from uncorrected C-P cell data could be correlated very
well with those from constant pressure filtration. Kottwitz and Boylan (1958) also
reported that the specific resistances of their CaCO3, BaSO4 and TiO2 filter cakes
could be predicted from C-P cell data, but the sidewall effect was neglected in their
studies.
Rawling (1964) measured the specific resistance for various cake thicknesses
and found that the specific resistance decreased with DL in the range of 6.02.0 −=
DL .
35
This result showed that the effect of side-wall friction could not be neglected for DL
ratio of less than 0.6, which invalidated the statement made by Grace (1953a,b). In
order to account for the effect of wall friction, Tiller and co-workers (1962) derived a
correction factor to revise the α value obtained from the C-P cell measurement.
In the conventional C-P cell, the bottom of the cell on which the cake was
seated formed an integral part with the side wall while the top consisted of a movable
piston (Ruth, 1946, Grace 1953a,b, Kottwitz and Boylan, 1958). Haynes (1966)
modified the C-P cell to measure wall friction by using a freely floating piston at both
the top and bottom of the cake. The side wall friction was determined based upon the
measured transmitted pressure from the bottom of filter cake and the applied pressure
on top of the filter cake. He found that 20% to 60% of applied load was consumed as
sidewall friction in 1 to 3-inch cakes using his modified C-P cell and the effect of
sidewall friction was still significant even when the cake DL ratio was 0.5. Other
researchers have developed and modified C-P cell based on Haynes's apparatus. For
example, Shirato et al. (1968) used their modified C-P cell to perform an extensive
analysis of side wall friction by combining the knowledge of soil mechanics, wall
frictional force and cohesive force balance. They observed that the tp − results
predicted from C-P cell data with side wall friction corrected were closer to the
constant rate filtration results (deviation of 20% versus 45%).
Shirato et al. (1968, 1971) made an approximate correction for side wall
friction effect based on the permeability data obtained from the C-P cell tests. They
assumed constant values of Rankine constant, frictional coefficient and cohesive stress
along the side wall. However, these values were found to be a function of the wall
36
normal stress (Fang, 1996; Lu et al., 1998). In their study, the vertical load was
assumed to be uniformly distributed across the cell. But, it was found to be otherwise
by other researchers (Lu, 1968; Fang, 1996). Nevertheless, based on the wall friction
concept, they have developed a relation for the average solid compressive pressure and
C-P cell data corrected with the equation was shown to give a better prediction of the
filtration data. They have also highlighted that the use of large DL ratio and
minimizing wall friction are essential to the proper use of C-P cells and the need of
information concerning the different solids and different coating materials for the cell
wall.
The fraction of pressure transmitted to the bottom of filter cake was reported to
be dependent on the applied pressure, cake DL ratio, material properties and C-P cell
wall material (Lu, 1968, Tiller and Lu, 1972, Tiller et al., 1972, Fang, 1996). Tiller et
al. (1972) performed a qualitative estimate of the vertical variation due to side wall
friction in the C-P cell tests.
The stress distribution of filter cake was investigated by installing pressure
transducers at the bottom of C-P cell at various radial locations and at the side wall of
C-P cell at various vertical heights (Tiller and Lu, 1972, Risbud, 1974, Lu et al., 1998).
The former measurements provide axial stress distributions of the septum, while the
latter measurements provide the radial stress distribution of the side wall. The stress
profiles were found to be non-uniform, indicating that wall friction has tremendous
effect on the structure of filter cake and C-P cell data should be corrected before it can
be used to predict filtration behaviour. In a recent study, Lu et al. (1998) used their
integrated equation of stress distribution derived from rigorous force equilibrium to
37
estimate the average compressive pressure and to correct for the effect of side wall
friction. The simulated results based on corrected C-P cell data were able to predict the
performance of constant pressure filtration within an average deviation of 5% while
the uncorrected data gave a deviation higher than 10%. They also proposed a simple
equation to estimate average compressive pressure which is able to give similar results
to their integrated equation by taking the logarithmic mean of the applied and
transmitted pressure on the filter cake:
−=
T
M
TMs
pp
pppln
(2.49)
2.2.1.2 Filtration Experiment
Filtration experiments can also be used to determine the overall filter cake
characteristics, such as the average ratio of wet cake mass to dry cake mass ( m ) and
the average specific cake resistance ( avα ). In this case, feed suspensions with specified
particle concentration and size are allowed to pass through a filter cell at constant flow
rate or constant applied pressure. For more convenient treatment, the general filtration
equation (Equation 2.45) can be further rewritten in the reciprocal form as follows:
PRv
Pc
dvdt mav µµα += (2.50)
For constant pressure filtration, P is constant, and Equation (2.50) can be
integrated with the following boundary conditions, assuming avα is constant
(Svarovsky, 1981; Tiller et al., 1992):
0,0 == vt and vvtt == , , giving:
38
PRv
Pc
vt mav µµα +=
2 (2.51)
If vt plotted against v gives a straight line, avα can be determined from the slope of
the plot.
If the filtration test is performed at a constant rate, q , the resulting equation is:
qRtqcp mav µµα +=∆ 2 (2.52)
A plot of p∆ vs. t will give a straight line and avα can be evaluated from the slope of
the plot. The results obtained from filtration tests can be used to assess the filtration
performance and to validate the C-P test results.
As mentioned earlier, the reliability of C-P cell data depends on how closely
local cake conditions and actual filtration behaviour can be duplicated in the test cell.
To this end, reliable filtration data are also required. Christensen et al. (1985a,b)
reported that the time-filtrate volume data for most of their 150 runs of filtration
experiments were parabolic and could fit the two-resistance filtration model quite well.
They pointed out that in many instances, non-parabolic filtration curves could be
modified to produce parabolic filtration data by using the corrected non-synchronous
time-filtrate volume data with the consideration of filtrate retained in the filtration
apparatus. To improve the accuracy and precision, the filtration experiments should be
performed using computerized manipulation of operating parameters based on the
application of pressure immediately following the slurry feed, and thickening the slurry
prior to filtration to reduce the significance of sedimentation with respect to filtration.
Murase et al. (1987) designed a filter equipped with a disk having a hole placed
on top of the filter chamber to determine the end point of the filtration test (Figure
39
2.5). They observed that the results obtained by constant pressure filtration
experiments in this new apparatus were in good agreement with those based on C-P
cell test data. The design was based on the principle of sudden flow area contraction in
an orifice. The function of the hole is to detect a transition point of filtration behaviour
due to the sudden reduction in filtration area of filter cake surface. Once the filter cake
grows up to the position underneath the disk, the filtrate flow rate decreases suddenly.
Thus, the dvdt vs. v plot would deviate from the relation represented by the general
filtration Equation (2.50). The transition point is an indication of the end of cake
formation in the filtration chamber as illustrated in Figure 2.5. The cumulative filtrate
volume per unit area at the transition point is expressed as fv . In this case, the average
porosity of the cake can be determined from the following equation:
ssLvs
s
s
fs
av ρρ
ρρ
ε+−
−−=
)1(
)1( (2.53)
The mass ratio of wet cake to dry cake can be determined by:
sav
avsavmρε
ρερε)1(
)1(−
+−= (2.54)
and
mssc
−=
1ρ (2.55)
In the past, the value of m has almost invariably been determined based on weighing
the filter cake before and after the cake drying. By above method, the determination of
wet cake to dry cake mass ratio, porosity and specific resistance does not have to rely
40
on the tedious sampling and drying of the cake material. This method is commonly and
widely used to conduct filtration tests for cake filtration studies. However, the presence
of the orifice plate may cause some irregularities in the flow of suspension and
inhomogeneous cake growth when the filter cake approaches the plate.
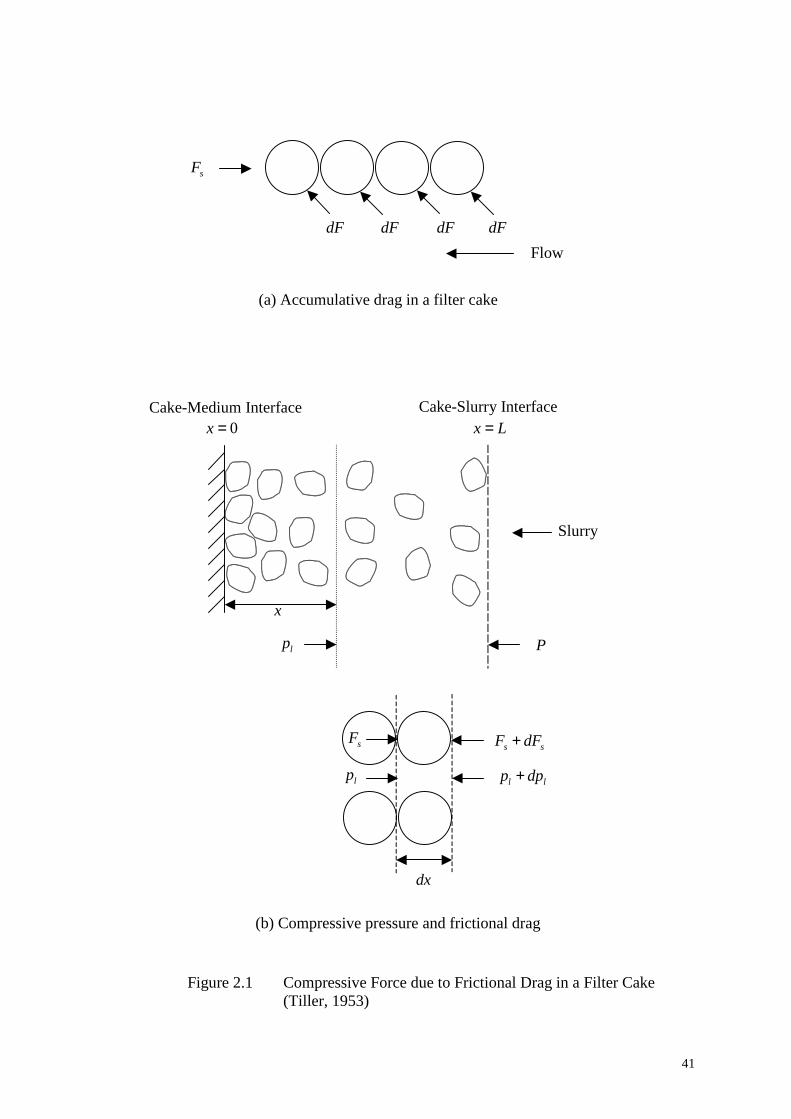
41
Figure 2.1 Compressive Force due to Frictional Drag in a Filter Cake
(Tiller, 1953)
0=xCake-Medium Interface Cake-Slurry Interface
Lx =
x
lp P
Slurry
sF
lp
dx
ss dFF +
ll dpp +
sF
dF dF dF dFFlow
(a) Accumulative drag in a filter cake
(b) Compressive pressure and frictional drag
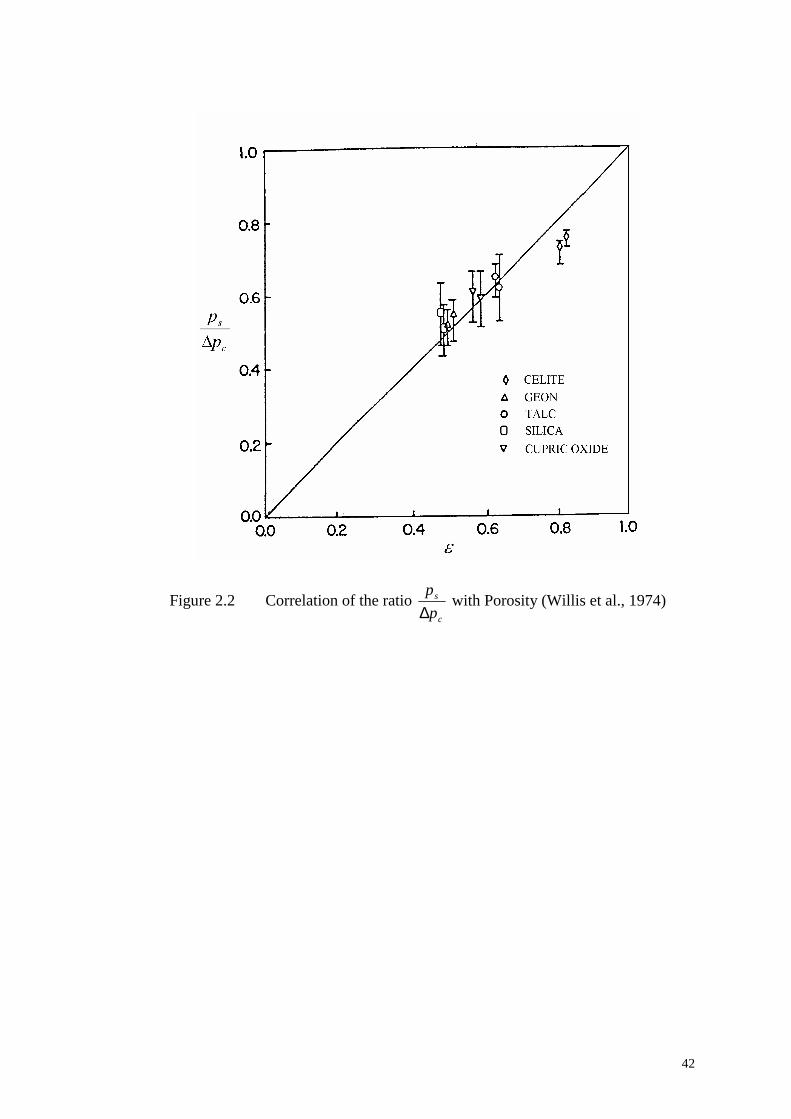
42
Figure 2.2 Correlation of the ratio c
s
pp
∆ with Porosity (Willis et al., 1974)
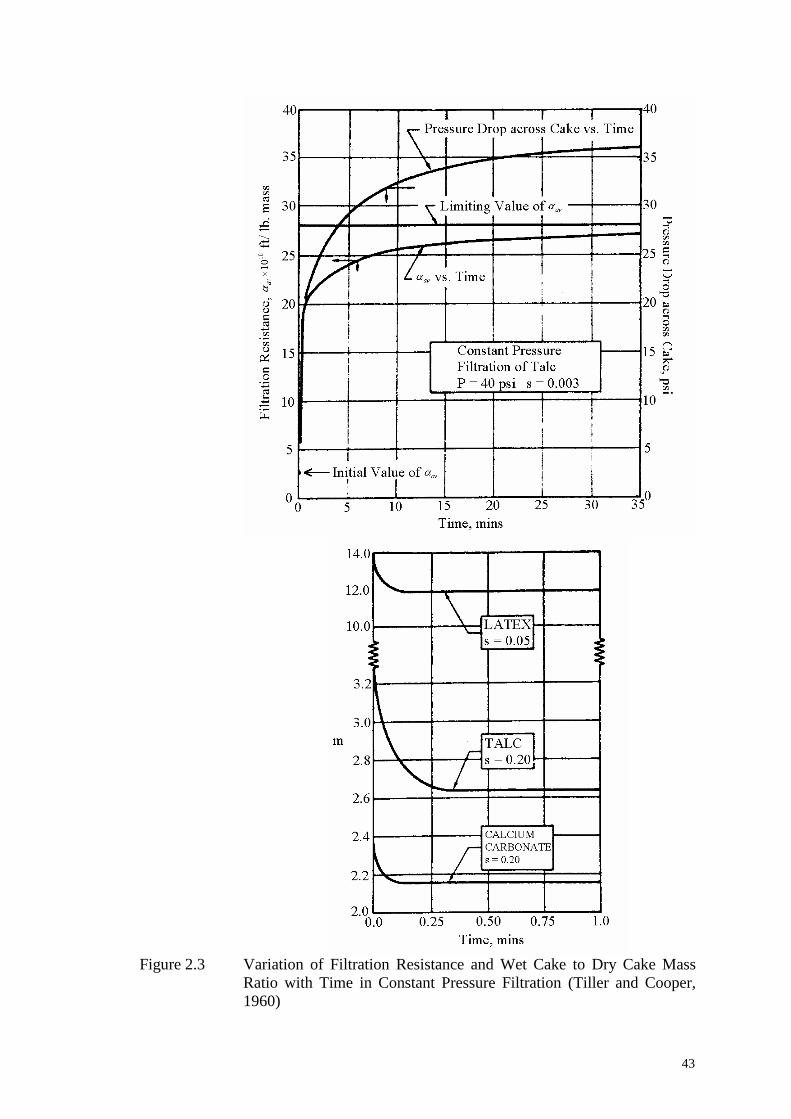
43
Figure 2.3 Variation of Filtration Resistance and Wet Cake to Dry Cake Mass
Ratio with Time in Constant Pressure Filtration (Tiller and Cooper, 1960)
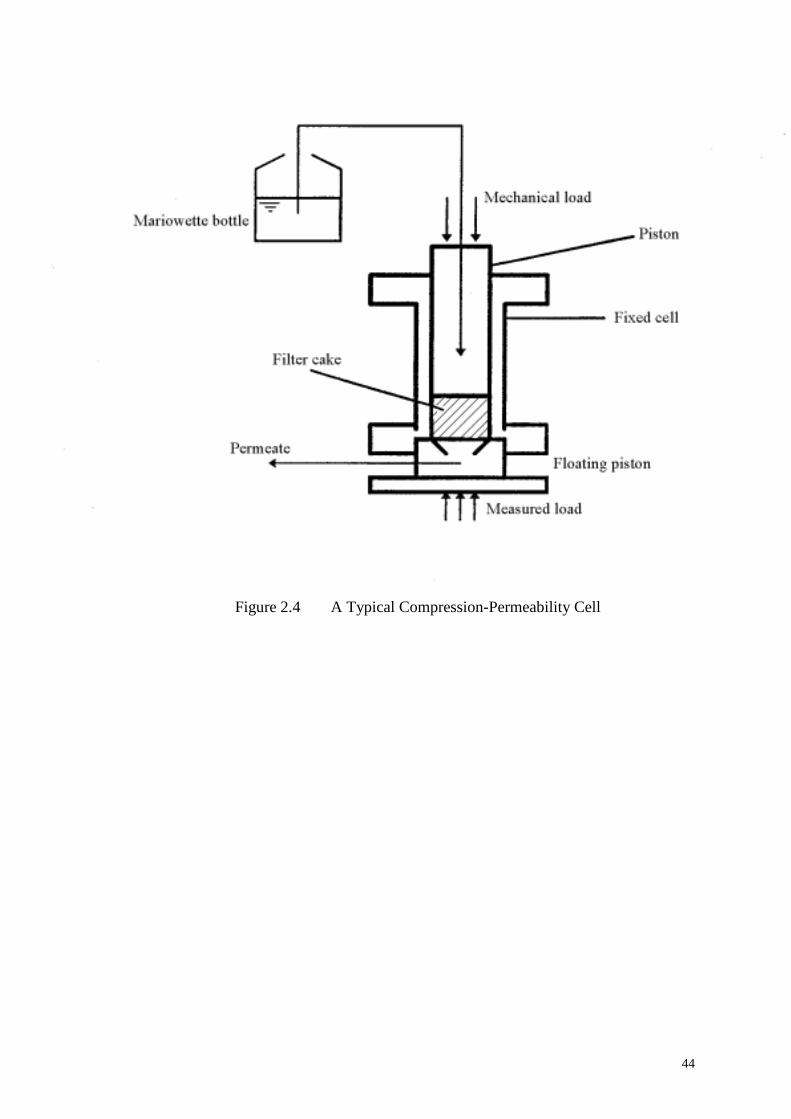
44
Figure 2.4 A Typical Compression-Permeability Cell
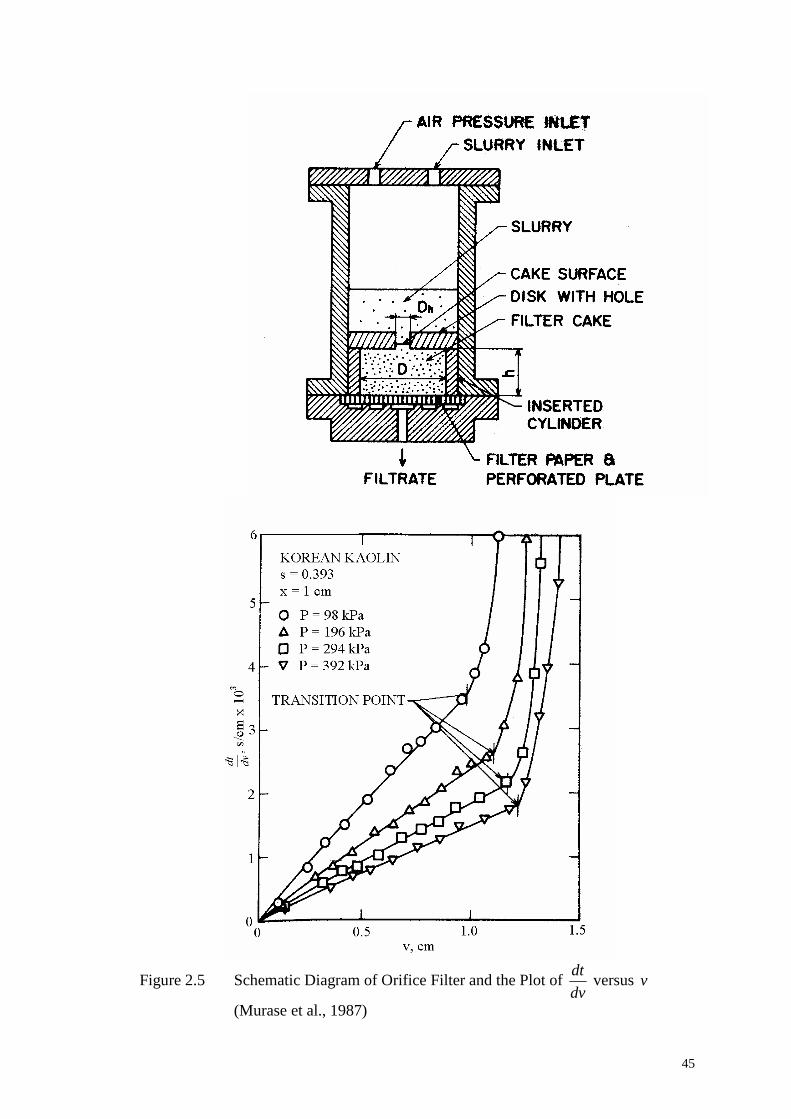
45
Figure 2.5 Schematic Diagram of Orifice Filter and the Plot of
dvdt versus v
(Murase et al., 1987)
46
CHAPTER 3
DEVELOPMENT OF A NEW
MULTIFUNCTION TEST CELL
3.1 Introduction
In filter cake formation, the governing physical parameter is the specific cake
resistance, which is assumed to be a function of the solid compressive stress. For more
than half a century, the compression-permeability (C-P) cell measurement offered a
conceptually simple and independent method of determining the relationship between
α and sp to form a constitutive equation which is required to obtain the stress-
averaged specific cake resistance ( avα ). Although the stress-averaged specific cake
resistance can be obtained from filtration data, the independent determination of
specific cake resistance (α ) using C-P cell has added credence to the physical
significance of α so that α could not be regarded as merely a fitting parameter. The
specific cake resistance and cake solidosity data as a function of solid compressive
stress obtained from C-P measurements are key parameters for the design and
simulation of cake filtration processes.
The filtration characterization results from previous studies had been compared
based on data obtained from two different units, i.e. a separate C-P cell and a separate
filtration unit (Ruth, 1946; Grace, 1953a,b; Kottwitz and Boylan, 1958; Shirato et al.,
1968; Lu et al., 1970; Fang, 1996; Huang, 1998). This method often leads to
uncertainties due to different cell wall surfaces giving rise to different wall friction
between the cell wall-cake interface, thus affecting the cake structure and
47
characteristics. To eliminate this situation, a new multifunction test device was
designed to serve as a Compression-Permeability (C-P) cell, as well as a variable-
volume filtration chamber, within which cake compression, liquid permeation and
constant pressure filtration tests can be carried out in the same test cell, thereby
enabling a direct comparison and correlation between the data.
The new multifunction test cell is equipped with a computerised test system
that allows precise setting of the operating parameters such as the applied loading and
vertical travel of the upper piston. The vertical travel and applied force of the upper
piston are controlled by a load frame device that is typically instrumented for stroke,
traverse speed and load hold. These parameters could be set or adjusted easily using the
associated one-touch control panel. The new test cell also advantageously provides
means for obtaining transmitted pressure (hence wall friction exerted by the filter
cake), cake displacement and filtrate flow rate. As such, filter cake properties such as
cake porosity, compressibility, specific cake resistance and cake growth profile could
be determined. C-P and Filtration Data generated from this new multifunction test cell
will be compared to various literature data for verification. For this purpose, CaCO3-
H2O system which is the pioneering and commonly-used material will be used as a
typical example. The usefulness of this cell will be validated through the correlation
between C-P and filtration results using a few material systems with various
compressibility.
3.2 Description of the Multifunction Test Cell
The new multifunction test cell was modified from a commercial computer-
controlled precision universal-testing machine, i.e. Shimadzu Autograph AGS-10kNG,
48
which is typically used for measuring the mechanical strength characteristics of
materials, up to a maximum loading of 10 kN (or 2000 kPa). It can provide a constant
applied loading and an adjustable piston vertical travel. As illustrated in Figure 3.1,
this modified test cell consists of an upper piston, a complementary lower piston and a
stainless steel cylindrical cell. The inner diameter of the cylindrical cell is 7.5 cm with a
cell height of 9.5 cm. Liquid or slurry was fed into the cell through a central bore in the
upper piston, while the filtrate was drained out via a central bore in the lower piston.
The lower piston rests on a lower load cell, which is linked to a multi-channel
digital data acquisition unit in order to measure transmitted pressure across the filter
cake and consequently the friction loss during cake compression. The vertical travel of
upper piston could be monitored to determine the variation of cake thickness with time
during compression. The change in filter cake thickness is displayed on the control
panel and could be captured continuously through a modified software called Shikibu.
Prior to any of the tests, the load cell would be calibrated electronically to ensure
accuracy and reproducibility.
3.2.1 Multifunction Test Cell used as a C-P Cell
When the multifunction test cell was used as a C-P cell (Figure 3.2), the upper
and lower pistons enclosed a pre-formed filter cake consisting of solid particles of the
material of interest. The upper piston contains a liquid inlet by which liquid can be
delivered to the filter cake. The bottom of the upper piston is provided with a distributor
region consisting of a plurality of grooves. A separate opening acts as an outlet for
entrapped air during cake compression. The bottom of the upper piston is fitted with an
interchangeable multi-orifice support plate. The distributor region was left open to allow
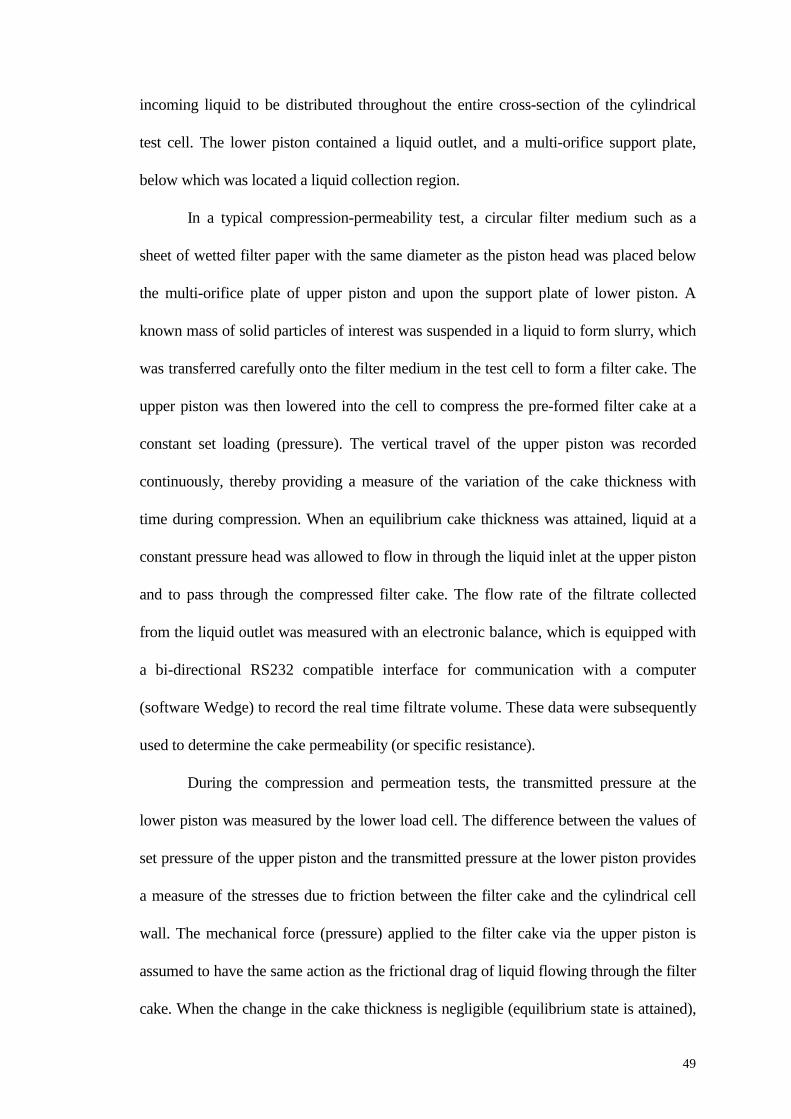
49
incoming liquid to be distributed throughout the entire cross-section of the cylindrical
test cell. The lower piston contained a liquid outlet, and a multi-orifice support plate,
below which was located a liquid collection region.
In a typical compression-permeability test, a circular filter medium such as a
sheet of wetted filter paper with the same diameter as the piston head was placed below
the multi-orifice plate of upper piston and upon the support plate of lower piston. A
known mass of solid particles of interest was suspended in a liquid to form slurry, which
was transferred carefully onto the filter medium in the test cell to form a filter cake. The
upper piston was then lowered into the cell to compress the pre-formed filter cake at a
constant set loading (pressure). The vertical travel of the upper piston was recorded
continuously, thereby providing a measure of the variation of the cake thickness with
time during compression. When an equilibrium cake thickness was attained, liquid at a
constant pressure head was allowed to flow in through the liquid inlet at the upper piston
and to pass through the compressed filter cake. The flow rate of the filtrate collected
from the liquid outlet was measured with an electronic balance, which is equipped with
a bi-directional RS232 compatible interface for communication with a computer
(software Wedge) to record the real time filtrate volume. These data were subsequently
used to determine the cake permeability (or specific resistance).
During the compression and permeation tests, the transmitted pressure at the
lower piston was measured by the lower load cell. The difference between the values of
set pressure of the upper piston and the transmitted pressure at the lower piston provides
a measure of the stresses due to friction between the filter cake and the cylindrical cell
wall. The mechanical force (pressure) applied to the filter cake via the upper piston is
assumed to have the same action as the frictional drag of liquid flowing through the filter
cake. When the change in the cake thickness is negligible (equilibrium state is attained),
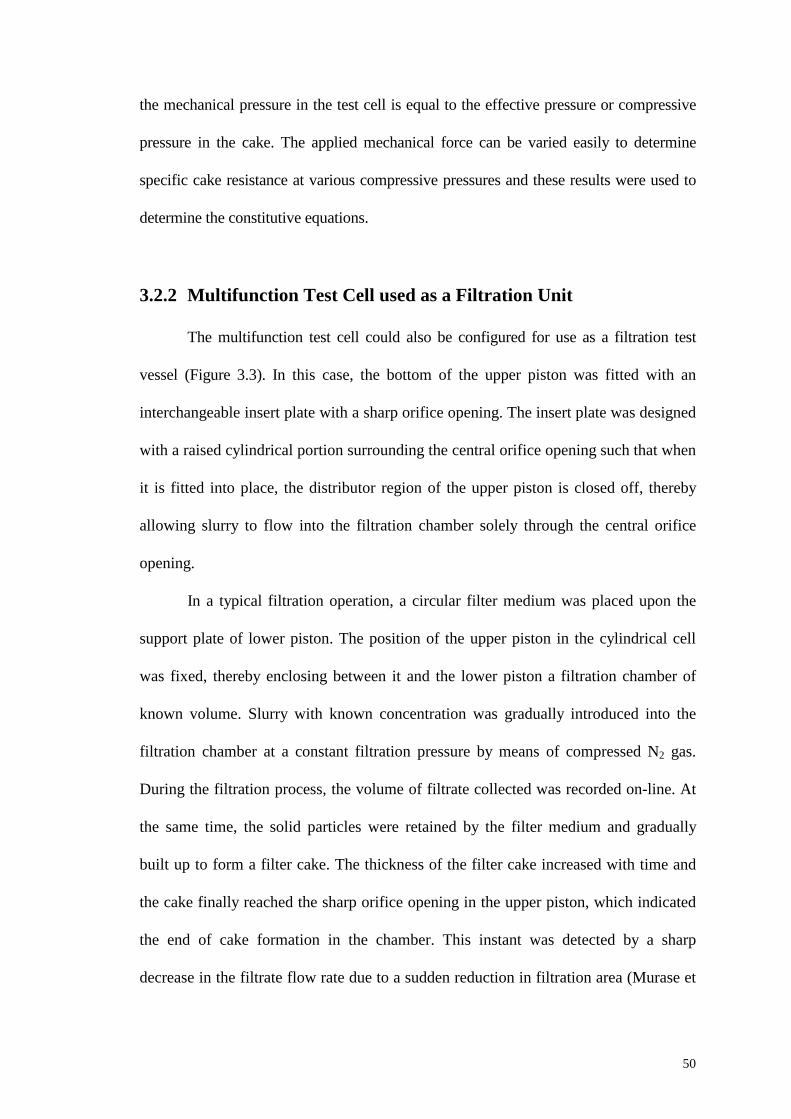
50
the mechanical pressure in the test cell is equal to the effective pressure or compressive
pressure in the cake. The applied mechanical force can be varied easily to determine
specific cake resistance at various compressive pressures and these results were used to
determine the constitutive equations.
3.2.2 Multifunction Test Cell used as a Filtration Unit
The multifunction test cell could also be configured for use as a filtration test
vessel (Figure 3.3). In this case, the bottom of the upper piston was fitted with an
interchangeable insert plate with a sharp orifice opening. The insert plate was designed
with a raised cylindrical portion surrounding the central orifice opening such that when
it is fitted into place, the distributor region of the upper piston is closed off, thereby
allowing slurry to flow into the filtration chamber solely through the central orifice
opening.
In a typical filtration operation, a circular filter medium was placed upon the
support plate of lower piston. The position of the upper piston in the cylindrical cell
was fixed, thereby enclosing between it and the lower piston a filtration chamber of
known volume. Slurry with known concentration was gradually introduced into the
filtration chamber at a constant filtration pressure by means of compressed N2 gas.
During the filtration process, the volume of filtrate collected was recorded on-line. At
the same time, the solid particles were retained by the filter medium and gradually
built up to form a filter cake. The thickness of the filter cake increased with time and
the cake finally reached the sharp orifice opening in the upper piston, which indicated
the end of cake formation in the chamber. This instant was detected by a sharp
decrease in the filtrate flow rate due to a sudden reduction in filtration area (Murase et
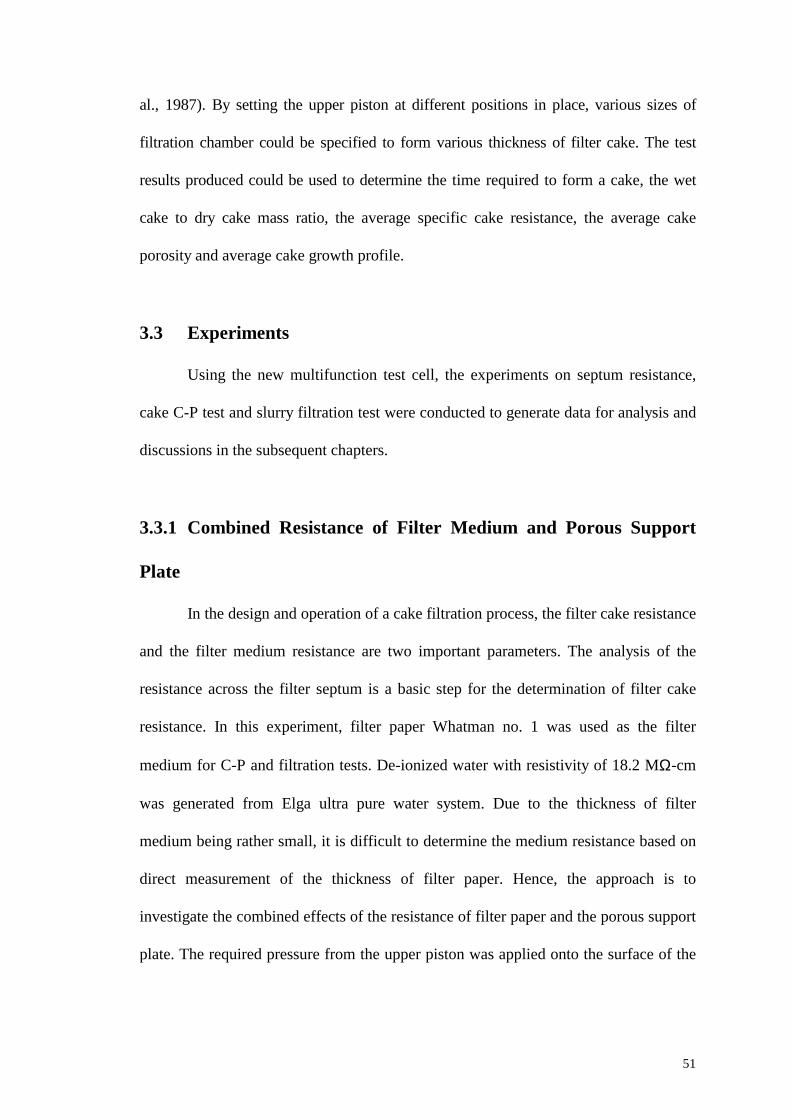
51
al., 1987). By setting the upper piston at different positions in place, various sizes of
filtration chamber could be specified to form various thickness of filter cake. The test
results produced could be used to determine the time required to form a cake, the wet
cake to dry cake mass ratio, the average specific cake resistance, the average cake
porosity and average cake growth profile.
3.3 Experiments
Using the new multifunction test cell, the experiments on septum resistance,
cake C-P test and slurry filtration test were conducted to generate data for analysis and
discussions in the subsequent chapters.
3.3.1 Combined Resistance of Filter Medium and Porous Support
Plate
In the design and operation of a cake filtration process, the filter cake resistance
and the filter medium resistance are two important parameters. The analysis of the
resistance across the filter septum is a basic step for the determination of filter cake
resistance. In this experiment, filter paper Whatman no. 1 was used as the filter
medium for C-P and filtration tests. De-ionized water with resistivity of 18.2 MΩ-cm
was generated from Elga ultra pure water system. Due to the thickness of filter
medium being rather small, it is difficult to determine the medium resistance based on
direct measurement of the thickness of filter paper. Hence, the approach is to
investigate the combined effects of the resistance of filter paper and the porous support
plate. The required pressure from the upper piston was applied onto the surface of the
52
filter medium placed on a porous support plate, and liquid (de-ionized water in this
work) under a constant hydraulic head was passed through the filter septum.
3.3.2 Filter Cake Compression and Permeation Test
CaCO3 is one of the most commonly used materials in the analysis of cake
compression-permeation and cake filtration, as it was used in the pioneering work of
Ruth (1946) and Grace (1953a,b). Therefore, CaCO3 powder (obtained from Fisher
Scientific) is used extensively in this research. Other materials that were investigated
include Kaolin powder, TiO2 powder and Kromasil powder. Physical properties and
sources of supply of these materials can be found in Appendix A.
The filter cake consisting of the respective powder (e.g. 50g for CaCO3, 100g
for Kaolin, 60g for TiO2 and 40g for Kromasil), and saturated with de-ionized water
was pre-formed and compressed under applied pressures of 100 to 800 kPa(g) in the C-
P cell for about 24 hours until the cake reached its equilibrium thickness. The filter
outlet was kept at a level higher than the cake surface so that the cake was always
saturated and compressed. When the cake compression had attained equilibrium, i.e.
negligible change in cake thickness was observed, de-ionized water was passed
through the filtration cell under a constant hydraulic head to start the permeability test.
The cake compression and permeation tests were performed under various
compressive pressures. In this experiment, a fresh new cake was pre-formed for each
compressive pressure to avoid the variation of cake structure which could be resulted
from particle degradation or fine particle migration towards the septum due to prolonged
water permeation through the filter cake and hence affecting the specific cake resistance
(Lu et al., 1970).
53
3.3.3 Filtration Test
In the filtration test, a known quantity of the respective powder was mixed with
de-ionized water to form a suspension with the required solids concentration (e.g. 2%
by weight for CaCO3-H2O system). The suspension was stirred at 25 rpm in a slurry
tank for at least ½ hour before the start of filtration and stirring was maintained during
the test. Filtration test was performed as mentioned earlier in section 3.2.2 under
filtration pressure of 100 to 800 kPa(g). The concentration of the suspension was
measured and checked for each test to ensure reproducibility of the suspensions
prepared. Table 3.1 lists the conditions under which the filtration experiments were
conducted. Four types of suspensions, i.e. CaCO3, Kaolin, TiO2, and Kromasil were
analyzed because they are commonly used materials in filtration research.
3.4 Results and Discussion
In this section, the data generated from the new multifunction test cell will be
presented and analyzed with discussion in more details for the commonly-used CaCO3
system.
3.4.1 Combined Resistance of Filter Medium and Porous Support
Plate
The combined resistances of filter medium and porous support plate were
determined as a function of applied pressures and cumulative filtrate volume. Figure
3.4 shows the combined resistance of filter paper and porous support plate under a
range of applied pressures from about 100-1000 kPa. Comparison between various
numbers of filter paper used was also shown on the same figure. The septum resistance
54
was calculated based on Equation 2.39 with q being the value of de-ionized filtrate
flow rate per unit filtration area. The septum resistance was found to increase slightly
and linearly with applied pressure. This is consistent with the results obtained by Fang
(1996). With increasing pressure, the filter paper becomes more compact.
Compactness, in turn, leads to a higher resistance to flow. As expected from Figure
3.4, the value of filter septum resistance increases with the number of filter papers
used.
Figure 3.5 shows that there is no plugging of filter medium in the presence of
de-ionized water as the feed liquid because cumulative filtrate volume obeyed a linear
relationship with operating time. Hence, in this instant, mR is constant throughout the
operation at a specific compressive pressure.
3.4.2 Correction of Applied Pressure in C-P Cell
The new multifunction test cell has the features of zero reset and constant
loading. As such, it is able to provide accurate data on cake thickness (piston
displacement), transmitted pressure and hence the side wall friction. In this work, the
side wall friction has been taken into account to characterize the filter cake parameters,
and the effective pressure was taken as the log mean value of the applied and
transmitted pressures (Equation 2.49) according to Lu et al. (1998). They have shown
that the mean applied pressure calculated from this simple formula agreed very well
with the results corrected by their equation derived from stress analysis (Equation 23,
Lu et al., 1998). In this experiment with CaCO3 cake, the friction loss due to sidewall
effect in cake compression was found to range from 16-35% of applied pressure for
cake DL ratio of 0.19-0.25 (Figure 3.6). At the same L/D ratio, Kromasil cake which
55
is less compressible than CaCO3 gives a lower friction loss, i.e. 10-26%. At L/D ratio
of 0.10-0.14, Kaolin which is more compressible than TiO2 shows a higher friction
loss (22-41%) compared to that of TiO2 (11-27%). Hence, a more compressible cake is
subjected to a higher wall friction loss. Tiller et al. (1972) and Shirato et al. (1968)
reported that 20% of applied pressure was consumed as sidewall friction even when
the cake DL ratio was < 0.2.
3.4.3 Filter Cake Compressibility and Permeability
Data on cake porosity and permeability (or specific resistance) are important to
the design and modeling of cake filtration. A typical plot of the variation of cake
thickness with time for CaCO3 cake under compression is shown in Figure 3.7. From
this figure, it was found that the cake thickness changed significantly during
approximately the first hour of compression and gradually leveled off until around 24
hours of compression. Grace (1953a) reported that about 10-15 minutes was sufficient
for a material showing a high degree of compressibility to reach its mechanical
equilibrium. However, with the new test cell which is capable of detecting its piston
displacement within an accuracy of 0.01 mm at real time intervals, it was observed that
a period much greater than 15 minutes was required for materials such as CaCO3 to
reach mechanical equilibrium.
The filter cake specific resistance can be determined using Equation (2.47) and
based on the instantaneous cake thickness data, the cake porosity can be calculated
from Equation (2.48). As an example, the compression-permeability results for CaCO3
obtained from the new multifunction test cell in terms of α vs. sp and ε vs. sp are
shown in Figure 3.8(a) and 3.8(b), respectively. The data of specific cake resistance
56
and porosity generated from this multifunction test cell could be reproduced within the
experimental uncertainties as shown by symbol “•” on both Figures 3.8(a) and 3.8(b).
The estimated experimental uncertainties are also shown as error bars on the plots. The
percentage errors are found to be only within 6% for both the specific cake resistance
and porosity. Comparisons with literature data on CaCO3-water system from Grace
(1953a) and Fang (1996) have also been made as shown on the plots. In general, the
trends follow closely of those from other researchers although an exact agreement is
not expected because of different cell design and measurement systems. Nevertheless,
the specific cake resistance is observed to decrease with increasing porosity or, in other
words, a less stressed cake exhibits greater porosity and permeability.
The relationship between cake permeability and porosity obtained from the
new multi-function test cell could be predicted using Carman-Kozeny equation
[Equation (2.12)] as shown in Figure 3.9(a)-(d) ( K = 5 for Kromasil, K = 10 for
CaCO3 and TiO2, and K = 12 for Kaolin system). For Kromasil cake, the prediction is
not satisfactory as the range of porosity involved is rather small.
3.4.4 Constant Pressure Filtration
The filtration experiments were conducted under constant pressure conditions.
The results obtained are v vs. t up to the time when the cake thickness reached a pre-
specified value. When the multifunction cell was used for filtration experiment, the
position of the upper piston was fixed, thereby enclosing between it and the lower
piston a chamber of known volume (Section 3.2.2). The test suspension entered into
the chamber through an orifice at the center of the piston. Initially, there was sufficient
space between the upper piston and the cake surface for the entering suspension to be
57
distributed over the entire cake surface. However, as the cake thickness approaches the
chamber height, suspension distributions are hindered and the reduction of the
effective filtration area leads to a sudden reduction of the filtration rate (Murase et al.,
1987). From the occurrence of this sudden reduction in filtration, the filtration time
was determined.
To illustrate the procedure, the results of v vs. t for one typical experiment
(filtration of CaCO3 suspension at oP = 8 x 10⁵ Pa) are shown in Fig. 3.10(a). As in
constant pressure filtration, v decreases with t but a more significant reduction occurs
at t ∼ 700 s. This situation can be shown more clearly if one plots vt vs. v (Figure
3.10b). As shown in Fig. 3.10(b), the results are represented by two linear segments.
The intersecting point of these two segments enables the determination of the time
when L equals the cake thickness setting. Table 3.2 shows the time when a cake
thickness reached its pre-set value for different material systems in study. As expected,
when the filtration pressure is higher, the cake can form and grow faster to reach the
pre-set cake thickness. For the same cake thickness setting, Kaolin cake which is more
compressible requires a longer time to reach the preset cake thickness, followed by the
less compressible materials, i.e. CaCO3 and Kromasil cake. By varying volume of
filtration chamber and investigating the different times required for the filter cake to
fill the pre-set filtration chamber, the filter cake growth profile could be deduced
(Figure 3.11a-b). The increase of cake thickness with time which provides information
on cake formation and growth is of practical importance especially if the filtered solids
are the primary product of separation. Besides tv − data, information on this tL − is
also required in the determination of constitutive relationship from filtration data as
outlined in Chapter 5.
58
Comparing the filtration data obtained from 5 pre-set insert plate placements
(i.e. 10, 20, 30, 40 and 50mm) for CaCO3 cake (Figure 3.12a), a higher average
specific cake resistance is observed especially for the filtration run with a smaller
insert plate setting at higher filtration pressure. For a smaller cake thickness setting, the
insert plate is nearer to the filtering septum and the jetting of slurry through the insert
plate onto the filtering septum is more pronounced when the slurry is introduced into
the filtration chamber. Besides the filtration pressure, the slurry jetting effect provides
an extra impact onto the growing filter cake and increases its average specific cake
resistance. However, the effect of this insert plate placement is observed to be
insignificant for Kaolin cake which is more compressible, since its average specific
cake resistance does not vary significantly at different insert plate settings (Figure
3.12b: 4 pre-set chamber heights, i.e. 5, 10, 15 and 20mm for Kaolin cake). As a
whole, the associated tv − data generated from different pre-set cake thickness at a
specific filtration pressure are mostly overlapping with each other (Figure 3.13a-b),
except for CaCO3 cake with preset thickness at 10mm (Figure 3.14a-c) which shows a
gradual decreasing trend with filtration pressure compared to the tv − data at the first
10mm of cake thickness for the other 4 insert plate settings. This explains the higher
average specific cake resistance observed earlier for the filtration run pre-set at a
smaller insert plate setting at higher filtration pressure. From Figures 3.14(a)-(c), the
tv − data tend to be less consistent and less overlapping at different cake thickness
settings when the operating pressure is lowered.
Once the slope of the plot of vt vs. v is obtained, the values of average specific
cake resistance can be calculated from Equation (2.51). The value of filtrate volume at
transition point ( fv ) was used to calculate cake average porosity ( avε ) from Equation
59
(2.53). The corresponding values of wet cake mass to dry cake mass (m) obtained from
Equation (2.54) indirectly through vt vs. v plot were found to be agree reasonably
well with those determined by physically weighing the wet mass and dry mass (heat
and dry up the cake until its weight is constant) of the filter cake produced from
filtration experiment (Figure 3.15). Values of m were observed to decrease slightly
with filtration time at the initial period. However, m has been assumed to be constant
in the conventional filtration analysis and this issue will be further discussed in
Chapter 5.
The average specific cake resistance and average cake porosity from filtration
test of CaCO3-H2O system are plotted as a function of filtration pressure in Figures
3.16(a) and 3.16(b). The estimated errors associated with experimental uncertainties
and in determining the average cake properties using Equations (2.51), (2.53-2.55) and
the plot of vt vs. v are also shown as error bars on the figures. Basically, these errors
range from 19-21% for average specific resistance and 9-11% for average porosity of
the CaCO3 cake. The average specific cake resistance and porosity obtained from this
multifunction test cell could be reasonably reproduced as shown by symbol “•” on
both Figures 3.16(a) and 3.16(b). Again, comparisons were also made with literature
data on CaCO3-water system from Grace (1953b) and Lu and Hwang (1993) as shown
on the plots. The latter have conducted filtration test in a smaller pressure range.
Nevertheless, the overall trend is evident from the plots.
60
3.4.5 Correlation of C-P and Filtration Data
The data of cake solidosity, specific cake resistance and permeability with
respect to cake compressive stress obtained from C-P cell measurement for CaCO3,
Kaolin, TiO2 and Kromasil cakes are shown in Table 3.3. Both the results of α and ε
from C-P test for the four materials were fitted with the Power Law Equations of
(2.30) and (2.31) (Figures 3.17a and 3.17b). The respective values of the fitting
parameters obtained by non-linear regression analysis are given in Table 3.4. Having
the highest values of compressibility coefficients, i.e. n and β , kaolin is shown to be
the most compressible material followed by TiO2, CaCO3 and Kromasil. The degree of
fitting for both porosity and specific cake resistance can be seen graphically from
Figure 3.17(a) and 3.17(b) for the four material systems. Constitutive parameters for
the CaCO3-H2O system, as a typical example, have also been compared with literature
data from both C-P and filtration tests as listed in Table 3.4. For filtration test data in
Table 3.4, the constitutive parameters were obtained from non-linear regression
analysis of the integrated average equation for specific cake resistance and porosity,
i.e. Equations (2.34) and (2.38).
Figures 3.18(a)-(d) and 3.19(a)-(d) show the comparisons between the average
specific cake resistance and average porosity obtained from filtration test results (with
experimental error bars shown) and those according equations (2.34) and (2.38) with
the constitutive parameters determined from compression-permeability test data shown
in Table 3.4. The estimated errors associated with experimental uncertainties and in
determining the average specific cake resistance of Kaolin (∼ 19-22%), TiO2 (∼ 19-
22%) and Kromasil (∼ 20-23%) are almost the same as that of CaCO3 cake (∼ 19-21%).
For average cake porosity, the estimated experimental error was observed to be highest
61
for Kaolin (∼ 13-23%) which is more compressible, followed by TiO2 (∼ 6-12%),
CaCO3 (∼ 9-11%) and Kromasil cake (∼ 7-9%).
Within the pressure range used in this study [100-800 kPa], the results
predicted based on C-P cell data generated from the new multifunction test cell
correlate well with and follow reasonably the trend displayed by the results from
filtration data for the CaCO3 avα value and the Kromasil avε value. However, the avα
values for the other materials tend to experience worsening deviations at higher oP
values and the form of the C-P and filtration data curves are not the same for either
TiO2 or Kromasil. The avε curves do exhibit similar trends, but for CaCO3, Kaolin and
TiO2, the differences in values obtained from C-P and filtration tests are large. The
results shown here are predicted from C-P data based on the conventionally employed
relationship between pore liquid pressure and solid compressive stress of 0=+ ls dpdp
where mp∆ is negligible and the value of cp∆ in the derived equations is taken as oP .
In this case, the effect of cake porosity on the sl pp − relationship has not been
considered although it affects the correlation between the results derived from C-P cell
measurement and the filtration data as pointed out by Willis et al. (1974). In view of
this, the effect of sl pp − relationship on the filter cake analysis will be investigated in
the subsequent chapter.
Constitutive parameters determined from C-P cell test can be used to simulate
the formation and growth of filter cake. Filtrate volume and cake thickness as
functions of time can be calculated from conventional theory (Equations 2.51 and
2.53) using the average values determined from constitutive Equations (2.34) and
(2.38) whereby the constitutive parameters were derived from C-P test data. In this
62
case, the conventional 0=+ ls dpdp equation is employed for the relationship between
pore liquid pressure and cake compressive stress. An example of a numerical filtration
model to predict the variation of filtrate volume and cake thickness with time by
employing constitutive parameters in a computer simulation program was proposed by
Stamatakis and Tien (1991). This model is a rigorous analysis of cake filtration using
multiphase flow theory. Cake compression and moving boundary nature of cake
formation and growth are taken into account.
As an example, comparisons between the above mentioned models and
filtration data are shown in Figures 3.20 and 3.21 for CaCO3 cake. For variation of
filtrate volume as a function of time in Figure 3.20, the filtration model proposed by
Stamatakis and Tien predicted a lower filtrate volume compared to the conventional
theory at both the low and high pressures (100 and 800 kPa). The results predicted
from conventional theory were found to be closer to the actual filtration data. From
Figure 3.21, the model proposed by Stamatakis and Tien predicted a smaller cake
thickness compared to the prediction from conventional theory, which agrees better
with actual filtration data.
3.5 Concluding Remarks
The newly-developed multifunction test cell was modified from a commercial
computer-controlled precision universal testing machine, which is typically used for
measuring the mechanical strength characteristics of materials. The modifications
enable it to be used at different times as a C-P cell and a variable volume filtration
chamber. The conversion between C-P and filtration test is effected by simply
replacing the proper interchangeable insert plate at the bottom of upper piston. As both
63
the filtration test and the compression-permeability test can be carried out in the same
cell, this enables a direct comparison and correlation of the results. The effect of
sidewall friction could be accounted for from the measurement of lower load cell
during each test. The magnitude of wall friction was found to be more than 20% even
for a cake DL ratio of less than 0.2.
Overall, this new test device consisting of a stainless steel test cell,
computerized load frame, data capture and analysis software, and peripherals, is a
convenient all-in-one package solution for cake filtration studies. The computerized
load frame can automatically control the operating parameters such as applied load and
vertical travel of upper piston through the function keys on an easy-operated one-touch
control panel. From filtration experiments conducted in the new multi-function test
cell, data on cake filtration rate, average specific resistance and porosity could be
obtained. The wet cake to dry cake mass ratio could be determined without the need
for cake drying. By varying the insert plate location, different filtration chamber
volume and hence cake thickness could be pre-set to determine the cake growth
profile. The effect of insert plate placement was found to affect mostly the average
specific cake resistance of CaCO3 cake with smaller cake thickness setting at higher
filtration pressure. It also causes the inconsistency in tv − data especially at lower
filtration pressure.
From error analysis and comparisons of data with other researchers, the
experimental data generated from this new multifunction test cell are within
experimental error and acceptable limits. The reproducibility of this equipment is also
within tolerance. The values of specific cake resistance (α ) and cake porosity (ε ) are
dependent on properties of the suspension, in particular particle size and size
distribution, crystal morphology, and pH (or zeta potential and ionic strength). Due to
64
the specific type (or grade) of materials used are different and the characteristics of the
suspensions are not sufficiently available in the published literature, this makes the
comparisons of the new data with already published data difficult and may not be
entirely valid.
The data generated from the C-P test could be used to form the power-law type
of constitutive equations, from which the average values of the cake properties were
determined. The relationship between cake permeability and porosity could be
interpreted using the established Carman-Kozeny equation with the Kozeny constant
known a priori. In view of both its functionality as a C-P cell and filtration chamber in
the same test unit, the new multifunction test cell could show a direct and actual
correlation between C-P and filtration results to develop a better prediction of filtration
performance in terms of the correspondence between specific cake resistance (or cake
permeability) and compressive stress from the C-P data.
From the experimental results obtained and based on the conventional
approach of deriving the average properties from the local properties using sl pp −
relationship of 0=+ sl dpdp , this new multifunction test cell can be used to predict
the filtration performance from the C-P test data within certain tolerances specific to a
material system. However, it is proposed to further study the effect of the relationship
between pore liquid pressure and solid compressive stress on the correlation of the C-P
and filtration results, in view of the differences between the results. The constitutive
parameters determined from the non-linear regression of C-P data could also be used
in different filtration models to predict the behavior of filtration process.
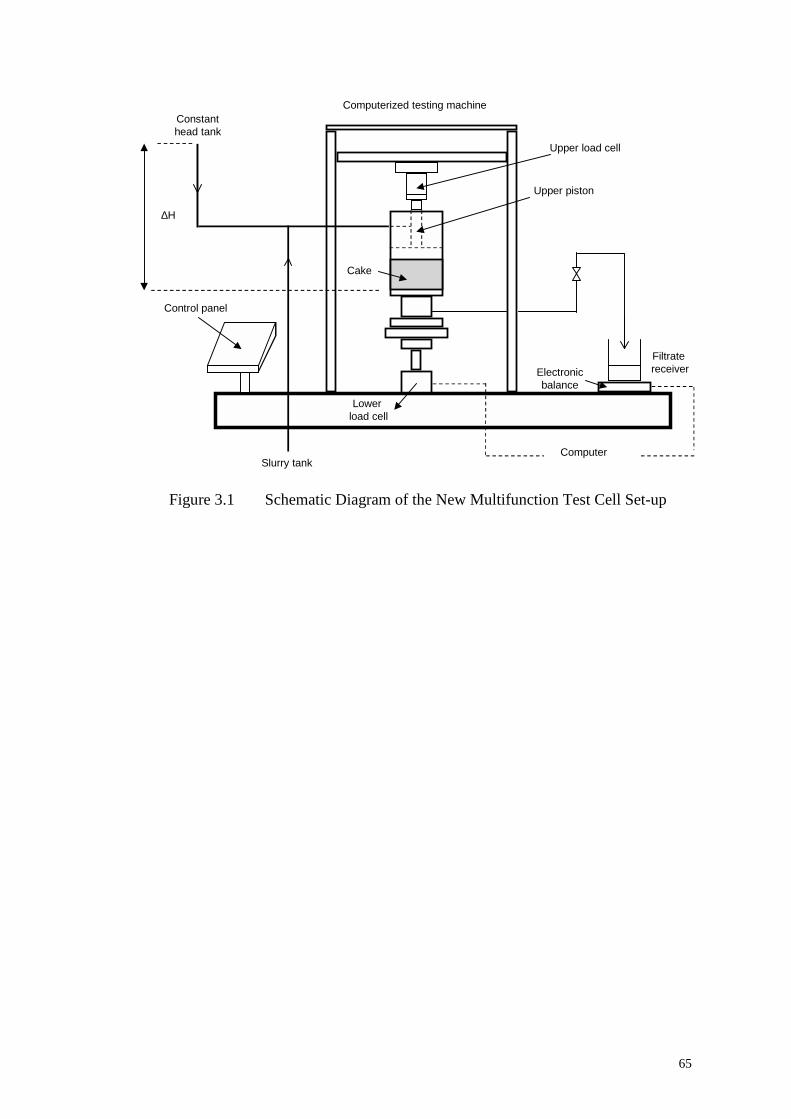
65
ComputerSlurry tank
Constanthead tank
Computerized testing machine
Upper load cell
Cake
Filtrate receiver
Control panel
Lower load cell
Upper piston
∆H
Electronicbalance
Figure 3.1 Schematic Diagram of the New Multifunction Test Cell Set-up
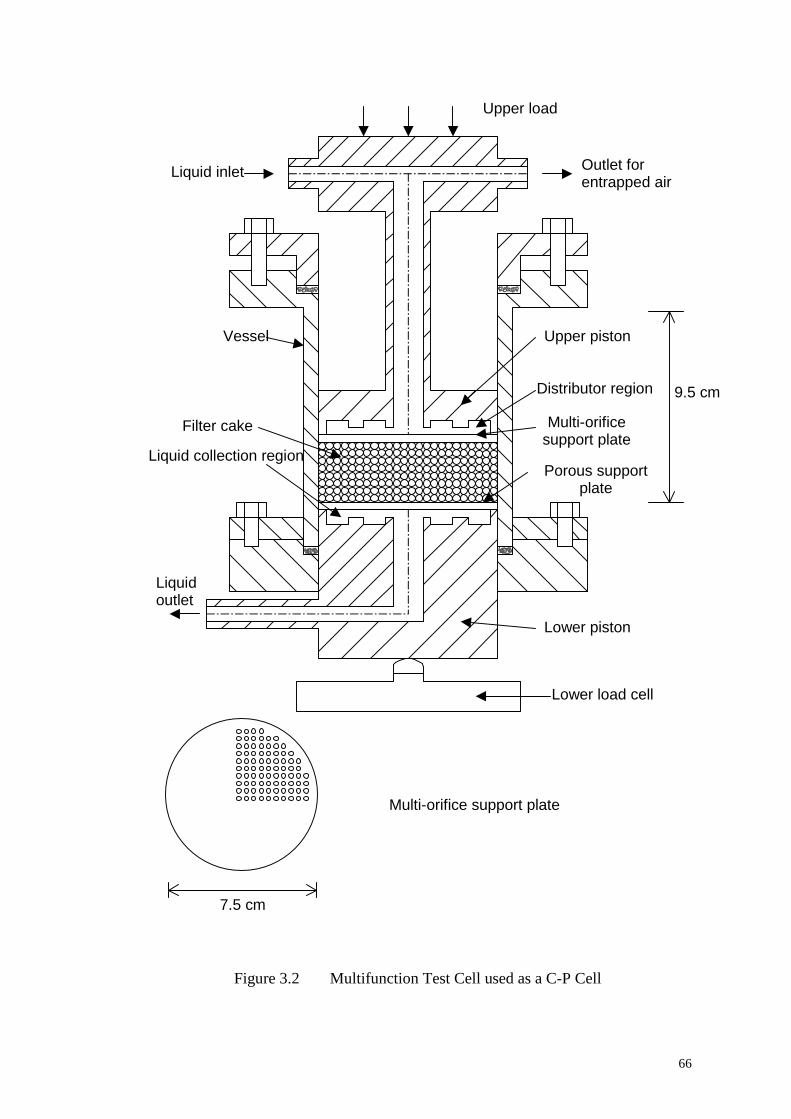
66
Figure 3.2 Multifunction Test Cell used as a C-P Cell
Liquid inlet Outlet for entrapped air
Vessel
Filter cake
Liquid collection region
Liquid outlet
Upper piston
Distributor region Multi-orifice
support plate Porous support
plate
Lower piston
Lower load cell
Multi-orifice support plate
Upper load
9.5 cm
7.5 cm
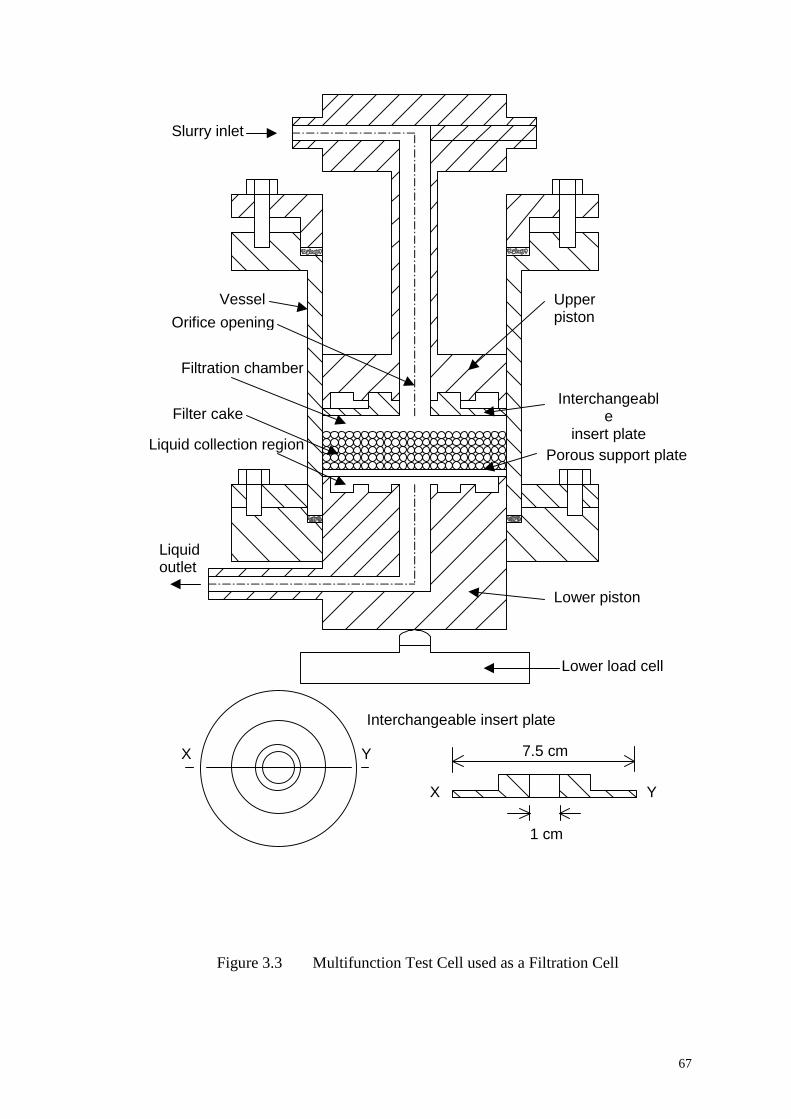
67
Figure 3.3 Multifunction Test Cell used as a Filtration Cell
Slurry inlet
Vessel
Filter cake
Liquid collection region
Liquid outlet
Upper piston
Interchangeable
insert plate Porous support plate
Lower piston
Lower load cell
Interchangeable insert plate
Filtration chamber
Orifice opening
X Y X Y
1 cm
7.5 cm
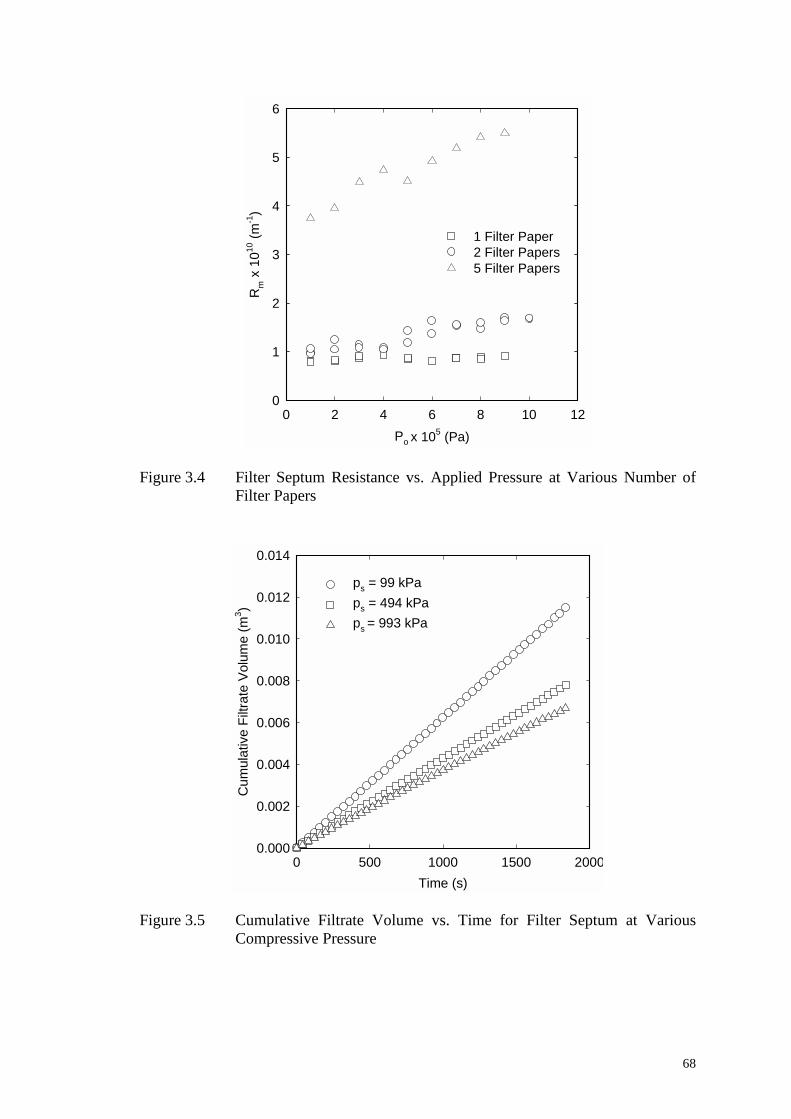
68
Po x 105 (Pa)0 2 4 6 8 10 12
Rm x
1010
(m-1
)
0
1
2
3
4
5
6
1 Filter Paper2 Filter Papers 5 Filter Papers
Figure 3.4 Filter Septum Resistance vs. Applied Pressure at Various Number of
Filter Papers
Time (s)0 500 1000 1500 2000
Cum
ulat
ive
Filtr
ate
Volu
me
(m3 )
0.000
0.002
0.004
0.006
0.008
0.010
0.012
0.014
ps = 99 kPa ps = 494 kPa ps = 993 kPa
Figure 3.5 Cumulative Filtrate Volume vs. Time for Filter Septum at Various
Compressive Pressure
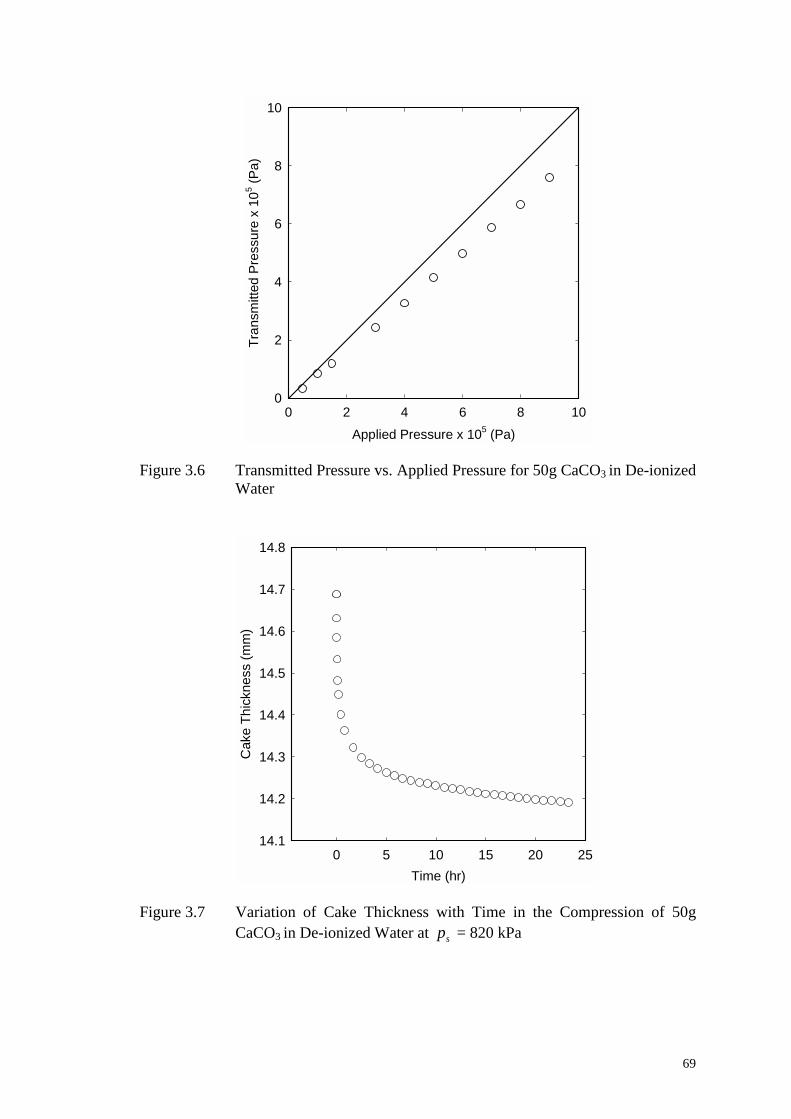
69
Applied Pressure x 105 (Pa)0 2 4 6 8 10
Tran
smitt
ed P
ress
ure
x 10
5 (Pa)
0
2
4
6
8
10
Figure 3.6 Transmitted Pressure vs. Applied Pressure for 50g CaCO3 in De-ionized
Water
Time (hr)0 5 10 15 20 25
Cak
e Th
ickn
ess
(mm
)
14.1
14.2
14.3
14.4
14.5
14.6
14.7
14.8
Figure 3.7 Variation of Cake Thickness with Time in the Compression of 50g CaCO3 in De-ionized Water at sp = 820 kPa
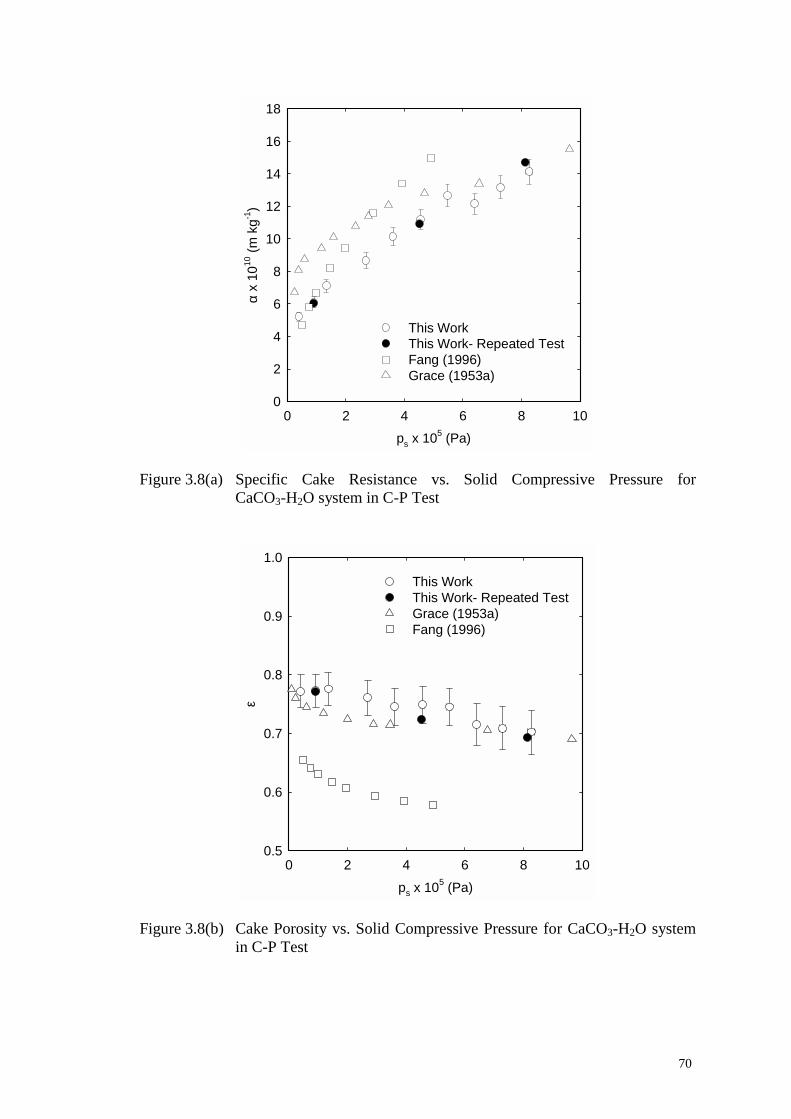
70
ps x 105 (Pa)0 2 4 6 8 10
α x
1010
(m k
g-1)
0
2
4
6
8
10
12
14
16
18
This WorkThis Work- Repeated TestFang (1996)Grace (1953a)
Figure 3.8(a) Specific Cake Resistance vs. Solid Compressive Pressure for
CaCO3-H2O system in C-P Test
ps x 105 (Pa)0 2 4 6 8 10
ε
0.5
0.6
0.7
0.8
0.9
1.0
This WorkThis Work- Repeated TestGrace (1953a)Fang (1996)
Figure 3.8(b) Cake Porosity vs. Solid Compressive Pressure for CaCO3-H2O system
in C-P Test
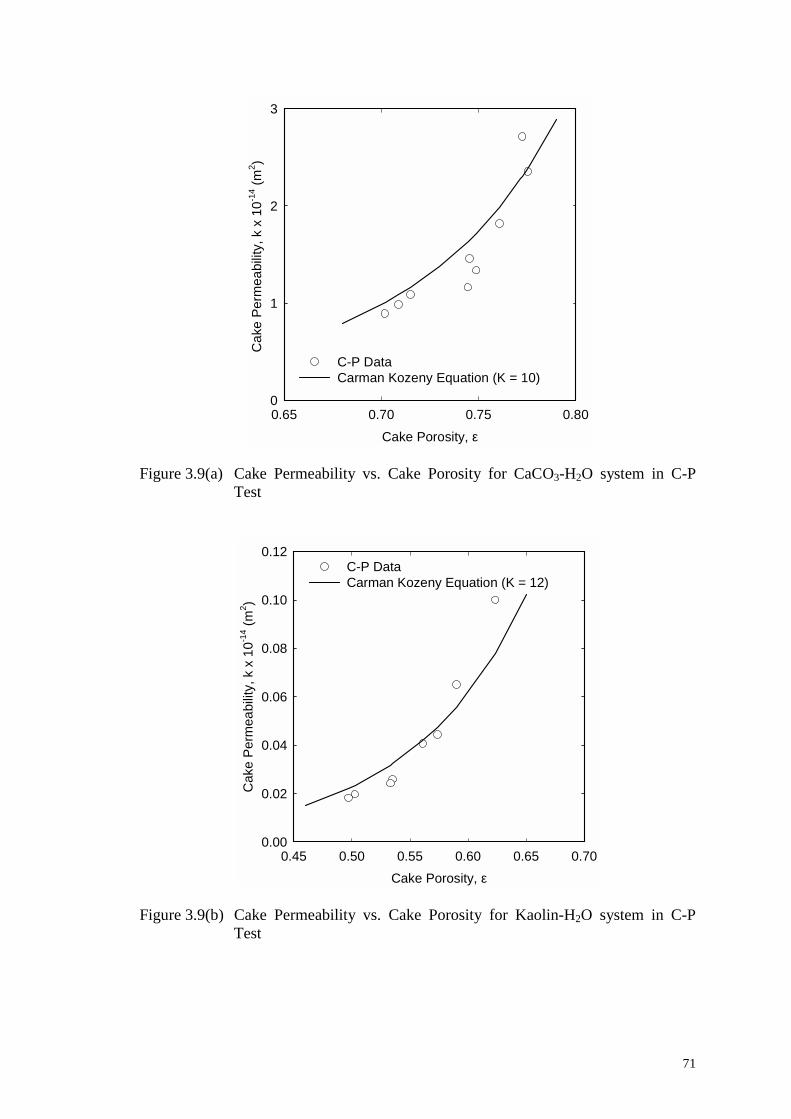
71
Cake Porosity, ε0.65 0.70 0.75 0.80
Cak
e Pe
rmea
bilit
y, k
x 1
0-14 (m
2 )
0
1
2
3
C-P DataCarman Kozeny Equation (K = 10)
Figure 3.9(a) Cake Permeability vs. Cake Porosity for CaCO3-H2O system in C-P
Test
Cake Porosity, ε0.45 0.50 0.55 0.60 0.65 0.70
Cak
e Pe
rmea
bilit
y, k
x 1
0-14 (m
2 )
0.00
0.02
0.04
0.06
0.08
0.10
0.12C-P DataCarman Kozeny Equation (K = 12)
Figure 3.9(b) Cake Permeability vs. Cake Porosity for Kaolin-H2O system in C-P
Test
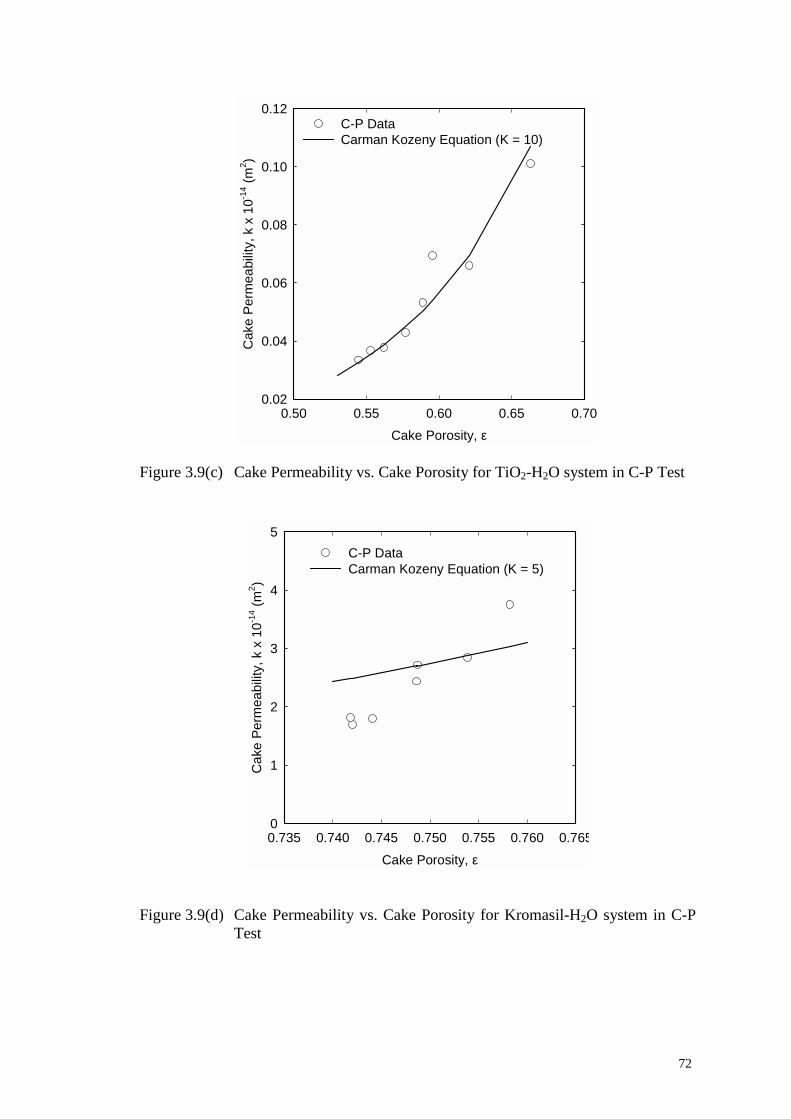
72
Cake Porosity, ε0.50 0.55 0.60 0.65 0.70
Cak
e Pe
rmea
bilit
y, k
x 1
0-14 (m
2 )
0.02
0.04
0.06
0.08
0.10
0.12C-P DataCarman Kozeny Equation (K = 10)
Figure 3.9(c) Cake Permeability vs. Cake Porosity for TiO2-H2O system in C-P Test
Cake Porosity, ε0.735 0.740 0.745 0.750 0.755 0.760 0.765
Cak
e Pe
rmea
bilit
y, k
x 1
0-14 (m
2 )
0
1
2
3
4
5C-P Data Carman Kozeny Equation (K = 5)
Figure 3.9(d) Cake Permeability vs. Cake Porosity for Kromasil-H2O system in C-P
Test
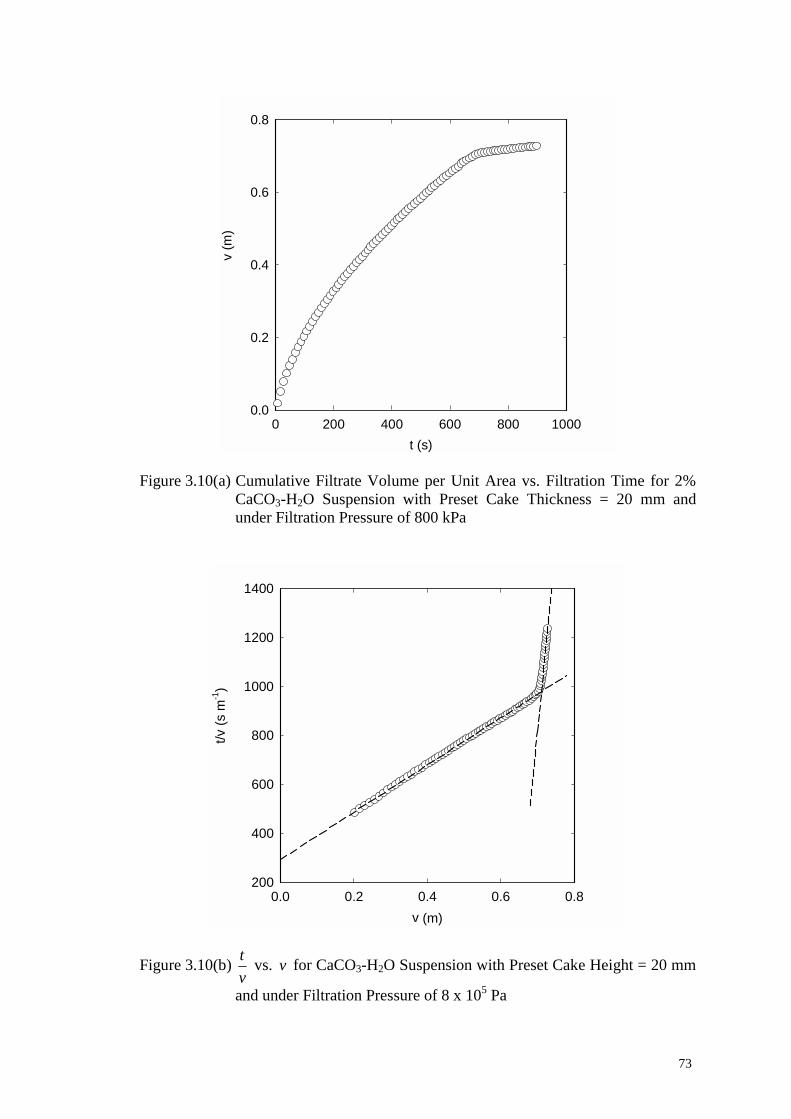
73
t (s)0 200 400 600 800 1000
v (m
)
0.0
0.2
0.4
0.6
0.8
Figure 3.10(a) Cumulative Filtrate Volume per Unit Area vs. Filtration Time for 2%
CaCO3-H2O Suspension with Preset Cake Thickness = 20 mm and under Filtration Pressure of 800 kPa
v (m)0.0 0.2 0.4 0.6 0.8
t/v (s
m-1
)
200
400
600
800
1000
1200
1400
Figure 3.10(b) vt vs. v for CaCO3-H2O Suspension with Preset Cake Height = 20 mm
and under Filtration Pressure of 8 x 10⁵ Pa
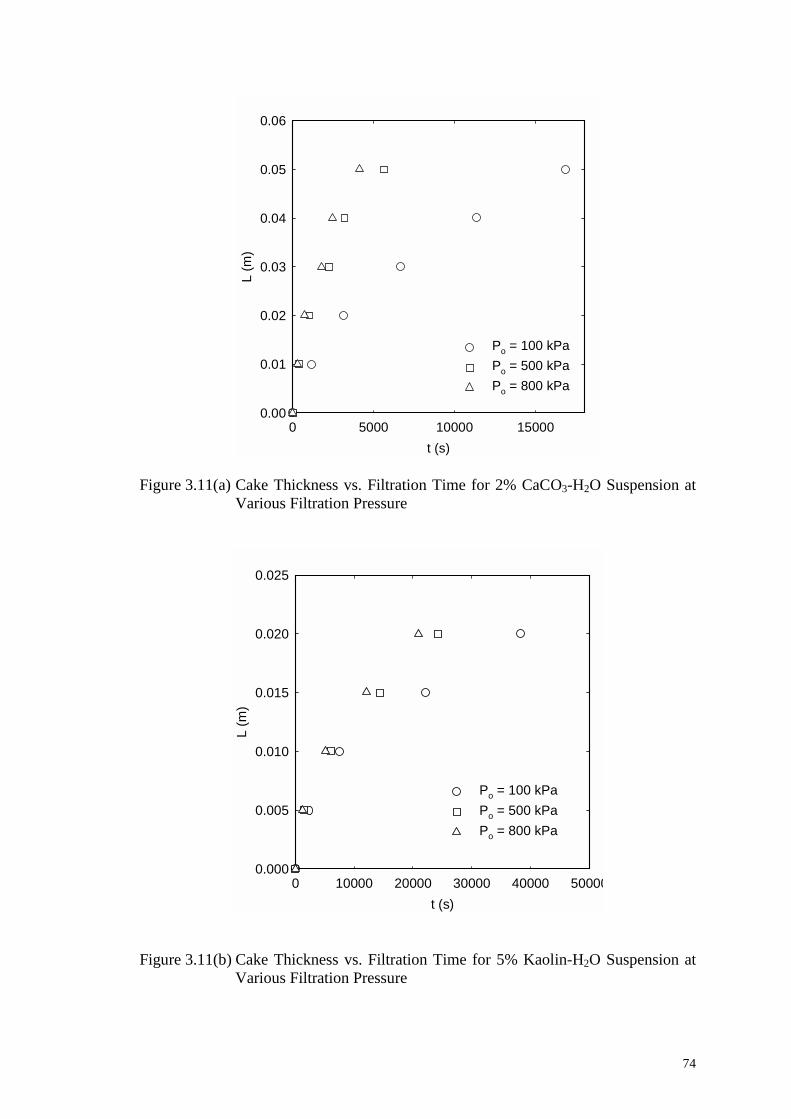
74
t (s)0 5000 10000 15000
L (m
)
0.00
0.01
0.02
0.03
0.04
0.05
0.06
Po = 100 kPaPo = 500 kPaPo = 800 kPa
Figure 3.11(a) Cake Thickness vs. Filtration Time for 2% CaCO3-H2O Suspension at
Various Filtration Pressure
t (s)0 10000 20000 30000 40000 50000
L (m
)
0.000
0.005
0.010
0.015
0.020
0.025
Po = 100 kPa Po = 500 kPa Po = 800 kPa
Figure 3.11(b) Cake Thickness vs. Filtration Time for 5% Kaolin-H2O Suspension at
Various Filtration Pressure
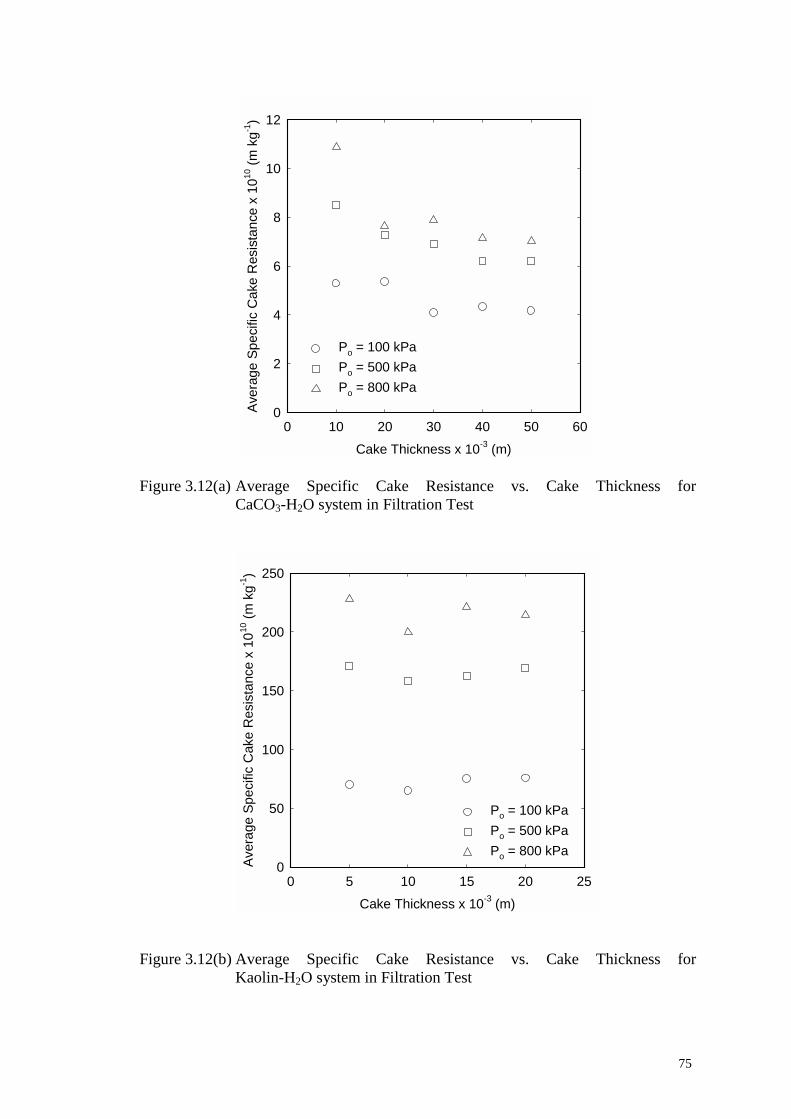
75
Cake Thickness x 10-3 (m)0 10 20 30 40 50 60
Aver
age
Spec
ific
Cak
e R
esis
tanc
e x
1010
(m k
g-1)
0
2
4
6
8
10
12
Po = 100 kPa Po = 500 kPaPo = 800 kPa
Figure 3.12(a) Average Specific Cake Resistance vs. Cake Thickness for
CaCO3-H2O system in Filtration Test
Cake Thickness x 10-3 (m)0 5 10 15 20 25
Aver
age
Spec
ific
Cak
e R
esis
tanc
e x
1010
(m k
g-1)
0
50
100
150
200
250
Po = 100 kPaPo = 500 kPaPo = 800 kPa
Figure 3.12(b) Average Specific Cake Resistance vs. Cake Thickness for
Kaolin-H2O system in Filtration Test
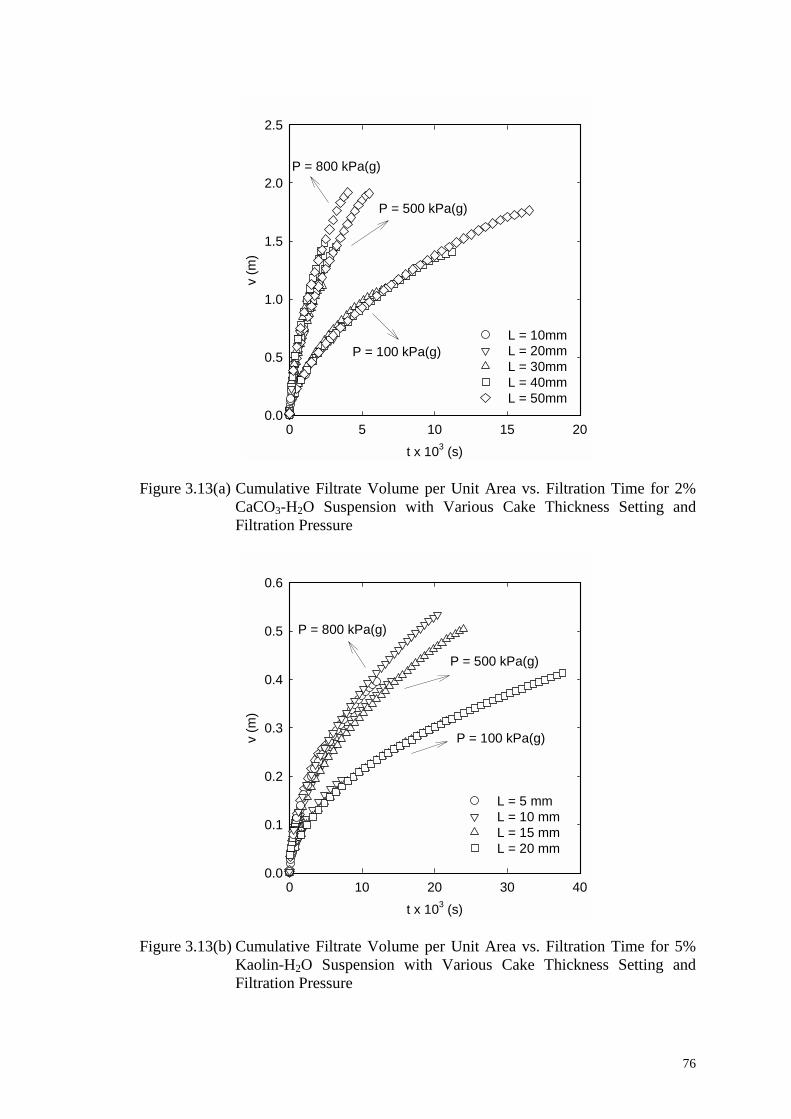
76
t x 103 (s)0 5 10 15 20
v (m
)
0.0
0.5
1.0
1.5
2.0
2.5
L = 10mmL = 20mmL = 30mmL = 40mmL = 50mm
P = 800 kPa(g)
P = 500 kPa(g)
P = 100 kPa(g)
Figure 3.13(a) Cumulative Filtrate Volume per Unit Area vs. Filtration Time for 2%
CaCO3-H2O Suspension with Various Cake Thickness Setting and Filtration Pressure
t x 103 (s)0 10 20 30 40
v (m
)
0.0
0.1
0.2
0.3
0.4
0.5
0.6
L = 5 mmL = 10 mmL = 15 mmL = 20 mm
P = 800 kPa(g)
P = 500 kPa(g)
P = 100 kPa(g)
Figure 3.13(b) Cumulative Filtrate Volume per Unit Area vs. Filtration Time for 5%
Kaolin-H2O Suspension with Various Cake Thickness Setting and Filtration Pressure
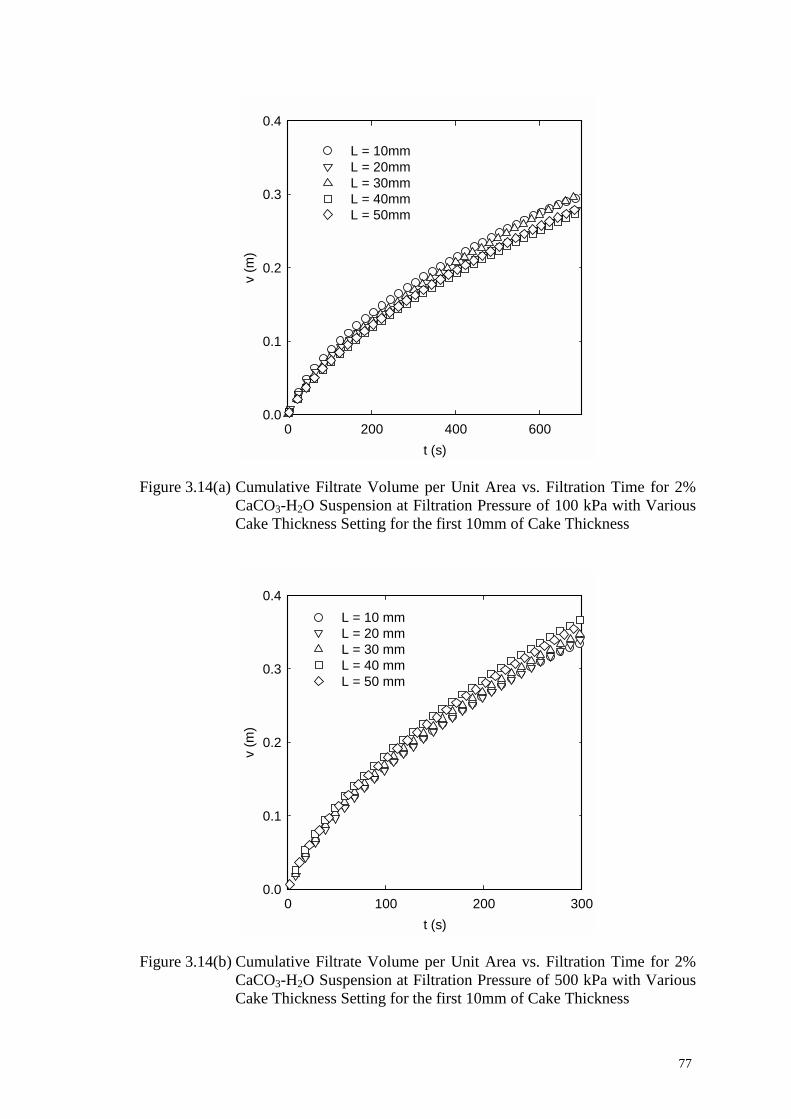
77
t (s)0 200 400 600
v (m
)
0.0
0.1
0.2
0.3
0.4
L = 10mmL = 20mmL = 30mmL = 40mmL = 50mm
Figure 3.14(a) Cumulative Filtrate Volume per Unit Area vs. Filtration Time for 2%
CaCO3-H2O Suspension at Filtration Pressure of 100 kPa with Various Cake Thickness Setting for the first 10mm of Cake Thickness
t (s)0 100 200 300
v (m
)
0.0
0.1
0.2
0.3
0.4L = 10 mmL = 20 mmL = 30 mmL = 40 mmL = 50 mm
Figure 3.14(b) Cumulative Filtrate Volume per Unit Area vs. Filtration Time for 2%
CaCO3-H2O Suspension at Filtration Pressure of 500 kPa with Various Cake Thickness Setting for the first 10mm of Cake Thickness
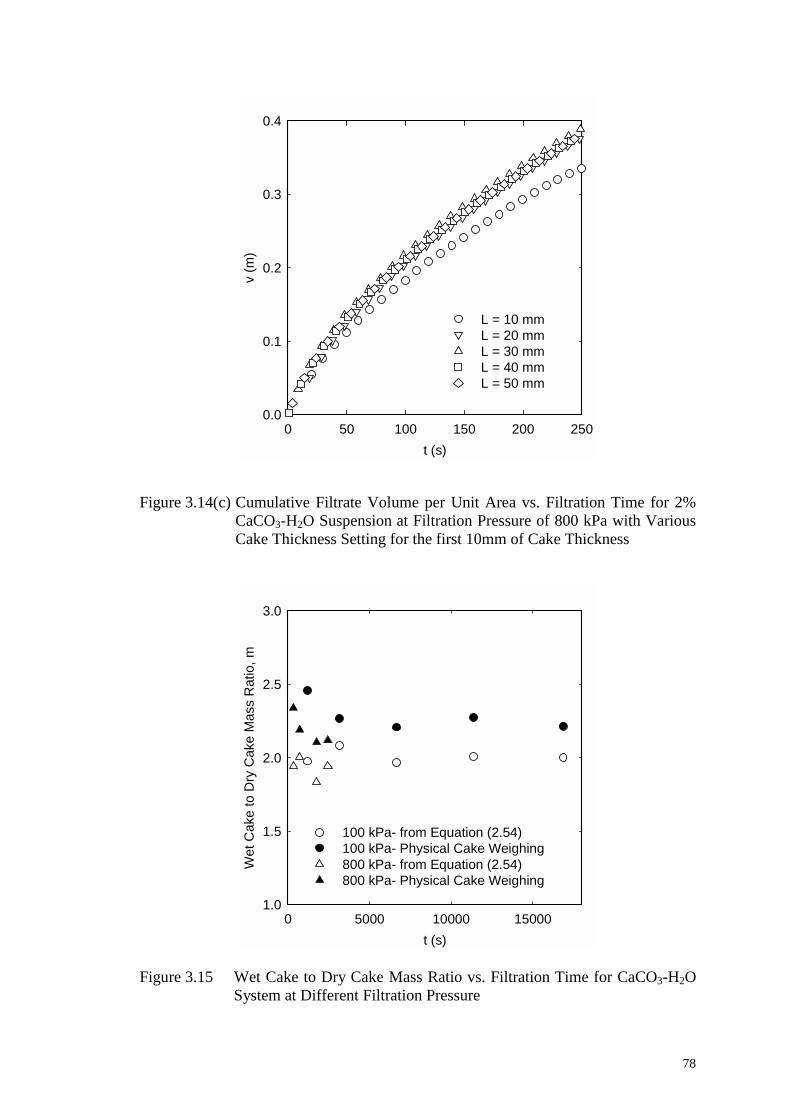
78
t (s)0 50 100 150 200 250
v (m
)
0.0
0.1
0.2
0.3
0.4
L = 10 mmL = 20 mmL = 30 mm L = 40 mmL = 50 mm
Figure 3.14(c) Cumulative Filtrate Volume per Unit Area vs. Filtration Time for 2%
CaCO3-H2O Suspension at Filtration Pressure of 800 kPa with Various Cake Thickness Setting for the first 10mm of Cake Thickness
t (s)0 5000 10000 15000
Wet
Cak
e to
Dry
Cak
e M
ass
Rat
io, m
1.0
1.5
2.0
2.5
3.0
100 kPa- from Equation (2.54) 100 kPa- Physical Cake Weighing 800 kPa- from Equation (2.54) 800 kPa- Physical Cake Weighing
Figure 3.15 Wet Cake to Dry Cake Mass Ratio vs. Filtration Time for CaCO3-H2O
System at Different Filtration Pressure
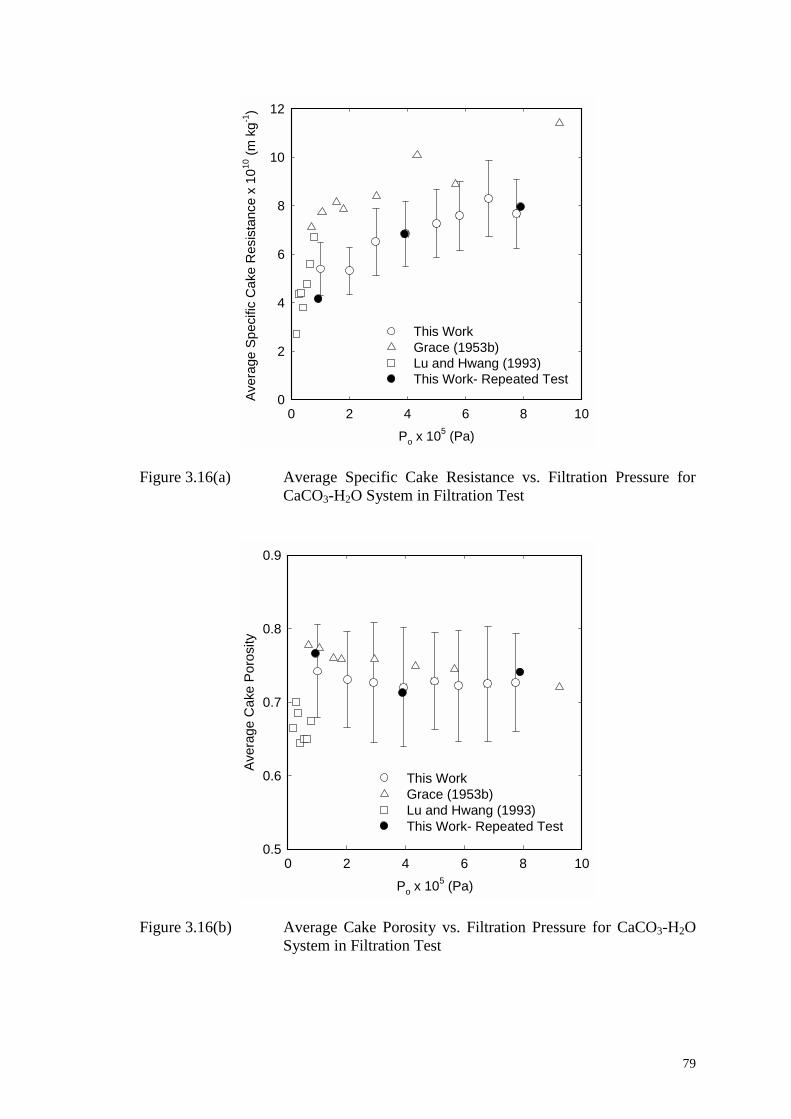
79
Po x 105 (Pa)0 2 4 6 8 10
Aver
age
Spec
ific
Cak
e R
esis
tanc
e x
1010
(m k
g-1)
0
2
4
6
8
10
12
This WorkGrace (1953b) Lu and Hwang (1993)This Work- Repeated Test
Figure 3.16(a) Average Specific Cake Resistance vs. Filtration Pressure for
CaCO3-H2O System in Filtration Test
Po x 105 (Pa)0 2 4 6 8 10
Aver
age
Cak
e Po
rosi
ty
0.5
0.6
0.7
0.8
0.9
This WorkGrace (1953b)Lu and Hwang (1993)This Work- Repeated Test
Figure 3.16(b) Average Cake Porosity vs. Filtration Pressure for CaCO3-H2O
System in Filtration Test
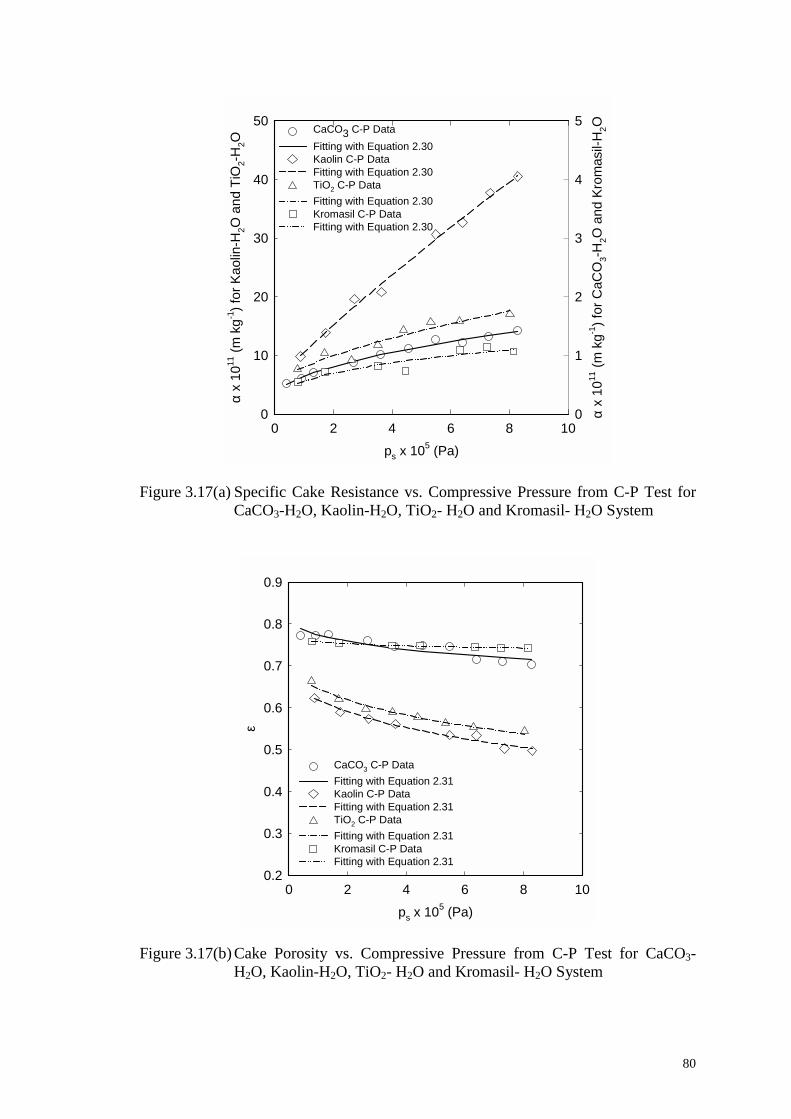
80
ps x 105 (Pa)0 2 4 6 8 10
α x
1011
(m k
g-1) f
or K
aolin
-H2O
and
TiO
2-H
2O
0
10
20
30
40
50
α x
1011
(m k
g-1) f
or C
aCO
3-H
2O a
nd K
rom
asil-
H2O
0
1
2
3
4
5CaCO3 C-P DataFitting with Equation 2.30Kaolin C-P DataFitting with Equation 2.30TiO2 C-P DataFitting with Equation 2.30Kromasil C-P DataFitting with Equation 2.30
Figure 3.17(a) Specific Cake Resistance vs. Compressive Pressure from C-P Test for CaCO3-H2O, Kaolin-H2O, TiO2- H2O and Kromasil- H2O System
ps x 105 (Pa)0 2 4 6 8 10
ε
0.2
0.3
0.4
0.5
0.6
0.7
0.8
0.9
CaCO3 C-P DataFitting with Equation 2.31Kaolin C-P DataFitting with Equation 2.31TiO2 C-P DataFitting with Equation 2.31Kromasil C-P DataFitting with Equation 2.31
Figure 3.17(b) Cake Porosity vs. Compressive Pressure from C-P Test for CaCO3-
H2O, Kaolin-H2O, TiO2- H2O and Kromasil- H2O System
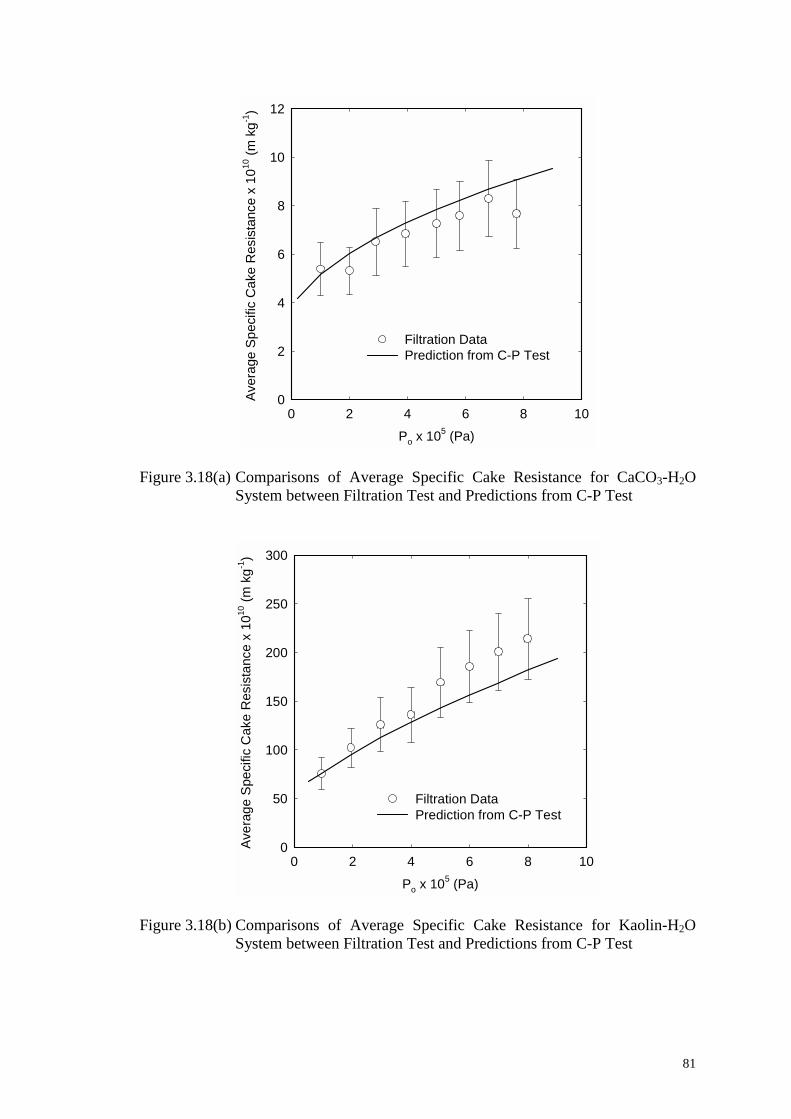
81
Po x 105 (Pa)0 2 4 6 8 10
Aver
age
Spec
ific
Cak
e R
esis
tanc
e x
1010
(m k
g-1)
0
2
4
6
8
10
12
Filtration DataPrediction from C-P Test
Figure 3.18(a) Comparisons of Average Specific Cake Resistance for CaCO3-H2O
System between Filtration Test and Predictions from C-P Test
Po x 105 (Pa)0 2 4 6 8 10
Aver
age
Spec
ific
Cak
e R
esis
tanc
e x
1010
(m k
g-1)
0
50
100
150
200
250
300
Filtration DataPrediction from C-P Test
Figure 3.18(b) Comparisons of Average Specific Cake Resistance for Kaolin-H2O System between Filtration Test and Predictions from C-P Test
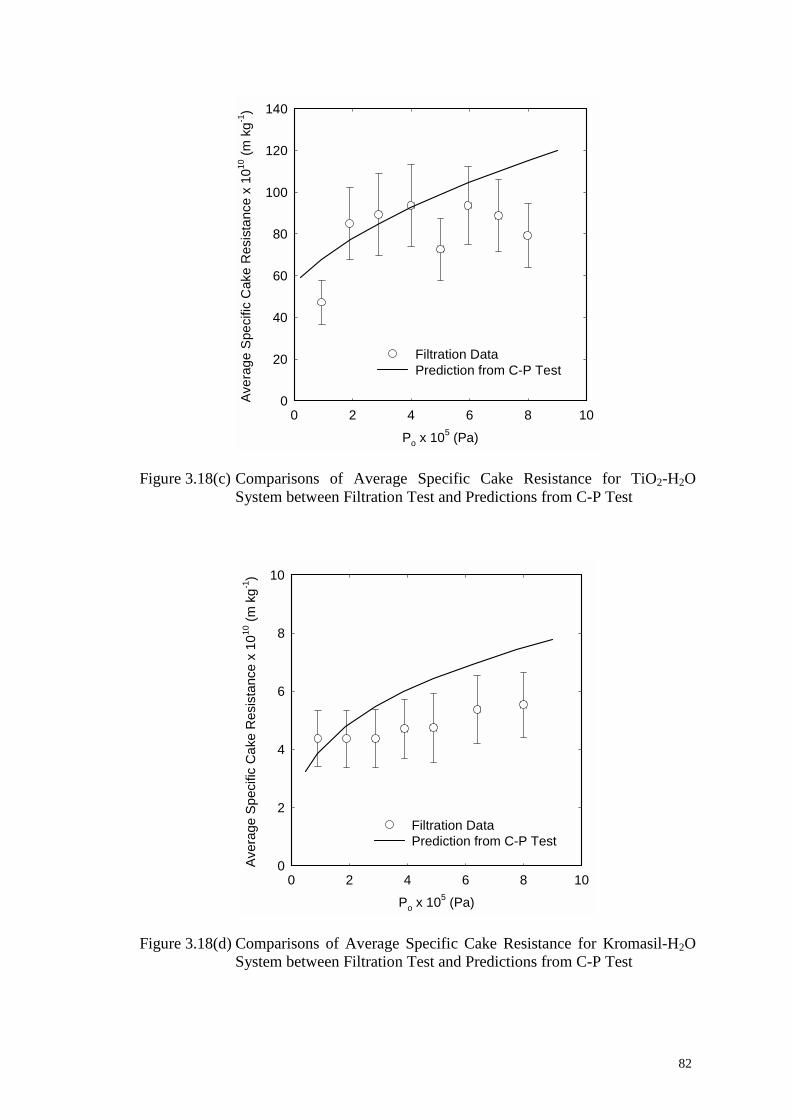
82
Po x 105 (Pa)0 2 4 6 8 10
Aver
age
Spec
ific
Cak
e R
esis
tanc
e x
1010
(m k
g-1)
0
20
40
60
80
100
120
140
Filtration DataPrediction from C-P Test
Figure 3.18(c) Comparisons of Average Specific Cake Resistance for TiO2-H2O
System between Filtration Test and Predictions from C-P Test
Po x 105 (Pa)0 2 4 6 8 10
Aver
age
Spec
ific
Cak
e R
esis
tanc
e x
1010
(m k
g-1)
0
2
4
6
8
10
Filtration DataPrediction from C-P Test
Figure 3.18(d) Comparisons of Average Specific Cake Resistance for Kromasil-H2O
System between Filtration Test and Predictions from C-P Test
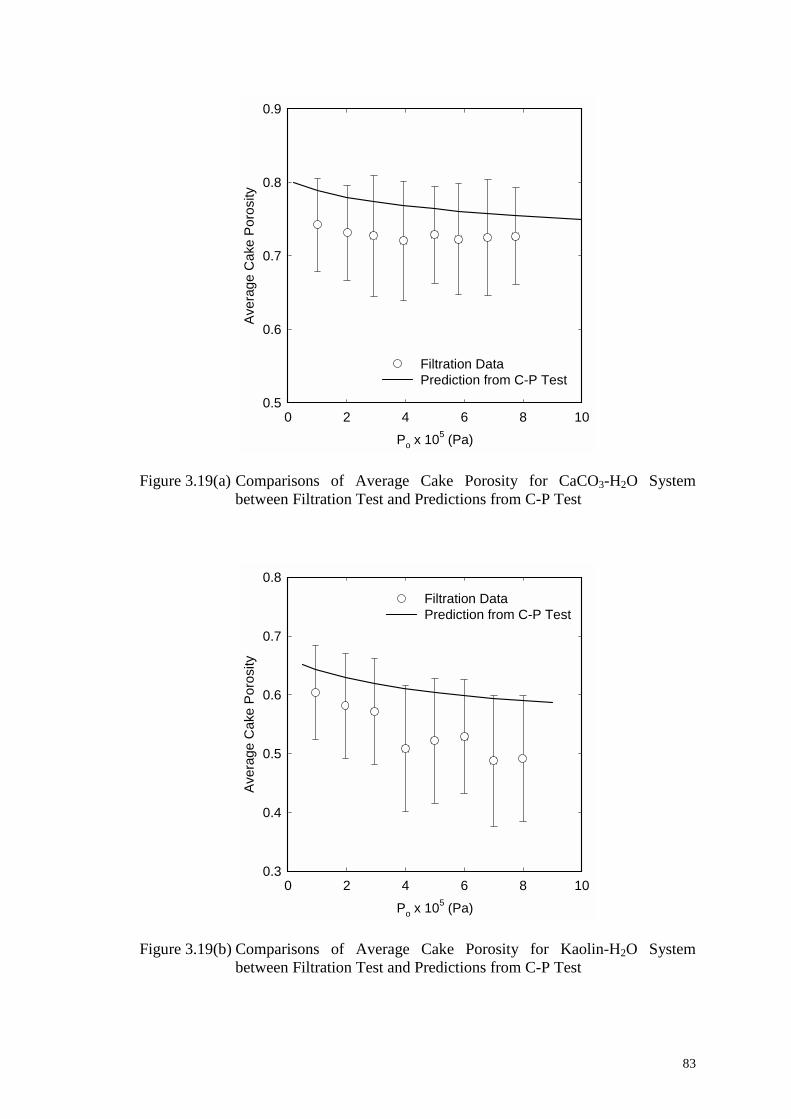
83
Po x 105 (Pa)0 2 4 6 8 10
Aver
age
Cak
e Po
rosi
ty
0.5
0.6
0.7
0.8
0.9
Filtration DataPrediction from C-P Test
Figure 3.19(a) Comparisons of Average Cake Porosity for CaCO3-H2O System
between Filtration Test and Predictions from C-P Test
Po x 105 (Pa)0 2 4 6 8 10
Aver
age
Cak
e Po
rosi
ty
0.3
0.4
0.5
0.6
0.7
0.8Filtration DataPrediction from C-P Test
Figure 3.19(b) Comparisons of Average Cake Porosity for Kaolin-H2O System
between Filtration Test and Predictions from C-P Test
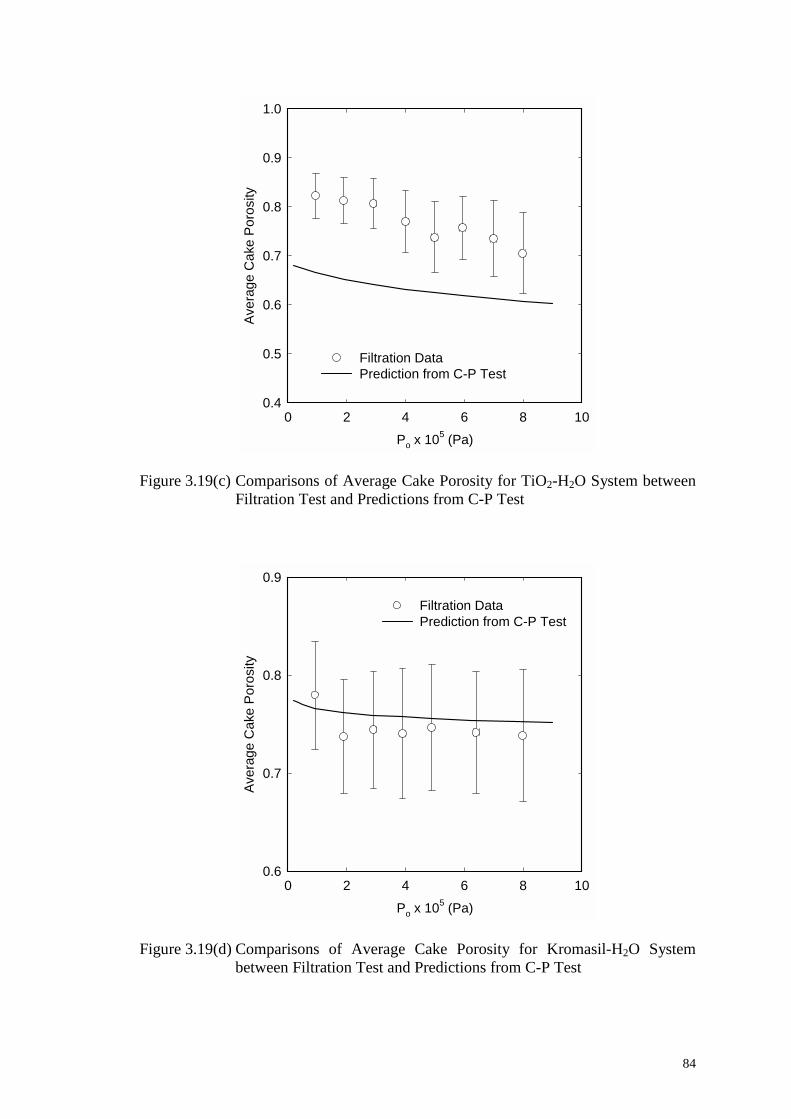
84
Po x 105 (Pa)0 2 4 6 8 10
Aver
age
Cak
e Po
rosi
ty
0.4
0.5
0.6
0.7
0.8
0.9
1.0
Filtration DataPrediction from C-P Test
Figure 3.19(c) Comparisons of Average Cake Porosity for TiO2-H2O System between
Filtration Test and Predictions from C-P Test
Po x 105 (Pa)0 2 4 6 8 10
Aver
age
Cak
e Po
rosi
ty
0.6
0.7
0.8
0.9
Filtration DataPrediction from C-P Test
Figure 3.19(d) Comparisons of Average Cake Porosity for Kromasil-H2O System
between Filtration Test and Predictions from C-P Test
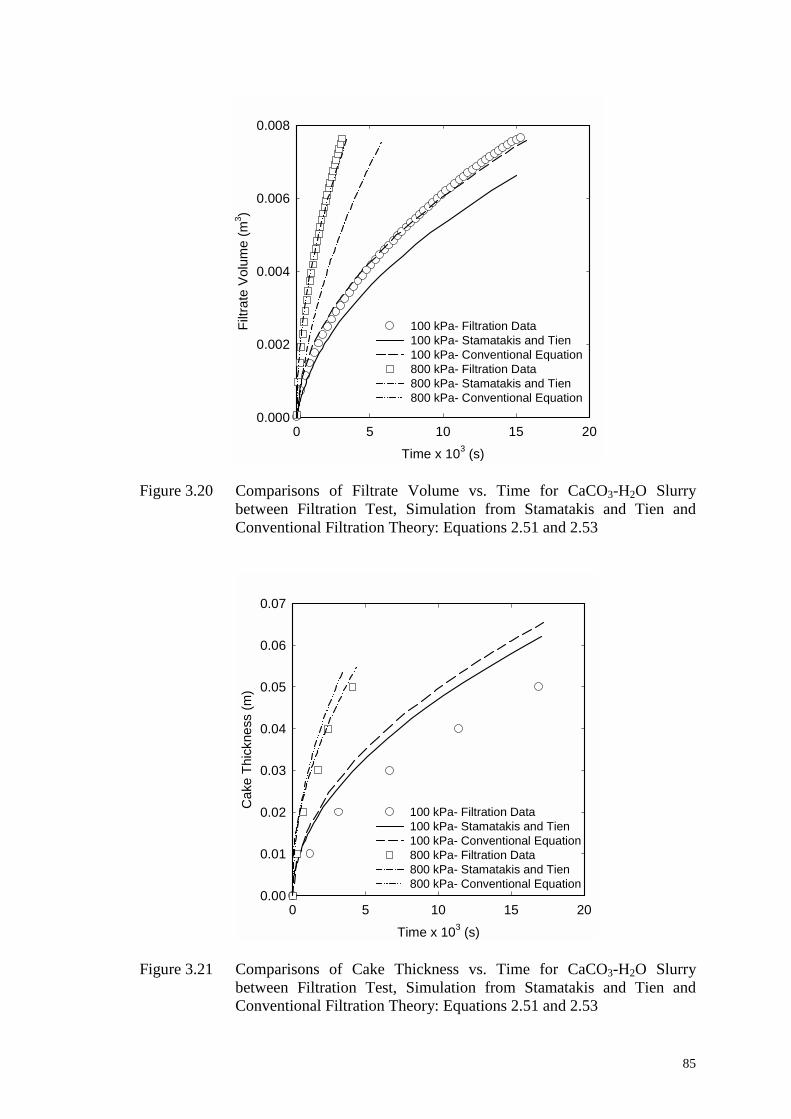
85
Time x 103 (s)0 5 10 15 20
Filtr
ate
Volu
me
(m3 )
0.000
0.002
0.004
0.006
0.008
100 kPa- Filtration Data 100 kPa- Stamatakis and Tien100 kPa- Conventional Equation 800 kPa- Filtration Data 800 kPa- Stamatakis and Tien 800 kPa- Conventional Equation
Figure 3.20 Comparisons of Filtrate Volume vs. Time for CaCO3-H2O Slurry
between Filtration Test, Simulation from Stamatakis and Tien and Conventional Filtration Theory: Equations 2.51 and 2.53
Time x 103 (s)0 5 10 15 20
Cak
e Th
ickn
ess
(m)
0.00
0.01
0.02
0.03
0.04
0.05
0.06
0.07
100 kPa- Filtration Data 100 kPa- Stamatakis and Tien 100 kPa- Conventional Equation800 kPa- Filtration Data 800 kPa- Stamatakis and Tien800 kPa- Conventional Equation
Figure 3.21 Comparisons of Cake Thickness vs. Time for CaCO3-H2O Slurry
between Filtration Test, Simulation from Stamatakis and Tien and Conventional Filtration Theory: Equations 2.51 and 2.53
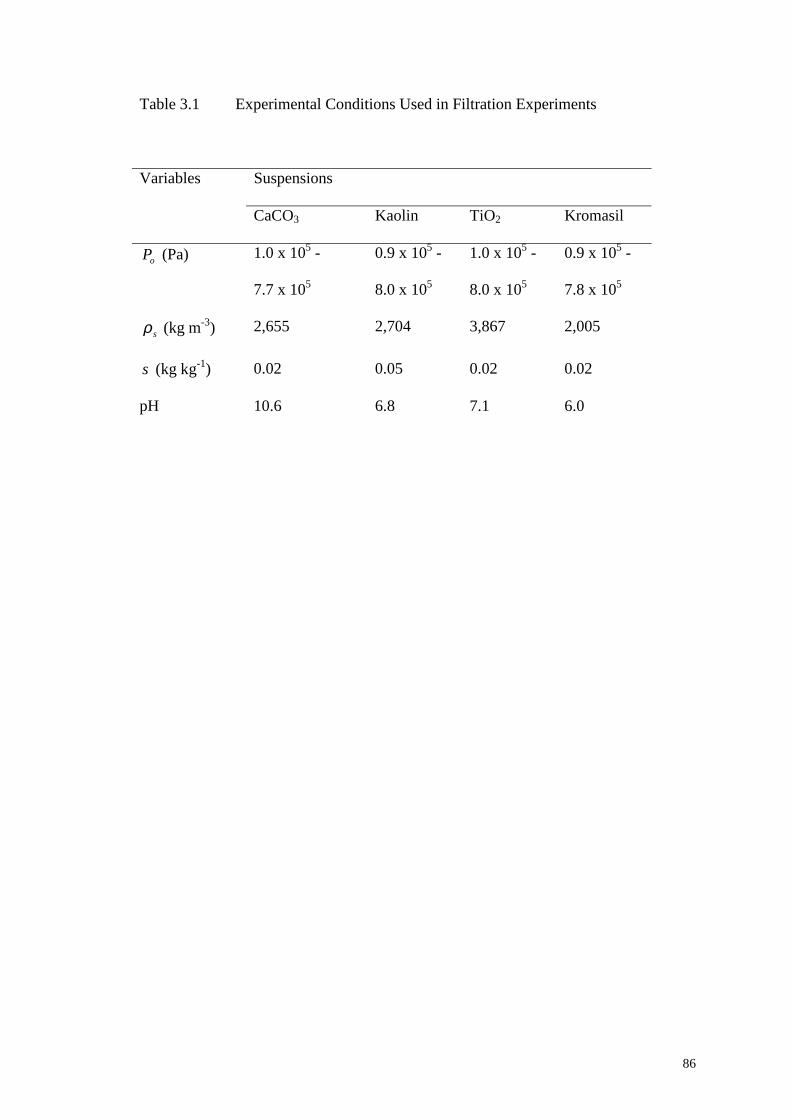
86
Table 3.1 Experimental Conditions Used in Filtration Experiments
Variables Suspensions
CaCO3 Kaolin TiO2 Kromasil
oP (Pa) 1.0 x 10⁵ -
7.7 x 10⁵
0.9 x 10⁵ -
8.0 x 10⁵
1.0 x 10⁵ -
8.0 x 10⁵
0.9 x 10⁵ -
7.8 x 10⁵
sρ (kg m-3) 2,655 2,704 3,867 2,005
s (kg kg-1) 0.02 0.05 0.02 0.02
pH 10.6 6.8 7.1 6.0
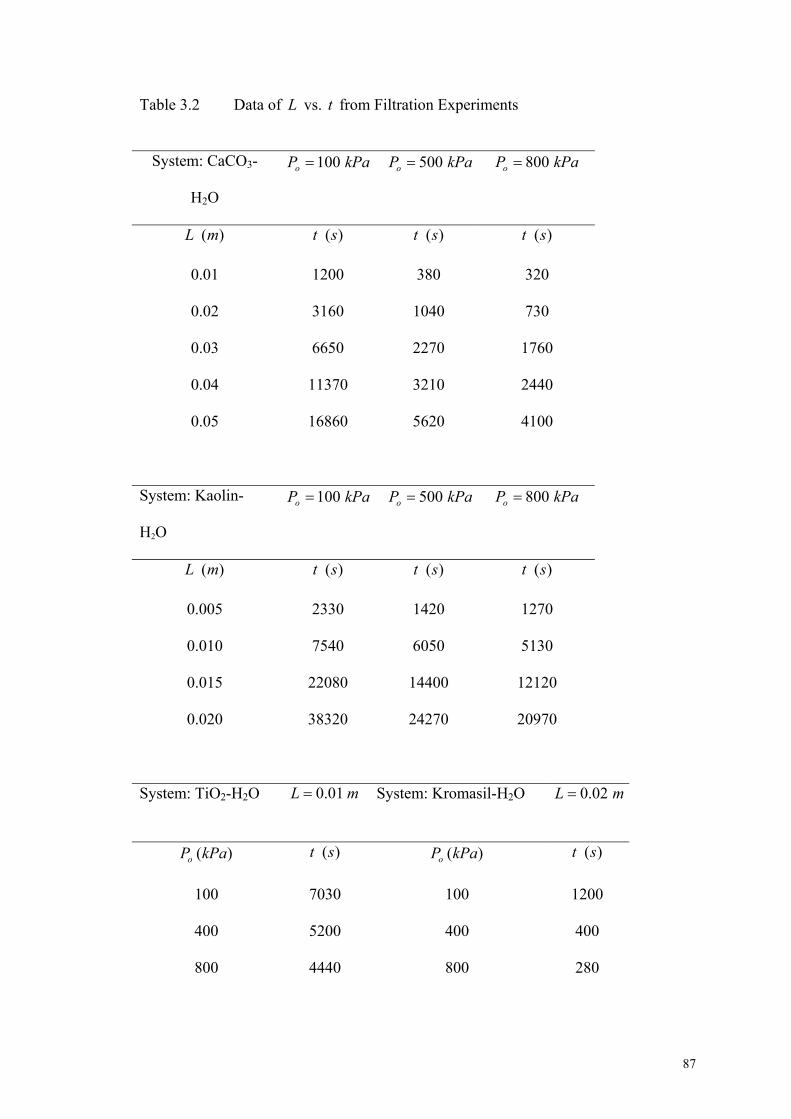
Table 3.2 Data of vs. t from Filtration Experiments L
System: CaCO3-
H2O
kPaPo 100=
kPaPo 500=
kPaPo 800=
)(mL ) ) )(st (st (st
0.01 1200 380 320
0.02 3160 1040 730
0.03 6650 2270 1760
0.04 11370 3210 2440
0.05 16860 5620 4100
System: Kaolin-
H2O
kPaPo 100=
kPaPo 500=
kPaPo 800=
)(mL )(st )(st )(st
0.005 2330 1420 1270
0.010 7540 6050 5130
0.015 22080 14400 12120
0.020 38320 24270 20970
System: TiO2-H2O mL 01.0= System: Kromasil-H2O mL 02.0=
)(kPaPo )(st )(kPaPo )(st
100 7030 100 1200
400 5200 400 400
800 4440 800 280
87
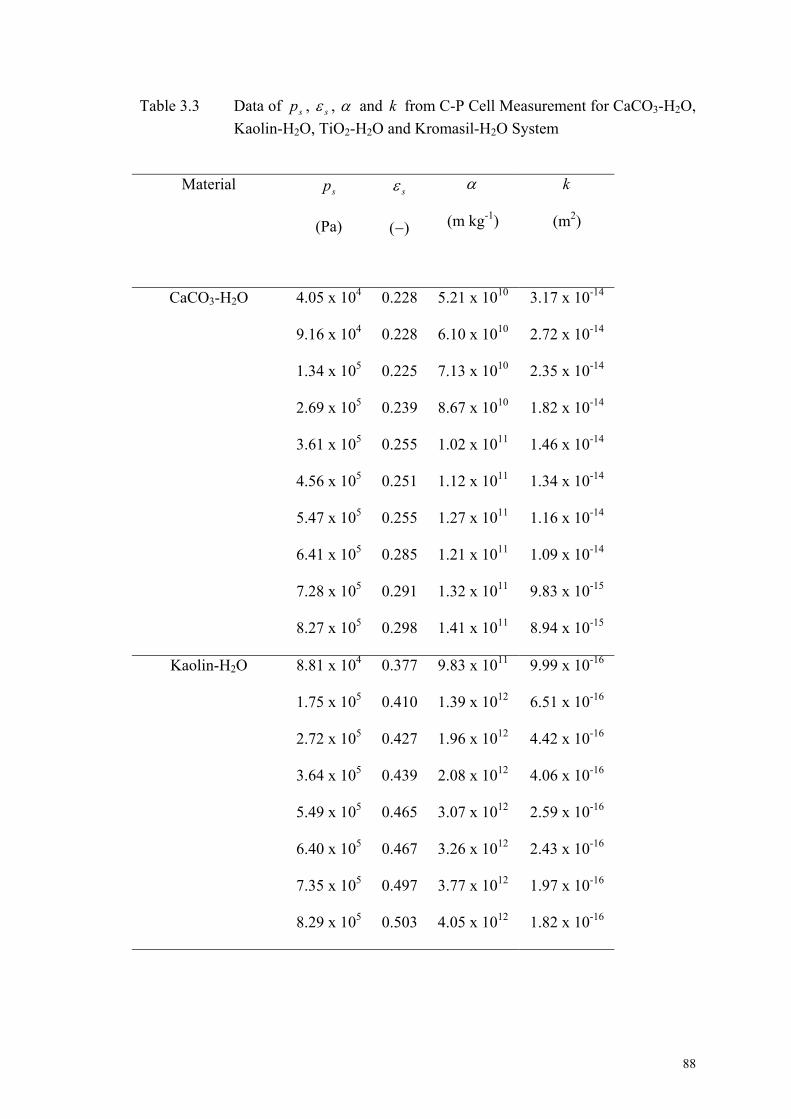
Table 3.3 Data of , sp sε , α and from C-P Cell Measurement for CaCOk 3-H2O, Kaolin-H2O, TiO2-H2O and Kromasil-H2O System
Material sp
(Pa)
sε
(−)
α
(m kg-1)
k
(m2)
CaCO3-H2O 4.05 x 10⁴
0.228
5.21 x 10¹⁰
3.17 x 10⁻¹⁴
9.16 x 10⁴
0.228
6.10 x 10¹⁰
2.72 x 10⁻¹⁴
1.34 x 10⁵
0.225
7.13 x 10¹⁰
2.35 x 10⁻¹⁴
2.69 x 10⁵
0.239
8.67 x 10¹⁰
1.82 x 10⁻¹⁴
3.61 x 10⁵
0.255
1.02 x 10¹¹
1.46 x 10⁻¹⁴
4.56 x 10⁵
0.251
1.12 x 10¹¹
1.34 x 10⁻¹⁴
5.47 x 10⁵
0.255
1.27 x 10¹¹
1.16 x 10⁻¹⁴
6.41 x 10⁵
0.285
1.21 x 10¹¹
1.09 x 10⁻¹⁴
7.28 x 10⁵
0.291
1.32 x 10¹¹
9.83 x 10⁻¹⁵
8.27 x 10⁵
0.298
1.41 x 10¹¹
8.94 x 10⁻¹⁵
Kaolin-H2O 8.81 x 10⁴
0.377
9.83 x 10¹¹
9.99 x 10⁻¹⁶
1.75 x 10⁵
0.410
1.39 x 10¹²
6.51 x 10⁻¹⁶
2.72 x 10⁵
0.427
1.96 x 10¹²
4.42 x 10⁻¹⁶
3.64 x 10⁵
0.439
2.08 x 10¹²
4.06 x 10⁻¹⁶
5.49 x 10⁵
0.465
3.07 x 10¹²
2.59 x 10⁻¹⁶
6.40 x 10⁵
0.467
3.26 x 10¹²
2.43 x 10⁻¹⁶
7.35 x 10⁵
0.497
3.77 x 10¹²
1.97 x 10⁻¹⁶
8.29 x 10⁵
0.503
4.05 x 10¹²
1.82 x 10⁻¹⁶
88
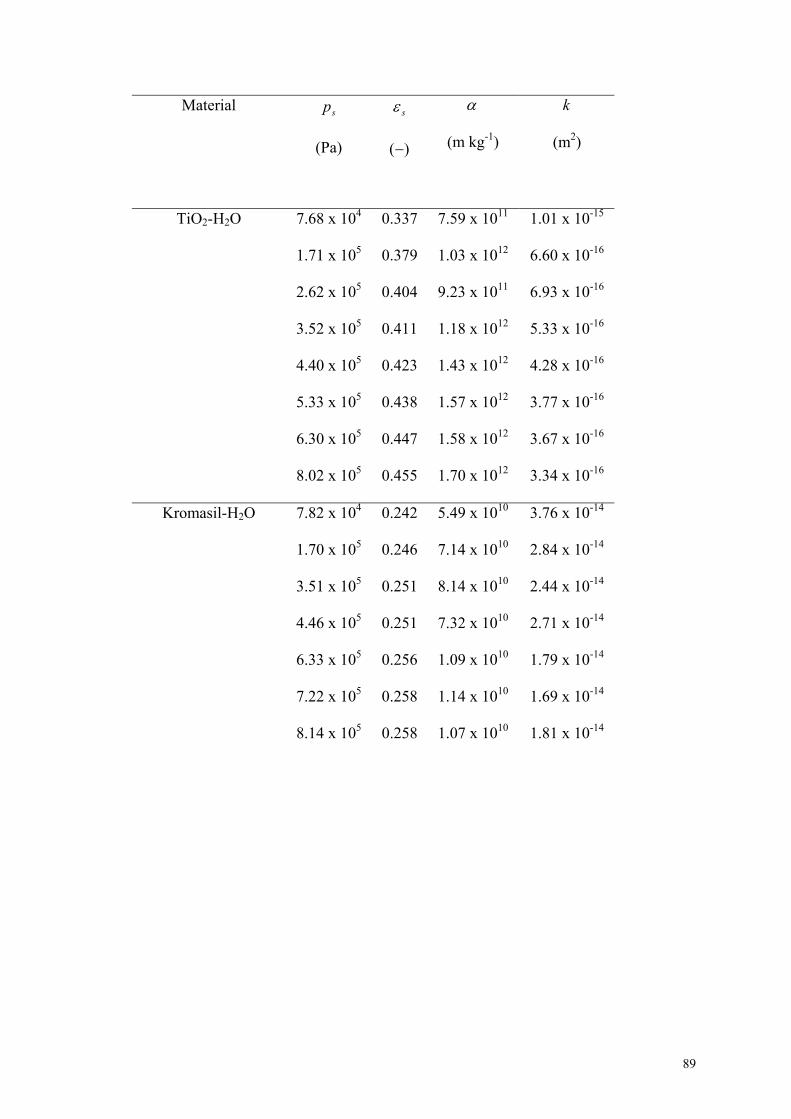
Material sp
(Pa)
sε
(−)
α
(m kg-1)
k
(m2)
TiO2-H2O 7.68 x 10⁴
0.337
7.59 x 10¹¹
1.01 x 10⁻¹⁵
1.71 x 10⁵
0.379
1.03 x 10¹²
6.60 x 10⁻¹⁶
2.62 x 10⁵
0.404
9.23 x 10¹¹
6.93 x 10⁻¹⁶
3.52 x 10⁵
0.411
1.18 x 10¹²
5.33 x 10⁻¹⁶
4.40 x 10⁵
0.423
1.43 x 10¹²
4.28 x 10⁻¹⁶
5.33 x 10⁵
0.438
1.57 x 10¹²
3.77 x 10⁻¹⁶
6.30 x 10⁵
0.447
1.58 x 10¹²
3.67 x 10⁻¹⁶
8.02 x 10⁵
0.455
1.70 x 10¹²
3.34 x 10⁻¹⁶
Kromasil-H2O 7.82 x 10⁴
0.242
5.49 x 10¹⁰
3.76 x 10⁻¹⁴
1.70 x 10⁵
0.246
7.14 x 10¹⁰
2.84 x 10⁻¹⁴
3.51 x 10⁵
0.251
8.14 x 10¹⁰
2.44 x 10⁻¹⁴
4.46 x 10⁵
0.251
7.32 x 10¹⁰
2.71 x 10⁻¹⁴
6.33 x 10⁵
0.256
1.09 x 10¹⁰
1.79 x 10⁻¹⁴
7.22 x 10⁵
0.258
1.14 x 10¹⁰
1.69 x 10⁻¹⁴
8.14 x 10⁵
0.258
1.07 x 10¹⁰
1.81 x 10⁻¹⁴
89
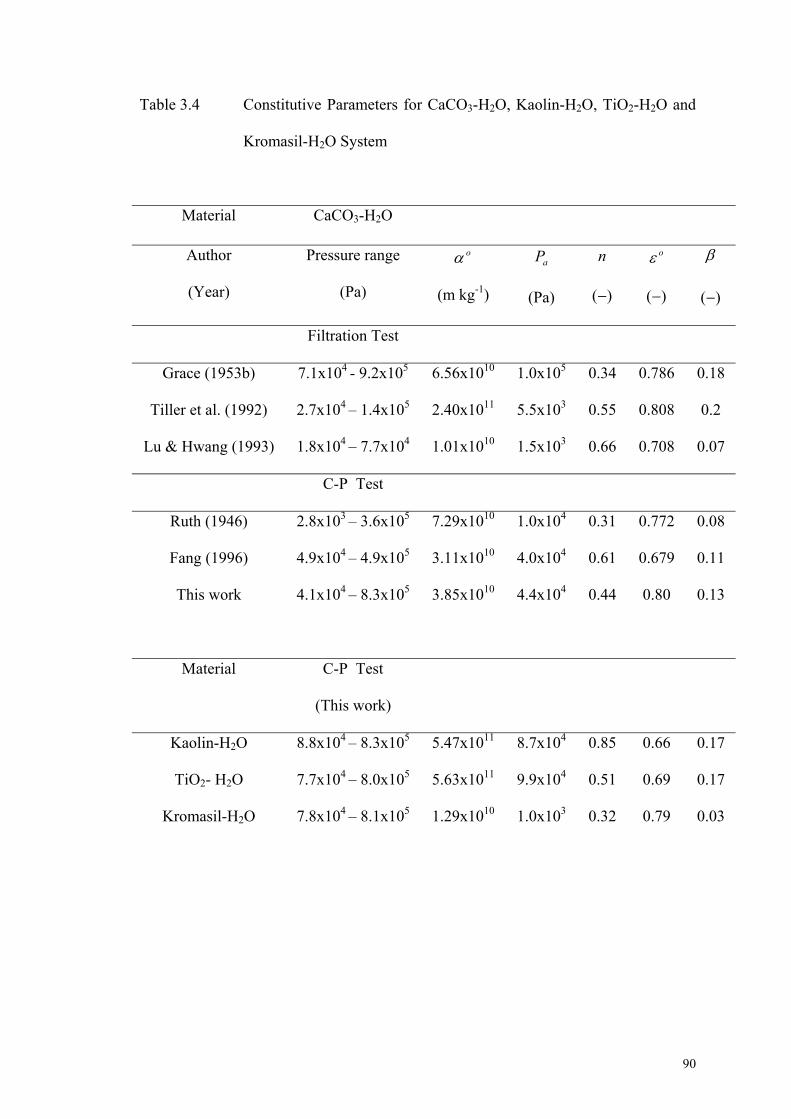
Table 3.4 Constitutive Parameters for CaCO3-H2O, Kaolin-H2O, TiO2-H2O and
Kromasil-H2O System
Material CaCO3-H2O
Author
(Year)
Pressure range
(Pa)
oα
(m kg-1)
aP
(Pa)
n
(−)
oε
(−)
β
(−)
Filtration Test
Grace (1953b) 7.1x10⁴ - 9.2x10⁵ 6.56x10¹⁰ 1.0x10⁵ 0.34 0.786 0.18
Tiller et al. (1992) 2.7x10⁴ – 1.4x10⁵ 2.40x10¹¹ 5.5x10³ 0.55 0.808 0.2
Lu & Hwang (1993) 1.8x10⁴ – 7.7x10⁴ 1.01x10¹⁰ 1.5x10³ 0.66 0.708 0.07
C-P Test
Ruth (1946) 2.8x10³ – 3.6x10⁵ 7.29x10¹⁰ 1.0x10⁴ 0.31 0.772 0.08
Fang (1996) 4.9x10⁴ – 4.9x10⁵ 3.11x10¹⁰ 4.0x10⁴ 0.61 0.679 0.11
This work 4.1x10⁴ – 8.3x10⁵ 3.85x10¹⁰ 4.4x10⁴ 0.44 0.80 0.13
Material C-P Test
(This work)
Kaolin-H2O 8.8x10⁴ – 8.3x10⁵ 5.47x10¹¹ 8.7x10⁴ 0.85 0.66 0.17
TiO2- H2O 7.7x10⁴ – 8.0x10⁵ 5.63x10¹¹ 9.9x10⁴ 0.51 0.69 0.17
Kromasil-H2O 7.8x10⁴ – 8.1x10⁵ 1.29x10¹⁰ 1.0x10³ 0.32 0.79 0.03
90
91
CHAPTER 4
EFFECT OF THE RELATIONSHIP BETWEEN PORE
LIQUID PRESSURE AND CAKE COMPRESSIVE
STRESS ON CAKE FILTRATION ANALYSIS
4.1 Introduction
In cake filtration operations, liquid-solid suspensions flow through media,
which allow the passage of the suspending liquid but retain particles at the upstream
side of the media. In most cases, filter cakes exhibit compressive behavior, namely,
they become more compact as the cake compressive stress increases. On the other
hand, liquid flow rate through filter cakes depends upon liquid pressure gradient in
addition to other variables. Analysis of cake filtration therefore requires the knowledge
between the liquid pressure within the cake and the cake compressive stress. This
information is also needed in applying cake properties obtained from the C-P cell
measurements for the prediction of cake filtration performance.
The relationship between pore liquid pressure )( lp and cake compressive stress
)( sp , which is required in analyzing cake filtration is commonly assumed as (for the
one-dimensional case):
0=+ sl dpdp [from Equation (2.16)] , (4.1)
although similar but different ones may also be advanced from the multiphase flow
theory depending upon the definition chosen as pointed out by Rietema (1982) [from
Equations (2.17) to (2.19)], i.e.
0=+ sl dpdpε (4.2)
92
0)1( =+− ssls dpdp εε (4.3)
[ ] 0][)1( =+− ssls pdpd εε (4.4)
Equation (4.1) has been widely used in filtration analysis for the last three
decades. According to this relationship, the sum of lp and sp is constant across a
cake. However, this assumption does not necessarily hold for Equations (4.2) to (4.4).
A natural question arising from this multiplicity of the relationship is its effect on the
analysis and prediction of cake filtration. One may ask which one of the expressions
should be used in applying C-P cell results to filtration calculations? Such a question
was raised a quarter of a century ago (Willis et al., 1974). It is somewhat a surprise
that this line of inquiry has not been further pursued since. The purpose of the present
work is to investigate which one of the above definitions is more consistent with the
compression load used in forming cakes in the C-P measurements by examining the
correspondence between cake filtration data and the C-P cell measurements of a few
material systems. To carry out this investigation, the conventional filtration equation
will first be re-derived in a manner so that the effect of the lp – sp relationship is
manifested explicitly.
4.2 Explicit Expressions of lp
The expressions of lp as a function of sp for the one-dimensional case which
is commonly encountered in cake filtration will be first derived. A schematic
representation is given in Fig. 4.1. The x -coordinate starts from the medium surface
( 0=x ), )(tLx = corresponds to the cake suspension interface, and L is the cake
thickness. The suspension is at a pressure of oP and the pressure at the downstream
93
side of the medium is assumed to be zero. Therefore, the total pressure drop is oP . If
the pressure drop across the cake and medium are mp∆ and cp∆ respectively, one has
[from Equation (2.35a)],
omc Ppp =∆+∆ (4.5)
At the cake suspension interface, the cake is free of compression and
0=sp at )(tLx = (4.6)
sp reaches a maximum at the cake-media interface, or
sms pp = at 0=x (4.7)
From Equation (4.1), (4.2), (4.3), (4.4), (4.6) and (4.7), lp is found to be:
Case (1): 0=+ ls dpdp [i.e. Equation (4.1)]
sol pPp −= (4.8a)
antinsignificispifPpPp momosm∆=∆−= (4.8b)
Case (2): 0=+ ls dpdp ε [i.e. Equation (4.2)]
∫ −−=
sp
s
sol
dpPp0 1 ε
(4.9a)
antinsignificispifPpPdpmomo
p
s
sms
∆≅∆−=−∫
0 1 ε (4.9b)
Case (3): 0)1( =+− ssls dpdp εε [i.e. Equation (4.3)]
94
s
p
s
sol dpPp
s
∫ −−=
0 1 εε (4.10a)
antinsignificispifPpPdp momoss
sp
o
ms
∆≅∆−=−∫ εε
1 (4.10b)
Case (4): [ ] 0][)1( =+− ssls pdpd εε [i.e. Equation (4.4)]
ss
so
s
os
l pPpε
εεε
−−
−−=
111 (4.11a)
antinsignificispifPpPp mos
os
ms
s
os
os
smm
m
m
m∆−≅∆
−−−=
εε
ε
ε
εε 111 (4.11b)
where osε is the cake solidosity at zero stress state and
msε is the value of sε at
mss pp = . From these expressions, with the knowledge of sε vs. sp (i.e. the
constitutive equation), the relationship of lp vs. sp across a cake can be readily
determined.
4.3 Re-derivation of the Parabolic Law for Constant-Pressure
Filtration
In principle, the conventional cake filtration theory is based on the following
assumptions:
(1) The solid (particle) velocity is negligible (for dilute slurry).
(2) The moving boundary effect of the suspension-cake interface can be ignored.
(3) Darcy’s Law can be used to estimate liquid flow rate.
(4) The relevant cake properties, i.e. the solidosity and permeability are functions
of the compressive stress only.
95
The mass continuity equations of the liquid and solid phases are
)(tx
ql
∂∂=
∂∂ ε (4.12a)
)(tx
q ss
∂∂=
∂∂ ε (4.12b)
where lq and sq denote the liquid and solid superficial velocities. ε is the cake
porosity and equals to sε−1 .
The sum of the above two expressions gives
0)( =+∂∂=
∂∂+
∂∂
ssl
txq
xq εε
and
mlsl qqq )(=+ = constant (4.13)
where mlq )( is the liquid permeation velocity through the medium.
With assumption (1), lq is constant across the cake at any instant and equal to the rate
of permeation (i.e. filtration rate). If v is the cumulative volume of filtrate per unit
medium area, on account of assumption (1) and from Equation (2.1), one has
xpk
dtdvq l
l ∂∂==
µ (4.14)
The above expression may be rearranged to give
lssss dpkdxdtdv )()( ερερµ = (4.15)
96
Integrating the above equation over the entire cake thickness and noting that
dtdv is
constant across the cake and sε and k being functions of sp only, one has
s
p
ss
L
ss dpfkdxdtdv ms
∫∫ −=0
'
0
))(( ρεερµ (4.16)
where
s
l
dpdpf =' (4.17)
and sρ is the particle density.
The first integral of Equation (4.16) gives the mass of cake solid per unit medium area,
w . By definition, from Equation (2.4) and (2.55),
smsvdxw
L
ss −== ∫ 10
ρερ (4.18)
where s is the particle mass fraction of the suspension and m is the overall mass ratio
of wet cake to dry cake, which from Equations (2.36) and (2.54), can be expressed as
dx
dxm
ss
L
o
so
L
ρε
ρε
∫
∫ −+=
)1(1 (4.19)
Substituting Equations (4.18) into (4.16), one has
s
p
ss dpfksvsm
dtdv ms
∫ −−=0
' ))((1 ρερµ
(4.20)
For flow of liquid through the medium, from Equation (2.39), one has
97
m
m
Rp
dtdv
µ∆= (4.21)
where mR is the medium resistance.
Combining Equations (4.20) and (4.21) and using the relations of Equation (4.5), one
has
mco ppP ∆+∆=
dtdvR
dpfk
psm
sdtdvv m
s
p
ss
c
msµ
ρε
µρ +
−
∆−
=
∫0
' ))((1
(4.22)
An average specific cake resistance, avα is defined over compressive stress ranging
from 0 to msp to be
m
ms
m
ms
ssss
p
o
scpav
pdpfk
pp
/])')(([
]/[][
−
∆=
∫ ρεα (4.23)
Equation (4.23) shows that the relationship between lp and sp is essential when the
results obtained from C-P cell measurement are applied to predict the cake filtration
behavior.
With mspav ][α defined in Equation (4.23), Equation (4.22) may be rewritten as:
dtdvR
sms
dtdvvP mpavo ms
µαµρ +−
= ][
]1[ (4.24)
98
Further integration with time under the conditions of oP = constant and assuming mR =
constant gives:
vRdvvsmstP mpav
tv
o msµαρµ +
−= ∫ ][
]1[
)(
0
vRvsm
sm
pav ms µαρµ +
−= 2
1
][
2 (4.25)
where
−=
− ∫)(
02 ]1[
][21
][ tvpavpav dvvsmvsm
msmsαα
(4.26)
It should be noted that as m and avα correspond to the average values of the mass
ratio of wet to dry cakes and the specific cake resistance respectively, thus,
− smmspav
1
][αis the average of a quantity, which, in turn, is composed of average
quantities according to Equations (4.19) and (4.23). Approximately, one may assume
that
)1(
][
1
][
smsmmsms pavpav
−≅
−
αα (4.27)
with the values of the right hand side evaluated according to the final cake thickness.
With this approximation, Equation (4.25) becomes:
vRvsm
stP mpav
oms µ
αρµ +−
=2)1(
][ 2
(4.28)
99
If the commonly-used equation, 0=+ sl dpdp is employed to the relationship between
pore liquid pressure and cake compressive stress ( 1' −=f ) in this instant, and with
negligible medium resistance, then os Ppm
≅ and Equation (4.25) becomes
2
)1(2
][v
sm
stP oPav
o−
=αρµ
(4.29)
On top of that, Equation (4.23) becomes
[ ]∫∫
==ooo P
s
oP
sss
oPav
dp
P
dpk
P
00
)1()(α
ρεα (4.30)
For an incompressible cake, cssm ρ=−1 and
mspav ][α are essentially constant. With
the assumption that os Ppm
= where cp∆ >> mp∆ , from Equation (4.28), one has:
vRvsm
stP m
pavo
ms µαρµ
+−
= 2
)1(2
][
= vRvc
mPav o µ
αµ+2
2][
(4.31)
Equation (4.31) gives the parabolic relationship between filtrate volume and
time. A linear plot of vt versus v can be expected from which the average specific
cake resistance corresponding to a compressive stress equal to the total pressure drop
can be determined. Thus, Equations (4.30) and (4.31) constitute the so-called parabolic
law of constant pressure filtration according to the conventional cake filtration theory.
100
The simple derivation given above shows that there exists a general expression
between v and t irrespective of the relationship between lp and sp . On the other
hand, Equation (4.23) also reveals that the relationship between lp and sp is required
if the results obtained from the C-P cell measurements are to be applied for predicting
the cake filtration characteristics. Hence, the sl pp − relationship is essential to the
development of the constitutive relationship from C-P experimental results. This latter
point will be discussed in section 4.5.
4.4. Experiments
The experimental results used in examining the effect of the relationship
between lp and sp are filtration data ( v vs. t ) and C-P cell data ( sε vs. sp and α vs.
sp ). These data were obtained using the new multifunction test cell as described in
Chapter 3. The suspensions used in this study were: CaCO3-H2O, Kaolin-H2O, TiO2-
H2O and Kromasil-H2O systems. The test suspensions were prepared by using de-
ionized water. The conditions under which the experiments conducted were listed in
Table 3.1 in Chapter 3.
4.5 Results and Discussions
4.5.1 C-P Cell and Filtration Results
As mentioned in Section 3.2.1, in C-P cell measurements, uniformly packed
cakes were formed under specified load. The solidosity of the cake was calculated
from the amount of the solid particles used to form the cake and the cake thickness.
The cake permeability was then determined by carrying out the classical flow rate-
101
pressure drop measurements. The results of ])([ 1−= ss k ερα vs. sp and sεε −=1 vs.
sp for the four cake systems in study are shown in Fig. 3.17(a)-(b). These results were
fitted with the power-law equation as outlined in Section 3.4.5. The respective values
of the fitting parameters are given in Table 3.4 and the degree of fitting can be seen
from Fig. 3.17(a)-(b). The filtration experiments were conducted under the condition
of constant pressure. The results of average specific cake resistance and average cake
porosity of the systems in study were obtained as mentioned in Section 3.2.2.
4.5.2 Assessing the Effect of the sl pp − Relationships
In the following assessment, mR is assumed to be constant throughout the
filtration process and mp∆ is negligible ( mp∆ is much smaller than cp∆ ). In other
words, avα can be considered to be constant. Once the information of sε vs. sp is
known from C-P test, the relationship between lp and sp and the maximum value of
msp ( sp at the cake-medium interface) can be readily determined from the various
equations given before [i.e. Equations (4.8a) – (4.11b)]. The results are shown in Figs.
4.2(a) - 4.2(d) and 4.3(a) - 4.3(d). In Fig. 4.2, the relationships of lp vs. sp for oP
equal to 2 x 10⁵ Pa and 7 x 10⁵ Pa of the cake systems are shown and Fig. 4.3 gives the
results of msp vs. oP . It is clear that the numerical values of
msp can be either greater or
less than the pressure drop across the cake, depending upon the sl pp − relationship
used.
102
4.5.3 Correspondence between the Specific Cake Resistance
determined from Filtration Data and C-P-cell Measurement
Results
As a general expression relating v and t , Equation (4.28) can be used to
determine ][ avα from filtration experimental data following the conventional
procedure based on the vt vs. v plot. On the other hand, if the constitutive
relationships of sε vs. sp and α vs. sp are known, ][ avα can be estimated according to
Equation (4.23). By comparing these values of average specific cake resistance, the
more appropriate relationship between sl pp − , applicable to cake filtration analysis
may be identified.
Such comparisons are shown in Figs. 4.4 for each of the materials in this study.
It is clear that for the same constitutive relationship, the calculated average specific
cake resistance varies depending upon the sl pp − relationship (i.e. 'f ) used. From
Fig. 4.4(a), 4.4(c) and 4.4(d), ][ avα obtained from constant-pressure filtration data
within experimental errors for CaCO3, TiO2 and Kromasil cakes were found to be
lower than that calculated with sl pp − relationship of Case 1, but more agreeable to
that of Case 2. Using different types of material systems, Willis et al. (1974) observed
that the ratio of cumulative drag stress to cake pressure drop correlates very well with
cake porosity, which is similar to Case 2 in this study. Physically, this can be explained
by the fact that the interfacial momentum transport is proportional to the liquid
pressure drop as well as the cake porosity. Porosity is involved in this case on the basis
103
that it is somehow a way of interpreting the extent and influence of fluid-solid
interface for flow of liquid through porous media.
On the other hand, for Kaolin cake in Figure 4.4(b), the best agreement was
found if the sl pp − relationship is of Case 3 or Case 1. The trend of filtration data is
higher than that resulted from sl pp − relationship of Case 1 at greater filtration
pressure. Similar results on Korean Kaolin have been shown by Shirato et al. (1968)
where the trend of filtration data is higher than the C-P data with sidewall friction
corrected and employing the sl pp − relationship of Case 1. This could be due to the
higher compressibility of Kaolin compared to the other three materials as indicated by
its higher n value, i.e. 0.85 versus 0.32 - 0.51 (Table 3.4). In this case, the interfacial
momentum transport is proportional to the hydraulic pressure drop, as well as the ratio
of cake porosity to cake solidosity.
In Case 1 or Equation (4.1), the cumulative compressive stress equals to the
cake pressure drop alone was derived based on the assumption that the momentum
change is negligible (Tiller et al., 1972). Judging from Figure 4.4(a) to (d) as a whole,
it is still able to correlate the C-P test data to that of filtration test data. However, if one
considers that the cake compressive stress originates from the drag forces exerted on
individual particles constituting a cake due to the relative motion between the cake
solid and pore liquid, the cake structure (or porosity) is likely to play a role in the
magnitude of sp .
104
4.5.4 Correlation of sl pp − Relationship with Cake Characteristics
From Equation (4.17), the gradient of pore liquid pressure to solid compressive
stress is written as 'fdpdp
s
l = and from the different cases of sl pp − relationship,
'f is found to be:
Case (1) 1' =− f (4.32a)
Case (2) s
fε−
=−1
1' (4.32b)
Case (3) s
sfε
ε−
=−1
' (4.32c)
Case (4) ooso
s
s
sa
os
s
s PP
f )1()1(1
1
2' ε
εε
εβε
εε β
β
−
−−
−=−
−
(4.32d)
Thus, 'f is independent of sε for the commonly-used Case 1. For Cases 2 and
3, 'f is a function of sε only while for Case 4, 'f is also dependent upon the
operating pressure, oP as well as the parameters of the constitutive relationship (i.e.
β , aP and osε ).
From Figure 3.16(b), sε in general does not change greatly and as an
approximation, it can be assumed that oss εε = . Using the values of constitutive
parameters given in Table 3.4, the respective results of 'f for the four cases are shown
in Table 4.1. The results of Figures 4.4(a)-(d) show that the placement of the four
curves (corresponding to the four cases) upward is in the order of Case 2, Case 1, Case
3 and Case 4 or in the descending order of 'f .
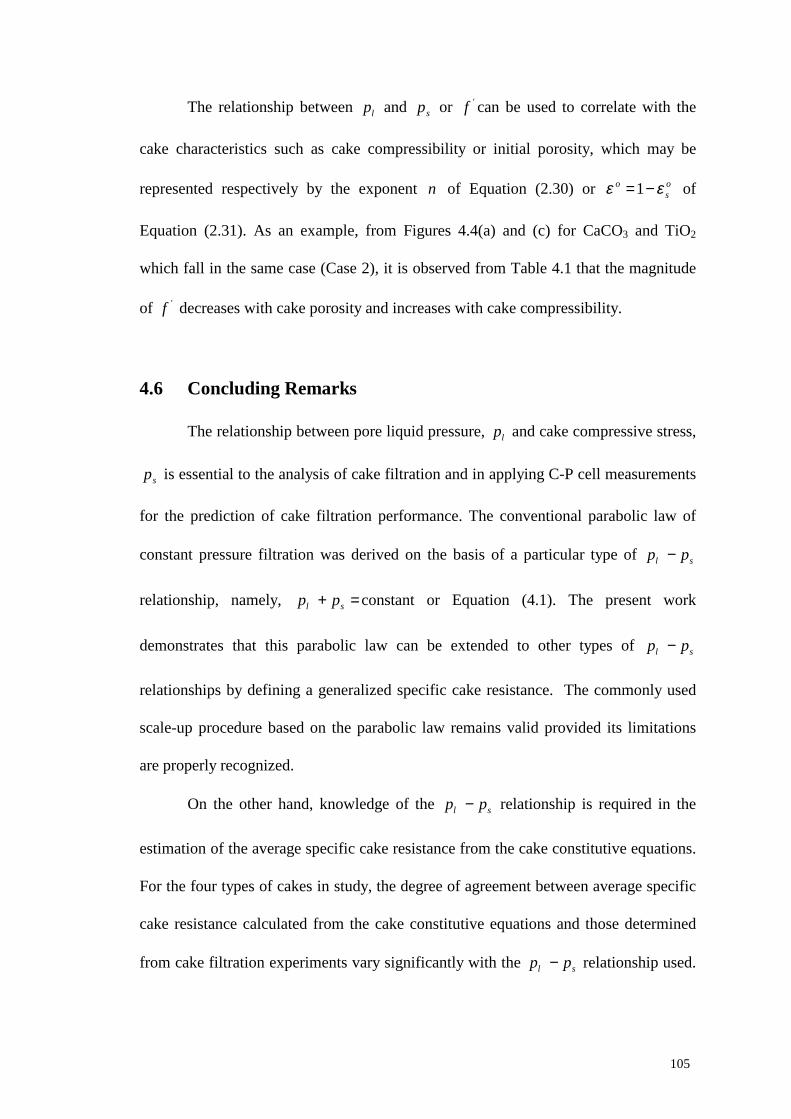
105
The relationship between lp and sp or 'f can be used to correlate with the
cake characteristics such as cake compressibility or initial porosity, which may be
represented respectively by the exponent n of Equation (2.30) or os
o εε −=1 of
Equation (2.31). As an example, from Figures 4.4(a) and (c) for CaCO3 and TiO2
which fall in the same case (Case 2), it is observed from Table 4.1 that the magnitude
of 'f decreases with cake porosity and increases with cake compressibility.
4.6 Concluding Remarks
The relationship between pore liquid pressure, lp and cake compressive stress,
sp is essential to the analysis of cake filtration and in applying C-P cell measurements
for the prediction of cake filtration performance. The conventional parabolic law of
constant pressure filtration was derived on the basis of a particular type of sl pp −
relationship, namely, =+ sl pp constant or Equation (4.1). The present work
demonstrates that this parabolic law can be extended to other types of sl pp −
relationships by defining a generalized specific cake resistance. The commonly used
scale-up procedure based on the parabolic law remains valid provided its limitations
are properly recognized.
On the other hand, knowledge of the sl pp − relationship is required in the
estimation of the average specific cake resistance from the cake constitutive equations.
For the four types of cakes in study, the degree of agreement between average specific
cake resistance calculated from the cake constitutive equations and those determined
from cake filtration experiments vary significantly with the sl pp − relationship used.
106
The sl pp − relationship which yields the best agreement was observed to be system
specific and varies with cake compressibility. For materials with lower to moderate
compressibility ( =n 0.32 - 0.51), for instance Kromasil, CaCO3 and TiO2, Case 2
gives a better agreement. For material with a higher compressibility ( =n 0.85), for
example Kaolin the better agreement lies with Case 3. Both of these two cases
involved cake porosity or solidosity in establishing the correlation between pore liquid
pressure and cake compressive pressure.
Strictly speaking, the data presented at the mean time on the proper selection of
sl pp − relationship are limited to the few material systems studied. Nevertheless,
some speculations and possible approaches have been offered to investigate the role of
porosity in sl pp − relationship which is believed to be attributed to the extent and
manner of the liquid flow when a cake is formed. Based on this, correlation between
the relationship of sl pp − or 'f with cake characteristics could also possibly be
made.
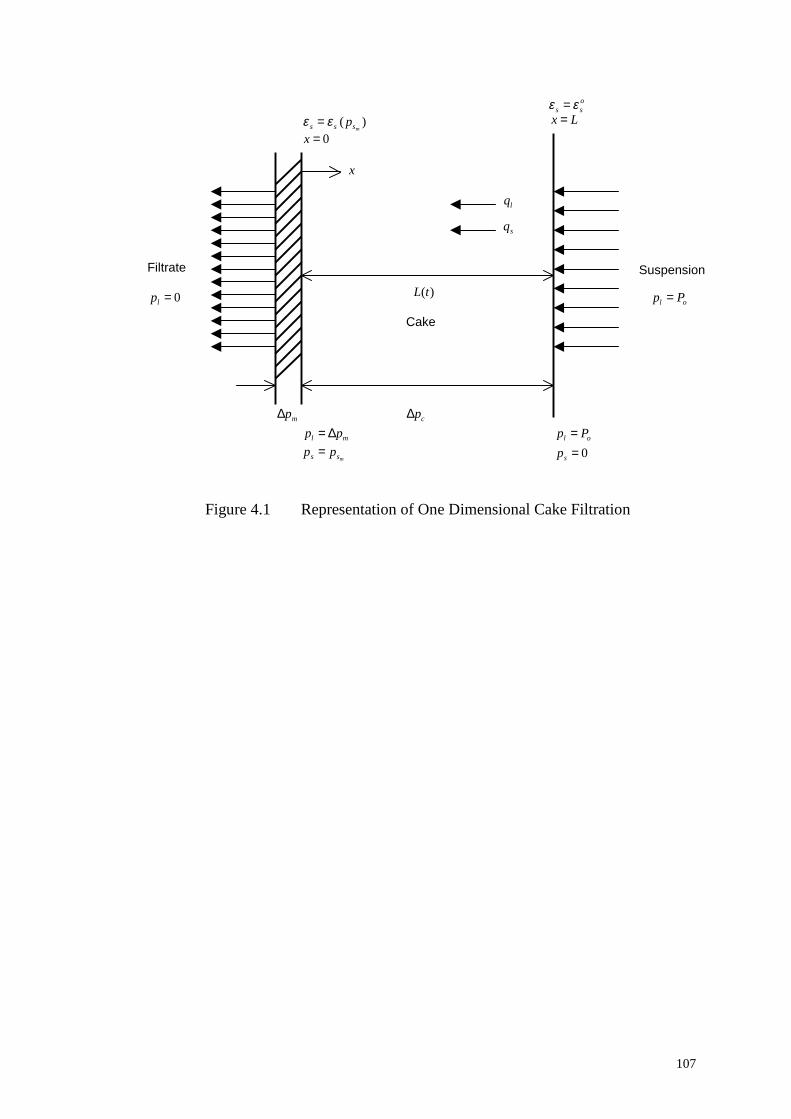
107
Figure 4.1 Representation of One Dimensional Cake Filtration
Filtrate
Cake
Suspension
mp∆ ml pp ∆=
mss pp =ol Pp =
0=sp
cp∆
ol Pp =0=lp
x
lq
sq
)(tL
0=xLx =)(
msss pεε =
oss εε =
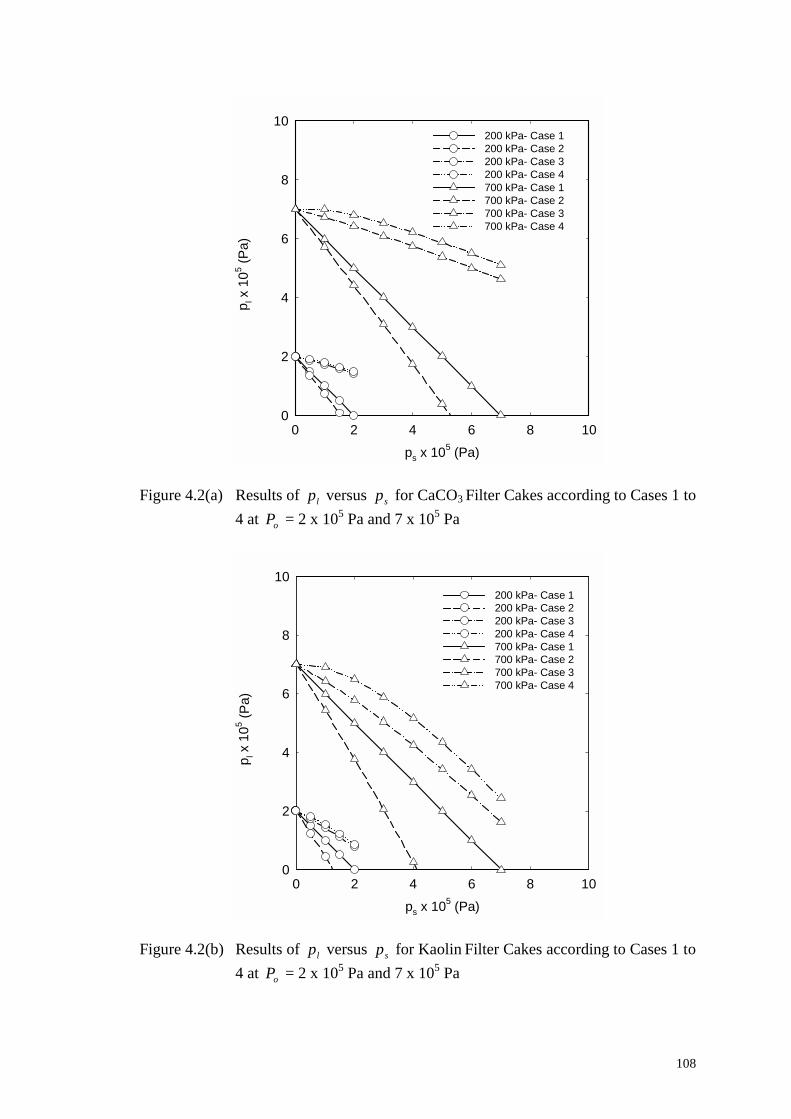
108
ps x 105 (Pa)0 2 4 6 8 10
p l x 1
05 (Pa)
0
2
4
6
8
10200 kPa- Case 1 200 kPa- Case 2 200 kPa- Case 3 200 kPa- Case 4 700 kPa- Case 1 700 kPa- Case 2 700 kPa- Case 3 700 kPa- Case 4
Figure 4.2(a) Results of lp versus sp for CaCO3 Filter Cakes according to Cases 1 to
4 at oP = 2 x 10⁵ Pa and 7 x 10⁵ Pa
ps x 105 (Pa)0 2 4 6 8 10
p l x 1
05 (Pa)
0
2
4
6
8
10200 kPa- Case 1 200 kPa- Case 2 200 kPa- Case 3 200 kPa- Case 4 700 kPa- Case 1 700 kPa- Case 2 700 kPa- Case 3 700 kPa- Case 4
Figure 4.2(b) Results of lp versus sp for Kaolin Filter Cakes according to Cases 1 to
4 at oP = 2 x 10⁵ Pa and 7 x 10⁵ Pa
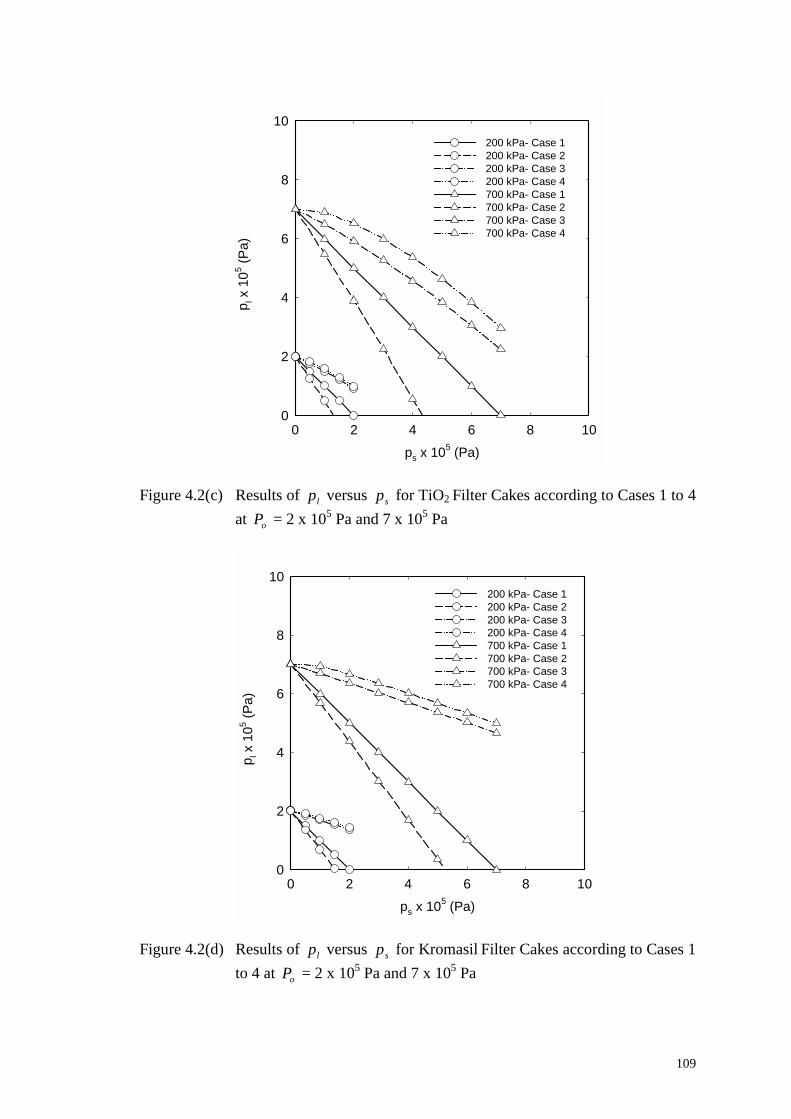
109
ps x 105 (Pa)0 2 4 6 8 10
p l x 1
05 (Pa)
0
2
4
6
8
10200 kPa- Case 1 200 kPa- Case 2 200 kPa- Case 3 200 kPa- Case 4 700 kPa- Case 1 700 kPa- Case 2 700 kPa- Case 3 700 kPa- Case 4
Figure 4.2(c) Results of lp versus sp for TiO2 Filter Cakes according to Cases 1 to 4
at oP = 2 x 10⁵ Pa and 7 x 10⁵ Pa
ps x 105 (Pa)0 2 4 6 8 10
p l x 1
05 (Pa)
0
2
4
6
8
10200 kPa- Case 1 200 kPa- Case 2 200 kPa- Case 3 200 kPa- Case 4 700 kPa- Case 1 700 kPa- Case 2 700 kPa- Case 3 700 kPa- Case 4
Figure 4.2(d) Results of lp versus sp for Kromasil Filter Cakes according to Cases 1
to 4 at oP = 2 x 10⁵ Pa and 7 x 10⁵ Pa
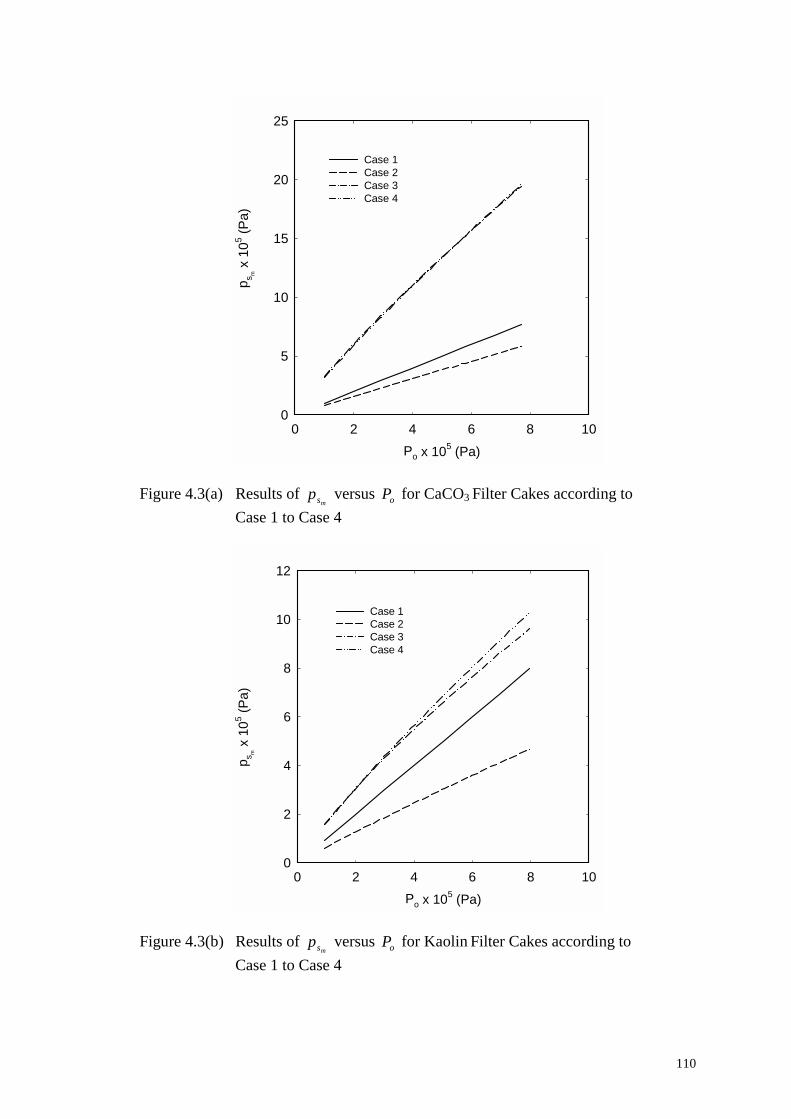
110
Po x 105 (Pa)0 2 4 6 8 10
p s m x
105 (P
a)
0
5
10
15
20
25
Case 1Case 2Case 3Case 4
Figure 4.3(a) Results of
msp versus oP for CaCO3 Filter Cakes according to Case 1 to Case 4
Po x 105 (Pa)0 2 4 6 8 10
p s m x
105 (P
a)
0
2
4
6
8
10
12
Case 1Case 2Case 3Case 4
Figure 4.3(b) Results of
msp versus oP for Kaolin Filter Cakes according to Case 1 to Case 4
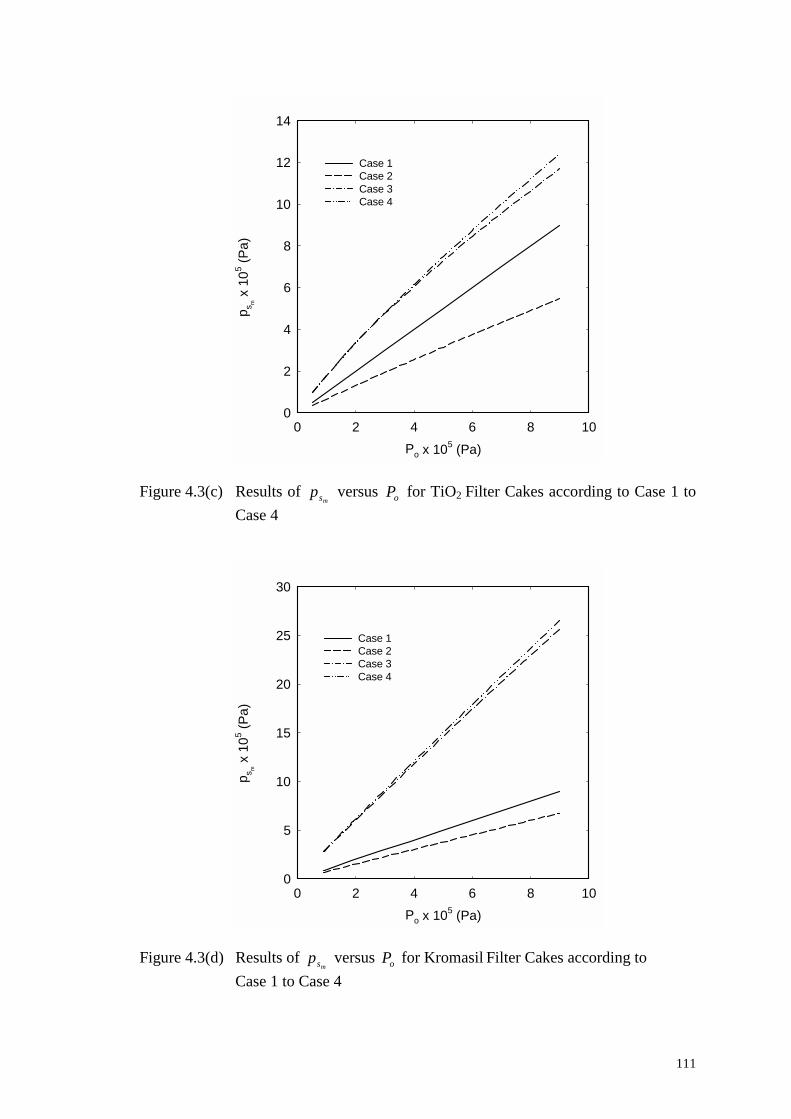
111
Po x 105 (Pa)0 2 4 6 8 10
p s m x
105 (P
a)
0
2
4
6
8
10
12
14
Case 1Case 2Case 3Case 4
Figure 4.3(c) Results of
msp versus oP for TiO2 Filter Cakes according to Case 1 to Case 4
Po x 105 (Pa)0 2 4 6 8 10
p s m x
105 (P
a)
0
5
10
15
20
25
30
Case 1Case 2Case 3Case 4
Figure 4.3(d) Results of
msp versus oP for Kromasil Filter Cakes according to Case 1 to Case 4
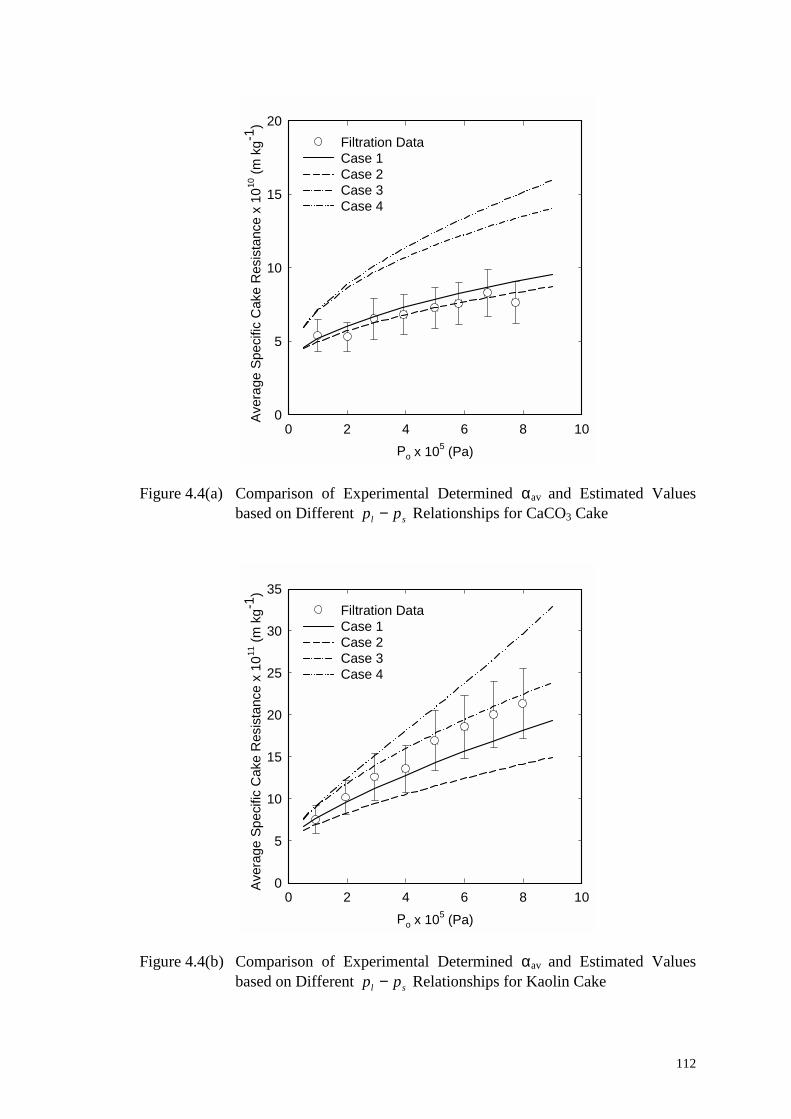
112
Po x 105 (Pa)0 2 4 6 8 10
Aver
age
Spec
ific
Cak
e R
esis
tanc
e x
1010
(m k
g-1)
0
5
10
15
20Filtration DataCase 1Case 2Case 3 Case 4
Figure 4.4(a) Comparison of Experimental Determined αav and Estimated Values based on Different sl pp − Relationships for CaCO3 Cake
Po x 105 (Pa)0 2 4 6 8 10
Aver
age
Spec
ific
Cak
e R
esis
tanc
e x
1011
(m k
g-1)
0
5
10
15
20
25
30
35Filtration DataCase 1Case 2Case 3 Case 4
Figure 4.4(b) Comparison of Experimental Determined αav and Estimated Values
based on Different sl pp − Relationships for Kaolin Cake
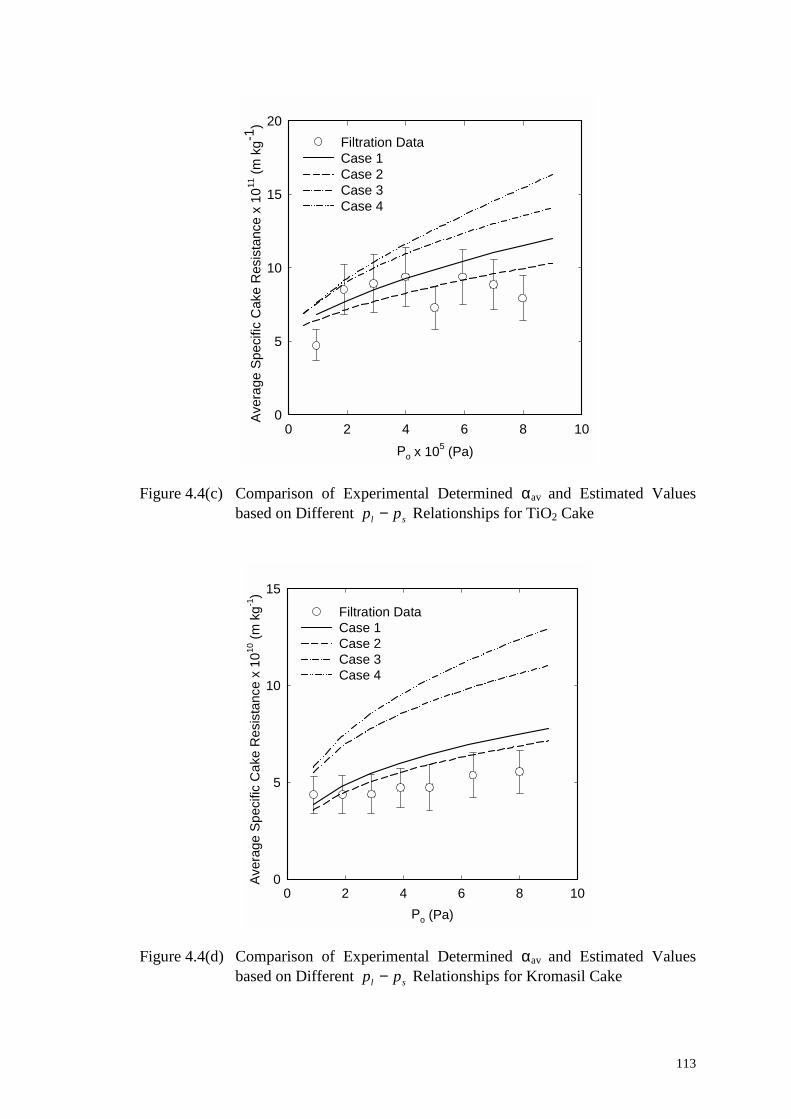
113
Po x 105 (Pa)0 2 4 6 8 10
Aver
age
Spec
ific
Cak
e R
esis
tanc
e x
1011
(m k
g-1)
0
5
10
15
20Filtration DataCase 1Case 2Case 3 Case 4
Figure 4.4(c) Comparison of Experimental Determined αav and Estimated Values
based on Different sl pp − Relationships for TiO2 Cake
Po (Pa)0 2 4 6 8 10
Aver
age
Spec
ific
Cak
e R
esis
tanc
e x
1010
(m k
g-1)
0
5
10
15
Filtration DataCase 1 Case 2Case 3Case 4
Figure 4.4(d) Comparison of Experimental Determined αav and Estimated Values
based on Different sl pp − Relationships for Kromasil Cake
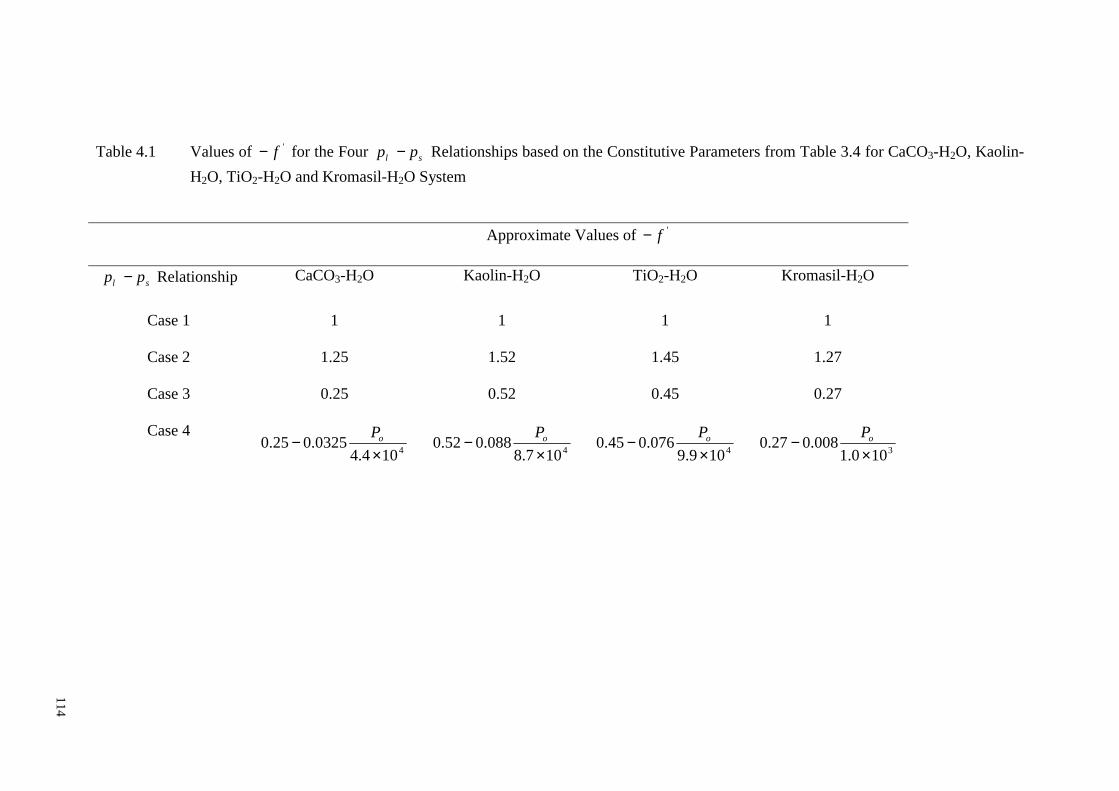
Table 4.1 Values of 'f− for the Four sl pp − Relationships based on the Constitutive Parameters from Table 3.4 for CaCO3-H2O, Kaolin-H2O, TiO2-H2O and Kromasil-H2O System
Approximate Values of 'f−
sl pp − Relationship CaCO3-H2O Kaolin-H2O TiO2-H2O Kromasil-H2O
Case 1 1 1 1 1
Case 2 1.25 1.52 1.45 1.27
Case 3 0.25 0.52 0.45 0.27
Case 4 4104.4
0325.025.0×
− oP 4107.8088.052.0
×− oP 4109.9
076.045.0×
− oP 3100.1008.027.0
×− oP
114
115
CHAPTER 5
A NEW PROCEDURE OF INTERPRETING
FILTRATION DATA
5.1 Introduction
The design and scale-up of filtration operations depend largely on the
availability and accuracy of the relevant experimental data, therefore it is important to
improve the existing or develop new procedures of determining cake properties,
aiming at both enhancing the accuracy of results and reducing the time to conduct the
experiments. Although C-P cell measurement which is commonly used to determine
cake characteristics could offer a simple, independent and less time-consuming method
to give data on the cake solidosity and permeability as functions of the compressive
stress directly, the results obtained cannot be applied directly to the calculation of filter
performance without additional information about the sl pp − relationship. Another
disadvantage of the C-P cell is the presence of surface friction, the effect of which
requires data corrections. The recent work of Lu et al. (1998) ameliorated this
disadvantage somewhat but not completely since the analysis is only approximate.
Rigorous analysis and simulation of cake formation and growth using computer
programming requires accurate input parameter which might need to be determined
separately with another experiment, e.g. determination of cake surface porosity, iε (Lu
and Hwang, 1993; Huang, 1998). Hence, it might be more efficient if the filtration data
could be directly used to obtain cake constitutive relationships between average
specific cake resistance and solid compressive pressure for the design of filtration
equipment.
116
For each filtration process, the conventional approach only enables the
determination of an average specific cake resistance from the slope of vt vs. v plot,
which is approximated to be linear, corresponding to the assumption that compressive
stress equals the operating pressure ( os Pp = ). A full account of the filtration
characteristics and information during a filtration process is not obtainable. In other
words, the conventional method does not allow the determination of average specific
cake resistance over a range of solid compressive pressure because to do so, a number
of filtration experiments under different values of oP must be carried out and this may
be time-consuming.
The conventional filtration equation (Equation 2.50) derived by Ruth (1935)
assumed the average specific cake resistance and the mass ratio of wet cake to dry cake
to be constant for the entire filtration run. Tiller and Cooper (1960) highlighted the
possibility that these assumptions might lead to erroneous results, especially in the
initial period of filtration or for short duration of filtration. As pointed out by Tiller
(1990), the v versus t relation is non-parabolic theoretically in the initial stages of
filtration because the pressure drop across the cake varies and average specific cake
resistance increases with time in the initial period. However up till now, the method of
obtaining cake characteristics from constant pressure filtration experiments has still
been based on the plot of vt vs. v via the conventional parabolic filtration equation,
where the plot of vt versus v for a filtration run is commonly approximated to be
linear in the conventional approach. The deviation of a filtration process from
parabolic behavior is believed to be attributed to the filter septum resistance or septum
117
clogging (Ruth, et al., 1933, Tiller et al., 1981, Willis et al., 1983, Koenders and
Wakeman, 1996, 1997a and 1997b, Meeten, 2000).
In view of the above-mentioned, the conventional method of interpreting
constant-pressure cake filtration data using the parabolic law will be re-examined.
Since both the conventional theory and experiments have mostly focused on the
compaction stage of filtration, it is also worthwhile to investigate the initial stage of
filtration and the effect of medium resistance. In this research, a new procedure will be
developed to obtain average specific cake resistance over a range of pressure drop
across the cake from a single filtration run.
5.2 Initial Filtration Period
From the conventional constant pressure filtration equation (Equation 4.31), a
plot of vt versus v is expected to yield a linear relationship for the entire filtration
data. Figure 5.1 shows the comparisons of vt vs. v plot for filtration runs of 2%
CaCO3-H2O system at 100 kPa and 10 mm cake thickness with media of various
resistances (i.e. 3, 4, 10 and 18 filter papers). The linearity of vt vs. v plot is observed
only when the value of v (or time) or the cake thickness is sufficiently large. The
initial part of the data contributes to the non-parabolic behavior of the entire range of
filtration data. With increasing number of filter papers and hence increasing
medium/septum resistance, the vt vs. v plots show more pronounced non-linearity and
non-parabolic filtration behavior. Similar trends were reported by Tiller et al. (1981)
118
when they increased their medium clogging constant which is a function of the initial
medium resistance.
The initial filtration behavior may be explained by the incipient interaction
between loose clusters of particles and the filtering medium in the initial filtration
phase. The effect of the initial period was observed to be reduced by applying higher
filtration pressure as shown in Figure 5.2(a) and (b) for CaCO3 and Kaolin cakes
where the degree of nonlinearity decreases when filtration pressure is increased. The
higher applied filtration pressure probably causes faster particle migration and
compaction during the deposition process. This in turn speeds up the growth of the
filter cake and the dominance of cake resistance over the medium/septum resistance.
5.2.1 Analysis of Initial Filtration Period
As pointed out by Meeten (2000), an initial time is taken by the cake to grow to
a certain thickness until the pressure drop across the cake and the septum become
equal. The filtrate efflux rate is controlled mainly by the septum resistance during this
initial time and mainly by the cake when the filtration time is greater than this initial
time. Hence, the initial filtration period may be defined as the period up to the point
when the filtration velocity drops to approximately half of its initial value or when the
pressure drop across the cake increases to about half of the applied pressure.
Values of dtdv were obtained from the experimental data of v versus t through
difference-approximation method. The initial value of dtdv were estimated by
extrapolation of dtdv vs. t plot to 0=t . The estimated value of
0=
tdtdv is counter-
119
checked by plotting vt versus v and
dvdt versus v on the same plot and extrapolated
the respective data to 0=v .
From Figure 5.3(a)-(b), the profile of filtration velocity can be divided into two
segments with the first portion showing a steep gradient and the second portion
showing a more gradual gradient. At the very beginning of filtration, the cake has not
been formed and the total pressure drop is entirely across the filter medium alone.
Thus, filtration rate is the highest at the starting point of filtration when 0=t . As the
medium is covered by particles and thin layer of cake starts to prevail, the total
pressure drop has to be shared by both the medium and the cake, causing filtration rate
to decrease steeply. The subsequent reduction of filtration rate is gradual and attributed
to the increasing cake thickness during cake growth. As the initial phase is
correspondent to the period where a steep velocity gradient exists, the first segment of
the plot is intuitively the initial stage of filtration.
With the initial stage defined as above, the plot of vt versus v can be divided
consistently into two segments corresponding to the initial and latter stage of filtration.
As shown in Figure 5.4(a) and (b), the as-defined initial stage based on the period up to
when the filtration velocity drops to approximately half of its initial value indicated on
the vt versus v plot divides the data into two segments which can be approximately
distinguished by visual observation.
Tables 5.1(a) and (b) show the initial filtration velocity and the estimated time
required for the filtration rate to drop to half of its initial value (terminal velocity) for
2% CaCO3-H2O and 5% Kaolin-H2O system, respectively. As filtration pressure is
increased, a higher compression force is applied to the slurry causing the initial
120
filtration velocity and terminal velocity to increase. The acceleration of the filtration
process shown by the increase in the reduction of filtration rate shortens the time
needed to reach the terminal velocity. As a result, increasing filtration pressures tend to
diminish the effect of the initial filtration period as shown in Figure 5.2(a) and (b).
Within the experimental conditions conducted herein and based on the as-
defined initial filtration period, the duration of the initial period was found to range
from 3-8% of the total filtration time for CaCO3-H2O system and < 1% for Kaolin-
H2O system. The difficulties in determining and analyzing the initial filtration period
mainly result from the short time period involved and the inherent uncertainties of
filtration data collected. Grace (1956) pointed out that this region of filtration was of
short duration in most cases and it appeared to be a true transition zone which is not
amendable to any single relationship.
5.3 Determination of Cake Characteristics from Filtration
Experimental Data
To develop a new method of interpreting filtration data for obtaining a more
complete information of the filter cake characteristics from the conventional cake
filtration theory, the conventional filtration approach detailed in Chapter 4 will be
further considered. From Equation (4.26), it can be seen that both mspav ][α and m vary
with operating time in a filtration process. Consequently, Equations (4.25) and (4.28)
do not give t as a parabolic function of v . Equation (4.28) describes the filtration
behavior of a compressible cake with finite medium resistance, where m is a time-
dependent local function. From Equation (4.31), the conventional parabolic law is seen
121
to apply only for incompressible cakes because for compressible cakes, )1(
][
smmspav
−
α is not
constant as shown in Equation (4.28). Hence, a new method to interpret the filtration
data is proposed as follows.
As the pressure drop across a cake during a filtration run is a monotonically
increasing function of time with oP as its asymptotic value, the average specific cake
resistance, mspav ][α can be evaluated corresponding to the range of cp∆ values
experienced by the cake. This method would be more efficient than that based on the
vt versus v plot, where only a value of average specific cake resistance corresponding
to the operating pressure ( os Pp = ) is obtained.
The experimental data of v versus t and L versus t can be used to estimate
dtdv and m at various times. From the filtration rate at 0=t , i.e.
0=
tdtdv , medium
resistance can be estimated and cp∆ across the cake can be readily determined as
follows:
0=
=
t
om
dtdvPR
µ (5.1)
o
t
mm P
dtdv
dtdv
Rdtdvp
0=
=
=∆ µ
(5.2)
−=∆−=∆
=0
1
t
omoc
dtdv
dtdv
PpPp (5.3)
122
Thus, from a single filtration experiment, a range of average specific cake resistance
could be obtained for 0 < sp < oP , instead of a single value of average specific cake
resistance at os Pp = .
The data generated from filtration experiments with various cake thicknesses
under the same applied pressure from Section 3.4.4 could be fitted with the following
power function to estimate the variation of cake thickness with time:
5.0atL = (5.4)
where a is a fitting parameter.
These data can be used to obtain m as shown in Equation (4.19), i.e.
ss
smερερ )1(1 −+= (5.5)
sε is the spatial average value of cake solidosity at a given t or v .
Based on an overall basis, the ratio of cake volume to filtrate volume can be expressed
as:
sssms
vL
ρερ
)1( −= (5.6)
Substituting Equation (5.5) into Equation (5.6), one has
LsLsLLvs
sss ρρρ
ρε−+
+= )( (5.7)
Although the principle of this new procedure looks simple, its implementation
is not straight forward. The accuracy of mp∆ and cp∆ depends on the value of
123
0=
tdtdv and
dtdv , and it is based on the assumption that mR is constant. Obtaining
values of dtdv by differentiating experimental data of v versus t will inevitably
introduce errors. The same goes to the determination of 0=
tdtdv by differentiating and
extrapolating the experimental data. The difficulties of accurately determining mR
value have been reported by several researchers (Willis et al., 1983; Tiller, 1990;
Meeten, 2000).
5.3.1 Effect of Medium Resistance
Values of mR were determined from a few methods as shown in Table 5.2. In
the analysis and simulation of filtration cake formation and growth, value of mR
employed is commonly determined from the initial filtration rate, 0=
tdtdv based on
Darcy’s equation (Wakeman, 1981; Theliander and Fathi-Najafi, 1996; Huang, 1998),
i.e. Equation (5.1). 0=
tdtdv is obtained by extrapolating results of
dtdv to intercept the
ordinate of 0=t .
As commonly used in the conventional approach, mR could also be determined
from the latter portion of the plot when the cake resistance is deemed to be dominant.
In this case, it is taken to be from the time when the filtration velocity drops to about
half of its initial value, in conjunction to the definition of the initial period discussed in
Section 5.2. The value of lattermR , was determined from the intercept of the later portion
of the plot and from Equation (4.31):
124
=
µo
latterlattermPInterceptR )(, (5.8)
For measurement using de-ionized water, the mR obtained is simply the
intrinsic septum resistance for clean filter mediums and it is expected to be lower
compared to those determined from filtration data for dirty medium. In this work, mR
determined from filtration experiments was observed to be about 11-17 times higher
than the intrinsic mR for CaCO3 system and about 22-100 times higher than that for
Kaolin system (Table 5.2). Other researchers have reported the extent of mR increase
from clean to dirty medium to be 2-8 times for various materials (Chase and Arconti,
1994; Huang, 1998; Meeten, 2000). Heertjes (1957) pointed out the extrapolated mR
value is generally much higher than the resistance of clean cloth.
The rapid change of mR from intrinsic value to that of 0
,=
tdtdvm
R or lattermR ,
indicates that filter medium is clogged by particles once the medium is in contact with
the incoming slurry. Hence, the initial stage is considered to be septum-controlled
where pressure drop across the medium dominates. Meeten (2000) reported that the
incipient cake grows on a septum with constant clogged mR value (and decreasing
mp∆ due to decreasing dtdv across the cake and medium) as mR is independent of
slurry concentration and unaffected by the later cake growth.
For the different cake materials used in this study, the values of 0
,=
tdtdvm
R were
observed to be lower than lattermR , for CaCO3 system and higher than that for Kaolin
system which is more compressible (Table 5.2). This is due to the different initial
filtration behavior shown by the two materials (Figure 5.2a and 5.2b). For Kaolin, the
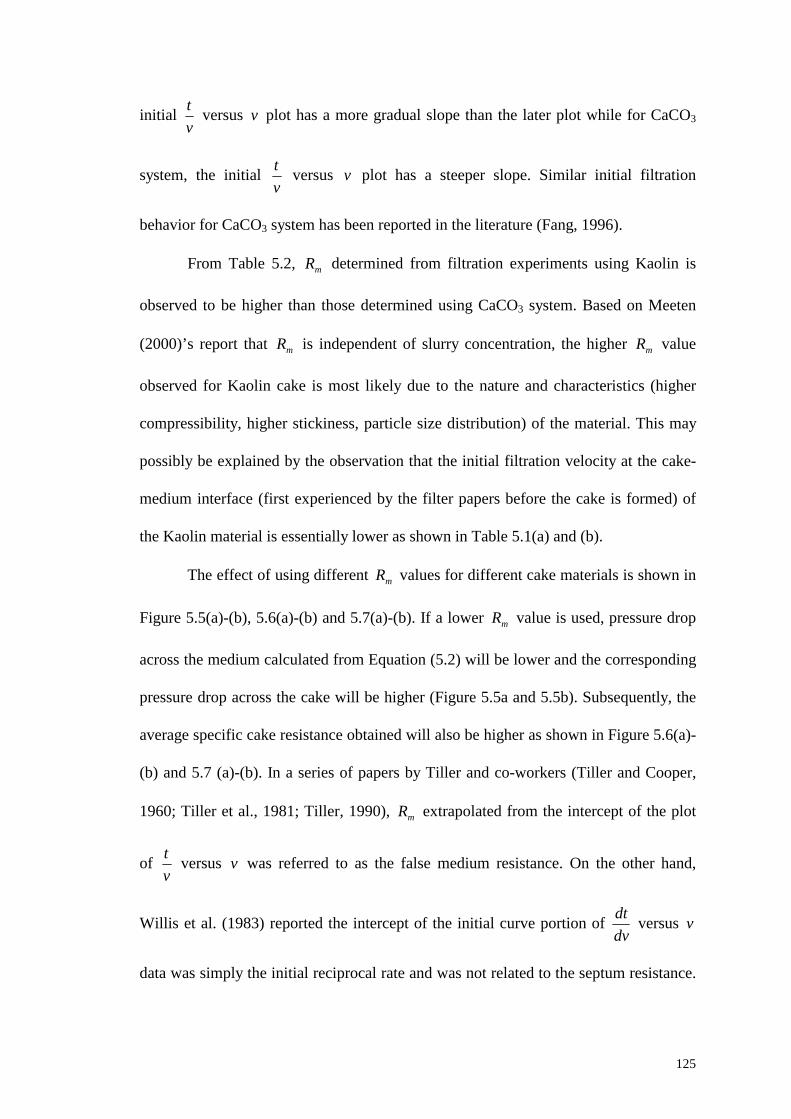
125
initial vt versus v plot has a more gradual slope than the later plot while for CaCO3
system, the initial vt versus v plot has a steeper slope. Similar initial filtration
behavior for CaCO3 system has been reported in the literature (Fang, 1996).
From Table 5.2, mR determined from filtration experiments using Kaolin is
observed to be higher than those determined using CaCO3 system. Based on Meeten
(2000)’s report that mR is independent of slurry concentration, the higher mR value
observed for Kaolin cake is most likely due to the nature and characteristics (higher
compressibility, higher stickiness, particle size distribution) of the material. This may
possibly be explained by the observation that the initial filtration velocity at the cake-
medium interface (first experienced by the filter papers before the cake is formed) of
the Kaolin material is essentially lower as shown in Table 5.1(a) and (b).
The effect of using different mR values for different cake materials is shown in
Figure 5.5(a)-(b), 5.6(a)-(b) and 5.7(a)-(b). If a lower mR value is used, pressure drop
across the medium calculated from Equation (5.2) will be lower and the corresponding
pressure drop across the cake will be higher (Figure 5.5a and 5.5b). Subsequently, the
average specific cake resistance obtained will also be higher as shown in Figure 5.6(a)-
(b) and 5.7 (a)-(b). In a series of papers by Tiller and co-workers (Tiller and Cooper,
1960; Tiller et al., 1981; Tiller, 1990), mR extrapolated from the intercept of the plot
of vt versus v was referred to as the false medium resistance. On the other hand,
Willis et al. (1983) reported the intercept of the initial curve portion of dvdt versus v
data was simply the initial reciprocal rate and was not related to the septum resistance.
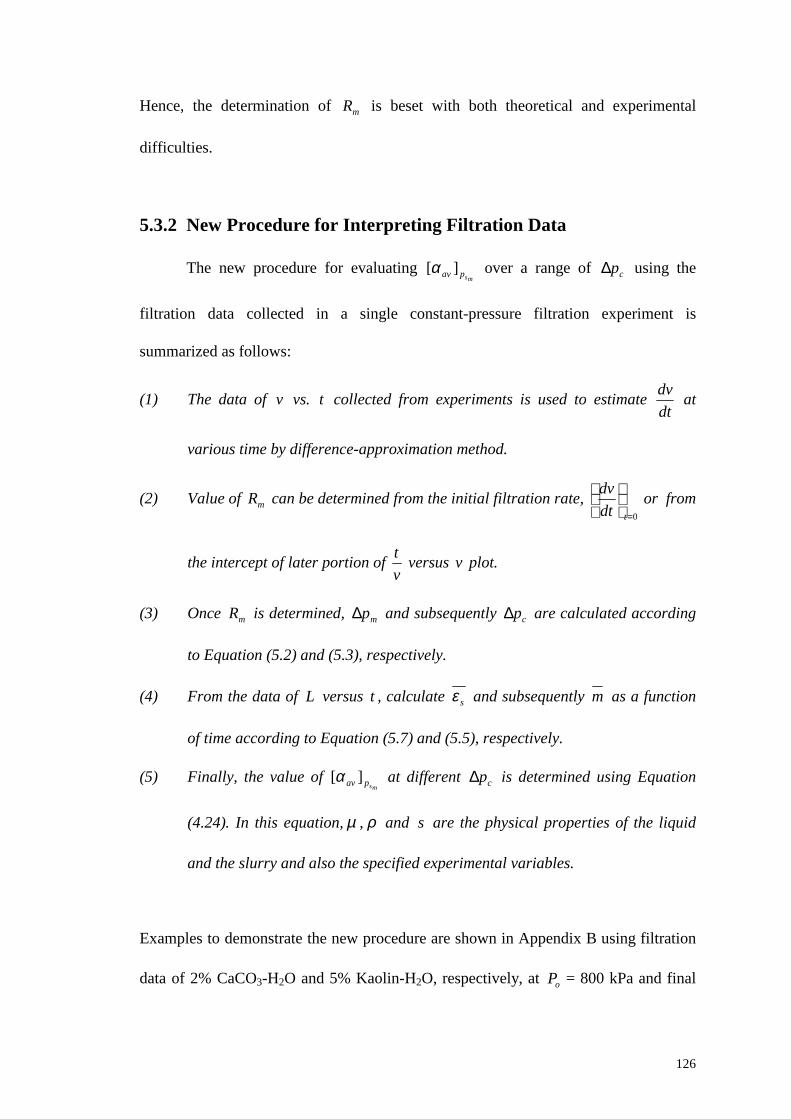
126
Hence, the determination of mR is beset with both theoretical and experimental
difficulties.
5.3.2 New Procedure for Interpreting Filtration Data
The new procedure for evaluating mspav ][α over a range of cp∆ using the
filtration data collected in a single constant-pressure filtration experiment is
summarized as follows:
(1) The data of v vs. t collected from experiments is used to estimate dtdv at
various time by difference-approximation method.
(2) Value of mR can be determined from the initial filtration rate, 0=
tdtdv or from
the intercept of later portion of vt versus v plot.
(3) Once mR is determined, mp∆ and subsequently cp∆ are calculated according
to Equation (5.2) and (5.3), respectively.
(4) From the data of L versus t , calculate sε and subsequently m as a function
of time according to Equation (5.7) and (5.5), respectively.
(5) Finally, the value of mspav ][α at different cp∆ is determined using Equation
(4.24). In this equation, µ , ρ and s are the physical properties of the liquid
and the slurry and also the specified experimental variables.
Examples to demonstrate the new procedure are shown in Appendix B using filtration
data of 2% CaCO3-H2O and 5% Kaolin-H2O, respectively, at oP = 800 kPa and final
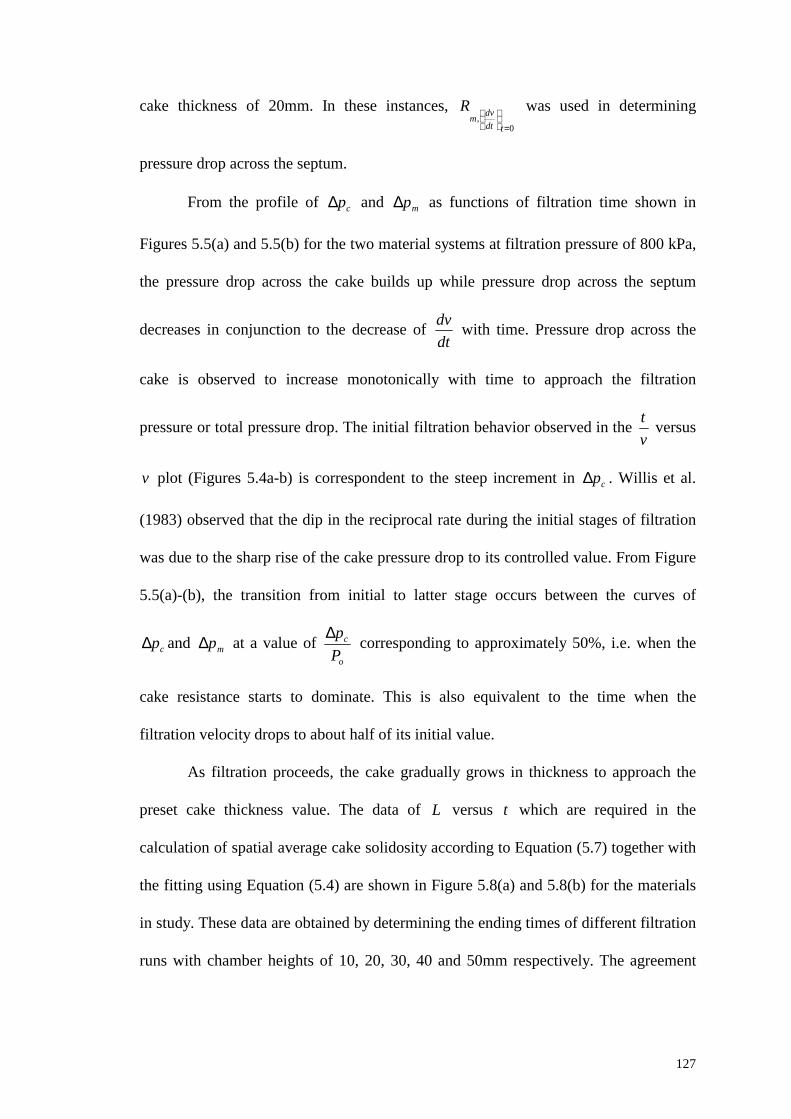
127
cake thickness of 20mm. In these instances, 0
,=
tdtdvm
R was used in determining
pressure drop across the septum.
From the profile of cp∆ and mp∆ as functions of filtration time shown in
Figures 5.5(a) and 5.5(b) for the two material systems at filtration pressure of 800 kPa,
the pressure drop across the cake builds up while pressure drop across the septum
decreases in conjunction to the decrease of dtdv with time. Pressure drop across the
cake is observed to increase monotonically with time to approach the filtration
pressure or total pressure drop. The initial filtration behavior observed in the vt versus
v plot (Figures 5.4a-b) is correspondent to the steep increment in cp∆ . Willis et al.
(1983) observed that the dip in the reciprocal rate during the initial stages of filtration
was due to the sharp rise of the cake pressure drop to its controlled value. From Figure
5.5(a)-(b), the transition from initial to latter stage occurs between the curves of
cp∆ and mp∆ at a value of o
c
Pp∆ corresponding to approximately 50%, i.e. when the
cake resistance starts to dominate. This is also equivalent to the time when the
filtration velocity drops to about half of its initial value.
As filtration proceeds, the cake gradually grows in thickness to approach the
preset cake thickness value. The data of L versus t which are required in the
calculation of spatial average cake solidosity according to Equation (5.7) together with
the fitting using Equation (5.4) are shown in Figure 5.8(a) and 5.8(b) for the materials
in study. These data are obtained by determining the ending times of different filtration
runs with chamber heights of 10, 20, 30, 40 and 50mm respectively. The agreement
128
between the fitting and experimental data suggests that cake thickness is a linear
function of 5.0t .
The spatial average cake solidosity which describes the average cake solidosity
across a cake at a particular instant is an increasing function of filtration time (Figure
5.9a and 5.9b) until it reaches a maximum value limited by the total filtration pressure
at the cake-medium interface. The profile of cake solidosity determined from a single
filtration run using the new method (Equation 5.5-5.7) follows closely the trend of that
obtained by setting different cake thicknesses in various filtration experiments. As
shown in Equation (5.5), the trend of the overall ratio of wet cake mass to dry cake
mass is in a decreasing direction with respect to filtration time before reaching the
constant limiting value (Figure 5.10a and 5.10b). Therefore, the factor of ( sm−1 )
cannot be assumed to be constant in the conventional filtration equation [Equation
(4.24)].
The range of mspav ][α values determined from a number of filtration runs using
the new procedure are plotted against cp∆ in Figure 5.11(a), 5.11(b), 5.12(a) and
5.12(b) for CaCO3 and Kaolin cake, respectively. Since the new procedure is aimed at
obtaining cake characteristics from cake filtration data during the cake formation and
growth stage when cake resistance dominates, the data obtained from the initial
filtration period were discarded in the plots.
Nevertheless, the new method is able to generate values of average specific
cake resistance over a range of pressure drop across the cake from a single filtration
experiment. From Figure 5.11(a)-(b) and 5.12(a)-(b), within experimental errors, these
results are comparable to the average specific cake resistance evaluated from C-P cell
measurement based on sl pp − relationship of 0=+ sl dpdp . In this case where value
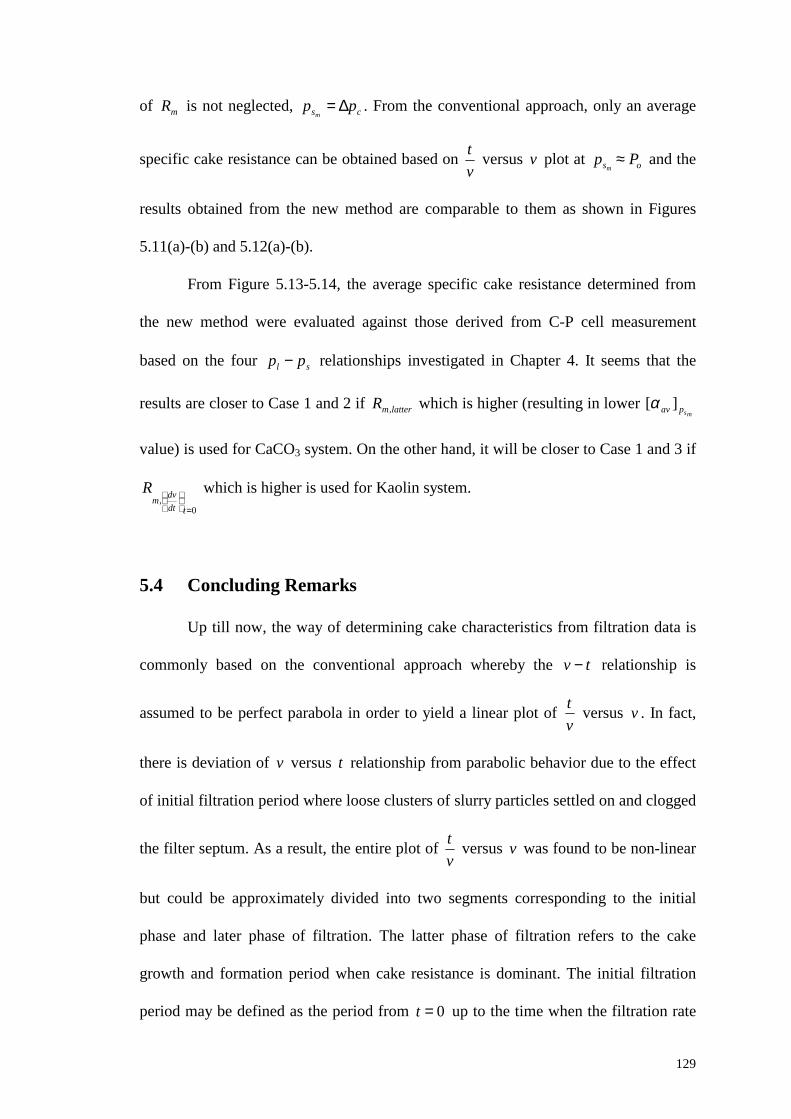
129
of mR is not neglected, cs ppm
∆= . From the conventional approach, only an average
specific cake resistance can be obtained based on vt versus v plot at os Pp
m≈ and the
results obtained from the new method are comparable to them as shown in Figures
5.11(a)-(b) and 5.12(a)-(b).
From Figure 5.13-5.14, the average specific cake resistance determined from
the new method were evaluated against those derived from C-P cell measurement
based on the four sl pp − relationships investigated in Chapter 4. It seems that the
results are closer to Case 1 and 2 if lattermR , which is higher (resulting in lower mspav ][α
value) is used for CaCO3 system. On the other hand, it will be closer to Case 1 and 3 if
0,
=
tdtdvm
R which is higher is used for Kaolin system.
5.4 Concluding Remarks
Up till now, the way of determining cake characteristics from filtration data is
commonly based on the conventional approach whereby the tv − relationship is
assumed to be perfect parabola in order to yield a linear plot of vt versus v . In fact,
there is deviation of v versus t relationship from parabolic behavior due to the effect
of initial filtration period where loose clusters of slurry particles settled on and clogged
the filter septum. As a result, the entire plot of vt versus v was found to be non-linear
but could be approximately divided into two segments corresponding to the initial
phase and later phase of filtration. The latter phase of filtration refers to the cake
growth and formation period when cake resistance is dominant. The initial filtration
period may be defined as the period from 0=t up to the time when the filtration rate
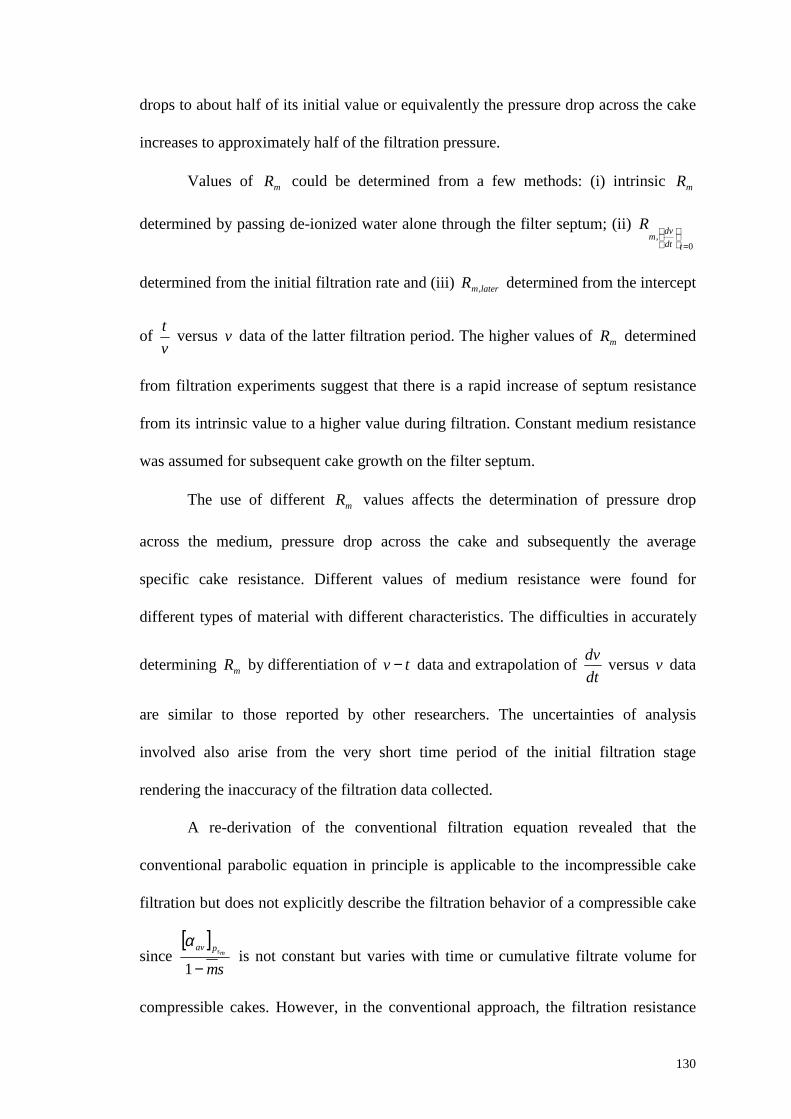
130
drops to about half of its initial value or equivalently the pressure drop across the cake
increases to approximately half of the filtration pressure.
Values of mR could be determined from a few methods: (i) intrinsic mR
determined by passing de-ionized water alone through the filter septum; (ii) 0
,=
tdtdvm
R
determined from the initial filtration rate and (iii) latermR , determined from the intercept
of vt versus v data of the latter filtration period. The higher values of mR determined
from filtration experiments suggest that there is a rapid increase of septum resistance
from its intrinsic value to a higher value during filtration. Constant medium resistance
was assumed for subsequent cake growth on the filter septum.
The use of different mR values affects the determination of pressure drop
across the medium, pressure drop across the cake and subsequently the average
specific cake resistance. Different values of medium resistance were found for
different types of material with different characteristics. The difficulties in accurately
determining mR by differentiation of tv − data and extrapolation of dtdv versus v data
are similar to those reported by other researchers. The uncertainties of analysis
involved also arise from the very short time period of the initial filtration stage
rendering the inaccuracy of the filtration data collected.
A re-derivation of the conventional filtration equation revealed that the
conventional parabolic equation in principle is applicable to the incompressible cake
filtration but does not explicitly describe the filtration behavior of a compressible cake
since [ ]
smmspav
−1
α is not constant but varies with time or cumulative filtrate volume for
compressible cakes. However, in the conventional approach, the filtration resistance
131
and mass ratio of wet cake to dry cake ( m ) were assumed to be constant. Hence, only
an average cake property can be determined at a specific filtration pressure based on
the vt versus v plot which is assumed to be linear. Moreover, the data used must cover
a sufficiently long period of time so that the pressure drop across the filter medium is
negligible compared to that across the cake.
The new method proposed can be used to interpret constant pressure filtration
data from the conventional filtration equation based on the variation of filtration rate
and pressure drop across the cake with times. This method provides more detailed and
complete information about the filter cake characteristics, i.e. the profiles of pressure
drop across filter cake, ratio of wet cake mass to dry cake mass, spatial average cake
solidosity with respect to filtration times, as well as an efficient way of determining the
average specific cake resistance over a range of compressive pressures from a single
filtration experiment. It also offers a closer interaction between analysis and
experiments as experimental filtration data is directly employed to analyze the cake
characteristics during the cake formation and growth. The a priori relationship between
sl pp − which is essential in the C-P cell method is not required in the filtration
calculation of the new approach.
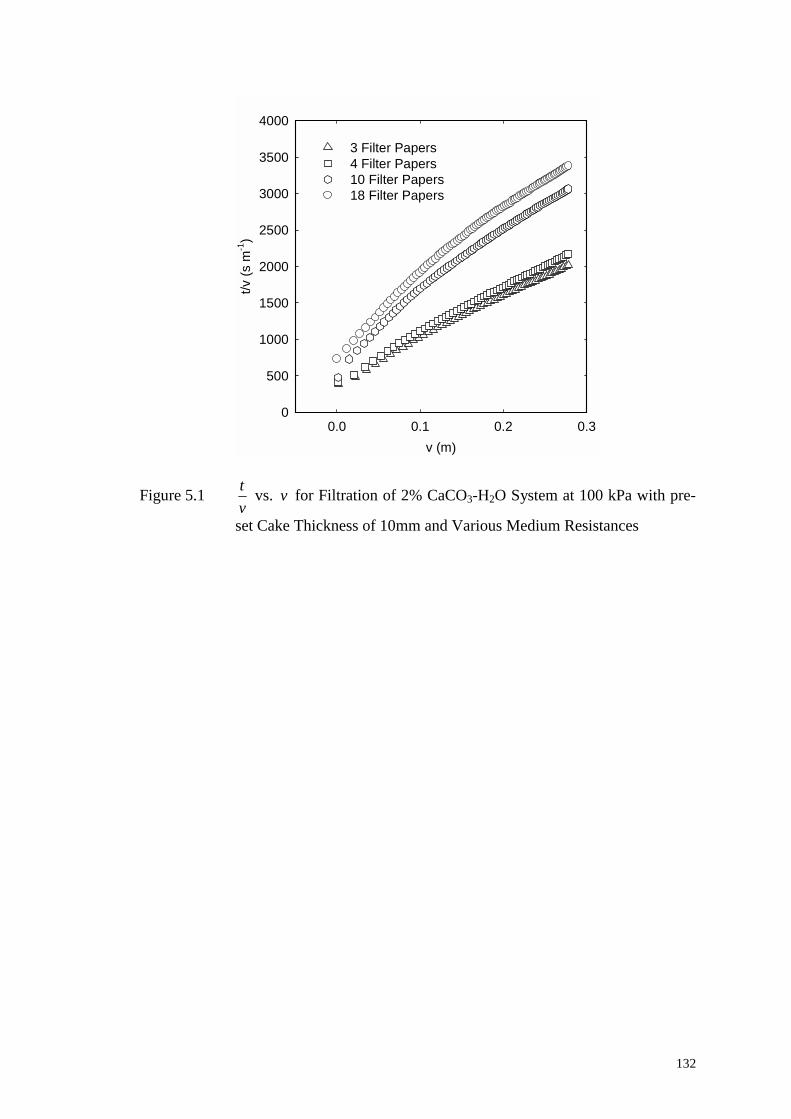
132
v (m)0.0 0.1 0.2 0.3
t/v (s
m-1
)
0
500
1000
1500
2000
2500
3000
3500
4000
3 Filter Papers 4 Filter Papers10 Filter Papers 18 Filter Papers
Figure 5.1 vt vs. v for Filtration of 2% CaCO3-H2O System at 100 kPa with pre-
set Cake Thickness of 10mm and Various Medium Resistances
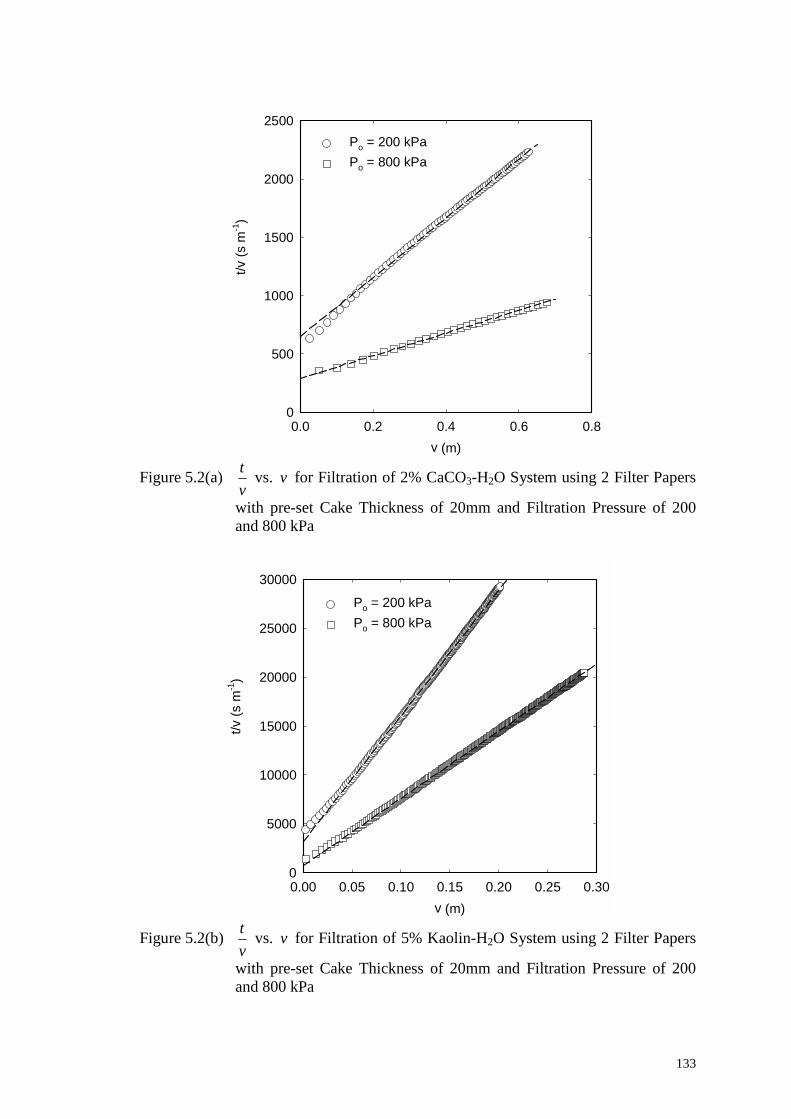
133
v (m)0.0 0.2 0.4 0.6 0.8
t/v (s
m-1
)
0
500
1000
1500
2000
2500Po = 200 kPaPo = 800 kPa
Figure 5.2(a)
vt vs. v for Filtration of 2% CaCO3-H2O System using 2 Filter Papers
with pre-set Cake Thickness of 20mm and Filtration Pressure of 200 and 800 kPa
v (m)0.00 0.05 0.10 0.15 0.20 0.25 0.30
t/v (s
m-1
)
0
5000
10000
15000
20000
25000
30000
Po = 200 kPaPo = 800 kPa
Figure 5.2(b)
vt vs. v for Filtration of 5% Kaolin-H2O System using 2 Filter Papers
with pre-set Cake Thickness of 20mm and Filtration Pressure of 200 and 800 kPa
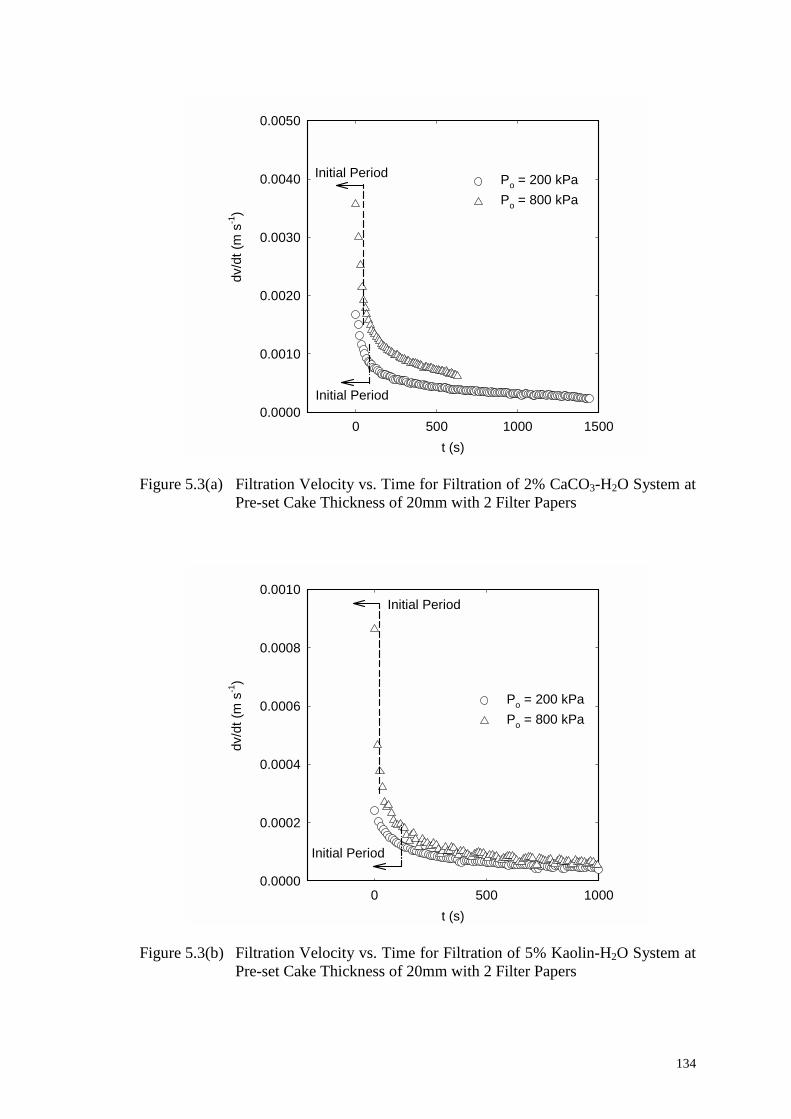
134
t (s)0 500 1000 1500
dv/d
t (m
s-1
)
0.0000
0.0010
0.0020
0.0030
0.0040
0.0050
Po = 200 kPaPo = 800 kPa
Initial Period
Initial Period
Figure 5.3(a) Filtration Velocity vs. Time for Filtration of 2% CaCO3-H2O System at
Pre-set Cake Thickness of 20mm with 2 Filter Papers
t (s)0 500 1000
dv/d
t (m
s-1
)
0.0000
0.0002
0.0004
0.0006
0.0008
0.0010
Po = 200 kPaPo = 800 kPa
Initial Period
Initial Period
Figure 5.3(b) Filtration Velocity vs. Time for Filtration of 5% Kaolin-H2O System at
Pre-set Cake Thickness of 20mm with 2 Filter Papers
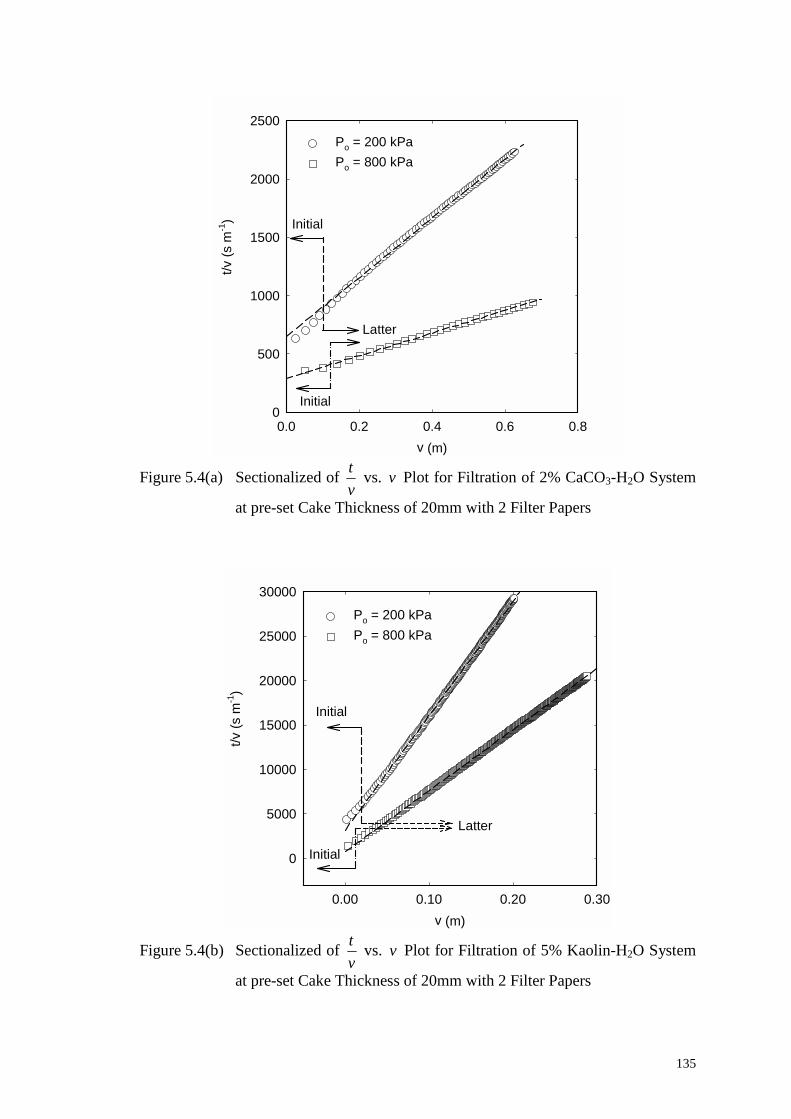
135
v (m)0.0 0.2 0.4 0.6 0.8
t/v (s
m-1
)
0
500
1000
1500
2000
2500Po = 200 kPaPo = 800 kPa
Initial
Initial
Latter
Figure 5.4(a) Sectionalized of
vt vs. v Plot for Filtration of 2% CaCO3-H2O System
at pre-set Cake Thickness of 20mm with 2 Filter Papers
v (m)0.00 0.10 0.20 0.30
t/v (s
m-1
)
0
5000
10000
15000
20000
25000
30000
Po = 200 kPaPo = 800 kPa
Initial
Initial
Latter
Figure 5.4(b) Sectionalized of
vt vs. v Plot for Filtration of 5% Kaolin-H2O System
at pre-set Cake Thickness of 20mm with 2 Filter Papers
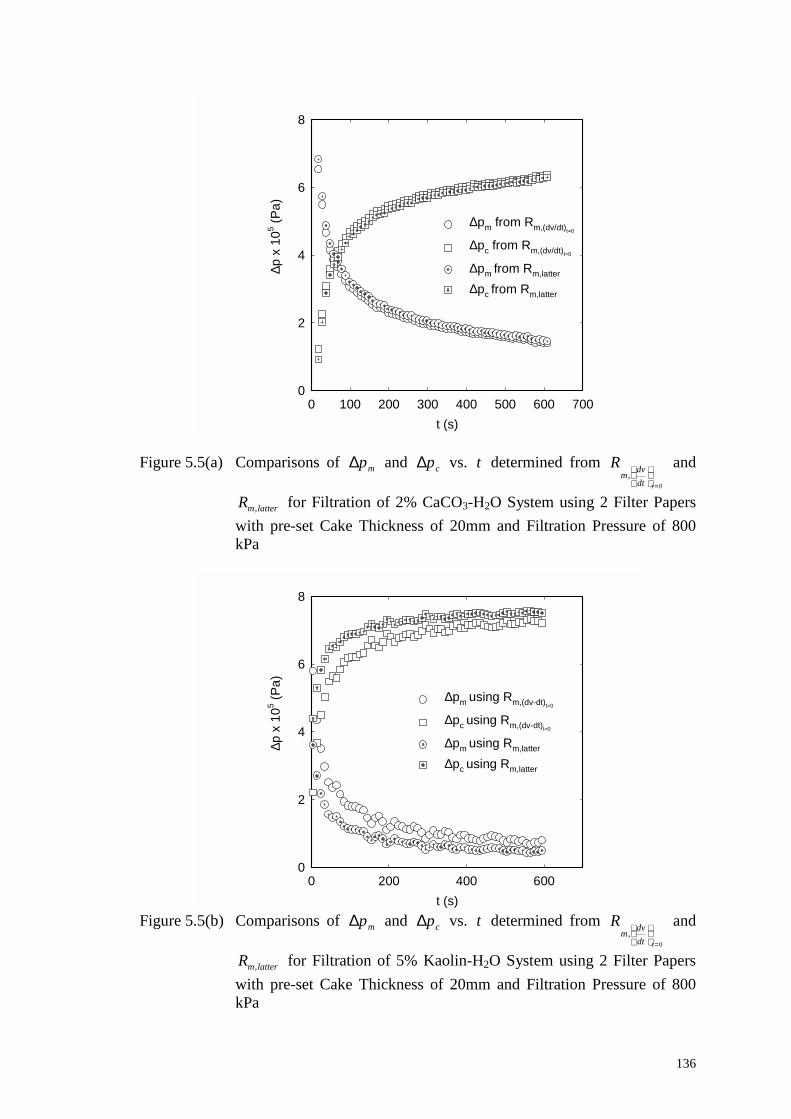
136
t (s)0 100 200 300 400 500 600 700
∆p x
105 (P
a)
0
2
4
6
8
∆pm from Rm,(dv/dt)t=0
∆pc from Rm,(dv/dt)t=0
∆pm from Rm,latter ∆pc from Rm,latter
Figure 5.5(a) Comparisons of mp∆ and cp∆ vs. t determined from
0,
=
tdtdvm
R and
lattermR , for Filtration of 2% CaCO3-H2O System using 2 Filter Papers with pre-set Cake Thickness of 20mm and Filtration Pressure of 800 kPa
t (s)0 200 400 600
∆p x
105 (P
a)
0
2
4
6
8
∆pm using Rm,(dv-dt)t=0
∆pc using Rm,(dv-dt)t=0
∆pm using Rm,latter
∆pc using Rm,latter
Figure 5.5(b) Comparisons of mp∆ and cp∆ vs. t determined from
0,
=
tdtdvm
R and
lattermR , for Filtration of 5% Kaolin-H2O System using 2 Filter Papers with pre-set Cake Thickness of 20mm and Filtration Pressure of 800 kPa
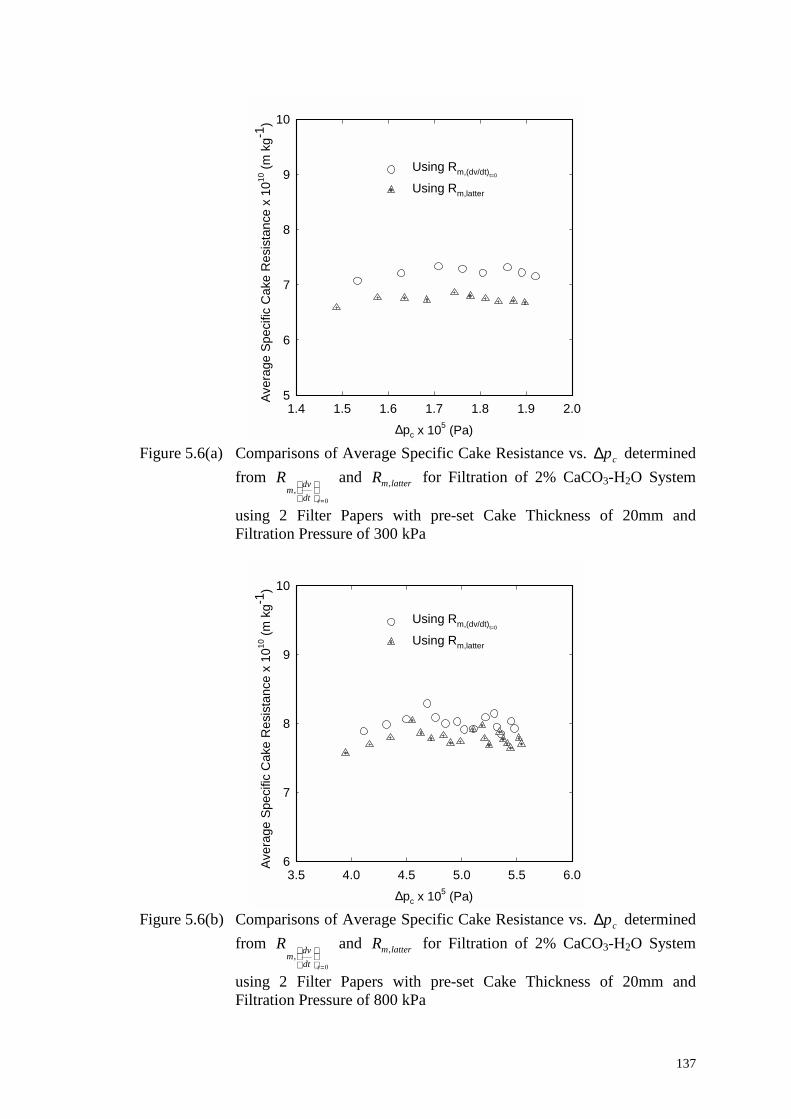
137
∆pc x 105 (Pa)
1.4 1.5 1.6 1.7 1.8 1.9 2.0
Aver
age
Spec
ific
Cak
e R
esis
tanc
e x
1010
(m k
g-1)
5
6
7
8
9
10
Using Rm,(dv/dt)t=0
Using Rm,latter
Figure 5.6(a) Comparisons of Average Specific Cake Resistance vs. cp∆ determined
from 0
,=
tdtdvm
R and lattermR , for Filtration of 2% CaCO3-H2O System
using 2 Filter Papers with pre-set Cake Thickness of 20mm and Filtration Pressure of 300 kPa
∆pc x 105 (Pa)3.5 4.0 4.5 5.0 5.5 6.0
Aver
age
Spec
ific
Cak
e R
esis
tanc
e x
1010
(m k
g-1)
6
7
8
9
10
Using Rm,(dv/dt)t=0
Using Rm,latter
Figure 5.6(b) Comparisons of Average Specific Cake Resistance vs. cp∆ determined
from 0
,=
tdtdvm
R and lattermR , for Filtration of 2% CaCO3-H2O System
using 2 Filter Papers with pre-set Cake Thickness of 20mm and Filtration Pressure of 800 kPa
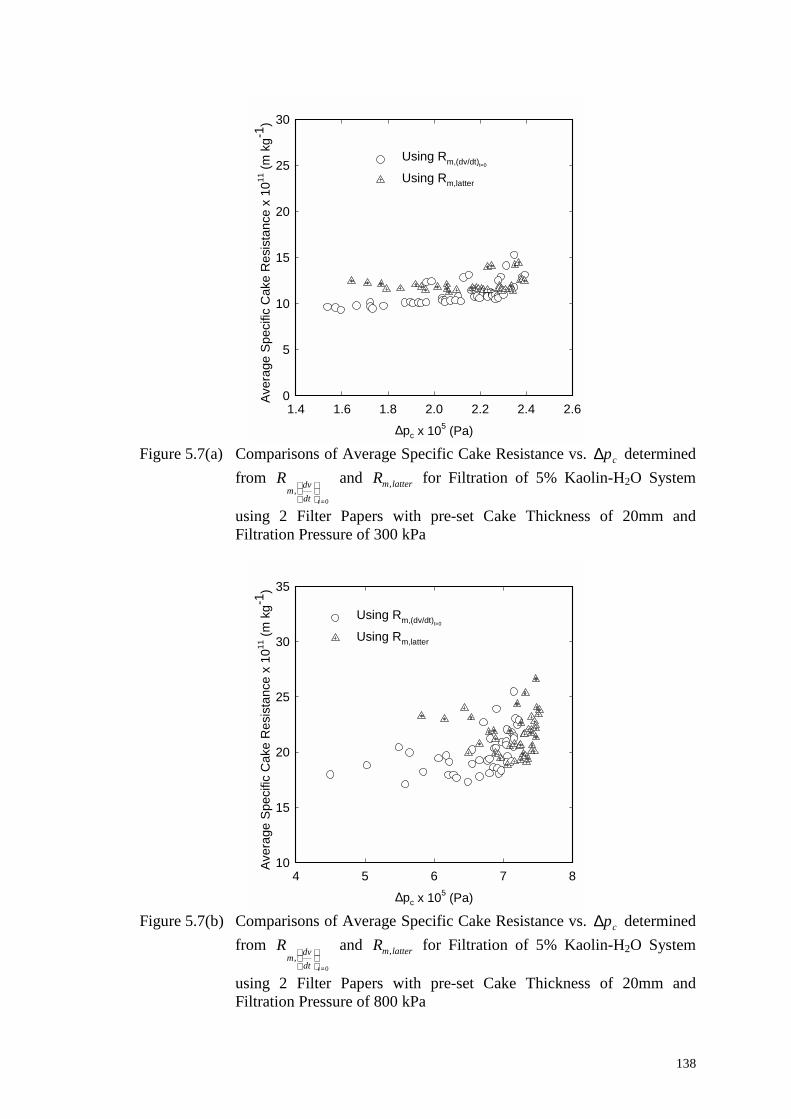
138
∆pc x 105 (Pa)
1.4 1.6 1.8 2.0 2.2 2.4 2.6
Aver
age
Spec
ific
Cak
e R
esis
tanc
e x
1011
(m k
g-1)
0
5
10
15
20
25
30
Using Rm,(dv/dt)t=0
Using Rm,latter
Figure 5.7(a) Comparisons of Average Specific Cake Resistance vs. cp∆ determined
from 0
,=
tdtdvm
R and lattermR , for Filtration of 5% Kaolin-H2O System
using 2 Filter Papers with pre-set Cake Thickness of 20mm and Filtration Pressure of 300 kPa
∆pc x 105 (Pa)
4 5 6 7 8
Aver
age
Spec
ific
Cak
e R
esis
tanc
e x
1011
(m k
g-1)
10
15
20
25
30
35
Using Rm,(dv/dt)t=0
Using Rm,latter
Figure 5.7(b) Comparisons of Average Specific Cake Resistance vs. cp∆ determined
from 0
,=
tdtdvm
R and lattermR , for Filtration of 5% Kaolin-H2O System
using 2 Filter Papers with pre-set Cake Thickness of 20mm and Filtration Pressure of 800 kPa
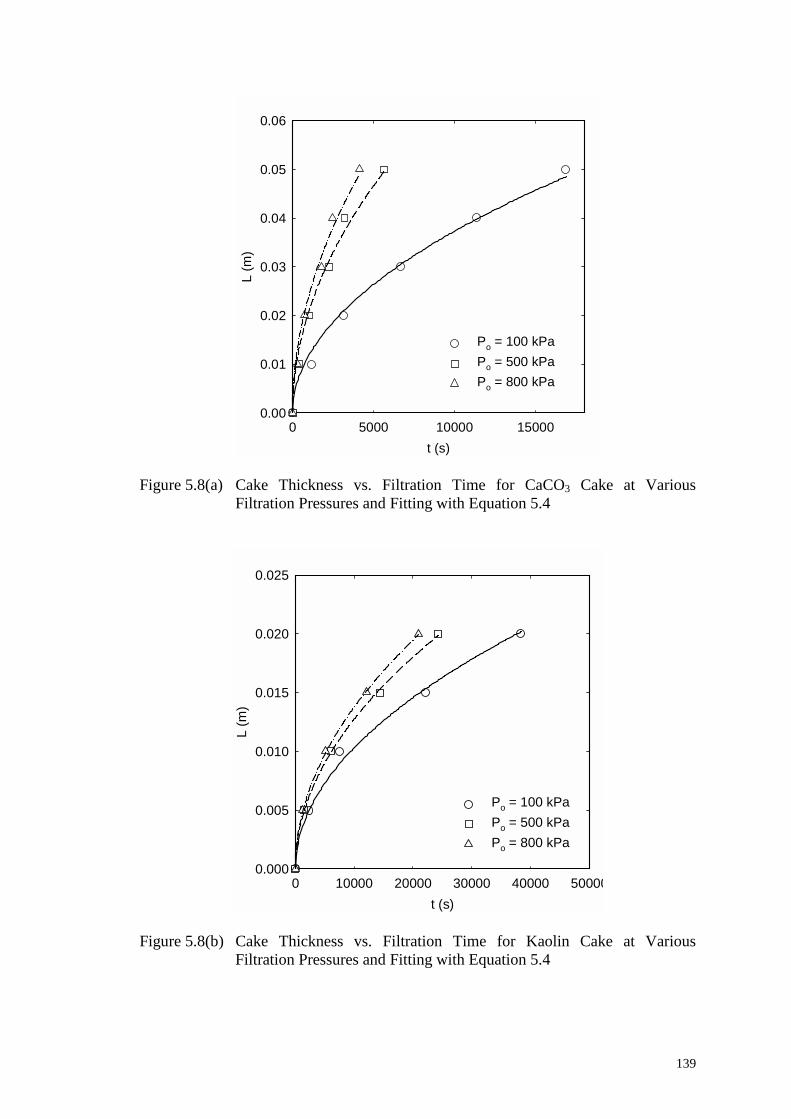
139
t (s)0 5000 10000 15000
L (m
)
0.00
0.01
0.02
0.03
0.04
0.05
0.06
Po = 100 kPaPo = 500 kPaPo = 800 kPa
Figure 5.8(a) Cake Thickness vs. Filtration Time for CaCO3 Cake at Various
Filtration Pressures and Fitting with Equation 5.4
t (s)0 10000 20000 30000 40000 50000
L (m
)
0.000
0.005
0.010
0.015
0.020
0.025
Po = 100 kPaPo = 500 kPaPo = 800 kPa
Figure 5.8(b) Cake Thickness vs. Filtration Time for Kaolin Cake at Various
Filtration Pressures and Fitting with Equation 5.4
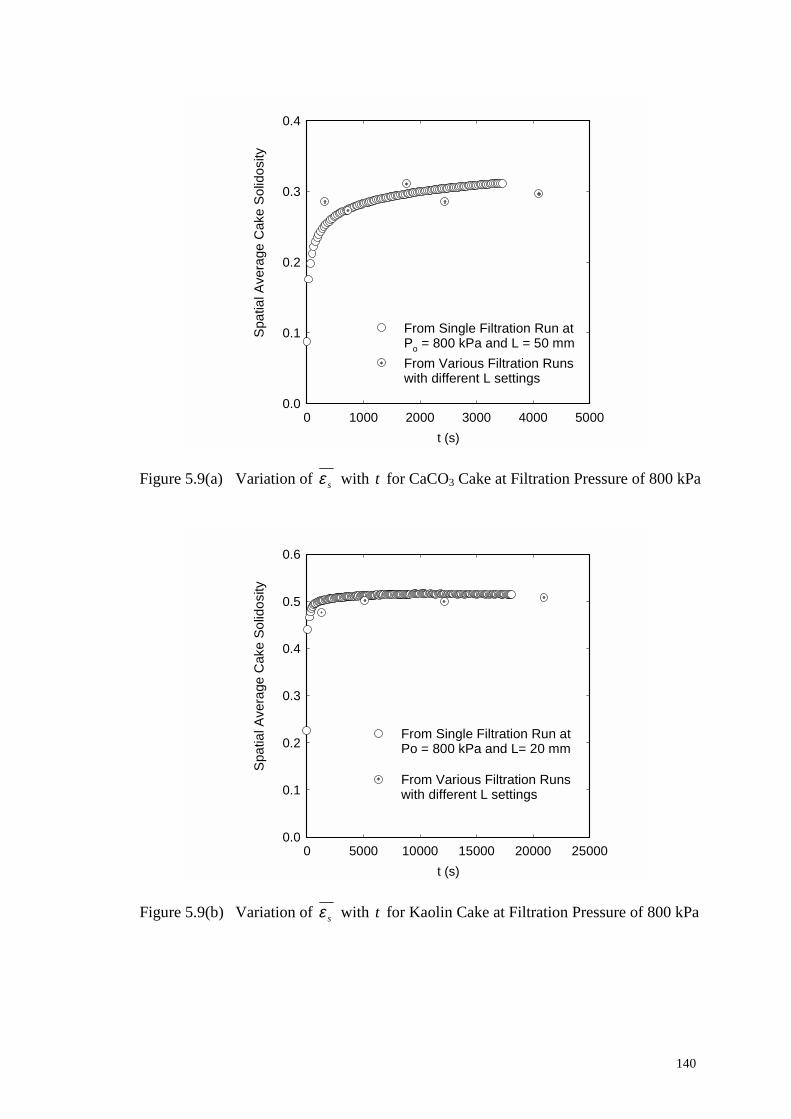
140
t (s)0 1000 2000 3000 4000 5000
Spat
ial A
vera
ge C
ake
Solid
osity
0.0
0.1
0.2
0.3
0.4
From Single Filtration Run atPo = 800 kPa and L = 50 mmFrom Various Filtration Runs with different L settings
Figure 5.9(a) Variation of sε with t for CaCO3 Cake at Filtration Pressure of 800 kPa
t (s)0 5000 10000 15000 20000 25000
Spat
ial A
vera
ge C
ake
Solid
osity
0.0
0.1
0.2
0.3
0.4
0.5
0.6
From Single Filtration Run atPo = 800 kPa and L= 20 mm
From Various Filtration Runswith different L settings
Figure 5.9(b) Variation of sε with t for Kaolin Cake at Filtration Pressure of 800 kPa
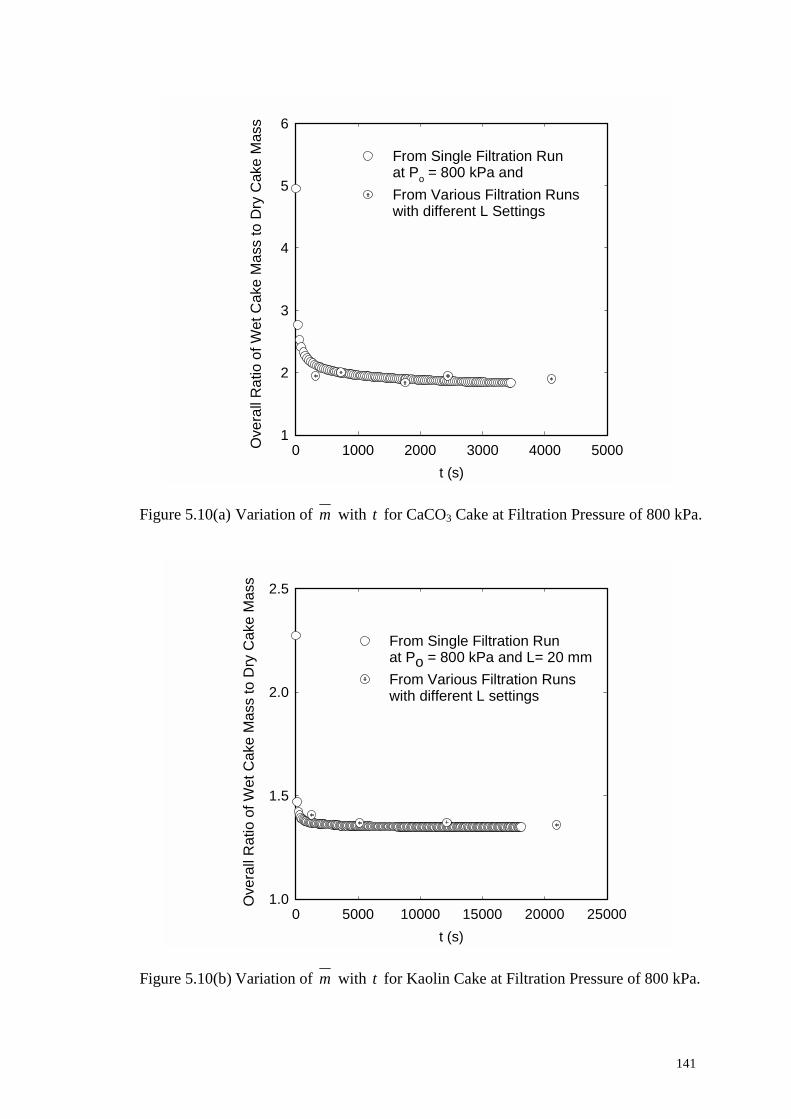
141
t (s)0 1000 2000 3000 4000 5000O
vera
ll R
atio
of W
et C
ake
Mas
s to
Dry
Cak
e M
ass
1
2
3
4
5
6
From Single Filtration Runat Po = 800 kPa andFrom Various Filtration Runswith different L Settings
Figure 5.10(a) Variation of m with t for CaCO3 Cake at Filtration Pressure of 800 kPa.
t (s)0 5000 10000 15000 20000 25000
Ove
rall
Rat
io o
f Wet
Cak
e M
ass
to D
ry C
ake
Mas
s
1.0
1.5
2.0
2.5
From Single Filtration Run at Po = 800 kPa and L= 20 mmFrom Various Filtration Runswith different L settings
Figure 5.10(b) Variation of m with t for Kaolin Cake at Filtration Pressure of 800 kPa.
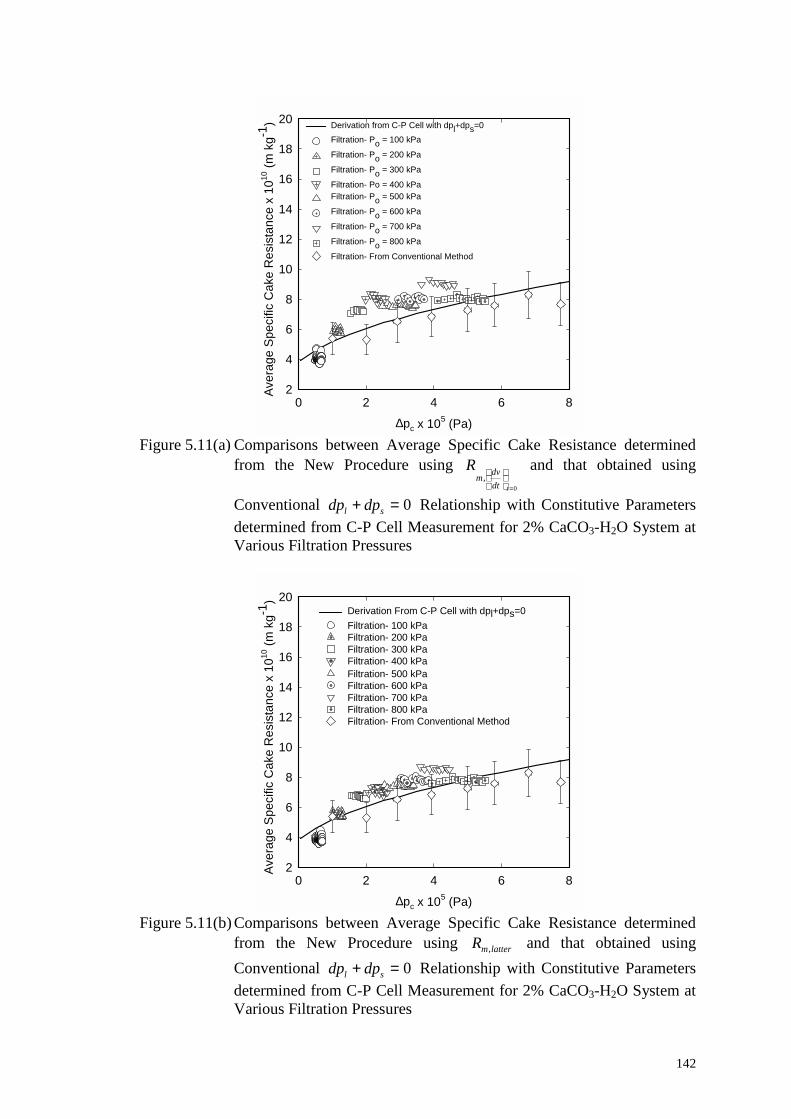
142
∆pc x 105 (Pa)
0 2 4 6 8
Aver
age
Spec
ific
Cak
e R
esis
tanc
e x
1010
(m k
g-1)
2
4
6
8
10
12
14
16
18
20 Derivation from C-P Cell with dpl+dps=0Filtration- Po = 100 kPa
Filtration- Po = 200 kPa
Filtration- Po = 300 kPa
Filtration- Po = 400 kPaFiltration- Po = 500 kPa
Filtration- Po = 600 kPa
Filtration- Po = 700 kPa
Filtration- Po = 800 kPa
Filtration- From Conventional Method
Figure 5.11(a) Comparisons between Average Specific Cake Resistance determined
from the New Procedure using 0
,=
tdtdvm
R and that obtained using
Conventional 0=+ sl dpdp Relationship with Constitutive Parameters determined from C-P Cell Measurement for 2% CaCO3-H2O System at Various Filtration Pressures
∆pc x 105 (Pa)
0 2 4 6 8
Aver
age
Spec
ific
Cak
e R
esis
tanc
e x
1010
(m k
g-1)
2
4
6
8
10
12
14
16
18
20Derivation From C-P Cell with dpl+dps=0Filtration- 100 kPaFiltration- 200 kPaFiltration- 300 kPaFiltration- 400 kPaFiltration- 500 kPaFiltration- 600 kPaFiltration- 700 kPaFiltration- 800 kPaFiltration- From Conventional Method
Figure 5.11(b) Comparisons between Average Specific Cake Resistance determined
from the New Procedure using lattermR , and that obtained using Conventional 0=+ sl dpdp Relationship with Constitutive Parameters determined from C-P Cell Measurement for 2% CaCO3-H2O System at Various Filtration Pressures
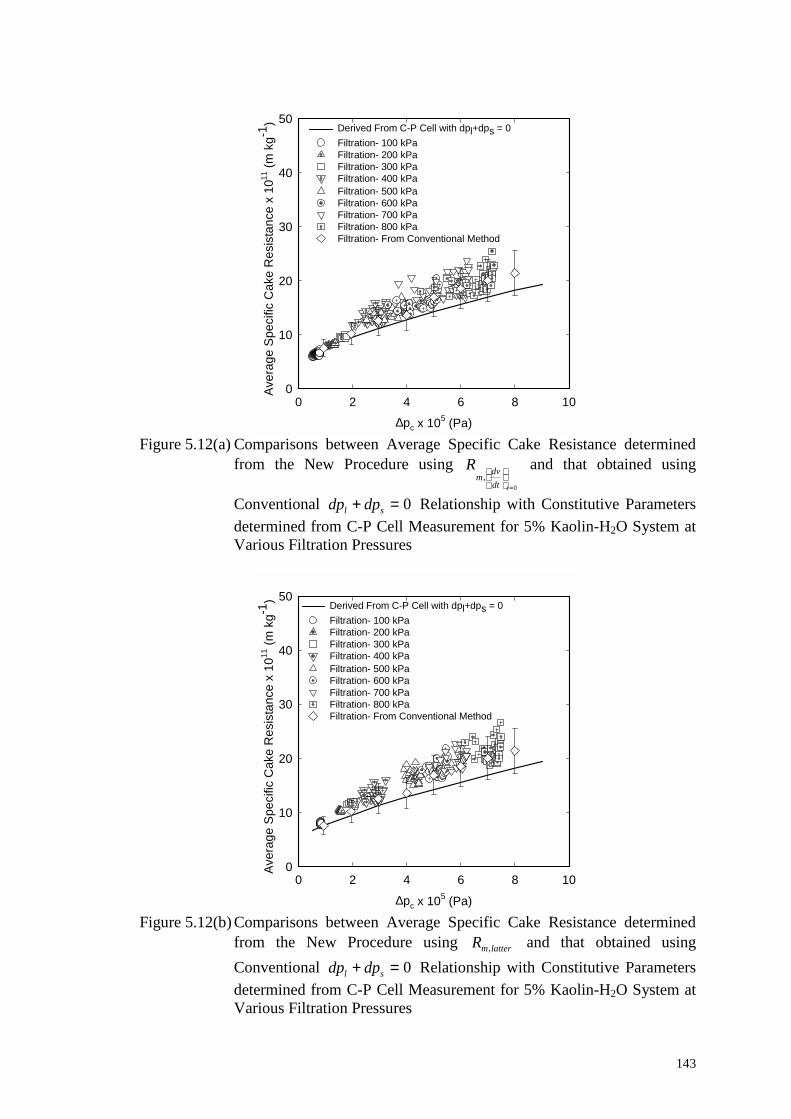
143
∆pc x 105 (Pa)
0 2 4 6 8 10
Aver
age
Spec
ific
Cak
e R
esis
tanc
e x
1011
(m k
g-1)
0
10
20
30
40
50Derived From C-P Cell with dpl+dps = 0Filtration- 100 kPaFiltration- 200 kPaFiltration- 300 kPaFiltration- 400 kPaFiltration- 500 kPaFiltration- 600 kPaFiltration- 700 kPaFiltration- 800 kPaFiltration- From Conventional Method
Figure 5.12(a) Comparisons between Average Specific Cake Resistance determined
from the New Procedure using 0
,=
tdtdvm
R and that obtained using
Conventional 0=+ sl dpdp Relationship with Constitutive Parameters determined from C-P Cell Measurement for 5% Kaolin-H2O System at Various Filtration Pressures
∆pc x 105 (Pa)
0 2 4 6 8 10
Aver
age
Spec
ific
Cak
e R
esis
tanc
e x
1011
(m k
g-1)
0
10
20
30
40
50Derived From C-P Cell with dpl+dps = 0Filtration- 100 kPaFiltration- 200 kPaFiltration- 300 kPaFiltration- 400 kPaFiltration- 500 kPaFiltration- 600 kPaFiltration- 700 kPaFiltration- 800 kPaFiltration- From Conventional Method
Figure 5.12(b) Comparisons between Average Specific Cake Resistance determined
from the New Procedure using lattermR , and that obtained using Conventional 0=+ sl dpdp Relationship with Constitutive Parameters determined from C-P Cell Measurement for 5% Kaolin-H2O System at Various Filtration Pressures
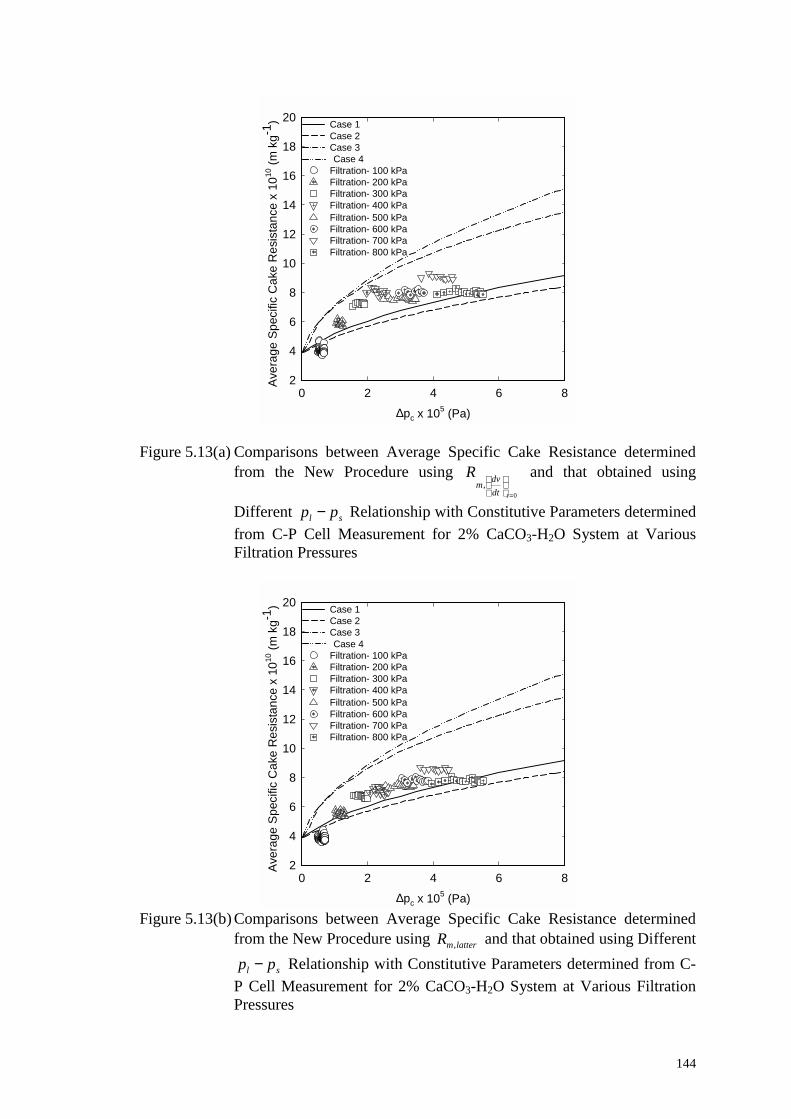
144
∆pc x 105 (Pa)
0 2 4 6 8
Aver
age
Spec
ific
Cak
e R
esis
tanc
e x
1010
(m k
g-1)
2
4
6
8
10
12
14
16
18
20 Case 1Case 2Case 3Case 4
Filtration- 100 kPaFiltration- 200 kPaFiltration- 300 kPaFiltration- 400 kPaFiltration- 500 kPaFiltration- 600 kPaFiltration- 700 kPaFiltration- 800 kPa
Figure 5.13(a) Comparisons between Average Specific Cake Resistance determined from the New Procedure using
0,
=
tdtdvm
R and that obtained using
Different sl pp − Relationship with Constitutive Parameters determined from C-P Cell Measurement for 2% CaCO3-H2O System at Various Filtration Pressures
∆pc x 105 (Pa)
0 2 4 6 8
Aver
age
Spec
ific
Cak
e R
esis
tanc
e x
1010
(m k
g-1)
2
4
6
8
10
12
14
16
18
20 Case 1Case 2Case 3Case 4
Filtration- 100 kPaFiltration- 200 kPaFiltration- 300 kPaFiltration- 400 kPaFiltration- 500 kPaFiltration- 600 kPaFiltration- 700 kPaFiltration- 800 kPa
Figure 5.13(b) Comparisons between Average Specific Cake Resistance determined
from the New Procedure using lattermR , and that obtained using Different
sl pp − Relationship with Constitutive Parameters determined from C-P Cell Measurement for 2% CaCO3-H2O System at Various Filtration Pressures
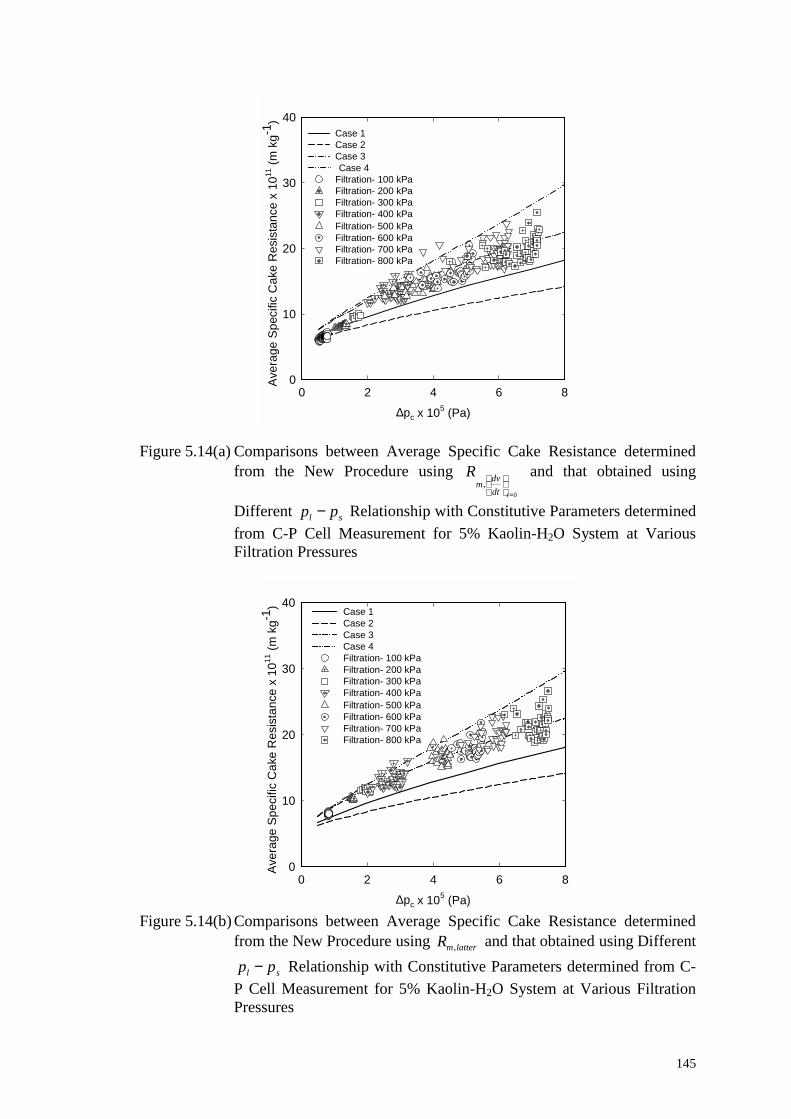
145
∆pc x 105 (Pa)
0 2 4 6 8
Aver
age
Spec
ific
Cak
e R
esis
tanc
e x
1011
(m k
g-1)
0
10
20
30
40Case 1Case 2Case 3Case 4
Filtration- 100 kPaFiltration- 200 kPaFiltration- 300 kPaFiltration- 400 kPaFiltration- 500 kPaFiltration- 600 kPaFiltration- 700 kPaFiltration- 800 kPa
Figure 5.14(a) Comparisons between Average Specific Cake Resistance determined from the New Procedure using
0,
=
tdtdvm
R and that obtained using
Different sl pp − Relationship with Constitutive Parameters determined from C-P Cell Measurement for 5% Kaolin-H2O System at Various Filtration Pressures
∆pc x 105 (Pa)
0 2 4 6 8
Aver
age
Spec
ific
Cak
e R
esis
tanc
e x
1011
(m k
g-1)
0
10
20
30
40Case 1Case 2Case 3Case 4Filtration- 100 kPaFiltration- 200 kPaFiltration- 300 kPaFiltration- 400 kPaFiltration- 500 kPaFiltration- 600 kPaFiltration- 700 kPaFiltration- 800 kPa
Figure 5.14(b) Comparisons between Average Specific Cake Resistance determined
from the New Procedure using lattermR , and that obtained using Different
sl pp − Relationship with Constitutive Parameters determined from C-P Cell Measurement for 5% Kaolin-H2O System at Various Filtration Pressures
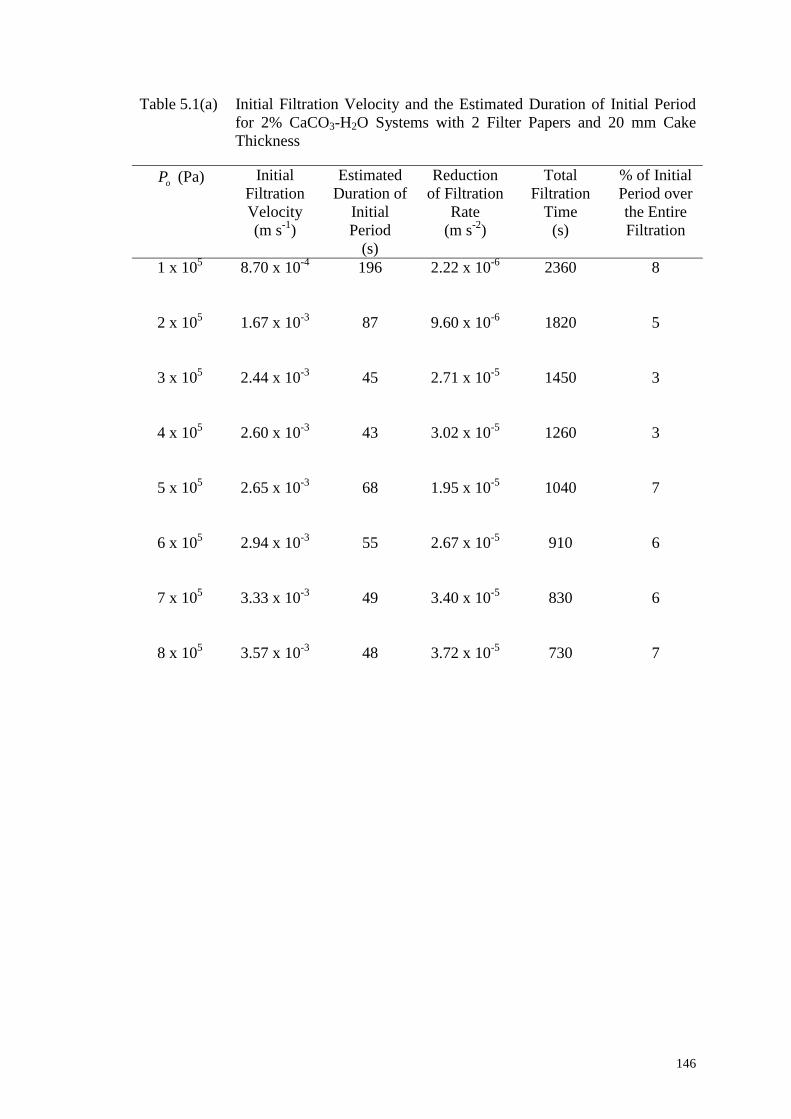
146
Table 5.1(a) Initial Filtration Velocity and the Estimated Duration of Initial Period for 2% CaCO3-H2O Systems with 2 Filter Papers and 20 mm Cake Thickness
oP (Pa) Initial Filtration Velocity (m s-1)
Estimated Duration of
Initial Period
(s)
Reduction of Filtration
Rate (m s-2)
Total Filtration
Time (s)
% of Initial Period over the Entire Filtration
1 x 10⁵ 8.70 x 10⁻⁴
196
2.22 x 10⁻⁶ 2360
8
2 x 10⁵ 1.67 x 10⁻³ 87
9.60 x 10⁻⁶ 1820 5
3 x 10⁵ 2.44 x 10⁻³ 45
2.71 x 10⁻⁵ 1450
3
4 x 10⁵ 2.60 x 10⁻³ 43
3.02 x 10⁻⁵ 1260
3
5 x 10⁵ 2.65 x 10⁻³
68
1.95 x 10⁻⁵ 1040 7
6 x 10⁵ 2.94 x 10⁻³ 55
2.67 x 10⁻⁵ 910 6
7 x 10⁵ 3.33 x 10⁻³ 49
3.40 x 10⁻⁵ 830
6
8 x 10⁵ 3.57 x 10⁻³
48
3.72 x 10⁻⁵ 730
7
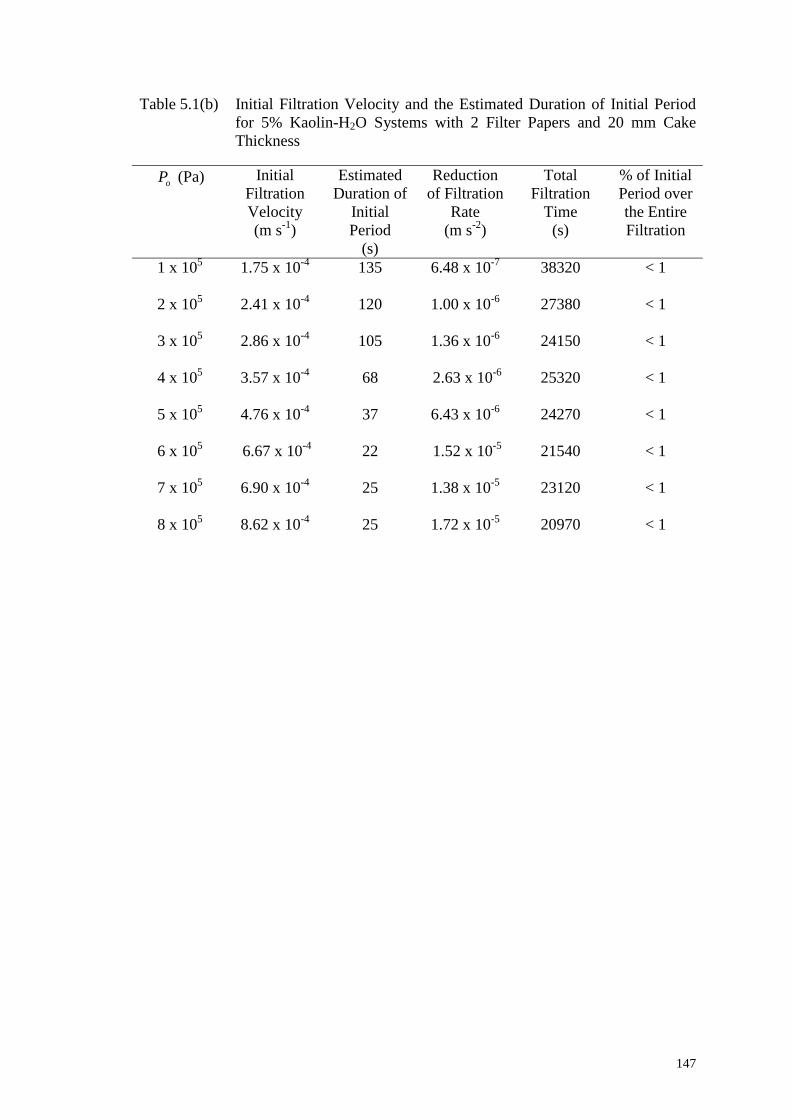
147
Table 5.1(b) Initial Filtration Velocity and the Estimated Duration of Initial Period for 5% Kaolin-H2O Systems with 2 Filter Papers and 20 mm Cake Thickness
oP (Pa) Initial Filtration Velocity (m s-1)
Estimated Duration of
Initial Period
(s)
Reduction of Filtration
Rate (m s-2)
Total Filtration
Time (s)
% of Initial Period over the Entire Filtration
1 x 10⁵ 1.75 x 10⁻⁴ 135 6.48 x 10⁻⁷ 38320 < 1
2 x 10⁵ 2.41 x 10⁻⁴
120 1.00 x 10⁻⁶ 27380 < 1
3 x 10⁵ 2.86 x 10⁻⁴
105 1.36 x 10⁻⁶ 24150 < 1
4 x 10⁵ 3.57 x 10⁻⁴ 68 2.63 x 10⁻⁶ 25320 < 1
5 x 10⁵ 4.76 x 10⁻⁴
37 6.43 x 10⁻⁶ 24270 < 1
6 x 10⁵ 6.67 x 10⁻⁴ 22 1.52 x 10⁻⁵ 21540 < 1
7 x 10⁵ 6.90 x 10⁻⁴
25
1.38 x 10⁻⁵ 23120 < 1
8 x 10⁵ 8.62 x 10⁻⁴
25 1.72 x 10⁻⁵ 20970 < 1
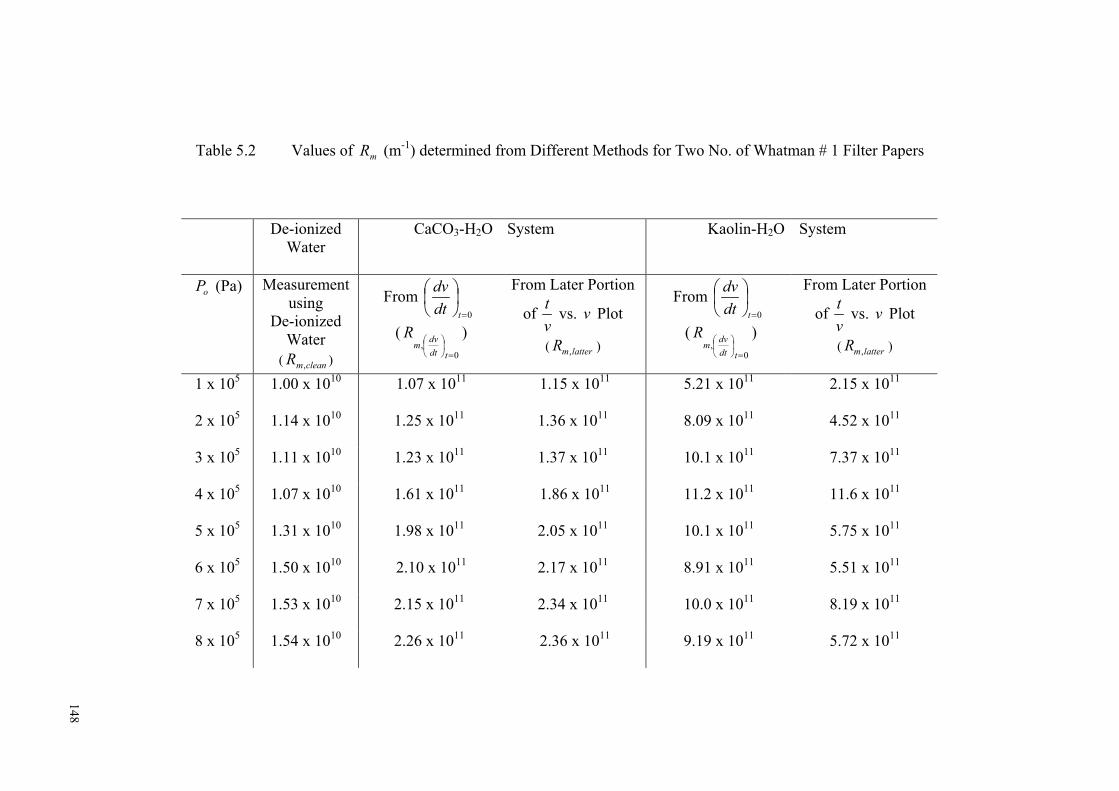
Table 5.2 Values of (mmR-1) determined from Different Methods for Two No. of Whatman # 1 Filter Papers
De-ionized Water
CaCO3-H2O
System Kaolin-H2O
System
oP (Pa) Measurement using
De-ionized Water R( ) cleanm,
From 0=
tdtdv
(0
,=
tdtdvm
R )
From Later Portion
of vt vs. Plot v
( ) lattermR ,
From 0=
tdtdv
(0
,=
tdtdvm
R )
From Later Portion
of vt vs. Plot v
( ) lattermR ,
1 x 10⁵ 1.00 x 10¹⁰ 1.07 x 10¹¹ 1.15 x 10¹¹ 5.21 x 10¹¹ 2.15 x 10¹¹
2 x 10⁵ 1.14 x 10¹⁰ 1.25 x 10¹¹ 1.36 x 10¹¹ 8.09 x 10¹¹ 4.52 x 10¹¹
3 x 10⁵ 1.11 x 10¹⁰ 1.23 x 10¹¹ 1.37 x 10¹¹ 10.1 x 10¹¹ 7.37 x 10¹¹
4 x 10⁵ 1.07 x 10¹⁰ 1.61 x 10¹¹ 1.86 x 10¹¹ 11.2 x 10¹¹ 11.6 x 10¹¹
5 x 10⁵ 1.31 x 10¹⁰ 1.98 x 10¹¹ 2.05 x 10¹¹ 10.1 x 10¹¹ 5.75 x 10¹¹
6 x 10⁵ 1.50 x 10¹⁰ 2.10 x 10¹¹ 2.17 x 10¹¹ 8.91 x 10¹¹ 5.51 x 10¹¹
7 x 10⁵ 1.53 x 10¹⁰ 2.15 x 10¹¹ 2.34 x 10¹¹ 10.0 x 10¹¹ 8.19 x 10¹¹
8 x 10⁵ 1.54 x 10¹⁰ 2.26 x 10¹¹ 2.36 x 10¹¹ 9.19 x 10¹¹ 5.72 x 10¹¹
148
149
CHAPTER 6
CONCLUSIONS AND RECOMMENDATIONS FOR
FUTURE WORK
A new multifunction test cell has been developed from a commercial
computer-controlled universal precision testing machine typically used for measuring
the mechanical strength characteristics of materials. The unique feature of this new
multifunction test cell is that it can be used as a C-P cell as well as a variable volume
filtration chamber. This enables a direct comparison and correlation of the C-P cell test
where the effective compressive pressure exerts only onto the solid particles in the pre-
formed cake until an equilibrium condition or thickness is reached before de-ionized
water is allowed to permeate through the cake, and the filtration test which is a time-
dependent and dynamic process.
The conversion between C-P and filtration test is by simply replacing an
interchangeable insert plate at the bottom of upper piston. As a whole, the new
multifunction test device can be considered as a convenient all-in-one package
solution for cake filtration studies as it consists of a stainless steel test cell with
computerized load frame and testing system, on-line data capture software and
peripherals. It allows precise setting of operating parameters such as applied load and
vertical travel of upper piston through the use of function keys on an easy-operated
one-touch control panel. Data on cake filtration rate, average specific resistance,
porosity and wet cake to dry cake mass ratio can be obtained without the need for cake
drying.
150
The magnitude of sidewall friction can be accounted for. The effective solid
compressive stress could be determined by measuring the lower load and calculated
from a simple equation which relates the lower load (or transmitted pressure) and the
applied mechanical pressure (Equation 2.49) derived by Lu et al. (1998). Using this
method, the magnitude of wall friction was found to be more than 15% even for a cake
DL ratio of less than 0.2 and this is consistent with what has been reported by other
researchers in recent years. Since the stress at cell side wall was not measured directly,
it may be worthwhile to conduct a complete study and analysis of the wall friction
using this new multifunction test cell in future research.
In this work, error analysis and comparisons of data with other researchers
have been carried out and this verified that the experimental data generated from this
new multifunction test cell is within experimental error and acceptable limits. The data
generated was used to form constitutive equations (in power law form), from which
the average values of the cake properties were determined. From the experimental
results obtained from four cake materials with various compressibilities (CaCO3,
Kaolin, TiO2 and Kromasil), this new multifunction test cell is able to predict
reasonably well the actual filtration process from the C-P test data within pressure
range of 100 to 800 kPa. The constitutive parameters determined from the non-linear
regression of C-P data could also be used in various filtration models to predict the
behavior of filtration process.
The analysis of cake filtration and the application of C-P cell measurements for
the prediction of cake filtration performance requires the knowledge of the relationship
between the pore liquid pressure, lp and cake phase compressive stress, sp .
However, this relationship is commonly assumed to be 0=+ sl dpdp or
=+ sl pp constant (Case 1) without further question and investigation. The
151
conventional parabolic law of constant pressure filtration has been derived on the basis
of this relationship. By defining a generalized specific cake resistance in this work, i.e.
m
ms
m
ms
ssss
p
o
scpav
pdpfk
pp
/])')(([
]/[][
−
∆=
∫ ρεα (Equation 4.23), the parabolic law was
extended to other types of sl pp − relationships derived from multi-phase flow
theory:
Case 2: 0)1( =+− sls dpdpε (6.1)
Case 3: 0)1( =+− ssls dpdp εε (6.2)
Case 4: [ ] 0][)1( =+− ssls pdpd εε (6.3)
The conventional filtration equation was re-derived in a manner to manifest the
effect of the lp – sp relationship on cake filtration analysis with the following
assumptions:
(1) The solid (particle) velocity is negligible (for dilute slurry).
(2) The moving boundary effect of the suspension-cake interface can be ignored.
(3) Darcy’s Law can be used to estimate liquid flow rate.
(4) The relevant cake properties, i.e. the solidosity and permeability are functions
of the compressive stress only.
According to Equation (4.23), the sl pp − relationship is required in the
estimation of the average specific cake resistance from the cake constitutive equations.
In this study, four types of cakes with different compressibility were used for the
analysis. Average specific cake resistance calculated based on the same cake
constitutive relationship was found to vary significantly with the sl pp − relationship
used. For material with lower to moderate compressibilty ( =n 0.32 - 0.51), for
152
instance Kromasil, CaCO3 and TiO2, Case 2 gives a better agreement. For material
with a higher compressibility ( =n 0.85), for example Kaolin, the better agreement lies
with Case 3. The use of sl pp − relationship to yield a better correlation with actual
filtration data was observed to be system specific as well as dependent on the cake
compressibility.
At this moment, the data presented to derive a proper selection of sl pp −
relationship is limited only to the few material systems in study. The commonly used
scale-up procedure based on the conventional parabolic law remains valid provided its
limitations are properly recognized. Nevertheless, the role of porosity in sl pp −
relationship and the effect of cake compressibility on the sl pp − relationship for cake
filtration analysis have been explored and speculated. For future work, it may be
worthwhile to extend the study to more types of material in order to establish a wider
spectrum of cake compressibility. A rational rule is yet to be established for a proper
selection of the sl pp − relationship which is more consistent with the compression
load used in forming cakes in the C-P cell measurements.
In the conventional approach, only an average specific cake resistance can be
determined from the slope of vt vs. v plot, which is approximated to be linear,
corresponding to a compressive stress equals to the operating pressure ( os Pp ≈ ) for
each filtration run. The filtration data generated from the new multifunction test cell
showed that the vt vs. v plot is not entirely linear and non-parabolic behaviour exists
in the initial filtration stage. Based on the steepest reduction in filtration velocity, the
initial filtration period may be defined as the time up to the point when the filtration
velocity drops to approximately half of its initial value or the pressure drop across the
153
cake raises to about 50% of the filtration pressure. The analysis also revealed that the
filtration data could be approximately divided into two segments, corresponding to the
initial and latter period of filtration.
The effect of initial filtration phase on the non-parabolic behaviour of tv −
data was due to septum resistance as the septum resistance was observed to increase
dramatically from its intrinsic value to a higher value when the solid particles are first
in contact with the filter medium. mR could be determined from a few methods using
clean de-ionized water or through filtration tests. There are inherent difficulties
associated with the determination of mR values from filtration test due to inaccurate
data involved in the short initial filtration period, and errors arise in data
differentiation and extrapolation. The use of different mR values would affect the
determination of average specific cake resistance. Values of mR were found to differ
from one material system to another. Future study on the determination of specific
mechanism responsible for the effect of mR for each type of material is recommended
as it requires a detailed analysis of the particle penetration into medium, blocking of
pore or compression of medium.
In the conventional approach, the filtration resistance and the mass ratio of wet
cake to dry cake were assumed to be constant. From the re-derivation of the
conventional parabolic equation, both of these parameters were shown to vary with
filtration time or filtrate volume. In view of this and the existence of an initial filtration
period, a new method was proposed to interpret the constant pressure filtration data
from the conventional filtration equation. The new procedure is developed based on
the pressure drop across a cake increases as a function of time with oP as its
asymptotic value in a filtration run. The new method is able to provide more detailed
154
information about the filter cake characteristics - for instance the profiles of cake
pressure drop, spatial average cake solidosity, ratio of wet cake mass to dry cake mass
and average specific cake resistance from a single filtration run over a range of solid
compressive stress. This enables the determination of a more accurate constitutive
relationship between average specific cake resistance and solid compressive stress
from the filtration data.
As there are inevitable errors associated with differentiating v versus t data,
there were fluctuations in the early and final portion of the data and hence in the
derived results of average specific cake resistance. This drawback only allows the
determination of average specific cake resistance for a short range of pressure drop
across the cake. It may be useful to further analyse the filtration transition and end
phases so that the limitation in the new method may be better understood and
eventually overcome.
Using the new multifunction test cell, further research could be extended to
study the filtration performance and behaviour of deformable and swelling particles
(for example Sephadex), the effect of particle-particle interaction on cake structure,
properties and cake compaction during filtration. In future studies, the new method of
analysis could be used to generate detailed information of a wide range of material
systems to establish a proper selection of the relationship between pore liquid pressure
and cake compressive stress on cake filtration analysis.
155
REFERENCES
• Baird, R. L. and, M. G. Perry. The Distribution of Porosity in Filter Cakes,
Filtration and Separation, 4, pp. 471-476, 1967.
• Brown, J. C. Jr. Determination of Exposed Specific Surface of Pulp Fibers
from Air Permeability Measurements, TAPPI, 33, pp. 130, 1950.
• Brownell, L. E. and D. L Katz. Flow of Fluids through Porous Media, I. Single
Homogeneous Fluids, Chem. Eng. Prog., 43, No. 10, pp. 537-548. 1947.
• Carman, P. C. Fluid Flow through Granular Beds, Trans. IChemE, 15, pp. 150-
166. 1937.
• Carman, P. C. Fundamental Principles of Industrial Filtration (A Critical
Review of Present Knowledge), Trans. IChemE, 16, pp. 168-188. 1938.
• Chen, C. Y. Filtration of Aerosols by Fibrous Media, Chem. Rev., 55, pp. 595.
1955.
• Chase, G. G., J. Arconti and I. Kanel. The Effect of Filter Cakes on Filter
Medium Resistance, Sep. Sci. & Tech., 29, No. 16, pp. 2179-2196. 1994.
• Christensen, G. Lee and R. I. Dick. Specific Resistance Measurements:
Nonparabolic Data, J. Environ. Eng., 111, No. 3, pp. 243-257. 1985a.
• Christensen, G. Lee and R. I. Dick. Specific Resistance Measurements:
Methods and Procedures, J. Environ. Eng., 111, No. 3, pp. 258-271. 1985b.
• Darcy H. P. G. Les Fontaines Publiques de la Ville de Dijon. Dalamont, Paris.
1856.
• Davies, C. N. The Separation of Airborne Dust and Particles, Proc. Inst. Mech.
Eng. (London), B1, pp. 185. 1952.
156
• Dullien, F. A. L. Porous Media-Fluid Transport and Pore Structure. San Diego:
Academic Press. 1992.
• Fang C. H. Stress Distribution in a Confined Cake in the Compression-
Permeability Cell and Its Application. M. S. Thesis. National Taiwan
University. 1996.
• Fathi-Najafi M. and H. Theliander. Determination of Local Filtration Properties
at Constant Pressure, Separation Technology, 5, Issue 3, pp. 165-178, 1995.
• Grace, H. P. Resistance and Compressibility of Filter Cakes, Chem. Eng. Prog.,
49, No. 6, Part I, pp. 303-318, 1953a.
• Grace, H. P. Resistance and Compressibility of Filter Cakes, Chem. Eng. Prog.,
49, No. 7, Part II, pp. 367-377, 1953b.
• Grace, H. P. Structure and Performance of Filter Media, AIChE J., 2, No. 3, pp.
307-336, 1956.
• Happel, J. and H. Brenner. Low Reynolds’s Number Hydrodynamics with
Special Application to Particulate Media. New York: Prentice-Hall, Englewood
Cliffs. 1965.
• Haynes, S. Ph. D. Thesis. University of Houston. Texas, USA. 1966.
• Heertjes, P. M. Studies in filtration- the Initial Stages of the Cake Filtration.
Chem. Eng. Sci., 6, pp. 269-276. 1957.
• Hoffing, E. H. and F. J. Lockhart. Resistance to Filtration. Chem. Eng. Prog.
47, No. 1. pp. 3. 1951.
• Huang Y. P. The Determination of the Cake Characteristics and Its
Application. Ph.D Thesis. National Taiwan University. 1998.
• Ingmanson, W. L. Filtration Resistance of Compressible Materials, Chem. Eng.
157
Prog., 49, No. 11, pp. 577-584. 1953.
• Ingmanson, W. L., B. D. Andrews and R. C. Johnson. Internal Pressure
Distribution in Compressible Mats under Fluid Stress. TAPPI, 42, pp. 840.
1959.
• Jackson, G. W. and D. F. James. The Permeability of Fibrous Porous Media,
Can. J. Chem. Eng., 64, pp. 364-372. 1986.
• Koenders, M. A. and R. J. Wakeman. The Initial Stages of Compact Formation
from Suspensions by Filtration, Chem. Eng. Sci., 51, No. 16, pp. 3897-3908.
1996.
• Koenders, M. A. and R. J. Wakeman. Filter Cake Formation from Structured
Suspensions, Trans. IChemE, 75, Part A, pp. 309-320. 1997a.
• Koenders, M. A. and R. J. Wakeman. Initial Deposition of Interacting Particles
by Filtration of Dilute Suspensions, AIChE J., 43, No. 4, pp. 946-958. 1997b.
• Kottwitz, F. A. and D. R. Boylan. Prediction of Resistance in Constant-
Pressure Cake Filtration, AIChE J., 4, No. 2, pp. 175-180. 1958.
• Kozeny, J. Uber kapillare Leitung des Wassers im Boden. Sitzungsber. Akad
Wiss. Wien, 136, pp. 271-306. 1927.
• Lu, W., F. M. Tiller, F. Cheng and C. Chien. A New Method to Determine
Local Porosity and Filtration Resistance of Filter Cakes, J. Chinese Inst. Chem.
Engrs, 1, pp. 45-53. 1970.
• Lu, W. and K. Hwang. Mechanism of Cake Formation in Constant Pressure
Filtrations, Sep. Tech., 3, July, pp. 122-132. 1993.
• Lu, W. M. Theoretical and Experimental Analysis of Variable Pressure
Filtration and the Effect of Side Wall Friction in Compression-Permeability
158
Cell. Ph.D. Thesis, University of Houston, Texas, 1968.
• Lu, W. M., Y. P. Huang, C. Fang and J. S. Huang, An Analysis of Average
Stress within Filter Cakes in the Compression-permeability Cell. In
Proceedings Symposium on Transport Phenomena and Applications (Chinese),
Dec. 1995, Taipei, pp.551-556.
• Lu, W., Y. Huang and K. Hwang. Stress Distribution in a Confined Wet Cake
in the Compression-Permeability Cell and Its Application, Powder Technology,
97, pp. 16-25. 1998.
• Meeten, G. H., Septum and Filtration Properties of Rigid and Deformable
Particle Suspensions, Chem. Eng. Sci., 55, pp. 1755-1767. 2000.
• Murase, T., E. Iritani, J. H. Cho, S. Nakanomori and M. Shirato. Determination
of Filtration Characteristics Due To Sudden Reduction in Filtration Area of
Filter Cake Surface, J. Chem. Eng. (Japan), 20, No. 3, pp. 246-251. 1987.
• Muskat, M and R. D. Wyckoff. The Flow of Homogeneous Fluid through
Porous Media. In International Series in Physics, New York: McGraw-Hill,
1946.
• Mydlarz, J. and A. G. Jones. Continuous Crystallization and Subsequent Solid-
Liquid Separation of Potassium Sulphate. Part II: Slurry Filterability, Chem.
Eng. Res. Des., 67, pp. 294-299. 1989.
• Okamura, S. and M. Shirato. On the Ruth's Coefficient of Constant-Pressure
Filtration: Filtration of Slurries for Ignition Plugs. J. Chem. Eng. (Japan), 18,
pp. 59. 1954.
• Okamura, S. and M. Shirato. Hydraulic Pressure Distribution within Cakes in
the Constant Pressure Filtration. J. Chem. Eng. (Japan), 19, pp. 104. 1955.
159
• Orr, C. and J. M. D. Valle. Fine Particle Measurement, Size, Surface and Pore
Volume, New York: McMillan, 1959.
• Payatakes, A. C., C. Tien and R. Turian. A New Model for Granular Porous
Media: I. Model Formulation. AIChE J., 19, No. 1, pp. 58. 1973.
• Philip, J. R. Flow in Porous Media. Ann. Rev. of Fluid Mech., 2, 1970.
• Poiseuille, J. L. Compte Rendus, 11, pp. 961 & 1041, 1840.
• Rajagopalan, R. and C. Tien. Trajectory Analysis of Deep-bed Filtration with
the Sphere In-Cell Porous Media Model. AIChE J., 22, No.3, pp. 523. 1976.
• Rawling, F. L. Jr. Ph.D. Thesis, Iowa State University, Ames, Iowa. 1964
• Rietema, K. Stabilizing Effects in Compressible Filter Cakes, Chem. Eng. Sci.,
2, pp. 88-94. 1953.
• Rietema, K. Science and Technology of Dispersed Two-Phase Systems I and II,
Chem. Eng. Sci., 37, 1125-1150. 1982.
• Risbud, H. M. Ph.D. Thesis, University of Houston, Texas, USA, 1974.
• Ruth, B. F. Studies in Filtration: III. Derivation of General Filtration Equations,
Ind. Eng. Chem., 27, No. 6, pp. 708-723. 1935.
• Ruth, B. F. Correlating Filtration Theory with Industrial Practice, Ind. Eng.
Chem., 38, No. 6, pp. 564-571. 1946.
• Ruth, B. F, G. H. Montillon and R. E. Montonna. Studies in Filtration II.
Fundamental Axiom of Constant Pressure Filtration, Ind. Eng. Chem., 25, No.
2, pp. 153-161. 1933.
• Scheidegger, A. E. The Physics of Flow Through Porous Media. University of
Toronto Press. 1974.
• Shirato, M., M. Sambuichi, H. Kato and T. Aragaki. Internal Flow Mechanism
160
in Filter Cake. AIChE J., 15, No. 3, pp. 405-409. 1969.
• Shirato, M., T.Aragaki, K.Ichimura and N.Ootsuji. Porosity Variation in Filter
Cake under Constant-pressure Filtration, J. Chem. Eng.(Japan), 4, pp.172-177,
1971.
• Shirato, M., T.Aragaki, R.Mori and K.Sawamoto. Predictions of Constant
Pressure and Constant Rate Filtrations based upon an Approximate Correction
for Side Wall Friction in Compression Permeability Cell Data, J. Chem.
Eng.(Japan), 1, pp.86-90, 1968.
• Shirato, M., T. Murase, H. Kato and F. Shigeo. Fundamentals Analysis for
Expression Under Constant Pressure. Filtration & Separation, 7, pp. 277. 1970.
• Stamatakis, K. and C. Tien. Cake Formation and Growth in Cake Filtration,
Chem. Eng. Sci., 46, No. 8, pp. 1917-1933. 1991.
• Sullivan, R. R. Specific Surface Measurements on Compact Bundles of Parallel
Fibers. J. Appl. Phy., 13, pp. 725. 1942.
• Svarovsky, L. Filtration Fundamentals. In Solid-liquid Separation. Chapter 9,
Ed. 2, ed. by L. Svarovsky, pp. 242-264. London: Butterworths Monographs in
Chemistry and Chemical Engineering. 1981.
• Theliander, H. and M. Fathi-Najafi. Simulation of the Build-up of a Filter
Cake, Filtration & Separation, 33, Issue 5, pp. 417-420, 1996.
• Tiller, F. M. The Role of Porosity in Filtration, Part I: Numerical Methods for
Constant Rate and Constant Pressure Filtration based on Kozeny’s Law, Chem.
Eng. Prog., 49, No. 9, pp. 467-479. 1953.
• Tiller, F. M., The Role of Porosity in Filtration, Part II: Analytical Equations
for Constant Rate Filtration, Chem. Eng. Prog., 51, No. 6, pp. 282-290, 1955.
161
• Tiller, F. M., The Role of Porosity in Filtration, Part III: Variable-pressure-
Variable-rate Filtration, AIChE J., 4, No. 2, pp. 170-180. 1958.
• Tiller, F. M., Tutorial: Interpretation of Filtration Data I, Fluid/Particle
Separation Journal, 3, No. 2, pp. 85-94. 1990.
• Tiller, F. M., Alciatore A. and M. Shirato. Filtration in the Chemical Process
Industry. In Filtration: Principles and Practices. Ed. 2, ed. By Matteson M. J.
and Orr, C., pp. 361-474, New York: Marcel Dekker. 1987.
• Tiller, F. M. and C. J. Huang. Filtration Equipment: Theory, Ind. Eng. Chem.,
53, No. 7, pp. 529-545. 1961.
• Tiller, F. M. and C. S. Yeh, The Role of Porosity in Filtration, Part X.
Deposition of Compressible Cakes on External Radial Surfaces, AIChE J., 31,
No. 8, pp. 1241-1248, 1985.
• Tiller, F. M., D. Cong and N. B. Hsyung. New Revolving Laboratory Filter,
Annual Meeting of the American Filtration Society on New Filtration and
Separation Equipment, pp. 45-48, 1992.
• Tiller, F.M. and H. R.Cooper. The Role of Porosity in Filtration, Part IV.
Constant Pressure Filtration, AIChE J., 6, No. 4, pp. 595-601, 1960.
• Tiller, F.M. and H. R. Cooper. The Role of porosity in filtration, Part V.
Porosity Variation in Filter Cakes, AIChE J., 8, No. 4, pp. 445-449, 1962.
• Tiller, F. M. and M. Shirato, The Role of Porosity in Filtration, Part VI. New
Definition of Filtration Resistance, AIChE J., 10, No. 1, pp. 61-67. 1964.
• Tiller, F. M., R. Chow, W. Weber and O. Davies, Clogging Phenomena in the
Filtration of Liquefied Coal, Chem. Eng. Prog., 77, pp. 61-68. 1981.
• Tiller, F. M., S. Haynes and W. Lu, The Role of Porosity in Filtration, Part VII.
162
Effect of Side-Wall Friction in Compression-Permeability Cells, AIChE J., 18,
No. 1, pp. 13-20, 1972.
• Tiller, F. M. and T. C. Green. The Role of Porosity in Filtration, Part IX. Skin
Effect with Highly Compressible Materials, AIChE J., 19, No. 6, pp. 1266-
1269, 1973.
• Tiller, F. M. and W. F. Leu. Basic Data Fitting in Filtration, J. Chinese Inst.
Chem. Engrs, 11, pp. 61-70, 1980.
• Tiller, F. M. and W. Lu. The Role of Porosity in Filtration, Part VIII. Cake
Nonuniformity in Compression-Permeability Cells, AIChE J., 18, No. 3, pp.
569-572. 1972.
• Wakeman, R.J., Numerical Integration of the Differential Equations describing
the Formation of and Flow in Compressible Filter Cakes, Trans. IChemE, 56,
pp. 258-265,1978.
• Wakeman, R.J., The Formation and Properties of Apparently Incompressible
Filter Cakes under Vacuum on Downward Facing Surfaces, Trans. IChemE,
59, pp. 260-270, 1981.
• Walker, W. H., W. K. Lewis, W. H. McAdams & E. R. Gilliland. Principles of
Chemical Engineering, Ed. 3. New York: McGraw Hill. 1937.
• Whitaker, S. Advances in Theory of Fluid Motion in Porous Media. Flow
Through Porous Media Symposium, Ind. Eng. Chem., 61, No. 12, pp. 14-28,
1969.
• Willis, M. S., I. Tosun and R. M. Collins, Filtration Mechanisms, Chem. Eng.
Res. Des., 63, pp. 175-183. 1985.
• Willis, M. S., M. Shen and K. J. Gray. Investigation of the Fundamental
163
Assumptions Relating Compression-Permeability Data with Filtration, The
Can. J. Chem. Eng., 52, pp. 331-337. 1974.
• Willis, M. S., R. M. Collins and W. G. Bridges, Complete Analysis of Non-
Parabolic Filtration Behaviour, Chem. Eng. Res. Des., 61, pp. 96-109. 1983.
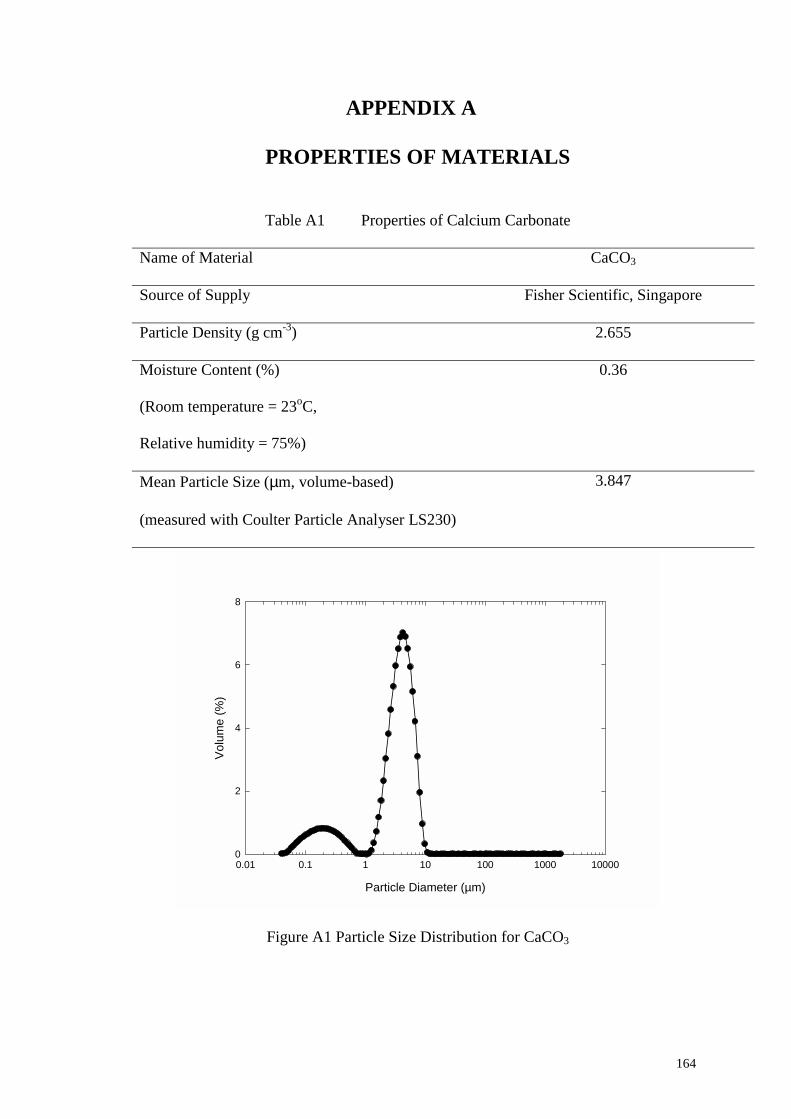
164
APPENDIX A
PROPERTIES OF MATERIALS
Table A1 Properties of Calcium Carbonate
Name of Material CaCO3
Source of Supply Fisher Scientific, Singapore
Particle Density (g cm-3) 2.655
Moisture Content (%)
(Room temperature = 23oC,
Relative humidity = 75%)
0.36
Mean Particle Size (µm, volume-based)
(measured with Coulter Particle Analyser LS230)
3.847
Particle Diameter (µm)
0.01 0.1 1 10 100 1000 10000
Volu
me
(%)
0
2
4
6
8
Figure A1 Particle Size Distribution for CaCO3
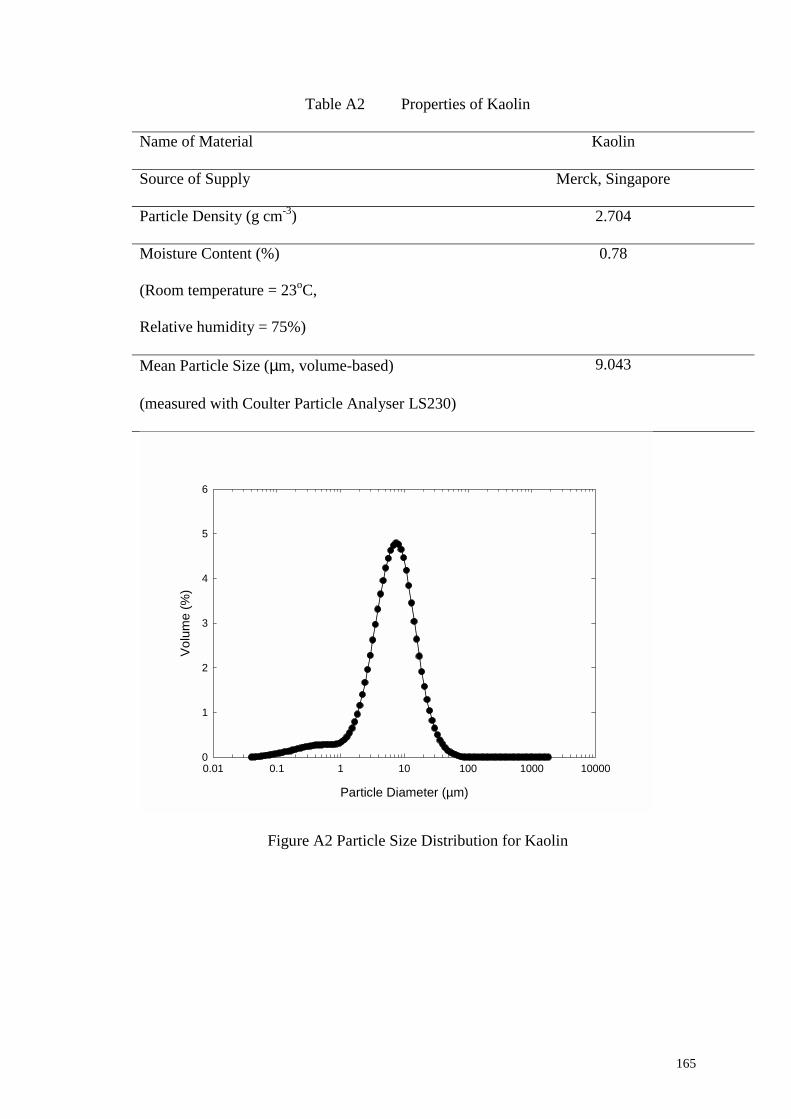
165
Table A2 Properties of Kaolin
Name of Material Kaolin
Source of Supply Merck, Singapore
Particle Density (g cm-3) 2.704
Moisture Content (%)
(Room temperature = 23oC,
Relative humidity = 75%)
0.78
Mean Particle Size (µm, volume-based)
(measured with Coulter Particle Analyser LS230)
9.043
Particle Diameter (µm)
0.01 0.1 1 10 100 1000 10000
Volu
me
(%)
0
1
2
3
4
5
6
Figure A2 Particle Size Distribution for Kaolin
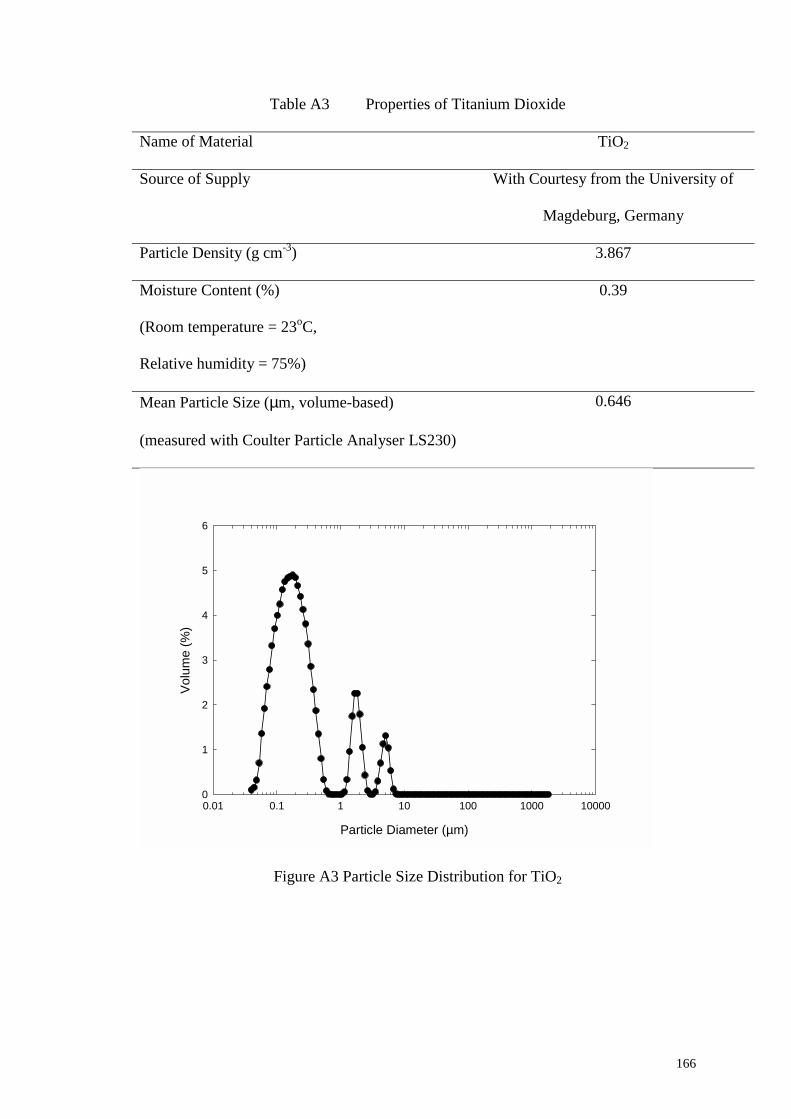
166
Table A3 Properties of Titanium Dioxide
Name of Material TiO2
Source of Supply With Courtesy from the University of
Magdeburg, Germany
Particle Density (g cm-3) 3.867
Moisture Content (%)
(Room temperature = 23oC,
Relative humidity = 75%)
0.39
Mean Particle Size (µm, volume-based)
(measured with Coulter Particle Analyser LS230)
0.646
Particle Diameter (µm)
0.01 0.1 1 10 100 1000 10000
Volu
me
(%)
0
1
2
3
4
5
6
Figure A3 Particle Size Distribution for TiO2
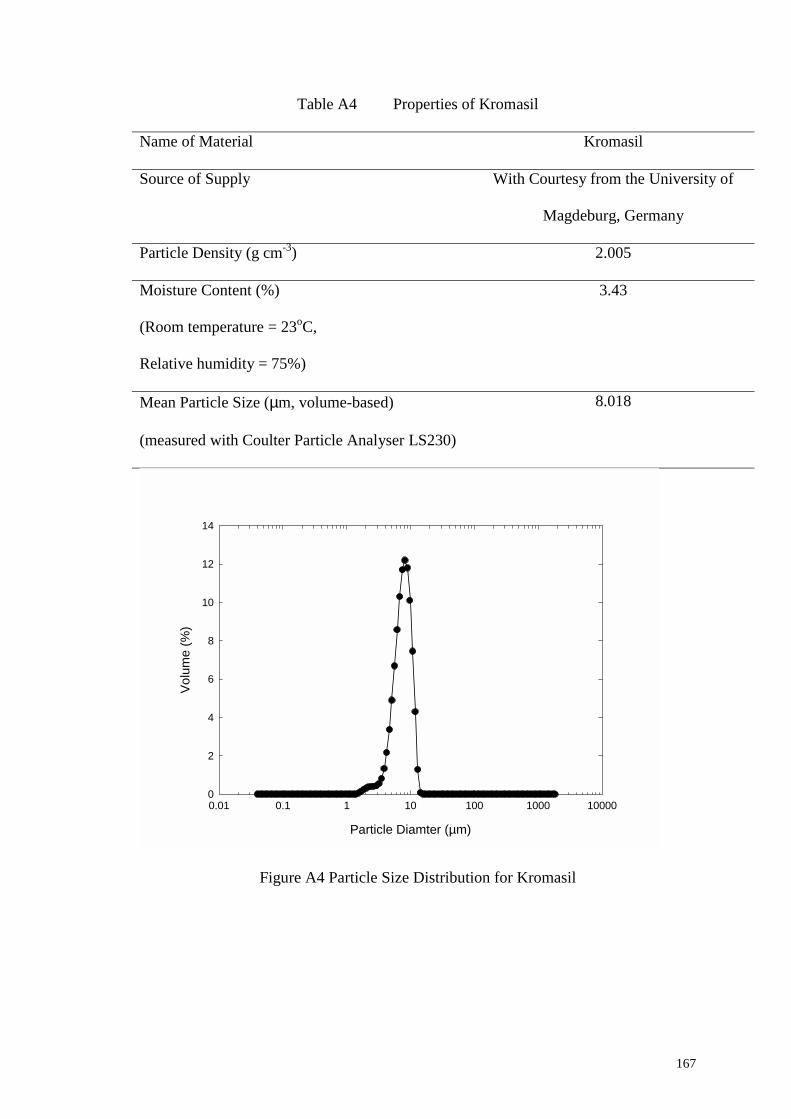
167
Table A4 Properties of Kromasil
Name of Material Kromasil
Source of Supply With Courtesy from the University of
Magdeburg, Germany
Particle Density (g cm-3) 2.005
Moisture Content (%)
(Room temperature = 23oC,
Relative humidity = 75%)
3.43
Mean Particle Size (µm, volume-based)
(measured with Coulter Particle Analyser LS230)
8.018
Particle Diamter (µm)
0.01 0.1 1 10 100 1000 10000
Volu
me
(%)
0
2
4
6
8
10
12
14
Figure A4 Particle Size Distribution for Kromasil
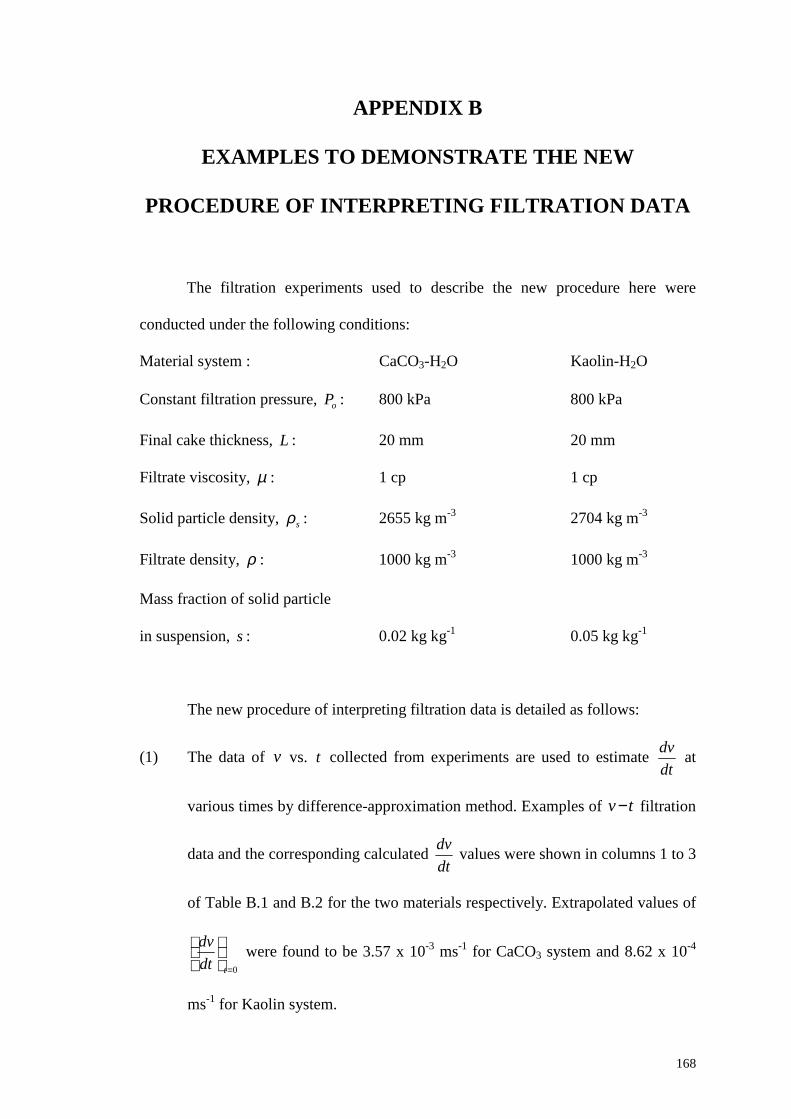
168
APPENDIX B
EXAMPLES TO DEMONSTRATE THE NEW
PROCEDURE OF INTERPRETING FILTRATION DATA
The filtration experiments used to describe the new procedure here were
conducted under the following conditions:
Material system : CaCO3-H2O Kaolin-H2O
Constant filtration pressure, oP : 800 kPa 800 kPa
Final cake thickness, L : 20 mm 20 mm
Filtrate viscosity, µ : 1 cp 1 cp
Solid particle density, sρ : 2655 kg m-3 2704 kg m-3
Filtrate density, ρ : 1000 kg m-3 1000 kg m-3
Mass fraction of solid particle
in suspension, s : 0.02 kg kg-1 0.05 kg kg-1
The new procedure of interpreting filtration data is detailed as follows:
(1) The data of v vs. t collected from experiments are used to estimate dtdv at
various times by difference-approximation method. Examples of tv− filtration
data and the corresponding calculated dtdv
values were shown in columns 1 to 3
of Table B.1 and B.2 for the two materials respectively. Extrapolated values of
0=
tdtdv
were found to be 3.57 x 10⁻³ ms-1 for CaCO3 system and 8.62 x 10⁻⁴
ms-1 for Kaolin system.
169
(2) Value of mR determined from Equation (5.1) using 0=
tdtdv were 2.26 x 10¹¹
m-1 for CaCO3 system and 9.19 x 10¹¹ m-1 for Kaolin system.
(3) Once mR is determined from Step (3), mp∆ and subsequently cp∆ can be
calculated according to Equation (5.2) and (5.3), respectively as shown in
columns 4 and 5 of Table B.1 and B.2.
(4) From the data of L versus t in column 6, values of sε and subsequently m
were calculated from Equation (5.7) and (5.5) as shown in the 7th and 8th
columns of Table B.1 and B.2, respectively.
(5) Finally, having determined all the unknown terms, the average specific cake
resistances can now be calculated from Equation (4.24). The results are shown
in the last column of Table B.1 and B.2.
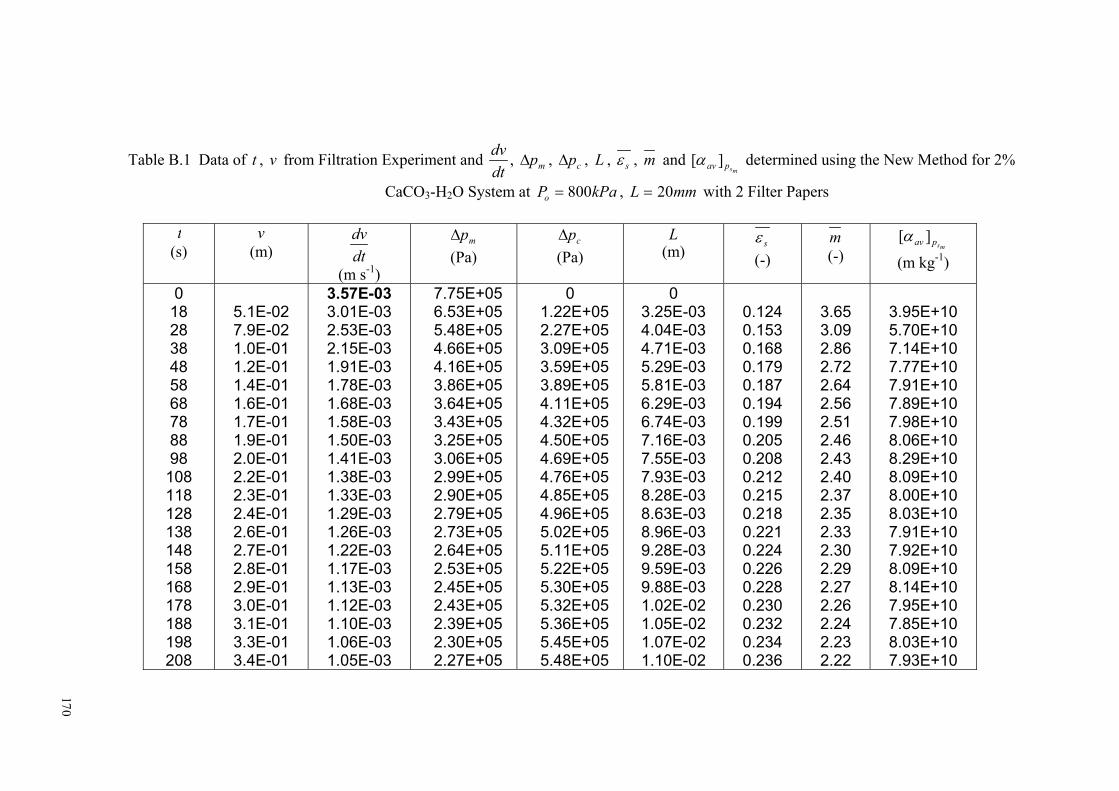
Table B.1 Data of , from Filtration Experiment and t vdtdv , mp∆ , cp∆ , , L sε , m and determined using the New Method for 2%
CaCOmspav ][α
3-H2O System at kPaPo 800= , with 2 Filter Papers mmL 20= ∆t
(s) v
(m) dtdv
(m s-1)
mp∆ (Pa)
cp (Pa)
L (m) sε
(-) m (-)
mspav ][α
(m kg-1)
0 18 28 38 48 58 68 78 88 98 108 118 128 138 148 158 168 178 188 198 208
5.1E-02 7.9E-02 1.0E-01 1.2E-01 1.4E-01 1.6E-01 1.7E-01 1.9E-01 2.0E-01 2.2E-01 2.3E-01 2.4E-01 2.6E-01 2.7E-01 2.8E-01 2.9E-01 3.0E-01 3.1E-01 3.3E-01 3.4E-01
3.57E-03 3.01E-03 2.53E-03 2.15E-03 1.91E-03 1.78E-03 1.68E-03 1.58E-03 1.50E-03 1.41E-03 1.38E-03 1.33E-03 1.29E-03 1.26E-03 1.22E-03 1.17E-03 1.13E-03 1.12E-03 1.10E-03 1.06E-03 1.05E-03
7.75E+056.53E+055.48E+054.66E+054.16E+053.86E+053.64E+053.43E+053.25E+053.06E+052.99E+052.90E+052.79E+052.73E+052.64E+052.53E+052.45E+052.43E+052.39E+052.30E+052.27E+05
0 1.22E+052.27E+053.09E+053.59E+053.89E+054.11E+054.32E+054.50E+054.69E+054.76E+054.85E+054.96E+055.02E+055.11E+055.22E+055.30E+055.32E+055.36E+055.45E+055.48E+05
0 3.25E-03 4.04E-03 4.71E-03 5.29E-03 5.81E-03 6.29E-03 6.74E-03 7.16E-03 7.55E-03 7.93E-03 8.28E-03 8.63E-03 8.96E-03 9.28E-03 9.59E-03 9.88E-03 1.02E-02 1.05E-02 1.07E-02 1.10E-02
0.124 0.153 0.168 0.179 0.187 0.194 0.199 0.205 0.208 0.212 0.215 0.218 0.221 0.224 0.226 0.228 0.230 0.232 0.234 0.236
3.65 3.09 2.86 2.72 2.64 2.56 2.51 2.46 2.43 2.40 2.37 2.35 2.33 2.30 2.29 2.27 2.26 2.24 2.23 2.22
3.95E+10 5.70E+10 7.14E+10 7.77E+10 7.91E+10 7.89E+10 7.98E+10 8.06E+10 8.29E+10 8.09E+10 8.00E+10 8.03E+10 7.91E+10 7.92E+10 8.09E+10 8.14E+10 7.95E+10 7.85E+10 8.03E+10 7.93E+10
170
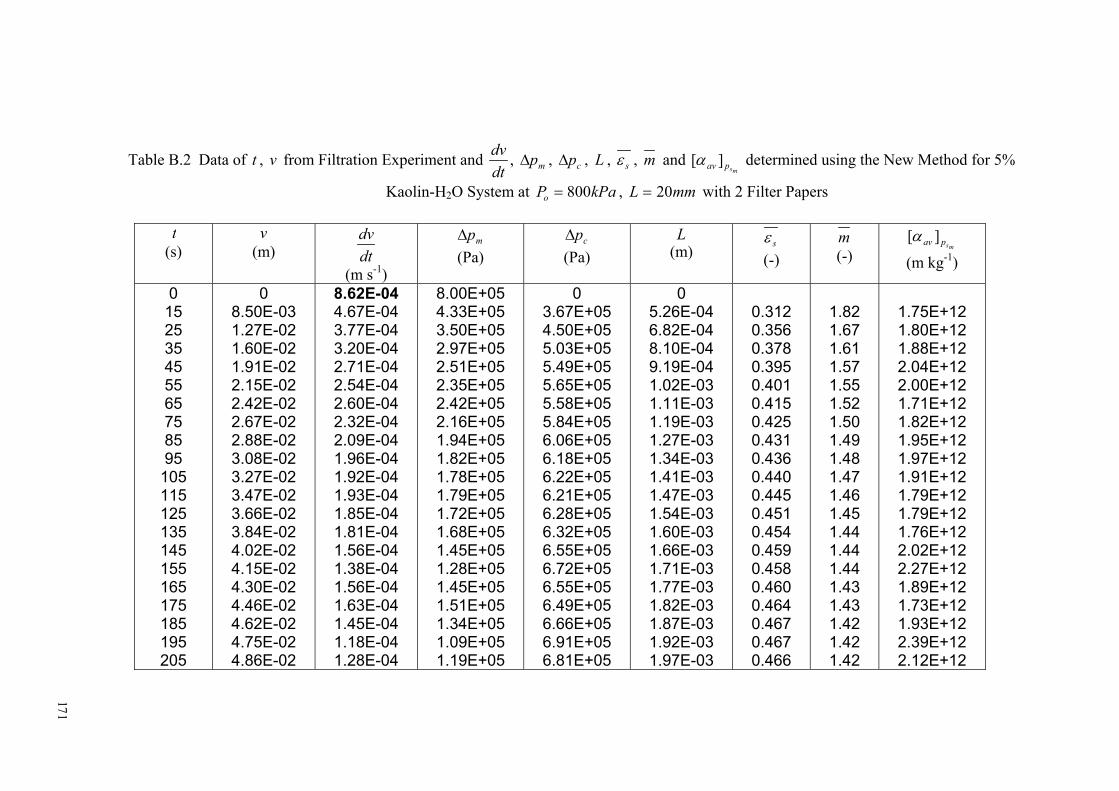
Table B.2 Data of , from Filtration Experiment and t vdtdv , mp∆ , cp∆ , , L sε , m and determined using the New Method for 5%
Kaolin-Hmspav ][α
2O System at kPaPo 800= , with 2 Filter Papers mmL 20=
t (s)
v (m) dt
dv
(m s-1)
mp∆ (Pa)
cp∆ (Pa)
L (m) sε
(-) m (-)
mspav ][α
(m kg-1)
0 15 25 35 45 55 65 75 85 95
105 115 125 135 145 155 165 175 185 195 205
0 8.50E-03 1.27E-02 1.60E-02 1.91E-02 2.15E-02 2.42E-02 2.67E-02 2.88E-02 3.08E-02 3.27E-02 3.47E-02 3.66E-02 3.84E-02 4.02E-02 4.15E-02 4.30E-02 4.46E-02 4.62E-02 4.75E-02 4.86E-02
8.62E-04 4.67E-04 3.77E-04 3.20E-04 2.71E-04 2.54E-04 2.60E-04 2.32E-04 2.09E-04 1.96E-04 1.92E-04 1.93E-04 1.85E-04 1.81E-04 1.56E-04 1.38E-04 1.56E-04 1.63E-04 1.45E-04 1.18E-04 1.28E-04
8.00E+05 4.33E+05 3.50E+05 2.97E+05 2.51E+05 2.35E+05 2.42E+05 2.16E+05 1.94E+05 1.82E+05 1.78E+05 1.79E+05 1.72E+05 1.68E+05 1.45E+05 1.28E+05 1.45E+05 1.51E+05 1.34E+05 1.09E+05 1.19E+05
0 3.67E+05 4.50E+05 5.03E+05 5.49E+05 5.65E+05 5.58E+05 5.84E+05 6.06E+05 6.18E+05 6.22E+05 6.21E+05 6.28E+05 6.32E+05 6.55E+05 6.72E+05 6.55E+05 6.49E+05 6.66E+05 6.91E+05 6.81E+05
0 5.26E-04 6.82E-04 8.10E-04 9.19E-04 1.02E-03 1.11E-03 1.19E-03 1.27E-03 1.34E-03 1.41E-03 1.47E-03 1.54E-03 1.60E-03 1.66E-03 1.71E-03 1.77E-03 1.82E-03 1.87E-03 1.92E-03 1.97E-03
0.312 0.356 0.378 0.395 0.401 0.415 0.425 0.431 0.436 0.440 0.445 0.451 0.454 0.459 0.458 0.460 0.464 0.467 0.467 0.466
1.82 1.67 1.61 1.57 1.55 1.52 1.50 1.49 1.48 1.47 1.46 1.45 1.44 1.44 1.44 1.43 1.43 1.42 1.42 1.42
1.75E+12 1.80E+12 1.88E+12 2.04E+12 2.00E+12 1.71E+12 1.82E+12 1.95E+12 1.97E+12 1.91E+12 1.79E+12 1.79E+12 1.76E+12 2.02E+12 2.27E+12 1.89E+12 1.73E+12 1.93E+12 2.39E+12 2.12E+12
171
172
APPENDIX C
LIST OF PUBLICATIONS
1. Teoh, S. K., R. B. H. Tan, D. He and C. Tien. A Multifunction Test Cell for
Cake Filtration Studies. Transactions of the Filtration Society, 1, No. 3, pp. 81-
90, 2001.
2. Tien, C, S. K. Teoh and R. B. H. Tan. Cake Filtration Analysis - the Effect of
the Relationship between the Pore Liquid Pressure and the Cake Compressive
Stress. Chemical Engineering Science, 18, No. 56, pp. 5361-5369, 2001.
3. Teoh, S. K., R. B. H. Tan and C. Tien. Correlation of C-P Cell and Filtration
Test Data using a New Test Cell. Separation and Purification Technology, 29,
pp. 131-139, 2002.
4. Teoh, S. K., R. B. H. Tan and C. Tien. A New Procedure of determining Cake
Characteristic from Filtration Data. In preparation, 2003.