Embed Size (px)
Citation preview
7/27/2019 Optical in-situ measurement of filter cake height during bag.pdf
http://slidepdf.com/reader/full/optical-in-situ-measurement-of-filter-cake-height-during-bagpdf 1/14
Optical in-situ measurement of filter cake height during bag
filter plant operation
Mahmood Saleem a,⁎, Gernot Krammer a, b
a Institute for Apparatus Design, Particle Technology, and Combustion, Graz University of Technology, Austria b Department of Energy and Process Engineering, Norwegian University of Science and Technology, Trondheim, Norway
Received 22 August 2006; received in revised form 12 September 2006; accepted 1 December 2006
Available online 15 December 2006
Abstract
A pilot scale jet pulsed bag filter test facility is operated at conditions similar to those of the industrial bag filters. The facility is equipped with a
stereo vision based optical system for in-situ cake height distribution measurements on the bag filter surface. Experimental data are presented and
data evaluation procedures are discussed to elaborate the features of the measuring system.
The results show that the cake height distribution becomes narrower towards the end of filtration cycles. A steep pressure drop rise is observed
at the start of a filtration cycle in the absence of re-attachment and a non-uniform bag cleaning, which may be attributed to different cake
properties. The specific cake resistance remains constant over the linear part of the pressure drop curve indicating a non-compressible cake
formation.
The analysis of residual cake patches shows a large number of small sized cake patches and a few large sized cake patches on the filter surface.
The cake patch size increases with the cake formation. The fractal analysis of patches boundary indicates preferential cake formation at the
boundary of the residual cake patches shortly after regeneration.
© 2006 Elsevier B.V. All rights reserved.
Keywords: Cake height; Distribution; Bag filter; Gas cleaning; Optical measurement; Cake patch size; Experimental; Fractal dimension
1. Introduction
Bag filters, having excellent separation efficiency (N99.99%)
for coarse as well as fine particles, provide a very good choice
for process engineers to meet stringent solid emission levels.
The filter pressure drop (Δ P ) over time for the jet-pulse bag
filters commonly exhibits steep increase after jet pulse (JP)
cleaning for short duration. It is followed by a moderate and
linear rise over the rest of the filtration cycle. This phen omenon is commonl y related to in-complete cake
detachment or patchy cleaning. The patchy cleaning gives
rise to a non-uniform cake load distribution on the bag filter
and hence affect cake formation and its detachment.
Quantitative knowledge of cake height distributions, their
evolution, and the factors affecting them is important for
better understanding of the filter behavior.
The bag filter consists of cylindrical bags made of woven or
needle felt fabrics. The bags are supported on metal cage rods
and are hanging from a support plate inside the housing. The
bags might be arranged in rows, in one or more compartments.
The gas stream pervades the permeable filter media and the dust
is separated on the surface of the filter media and forms a dust
cake. The forming cake is a source of increasing flow resistance.The industrial units and hence the bag filters operate mostly at
constant gas flow; therefore, a fan at the discharge provides the
necessary head to compensate for increasing Δ P .
A filtration cycle starts at a lower Δ P as the dust laden gas
flows through the filter. The Δ P increases with the cake
formation on the filter medium. The end of the cycle is reached
as soon as the Δ P reaches a certain predefined upper limit
(Δ P max) or a predefined filtration time (t filt ) is elapsed [1]. There
the dust cake has to be detached to sustain filter operation. The
cake detachment is accomplished, most commonly, by reverse
JP. High pressure short duration gas injections in reverse
Powder Technology 173 (2007) 93–106
www.elsevier.com/locate/powtec
⁎ Corresponding author. Institute for Apparatus Design, Particle Technology,
and Combustion, Graz University of Technology, Austria. Tel.: +43
3168737486; fax: +43 3168737492.
E-mail address: [email protected] (M. Saleem).
0032-5910/$ - see front matter © 2006 Elsevier B.V. All rights reserved.doi:10.1016/j.powtec.2006.12.008
7/27/2019 Optical in-situ measurement of filter cake height during bag.pdf
http://slidepdf.com/reader/full/optical-in-situ-measurement-of-filter-cake-height-during-bagpdf 2/14
direction blow the cake off the bag surface, which is collected in
the dust hopper located at the bottom of the filter housing. As
soon as the cake is removed, the Δ P is reduced and filtration
continues for another filtration cycle.
The JP cleaning process may be divided into three phases: (a)
acceleration of the filter medium towards outside, (b)
deceleration of the filter medium once it reaches a circular shape and (c) acceleration of the filter medium inwards towards
the cage after completion of the cleaning cycle and after the
decay of the cleaning pulse in the bag interior. The dust cake on
the surface of the bag is broken by the inflation of the filter
element. The acceleration from a concave to a convex shape
with sudden impact mechanically ejects the dust together with
particles that have penetrated the felt. The flowing air following
the pressure pulse flushes out the dust assisting cake removal
[1]. The reverse flow, in addition to acceleration, is reported
necessary for cake detachment in [2]. The cake removal is
improved at higher cake load in acceleration tests [3]. In
practice a fraction of filtration area is exposed to jet pulses and possibly only a fraction of the cake is removed from the jet
pulsed area [4] resulting in a non-uniform cake distribution
called patchy cleaning. Non-uniform filter cake distribution on
the bag surface is a natural outcome of patchy cleaning and
possesses many consequences like different residence times of
the cakes on the bag surface [5], distribution of gas velocities
across the filter surface as a result of the cake height distribution
[6], different cake characteristics depending on different
formation conditions [7], and as a consequence more frequent
bag cleaning is required.
Various theoretical and experimental studies are reported in
literature to provide understanding of underlying process of
cake formation and detachment which affect the Δ P . The Δ P isrelated to the operating parameters using regression analysis [1]
in one approach. Mostly, the Δ P within the filter media (Δ P m)
and the Δ P within the cake (Δ P c), are taken additive based on
the assumption that the resistances contributed by the filter
media and the cake act in series as reported in [1,5] for example.
Filtration process is simulated using one dimensional model in
[8] from its start-up, where a uniform cake is assumed to form
on a clean filter medium. At the end, JP removes a part of the
cake leaving a thin dust layer behind on the filter surface. The
second cycle starts with two model areas, one with the cake and
one regenerated and containing a thin dust layer. A Darcy
equation represents each model area but pressure drop is thesame across both areas. The fact that only a fraction of total area
may be subjected to jet pulses is not considered by [8].
Therefore, the characteristic property of cake detachment, a
fraction of cake of certain thickness removed on jet pulsing, is
not determined. The model presented in [9] deals with the case
of filtration at constant pressure drop. It also does not
distinguish between the fractions of the filter area that is
subjected to jet pulses. A model considering the fractional area
subjected to jet pulses is used for predicting operating points
from specific cake detachment experiments [10]. The model
parameters are estimated from the linear part of the pressure
drop curve ignoring the steep rise of the pressure drop curve.
The cake formation on non-uniformly covered filters may
influence the cake detachment due to highly non uniform gas
velocities, though the overall gas flow remains constant.
Therefore ignoring the cake formation may lead to erroneous
results. Other models describing filter cake additionally
consider cohesive stresses between single patches of filter
cakes. However, the three dimensional structural information of
the filter cake needed by these sophisticated approaches is not easily available [11,12]. The size and thickness of single patch
in conjunction with the length of boundary to the neighbouring
patches are decisive for plausibility of the assumption of
rectilinear, parallel gas flow. The question whether the actual
size of patches observed in filter experiments allows the
assumption of rectilinear flow is not yet settled, although this
assumption is often used for the reasons of simplicity. Transient
growth of the filter cake is simulated using two-dimensional
model in [13]. Results revealed that the pressure drop after a
cleaning pulse with constant cake mass removed is higher or
lower depending on whether the removed patches are larger or
smaller respectively. In the fringe zone between thick and thincakes, gas enters sideways increasing the permeability of the
filter cake. However, discrepancies in the pressure drop curves
are small and restricted to the first 10% of the filter cycle only.
The Darcy's law with constant specific filter cake resistance (α)
is applicable to filter modelling at constant gas velocity if the
rise of Δ P versus time is linear. At changing velocity, the Δ P
coefficient of filter cake is intrinsically not constant [14,15].
Consideration of cake compaction for the modelling of patchily
regenerated filters could be made, when complex cake
formation models [16,17] are combined with a model
describing the distribution of solid cake over the filter area.
The specific resistance of filter medium ( R) may change over
time [18–20] due to changes in filter media resulting fromentrainment of fine dust particles and more generally filter
media aging. Moreover, if the residual cake mass (cake
remaining on the bag after jet pulse cleaning) is lumped to R
then R may have different values if the distribution of residual
cake mass (cake height and/or cake density) is locally different
[21]. The flow resistance through the filter cake may depend on
the cake porosity (dependent on particle size and shape
distribution) or density, permeability of the cake, and density
of the solid particles [1]. The conditions of the filter medium
after regeneration at the start of a filtration cycle may affect the
formation of the cake and its properties, porosity and strength
[22,23]. The cake detachment is dependent on the cake properties [22] e.g. strength, therefore, changes in the cake
properties affect the cake detachment and hence the formation
again [23]. Non-uniform distribution of residual cake is a result
of incomplete cake detachment, but may also be due to
reattachment of detached cake on the neighboring or the same
bag. The cake height distribution affects the filter medium as
well as the filter cake resistance parameters. The increased
resistance is responsible for shortening of filtration time which
may lead to unstable operation in extreme case [24].
In general the characterisation of dust cakes is difficult. The
cake properties, e.g. porosity can be estimated from semi
empirically derived equations, e.g. Karman–Kozney, Ergun's
or Rudnick and Happel, describing flow through porous media
94 M. Saleem, G. Krammer / Powder Technology 173 (2007) 93 – 106
7/27/2019 Optical in-situ measurement of filter cake height during bag.pdf
http://slidepdf.com/reader/full/optical-in-situ-measurement-of-filter-cake-height-during-bagpdf 3/14
[14]. Naturally the derivations of these equations are based on
assumptions and involve empirical constants. Alternatively, the
cake samples can be characterised by direct examination under
the microscope [23,25]. A large number of observations and
statistical methods provide good estimate of cake properties.
However, information about 3D structure is mostly inferred
from 2D examinations. The cake undergoes extensive prepara-tion steps before it is examined under the microscope.
Therefore, uncertainties are also there. Fractal dimension (FD)
is a property of self similar objects and is used to characterize
complex systems e.g. dust powders or cake structure. The
fractal analysis of dust cake structures from micrographs of cake
cross-section of prepared dust cake samples is reported in [23].
The limestone dust (mass mean diameter of 3.5 μm) cakes
prepared at 500, 1000, and 2000 Pa are analysed using Box
Counting Method. The FD are scattered in the range 1.62–1.66
and no dependency of cake structure on the studied parameters
is reported. The invasive techniques, for characterising filter
cake, are superior since the cake is examined in-situ on the filter surface with minimum disturbances if any.
Some in-situ measurement techniques for determining cake
height/mass distribution on gas filters are reported in literature.
A radiometric method based on beta ray absorption and laser
light reflection is reported in [26]. Three aerial dust density
profiles on polyester bag filter of 2.5 m length using X-ray
absorption are measured. Non uniform dust cake profiles along
the length of the bag and a higher dust load near the bottom of
the filter are observed.
In another method, beta mass probe is used for investigating
the cake formation and release on a flat filter felt [27]. The β-ray
source and the detector are moved together on opposite sides of
the dust laden bag for scanning the bag surface. The filter bag issupported on a rectangular frame of 6 in×11 in, divided in 1 in2.
Because of the interference of metal wires of the frame on
radiation, a continuous measurement of the cake load along the
length or width of the filter is not possible. Only point wise
measurements could be obtained. The system required calibration
under exactly the same condition as expected in operation using
sheets of known mass per unit area. Dust and gas flow are stopped
during scanning and cleaning is off-line. The dust is found
depositing non-uniformly on the filter surface. The reported
detachment mechanism is acceleration and deceleration.
A laser displacement system is reported in [14] to measure
the dust cake thickness and the amount of dust cakecompaction. Higher filtration velocity is found responsible for
irreversible dust cake compaction. The laser displacement
system works on the principle of reflection, thus it requires a
rigid surface.
Invent of high resolution digital cameras and improved
machine vision techniques has led to wide spread applications
of digital cameras for remote sensing and monitoring of objects
and processes. The approach is non hazardous and provides in-
situ measurements of a large surface from relatively long
distance. Use of CCD-colour vision camera for characterizing
the surface treatment of needle felts is reported in [28]. The
images are processed to compute the surface porosity and size
distribution of the pores. One variant of optical in-situ technique
is reported in [29] for measuring the cake thickness distributions
on rigid ceramic filters. The circular and flat filter element of
14 cm in diameter is used. The cake thickness distributions are
recorded by an image acquisition process with a lateral
resolution of about 280 μm and a vertical resolution of about
50 μm. The experiments are performed using quartz dust at high
temperature. The measuring principle is based on a projectedfringe technique and reconstruction of the surface is done using
shape from structured light technique. The technique revealed
useful information regarding cake load distributions on filter
surfaces; however, this technique cannot be employed for
flexible filter media where the hidden filter deforms due to
increased pressure drop during cake formation. Thus simply
reconstructing the surface from structured light technique will
not account for such deformation.
In this paper an optical system is presented for measuring the
cake height distributions in the course of cake formation and
after regeneration on flexible filter media. This includes a
description of the bag filter facility, and the optical system. Thedata evaluation procedures are outlined and exemplary results
are presented and discussed. The residual cake height measure-
ments are used for estimating the residual cake patch size
distribution. The fractal analysis of the residual and forming
cake patches is also discussed.
2. Experimental
2.1. Bag filter set-up
The experimental set-up consists of three rows of bags (two
bags per row at maximum) enclosed in a chamber, which
closely resembles the large scale bag filter, and providesinstrumentation for acquiring all important data simultaneously.
The operating conditions are selected in the range where
commercial bag filters are operated [1] and are listed in Table 1.
The basic experimental set up (Fig. 1) is presented in [30]
and is briefly described here. The two screw feeder (1) delivers
a controlled constant mass (variation ±1% at steady state) of
powder into the dispersion nozzle (3) through a vibrating chute
(2). Compressed, filtered and dried gas (air) meets the dust
tangentially in the dispersion nozzle. Ambient air is sucked in
and mixed with the dispersed dust to make the raw gas stream.
Table 1
Range of operating variables and the test conditions
Description Range Test conditions Unit
Dust concentration, c b1 to N50 7.17 g/m3
Total filtration area, A b= 4 2.03 m2
Upper pressure drop
limit, Δ P max
b2400 1200 Pa
Filtration velocity, u ∼16.6–200 20.5 mm/s
Pulse tank over pressure, P jet Up to 4 3.6 bar
Cleaning impulse, t impulse 10–100 50 ms
Time between consecutive
cleaning pulses, t interval
2–254 3 s
Dispersion air, P dis Up to 5 2 bar
Relative humidity – 54% at 26 °C
95 M. Saleem, G. Krammer / Powder Technology 173 (2007) 93 – 106
7/27/2019 Optical in-situ measurement of filter cake height during bag.pdf
http://slidepdf.com/reader/full/optical-in-situ-measurement-of-filter-cake-height-during-bagpdf 4/14
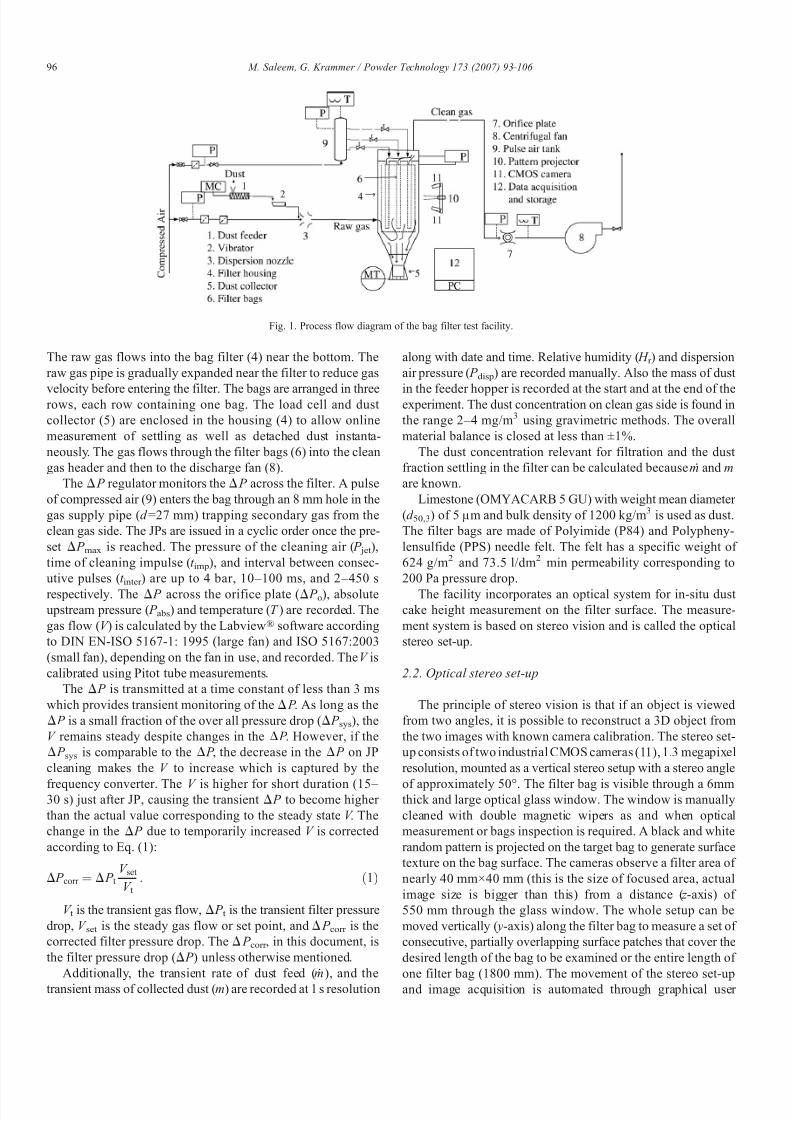
The raw gas flows into the bag filter (4) near the bottom. The
raw gas pipe is gradually expanded near the filter to reduce gas
velocity before entering the filter. The bags are arranged in threerows, each row containing one bag. The load cell and dust
collector (5) are enclosed in the housing (4) to allow online
measurement of settling as well as detached dust instanta-
neously. The gas flows through the filter bags (6) into the clean
gas header and then to the discharge fan (8).
The Δ P regulator monitors the Δ P across the filter. A pulse
of compressed air (9) enters the bag through an 8 mm hole in the
gas supply pipe (d =27 mm) trapping secondary gas from the
clean gas side. The JPs are issued in a cyclic order once the pre-
set Δ P max is reached. The pressure of the cleaning air ( P jet ),
time of cleaning impulse (t imp), and interval between consec-
utive pulses (t inter ) are up to 4 bar, 10–100 ms, and 2–450 s
respectively. The Δ P across the orifice plate (Δ P o), absoluteupstream pressure ( P abs) and temperature (T ) are recorded. The
gas flow (V ) is calculated by the Labview® software according
to DIN EN-ISO 5167-1: 1995 (large fan) and ISO 5167:2003
(small fan), depending on the fan in use, and recorded. The V is
calibrated using Pitot tube measurements.
The Δ P is transmitted at a time constant of less than 3 ms
which provides transient monitoring of the Δ P . As long as the
Δ P is a small fraction of the over all pressure drop (Δ P sys), the
V remains steady despite changes in the Δ P . However, if the
Δ P sys is comparable to the Δ P , the decrease in the Δ P on JP
cleaning makes the V to increase which is captured by the
frequency converter. The V is higher for short duration (15–30 s) just after JP, causing the transient Δ P to become higher
than the actual value corresponding to the steady state V . The
change in the Δ P due to temporarily increased V is corrected
according to Eq. (1):
D P corr ¼ D P t V set
V t : ð1Þ
V t is the transient gas flow, Δ P t is the transient filter pressure
drop, V set is the steady gas flow or set point, and Δ P corr is the
corrected filter pressure drop. The Δ P corr , in this document, is
the filter pressure drop (Δ P ) unless otherwise mentioned.
Additionally, the transient rate of dust feed (m), and the
transient mass of collected dust (m) are recorded at 1 s resolution
along with date and time. Relative humidity ( H r ) and dispersion
air pressure ( P disp) are recorded manually. Also the mass of dust
in the feeder hopper is recorded at the start and at the end of theexperiment. The dust concentration on clean gas side is found in
the range 2–4 mg/m3 using gravimetric methods. The overall
material balance is closed at less than ±1%.
The dust concentration relevant for filtration and the dust
fraction settling in the filter can be calculated because m and m
are known.
Limestone (OMYACARB 5 GU) with weight mean diameter
(d 50,3) of 5 μm and bulk density of 1200 kg/m3 is used as dust.
The filter bags are made of Polyimide (P84) and Polypheny-
lensulfide (PPS) needle felt. The felt has a specific weight of
624 g/m2 and 73.5 l/dm2 min permeability corresponding to
200 Pa pressure drop.
The facility incorporates an optical system for in-situ dust cake height measurement on the filter surface. The measure-
ment system is based on stereo vision and is called the optical
stereo set-up.
2.2. Optical stereo set-up
The principle of stereo vision is that if an object is viewed
from two angles, it is possible to reconstruct a 3D object from
the two images with known camera calibration. The stereo set-
up consists of two industrial CMOS cameras (11), 1.3 megapixel
resolution, mounted as a vertical stereo setup with a stereo angle
of approximately 50°. The filter bag is visible through a 6mmthick and large optical glass window. The window is manually
cleaned with double magnetic wipers as and when optical
measurement or bags inspection is required. A black and white
random pattern is projected on the target bag to generate surface
texture on the bag surface. The cameras observe a filter area of
nearly 40 mm×40 mm (this is the size of focused area, actual
image size is bigger than this) from a distance ( z -axis) of
550 mm through the glass window. The whole setup can be
moved vertically ( y-axis) along the filter bag to measure a set of
consecutive, partially overlapping surface patches that cover the
desired length of the bag to be examined or the entire length of
one filter bag (1800 mm). The movement of the stereo set-up
and image acquisition is automated through graphical user
Fig. 1. Process flow diagram of the bag filter test facility.
96 M. Saleem, G. Krammer / Powder Technology 173 (2007) 93 – 106
7/27/2019 Optical in-situ measurement of filter cake height during bag.pdf
http://slidepdf.com/reader/full/optical-in-situ-measurement-of-filter-cake-height-during-bagpdf 5/14
interface in Matlab® environment. The development of the
optical technique, its tailoring to meet the specific needs of our
system, and its boundary conditions are discussed in [31].
Land mark points on the filter surface are necessary for non
rigid alignment and registration. Wooden pearls of 4 mm outer
diameter and 1 mm hole are used for this purpose. The choice is
a compromise based on extensive experimental investigationsto meet the accuracy limits. Each marker is attached on a small
4 mm×4 mm piece of hard paper to provide a plane surface for
the marker to stay vertical to the filter surface. The paper blocks
the gas flow through the hole thus preventing dust particles
from entering and blocking the holes. The paper and marker's
outer surfaces are painted white while the inside of the hole and
bottom is painted black. Care has been taken to keep the holes
open and possibly uniform at the top of the markers for easy
detection. Marker to marker distance along width is nearly 1 cm
and along length of the bag is 3 cm. This distance is optimised
experimentally for target depth accuracy of 50 μm. Changing
this distance will affect the depth accuracy. The markers areglued to the filter bag using commercially available glue which
is found sufficient to hold the markers on the bag against jet
pulses up to 4 bar. The effect of markers on filter permeability is
studied and found insignificant. Variation in the height of the
marker top to the filter surface, due to the height tolerance of the
pearls, paper and glue, does not affect the cake height
measurement because the markers are rigidly fixed to the filter
surface and the cake height measurements are relative.
2.3. Description of an exemplary experimental run including
optical measurements
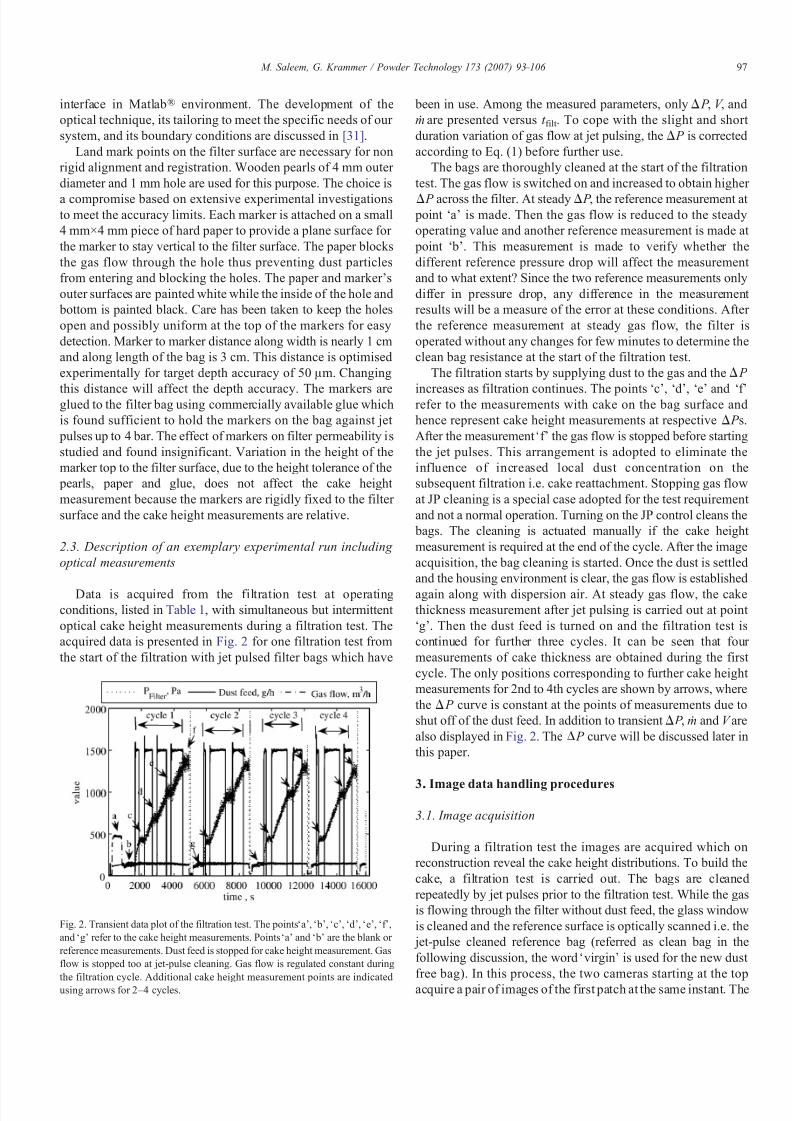
Data is acquired from the filtration test at operatingconditions, listed in Table 1, with simultaneous but intermittent
optical cake height measurements during a filtration test. The
acquired data is presented in Fig. 2 for one filtration test from
the start of the filtration with jet pulsed filter bags which have
been in use. Among the measured parameters, only Δ P , V , and
m are presented versus t filt . To cope with the slight and short
duration variation of gas flow at jet pulsing, the Δ P is corrected
according to Eq. (1) before further use.
The bags are thoroughly cleaned at the start of the filtration
test. The gas flow is switched on and increased to obtain higher
Δ P across the filter. At steady Δ P , the reference measurement at point ‘a’ is made. Then the gas flow is reduced to the steady
operating value and another reference measurement is made at
point ‘ b’. This measurement is made to verify whether the
different reference pressure drop will affect the measurement
and to what extent? Since the two reference measurements only
differ in pressure drop, any difference in the measurement
results will be a measure of the error at these conditions. After
the reference measurement at steady gas flow, the filter is
operated without any changes for few minutes to determine the
clean bag resistance at the start of the filtration test.
The filtration starts by supplying dust to the gas and the Δ P
increases as filtration continues. The points‘c’,‘d’,‘e’
and‘f ’
refer to the measurements with cake on the bag surface and
hence represent cake height measurements at respective Δ P s.
After the measurement ‘f ’ the gas flow is stopped before starting
the jet pulses. This arrangement is adopted to eliminate the
influence of increased local dust concentration on the
subsequent filtration i.e. cake reattachment. Stopping gas flow
at JP cleaning is a special case adopted for the test requirement
and not a normal operation. Turning on the JP control cleans the
bags. The cleaning is actuated manually if the cake height
measurement is required at the end of the cycle. After the image
acquisition, the bag cleaning is started. Once the dust is settled
and the housing environment is clear, the gas flow is established
again along with dispersion air. At steady gas flow, the cakethickness measurement after jet pulsing is carried out at point
‘g’. Then the dust feed is turned on and the filtration test is
continued for further three cycles. It can be seen that four
measurements of cake thickness are obtained during the first
cycle. The only positions corresponding to further cake height
measurements for 2nd to 4th cycles are shown by arrows, where
the Δ P curve is constant at the points of measurements due to
shut off of the dust feed. In addition to transient Δ P , m and V are
also displayed in Fig. 2. The Δ P curve will be discussed later in
this paper.
3. Image data handling procedures
3.1. Image acquisition
During a filtration test the images are acquired which on
reconstruction reveal the cake height distributions. To build the
cake, a filtration test is carried out. The bags are cleaned
repeatedly by jet pulses prior to the filtration test. While the gas
is flowing through the filter without dust feed, the glass window
is cleaned and the reference surface is optically scanned i.e. the
jet-pulse cleaned reference bag (referred as clean bag in the
following discussion, the word ‘virgin’ is used for the new dust
free bag). In this process, the two cameras starting at the top
acquire a pair of images of the first patch at the same instant. The
Fig. 2. Transient data plot of the filtration test. The points ‘a’, ‘ b’, ‘c’, ‘d’, ‘e’, ‘f ’,
and ‘g’ refer to the cake height measurements. Points ‘a’ and ‘ b’ are the blank or
reference measurements. Dust feed is stopped for cake height measurement. Gas
flow is stopped too at jet-pulse cleaning. Gas flow is regulated constant during
the filtration cycle. Additional cake height measurement points are indicatedusing arrows for 2–4 cycles.
97 M. Saleem, G. Krammer / Powder Technology 173 (2007) 93 – 106
7/27/2019 Optical in-situ measurement of filter cake height during bag.pdf
http://slidepdf.com/reader/full/optical-in-situ-measurement-of-filter-cake-height-during-bagpdf 6/14
optical system moves to the next position (2 cm downwards),
stops for 10 s, acquires an image pair of the second patch, moves
to the next and so on until the desired length of the bag iscovered. The acquired images are saved automatically for post
processing. This serves as reference clean bag.
At any intermediate point during a filtration cycle or at the
end of the filtration cycle, the dust feed is stopped though gas
flow is maintained to avoid the fall of the dust cake and
deformation of the filter bag. Once the gas in the filter chamber
is free of dust (it takes two to three minutes), the glass window is
cleaned and the image acquisition is repeated (referred as
measurement of dust laden bag). The gas flow may be stopped
for jet pulse cleaning but must be switched on for cake height
measurements.
The points on each pair of images have one to one
correspondence. The region within the markers is facing thecameras while the edges are turning outwards due to cylindrical
shape of the bag and are out of focus. The principle surface on
which measurements are obtained is the region within the
markers excluding markers themselves. A large number of
images are processed according to the procedure described in
the next section using Matlab® routines to obtain the point wise
cake height measurements on the examined filter surface.
3.2. Post processing of image data
A number of distinct processing steps are necessary to
retrieve the desired thickness profile. First, single patches arereconstructed such that they are partially overlapping using
stereo reconstruction [31] which results in a dense point cloud.
The surface patches reconstructed in this step are all defined
within their own local camera coordinate system. Second, the
relative motion (rotation and translation) between neighbouring
patches is estimated. Afterwards the patches are aligned such
that a continuous bag surface is generated. From the control of
the mechanical motion platform, the relative motion of the
stereo setup is known fairly accurately. With this initial solution,
an Iterative Closest Point (ICP) algorithm [32] is used to refine
the alignment. Third, registration of reconstructed surfaces is
necessary because the filter cloth is flexible. During operation it
undergoes a deformation due to the increasing Δ P between the
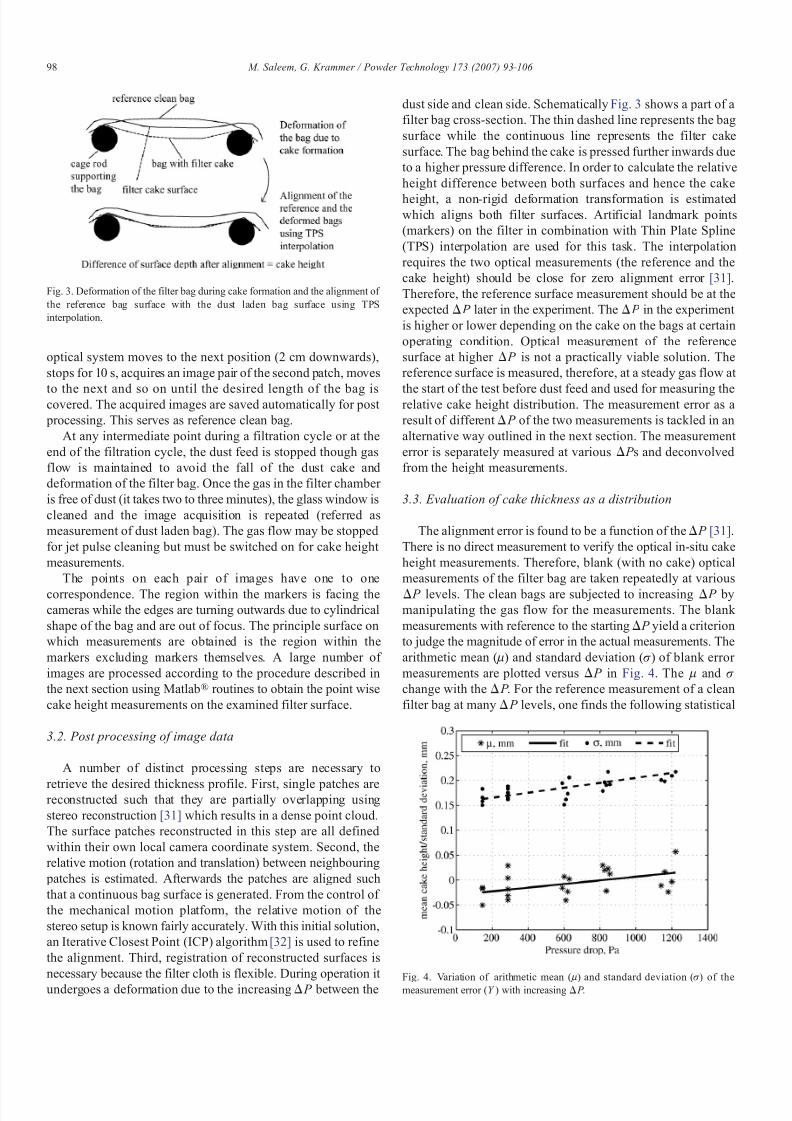
dust side and clean side. Schematically Fig. 3 shows a part of a
filter bag cross-section. The thin dashed line represents the bag
surface while the continuous line represents the filter cake
surface. The bag behind the cake is pressed further inwards due
to a higher pressure difference. In order to calculate the relative
height difference between both surfaces and hence the cake
height, a non-rigid deformation transformation is estimatedwhich aligns both filter surfaces. Artificial landmark points
(markers) on the filter in combination with Thin Plate Spline
(TPS) interpolation are used for this task. The interpolation
requires the two optical measurements (the reference and the
cake height) should be close for zero alignment error [31].
Therefore, the reference surface measurement should be at the
expected Δ P later in the experiment. The Δ P in the experiment
is higher or lower depending on the cake on the bags at certain
operating condition. Optical measurement of the reference
surface at higher Δ P is not a practically viable solution. The
reference surface is measured, therefore, at a steady gas flow at
the start of the test before dust feed and used for measuring therelative cake height distribution. The measurement error as a
result of different Δ P of the two measurements is tackled in an
alternative way outlined in the next section. The measurement
error is separately measured at various Δ P s and deconvolved
from the height measurements.
3.3. Evaluation of cake thickness as a distribution
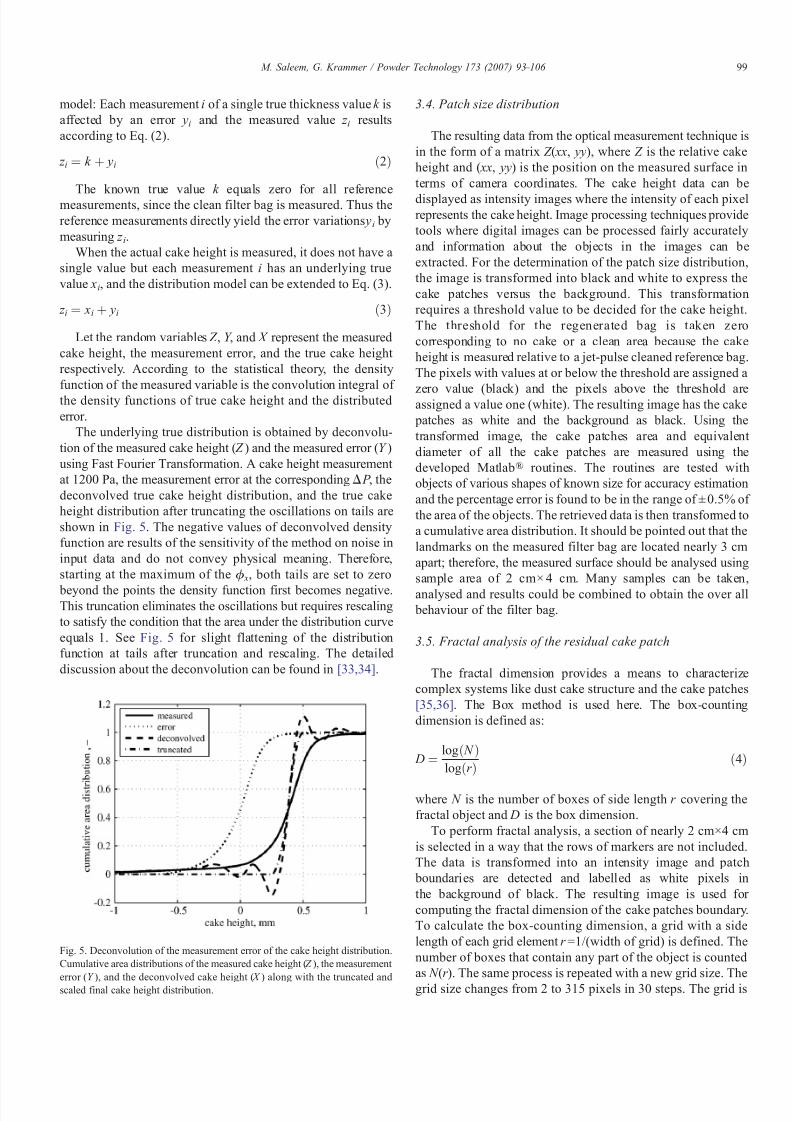
The alignment error is found to be a function of the Δ P [31].
There is no direct measurement to verify the optical in-situ cake
height measurements. Therefore, blank (with no cake) optical
measurements of the filter bag are taken repeatedly at various
Δ P levels. The clean bags are subjected to increasing Δ P bymanipulating the gas flow for the measurements. The blank
measurements with reference to the starting Δ P yield a criterion
to judge the magnitude of error in the actual measurements. The
arithmetic mean (μ) and standard deviation (σ) of blank error
measurements are plotted versus Δ P in Fig. 4. The μ and σ
change with the Δ P . For the reference measurement of a clean
filter bag at many Δ P levels, one finds the following statistical
Fig. 3. Deformation of the filter bag during cake formation and the alignment of
the reference bag surface with the dust laden bag surface using TPS
interpolation.
Fig. 4. Variation of arithmetic mean (μ) and standard deviation (σ) of themeasurement error (Y ) with increasing Δ P .
98 M. Saleem, G. Krammer / Powder Technology 173 (2007) 93 – 106
7/27/2019 Optical in-situ measurement of filter cake height during bag.pdf
http://slidepdf.com/reader/full/optical-in-situ-measurement-of-filter-cake-height-during-bagpdf 7/14
model: Each measurement i of a single true thickness value k is
affected by an error yi and the measured value z i results
according to Eq. (2).
z i ¼ k þ yi ð2Þ
The known true value k equals zero for all reference
measurements, since the clean filter bag is measured. Thus the
reference measurements directly yield the error variations yi by
measuring z i.
When the actual cake height is measured, it does not have a
single value but each measurement i has an underlying true
value xi, and the distribution model can be extended to Eq. (3).
z i ¼ xi þ yi ð3Þ
Let the random variables Z , Y , and X represent the measured
cake height, the measurement error, and the true cake height
respectively. According to the statistical theory, the density
function of the measured variable is the convolution integral of
the density functions of true cake height and the distributed
error.
The underlying true distribution is obtained by deconvolu-
tion of the measured cake height ( Z ) and the measured error (Y )
using Fast Fourier Transformation. A cake height measurement
at 1200 Pa, the measurement error at the corresponding Δ P , the
deconvolved true cake height distribution, and the true cake
height distribution after truncating the oscillations on tails are
shown in Fig. 5. The negative values of deconvolved density
function are results of the sensitivity of the method on noise in
input data and do not convey physical meaning. Therefore,
starting at the maximum of the ϕ x, both tails are set to zero
beyond the points the density function first becomes negative.This truncation eliminates the oscillations but requires rescaling
to satisfy the condition that the area under the distribution curve
equals 1. See Fig. 5 for slight flattening of the distribution
function at tails after truncation and rescaling. The detailed
discussion about the deconvolution can be found in [33,34].
3.4. Patch size distribution
The resulting data from the optical measurement technique is
in the form of a matrix Z ( xx, yy), where Z is the relative cake
height and ( xx, yy) is the position on the measured surface in
terms of camera coordinates. The cake height data can be
displayed as intensity images where the intensity of each pixelrepresents the cake height. Image processing techniques provide
tools where digital images can be processed fairly accurately
and information about the objects in the images can be
extracted. For the determination of the patch size distribution,
the image is transformed into black and white to express the
cake patches versus the background. This transformation
requires a threshold value to be decided for the cake height.
The threshold for the regenerated bag is taken zero
corresponding to no cake or a clean area because the cake
height is measured relative to a jet-pulse cleaned reference bag.
The pixels with values at or below the threshold are assigned a
zero value (black) and the pixels above the threshold areassigned a value one (white). The resulting image has the cake
patches as white and the background as black. Using the
transformed image, the cake patches area and equivalent
diameter of all the cake patches are measured using the
developed Matlab® routines. The routines are tested with
objects of various shapes of known size for accuracy estimation
and the percentage error is found to be in the range of ± 0.5% of
the area of the objects. The retrieved data is then transformed to
a cumulative area distribution. It should be pointed out that the
landmarks on the measured filter bag are located nearly 3 cm
apart; therefore, the measured surface should be analysed using
sample area of 2 cm× 4 cm. Many samples can be taken,
analysed and results could be combined to obtain the over all behaviour of the filter bag.
3.5. Fractal analysis of the residual cake patch
The fractal dimension provides a means to characterize
complex systems like dust cake structure and the cake patches
[35,36]. The Box method is used here. The box-counting
dimension is defined as:
D ¼logð N Þ
logðr Þð4Þ
where N is the number of boxes of side length r covering the
fractal object and D is the box dimension.
To perform fractal analysis, a section of nearly 2 cm×4 cm
is selected in a way that the rows of markers are not included.
The data is transformed into an intensity image and patch
boundaries are detected and labelled as white pixels in
the background of black. The resulting image is used for
computing the fractal dimension of the cake patches boundary.
To calculate the box-counting dimension, a grid with a side
length of each grid element r =1/(width of grid) is defined. The
number of boxes that contain any part of the object is counted
as N (r ). The same process is repeated with a new grid size. The
grid size changes from 2 to 315 pixels in 30 steps. The grid is
Fig. 5. Deconvolution of the measurement error of the cake height distribution.
Cumulative area distributions of the measured cake height ( Z ), the measurement
error (Y ), and the deconvolved cake height ( X ) along with the truncated andscaled final cake height distribution.
99 M. Saleem, G. Krammer / Powder Technology 173 (2007) 93 – 106
7/27/2019 Optical in-situ measurement of filter cake height during bag.pdf
http://slidepdf.com/reader/full/optical-in-situ-measurement-of-filter-cake-height-during-bagpdf 8/14
subjected to 1000 random offsets and computations are per-
formed to get an average value for a single grid size. A plot of log( N ) versus log(r ) is generated. The slope of the linear fit of
the data points leads to the box counting dimension ( D). An
exemplary image is included in Fig. 12 along with the computed
fractal dimension results.
4. Results and discussion
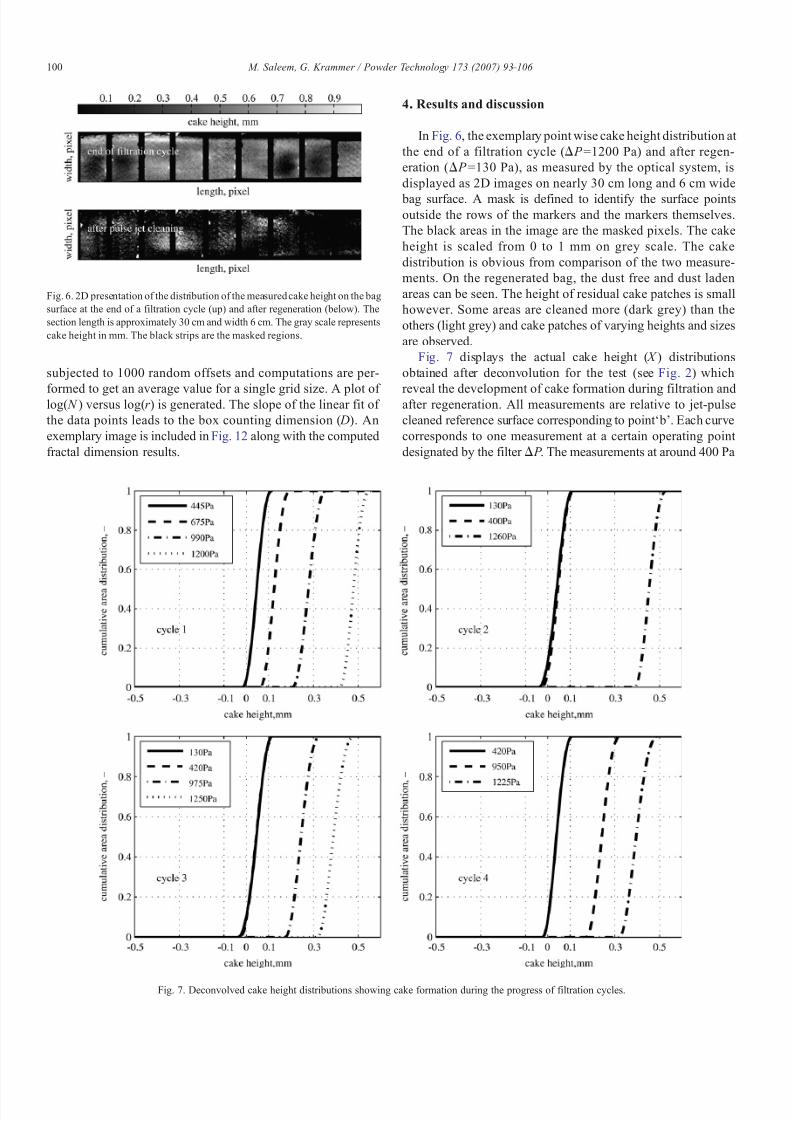
In Fig. 6, the exemplary point wise cake height distribution at
the end of a filtration cycle (Δ P =1200 Pa) and after regen-
eration (Δ P =130 Pa), as measured by the optical system, is
displayed as 2D images on nearly 30 cm long and 6 cm wide
bag surface. A mask is defined to identify the surface pointsoutside the rows of the markers and the markers themselves.
The black areas in the image are the masked pixels. The cake
height is scaled from 0 to 1 mm on grey scale. The cake
distribution is obvious from comparison of the two measure-
ments. On the regenerated bag, the dust free and dust laden
areas can be seen. The height of residual cake patches is small
however. Some areas are cleaned more (dark grey) than the
others (light grey) and cake patches of varying heights and sizes
are observed.
Fig. 7 displays the actual cake height ( X ) distributions
obtained after deconvolution for the test (see Fig. 2) which
reveal the development of cake formation during filtration andafter regeneration. All measurements are relative to jet-pulse
cleaned reference surface corresponding to point ‘ b’. Each curve
corresponds to one measurement at a certain operating point
designated by the filter Δ P . The measurements at around 400 Pa
Fig. 6. 2D presentation of the distribution of the measured cake height on the bag
surface at the end of a filtration cycle (up) and after regeneration (below). The
section length is approximately 30 cm and width 6 cm. The gray scale represents
cake height in mm. The black strips are the masked regions.
Fig. 7. Deconvolved cake height distributions showing cake formation during the progress of filtration cycles.
100 M. Saleem, G. Krammer / Powder Technology 173 (2007) 93 – 106
7/27/2019 Optical in-situ measurement of filter cake height during bag.pdf
http://slidepdf.com/reader/full/optical-in-situ-measurement-of-filter-cake-height-during-bagpdf 9/14
are at points where steep Δ P rise is just to end and a moderate
and linear rise is going to start (Fig. 9). The results show that the
mean cake height in 1st cycle is slightly higher than in the other
three cycles because the Δ P is higher (445 Pa) and the others are
lower (400 or 420). The mean and the range of distribution in
2nd–4th cycles are similar. The Δ P at the start of the filtration
cycle increases rapidly and therefore the dust cake mass
deposited on the bags is small at around 400 Pa. However, the
distributions at 400 Pa and 130 Pa in 2nd cycle and distributions
at 130 Pa and 420 Pa in 3rd cycle are only slightly different. The
distributions at 400 or 420 Pa are slightly narrower than the
distributions at 130 Pa on left tail indicating preferential cake
formation on some areas than others at the start of each filtrationcycle after regeneration. The two curves at 130 Pa represent
residual cake distributions in 2nd and 3rd cycles. The two
distributions are symmetric and range from −0.03 mm (30 μm)
to 0.12 mm (120 μm) approximately. The measurements agree
well because the residual Δ P is also the same in both cases. The
distributions at the end of the filtration cycles become narrower
but the difference is not high. The mean cake height is higher in
the 1st cycle and decreases gradually in 2nd, 3rd and 4th cycles.
Slight variation is attributed to slightly different Δ P at the end
of the cycle.
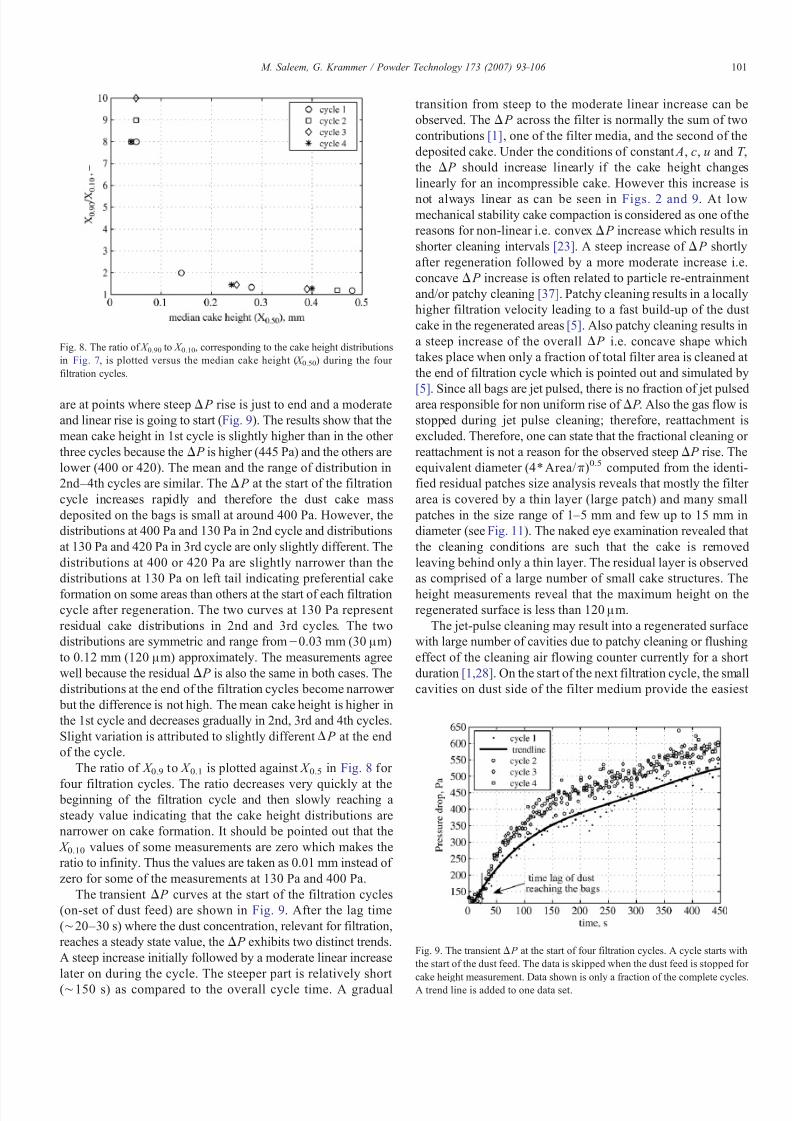
The ratio of X 0.9 to X 0.1 is plotted against X 0.5 in Fig. 8 for
four filtration cycles. The ratio decreases very quickly at the beginning of the filtration cycle and then slowly reaching a
steady value indicating that the cake height distributions are
narrower on cake formation. It should be pointed out that the
X 0.10 values of some measurements are zero which makes the
ratio to infinity. Thus the values are taken as 0.01 mm instead of
zero for some of the measurements at 130 Pa and 400 Pa.
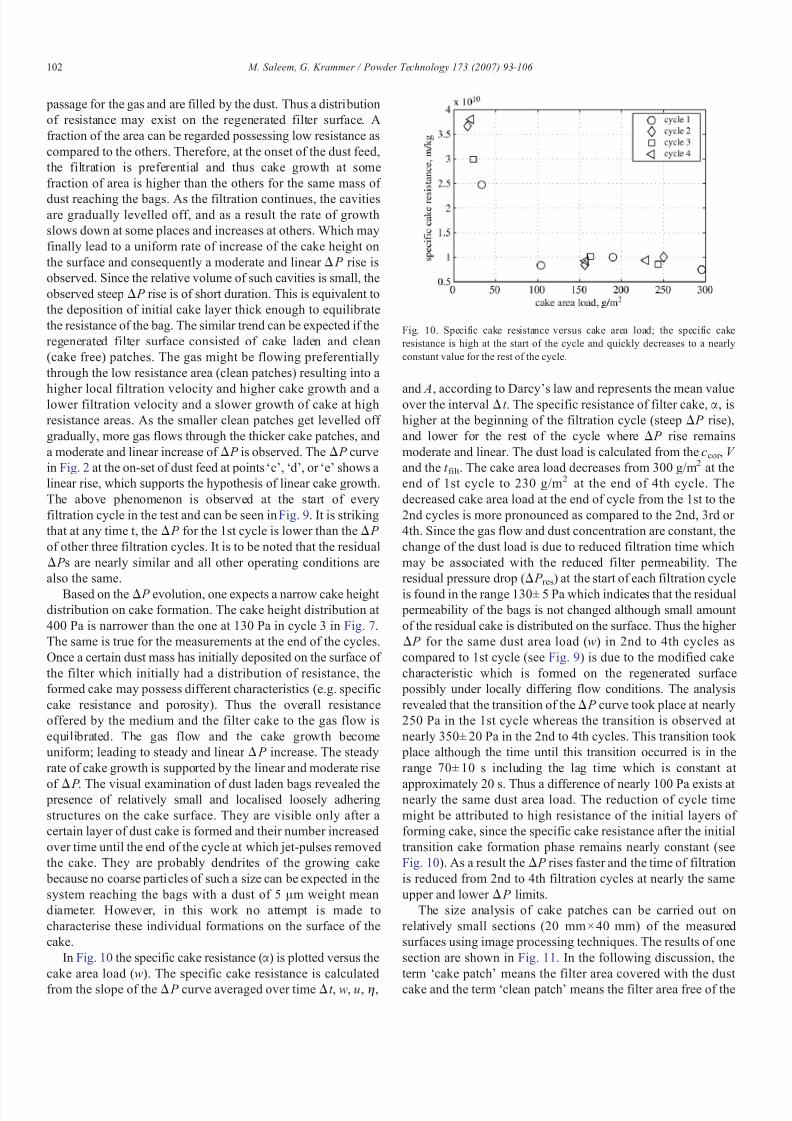
The transient Δ P curves at the start of the filtration cycles
(on-set of dust feed) are shown in Fig. 9. After the lag time
(∼20–30 s) where the dust concentration, relevant for filtration,
reaches a steady state value, the Δ P exhibits two distinct trends.
A steep increase initially followed by a moderate linear increase
later on during the cycle. The steeper part is relatively short
(∼150 s) as compared to the overall cycle time. A gradual
transition from steep to the moderate linear increase can be
observed. The Δ P across the filter is normally the sum of two
contributions [1], one of the filter media, and the second of the
deposited cake. Under the conditions of constant A, c, u and T ,
the Δ P should increase linearly if the cake height changes
linearly for an incompressible cake. However this increase is
not always linear as can be seen in Figs. 2 and 9. At lowmechanical stability cake compaction is considered as one of the
reasons for non-linear i.e. convex Δ P increase which results in
shorter cleaning intervals [23]. A steep increase of Δ P shortly
after regeneration followed by a more moderate increase i.e.
concave Δ P increase is often related to particle re-entrainment
and/or patchy cleaning [37]. Patchy cleaning results in a locally
higher filtration velocity leading to a fast build-up of the dust
cake in the regenerated areas [5]. Also patchy cleaning results in
a steep increase of the overall Δ P i.e. concave shape which
takes place when only a fraction of total filter area is cleaned at
the end of filtration cycle which is pointed out and simulated by
[5]. Since all bags are jet pulsed, there is no fraction of jet pulsedarea responsible for non uniform rise of Δ P . Also the gas flow is
stopped during jet pulse cleaning; therefore, reattachment is
excluded. Therefore, one can state that the fractional cleaning or
reattachment is not a reason for the observed steep Δ P rise. The
equivalent diameter (4⁎Area/ π)0.5 computed from the identi-
fied residual patches size analysis reveals that mostly the filter
area is covered by a thin layer (large patch) and many small
patches in the size range of 1–5 mm and few up to 15 mm in
diameter (see Fig. 11). The naked eye examination revealed that
the cleaning conditions are such that the cake is removed
leaving behind only a thin layer. The residual layer is observed
as comprised of a large number of small cake structures. The
height measurements reveal that the maximum height on theregenerated surface is less than 120 μm.
The jet-pulse cleaning may result into a regenerated surface
with large number of cavities due to patchy cleaning or flushing
effect of the cleaning air flowing counter currently for a short
duration [1,28]. On the start of the next filtration cycle, the small
cavities on dust side of the filter medium provide the easiest
Fig. 8. The ratio of X 0.90 to X 0.10, corresponding to the cake height distributions
in Fig. 7, is plotted versus the median cake height ( X 0.50) during the four
filtration cycles.
Fig. 9. The transient Δ P at the start of four filtration cycles. A cycle starts with
the start of the dust feed. The data is skipped when the dust feed is stopped for
cake height measurement. Data shown is only a fraction of the complete cycles.A trend line is added to one data set.
101 M. Saleem, G. Krammer / Powder Technology 173 (2007) 93 – 106
7/27/2019 Optical in-situ measurement of filter cake height during bag.pdf
http://slidepdf.com/reader/full/optical-in-situ-measurement-of-filter-cake-height-during-bagpdf 10/14
passage for the gas and are filled by the dust. Thus a distribution
of resistance may exist on the regenerated filter surface. A
fraction of the area can be regarded possessing low resistance as
compared to the others. Therefore, at the onset of the dust feed,
the filtration is preferential and thus cake growth at some
fraction of area is higher than the others for the same mass of
dust reaching the bags. As the filtration continues, the cavitiesare gradually levelled off, and as a result the rate of growth
slows down at some places and increases at others. Which may
finally lead to a uniform rate of increase of the cake height on
the surface and consequently a moderate and linear Δ P rise is
observed. Since the relative volume of such cavities is small, the
observed steep Δ P rise is of short duration. This is equivalent to
the deposition of initial cake layer thick enough to equilibrate
the resistance of the bag. The similar trend can be expected if the
regenerated filter surface consisted of cake laden and clean
(cake free) patches. The gas might be flowing preferentially
through the low resistance area (clean patches) resulting into a
higher local filtration velocity and higher cake growth and alower filtration velocity and a slower growth of cake at high
resistance areas. As the smaller clean patches get levelled off
gradually, more gas flows through the thicker cake patches, and
a moderate and linear increase of Δ P is observed. The Δ P curve
in Fig. 2 at the on-set of dust feed at points ‘c’, ‘d’, or ‘e’ shows a
linear rise, which supports the hypothesis of linear cake growth.
The above phenomenon is observed at the start of every
filtration cycle in the test and can be seen in Fig. 9. It is striking
that at any time t, the Δ P for the 1st cycle is lower than the Δ P
of other three filtration cycles. It is to be noted that the residual
Δ P s are nearly similar and all other operating conditions are
also the same.
Based on theΔ P evolution, one expects a narrow cake height distribution on cake formation. The cake height distribution at
400 Pa is narrower than the one at 130 Pa in cycle 3 in Fig. 7.
The same is true for the measurements at the end of the cycles.
Once a certain dust mass has initially deposited on the surface of
the filter which initially had a distribution of resistance, the
formed cake may possess different characteristics (e.g. specific
cake resistance and porosity). Thus the overall resistance
offered by the medium and the filter cake to the gas flow is
equilibrated. The gas flow and the cake growth become
uniform; leading to steady and linear Δ P increase. The steady
rate of cake growth is supported by the linear and moderate rise
of Δ P . The visual examination of dust laden bags revealed the presence of relatively small and localised loosely adhering
structures on the cake surface. They are visible only after a
certain layer of dust cake is formed and their number increased
over time until the end of the cycle at which jet-pulses removed
the cake. They are probably dendrites of the growing cake
because no coarse particles of such a size can be expected in the
system reaching the bags with a dust of 5 μm weight mean
diameter. However, in this work no attempt is made to
characterise these individual formations on the surface of the
cake.
In Fig. 10 the specific cake resistance (α) is plotted versus the
cake area load (w). The specific cake resistance is calculated
from the slope of the Δ P curve averaged over time Δt , w, u, η,
and A, according to Darcy's law and represents the mean valueover the interval Δt . The specific resistance of filter cake, α, is
higher at the beginning of the filtration cycle (steep Δ P rise),
and lower for the rest of the cycle where Δ P rise remains
moderate and linear. The dust load is calculated from the ccor , V
and the t filt . The cake area load decreases from 300 g/m2 at the
end of 1st cycle to 230 g/m2 at the end of 4th cycle. The
decreased cake area load at the end of cycle from the 1st to the
2nd cycles is more pronounced as compared to the 2nd, 3rd or
4th. Since the gas flow and dust concentration are constant, the
change of the dust load is due to reduced filtration time which
may be associated with the reduced filter permeability. The
residual pressure drop (Δ P res) at the start of each filtration cycle
is found in the range 130± 5 Pa which indicates that the residual permeability of the bags is not changed although small amount
of the residual cake is distributed on the surface. Thus the higher
Δ P for the same dust area load (w) in 2nd to 4th cycles as
compared to 1st cycle (see Fig. 9) is due to the modified cake
characteristic which is formed on the regenerated surface
possibly under locally differing flow conditions. The analysis
revealed that the transition of the Δ P curve took place at nearly
250 Pa in the 1st cycle whereas the transition is observed at
nearly 350± 20 Pa in the 2nd to 4th cycles. This transition took
place although the time until this transition occurred is in the
range 70± 10 s including the lag time which is constant at
approximately 20 s. Thus a difference of nearly 100 Pa exists at nearly the same dust area load. The reduction of cycle time
might be attributed to high resistance of the initial layers of
forming cake, since the specific cake resistance after the initial
transition cake formation phase remains nearly constant (see
Fig. 10). As a result the Δ P rises faster and the time of filtration
is reduced from 2nd to 4th filtration cycles at nearly the same
upper and lower Δ P limits.
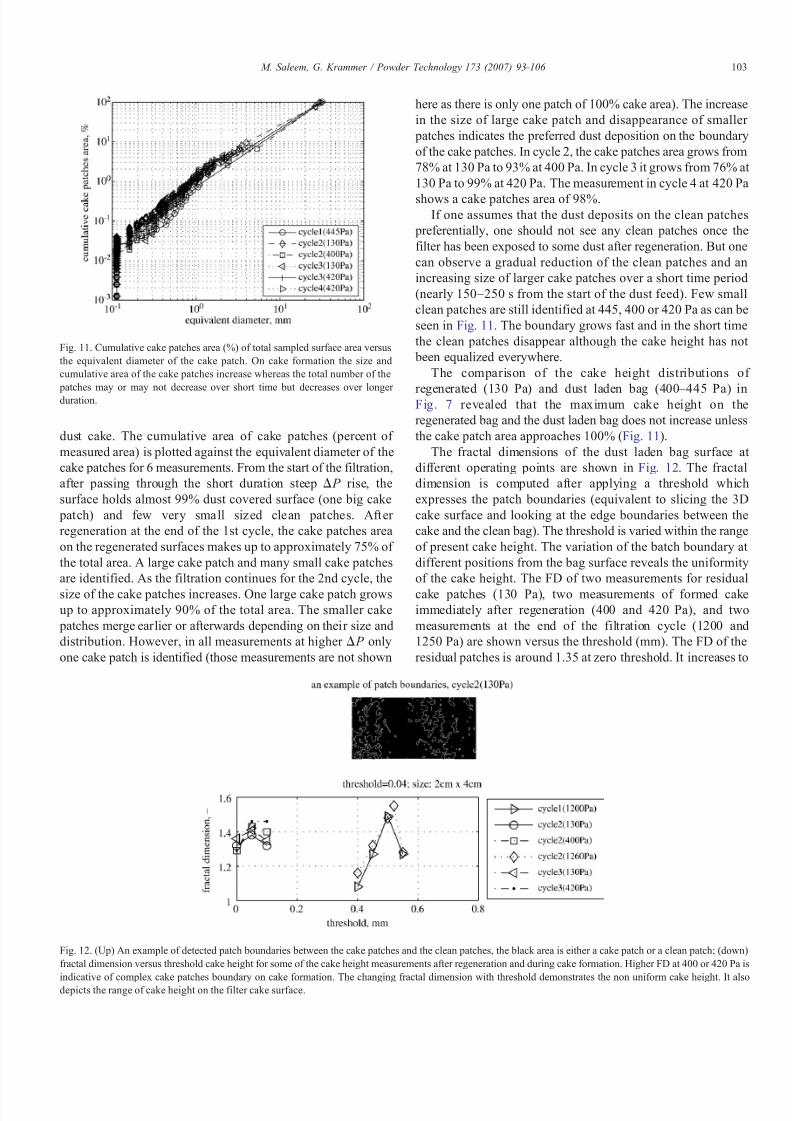
The size analysis of cake patches can be carried out on
relatively small sections (20 mm × 40 mm) of the measured
surfaces using image processing techniques. The results of one
section are shown in Fig. 11. In the following discussion, the
term ‘cake patch’ means the filter area covered with the dust
cake and the term ‘clean patch’ means the filter area free of the
Fig. 10. Specific cake resistance versus cake area load; the specific cake
resistance is high at the start of the cycle and quickly decreases to a nearly
constant value for the rest of the cycle.
102 M. Saleem, G. Krammer / Powder Technology 173 (2007) 93 – 106
7/27/2019 Optical in-situ measurement of filter cake height during bag.pdf
http://slidepdf.com/reader/full/optical-in-situ-measurement-of-filter-cake-height-during-bagpdf 11/14
dust cake. The cumulative area of cake patches (percent of
measured area) is plotted against the equivalent diameter of the
cake patches for 6 measurements. From the start of the filtration,
after passing through the short duration steep Δ P rise, the
surface holds almost 99% dust covered surface (one big cake
patch) and few very small sized clean patches. Aft er
regeneration at the end of the 1st cycle, the cake patches area
on the regenerated surfaces makes up to approximately 75% of
the total area. A large cake patch and many small cake patches
are identified. As the filtration continues for the 2nd cycle, the
size of the cake patches increases. One large cake patch growsup to approximately 90% of the total area. The smaller cake
patches merge earlier or afterwards depending on their size and
distribution. However, in all measurements at higher Δ P only
one cake patch is identified (those measurements are not shown
here as there is only one patch of 100% cake area). The increase
in the size of large cake patch and disappearance of smaller
patches indicates the preferred dust deposition on the boundary
of the cake patches. In cycle 2, the cake patches area grows from
78% at 130 Pa to 93% at 400 Pa. In cycle 3 it grows from 76% at
130 Pa to 99% at 420 Pa. The measurement in cycle 4 at 420 Pa
shows a cake patches area of 98%.If one assumes that the dust deposits on the clean patches
preferentially, one should not see any clean patches once the
filter has been exposed to some dust after regeneration. But one
can observe a gradual reduction of the clean patches and an
increasing size of larger cake patches over a short time period
(nearly 150–250 s from the start of the dust feed). Few small
clean patches are still identified at 445, 400 or 420 Pa as can be
seen in Fig. 11. The boundary grows fast and in the short time
the clean patches disappear although the cake height has not
been equalized everywhere.
The comparison of the cake height distributions of
regenerated (130 Pa) and dust laden bag (400–
445 Pa) inFig. 7 revealed that the maximum cake height on the
regenerated bag and the dust laden bag does not increase unless
the cake patch area approaches 100% (Fig. 11).
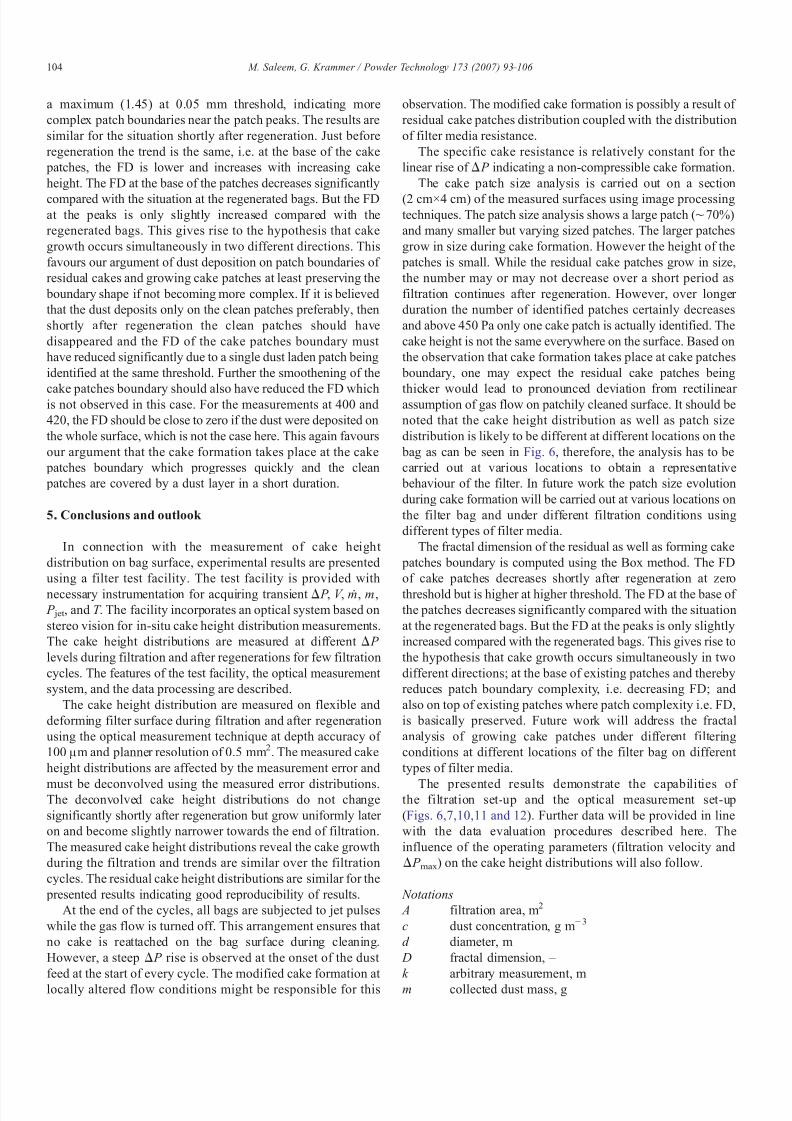
The fractal dimensions of the dust laden bag surface at
different operating points are shown in Fig. 12. The fractal
dimension is computed after applying a threshold which
expresses the patch boundaries (equivalent to slicing the 3D
cake surface and looking at the edge boundaries between the
cake and the clean bag). The threshold is varied within the range
of present cake height. The variation of the batch boundary at
different positions from the bag surface reveals the uniformity
of the cake height. The FD of two measurements for residual
cake patches (130 Pa), two measurements of formed cakeimmediately after regeneration (400 and 420 Pa), and two
measurements at the end of the filtration cycle (1200 and
1250 Pa) are shown versus the threshold (mm). The FD of the
residual patches is around 1.35 at zero threshold. It increases to
Fig. 11. Cumulative cake patches area (%) of total sampled surface area versus
the equivalent diameter of the cake patch. On cake formation the size and
cumulative area of the cake patches increase whereas the total number of the
patches may or may not decrease over short time but decreases over longer
duration.
Fig. 12. (Up) An example of detected patch boundaries between the cake patches and the clean patches, the black area is either a cake patch or a clean patch; (down)
fractal dimension versus threshold cake height for some of the cake height measurements after regeneration and during cake formation. Higher FD at 400 or 420 Pa is
indicative of complex cake patches boundary on cake formation. The changing fractal dimension with threshold demonstrates the non uniform cake height. It alsodepicts the range of cake height on the filter cake surface.
103 M. Saleem, G. Krammer / Powder Technology 173 (2007) 93 – 106
7/27/2019 Optical in-situ measurement of filter cake height during bag.pdf
http://slidepdf.com/reader/full/optical-in-situ-measurement-of-filter-cake-height-during-bagpdf 12/14
a maximum (1.45) at 0.05 mm threshold, indicating more
complex patch boundaries near the patch peaks. The results are
similar for the situation shortly after regeneration. Just before
regeneration the trend is the same, i.e. at the base of the cake
patches, the FD is lower and increases with increasing cake
height. The FD at the base of the patches decreases significantly
compared with the situation at the regenerated bags. But the FDat the peaks is only slightly increased compared with the
regenerated bags. This gives rise to the hypothesis that cake
growth occurs simultaneously in two different directions. This
favours our argument of dust deposition on patch boundaries of
residual cakes and growing cake patches at least preserving the
boundary shape if not becoming more complex. If it is believed
that the dust deposits only on the clean patches preferably, then
shortly after regeneration the clean patches should have
disappeared and the FD of the cake patches boundary must
have reduced significantly due to a single dust laden patch being
identified at the same threshold. Further the smoothening of the
cake patches boundary should also have reduced the FD whichis not observed in this case. For the measurements at 400 and
420, the FD should be close to zero if the dust were deposited on
the whole surface, which is not the case here. This again favours
our argument that the cake formation takes place at the cake
patches boundary which progresses quickly and the clean
patches are covered by a dust layer in a short duration.
5. Conclusions and outlook
In connection with the measurement of cake height
distribution on bag surface, experimental results are presented
using a filter test facility. The test facility is provided with
necessary instrumentation for acquiring transient Δ P , V , m, m, P jet , and T . The facility incorporates an optical system based on
stereo vision for in-situ cake height distribution measurements.
The cake height distributions are measured at different Δ P
levels during filtration and after regenerations for few filtration
cycles. The features of the test facility, the optical measurement
system, and the data processing are described.
The cake height distribution are measured on flexible and
deforming filter surface during filtration and after regeneration
using the optical measurement technique at depth accuracy of
100 μm and planner resolution of 0.5 mm2. The measured cake
height distributions are affected by the measurement error and
must be deconvolved using the measured error distributions.The deconvolved cake height distributions do not change
significantly shortly after regeneration but grow uniformly later
on and become slightly narrower towards the end of filtration.
The measured cake height distributions reveal the cake growth
during the filtration and trends are similar over the filtration
cycles. The residual cake height distributions are similar for the
presented results indicating good reproducibility of results.
At the end of the cycles, all bags are subjected to jet pulses
while the gas flow is turned off. This arrangement ensures that
no cake is reattached on the bag surface during cleaning.
However, a steep Δ P rise is observed at the onset of the dust
feed at the start of every cycle. The modified cake formation at
locally altered flow conditions might be responsible for this
observation. The modified cake formation is possibly a result of
residual cake patches distribution coupled with the distribution
of filter media resistance.
The specific cake resistance is relatively constant for the
linear rise of Δ P indicating a non-compressible cake formation.
The cake patch size analysis is carried out on a section
(2 cm×4 cm) of the measured surfaces using image processingtechniques. The patch size analysis shows a large patch (∼70%)
and many smaller but varying sized patches. The larger patches
grow in size during cake formation. However the height of the
patches is small. While the residual cake patches grow in size,
the number may or may not decrease over a short period as
filtration continues after regeneration. However, over longer
duration the number of identified patches certainly decreases
and above 450 Pa only one cake patch is actually identified. The
cake height is not the same everywhere on the surface. Based on
the observation that cake formation takes place at cake patches
boundary, one may expect the residual cake patches being
thicker would lead to pronounced deviation from rectilinear assumption of gas flow on patchily cleaned surface. It should be
noted that the cake height distribution as well as patch size
distribution is likely to be different at different locations on the
bag as can be seen in Fig. 6, therefore, the analysis has to be
carried out at various locations to obtain a representative
behaviour of the filter. In future work the patch size evolution
during cake formation will be carried out at various locations on
the filter bag and under different filtration conditions using
different types of filter media.
The fractal dimension of the residual as well as forming cake
patches boundary is computed using the Box method. The FD
of cake patches decreases shortly after regeneration at zero
threshold but is higher at higher threshold. The FD at the base of the patches decreases significantly compared with the situation
at the regenerated bags. But the FD at the peaks is only slightly
increased compared with the regenerated bags. This gives rise to
the hypothesis that cake growth occurs simultaneously in two
different directions; at the base of existing patches and thereby
reduces patch boundary complexity, i.e. decreasing FD; and
also on top of existing patches where patch complexity i.e. FD,
is basically preserved. Future work will address the fractal
analysis of growing cake patches under different filtering
conditions at different locations of the filter bag on different
types of filter media.
The presented results demonstrate the capabilities of the filtration set-up and the optical measurement set-up
(Figs. 6,7,10,11 and 12). Further data will be provided in line
with the data evaluation procedures described here. The
influence of the operating parameters (filtration velocity and
Δ P max) on the cake height distributions will also follow.
Notations
A filtration area, m2
c dust concentration, g m−3
d diameter, m
D fractal dimension, –
k arbitrary measurement, m
m collected dust mass, g
104 M. Saleem, G. Krammer / Powder Technology 173 (2007) 93 – 106
7/27/2019 Optical in-situ measurement of filter cake height during bag.pdf
http://slidepdf.com/reader/full/optical-in-situ-measurement-of-filter-cake-height-during-bagpdf 13/14
m mass flow rate, g s−1
N number of grid boxes, –
P pressure, Pa
R specific bag resistance, m−1
t time, s
T temperature, °C
u filtration velocity, m s−1
V gas flow, m3 h−1
w cake area load or aerial density, kg m−2
X true cake height, mm
x single measurement of X , mm
xx position in the horizontal plane, mm
Y measurement error, mm
y single measurement of Y , mm
yy position in the vertical plane, mm
Z measured cake height, mm
z single measurement of Z , mm
Greek/Latin letters
α specific cake resistance, m kg−1
Δ P pressure drop, Pa
Δt time interval, s
η gas viscosity, Pa s
ϕ probability density function, m−1
μ distribution mean, mm
σ standard deviation, mm
Abbreviations
3D three dimensional
CMOS complementary metal oxide semiconductor FD fractal dimension
ICP iterative closest point
JP jet pulse
LOGO brand name of PLC from Siemens
OMYACARB 5 GU trade name for the limestone dust
produced by OMYA
pdf probability density function
PLC programmable logic controller
P84 trademark for polyimide
PPS trade mark for polyphenylensulfide
TPS thin plate spline
Subscripts
abs absolute
c cake
corr corrected
dis dispersion
f filter
filt filtration
imp impulse
inter interval
jet jet air
m filter medium
max maximum
min minimum
o orifice
r residual
set desired value
t transient
Acknowledgements
The research project is funded by Austrian Science
Foundation (FWF) project P 16313-No. 7. The support of
Higher Education Commission, Pakistan is acknowledged. The
authors are grateful to M/s Inspec Fibers (Lenzing, Austria) for
supplying the filter bags and to M/s Alicona Imaging (Graz,
Austria) for the use of their Microscope for filter bag surface
analysis. The authors are also thankful for the valuable
discussions with Michael Koch, Norwegian University of
Science and Technology, Trondheim, Norway.
References
[1] F. Löffler, H. Dietrich, W. Flatt, Dust collection with bag filters and
envelope filters, Friedr. Vieweg & Sons, Braunschweig/Wiesbaden,
Germany, 1988.
[2] J. Sievert, F. Löffler, Dust cake release from non-woven fabrics, Filtration
& Separation (November/December 1987) 424–427.
[3] D. Koch, J. Seville, R. Clift, Dust cake detachment from gas filters, Powder
Technology 86 (1996) 21–29.
[4] M. De Ravin, W. Humphries, R. Postle, A model for the performance of a
pulse jet filter, Filtration & Separation 24 (1988) 201–207.
[5] A. Kavouras, G. Krammer, Distribution of age, thickness and gas velocity
in the cake of jet pulsed filters—application and validation of a generations
filter model, Chemical Engineering Science 58 (2003) 223–238.
[6] A. Dittler, G. Kasper, Investigation into the filtration and regeneration of
rigid gas cleaning filter media, Advances in Filtration and Separation
Technology 13a (1999) 137–143.
[7] M.L. Aguir, J.R. Coury, Cake formation in fabric filtration of gases,
Industrial & Engineering Chemistry Research 35 (1996) 3673–3679.
[8] W. Duo, J.P.K. Seville, N.F. Kirkby, R. Clift, Patchy cleaning of rigid gas
filters: I. A probabilistic model, Chemical Engineering Science 52 (1)
(1997) 141–151.
[9] J. Ju, M.S. Chiu, C. Tien, Further work on pulse filtration modelling,
Powder Technology 118 (2001) 79–89.
[10] K. Morris, C.A. Millington, Modelling fabric filters, Filtration &
Separation (November/December 1983) 478–483.
[11] M. Ferer, D.H. Smith, A simple model of the adhesive failure of a layer:
cohesive effects, Journal of Applied Physics 81 (4) (1997) 1737–1744.
[12] A. Dittler, M.V. Ferer, P. Mathur,P. Djuranovic,G. Kasper, D.H.Smith, Patchy
cleaning of rigid gas filters-transient regeneration phenomena comparison of
modelling to experiment, Powder Technology 124 (2002) 55–66.
[13] A. Dittler, G. Kasper, Simulation of operational behaviour of patchily
regenerated rigid gas cleaning filter media, Chemical Engineering and
Processing 38 (1999) 321–327.
[14] Y.H. Cheng, C.J. Tsai, Factors influencing pressure drop through a dust
cake during filtration, Aerosol Science and Technology 29 (1998)
315–328.
[15] B.F. Ruth, Studies in filtration, III. Derivation of general filtration
equations, Industrial and Engineering Chemistry 27 (6) (1935) 708–723.
[16] I. Tosun, Formulation of cake filtration, Chemical Engineering Science
41 (10) (1986) 2563–2568.
[17] K. Stamatakis, C. Tien, Cake formation and growth in cake filtration,
Chemical Engineering Science 46 (8) (1991) 1917–1933.
[18] A. Ergüdenler, W. Tang, C.M.H. Brereton, C.J. Lim, J.R. Grace, T.J.Gennrich, Performance of high-temperature fabric filters under gasification
105 M. Saleem, G. Krammer / Powder Technology 173 (2007) 93 – 106
7/27/2019 Optical in-situ measurement of filter cake height during bag.pdf
http://slidepdf.com/reader/full/optical-in-situ-measurement-of-filter-cake-height-during-bagpdf 14/14
and combustion conditions, Separation and Purification Technology 11
(1997) 1–16.
[19] S. Strangert, Predicting performance of bag filters, Filtration & Separation
(January/February 1978) 42–48.
[20] J.P.K. Seville, R. Clift, C.J. Withers, W. Keidel, Rigid ceramic media for
filtering hot gases, Filtration & Separation (July/August 1989) 265–271.
[21] J. Ellenbecker, D. Leith, The effect of dust retention on pressure drop in a
high velocity pulse jetfabric filter, PowderTechnology25 (1980)147–154.[22] J.H. Choi, Y.C. Bak, H.J. Jang, J.H. Kim, J.H. Kim, Experimental
investigation into compression properties of integrated coal gasification
combined cycle fly ashes on a ceramic filter, Korean Journal of Chemical
Engineering 21 (3) (2004) 726–732.
[23] E. Schmidt, Experimental investigations into the compression of dust
cakes deposited on filter media, Filtration & Separation 32 (8) (1995)
789–793.
[24] A. Kavouras, G. Krammer, A model analysis on the reasons for unstable
operation of jet-pulsed filters, Powder Technology 154 (2005) 24–32.
[25] E. Schmidt, F. Löffler, The analysis of dust cake structures, Particle &
Particle Systems Characterization 8 (1991) 105–109.
[26] R. Klingel, F. Löffler, Dust collection and cleaning efficiency of a pulse jet
fabric filter, Filtration & Separation (May/June 1983) 205–208.
[27] C.R. Holland, Build-up and release of dust cakes on felted filter fabrics,
Filtration & Separation (November/December 1986) 372–376.[28] W. Höflinger, G. Mauschitz, W. Koschutnig, Cleaning behaviour of textile
filter media, European Conference on Filtration and Separation, God-
benburg, June 24–26 2002.
[29] A. Dittler, B. Gutmann, R. Lichtenberger, H. Weber, G. Kasper, Optical in
situ measurement of dust cake thickness distribution on rigid filter media
for gas cleaning, Powder Technology 99 (1998) 177–184.
[30] M. Saleem, G. Krammer, M. Rüther, H. Bischof, Optical measurements
of cake thickness distribution and cake detachment on patchily cleaned
commercial bag filters, International Conference and Exhibition for
Filtration and Separation Technology, Wiesbaden-Germany, October
11–13 2005.[31] M. Rüther, M. Saleem, H. Bischof, G. Krammer, In-situ measurement of
dust deposition on bag filters using stereo vision and non-rigid registration,
Assembly Automation 25 (3) (2005) 196–203.
[32] P.J. Besl, N.D. McKay, IEEE Trans. Pattern Analysis and Machine
Intelligence 14 (2) (1992) 239–256.
[33] M. Koch, M. Saleem, G. Krammer, Measurement error correction for
distributed properties — filter cake thickness measurements, Particles &
Particle Systems Characterization (Submitted for publication).
[34] H.M. Wadsworth, Handbook of Statistical Methods for Engineers and
Scientists, McGraw Hill, Inc., New York, 1990.
[35] D.S. Ensor, M.E. Mullins, The fractal nature of dendrites formed by the
collection of particles on fibers, Particle Characterization 2 (1985) 77–78.
[36] A technical report by a subcommittee on Characterization of Porous Solids
by IUPAC, Recommendations for the characterization of porous solids,
Pure and Applied Chemistry 66 (8) (1994) 1739–1758.[37] D.H. Smith, V. Powell, G. Ahmadi, E. Ibrahim, Analysis of operational
filtration data part I. Ideal candle filter behaviour, Powder Technology
94 (1) (1997) 15–21.
106 M. Saleem, G. Krammer / Powder Technology 173 (2007) 93 – 106


![Schedule a complimentary cake consultation and tasting.Schedule a complimentary cake consultation and tasting. classiccake.com (215) 999-CAKE [2253] ChiFFon Cake (de) Catering available](https://img.pdfslide.us/doc/110x75/5e9b1e5f3a726d133a05100b/schedule-a-complimentary-cake-consultation-and-schedule-a-complimentary-cake-consultation.jpg)