Embed Size (px)
Citation preview

STUDIES AND RESEARCH REGARDING SOUND REDUCTION MATERIALS
WITH THE PURPOSE OF REDUCING SOUND POLLUTION
A Thesis
presented to
the Faculty of California Polytechnic State University,
San Luis Obispo
In Partial Fulfillment
of the Requirements for the
Degree Master of Science in
Architecture
By
Timothy Gerard Hawkins
April 2014

© 2014
Timothy Hawkins
ALL RIGHTS RESERVED
ii
COMMITTEE MEMBERSHIP
TITLE: Studies and Research Regarding Sound Reduction
Materials With The Purpose Of Reducing Sound.
AUTHOR: Timothy Hawkins
DATE SUBMITTED: February 2014
COMMITTEE CHAIR: Roger Phillip Lead TechnicianCal Poly Performing Arts Center
COMMITTEE MEMBER: Michael Haungs Associate Professor, Cal PolyPh.D., UC Davis Computer Science Department
COMMITTEE MEMBER: Jennifer Rennick Lecturer, Cal PolyB.S in Architecture, Cal Poly Architect, CEA
iii
ABSTRACT
Studies and research regarding sound reduction materials
with the purpose of reducing sound.
Timothy Hawkins
Noise can be defined as unwanted sound. There are many cases and applications
that reducing noise level is of great importance. Loss of hearing is only one of the effects
of continuous exposure to excessive noise levels. Noise can interfere with sleep and
speech, and cause discomfort and other non-auditory effects. High level noise and
vibration lead to structural failures as well as reduction in life span. The importance of
noise issue could be well understood by looking at regulations that have been passed by
governments to restrict noise production in society. Industrial machinery, air/surface
transportation and construction activities are main contributors in noise production or
"noise pollution". Noise Pollution is not only an annoyance; it is an environmental health
hazard. Noise can be found anywhere that life exists, in forests, in the workplace, in
homes across America and even under water. A lot of research has been done about noise
pollution in the last 40 years, but yet there is still more to learn about how to control and
lessen the affects that noise has on human and animal life. Noise control is a major factor
in the planning, design, and construction of transportation corridors. Architects,
acoustical engineers and transportation planners are searching for creative ways to
eliminate or greatly reduce noise levels.
iv
The challenge lies in attaining desired sound levels while simultaneously
maintaining or enhancing the visual environment. I will be setting up an experiment to
determine what kinds of materials absorb sound waves of varying frequencies most
effectively.
Keywords: Unwanted sound, Industrial machinery, Acoustical Engineers, Transportation
Planners, Noise Pollution, Noise Control.
v

TABLE OF CONTENTS
LIST OF TABLES viii
LIST OF FIGURES ix
CHAPTER 1 Introduction 1 Statement of the Problem 2
CHAPTER 2 Noise and Sound 3 Definitions and Fundamental Concepts for Sound and Noise 3 Response to the Human Ear and Noise 4 Human Perception of Noise 4 Characteristics of Sound and the Decibel Scale 5 Adding Sounds or Noises Together on the Decibel Scale 10 Propagation of Sound 13
CHAPTER 3 Noise Barriers 14
Sound Attenuation through Noise Barriers 15
CHAPTER 4 Studies and Research regarding Sound Attenuation of Sound Absorbing Materials 18 Parameters of Sound 18 Absorbing Materials 18
CHAPTER 5 Theoretical Basis of Sound Insulation 21
Measurement of Sound 21 Sound Transmission Loss 21
CHAPTER 6 Measurements in the Laboratory 23 Equipment Used in Measurements 23 Sound Proofing 25 Damping 25 Absorption 25 Porous Absorbers 26 Apparatus 27 Frequencies Chosen 27
vi

Materials Thickness Used 28 Experimental Procedure 28 Experimental Assumptions 28
CHAPTER 7 Experimental and Theoretical Results 29 Results 29
CHAPTER 8 Conclusions 30
REFERENCES 31
vii

LIST OF TABLES
Table 1 – Experimental Results 29
viii
LIST OF FIGURES
Figure 1 - Perception of Sound - Human Ear 3
Figure 2 - the Audible Sound Pressure Range is from 0 db to 120d 4
Figure 3 - Sound Pressure Level Expressed in Pa 6
Figure 4 - Common Sound or Noise in Terms of Pa 7
Figure 5 - Decibel Formula 8
Figure 6 - Relation Between Sound Pressure in Decibels vs Micropascals 9
Figure 7 - Formula to Add Three Sounds Together in Decibels 10
Figure 8 - Addition of Sound Levels 11
Figure 9 - Weighting Scale 12
Figure 10 - Noise Barrier berm along Highway 12, Sonoma County, CA 16
Figure 11 - Decibel Meter 23
24
24
Figure 12 - Sound Reduction Index
Figure 13 - Sound Reduction
Materials Figure 14 - Apparatus 27
ix.
1
CHAPTER 1
Introduction
Noise can be defined as unwanted sound. There are many cases and applications
that reducing noise level is of great importance. Loss of hearing is only one of the effects
of continuous exposure to excessive noise levels. Noise can interfere with sleep and
speech, and cause discomfort and other non-auditory effects. High level noise and
vibration lead to structural failures as well as reduction in life span.
The importance of noise issue could be well understood by looking at regulations
that have been passed by governments to restrict noise production in society. Industrial
machinery, air/surface transportation and construction activities are main contributors in
noise production or "noise pollution". Noise Pollution is not only an annoyance; it is an
environmental health hazard. Noise can be found anywhere that life exists, in forests, in
the workplace, in homes across America and even under water.
Statement of the Problem
A lot of research has been done about noise pollution in the last 40 years, but yet
there is still more to learn about how to control and lessen the affects that noise has on
human and animal life. Noise control is a major factor in the planning, design, and
construction of transportation corridors. Architects, acoustical engineers and
transportation planners are searching for creative ways to eliminate or greatly reduce
noise levels. The challenge lies in attaining desired sound levels while simultaneously
maintaining or enhancing the visual environment.

2
I will be setting up an experiment to determine what kinds of materials absorb
sound waves of varying frequencies most effectively. My objective is to compare sound
reduction effectiveness on different materials under different frequencies in term of
Sound Reduction Index(R) and Transmitted coefficient (T).
3
CHAPTER 2
Noise and Sound
Sound is a form of energy that is transmitted by pressure variations which the
human ear can detect. When one plays a musical instrument, say a guitar, the vibrating
chords set air particles into vibration and generate pressure waves in the air. [3] A
person nearby may then hear the sound of the guitar when the pressure waves are
perceived by the ear. Sound can also travel through other media, such as water or steel.
Apart from musical instruments, sound can be produced by many other sources -
man's vocal cord, a running engine, a vibrating loudspeaker diaphragm, an operating
machine tool, and so on. [6]
Definitions and Fundamental Concepts for Sound and Noise
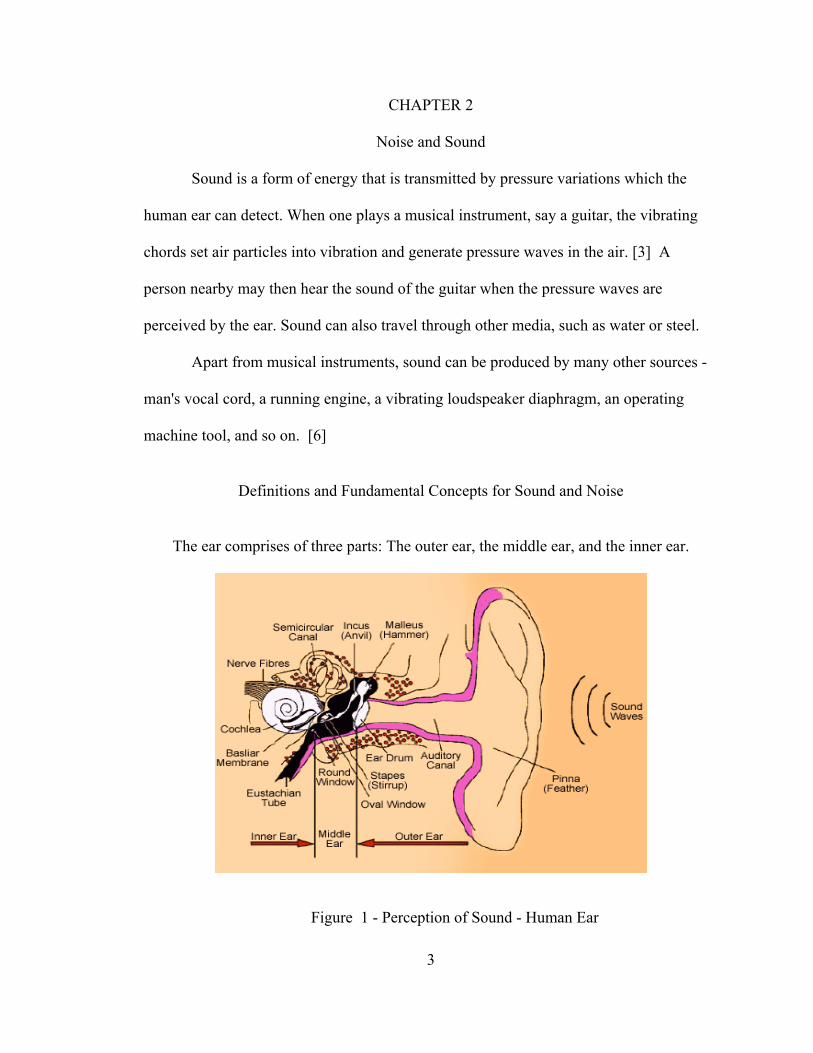
The ear comprises of three parts: The outer ear, the middle ear, and the inner ear.
Figure 1 - Perception of Sound - Human Ear

4
Response to the Human Ear and Noise
Frequency is one of the properties of sound or noise. A sound with a high
frequency is said to be high-pitched and a sound with a low frequency is low-pitched
There is a remarkably wide range of frequencies and sound pressure levels over which
the human ear can detect. The following diagram shows the audible range of a normal
human ear.
Figure 2 - The audible sound pressure range is from 0 dB to 120 dB.
Human Perception of Noise
It is a theory in psychology that our perception of objects, both visual and
auditory, is determined by certain principles. These principles function so that our
perceptual worlds are organized into the simplest pattern consistent with the sensory
information and with our experience. [1]
In hearing, we also tend to organize sounds into auditory objects or streams and
use the principles of grouping to help us to segregate those components we are interested

5
in from others. We are thus able to focus our listening attention to a particular noise
source and distinguish an auditory object from the background noise.
The human ears can detect not only changes in the overall sound pressure level
but are so sophisticated that they can detect sound, the sound pressure level of which is
well below the background noise level.
While there are variations in individual perception of the strength of a sound,
studies have shown that to a good approximation, the sound is perceived twice as loud if
the sound level increases by 10 dB. Similarly, a 20 dB increase in the sound level is
perceived as four times as loud by the normal human ear.
Characteristics of Sound and the Decibel Scale
Sound is the quickly varying pressure wave travelling through a medium. When
sound travels through air, the atmospheric pressure varies periodically. The number of
pressure variations per second is called the frequency of sound, and is measured in Hertz
(Hz) which is defined as cycles per second. [9]
The higher the frequency, the more high-pitched a sound is perceived. The sounds
produced by drums have much lower frequencies than those produced by a whistle, as
shown in the following diagrams. Please click on the demo button to hear their sounds
and the difference in pitch. [9]
Another property of sound or noise is its loudness. A loud noise usually has a
larger pressure variation and a weak one has smaller pressure variation. Pressure and
pressure variations are expressed in Pascal, abbreviated as Pa, which is defined as
N/m2(Newton per square metre).

6
Human ear can perceive a very wide range of sound pressure. The softest sound a
normal human ear can detect has a pressure variation of 20 micro Pascals, abbreviated as
µPa, which is 20 x 10-6 Pa ("20 millionth of a Pascal") and is called the Threshold of
Hearing. On the other hand, the sound pressure close to some very noisy events such as
launching of the space shuttle can produce a large pressure variation at a short distance of
approximately 2000 Pa or 2 x 10⁹ µPa. [1]
The following table illustrates sound pressure level of the above events expressed
in Pa and µPa.
Sound Pressure expressed in
Pa µPa
Softest Noise just Heard by a
Human Ear 20 x 10-6 20
Launching of the Space Shuttle 2,000 2 x 10⁹
Figure 3 – Sound Pressure Level Expressed in Pa
7
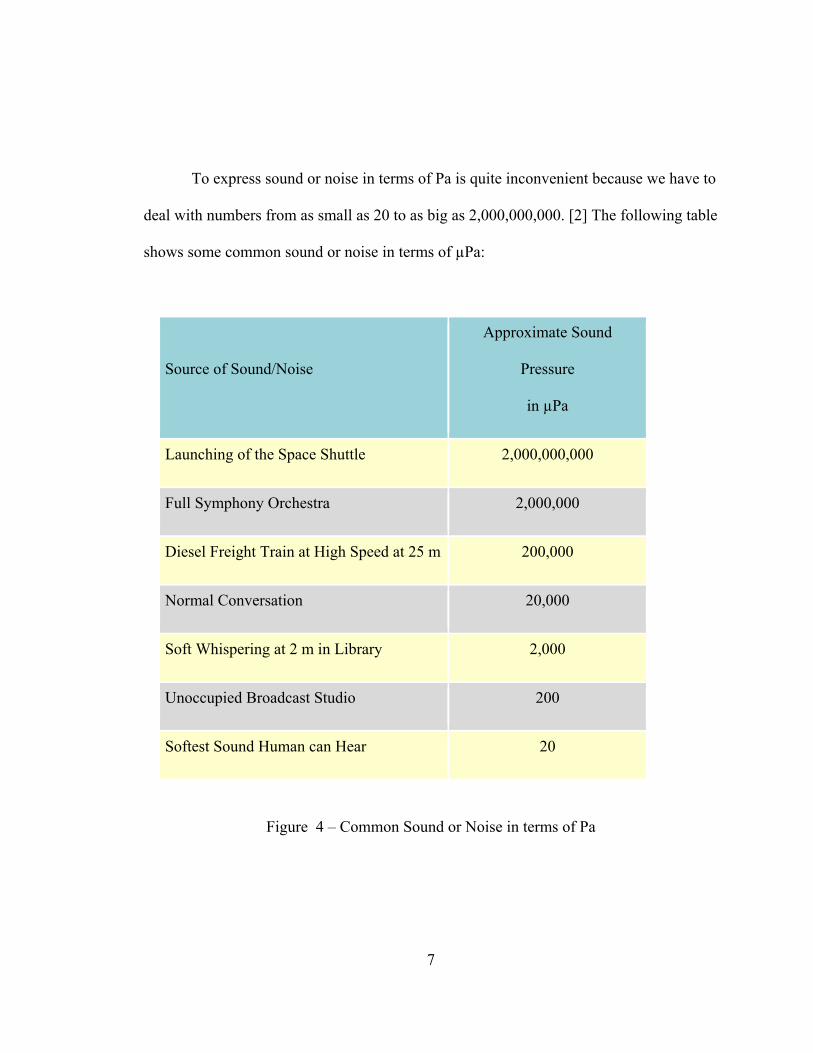
To express sound or noise in terms of Pa is quite inconvenient because we have to
deal with numbers from as small as 20 to as big as 2,000,000,000. [2] The following table
shows some common sound or noise in terms of µPa:
Source of Sound/Noise
Approximate Sound
Pressure
in µPa
Launching of the Space Shuttle 2,000,000,000
Full Symphony Orchestra 2,000,000
Diesel Freight Train at High Speed at 25 m 200,000
Normal Conversation 20,000
Soft Whispering at 2 m in Library 2,000
Unoccupied Broadcast Studio 200
Softest Sound Human can Hear 20
Figure 4 – Common Sound or Noise in terms of Pa
8
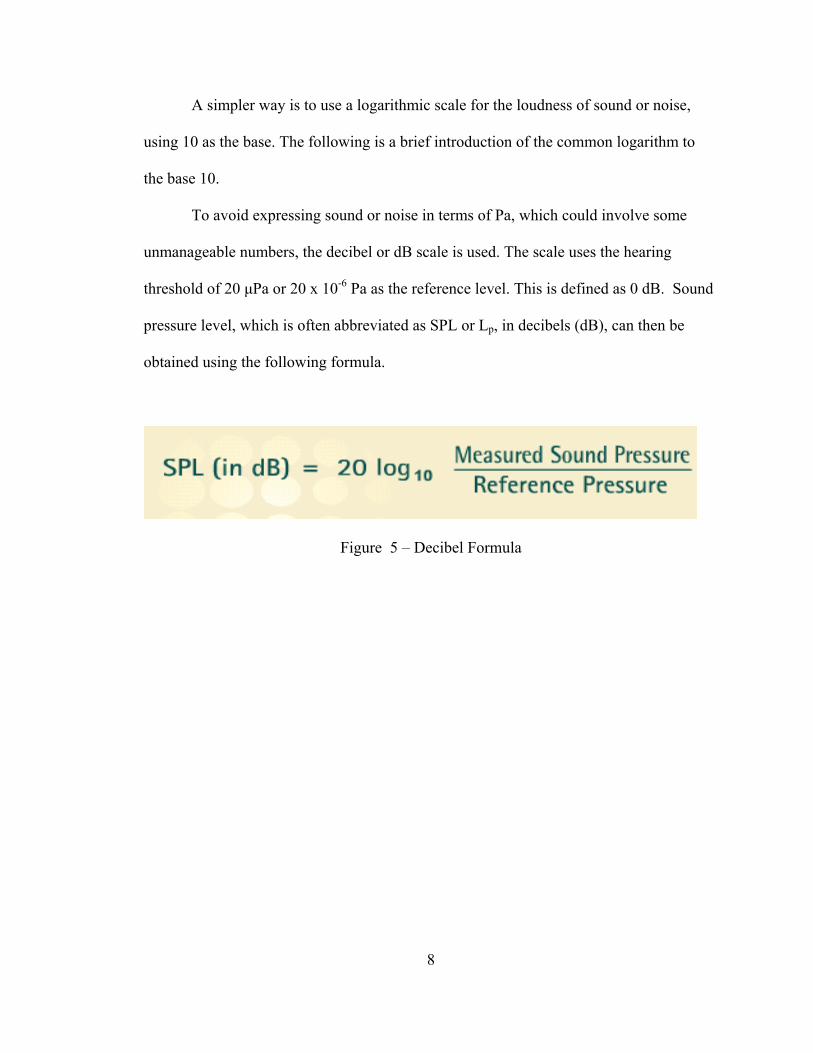
A simpler way is to use a logarithmic scale for the loudness of sound or noise,
using 10 as the base. The following is a brief introduction of the common logarithm to
the base 10.
To avoid expressing sound or noise in terms of Pa, which could involve some
unmanageable numbers, the decibel or dB scale is used. The scale uses the hearing
threshold of 20 μPa or 20 x 10-6 Pa as the reference level. This is defined as 0 dB. Sound
pressure level, which is often abbreviated as SPL or Lp, in decibels (dB), can then be
obtained using the following formula.
Figure 5 – Decibel Formula
9
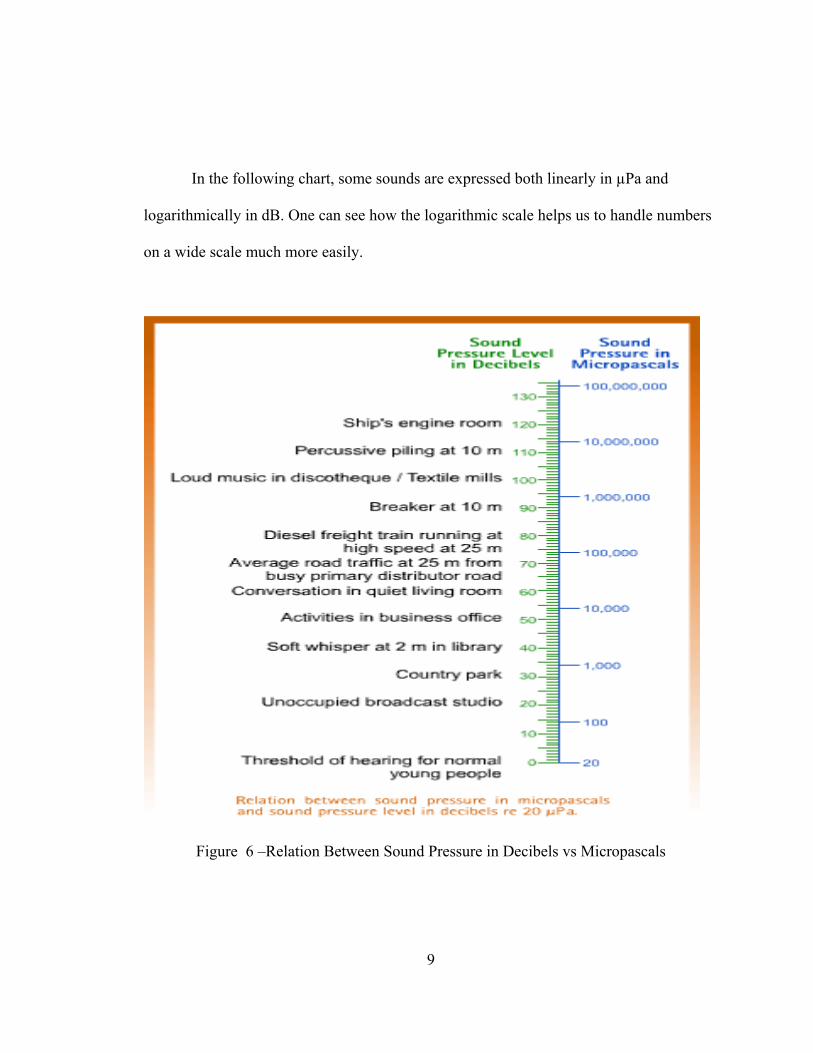
In the following chart, some sounds are expressed both linearly in µPa and
logarithmically in dB. One can see how the logarithmic scale helps us to handle numbers
on a wide scale much more easily.
Figure 6 –Relation Between Sound Pressure in Decibels vs Micropascals
10
One useful aspect of the decibel scale is that it gives a much better approximation
to the human perception of relative loudness than the Pascal scale. This is because
human ear responds to the logarithmic change in level, which corresponds to the decibel
scale. [6]
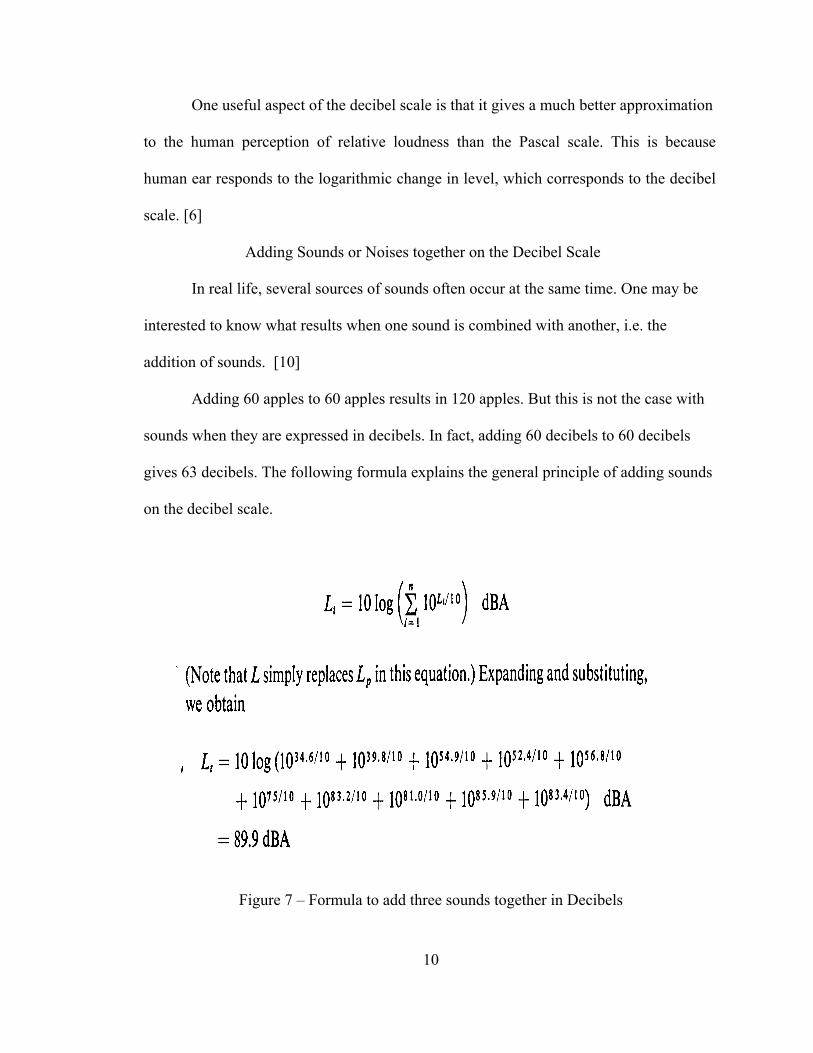
Adding Sounds or Noises together on the Decibel Scale
In real life, several sources of sounds often occur at the same time. One may be
interested to know what results when one sound is combined with another, i.e. the
addition of sounds. [10]
Adding 60 apples to 60 apples results in 120 apples. But this is not the case with
sounds when they are expressed in decibels. In fact, adding 60 decibels to 60 decibels
gives 63 decibels. The following formula explains the general principle of adding sounds
on the decibel scale.
Figure 7 – Formula to add three sounds together in Decibels
11
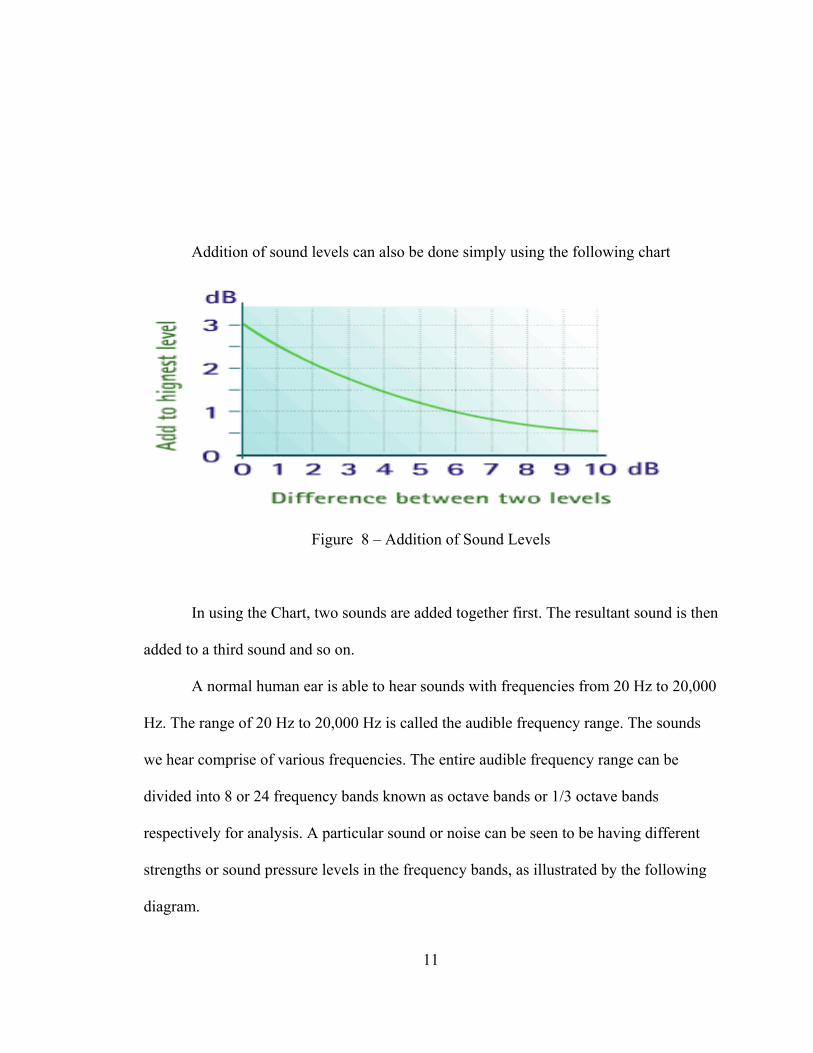
Addition of sound levels can also be done simply using the following chart
Figure 8 – Addition of Sound Levels
In using the Chart, two sounds are added together first. The resultant sound is then
added to a third sound and so on.
A normal human ear is able to hear sounds with frequencies from 20 Hz to 20,000
Hz. The range of 20 Hz to 20,000 Hz is called the audible frequency range. The sounds
we hear comprise of various frequencies. The entire audible frequency range can be
divided into 8 or 24 frequency bands known as octave bands or 1/3 octave bands
respectively for analysis. A particular sound or noise can be seen to be having different
strengths or sound pressure levels in the frequency bands, as illustrated by the following
diagram.
12
One single sound pressure level is often used to describe a sound. This can be
done by adding the contribution from all octave bands or 1/3 octave bands together to
yield one single sound pressure level.
The response of the ear to sound is dependent on the frequency of the sound. The
human ear has peak response around 2,500 to 3,000 Hz and has a relatively low response
at low frequencies. Hence, the single sound pressure level obtained by simply adding the
contribution from all octave bands or 1/3 octave bands together will not correlate well
with the non-linear frequency response of the human ear.
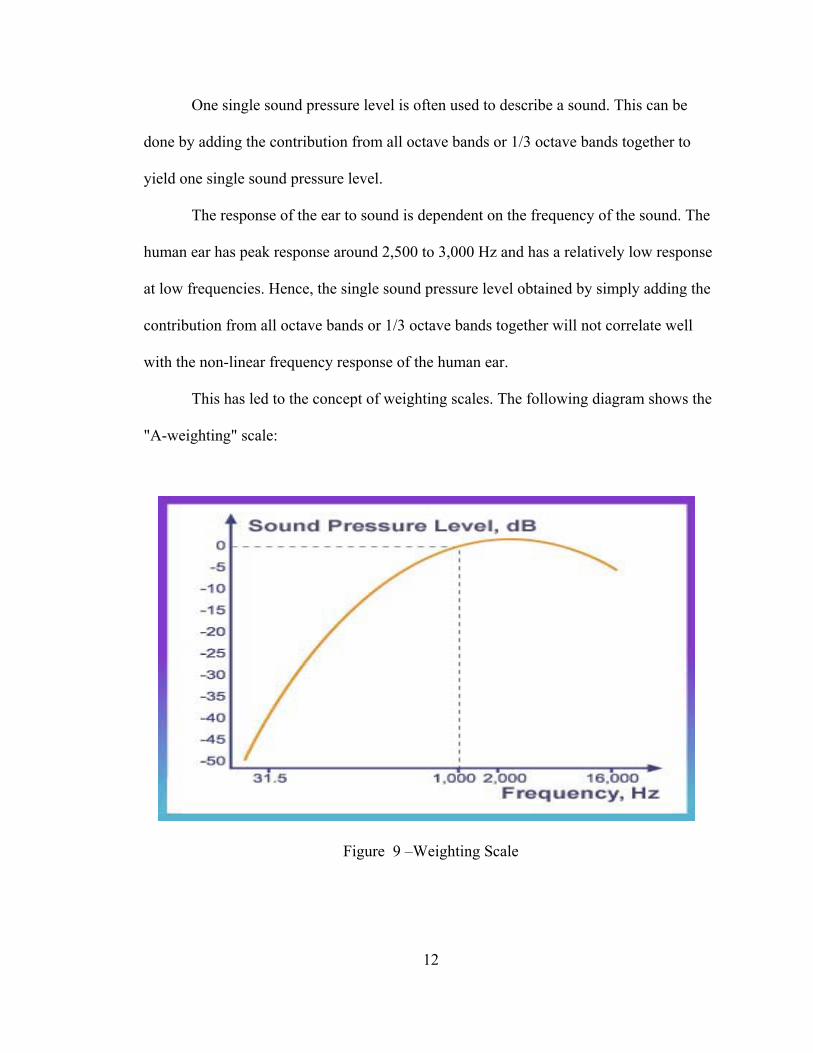
This has led to the concept of weighting scales. The following diagram shows the
"A-weighting" scale:
Figure 9 –Weighting Scale

13
In the "A-weighting" scale, the sound pressure levels for the lower frequency
bands and high frequency bands are reduced by certain amounts before they are being
combined together to give one single sound pressure level value. This value is designated
as dB(A). The dB(A) is often used as it reflects more accurately the frequency response
of the human ear. Weighting networks are often incorporated in measuring equipments to
give readings in dB(A).
Propagation of Sound
In air, sound is transmitted by pressure variations from its source to the
surroundings.
The sound level decreases as it gets further and further away from its source. While
absorption by air is one of the factors attributing to the weakening of a sound during
transmission, distance plays a more important role in noise reduction during transmission.
The reduction of a sound is called attenuation. The effect of distance attenuation
depends on the type of sound sources. Most sounds or noises we encountered in our daily
life are from sources which can be characterized as point or line sources. If a sound
source produces spherical spreading of sound in all directions, it is a point source. [3]
For a point source, the noise level decreases by 6 dB per doubling of distance
from it. If the sound source produces cylindrical spreading of sound as shown in this
diagram, such as stream of motor vehicles on a busy road at a distance, it may be
considered as a line source. Please click on the demo button to see the details. For a line
source, the noise level decreases by 3 dB per doubling of distance from it. [3]
14
CHAPTER 3
Noise Barriers
A noise barrier (also called a soundwall, sound berm, sound barrier, or acoustical barrier)
is an exterior structure designed to protect inhabitants of sensitive land use areas from
noise pollution. Noise barriers are the most effective method of mitigating roadway,
railway, and industrial noise sources – other than cessation of the source activity or use of
source controls.
In the case of surface transportation noise, other methods of reducing the source
noise intensity include encouraging the use of hybrid and electric vehicles, improving
automobile aerodynamics and tire design, and choosing low-noise paving material.
Extensive use of noise barriers began in the United States after noise regulations were
introduced in the early 1970s.
Noise barriers have been built in the United States since the mid-twentieth
century, when vehicular traffic burgeoned. In the late 1960s, acoustical science
technology emerged to mathematically evaluate the efficacy of a noise barrier design
adjacent to a specific roadway. By the 1991s, noise barriers that included use of
transparent materials were being designed in Denmark and other western European
countries. [11]
The best of these early computer models considered the effects of roadway
geometry, topography, vehicle volumes, vehicle speeds, truck mix, roadway surface type,
and micro-meteorology. Several U.S. research groups developed variations of the
computer modeling techniques: Caltrans Headquarters in Sacramento, California; the
ESL Inc. group in Palo Alto, California; the Bolt, Beranek and Newman group in
15
Cambridge, Massachusetts, and a research team at the University of Florida. Possibly the
earliest published work that scientifically designed a specific noise barrier was the study
for the Foothill Expressway in Los Altos, California. [13]
Numerous case studies across the U.S. soon addressed dozens of different existing
and planned highways. Most were commissioned by state highway departments and
conducted by one of the four research groups mentioned above. The U.S. National
Environmental Policy Act [7] effectively mandated the quantitative analysis of noise
pollution from every Federal-Aid Highway Act Project in the country, propelling noise
barrier model development and application. With passage of the Noise Control Act of
1972, demand for noise barrier design soared from a host of noise regulation spinoff.
By the late 1970s, more than a dozen research groups in the U.S. were applying similar
computer modeling technology and addressing at least 200 different locations for noise
barriers each year. As of 2006, this technology is considered a standard in the evaluation
of noise pollution from highways. The nature and accuracy of the computer models used
is nearly identical to the original 1970s versions of the technology. [13]
Sound Attenuation through noise Barriers
The acoustical science of noise barrier design is based upon treating an airway or
railway as a line source. The theory is based upon blockage of sound ray travel toward a
particular receptor; however, diffraction of sound must be addressed. Sound waves bend
(downward) when they pass an edge, such as the apex of a noise barrier. Further
complicating matters is the phenomenon of refraction, the bending of sound rays in the
16
presence of an inhomogeneous atmosphere. Wind shear and thermocline produce such
inhomogeneities. [16]
The sound sources modeled must include engine noise, tire noise, and
aerodynamic noise, all of which vary by vehicle type and speed. The resulting computer
model is based upon dozens of physics equations translated into thousands of lines of
computer code. Software applications are available which are able to model these
situations and assist in the design of such noise barriers.
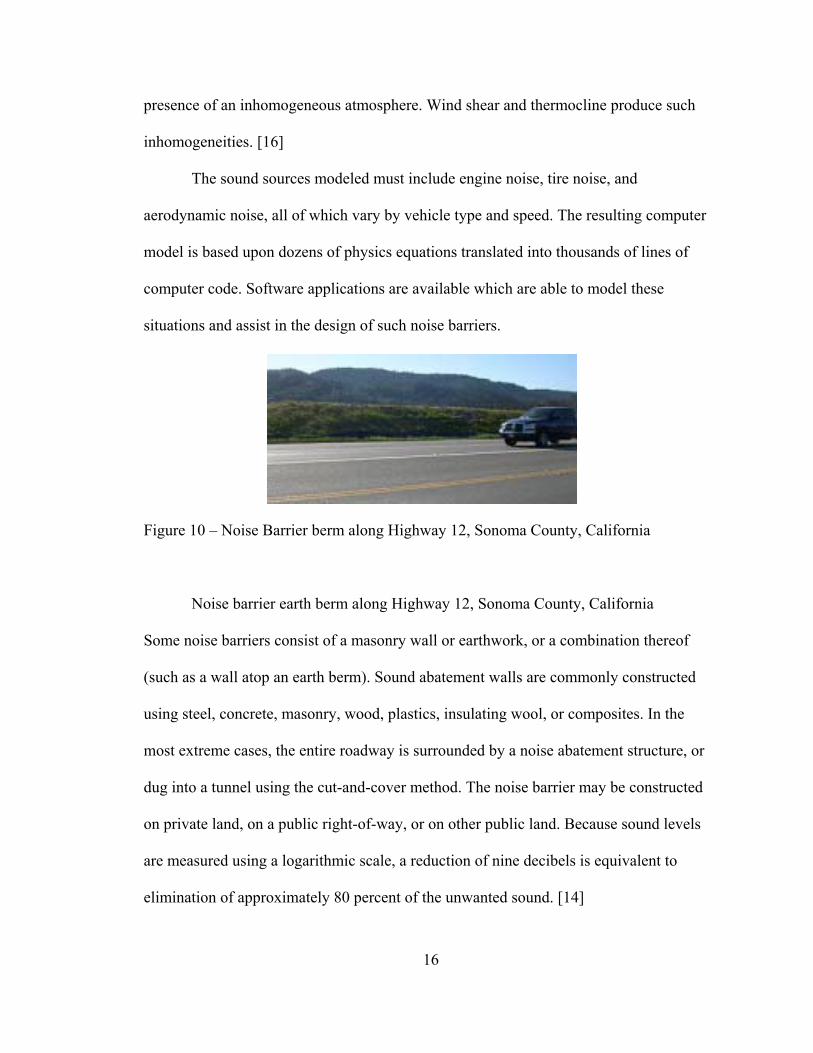
Figure 10 – Noise Barrier berm along Highway 12, Sonoma County, California
Noise barrier earth berm along Highway 12, Sonoma County, California
Some noise barriers consist of a masonry wall or earthwork, or a combination thereof
(such as a wall atop an earth berm). Sound abatement walls are commonly constructed
using steel, concrete, masonry, wood, plastics, insulating wool, or composites. In the
most extreme cases, the entire roadway is surrounded by a noise abatement structure, or
dug into a tunnel using the cut-and-cover method. The noise barrier may be constructed
on private land, on a public right-of-way, or on other public land. Because sound levels
are measured using a logarithmic scale, a reduction of nine decibels is equivalent to
elimination of approximately 80 percent of the unwanted sound. [14]
17
Noise barriers can be extremely effective tools for noise pollution abatement, but
theory calculates that certain locations and topographies are not suitable for use of any
reasonable noise barrier. Cost and aesthetics play a role in the final choice of any noise
barrier. [12]
Normally, the benefits of noise reduction far outweigh aesthetic impacts for
residents protected from unwanted sound. These benefits include lessened sleep
disturbance, improved ability to enjoy outdoor life, reduced speech interference, stress
reduction, reduced risk of hearing impairment, and a reduction in the elevated blood
pressure created by noise that improves cardiovascular health. [15]
18
CHAPTER 4
Studies and Research regarding Sound Attenuation of Sound Absorbing Materials
All materials have some sound absorbing properties. Incident sound energy which
is not absorbed must be reflected, transmitted or dissipated. A material’s sound absorbing
properties can be described as a sound absorption coefficient in a particular frequency
range. The coefficient can be viewed as a percentage of sound being absorbed, where
1.00 is complete absorption (100%) and 0.01 is minimal (1%). [4]
Parameters of Sound
Incident sound striking a room surface yields sound energy comprising reflected
sound, absorbed sound and transmitted sound. Most good sound reflectors prevent sound
transmission by forming a solid, impervious barrier. Conversely, most good sound
absorbers readily transmit sound. Sound reflectors tend to be impervious and massive,
while sound absorbers are generally porous, lightweight material. It is for this reason that
sound transmitted between rooms is little affected by adding sound absorption to the wall
surface.
Absorbing Materials
There are three basic categories of sound absorbers: porous materials commonly
formed of matted or spun fibers; panel (membrane) absorbers having an impervious
surface mounted over an airspace; and resonators created by holes or slots connected to
an enclosed volume of trapped air. The absorptivity of each type of sound absorber is
dramatically (in some cases) influenced by the mounting method employed. [8]
19
1) Porous absorbers: Common porous absorbers include carpet, draperies, spray-applied
cellulose, aerated plaster, fibrous mineral wool and glass fiber, open-cell foam, and felted
or cast porous ceiling tile. Generally, all of these materials allow air to flow into a cellular
structure where sound energy is converted to heat. Porous absorbers are the most
commonly used sound absorbing materials. Thickness plays an important role in sound
absorption by porous materials. Fabric applied directly to a hard, massive substrate such
as plaster or gypsum board does not make an efficient sound absorber due to the very thin
layer of fiber. Thicker materials generally provide more bass sound absorption or
damping. [5]
2) Panel Absorbers: Typically, panel absorbers are non-rigid, non-porous materials which
are placed over an airspace that vibrates in a flexural mode in response to sound pressure
exerted by adjacent air molecules. Common panel (membrane) absorbers include thin
wood paneling over framing, lightweight impervious ceilings and floors, glazing and
other large surfaces capable of resonating in response to sound. Panel absorbers are
usually most efficient at absorbing low frequencies. This fact has been learned repeatedly
on orchestra platforms where thin wood paneling traps most of the bass sound, robbing
the room of “warmth.” [14]
3) Resonators: Resonators typically act to absorb sound in a narrow frequency range.
Resonators include some perforated materials and materials that have openings (holes
and slots). The classic example of a resonator is the Helmholtz resonator, which has the
shape of a bottle. The resonant frequency is governed by the size of the opening, the
length of the neck and the volume of air trapped in the chamber. Typically, perforated
20
materials only absorb the mid-frequency range unless special care is taken in designing
the facing to be as acoustically transparent as possible. Slots usually have a similar
acoustic response. Long narrow slots can be used to absorb low frequencies. For this
reason, long narrow air distribution slots in rooms for acoustic music production should
be viewed with suspicion since the slots may absorb valuable low-frequency energy. [14]

21
CHAPTER 5
Theoretical Basis of Sound Insulation
The sound insulation or sound transmission loss of a wall is that property which
enables it to resist the passage of noise or sound from one side to the other. This should
not be confused with sound absorption which is that property of a material which permits
sound waves to be absorbed, thus reducing the noise level within a given space and
eliminating echoes or reverberations.
Measurement of Sound
The sound insulation of a building assembly is expressed as a reduction factor in decibels
(dB). The decibel is approximately the smallest change in energy the human ear can
detect, and the decibel scale is used for measuring ratios of sound intensities. The
reference sound intensity used to measure absolute noise levels is that corresponding to
the faintest sound a human ear can hear (0 dB). However, a difference of 3 or less dB is
not especially significant, because the human ear cannot detect a change in sounds of less
than 3 dB.
Sound Transmission Loss
It is desirable to have a single number rating as a means for describing the
performance of building elements when exposed to an "average" noise. In the past it was
customary to use the numerical average of the transmission loss values at nine
frequencies. This rating, termed the nine-frequency average transmission loss, is often
quite inaccurate in comparing an assembly of materials having widely differing TL-

22
frequency characteristics. One single number rating method which has been recently
proposed is the sound transmission class (STC). This rating is based on the requirements
that the value of transmission loss at any of the eleven measuring frequencies does not
fall below a specified TL-frequency contour. The shape of this contour is drawn to
represent
The more common types of noise, and generally covers the requirements for
speech privacy.
23
CHAPTER 6
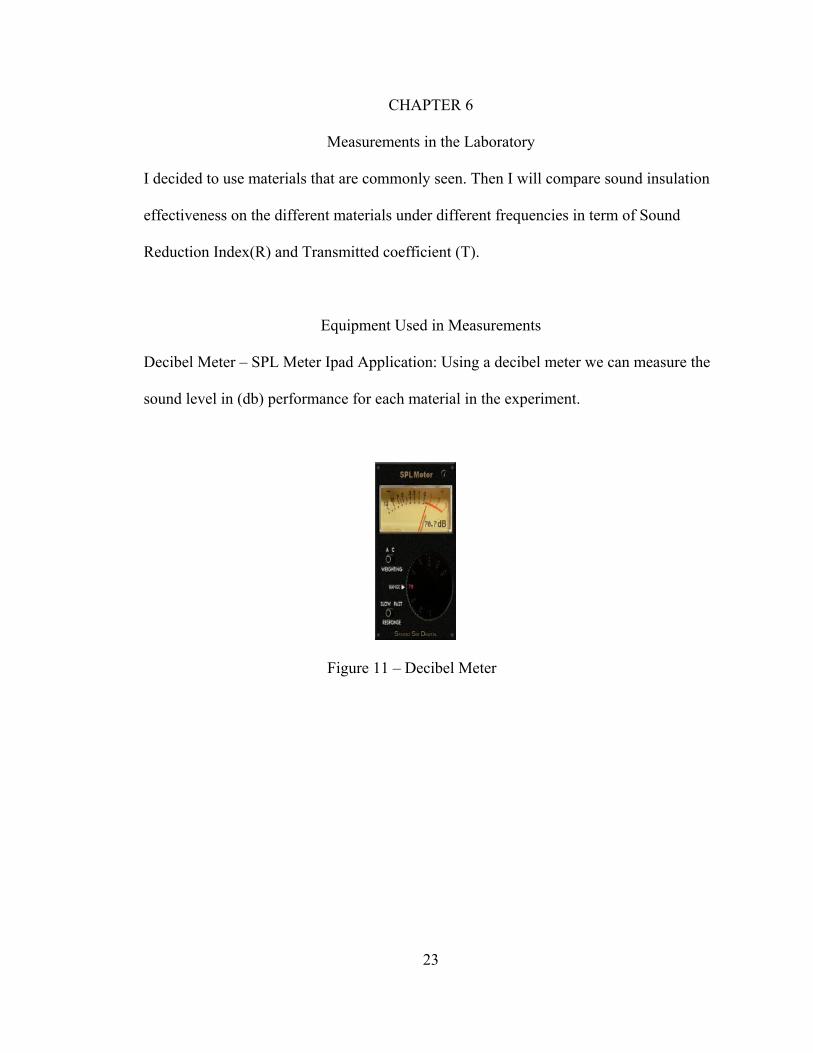
Measurements in the Laboratory
I decided to use materials that are commonly seen. Then I will compare sound insulation
effectiveness on the different materials under different frequencies in term of Sound
Reduction Index(R) and Transmitted coefficient (T).
Equipment Used in Measurements
Decibel Meter – SPL Meter Ipad Application: Using a decibel meter we can measure the
sound level in (db) performance for each material in the experiment.
Figure 11 – Decibel Meter
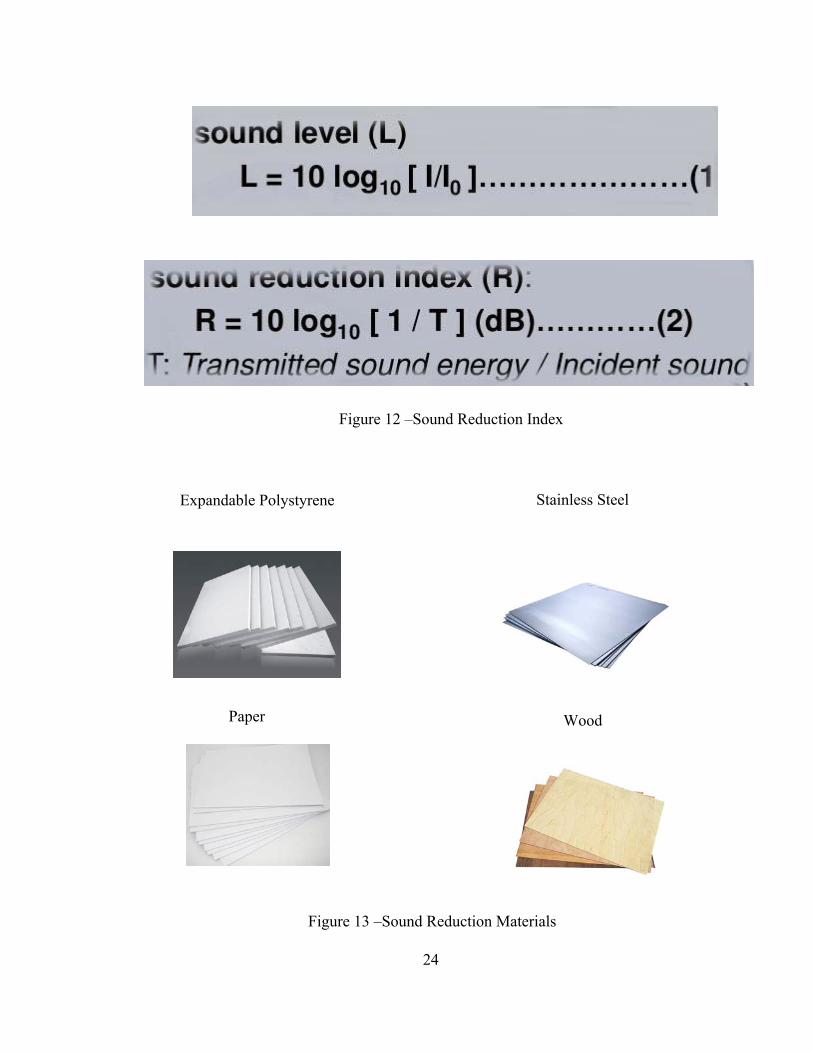
24
Figure 12 –Sound Reduction Index
Expandable Polystyrene Stainless Steel
Wood Paper
Figure 13 –Sound Reduction Materials
Sound Proofing
Soundproofing is any means of reducing the sound pressure with respect to a
specified sound source and receptor. There are several basic approaches to reducing
sound: increasing the distance between source and receiver, using noise barriers to reflect
or absorb the energy of the sound waves, using damping structures such as sound baffles,
or using active anti noise sound generators.
I will be using sound barriers to absorb the energy of the sound waves. The
energy density of sound waves decreases as they spread out, so that increasing the
distance between the receiver and source results in a progressively lesser intensity of
sound at the receiver. In a normal three dimensional setting, with a point source and point
receptor, the intensity of sound waves will be attenuated according to the inverse square
of the distance from the source. I will use the same distance for each test.
Damping
Damping means to reduce resonance in the room, by absorption or redirection
(reflection or diffusion). Absorption will reduce the overall sound level, whereas
redirection makes unwanted sound harmless or even beneficial by reducing coherence.
Damping can reduce the acoustic resonance in the air, or mechanical resonance in the
structure of the room itself or things in the room.
Absorption
Absorbing sound spontaneously converts part of the sound energy to a very small
amount of heat in the intervening object (the absorbing material), rather than sound being
25
transmitted or reflected. There are several ways in which a material can absorb sound.
The choice of sound absorbing material will be determined by the frequency distribution
of noise to be absorbed and the acoustic absorption profile required.
Porous Absorbers
Porous absorbers, typically open cell rubber foams or melamine sponges, absorb
noise by friction within the cell structure. Porous open cell foams are highly effective
noise absorbers across a broad range of medium-high frequencies. Performance is less
impressive at low frequencies.
The exact absorption profile of a porous open cell foam will be determined by a number
of factors including the following:
• Cell size
• Tortuosity
• Porosity
• Material thickness
• Material density
26
27
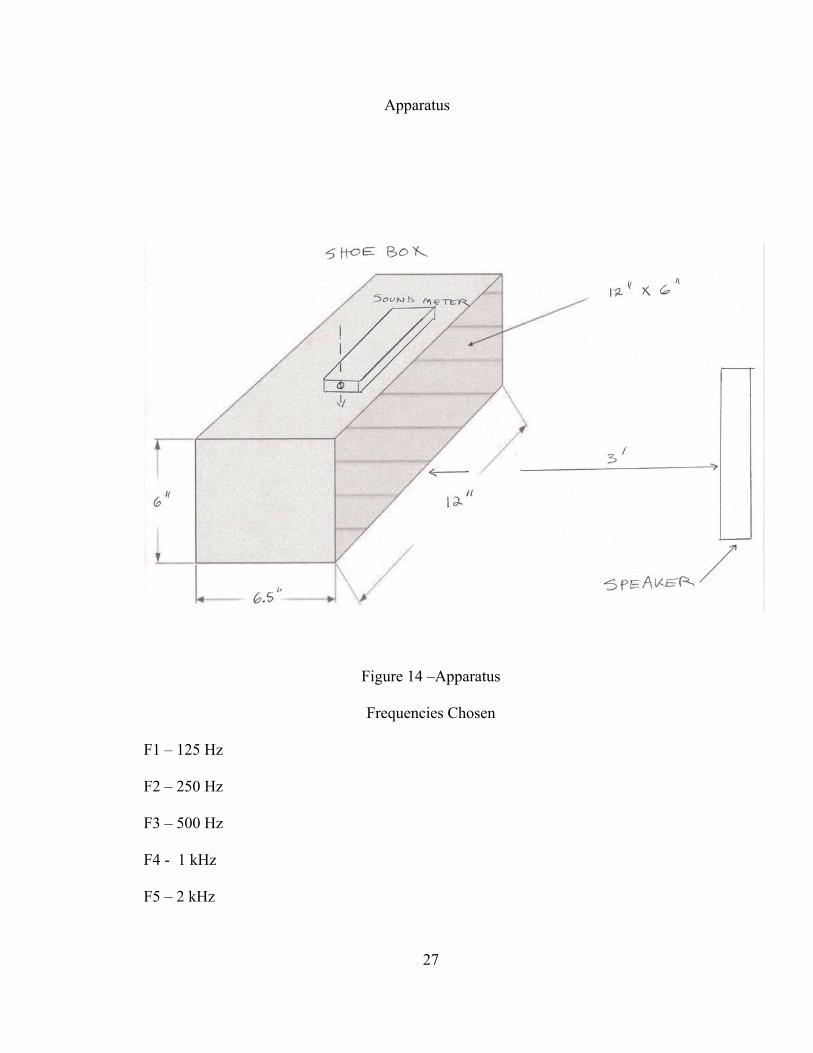
Apparatus
Figure 14 –Apparatus
Frequencies Chosen
F1 – 125 Hz
F2 – 250 Hz
F3 – 500 Hz
F4 - 1 kHz
F5 – 2 kHz
28
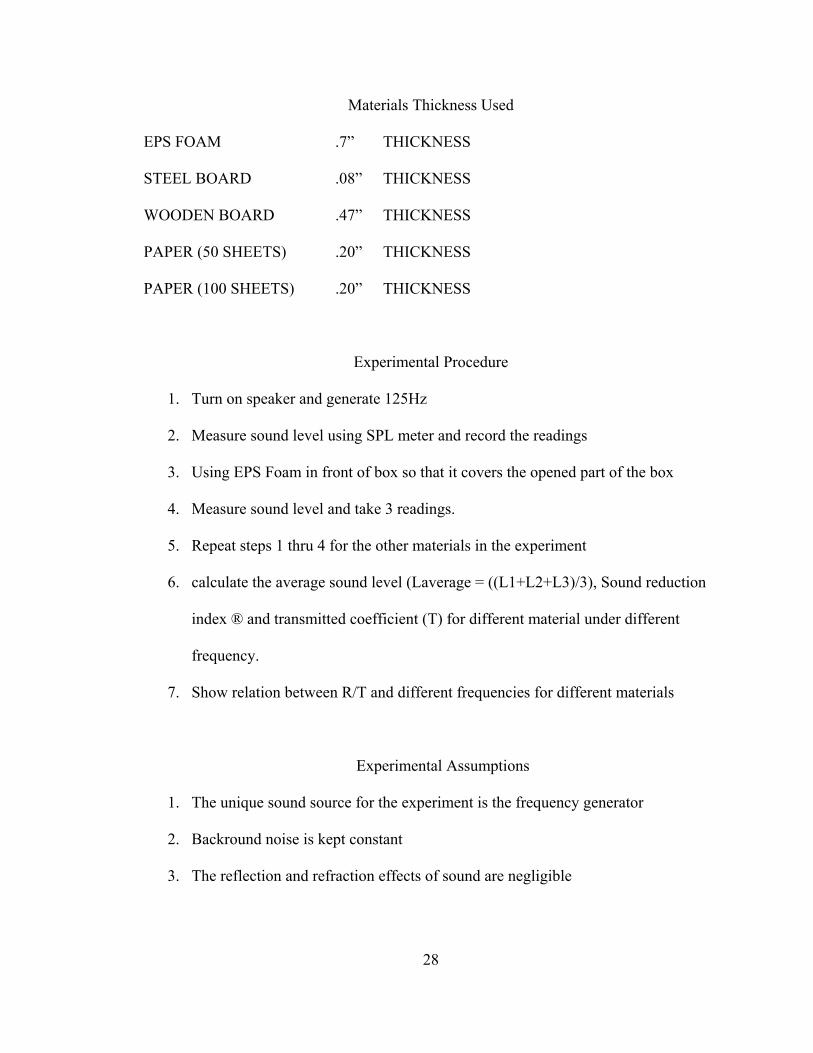
Materials Thickness Used
EPS FOAM .7” THICKNESS
STEEL BOARD .08” THICKNESS
WOODEN BOARD .47” THICKNESS
PAPER (50 SHEETS) .20” THICKNESS
PAPER (100 SHEETS) .20” THICKNESS
Experimental Procedure
1. Turn on speaker and generate 125Hz
2. Measure sound level using SPL meter and record the readings
3. Using EPS Foam in front of box so that it covers the opened part of the box
4. Measure sound level and take 3 readings.
5. Repeat steps 1 thru 4 for the other materials in the experiment
6. calculate the average sound level (Laverage = ((L1+L2+L3)/3), Sound reduction
index ® and transmitted coefficient (T) for different material under different
frequency.
7. Show relation between R/T and different frequencies for different materials
Experimental Assumptions
1. The unique sound source for the experiment is the frequency generator
2. Backround noise is kept constant
3. The reflection and refraction effects of sound are negligible

29
CHAPTER 7
Experimental and Theoretical Results
Materials F1 F2 F3 F4 F5 Sound Level
125Hz 250Hz 500Hz 1kHz 2kHz
EPS Foam 60 71 70 75 77 L(average) (dBb)
7” Thick 3.2 1.4 1.5 .50 5.2 R(db)
.5 .7 .7 .9 .3 T
Steel Board 62 59 53 53 55 L(average) (dBb)
.08” Thick 5.5 9.0 5.0 15.0 19.2 R(db)
.3 .2 .4 .02 .01 T
Wooden Board 69 68 57 56 51 L(average) (dBb)
.47” Thick 3.5 4.0 5.0 10.9 22. R(db)
.45 .4 4.6 10.9 22.0 T
A4 Paper 57 75 75 69 72 L(average) (dBb)
.20” Thick 1.5 1.0 1.0 2.0 2.2 R(db)
.7 .8 .8 .6 .6 T
A4 Paper 54 65 75 64 69 L(average) (dBb)
.40” Thick 1.8 2.6 1.7 6.5 5.5 R(db)
.7 .5 .7 .3 .3 T
Table 1 –Experimental Results

30
CHAPTER 8
Conclusions
1. The greater the R, the greater the sound reduction level.
2. The smaller the T, the greater the sound reduction level.
3. The most effective sound insulation material is the steel board.
4. the least effective sound insulation materials are the EPS foam and A4
Paper(50sheets).

31
REFERENCES
[1] “Perception of Sound - Human Ear.” Sound and Noise. N.p., 22 Feb. 2011. Web.
1 Jan. 2013.
[2] Olson, Ph.D., Andrew. "Frequency-Dependent Sound Absorption." Frequency-
Dependent Sound Absorption. Science Buddies, n.d. Web. 30 May 2012.
[3] "Acoustic Transmission." Wikipedia. Wikimedia Foundation, 09 Nov. 2012.
Web. 30 Apr. 2013.
[4] Maxwell, Clinton. "Cool Ideas: How Sound Insulations Work." Cool Ideas. N.p.,
2012. Web. Jan. 2012.
[5] "Products | Acoustical Solutions, Inc. | Soundproofing and Noise Control
Products." Products | Acoustical Solutions, Inc. | Soundproofing and Noise
Control Products. N.p., 2012. Web. 30 Sept. 2012.
[6] Schmid, Randolph E. “Aging Nation Faces Growing Hearing Loss” 18 February
2007. 28 January 2009.
[7] "NPC Law Library: Noise Regulations & Ordinances From The 50 Biggest
Cities." NPC Law Library: Noise Regulations & Ordinances From The 50 Biggest
Cities. N.p., 29 Jan. 2009. Web. 30 May 2013..
Orellana, Judith. Personal Interview. 31 January 2009
[8] Cox, Trevor J., and Peter D'Antonio. Acoustic Absorbers and Diffusers: Theory,
Design, and Application. London: Spon, 2004. Print.
[9] "Acoustics." Acoustics. N.p., July 2011. Web. 30 May 2014.
32
[10] Buckley, Cara. "U.S. Standards on Workplace Noise Trail Those of Other
Countries." The New York Times. The New York Times, 19 July 2012. Web. 30
May 2013.
[11] Benz Kotzen and Colin English, Environmental Noise Barriers: A Guide to Their
Visual and Acoustic Design, Spon Press, United Kingdom (1999) ISBN 978-0-
419-23180-6
[12] Ballard, George. "Fascinating Facts About Fiber Glass, Rock Wool & Slag Wool
Insulation (N071)." : NAIMA North American Insulation Manufacturers
Association. AIMA, 2011. Web. 02 June 2012.
[13] Kutz, Myer. Handbook of Transportation Engineering. New York: McGraw-Hill,
2011. Print.
[14] Mercolino, Nancy, and Michael Chusid. "Metal and Wood Ceiling Systems."
Scientific American Mind 18.2 (2007): 9. Metal and Wood Ceiling Systems.
Arcomnet, 2007. Web. 2012.
[15] Harris, Cyril M. Noise Control in Buildings: A Guide for Architects and
Engineers. New York: McGraw-Hill, 1994. Print.
[16] Barron, Randall F. Industrial Noise Control and Acoustics. New York: Marcel
Dekker, 2013. Print.


![Building acoustics – Impact sound insulation Brochure · Impact sound reduction ΔL w* up to [dB] 32 25 32 Impact sound reduction ΔL w** up to [dB] 41 35 – Precast element DIBT](https://img.pdfslide.us/doc/110x75/5f5e6d006253c83dca254b7f/building-acoustics-a-impact-sound-insulation-brochure-impact-sound-reduction-l.jpg)