Embed Size (px)
Citation preview
2
SOUND INSULATION AND VIBRATION REDUCTION OF MODIFIED ZINC
ROOF USING NATURAL FIBER ( ARENGA PINNATA )
MOHD KHAIRI BIN MOHD IMRAN
A thesis submitted in
fulfillment of the requirement for the award of the
Master’s of Mechanical Engineering with Honors
Faculty of Mechanical and Manufacturing Engineering
Universiti Tun Hussein Onn Malaysia
JANUARI 2015

6
CONTENTS
TITLE i
DECLARATION ii
DEDICATION iii
ABSTRACT iv
CONTENTS vi
LIST OF FIGURES x
LIST OF APPENDICES
xvi
CHAPTER I INTRODUCTION 1
1.1 Background 1
1.2 Significant of study 2
1.3 Research objective 2
1.4 Scope of study 3
1.5 Project planning 3
CHAPTER II LITERATURE REVIEW 4
2.1 Introduction 4
2.2 Sound absorption 4
2.3 Absorptive materials 7
7
2.4 Particulate reinforced polymer matrix composite 8
2.4.1 Corn cob 8
2.4.2 Pine sawdust 9
2.4.3 Rice-husk 10
2.5 Arenga Pinnata fiber 11
2.5.1 Fiber tensile properties 13
2.6 Roof system 15
2.6.1 Type of roof 15
2.6.2 Metal roof system 15
2.6.3 Metal roof system 18
CHAPTER III METHODOLOGY 19
3.1 Introduction 19
3.2 Material preparation 20
3.3 Roof sample construction 21
3.4 Testing apparatus 22
3.4.1 Impact hammer 22
3.4.2 Accelerometer 23
3.4.3 Sound receiver 24
3.5 Rain Simulator 26
3.6 Rain gauge measurement 27
3.7 Vibration testing 29
3.8 Noise measurement 31
CHAPTER IV DATA ANALYSIS AND DISCUSSION 32
4.1 Introduction 32
4.2 Result and comparison of vibration data for testing A 33
8
4.2.1 Impact at position 1.0 33
4.2.2 Impact at position 1.1 34
4.2.3 Impact at position 1.2 37
4.2.4 Impact at position 2.0 39
4.2.5 Impact at position 2.1 41
4.2.6 Impact at position 2.2 43
4.2.7 Impact at position 1 45
4.2.8 Impact at position 2 47
4.2.9 Impact at position 3 49
4.2.10 Impact at position 4 51
4.2.11 Impact at position 5 53
4.2.12 Impact at position 6 55
4.2.13 Impact at position 7 57
4.3 Result and comparison of vibration data for testing B 59
4.3.14 Impact at position 1.0 59
4.3.15 Impact at position 1.1 61
4.3.16 Impact at position 1.2 63
4.3.17 Impact at position 2.0 65
4.3.18 Impact at position 2.1 67
4.3.19 Impact at position 2.2 69
4.3.20 Impact at position 1 71
4.3.21 Impact at position 2 73
4.3.22 Impact at position 3 75
4.3.23 Impact at position 4 77
4.3.24 Impact at position 5 79
9
4.3.25 Impact at position 6 81
4.3.26 Impact at position 7 83
4.4 Result and comparison of sound data for all samples 85
4.4.1 Basic zinc and painted zinc (testing A) 85
4.4.2 Modified zinc A, B and C (testing B) 87
4.5 Result for precipitation rate by rain simulator 89
4.6 Discussion 90
4.6.1 Vibration test 90
4.6.2 Noise testing 91
4.6.3 Rain simulator 93
CHAPTER V CONCLUSION 94
5.1 Conclusion 94
5.2 Recommendation for future studies 95
REFERENCES 96
APPENDIX 97
10
LIST OF FIGURE
2.1 Room With and Without Sound Absorptive Treatment 5
2.2 Effect of sound absorbers addition 6
2.3 Absorption coefficients of composite materials M1 and M2 9
2.4 Comparison between 25 percents of rice husk 10
with the virgin polyurethane
2.5 Bundle of sugar palm fibers 11
2.6 Images of the surface of sugar palm 13
2.7 Construction of the vegetated roof (VEG) and experimental approach 14
2.8 Metal roof design 16
3.1 Bundle of Arenga Pinnata fibers 20
3.2 Basic zinc roof sample 21
3.3 Paint layered zinc roof sample 21
3.4 Sandwich roof type sample with arenga pinnata in between of zinc. 22
3.5 Impact hammer 23
3.6 Accelerometer 24
3.7 Sound reciever 25
3.8 Rain simulator 26
3.9 The sequel for rain gauge setup 28
11
3.10 Sketch and measurement on zinc roof sample 29
3.11 3 sample of zinc roof 30
3.12 Impulse hammer analysis system 31
4.1 Graph for basic zinc and painted zinc on position 1.0 33
4.2 Graph for basic zinc and painted zinc on position 1.1 35
4.3 Graph for basic zinc and painted zinc on position 1.2 37
4.4 Graph for basic zinc and painted zinc on position 2.0 39
4.5 Graph for basic zinc and painted zinc on position 2.1 41
4.6 Graph for basic zinc and painted zinc on position 2.2 43
4.7 Graph for basic zinc and painted zinc on position 1 45
4.8 Graph for basic zinc and painted zinc on position 2 47
4.9 Graph for basic zinc and painted zinc on position 3 49
4.10 Graph for basic zinc and painted zinc on position 4 51
4.11 Graph for basic zinc and painted zinc on position 5 53
4.12 Graph for basic zinc and painted zinc on position 6 55
4.13 Graph for basic zinc and painted zinc on position 7 57
4.14 Graph for modified zinc A (a) and modified zinc B (b) on position 1.0 59
4.14 Graph for modified zinc C (c) on position 1.0 60
4.15 Graph for modified zinc A (a) and modified zinc B (b) on position 1.1 61
4.15 Graph for modified zinc C (c) on position 1.1 62
4.16 Graph for modified zinc A (a) and modified zinc B (b) on position 1.2 63
4.16 Graph for modified zinc C (c) on position 1.2 64
4.17 Graph for modified zinc A (a) and modified zinc B (b) on position 2.0 65
4.17 Graph for modified zinc C (c) on position 2.0 66
4.18 Graph for modified zinc A (a) and modified zinc B (b) on position 2.1 67
12
4.18 Graph for modified zinc C (c) on position 2.1 68
4.19 Graph for modified zinc A (a) and modified zinc B (b) on position 2.2 69
4.19 Graph for modified zinc C (c) on position 2.2 70
4.20 Graph for modified zinc A (a) and modified zinc B (b) on position 1 71
4.20 Graph for modified zinc C (c) on position 1 72
4.21 Graph for modified zinc A (a) and modified zinc B (b) on position 2 73
4.21 Graph for modified zinc C (c) on position 2 74
4.22 Graph for modified zinc A (a) and modified zinc B (b) on position 3 75
4.22 Graph for modified zinc C (c) on position 3 76
4.23 Graph for modified zinc A (a) and modified zinc B (b) on position 4 77
4.23 Graph for modified zinc C (c) on position 4 78
4.24 Graph for modified zinc A (a) and modified zinc B (b) on position 5 79
4.24 Graph for modified zinc C (c) on position 5 80
4.25 Graph for modified zinc A (a) and modified zinc B (b) on position 6 81
4.25 Graph for modified zinc C (c) on position 6 82
4.26 Graph for modified zinc A (a) and modified zinc B (b) on position 7 83
4.26 Graph for modified zinc C (c) on position 7 84
4.27 Mean graph sound pressure level for basic zinc (a) 85
4.28 Mean graph sound pressure level for painted zinc (b) 86
4.29 Mean graph sound pressure level for modified zinc A (a) 87
and modified zinc B (b)
4.30 Mean graph sound pressure level for modified zinc C (c) 88
4.31 The result for precipitation rate produced by rain simulator 89
4.32 Graph vibration mean value (g*g) versus sound level (dB) 90
13
LIST OF TABLE
2.1 Material and structure for noise control 7
2.2 lists the utilization of sugar palm 12
2.3 Correlation between annoyance and noise disturbance (Side effects) 15
3.1 Microphone specification 25
3.2 Rain simulator equipment 26
4.1 Data for basic and painted zinc on position 1.0 34
4.2 Data for basic and painted zinc on position 1.1 36
4.3 Data for basic and painted zinc on position 1.2 38
4.4 Data for basic and painted zinc on position 2.0 40
4.5 Data for basic and painted zinc on position 2.1 42
4.6 Data for basic and painted zinc on position 2.2 44
4.7 Data for basic and painted zinc on position 1 46
4.8 Data for basic and painted zinc on position 2 48
4.9 Data for basic and painted zinc on position 3 50
4.10 Data for basic and painted zinc on position 4 52
4.11 Data for basic and painted zinc on position 5 54
4.12 Data for basic and painted zinc on position 6 56
4.13 Data for basic and painted zinc on position 7 58
14
4.14 Peak data for position 1.0 60
4.15 Peak data for position 1.1 62
4.16 Peak data for position 1.2 64
4.17 Peak data for position 2.0 66
4.18 Peak data for position 2.1 68
4.19 Peak data for position 2.2 70
4.20 Peak data for position 1 72
4.21 Peak data for position 2 74
4.22 Peak data for position 3 76
4.23 Peak data for position 4 78
4.24 Peak data for position 5 80
4.25 Peak data for position 6 82
4.26 Peak data for position 7 84
4.27 Mean graph vibration for basic, painted and modified zinc 90
4.28 Mean graph vibration for modified zinc A, B and C 90
4.29 Mean graph sound pressure level for basic and painted zinc 91
4.30 Mean graph sound pressure level for modified zinc A, B and C 91
15
LIST OF APPENDICES
A1 Master Project 1 Gantt Chart 98
A2 Master Project 2 Gantt Chart 99
B Calculation
100
C Precipitation Graph
101
16
CHAPTER 1
INTRODUCTION
1.1 Background
Nowadays, due to technology development and environmental situation, noise and
vibration have become a serious environmental problem. Demand on the sound
absorptive materials increased consistently to the industrial development. There are
varieties of materials that used for sound absorption materials, affordability, low rate
of CO2 emissions to the atmosphere, and small energy and water consumptions are
some of the parameters that have to be taken into consideration when a product is
designed. Using green building materials which are renewable, local and abundant is
a solution that contributes to achieve these important goals. The types of green
materials that usually have been used such as bagasse, cereal, straw, corn stalk, corn
cob, cotton stalks, kenaf, rice husks, rice, straw, sunflower hulls and stalks, banana
stalks, coconut coir, bamboo, durian peel, oil palm leaves were amongst products
that can be processed as particleboard, hardboard and fiber board, and focusing on
their thermal insulation ability.
Rain is the most common nature that occurs in Malaysia. . The conventional
metal roof does not have any insulation properties layer to provide good noise and
vibration insulation from the impact of rain. Most of the houses used asbestos board
for ceiling and there is no solid medium between the ceiling and the roof to provide
the noise and vibration insulation. New idea was proposed to design a new solution
for this matter especially to low cost housing areas that used metal roof because it is
cheap compared to brick roof. Metal type roof has very high percentage to rain
noise and vibration exposure. Noise and vibration exposure make the residents feel
17
uncomfortable. Educational institutions, commercial buildings, theatres and stadium
which utilizes metal roofing faced the same problem of rain impact noise and
vibration especially during heavy downfall. When it rains, the raindrops excite the
metal roof panels through random impact force and as a result, the metal panels
resonate and generate high level of noise and vibration, especially during heavy
downpour.
1.2 Significance of Study
This project is to study on the ability of Arenga Pinnata (also known as Ijuk fiber)
as noise and vibration isolator and to find a suitable method as solution to implement
the properties onto the metal roof. This research focuses on suitable design of the
noise and vibration isolator to reduce the noise and vibration at the zinc roof and by
working with this natural fiber could give benefits to our environmental issue and at
the same time hopefully will reduce the cost.
1.3 Research objective
The aim of this research is to investigate the feasibility of Arenga Pinnata (Ijuk)
fiber to be employed as acoustical layer of component. To achieve this aim, several
objectives have been described as follows:
i. To propose the suitable design for the zinc roof that is capable to isolate
noise and vibration using layers of Arenga Pinnata fibers.
ii. To determine suitable vibration absorber using Arenga Pinnata fiber with
zinc roof that can reduce transmitted vibration and noise levels.
1.4 Scope of study
i. Study on the effects of noise and vibration when the Arenga Pinnata
fiber materials sandwich between the zinc roof without paint or
other mixture.
ii. Study about the roof zinc that can facilitate this research.
18
iii. Identify the reduction of noise and vibration using pure Arenga
Pinnata.
iv. Compare the values on noise emission and vibration distribution
between modified zinc roof and standard zinc roof.
1.5 Project Planning
The study on first semester will cover the introduction of reserach work, literature
review and methodology. The second semester will involve by comeout with suitable
roof desgin, testing, and collecting data reading. This include the analysis, discussion
and result and also suggestion for future work.
19
CHAPTER 2
LITERATURE REVIEW
2.1 Introduction
Sound is a form of energy that is transmitted by pressure of air in variations which
the human ear can detect. Sound able to travel through other substances, such as
water or steel. Sound which is not desired is called noise. It is unwanted sound.
Noise may consist of a single pure tone but most cases contain many tones at
different frequencies and intensities. The sources of noise come from industrial
sectors, transportation, construction, building services, domestics’ noise and noise
from leisure activities. Noise may give serious problem on human but it depends on
the frequency exposed to determine its effect. Sound is “absorbed” by energy
conversion into heat in the material. Conventional materials such as glass fibers,
open cell foams, and acoustic tiles are often used as the sound absorbent materials.
These materials are called dissipative or porous materials due to the sound energy
that are dissipated in the interstices of the fibers. Their maximum efficiency occurs at
the typical thickness of these materials.
2.2 Sound Absorption
Sound absorption is defined as incident sound when the wavelength of sound waves
that strikes on a surface is smaller than dimensions of the materials surface. Sound
energy is dissipated into small number of heat as waves bounce around within the
material.
20
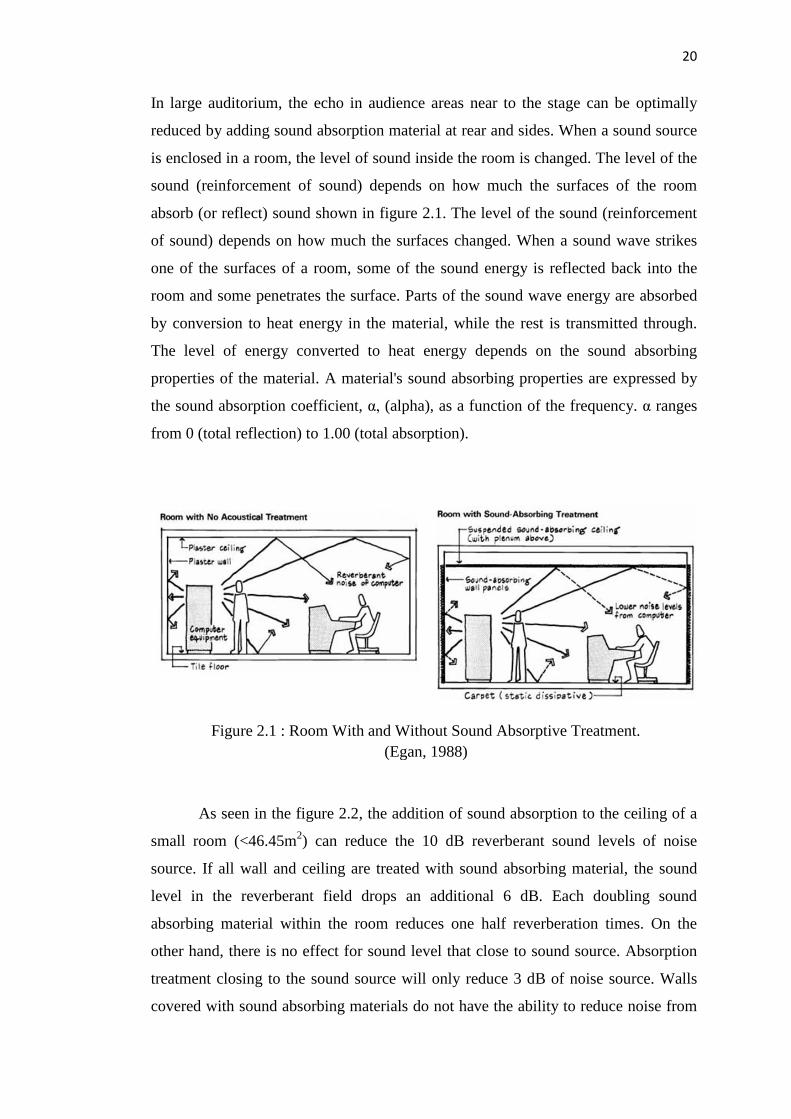
In large auditorium, the echo in audience areas near to the stage can be optimally
reduced by adding sound absorption material at rear and sides. When a sound source
is enclosed in a room, the level of sound inside the room is changed. The level of the
sound (reinforcement of sound) depends on how much the surfaces of the room
absorb (or reflect) sound shown in figure 2.1. The level of the sound (reinforcement
of sound) depends on how much the surfaces changed. When a sound wave strikes
one of the surfaces of a room, some of the sound energy is reflected back into the
room and some penetrates the surface. Parts of the sound wave energy are absorbed
by conversion to heat energy in the material, while the rest is transmitted through.
The level of energy converted to heat energy depends on the sound absorbing
properties of the material. A material's sound absorbing properties are expressed by
the sound absorption coefficient, α, (alpha), as a function of the frequency. α ranges
from 0 (total reflection) to 1.00 (total absorption).
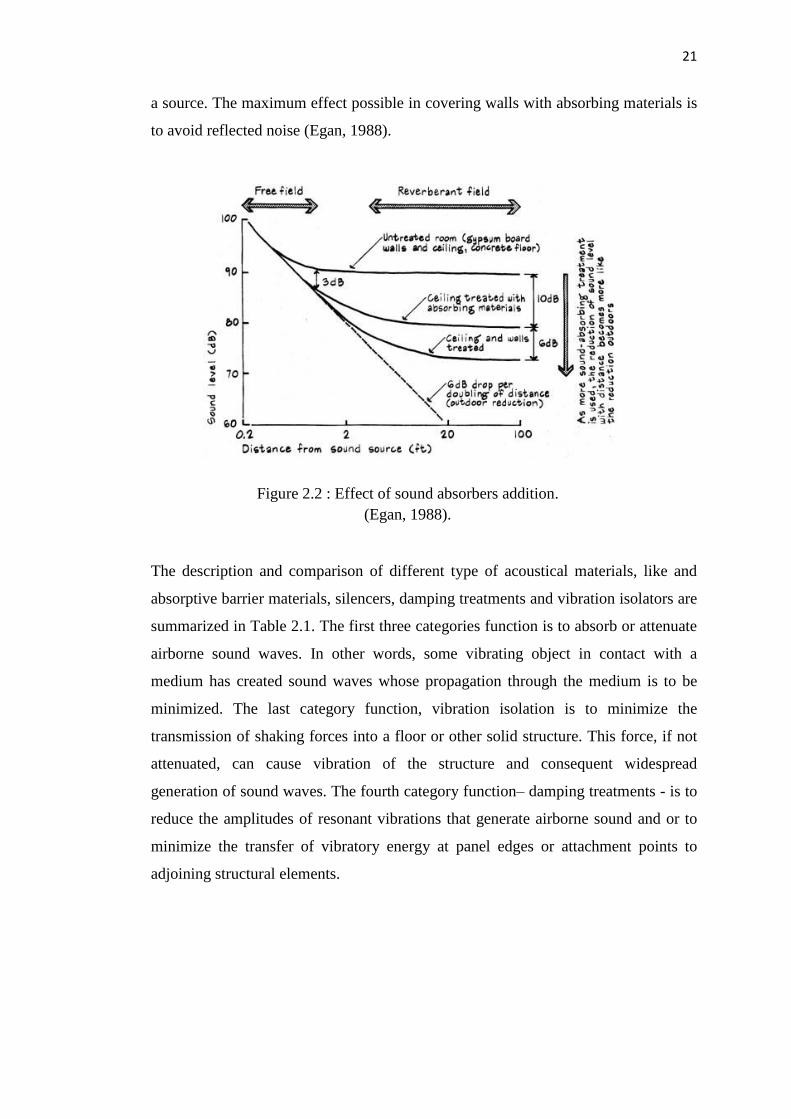
As seen in the figure 2.2, the addition of sound absorption to the ceiling of a
small room (<46.45m2) can reduce the 10 dB reverberant sound levels of noise
source. If all wall and ceiling are treated with sound absorbing material, the sound
level in the reverberant field drops an additional 6 dB. Each doubling sound
absorbing material within the room reduces one half reverberation times. On the
other hand, there is no effect for sound level that close to sound source. Absorption
treatment closing to the sound source will only reduce 3 dB of noise source. Walls
covered with sound absorbing materials do not have the ability to reduce noise from
Figure 2.1 : Room With and Without Sound Absorptive Treatment.
(Egan, 1988)
21
a source. The maximum effect possible in covering walls with absorbing materials is
to avoid reflected noise (Egan, 1988).
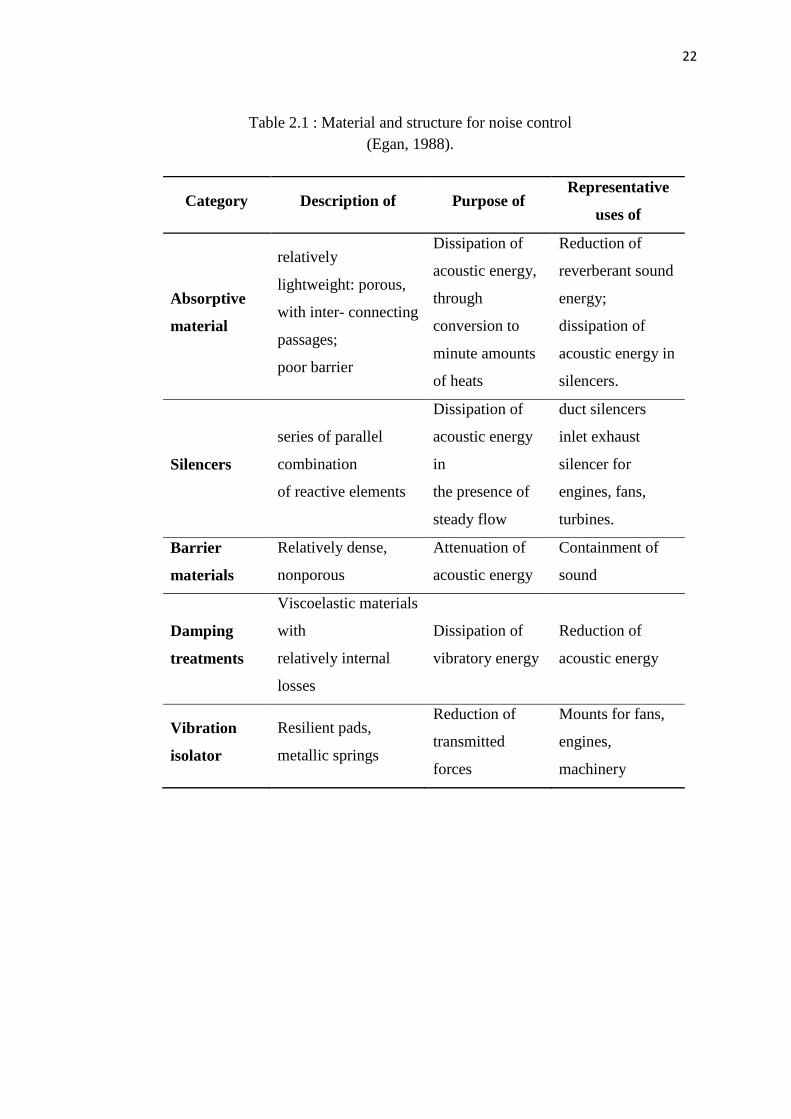
The description and comparison of different type of acoustical materials, like and
absorptive barrier materials, silencers, damping treatments and vibration isolators are
summarized in Table 2.1. The first three categories function is to absorb or attenuate
airborne sound waves. In other words, some vibrating object in contact with a
medium has created sound waves whose propagation through the medium is to be
minimized. The last category function, vibration isolation is to minimize the
transmission of shaking forces into a floor or other solid structure. This force, if not
attenuated, can cause vibration of the structure and consequent widespread
generation of sound waves. The fourth category function– damping treatments - is to
reduce the amplitudes of resonant vibrations that generate airborne sound and or to
minimize the transfer of vibratory energy at panel edges or attachment points to
adjoining structural elements.
Figure 2.2 : Effect of sound absorbers addition.
(Egan, 1988).
22
Category Description of Purpose of Representative
uses of
Absorptive
material
relatively
lightweight: porous,
with inter- connecting
passages;
poor barrier
Dissipation of
acoustic energy,
through
conversion to
minute amounts
of heats
Reduction of
reverberant sound
energy;
dissipation of
acoustic energy in
silencers.
Silencers
series of parallel
combination
of reactive elements
Dissipation of
acoustic energy
in
the presence of
steady flow
duct silencers
inlet exhaust
silencer for
engines, fans,
turbines.
Barrier
materials
Relatively dense,
nonporous
Attenuation of
acoustic energy
Containment of
sound
Damping
treatments
Viscoelastic materials
with
relatively internal
losses
Dissipation of
vibratory energy
Reduction of
acoustic energy
Vibration
isolator
Resilient pads,
metallic springs
Reduction of
transmitted
forces
Mounts for fans,
engines,
machinery
Table 2.1 : Material and structure for noise control
(Egan, 1988).
23
2.3 Absorptive materials
The function of absorptive materials is to transform acoustic energy into heat. The
two mechanisms by which energy is dissipated are viscous-flow losses and internal
friction. Viscous-flow losses are an effective absorber structure which consists of a
series of interconnected pores or voids where sound waves propagate into and
through the structure (Wassilieff C., 1995). Internal friction from some absorptive
materials have resilient fibrous or porous structures that are compressed or flexed by
sound wave propagation. In these structures, dissipation occurs not only from
viscous-flow losses but also from the internal friction of the material itself. The
absorptive characteristics of acoustical materials are determined by their pores or
voids size, interconnections between pores or voids, and material thickness (Ancuta,
B., 2011). The acoustical impedance at the materials surface and at various
frequencies and angles of incidence is probably the best descriptor of the relationship
between material properties and dissipation of acoustic energy.
2.4 Particulate reinforced polymer matrix composite
Polymer composites are an optional substance that basically has replaced
conventional engineering materials such as metals, plastics and ceramics in many
engineering applications lately. Nowadays, composite materials are chosen as
materials in engineering products for a variety of reasons and capabilities of new
product with desired properties including lightweight, high stiffness, high strength,
low thermal expansion, corrosion resistance and long fatigue life. Recently, natural
fiber composites are used in many non-structural and semi-structural applications
due to their low cost, renewable and abundance such as coconut fibers, oil palm
fibers, pineapple leaf fibers and wood fibers reinforced polymer composites.
Previous research (Faustino, J., 2012)on numerous work have been conducted in the
areas of natural fiber composites using different types of fibers from bamboo, oil
palm, rice-husk and wood (Mahzan, 2009).
24
2.4.1 Corn cob
Corn cob has an additional advantage in terms of possible application for alternative
processed products because it does not collide with the worldwide food stock and it
is generally considered as agricultural waste. Corn is mainly farm dominantly in
Portugal. Corn and corn stalk have different uses but the corn cob itself is treated as
agricultural waste which it is necessary to burn. It may fertilize the soil,
unfortunately, this option does not contribute to a better environmentally friendly
world. Corn cob particleboard has been under research in order to assess it as a
possible alternative sustainable solution for different building applications.
Previously, the microstructure and the elementary chemical composition of the corn
cob were identified by performing a scanning electron microscopy/energy dispersive
spectroscopy (SEM/EDS) analysis (Coutts, 2013). These results have inspired us to
think about a possible affordable and sustainable corn cob particleboard solution as
an alternative to the previously reported ones. Therefore, a simple manufacturing
process consisting in binding corn cob particles with wood glue according to the
ratio of 1:4 (glue: corn cob particles), in terms of weight, is proposed here.
2.4.2 Pine sawdust
Knowledge on acoustical materials is essential for the practicing noise control
engineer. Without this knowledge, cost effective control of noise become more a
matter of chance than of intelligent design. In this journal, (Ancuta, 2011) the author
described and compared different type of acoustical materials, such as absorptive
barrier materials, silencer, damping treatments and vibration isolators. The major
characteristics for each of these categories are summarized. The first categories
function is to absorb or attenuate airborne sound waves. Some of the vibrating object
that in contact with a medium has created sound waves whose propagation through
the medium is to be minimized. The next category function is vibration isolation that
is to minimize the transmission of shaking forces into a floor or other solid structure.
Based on this journal, they used pine sawdust with density, ρ = 0.035 g/cm3
to do the experiment on sound absorption coefficient on the material binded with a
commercial polyurethane binder PU 131. The two plate were made from pine
25
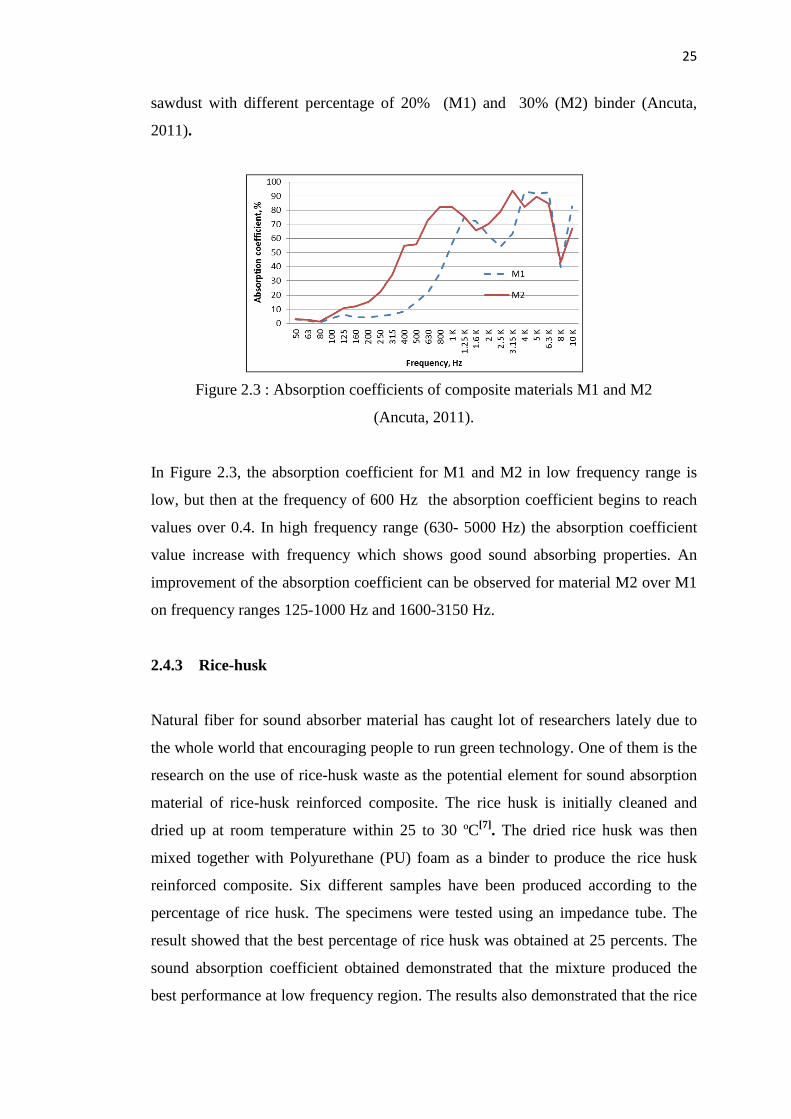
sawdust with different percentage of 20% (M1) and 30% (M2) binder (Ancuta,
2011).
Figure 2.3 : Absorption coefficients of composite materials M1 and M2
(Ancuta, 2011).
In Figure 2.3, the absorption coefficient for M1 and M2 in low frequency range is
low, but then at the frequency of 600 Hz the absorption coefficient begins to reach
values over 0.4. In high frequency range (630- 5000 Hz) the absorption coefficient
value increase with frequency which shows good sound absorbing properties. An
improvement of the absorption coefficient can be observed for material M2 over M1
on frequency ranges 125-1000 Hz and 1600-3150 Hz.
2.4.3 Rice-husk
Natural fiber for sound absorber material has caught lot of researchers lately due to
the whole world that encouraging people to run green technology. One of them is the
research on the use of rice-husk waste as the potential element for sound absorption
material of rice-husk reinforced composite. The rice husk is initially cleaned and
dried up at room temperature within 25 to 30 ºC[7]
. The dried rice husk was then
mixed together with Polyurethane (PU) foam as a binder to produce the rice husk
reinforced composite. Six different samples have been produced according to the
percentage of rice husk. The specimens were tested using an impedance tube. The
result showed that the best percentage of rice husk was obtained at 25 percents. The
sound absorption coefficient obtained demonstrated that the mixture produced the
best performance at low frequency region. The results also demonstrated that the rice
26
husk reinforced composite have a better sound coefficient compared to other natural
materials, hence promising a great potential for commercialization.
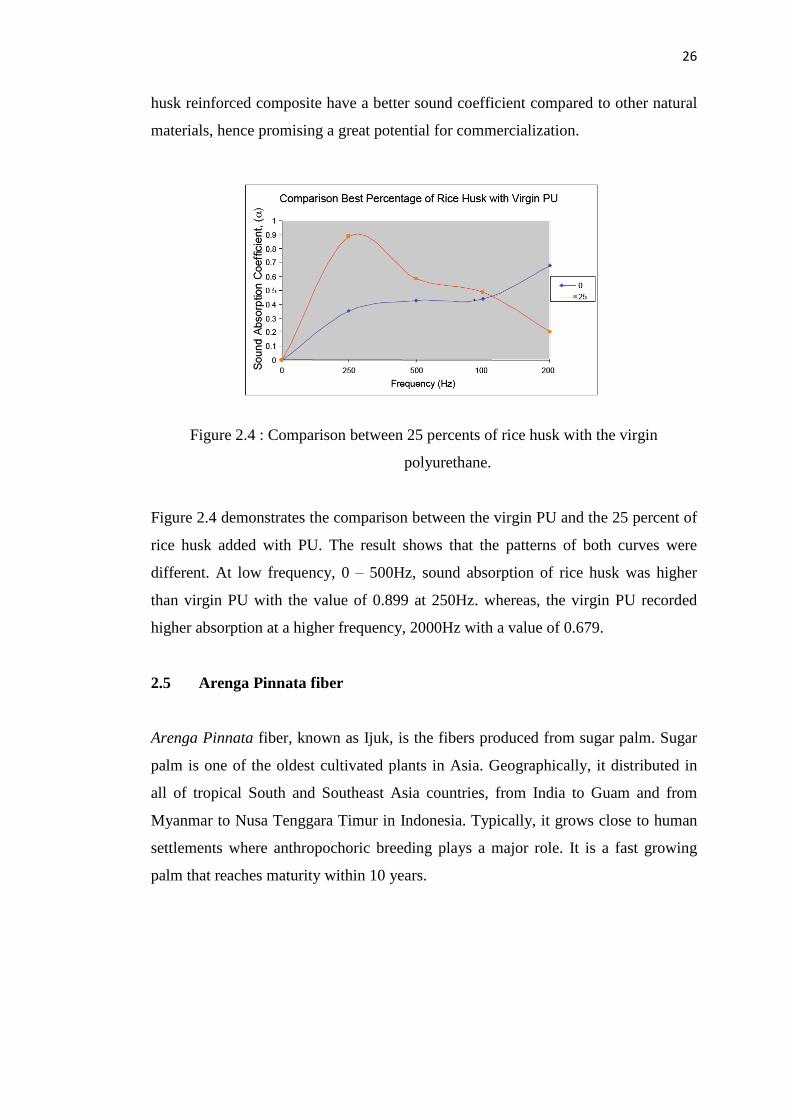
Figure 2.4 : Comparison between 25 percents of rice husk with the virgin
polyurethane.
Figure 2.4 demonstrates the comparison between the virgin PU and the 25 percent of
rice husk added with PU. The result shows that the patterns of both curves were
different. At low frequency, 0 – 500Hz, sound absorption of rice husk was higher
than virgin PU with the value of 0.899 at 250Hz. whereas, the virgin PU recorded
higher absorption at a higher frequency, 2000Hz with a value of 0.679.
2.5 Arenga Pinnata fiber
Arenga Pinnata fiber, known as Ijuk, is the fibers produced from sugar palm. Sugar
palm is one of the oldest cultivated plants in Asia. Geographically, it distributed in
all of tropical South and Southeast Asia countries, from India to Guam and from
Myanmar to Nusa Tenggara Timur in Indonesia. Typically, it grows close to human
settlements where anthropochoric breeding plays a major role. It is a fast growing
palm that reaches maturity within 10 years.
27
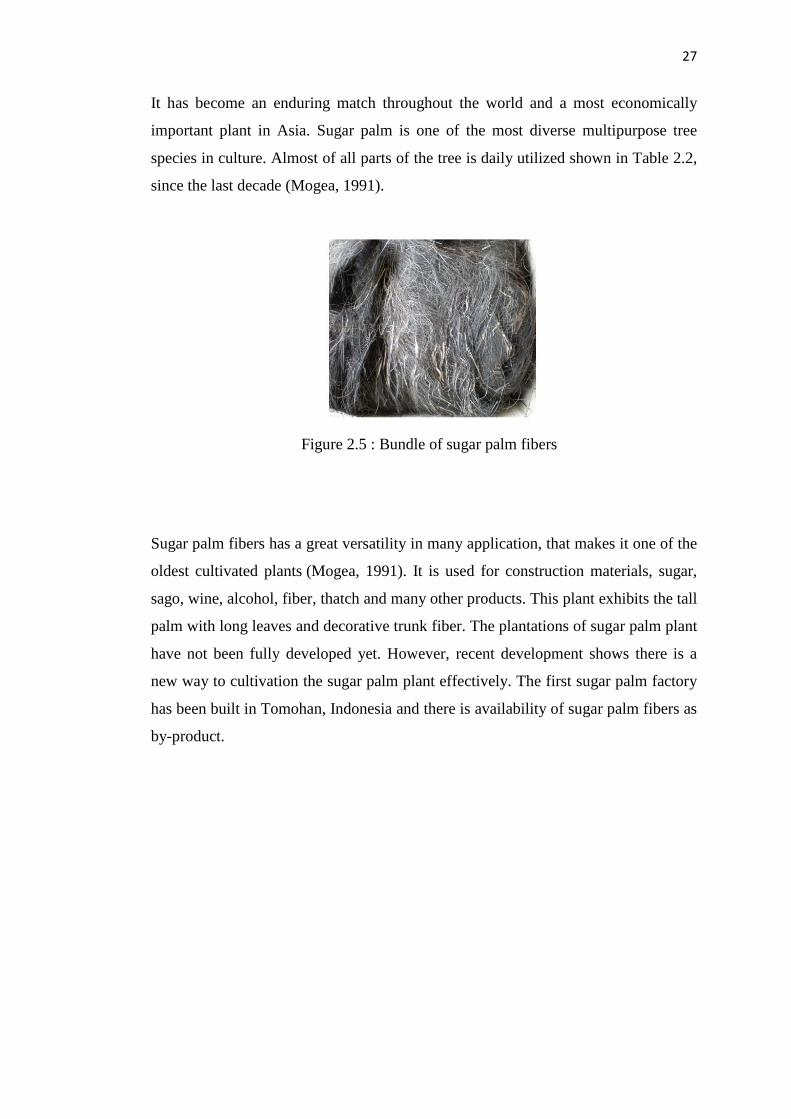
It has become an enduring match throughout the world and a most economically
important plant in Asia. Sugar palm is one of the most diverse multipurpose tree
species in culture. Almost of all parts of the tree is daily utilized shown in Table 2.2,
since the last decade (Mogea, 1991).
Sugar palm fibers has a great versatility in many application, that makes it one of the
oldest cultivated plants (Mogea, 1991). It is used for construction materials, sugar,
sago, wine, alcohol, fiber, thatch and many other products. This plant exhibits the tall
palm with long leaves and decorative trunk fiber. The plantations of sugar palm plant
have not been fully developed yet. However, recent development shows there is a
new way to cultivation the sugar palm plant effectively. The first sugar palm factory
has been built in Tomohan, Indonesia and there is availability of sugar palm fibers as
by-product.
Figure 2.5 : Bundle of sugar palm fibers
28
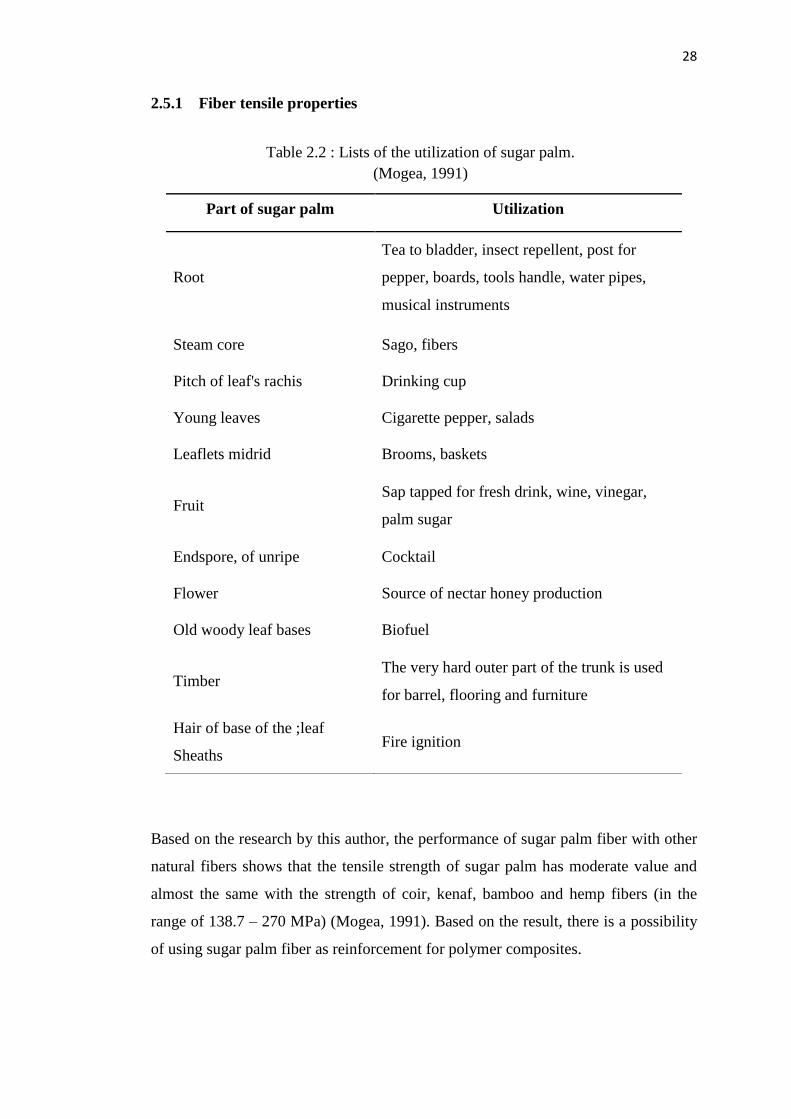
2.5.1 Fiber tensile properties
Based on the research by this author, the performance of sugar palm fiber with other
natural fibers shows that the tensile strength of sugar palm has moderate value and
almost the same with the strength of coir, kenaf, bamboo and hemp fibers (in the
range of 138.7 – 270 MPa) (Mogea, 1991). Based on the result, there is a possibility
of using sugar palm fiber as reinforcement for polymer composites.
Part of sugar palm Utilization
Root
Tea to bladder, insect repellent, post for
pepper, boards, tools handle, water pipes,
musical instruments
Steam core Sago, fibers
Pitch of leaf's rachis Drinking cup
Young leaves Cigarette pepper, salads
Leaflets midrid Brooms, baskets
Fruit Sap tapped for fresh drink, wine, vinegar,
palm sugar
Endspore, of unripe Cocktail
Flower Source of nectar honey production
Old woody leaf bases Biofuel
Timber The very hard outer part of the trunk is used
for barrel, flooring and furniture
Hair of base of the ;leaf
Sheaths Fire ignition
Table 2.2 : Lists of the utilization of sugar palm.
(Mogea, 1991)
29
Natural
fibre
Density
gr./cm
Tensile
strength,
Mpa
Tensile
modulus, Gpa
Strain, % Diameter,
µm
Sugar
palm
1.29 190 3.69 19.6 99-311
Curaua 1.33 655-1404 20.36 3-Feb 49-100
Nettle 1.53 1594 87 2.11 19.9
Hemp 1.48 270 19.1 0.8 31.2
Hemp 1.48 550-900 73 1.6
Jute 1.14 393-773 26.5 1.8
Coir 1.25 138.7 6 10.5 200
Kenaf 1.4 215.4 13-17 1.18-1.31 396.98
Bamboo 0.6-0.8 200.5 10.2
E-Glass 2.55 1800-3000 72-83 3 14
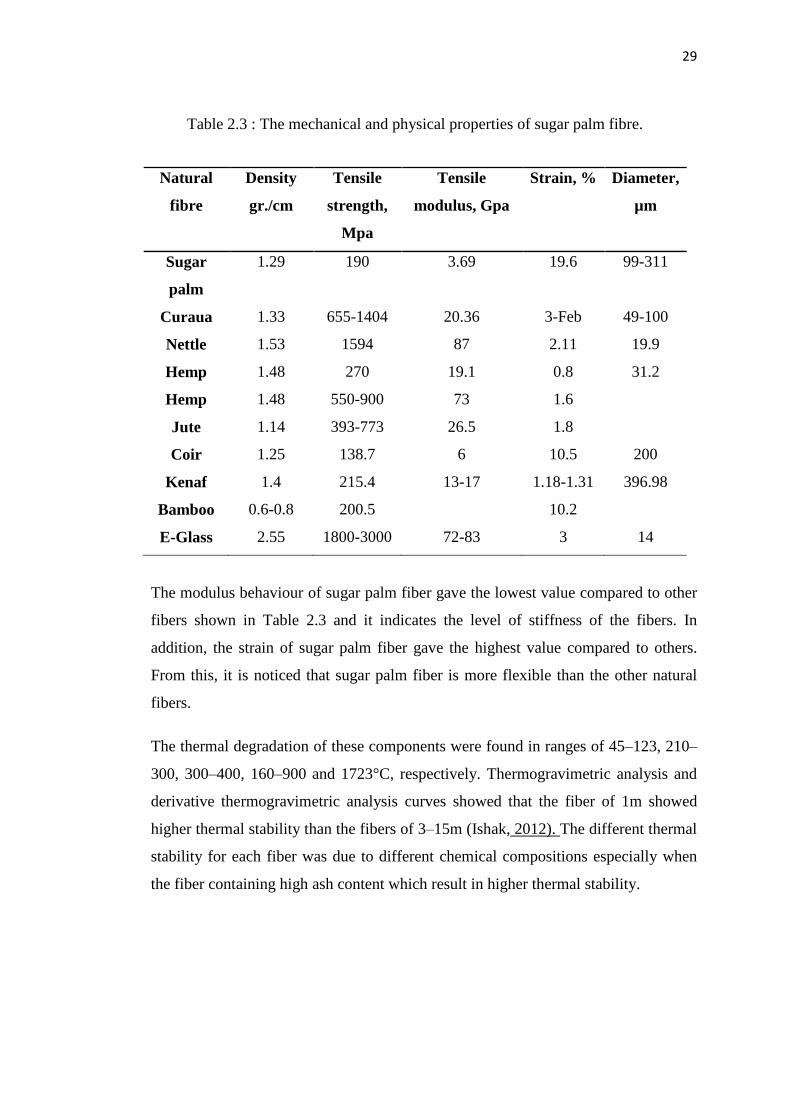
The modulus behaviour of sugar palm fiber gave the lowest value compared to other
fibers shown in Table 2.3 and it indicates the level of stiffness of the fibers. In
addition, the strain of sugar palm fiber gave the highest value compared to others.
From this, it is noticed that sugar palm fiber is more flexible than the other natural
fibers.
The thermal degradation of these components were found in ranges of 45–123, 210–
300, 300–400, 160–900 and 1723°C, respectively. Thermogravimetric analysis and
derivative thermogravimetric analysis curves showed that the fiber of 1m showed
higher thermal stability than the fibers of 3–15m (Ishak, 2012). The different thermal
stability for each fiber was due to different chemical compositions especially when
the fiber containing high ash content which result in higher thermal stability.
Table 2.3 : The mechanical and physical properties of sugar palm fibre.
30
2.6 Roof system
A roof is the essential part of a building which covers the uppermost part of
a building or acts as shelter. The purpose is to provide protection from rain which is
unexpected in Malaysia, but also from heat, wind and sunlight (Tukimat, 2011).
The basic shapes of roofs are flat, skillion, gabled, hipped, arched and domed. There
are many variations on these type (Harris, “Dictionary of Architecture &
Construction”.Roofs) constructed from flat sections that are sloped are referred to
aspitched roofs (generally if the angle exceeds 10 degrees). (Ferreira, 2012) Pitched
roofs, including gabled, hipped and skillion roofs, make up the greatest number of
domestic roofs. Some roofs follow organic shapes, either by architectural design or
because a flexible material such as thatch has been used in the construction.
2.6.1 Type of roof
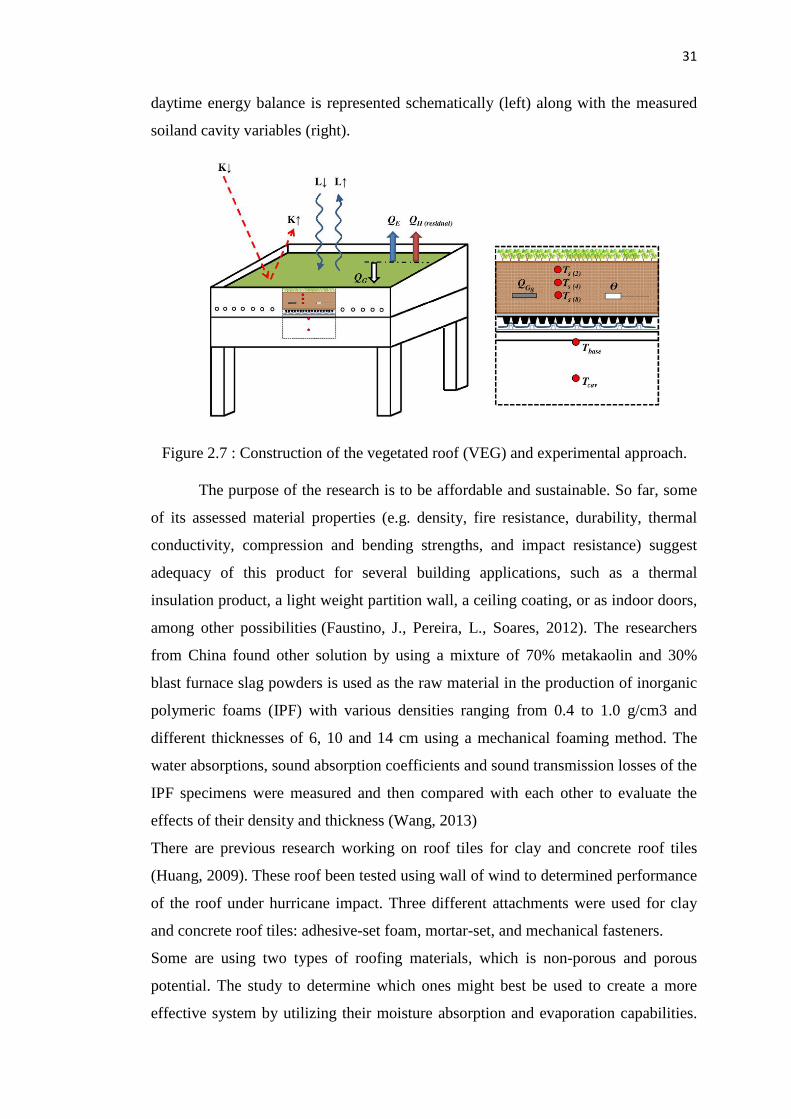
Previous research from this author (Coutts, 2013) shows that they come out with
green effort, the green and cool roofs that are commonly to provide urban heat
mitigation potential; however, their performance is highly dependent upon their
design, particularly green roofs that vary in substrate depth, vegetation species, and
watering regime. This study compares the insulating properties, including a green
roof (extensive green roof planted with Sedum) and a cool roof (uninsulated rooftop
coated with white elastomeric paint)[1]
. They also used other alternative such as
corncob as a particleboard. Figure 2.7 shows a VEG consisted of a plywood base,
steel sheet, black poly membrane, plastic ‘egg cup’ sheet, geotextile layer and a
scoria-soil mixture. The vegetation type was Sedum rubrotinctum. The measured
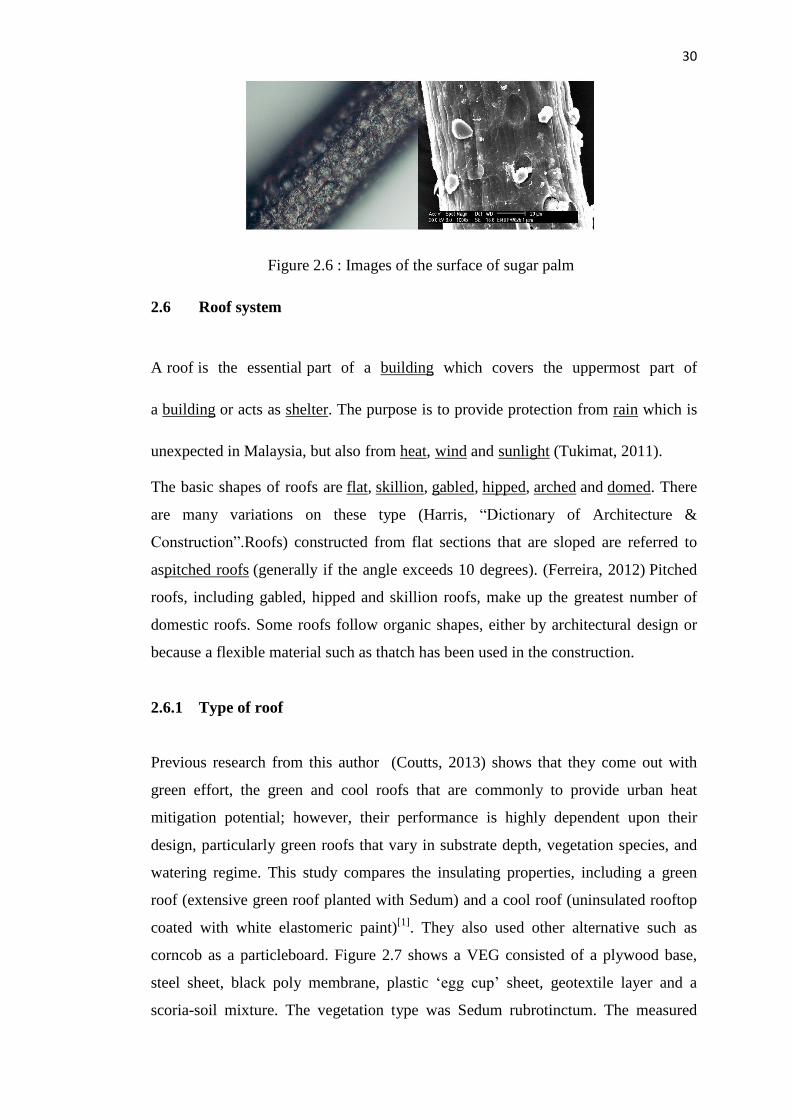
Figure 2.6 : Images of the surface of sugar palm
31
daytime energy balance is represented schematically (left) along with the measured
soiland cavity variables (right).
The purpose of the research is to be affordable and sustainable. So far, some
of its assessed material properties (e.g. density, fire resistance, durability, thermal
conductivity, compression and bending strengths, and impact resistance) suggest
adequacy of this product for several building applications, such as a thermal
insulation product, a light weight partition wall, a ceiling coating, or as indoor doors,
among other possibilities (Faustino, J., Pereira, L., Soares, 2012). The researchers
from China found other solution by using a mixture of 70% metakaolin and 30%
blast furnace slag powders is used as the raw material in the production of inorganic
polymeric foams (IPF) with various densities ranging from 0.4 to 1.0 g/cm3 and
different thicknesses of 6, 10 and 14 cm using a mechanical foaming method. The
water absorptions, sound absorption coefficients and sound transmission losses of the
IPF specimens were measured and then compared with each other to evaluate the
effects of their density and thickness (Wang, 2013)
There are previous research working on roof tiles for clay and concrete roof tiles
(Huang, 2009). These roof been tested using wall of wind to determined performance
of the roof under hurricane impact. Three different attachments were used for clay
and concrete roof tiles: adhesive-set foam, mortar-set, and mechanical fasteners.
Some are using two types of roofing materials, which is non-porous and porous
potential. The study to determine which ones might best be used to create a more
effective system by utilizing their moisture absorption and evaporation capabilities.
Figure 2.7 : Construction of the vegetated roof (VEG) and experimental approach.
32
The measurement results showed that porous materials can satisfactorily lower
surface temperature. The better performance of large size particles could possibly be
caused by the ventilation occurring within the material layers and high solar
penetration through the large gaps between particles, which would release more
latent heat when compared to materials of smaller particle size. Finally, analysis of
surface energy balance suggested that water contents, solar absorptivity, and wind
effects all have significant influences on cooling the surface temperature (Nagano,
2007).
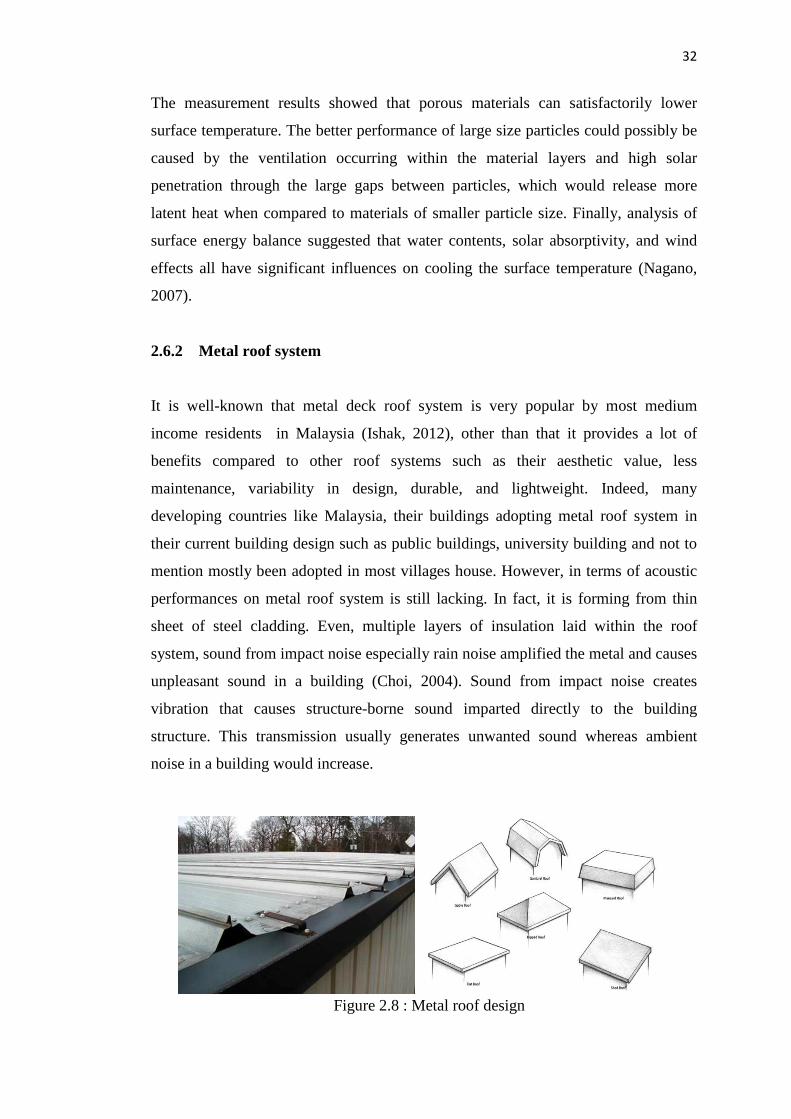
2.6.2 Metal roof system
It is well-known that metal deck roof system is very popular by most medium
income residents in Malaysia (Ishak, 2012), other than that it provides a lot of
benefits compared to other roof systems such as their aesthetic value, less
maintenance, variability in design, durable, and lightweight. Indeed, many
developing countries like Malaysia, their buildings adopting metal roof system in
their current building design such as public buildings, university building and not to
mention mostly been adopted in most villages house. However, in terms of acoustic
performances on metal roof system is still lacking. In fact, it is forming from thin
sheet of steel cladding. Even, multiple layers of insulation laid within the roof
system, sound from impact noise especially rain noise amplified the metal and causes
unpleasant sound in a building (Choi, 2004). Sound from impact noise creates
vibration that causes structure-borne sound imparted directly to the building
structure. This transmission usually generates unwanted sound whereas ambient
noise in a building would increase.
Figure 2.8 : Metal roof design
33
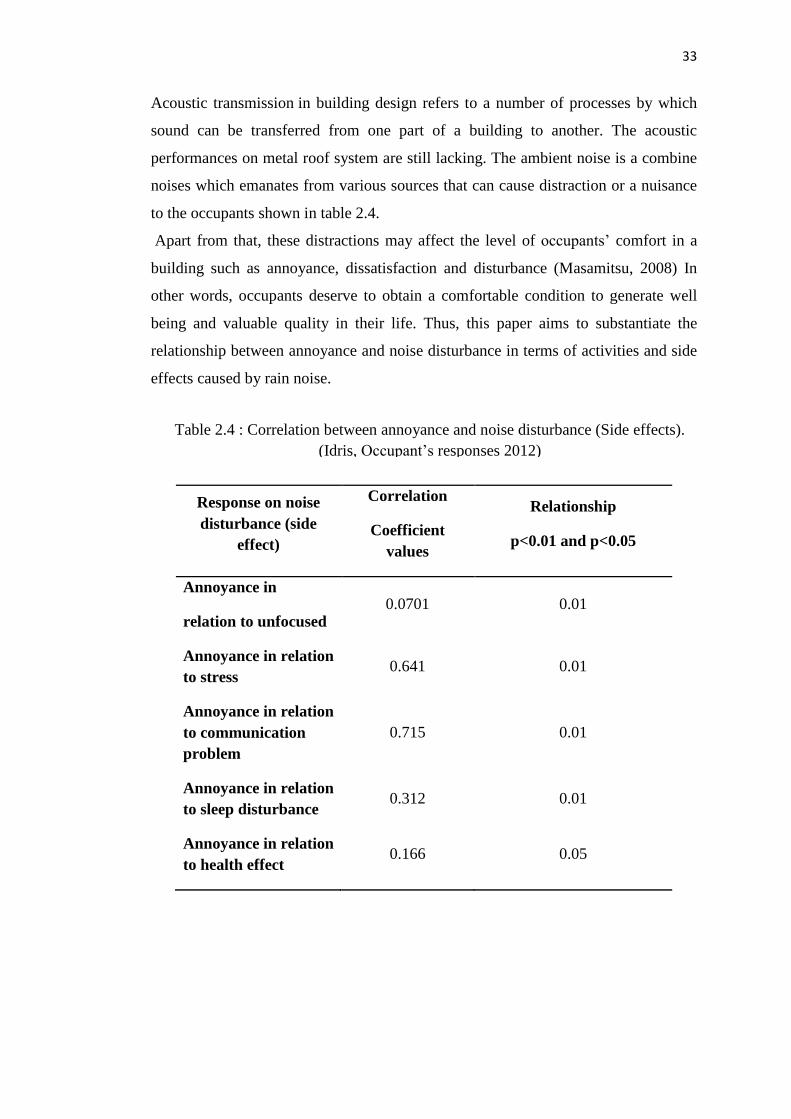
Acoustic transmission in building design refers to a number of processes by which
sound can be transferred from one part of a building to another. The acoustic
performances on metal roof system are still lacking. The ambient noise is a combine
noises which emanates from various sources that can cause distraction or a nuisance
to the occupants shown in table 2.4.
Apart from that, these distractions may affect the level of occupants’ comfort in a
building such as annoyance, dissatisfaction and disturbance (Masamitsu, 2008) In
other words, occupants deserve to obtain a comfortable condition to generate well
being and valuable quality in their life. Thus, this paper aims to substantiate the
relationship between annoyance and noise disturbance in terms of activities and side
effects caused by rain noise.
Response on noise
disturbance (side
effect)
Correlation
Coefficient
values
Relationship
p<0.01 and p<0.05
Annoyance in
relation to unfocused 0.0701 0.01
Annoyance in relation
to stress 0.641 0.01
Annoyance in relation
to communication
problem
0.715 0.01
Annoyance in relation
to sleep disturbance 0.312 0.01
Annoyance in relation
to health effect 0.166 0.05
Table 2.4 : Correlation between annoyance and noise disturbance (Side effects).
(Idris, Occupant’s responses 2012)
34
CHAPTER 3
METHODOLOGY
3.1 Introduction
This chapter discussed about how this study conducted to achieve its objectives. In
every study or experiment, the methodology used is crucial as sometime it will affect
the results of the experiment. So, the right choice of methodology is important for
every study including this one.
In this experiment, the fabrication of sample, the dimensions of the test roof, testing
apparatus, fabrication of testing apparatus and data interpretation was done
specifically to make sure the objective of our research achieved.
35
3.2 Material preparation
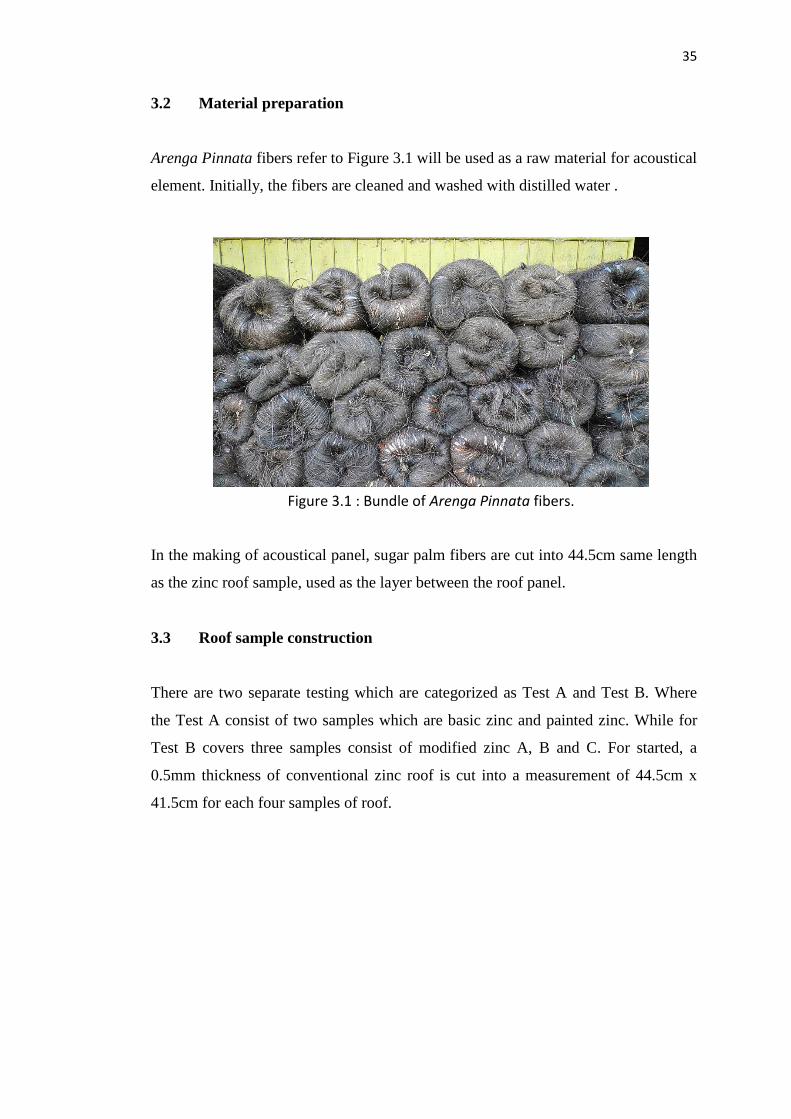
Arenga Pinnata fibers refer to Figure 3.1 will be used as a raw material for acoustical
element. Initially, the fibers are cleaned and washed with distilled water .
In the making of acoustical panel, sugar palm fibers are cut into 44.5cm same length
as the zinc roof sample, used as the layer between the roof panel.
3.3 Roof sample construction
There are two separate testing which are categorized as Test A and Test B. Where
the Test A consist of two samples which are basic zinc and painted zinc. While for
Test B covers three samples consist of modified zinc A, B and C. For started, a
0.5mm thickness of conventional zinc roof is cut into a measurement of 44.5cm x
41.5cm for each four samples of roof.
Figure 3.1 : Bundle of Arenga Pinnata fibers.
36
3.3.1 Samples Test A
(a) (b)
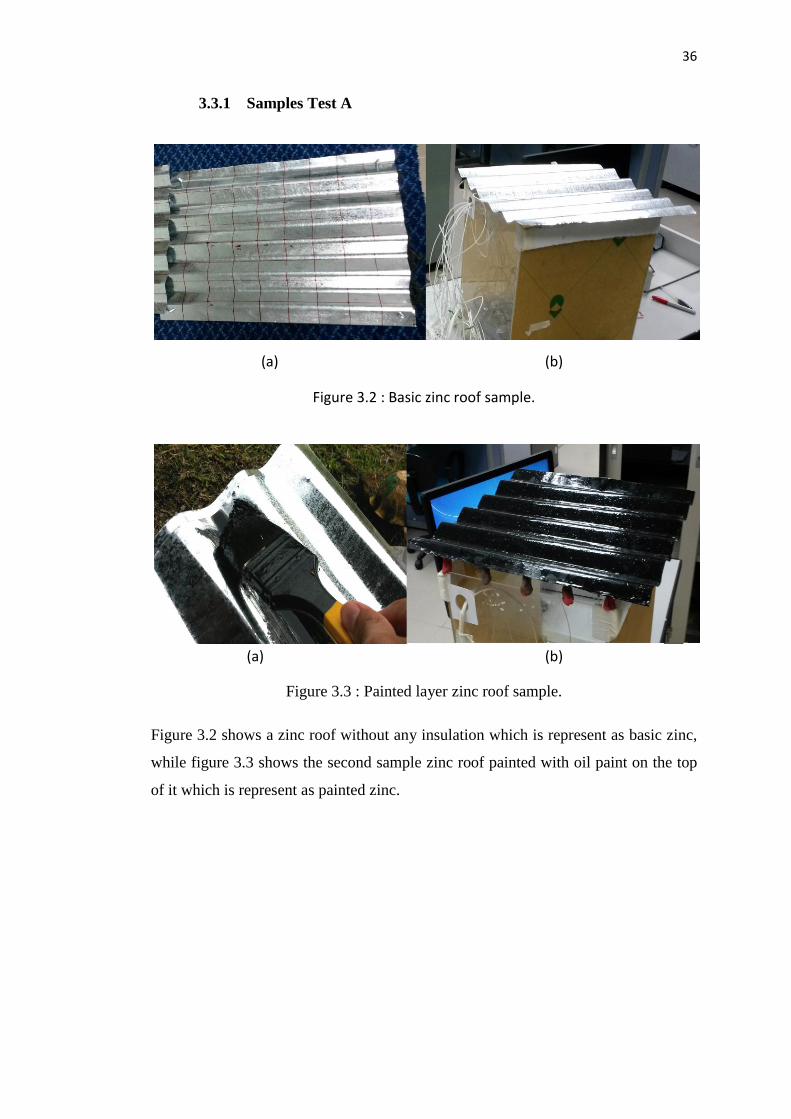
Figure 3.2 : Basic zinc roof sample.
(a) (b)
Figure 3.3 : Painted layer zinc roof sample.
Figure 3.2 shows a zinc roof without any insulation which is represent as basic zinc,
while figure 3.3 shows the second sample zinc roof painted with oil paint on the top
of it which is represent as painted zinc.
37
3.3.2 Samples Test B
(a) (b)
(c) (d)
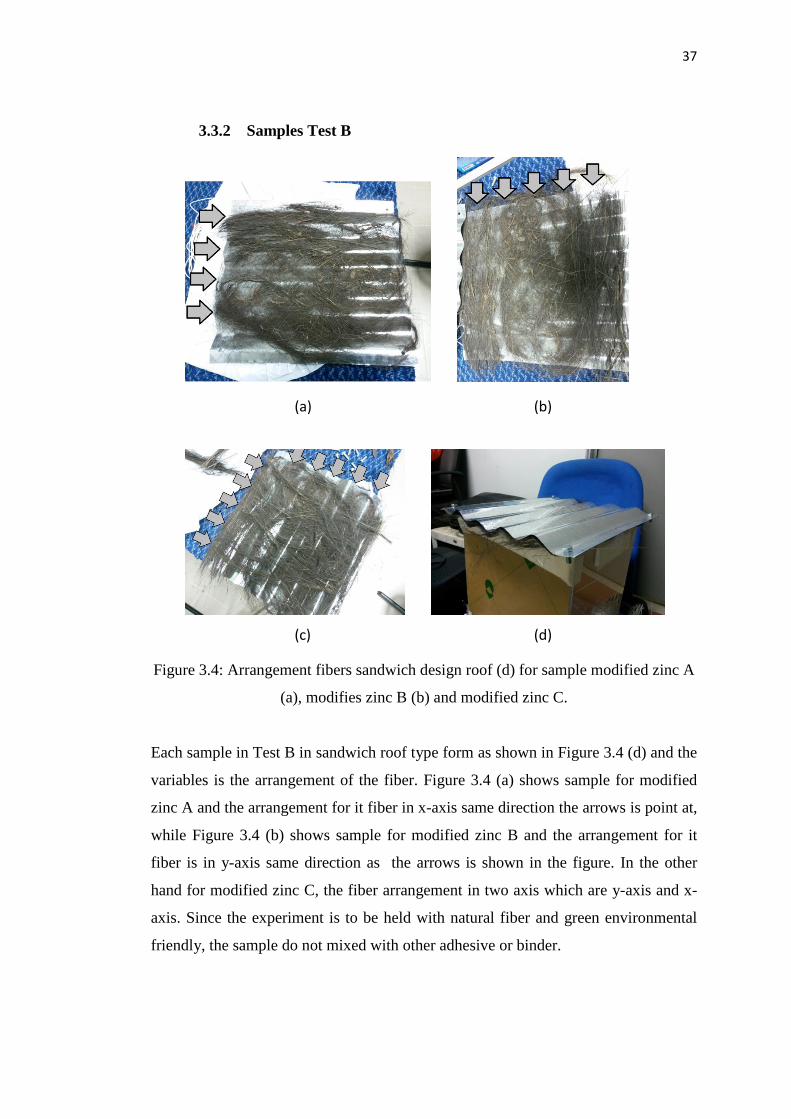
Figure 3.4: Arrangement fibers sandwich design roof (d) for sample modified zinc A
(a), modifies zinc B (b) and modified zinc C.
Each sample in Test B in sandwich roof type form as shown in Figure 3.4 (d) and the
variables is the arrangement of the fiber. Figure 3.4 (a) shows sample for modified
zinc A and the arrangement for it fiber in x-axis same direction the arrows is point at,
while Figure 3.4 (b) shows sample for modified zinc B and the arrangement for it
fiber is in y-axis same direction as the arrows is shown in the figure. In the other
hand for modified zinc C, the fiber arrangement in two axis which are y-axis and x-
axis. Since the experiment is to be held with natural fiber and green environmental
friendly, the sample do not mixed with other adhesive or binder.
38
3.4 Testing Apparatus
The experiments will be conducted in Vibration Laboratory, Universiti Tun Hussien
Malaysia (UTHM). All equipments that used in this project are to measure vibration
testing, noise exposure and rain simulation’s precipitation. The functions of these
equipments is described at below;
3.4.1 Impact Hammer
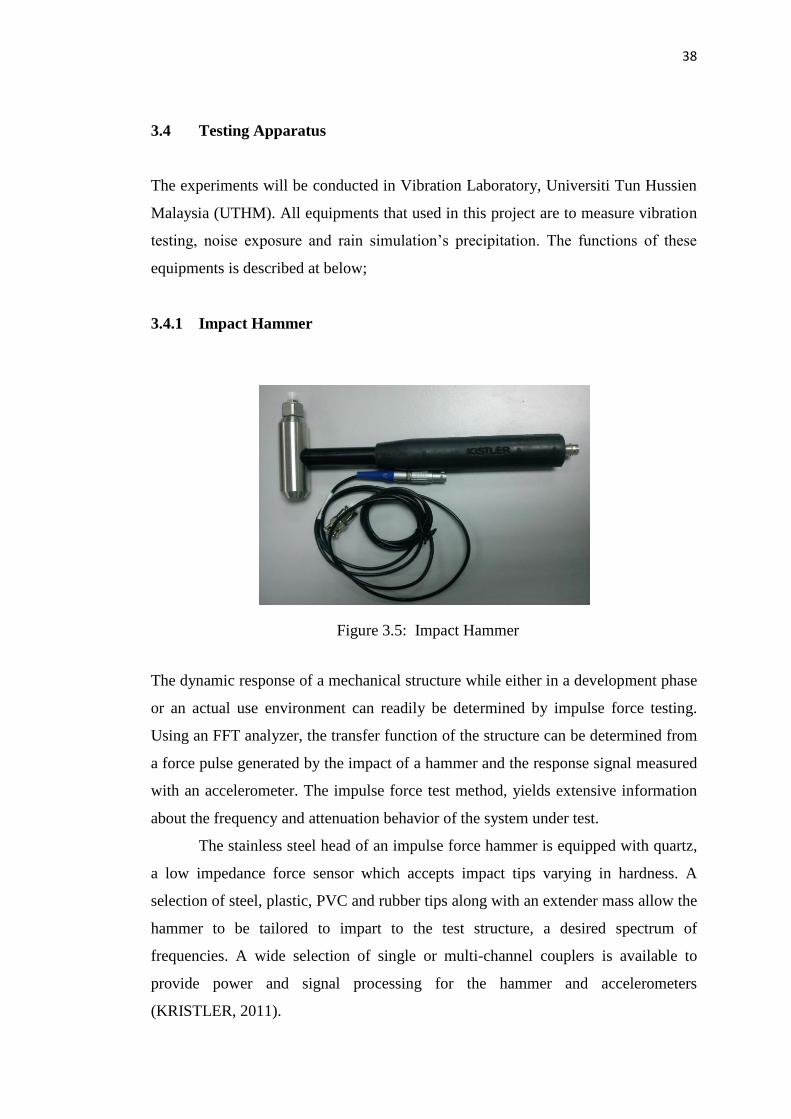
Figure 3.5: Impact Hammer
The dynamic response of a mechanical structure while either in a development phase
or an actual use environment can readily be determined by impulse force testing.
Using an FFT analyzer, the transfer function of the structure can be determined from
a force pulse generated by the impact of a hammer and the response signal measured
with an accelerometer. The impulse force test method, yields extensive information
about the frequency and attenuation behavior of the system under test.
The stainless steel head of an impulse force hammer is equipped with quartz,
a low impedance force sensor which accepts impact tips varying in hardness. A
selection of steel, plastic, PVC and rubber tips along with an extender mass allow the
hammer to be tailored to impart to the test structure, a desired spectrum of
frequencies. A wide selection of single or multi-channel couplers is available to
provide power and signal processing for the hammer and accelerometers
(KRISTLER, 2011).
39
3.4.2 Accelerometer
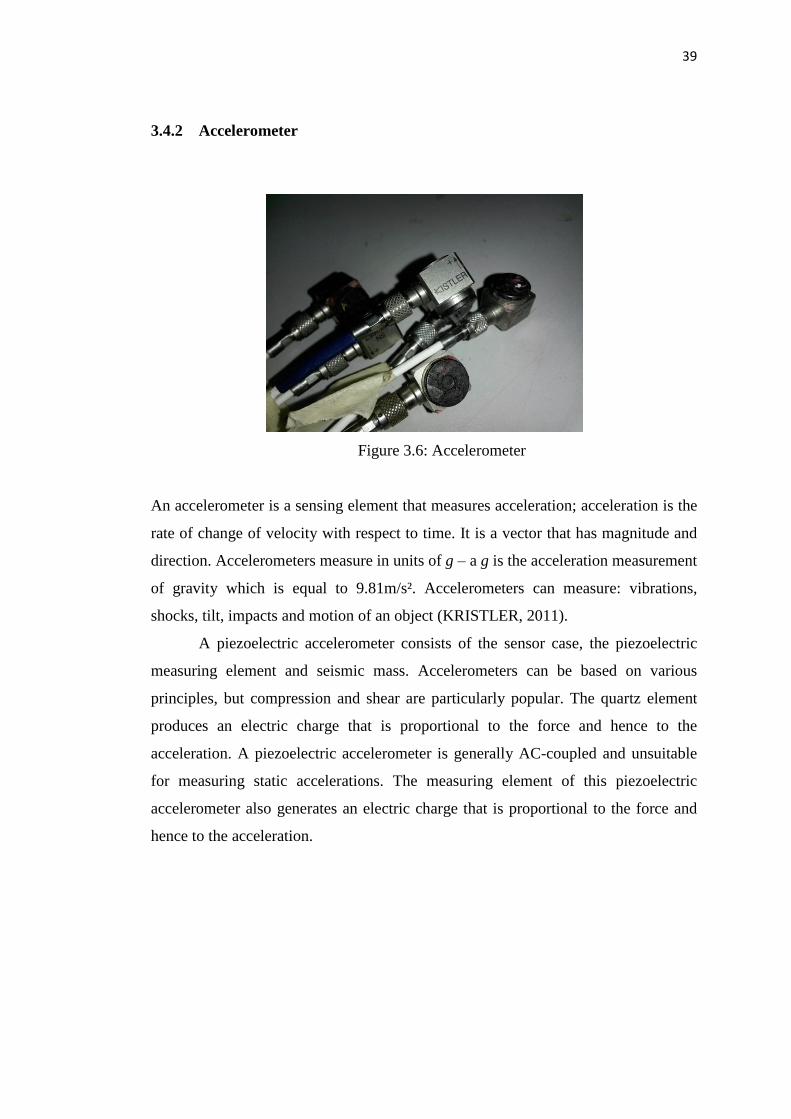
Figure 3.6: Accelerometer
An accelerometer is a sensing element that measures acceleration; acceleration is the
rate of change of velocity with respect to time. It is a vector that has magnitude and
direction. Accelerometers measure in units of g – a g is the acceleration measurement
of gravity which is equal to 9.81m/s². Accelerometers can measure: vibrations,
shocks, tilt, impacts and motion of an object (KRISTLER, 2011).
A piezoelectric accelerometer consists of the sensor case, the piezoelectric
measuring element and seismic mass. Accelerometers can be based on various
principles, but compression and shear are particularly popular. The quartz element
produces an electric charge that is proportional to the force and hence to the
acceleration. A piezoelectric accelerometer is generally AC-coupled and unsuitable
for measuring static accelerations. The measuring element of this piezoelectric
accelerometer also generates an electric charge that is proportional to the force and
hence to the acceleration.
106
REFERENCES
1. Coutts, A. M., Daly, E., Beringer, J., Tapper, N. J., (2013). Assessing
practical measures to reduce urban heat: Green and cool roofs. Monash
University Melbourne Australia.
2. Faustino, J., Pereira, L., Soares, S., Cruz, D., Paiva, A., Varum, H., Ferreira,
J., Pinto, J., (2012). Impact sound insulation technique using corn cob
particleboard. University of Trás-os-Montes Portugal.
3. Hung, T. C., Huang, J. S., Wang, Y. W., Lin, K. Y., (2013). Inorganic
polymeric foam as a sound absorbing and insulating material. National
Cheng Kung University China.
4. Egan, M. D. (1988). Architectural Acoustics. New York: McGraw-Hill.
5. Harold, W. (1987). Noise Control for Engineer. New York.
6. Ancuta, B., Tiberiu, R., Silviu I., Mihaiella, C., Adina, I., (2011). Acoustical
Materials : Sound Absorbing Materials Made of Pine Sawdust. Technical
University of Cluj-Napoca, Romania.
7. Mahzan, S., Zaidi, A.M., Ghazali, M.I., Yahya, M.N., Ismail, M., (2009).
Investigation on Sound Absorption of Rice-Husk Reinforced Composite.
Malaysian Technical Universities Conference on Engineering and
Technology, Kuantan Pahang.
8. Mogea, J., Seibert J. B., Smiths W.(1991) Multipurpose Palms: The Sugar
Palm (Arenga pinnata (Wurmb) Merr.) Agrof Sys.
9. Ishak, M. R., Sapuan, S. M., Leman, Z., Rahman, M. Z. A., Anwar, U. M. K.,
(2012). Characterization of sugar palm (Arenga pinnata) fiber. Universiti
Putra, Malaysia.
10. Tukimat, N. N. A., Harun, S., (2011). The project of future rainfall change
over Kedah, Malaysia with statistical downscaling model. Universiti
Teknologi Malaysia, Johor.
11. Choi, L. Y., (2004 ). “A Study on simulated rainfall noise generated and
prediction of rain noise for composite rood constructions,” M.S. thesis,
Universiti Teknologi Malaysia.
107
12. Masamitsu M., Toshihoto M., Iwao U., Kozo H., Naoki H., Iwao M., Kenichi
M., Koichi Y. & Shinji O., “Relationship between subjective health and
disturbance of daily life due to aircraft noise exposure – questionnaire study
conducted around Narita International Airport” in 9th international congress
on noise as a public health problem (ICBEN) 2008.
13. Wassilieff C., (1995). “Sound absorption of wood-based materials”.
Wellington, Newzealand.
14. Ayoub, A., (2007).“Seismic analysis of wood building structures”.
University of Missouri, United States.
15. Idris, M., Fahmi M., Hamzah, N., Izwani A., Ayop S. M., (2012).
“Occupants' responses on rain noise underneath metal deck roof system”.
UiTM, Shah Alam.
16. Harris, C.M., “Dictionary of Architecture & Construction”.
17. Huang, P., (2009). Mirmiran, A., Bishdid, C., Wang, T. L., “Performance of
Roof Tiles under Simulated Hurricane Impact”.
18. Nagano, K., Wanphen, S., (2007). “Experimental study of the performance of
porous materials to moderate the roof surface temperature by its evaporative
cooling effect”. Hokaido University, Japan.
19. Bachtiar, D., Saouan, S.M., Hamdan, M.M., (2007). “The effect of alkaline
treatment on tensile properties of sugar palm fibre reinforced epoxy
composites”. Universiti Putra Malaysia.
20. Meon, S.M., Othman, F.M., Remeli, F.M., Syawal, M.M., (2012).
“Improving tensile properties of kenaf fibers treated with sodium hydroxide”.
Universiti Teknology Mara, Shah Alam, Malaysia.
21 www.archinect.com/features/article/104336/branner-fellowship-summary-
drip-dry-systems-that-seep.
22. KISTLER. 9726A IMPULSE FORCE HAMMER. Retrieved November 29,
2011, from http://www.dytran.com/img/tech/a11.pdf.
23. KISTLER. The Accelerometer. Retrieved November 29, 2011, from
http://www.sensr.com/pdf/practical-guide-to-accelerometers.pdf .
24. KISTLER. The Accelerometer. Retrieved November 29, 2011, from
http://www.kistler.com/accelerometer_en.

108
25. Sihat, M.Z.H.M., (2013). “Rain Noise And Vibration Transmission Of
Improved Metal Roofs”. Universiti Tun Hussien Onn Malaysia.
26. Malaysia Forecast. http://www.myforecast.com/
27. R. J. Diehl, R. Nowack, and G. Hölzl, (2000) “Solutions for acoustical
problems with ballastless track,” Journal of Sound and Vibration.