Embed Size (px)
Citation preview
Universal Journal of Educational Research 8(11): 5361-5366, 2020 http://www.hrpub.org DOI: 10.13189/ujer.2020.081138
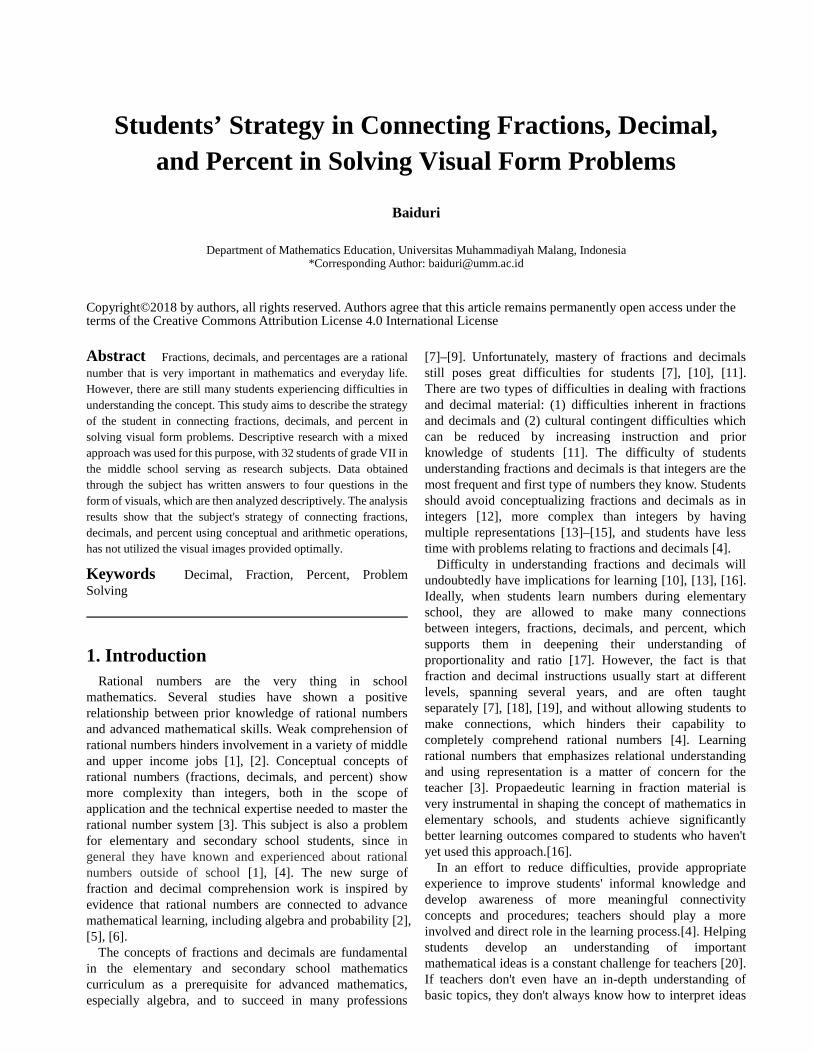
Students' Strategy in Connecting Fractions, Decimal, and Percent in Solving Visual Form Problems
Baiduri
Department of Mathematics Education, Universitas Muhammadiyah, Indonesia
Received July 15, 2020; Revised August 20, 2020; Accepted September 17, 2020
Cite This Paper in the following Citation Styles (a): [1] Baiduri , "Students' Strategy in Connecting Fractions, Decimal, and Percent in Solving Visual Form Problems," Universal Journal of Educational Research, Vol. 8, No. 11, pp. 5361 - 5366, 2020. DOI: 10.13189/ujer.2020.081138.
(b): Baiduri (2020). Students' Strategy in Connecting Fractions, Decimal, and Percent in Solving Visual Form Problems. Universal Journal of Educational Research, 8(11), 5361 - 5366. DOI: 10.13189/ujer.2020.081138.
Copyright©2020 by authors, all rights reserved. Authors agree that this article remains permanently open access under the terms of the Creative Commons Attribution License 4.0 International License
Abstract Fractions, decimals, and percentages are a rational number that is very important in mathematics and everyday life. However, there are still many students experiencing difficulties in understanding the concept due to its complexity in the scope of application and technical. Difficulty in understanding fractions and decimals will undoubtedly have implication for learning. This study aims to describe visual problem-solving strategies related to rational numbers of junior high school students in solving visual form problems. Descriptive research with a mixed approach was used for this purpose, with 32 students of grade VII in the middle school consisting of 10 (31.25%) boys, and 22 (68.75%) girls were used as research subjects. Data obtained through the subject has written answers to four questions in the form of visuals, namely one question determines the fraction, decimal, and percent values of a shaded area and three questions make up an area if a fraction, decimal, and percent value is given and the relationships among of them, which are then analyzed descriptively. The analysis results show that the subject's strategy of connecting fractions, decimals, and percent using conceptual and arithmetic operations, has not utilized the visual images provided optimally. On the other hand, the visual model is very important in understanding abstract mathematical concepts. Thus, the use of multiple visuals in learning fractions, decimals, and percent should be a concern to the teacher, especially on the topic of fractions.
Keywords Decimal, Fraction, Percent, Problem Solving
1. IntroductionRational numbers are the very thing in school
mathematics. Several studies have shown a positive relationship between prior knowledge of rational numbers and advanced mathematical skills. Weak comprehension of rational numbers hinders involvement in a variety of middle and upper income jobs [1], [2]. Conceptual concepts of rational numbers (fractions, decimals, and percent) show more complexity than integers, both in the scope of application and the technical expertise needed to master the rational number system [3]. This subject is also a problem for elementary and secondary school students, since in general they have known and experienced about rational numbers outside of school [1], [4]. The new surge of fraction and decimal comprehension work is inspired by evidence that rational numbers are connected to advance mathematical learning, including algebra and probability [2], [5], [6].
The concepts of fractions and decimals are fundamental in the elementary and secondary school mathematics curriculum as a prerequisite for advanced mathematics, especially algebra, and to succeed in many professions [7]–[9]. Unfortunately, mastery of fractions and decimals still poses great difficulties for students [7], [10], [11]. There are two types of difficulties in dealing with fractions and decimal material: (1) difficulties inherent in fractions and decimals and (2) cultural contingent difficulties which can be reduced by increasing instruction and prior knowledge of students [11]. The difficulty of students understanding fractions and decimals is that integers are the most frequent and first type of numbers they know. Students should avoid
5362 Students' Strategy in Connecting Fractions, Decimal, and Percent in Solving Visual Form Problems
conceptualizing fractions and decimals as in integers [12], more complex than integers by having multiple representations [13]–[15], and students have less time with problems related to fractions and decimals [4].
Difficulty in understanding fractions and decimals will undoubtedly have implications for learning [10], [13], [16]. Ideally, when students learn numbers during elementary school, they are allowed to make many connections between integers, fractions, decimals, and percent, which supports them in deepening their understanding of proportionality and ratio [17]. However, the fact is that fraction and decimal instructions usually start at different levels, spanning several years, and are often taught separately [7], [18], [19], and without allowing students to make connections, which hinders their capability to completely comprehend rational numbers [4]. Learning rational numbers that emphasizes relational understanding and using representation is a matter of concern for the teacher [3]. Propaedeutic learning in fraction material is very instrumental in shaping the concept of mathematics in elementary schools, and students achieve significantly better learning outcomes compared to students who haven't yet used this approach. [16]
In an effort to reduce difficulties, provide appropriate experience to improve students' informal knowledge and develop awareness of more meaningful connectivity concepts and procedures; teachers should play a more involved and direct role in the learning process. [4] Helping students develop an understanding of important mathematical ideas is a constant challenge for teachers [20]. If teachers don't even have an in-depth understanding of basic topics, they don't always know how to interpret ideas and make them easy to understand, and they often fail to convey concepts to be understood by students [21]. Teachers with a poor understanding of rational numbers and operations involving fractions and decimals will be barriers for students in learning algebra [11]. Interventions using story problems provide a substantial advantage in learning fractions, decimals, and percentages [11]. Building a comprehension of the products with similar of
rational numbers and the connection among fractions, decimals, and percentages by developing a visual model of rational numbers is very important [4]
Based on the fact that understanding the concept of rational numbers is of great importance and visual models can build a comprehension of the connection among fractions, decimals, and percent, then in this study using visual form problems in an effort to explore strategies that students do in determining fraction, decimal, and percent values and the relationship between the three. Problem- solving is one of the strategies in learning mathematics.
2. Methods This study aims to describe visual problem-solving
strategies related to rational numbers of junior high school students, without intervening on the subject. The type of research used is descriptive with a qualitative and quantitative approach [22]. The subject of the research is taken from grade VII which happened to be the only class in private middle school numbered 32 people (all students) consisting of 10 (31.25%) boys, and 22 (68.75%) girls. In addition, the research ignores the characteristics of students, such as mathematical ability.
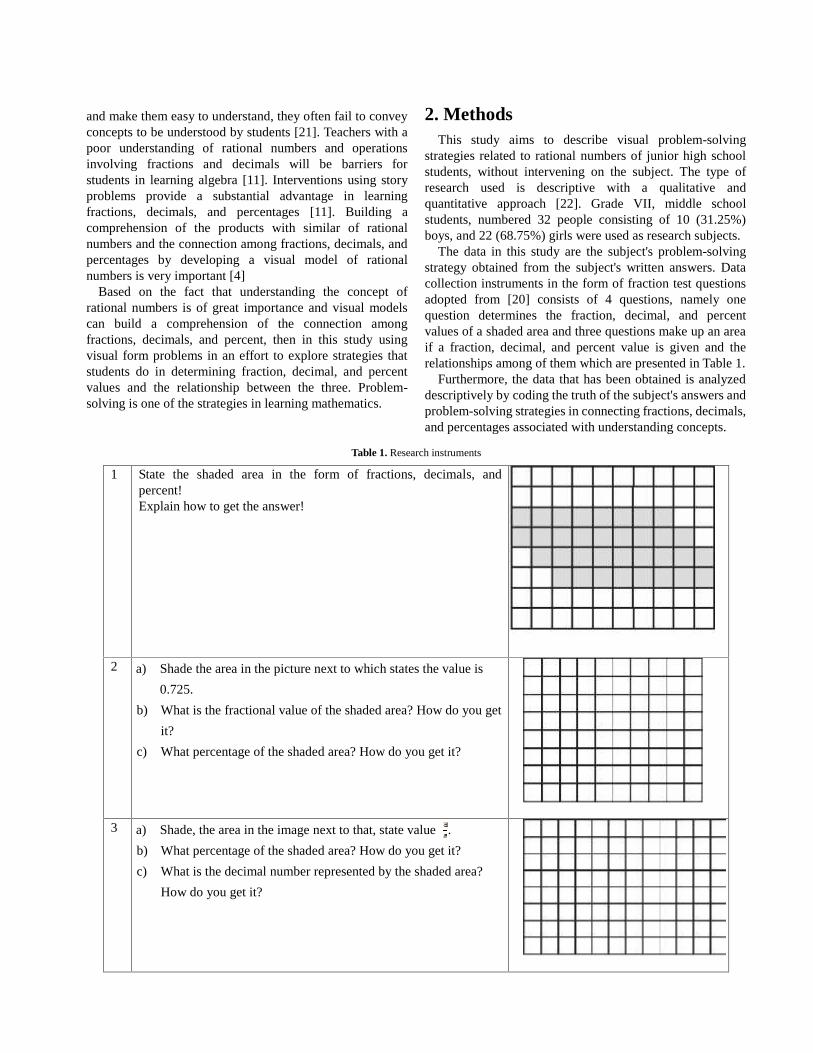
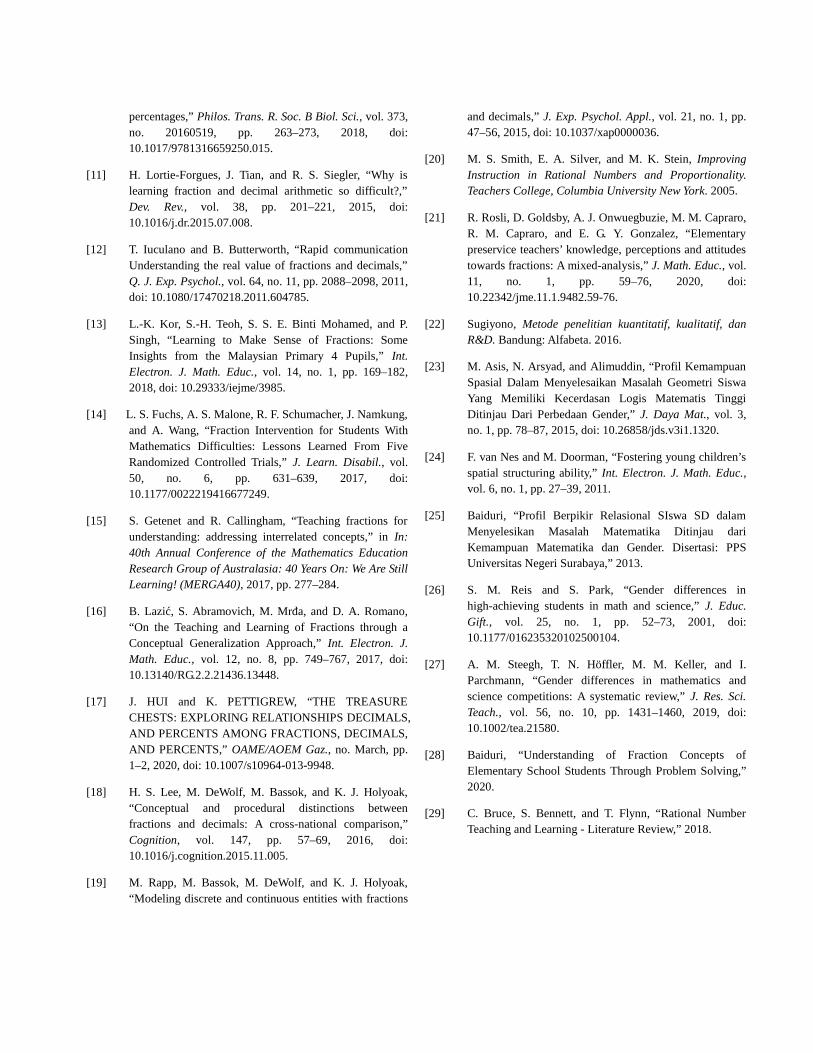
The data in this study are the subject's problem-solving strategy obtained from the subject's written answers. Data collection instruments in the form of fraction test questions adopted from [20] consists of 4 questions, namely one question determines the fraction, decimal, and percent values of a shaded area and three questions make up an area if a fraction, decimal, and percent value is given and the relationships among of them which are presented in Table 1.
Furthermore, the data that has been obtained is analyzed descriptively by coding the truth of the subject's answers and problem-solving strategies in connecting fractions, decimals, and percentages associated with understanding concepts.
Universal Journal of Educational Research 8(11): 5361-5366, 2020 5363
Table 1. Research instruments
1 State the shaded area in the form of fractions, decimals, and percent! Explain how to get the answer!
2 Shade the area in the picture next to which states the value is 0.725. What is the fractional value of the shaded area? How do you get it?
What percentage of the shaded area? How do you get it?
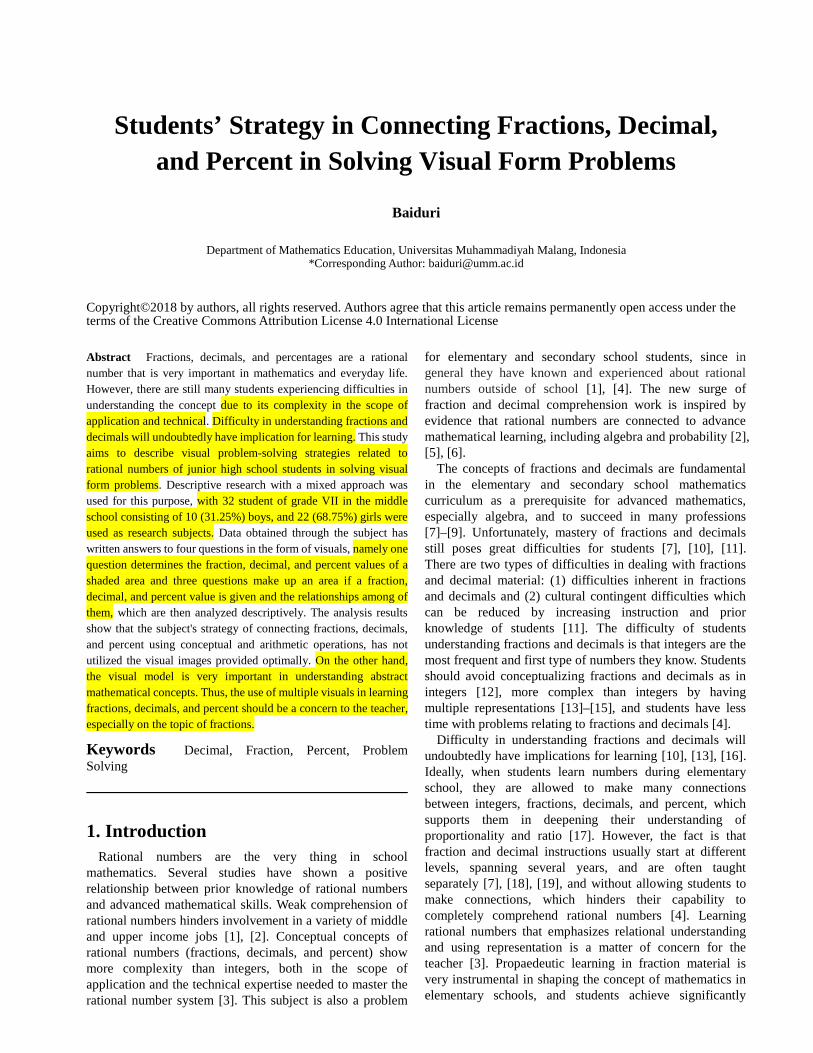
3 Shade, the area in the image next to that, state value 3
8.
What percentage of the shaded area? How do you get it? What is the decimal number represented by the shaded area? How do you get it?
4 Shade, the area in the image next to that, states value 87 1
2%.
What is the fractional value of the shaded area? How do you get it? What is the decimal number represented by the shaded area? How do you get it?
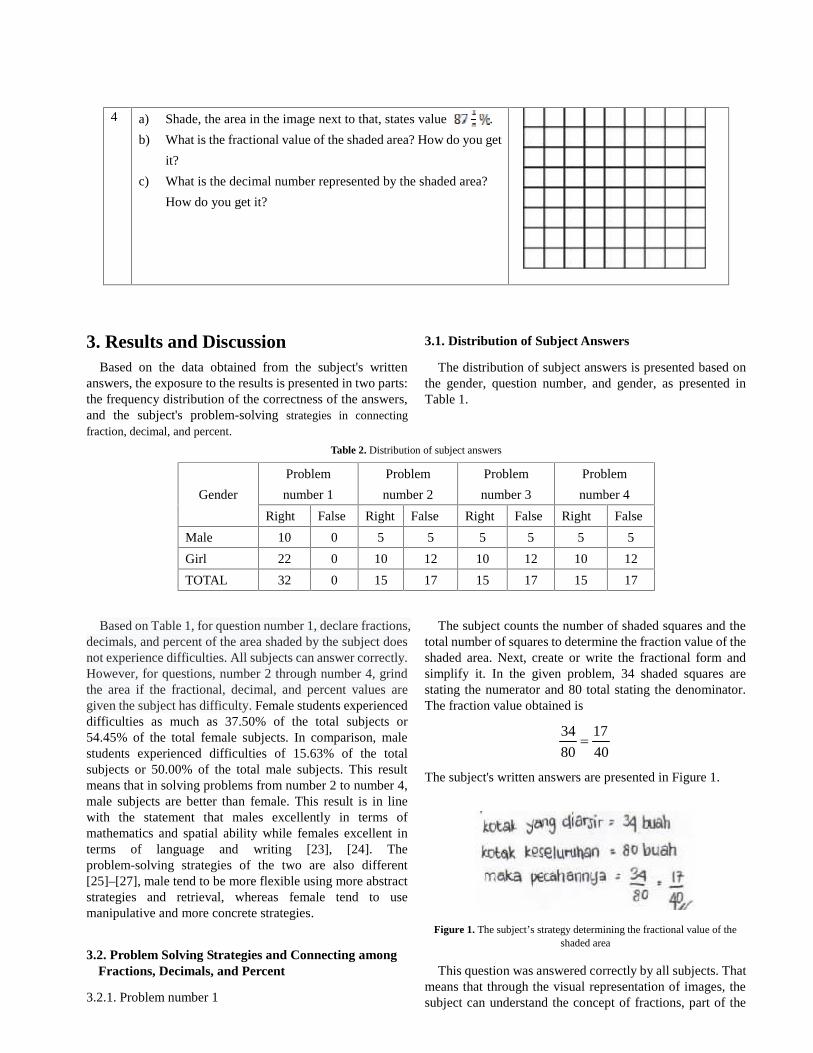
Table 2. Distribution of subject answers
Gender Problem number 1 Problem number 2 Problem number 3 Problem number 4
Right False Right False Right False Right False
Male 10 0 5 5 5 5 5 5
Girl 22 0 10 12 10 12 10 12
TOTAL 32 0 15 17 15 17 15 17
3. Results and Discussion Based on the data obtained from the subject's written
answers, the exposure to the results is presented in two parts: the frequency distribution of the correctness of the answers, and the subject's problem-solving strategies in connecting fraction, decimal, and percent.
3.1. Distribution of Subject Answers
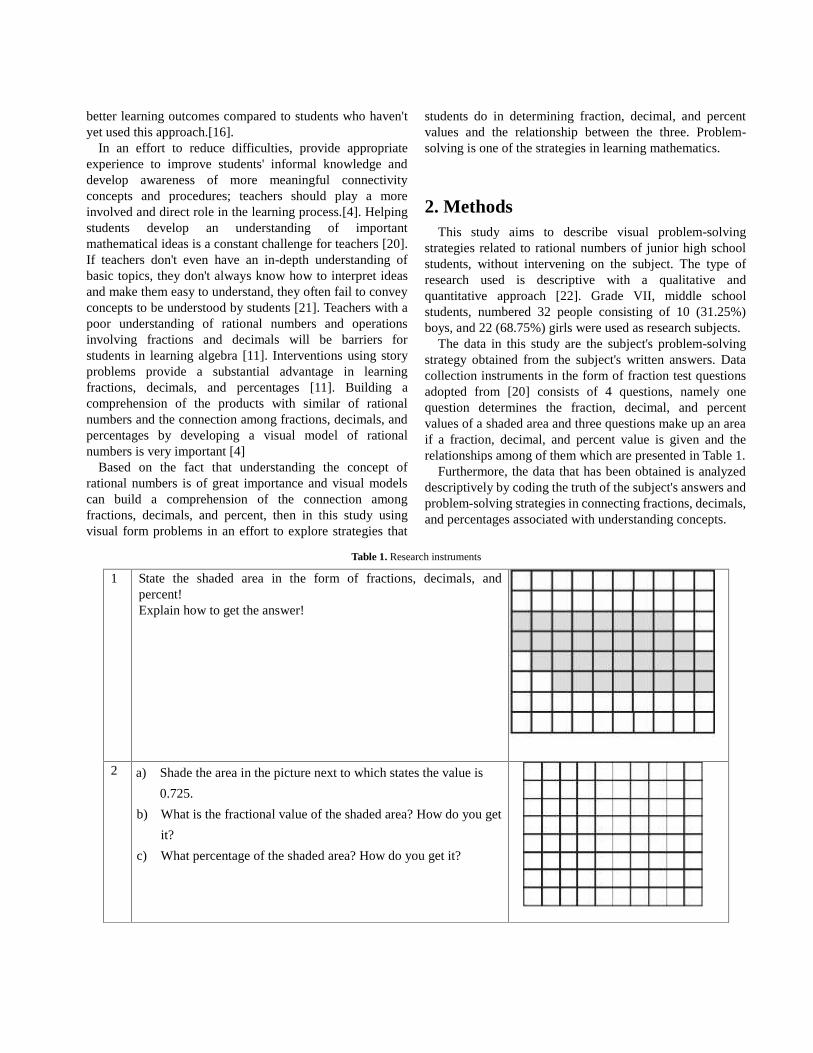
The distribution of subject answers is presented based on the gender, question number, and right and false answers, as presented in Table 1.
Based on Table 1, for question number 1, declare fractions, decimals, and percent of the area shaded by the subject does not experience difficulties. All subjects can answer correctly. However, for questions, number 2 through number 4, grind the area if the fractional, decimal, and percent values are given the subject has difficulty. Female students experienced difficulties as much as 37.50% of the total subjects or 54.45% of the total female subjects. In comparison, male students experienced difficulties of 15.63% of the total subjects or 50.00% of the total male subjects. This result means that in solving
problems from number 2 to number 4, male subjects are better than female. This result is in line with the statement that males excellently in terms of mathematics and spatial ability while females excellent in terms of language and writing [23], [24]. The problem-solving strategies of the two are also different [25]–[27], males tend to be more flexible using more abstract strategies and retrieval, whereas females tend to use manipulative and more concrete strategies.
3.2. Problem Solving Strategies and Connecting among Fractions, Decimals, and Percent
3.2.1. Problem Number 1
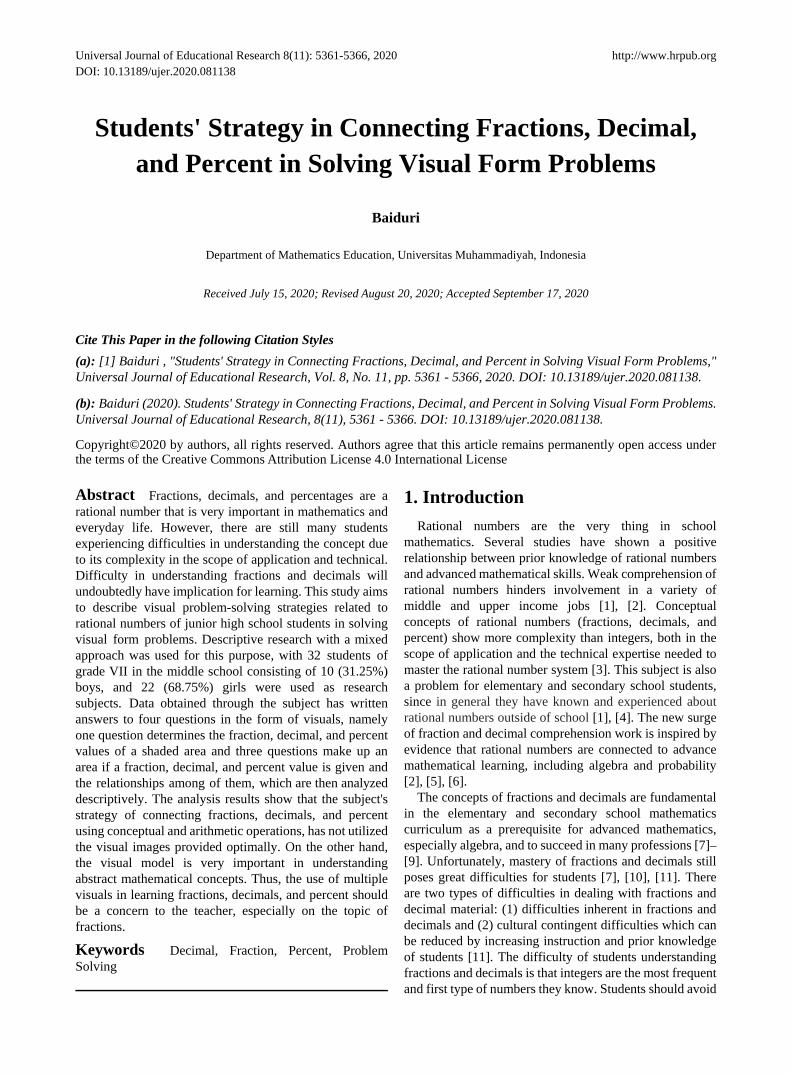
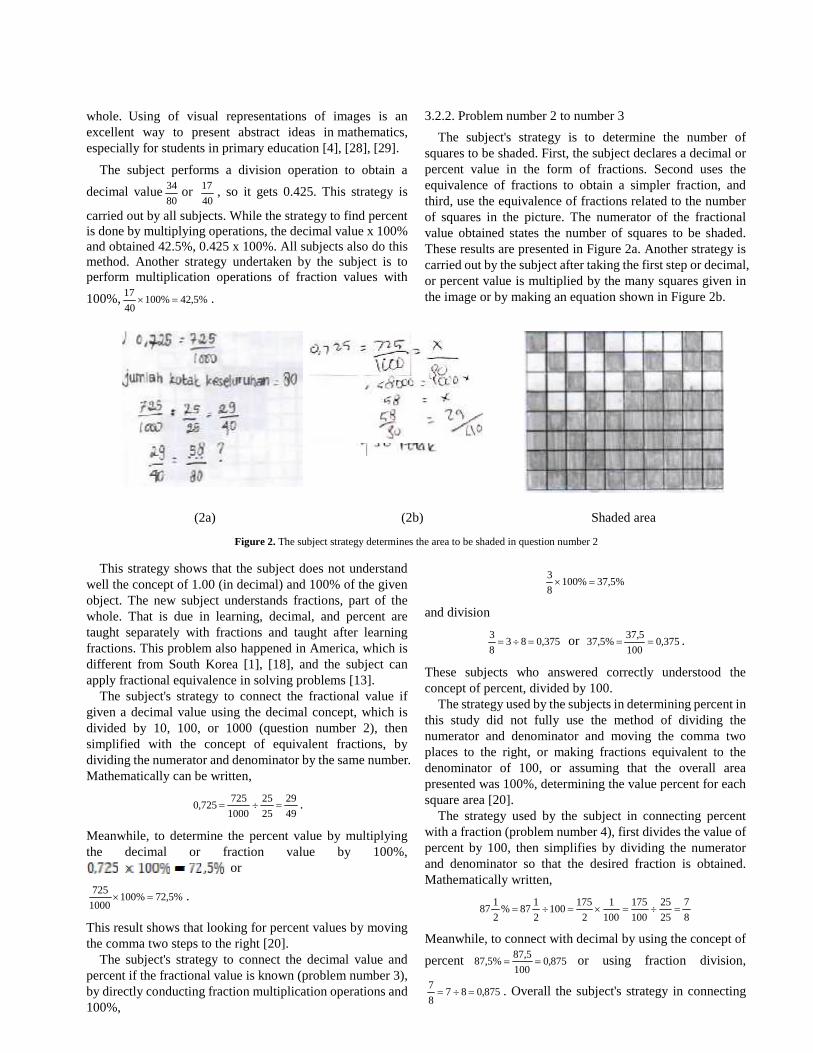
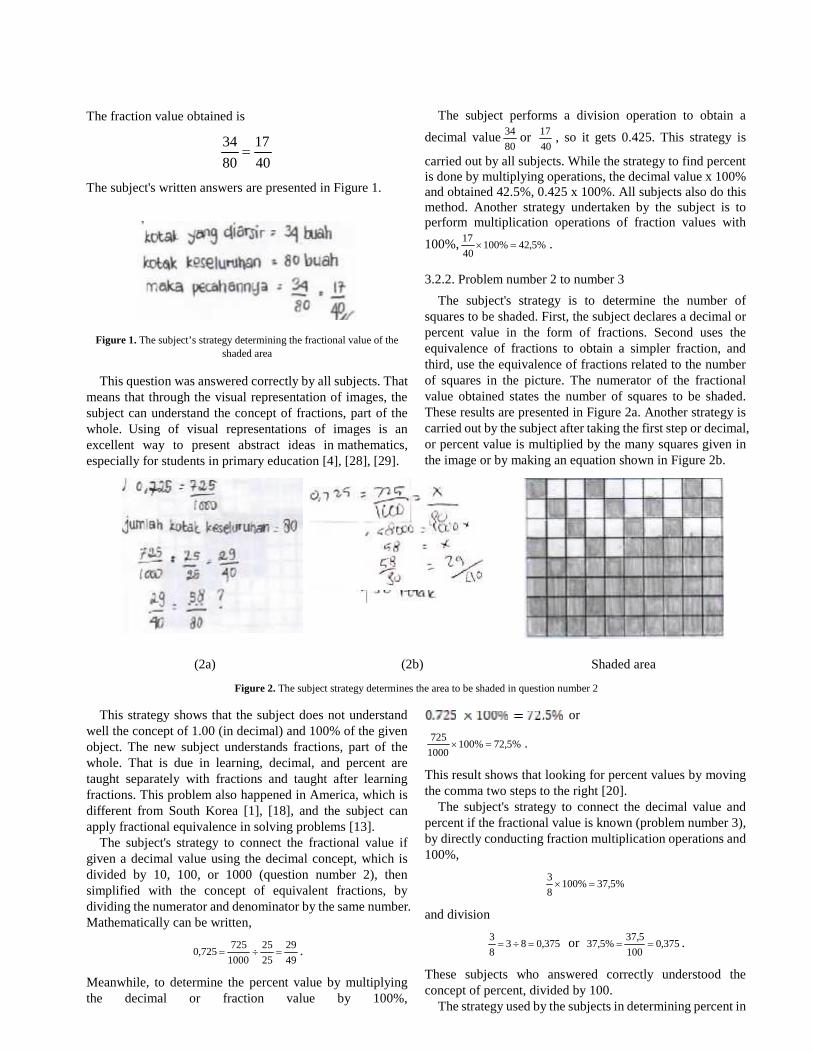
The subject counts the number of shaded squares and the total number of squares to determine the fraction value of the shaded area. Next, create or write the fractional form and simplify it. In the given problem, 34 shaded squares are stating the numerator and 80 total stating the denominator. The fraction value obtained is
4017
8034
=
5364 Students' Strategy in Connecting Fractions, Decimal, and Percent in Solving Visual Form Problems
The subject's written answers are presented in Figure 1.
Figure 1. The subject’s strategy determining the fractional value of the shaded area
This question was answered correctly by all subjects. That means that through the visual representation of images, the subject can understand the concept of fractions, part of the whole. Using of visual representations of images is an excellent way to present abstract ideas in mathematics, especially for students in primary education [4], [28], [29].
The subject performs a division operation to obtain a
decimal value or , so it gets 0.425. This strategy is
carried out by all subjects. While the strategy to find percent is done by multiplying operations, the decimal value x 100% and obtained 42.5%, 0.425 x 100%. All subjects also do this method. Another strategy undertaken by the subject is to perform multiplication operations of
fraction values with 100%, .
3.2.2. Problem Number 2 to Number 4
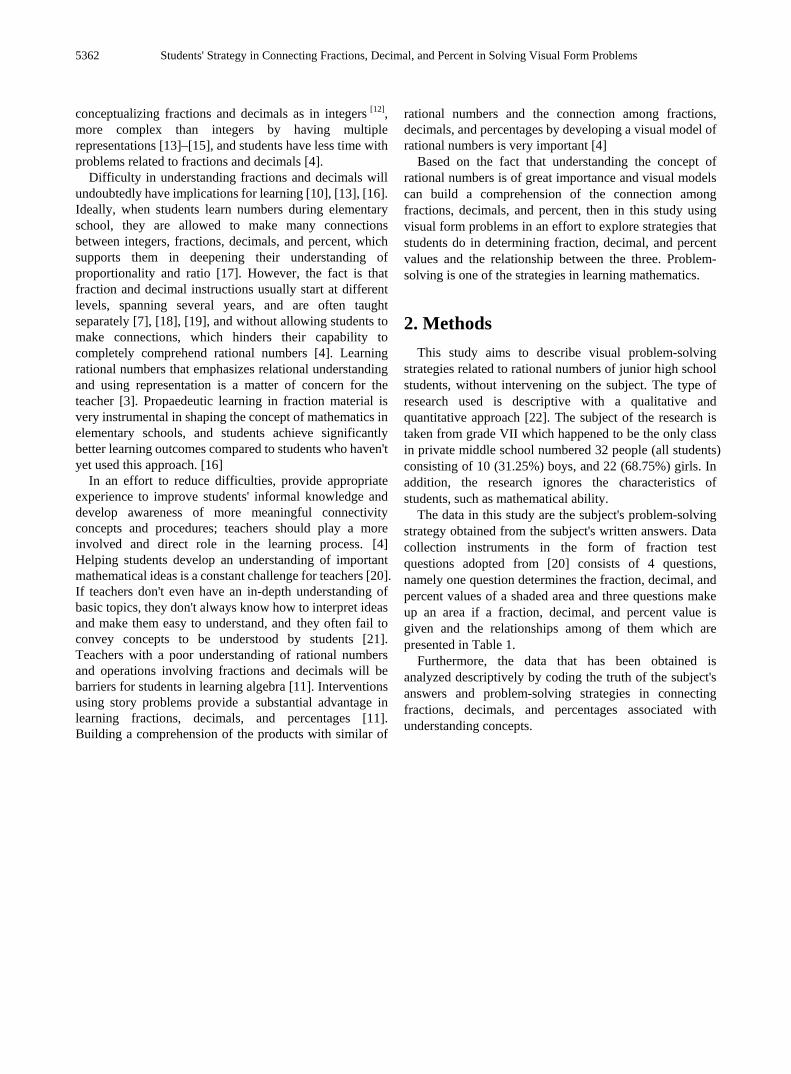
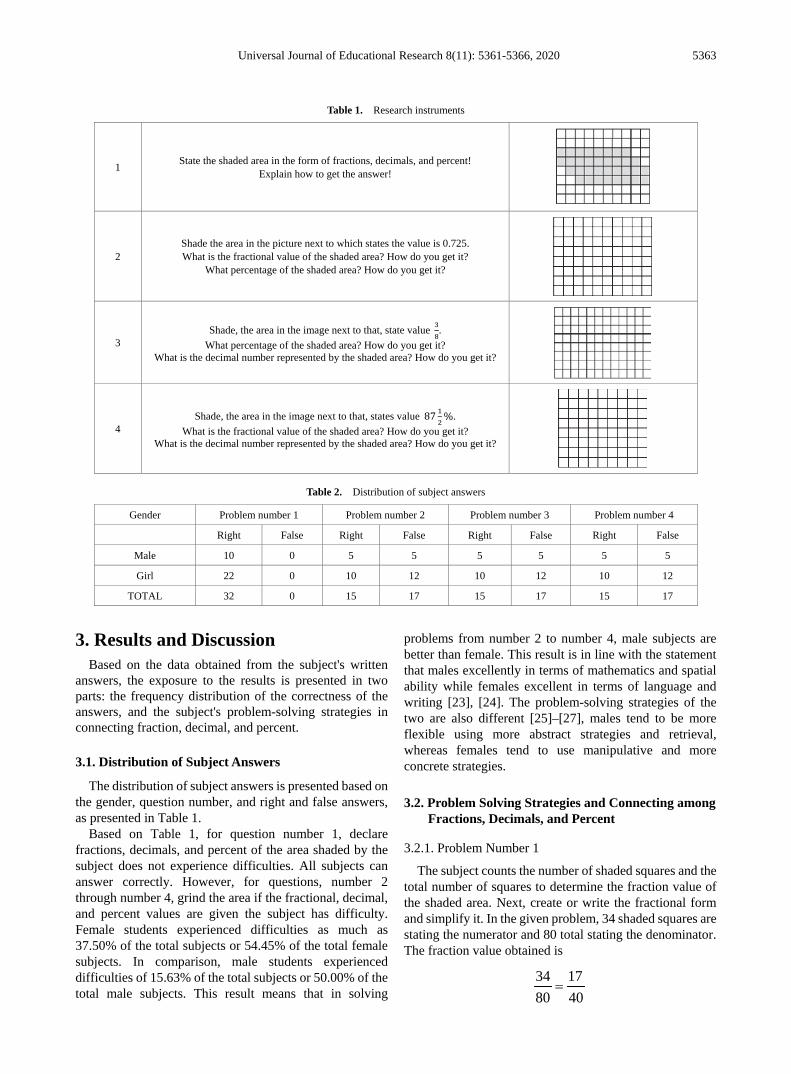
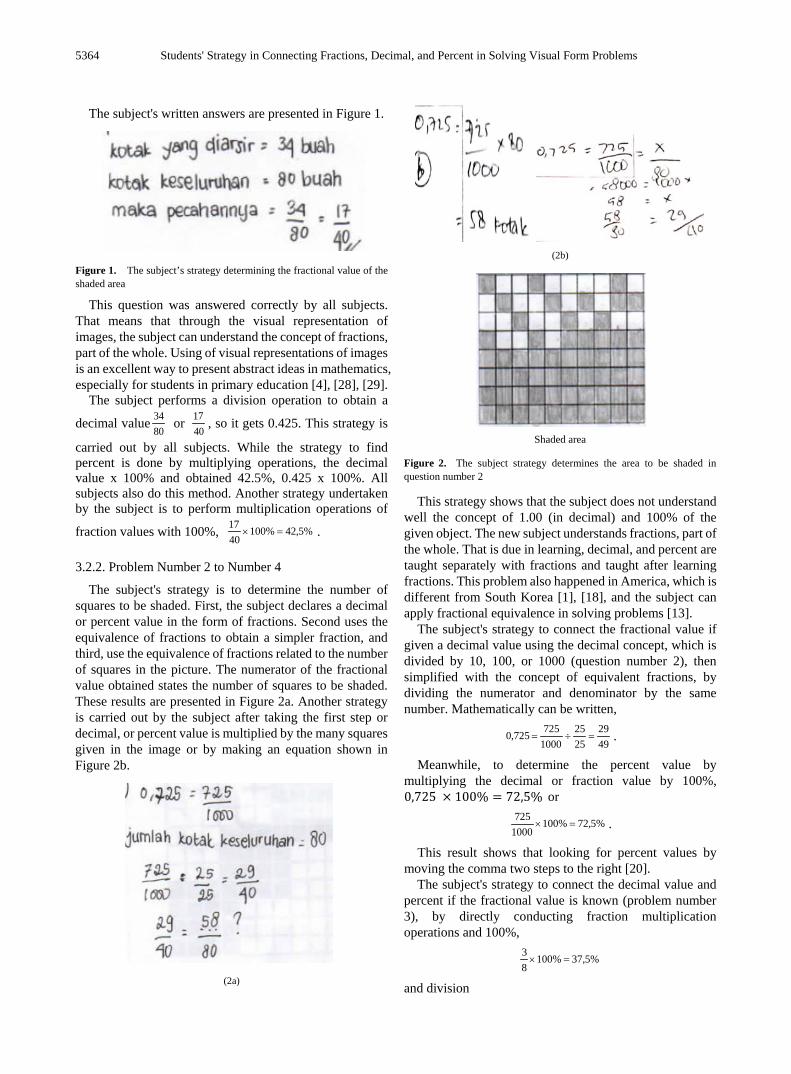
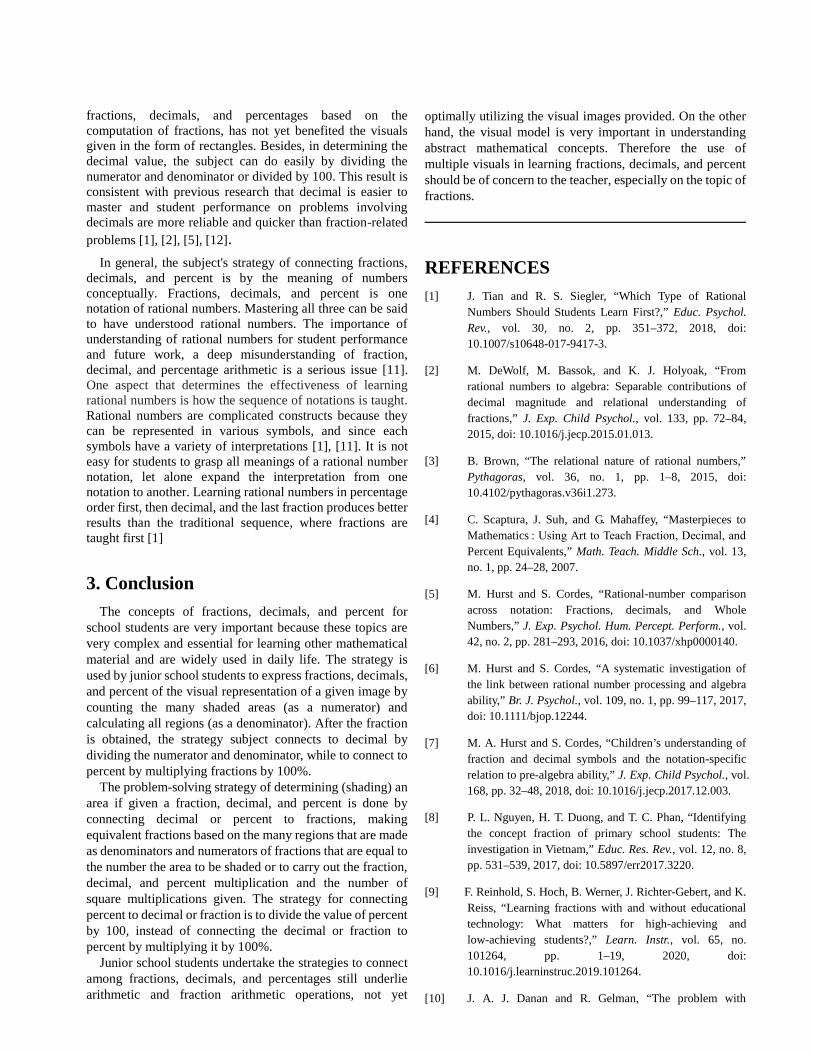
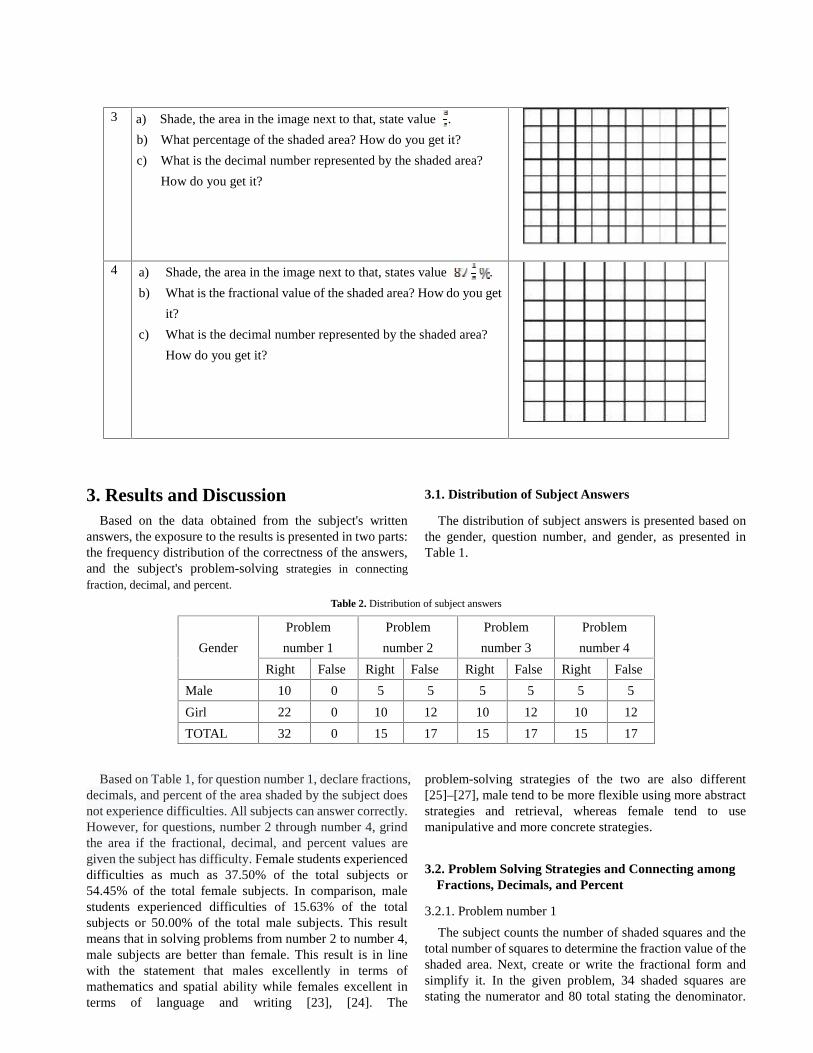
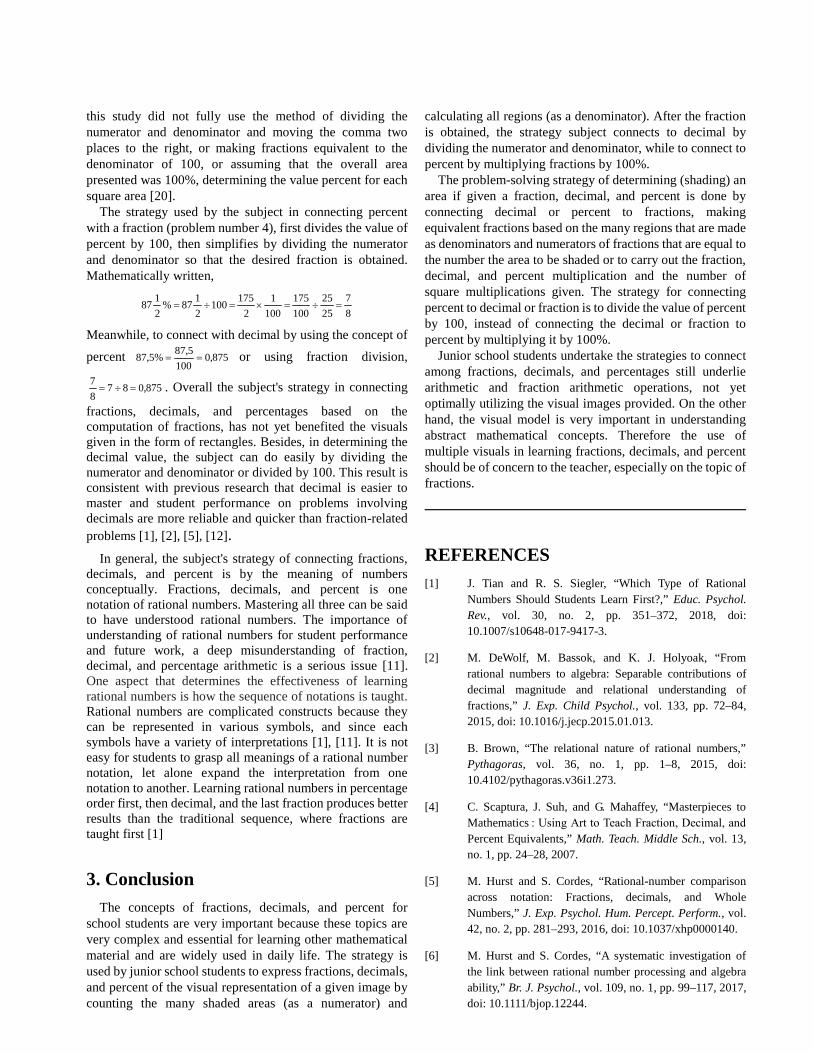
The subject's strategy is to determine the number of squares to be shaded. First, the subject declares a decimal or percent value in the form of fractions. Second uses the equivalence of fractions to obtain a simpler fraction, and third, use the equivalence of fractions related to the number of squares in the picture. The numerator of the fractional value obtained states the number of squares to be shaded. These results are presented in Figure 2a. Another strategy is carried out by the subject after taking the first step or decimal, or percent value is multiplied by the many squares given in the image or by making an equation shown in Figure 2b.
(2a)
(2b)
Shaded area
Figure 2. The subject strategy determines the area to be shaded in question number 2
This strategy shows that the subject does not understand well the concept of 1.00 (in decimal) and 100% of the given object. The new subject understands fractions, part of the whole. That is due in learning, decimal, and percent are taught separately with fractions and taught after learning fractions. This problem also happened in America, which is different from South Korea [1], [18], and the subject can apply fractional equivalence in solving problems [13].
The subject's strategy to connect the fractional value if given a decimal value using the decimal concept, which is divided by 10, 100, or 1000 (question number 2), then simplified with the concept of equivalent fractions, by dividing the numerator and denominator by the same number. Mathematically can be written,
.
Meanwhile, to determine the percent value by multiplying the decimal or fraction value by 100%, 0,725 × 100% = 72,5% or
.
This result shows that looking for percent values by moving the comma two steps to the right [20].
The subject's strategy to connect the decimal value and percent if the fractional value is known (problem number 3), by directly conducting fraction multiplication operations and 100%,
and division
8034
4017
%5,42%1004017
=×
4929
2525
1000725725,0 =÷=
%5,72%1001000725
=×
%5,37%10083
=×
Universal Journal of Educational Research 8(11): 5361-5366, 2020 5365
or .
These subjects who answered correctly understood the concept of percent, divided by 100.
The strategy used by the subjects in determining percent in this study did not fully use the method of dividing the numerator and denominator and moving the comma two places to the right, or making fractions equivalent to the denominator of 100, or assuming that the overall area presented was 100%, determining the value percent for each square area [20].
The strategy used by the subject in connecting percent with a fraction (problem number 4), first divides the value of percent by 100, then simplifies by dividing the numerator and denominator so that the desired fraction is obtained. Mathematically written,
Meanwhile, to connect with decimal by using the
concept of percent or using fraction
division, . Overall the subject's strategy in
connecting fractions, decimals, and percentages based on the computation of fractions, has not yet benefited the visuals given in the form of rectangles. Besides, in determining the decimal value, the subject can do easily by dividing the numerator and denominator or divided by 100. This result is consistent with previous research that decimal is easier to master and students’ performance on problems involving decimals are more reliable and quicker than fraction-related problems [1], [2], [5], [12].
In general, the subject's strategy of connecting fractions, decimals, and percent is by the meaning of numbers conceptually. Fractions, decimals, and percent is one notation of rational numbers. Mastering all three can be said to have understood rational numbers. The importance of understanding rational numbers for students’ performance and future work, a deep misunderstanding of fraction, decimal, and percentage arithmetic is a serious issue [11]. One aspect that determines the effectiveness of learning rational numbers is how the sequence of notations is taught. Rational numbers are complicated constructs because they can be represented in various symbols, and since each symbols have a variety of interpretations [1], [11]. It is not easy for students to grasp all meanings of a rational number notation, let alone expand the interpretation from one notation to another. Learning rational numbers in percentage order first, then decimal, and the last fraction produces better results than the traditional sequence, where fractions are taught first [1]
4. Conclusions The concepts of fractions, decimals, and percent for
school students are very important because these topics are very complex and essential for learning other mathematical materials and are widely used in daily life. The strategy is used by junior school students to express fractions, decimals, and percent of the visual representation of a given image by counting the many shaded areas (as a numerator) and calculating all regions (as a denominator). After the fraction is obtained, the strategy subject connects to decimal by dividing the numerator and denominator, while to connect to percent by multiplying fractions by 100%.
The problem-solving strategy of determining (shading) an area if given a fraction, decimal, and percent is done by connecting decimal or percent to fractions, making equivalent fractions based on the many regions that are made as denominators and numerators of fractions that are equal to the number the area to be shaded or to carry out the fraction, decimal, and percent multiplication and the number of square multiplications given. The strategy for connecting percent to decimal or fraction is to divide the value of percent by 100, instead of connecting the decimal or fraction to percent by multiplying it by 100%.
Junior school students undertake the strategies to connect among fractions, decimals, and percentages still underlie arithmetic and fraction arithmetic operations, not yet optimally utilizing the visual images provided. On the other hand, the visual model is very important in understanding abstract mathematical concepts. Therefore the use of multiple visuals in learning fractions, decimals, and percent should be of concern to the teacher, especially on the topic of fractions.
REFERENCES [1] J. Tian and R. S. Siegler, “Which Type of Rational Numbers
Should Students Learn First?,” Educ. Psychol. Rev., vol. 30, no. 2, pp. 351–372, 2018, doi: 10.1007/s10648-017-9417-3.
[2] M. DeWolf, M. Bassok, and K. J. Holyoak, “From rational numbers to algebra: Separable contributions of decimal magnitude and relational understanding of fractions,” J. Exp. Child Psychol., vol. 133, pp. 72–84, 2015, doi: 10.1016/j.jecp.2015.01.013.
[3] B. Brown, “The relational nature of rational numbers,” Pythagoras, vol. 36, no. 1, pp. 1–8, 2015, doi: 10.4102/pythagoras.v36i1.273.
[4] C. Scaptura, J. Suh, and G. Mahaffey, “Masterpieces to Mathematics : Using Art to Teach Fraction, Decimal, and Percent Equivalents,” Math. Teach. Middle Sch., vol. 13, no. 1, pp. 24–28, 2007.
[5] M. Hurst and S. Cordes, “Rational-number comparison across notation: Fractions, decimals, and Whole Numbers,” J. Exp. Psychol. Hum. Percept. Perform., vol. 42, no. 2, pp. 281–293, 2016, doi: 10.1037/xhp0000140.
[6] M. Hurst and S. Cordes, “A systematic investigation of the
375,08383
=÷= 375,0100
5,37%5,37 ==
87
2525
100175
1001
2175100
2187%
2187 =÷=×=÷=
875,0100
5,87%5,87 ==
875,08787
=÷=
5366 Students' Strategy in Connecting Fractions, Decimal, and Percent in Solving Visual Form Problems
link between rational number processing and algebra ability,” Br. J. Psychol., vol. 109, no. 1, pp. 99–117, 2017, doi: 10.1111/bjop.12244.
[7] M. A. Hurst and S. Cordes, “Children’s understanding of fraction and decimal symbols and the notation-specific relation to pre-algebra ability,” J. Exp. Child Psychol., vol. 168, pp. 32–48, 2018, doi: 10.1016/j.jecp.2017.12.003.
[8] P. L. Nguyen, H. T. Duong, and T. C. Phan, “Identifying the concept fraction of primary school students: The investigation in Vietnam,” Educ. Res. Rev., vol. 12, no. 8, pp. 531–539, 2017, doi: 10.5897/err2017.3220.
[9] F. Reinhold, S. Hoch, B. Werner, J. Richter-Gebert, and K. Reiss, “Learning fractions with and without educational technology: What matters for high-achieving and low-achieving students?,” Learn. Instr., vol. 65, no. 101264, pp. 1–19, 2020, doi: 10.1016/j.learninstruc.2019.101264.
[10] J. A. J. Danan and R. Gelman, “The problem with percentages,” Philos. Trans. R. Soc. B Biol. Sci., vol. 373, no. 20160519, pp. 263–273, 2018, doi: 10.1017/9781316659250.015.
[11] H. Lortie-Forgues, J. Tian, and R. S. Siegler, “Why is learning fraction and decimal arithmetic so difficult?,” Dev. Rev., vol. 38, pp. 201–221, 2015, doi: 10.1016/j.dr.2015.07.008.
[12] T. Iuculano and B. Butterworth, “Rapid communication Understanding the real value of fractions and decimals,” Q. J. Exp. Psychol., vol. 64, no. 11, pp. 2088–2098, 2011, doi: 10.1080/17470218.2011.604785.
[13] L.-K. Kor, S.-H. Teoh, S. S. E. Binti Mohamed, and P. Singh, “Learning to Make Sense of Fractions: Some Insights from the Malaysian Primary 4 Pupils,” Int. Electron. J. Math. Educ., vol. 14, no. 1, pp. 169–182, 2018, doi: 10.29333/iejme/3985.
[14] L. S. Fuchs, A. S. Malone, R. F. Schumacher, J. Namkung, and A. Wang, “Fraction Intervention for Students With Mathematics Difficulties: Lessons Learned From Five Randomized Controlled Trials,” J. Learn. Disabil., vol. 50, no. 6, pp. 631–639, 2017, doi: 10.1177/0022219416677249.
[15] S. Getenet and R. Callingham, “Teaching fractions for understanding: addressing interrelated concepts,” The 40th Annual Conference of the Mathematics Education Research Group of Australasia: 40 Years On: We Are Still Learning! (MERGA40), 2017, pp. 277–284.
[16] B. Lazić, S. Abramovich, M. Mrđa, and D. A. Romano, “On the Teaching and Learning of Fractions through a Conceptual Generalization Approach,” Int. Electron. J. Math. Educ., vol. 12, no. 8, pp. 749–767, 2017, doi: 10.13140/RG.2.2.21436.13448.
[17] J. HUI and K. PETTIGREW, “THE TREASURE CHESTS:
EXPLORING RELATIONSHIPS DECIMALS, AND PERCENTS AMONG FRACTIONS, DECIMALS, AND PERCENTS,” OAME/AOEM Gaz., no. March, pp. 1–2, 2020, doi: 10.1007/s10964-013-9948.
[18] H. S. Lee, M. DeWolf, M. Bassok, and K. J. Holyoak, “Conceptual and procedural distinctions between fractions and decimals: A cross-national comparison,” Cognition, vol. 147, pp. 57–69, 2016, doi: 10.1016/j.cognition.2015.11.005.
[19] M. Rapp, M. Bassok, M. DeWolf, and K. J. Holyoak, “Modeling discrete and continuous entities with fractions and decimals,” J. Exp. Psychol. Appl., vol. 21, no. 1, pp. 47–56, 2015, doi: 10.1037/xap0000036.
[20] M. S. Smith, E. A. Silver, and M. K. Stein, Improving Instruction in Rational Numbers and Proportionality. Teachers College, Columbia University New York. 2005.
[21] R. Rosli, D. Goldsby, A. J. Onwuegbuzie, M. M. Capraro, R. M. Capraro, and E. G. Y. Gonzalez, “Elementary preservice teachers’ knowledge, perceptions and attitudes towards fractions: A mixed-analysis,” J. Math. Educ., vol. 11, no. 1, pp. 59–76, 2020, doi: 10.22342/jme.11.1.9482.59-76.
[22] Sugiyono, Metode penelitian kuantitatif, kualitatif, dan R&D. Bandung: Alfabeta. 2016.
[23] M. Asis, N. Arsyad, and Alimuddin, “Profil Kemampuan Spasial Dalam Menyelesaikan Masalah Geometri Siswa Yang Memiliki Kecerdasan Logis Matematis Tinggi Ditinjau Dari Perbedaan Gender,” J. Daya Mat., vol. 3, no. 1, pp. 78–87, 2015, doi: 10.26858/jds.v3i1.1320.
[24] F. van Nes and M. Doorman, “Fostering young children’s spatial structuring ability,” Int. Electron. J. Math. Educ., vol. 6, no. 1, pp. 27–39, 2011.
[25] Baiduri, “Profil Berpikir Relasional SIswa SD dalam Menyelesikan Masalah Matematika Ditinjau dari Kemampuan Matematika dan Gender. Disertasi: PPS Universitas Negeri Surabaya,” 2013.
[26] S. M. Reis and S. Park, “Gender differences in high-achieving students in math and science,” J. Educ. Gift., vol. 25, no. 1, pp. 52–73, 2001, doi: 10.1177/016235320102500104.
[27] A. M. Steegh, T. N. Höffler, M. M. Keller, and I. Parchmann, “Gender differences in mathematics and science competitions: A systematic review,” J. Res. Sci. Teach., vol. 56, no. 10, pp. 1431–1460, 2019, doi: 10.1002/tea.21580.
[28] Baiduri, “Understanding of Fraction Concepts of Elementary School Students Through Problem Solving,” 2020.
[29] C. Bruce, S. Bennett, and T. Flynn, “Rational Number Teaching and Learning - Literature Review,” 2018.
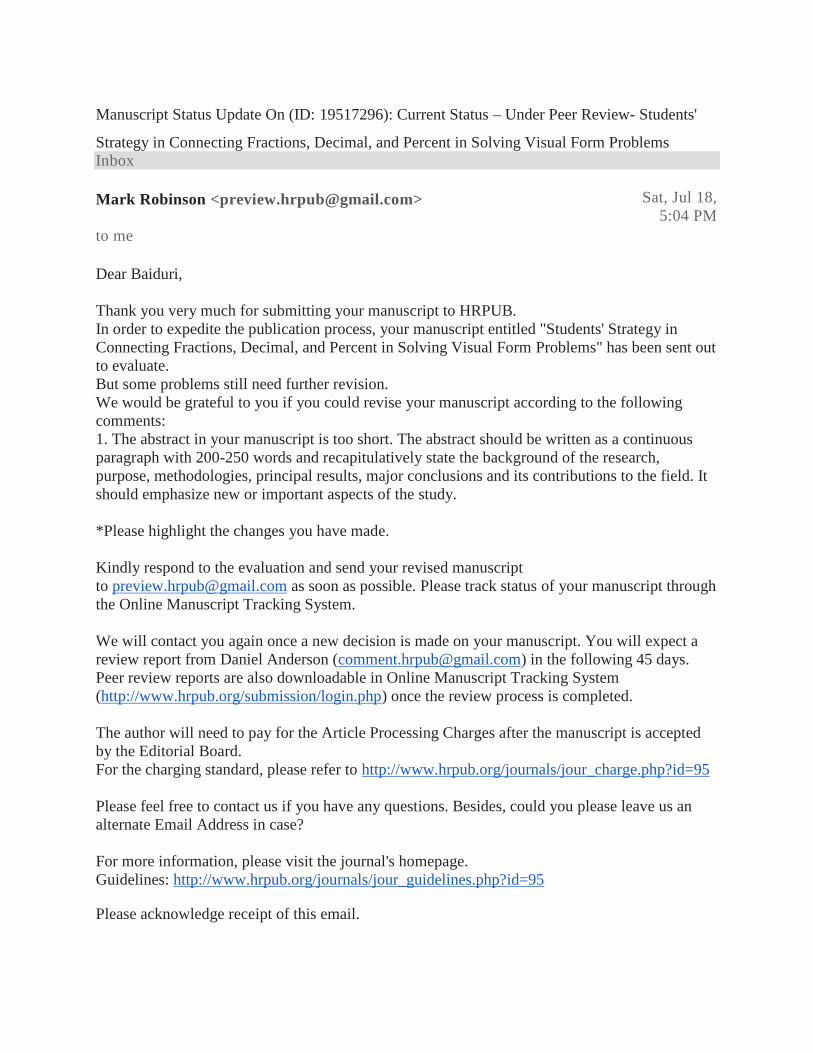
Manuscript Status Update On (ID: 19517296): Current Status – Under Peer Review- Students'
Strategy in Connecting Fractions, Decimal, and Percent in Solving Visual Form ProblemsInbox
Mark Robinson <[email protected]> Sat, Jul 18,5:04 PM
to me
Dear Baiduri,
Thank you very much for submitting your manuscript to HRPUB.In order to expedite the publication process, your manuscript entitled "Students' Strategy inConnecting Fractions, Decimal, and Percent in Solving Visual Form Problems" has been sent outto evaluate.But some problems still need further revision.We would be grateful to you if you could revise your manuscript according to the followingcomments:1. The abstract in your manuscript is too short. The abstract should be written as a continuousparagraph with 200-250 words and recapitulatively state the background of the research,purpose, methodologies, principal results, major conclusions and its contributions to the field. Itshould emphasize new or important aspects of the study.
*Please highlight the changes you have made.
Kindly respond to the evaluation and send your revised manuscriptto [email protected] as soon as possible. Please track status of your manuscript throughthe Online Manuscript Tracking System.
We will contact you again once a new decision is made on your manuscript. You will expect areview report from Daniel Anderson ([email protected]) in the following 45 days.Peer review reports are also downloadable in Online Manuscript Tracking System(http://www.hrpub.org/submission/login.php) once the review process is completed.
The author will need to pay for the Article Processing Charges after the manuscript is acceptedby the Editorial Board.For the charging standard, please refer to http://www.hrpub.org/journals/jour_charge.php?id=95
Please feel free to contact us if you have any questions. Besides, could you please leave us analternate Email Address in case?
For more information, please visit the journal's homepage.Guidelines: http://www.hrpub.org/journals/jour_guidelines.php?id=95
Please acknowledge receipt of this email.
Best Regards
Mark RobinsonEditorial [email protected] Research Publishing, USAhttp://www.hrpub.org
Revised Manuscript of "Students’ Strategy in Connecting Fractions, Decimal, and Percent in
Solving Visual Form Problems"Inbox
Baiduri Drs. M.Si. . <[email protected]> Mon, Jul 20,5:15 PM
to preview.hrpub, comment.hrpub
Dear Editor
Thank you for your previous feedback on my manuscript. I have revised the manuscript whichhas been enclosed within this email based on your comments and inserted the highlight on therevision. Thus, the further notification or any immediate feedback from you will be highlyappreciated. Lastly, we greatly hope that the manuscript will be accepted and be published inyour journal. Thank you for your cooperation.
Sincerely yours,BaiduriAttachments area
Mark Robinson <[email protected]> Tue, Jul 21,3:21 PM
to meDear Baiduri,
Thanks for your kind email.We have received your paper. If further revision is required, we will contact you again.
Best Regards
Mark RobinsonEditorial [email protected] Research Publishing, USAhttp://www.hrpub.org
Revision after Peer Review (ID:19517296)-2 reports-Students' Strategy in Connecting Fractions,
Decimal, and Percent in Solving Visual Form Problems
InboxDaniel Anderson <[email protected]> Mon, Aug 17,
9:55 AMto meDear Baiduri,
Thank you for your interest in publishing your work in HRPUB.
Your manuscript has now been peer reviewed and the comments are accessible in Word format.
Usually, we invite 2 peer reviewers for one manuscript. Compared with both review reports, theoverlapped parts can be ignored.Please confirm all comments from the two reviewers have been effected in your paper.
We would be grateful if you could address the comments of the reviewers in a revisedmanuscript and answer all questions raised by reviewers in a cover letter. Any revision should bemade on the attached manuscript.
Note:1. The citation style should follow the journalguidelines. http://www.hrpub.org/journals/jour_guidelines.php?id=952. In addition to necessary revisions, please note that the similarity index of the revisedversion should be lower than 20% and similarity from a single source should not exceed5%.
Please download the publication agreement(http://www.hrpub.org/download/HRPUB_Publication_Agreement2020.pdf) and fill in theauthor name, manuscript title, manuscript ID and signature, then send a scanned version to us.
Please submit the revised paper to us by email in MS Word or LaTex format within two weeks.
Look forward to receiving your revised manuscript as soon as possible.
Please acknowledge receipt of this email.
Best Regards
Daniel AndersonEditorial [email protected] Research Publishing, USAhttp://www.hrpub.org3 Attachments
Baiduri Drs. M.Si. . <[email protected]> Mon, Aug 17,11:23 AM
to Daniel
Dear Editor,
Thank you very much for the information about the results of my manuscript review.I will revise it according to the suggestions of reviewers and I will be very happy if themanuscript is accepted for publication in your journal.
Best regards,Baiduri
Daniel Anderson <[email protected]> Mon, Aug 17,1:13 PM
to me
Dear Baiduri,
Thank you for your reply.Please send the revised paper and cover letter to us via email after you finish it.
Best Regards
Daniel AndersonEditorial Assistant
[email protected] Research Publishing, USAhttp://www.hrpub.org
Manuscript Revision of Student’s Strategy in Connecting Fractions, Decimal, and Percent in
Solving Visual Form ProblemsInbox
Baiduri Drs. M.Si. . <[email protected]> Wed, Aug 19,2:50 PM
to Daniel
Dear Daniel,
Herewith I attached the manuscript revision, cover letter, plagiarism check, and agreement letteras requested. We hope that the manuscript will be published to UJER-HRPUB Journal. Thankyou,
Best regards
Baiduri
4 Attachments
Daniel Anderson <[email protected]> Thu, Aug 20,9:07 AM
to me
Dear Baiduri,
Thank you for your kind email.We have received your revised paper and other related documents. If further revision is notrequired, you will expect an Acceptance Letter in a week.
Best Regards
Daniel AndersonEditorial [email protected] Research Publishing, USAhttp://www.hrpub.org

Acceptance Letter & Advice of Payment (ID:19517296)InboxDaniel Anderson <[email protected]> Fri, Aug 28,
8:39 PMto me
Dear Baiduri,
Your paper has been accepted for publication. Herewith attached is the Acceptance Letter.
The publication fee is $290. Payment can be made by Wire Transfer, PayPal and Credit Card.Payment instructions are below.
(1)Wire Transfer Instructions
Beneficiary name: HORIZON RESEARCH PUBLISHING CO., LTDBeneficiary account number: 33113742Banking Swift code for international wires: CATHUS6LBeneficiary bank name: Cathay BankBeneficiary bank address: 4128 Temple City Blvd, Rosemead, CA 91770 USANote: Please add $35.00 for wire transfer fee.
The bank charge would be deducted prior to the receipt of the payment. To avoid a shortfall onthe net amount received and request for repayment, authors shall pay the commission chargewhile making the payment.
(2) PayPal InstructionsOur PayPal recipient email address is [email protected]. To avoid confusion, pleaseadd special instructions during the transaction process.
The online payment processes via PayPal are divided into 3 steps:
Step 1: login to the Online Manuscript Tracking System(http://www.hrpub.org/submission/login.php)
Step 2: Select the option "H_Economies: $290 USD" and click on "buy now" to proceed;
Step 3: Login to your PayPal account to complete the purchase
(3) Credit Card PaymentsThe online payment processes via credit card are divided into 3 steps:Step 1: log into the Online Manuscript Tracking System;(http://www.hrpub.org/submission/login.php)
Step 2: Select the option "H_Economies: $290 USD" and click on "buy now" to proceed;
Step 3: Pay with debit or credit card. Fill in all required information to complete your purchase
Please add special instructions during the transaction process.Once the payment is finished, please inform us or send the payment voucher to us.Look forward to hearing from you soon.
Best Regards
Daniel AndersonEditorial [email protected] Research Publishing, USAhttp://www.hrpub.org
Baiduri Drs. M.Si. . <[email protected]> Aug 31, 2020,1:45 PM
to Daniel
Dear Editor,
Thank you for the information. I am very happy and grateful that my manuscript can bepublished in your journal.I will make the payment as suggested as soon as possible and send proof of payment.
Best regards,Baiduri
Daniel Anderson <[email protected]> Sep 1, 2020,7:19 PM
to me
Dear Baiduri,
Thank you for your response.
Best Regards
Daniel AndersonEditorial [email protected] Research Publishing, USAhttp://www.hrpub.org
Resi untuk Pembayaran Anda kepada Electronic Products, Consulting Service, Application
[email protected] <[email protected]> Wed, Sep 2,
11:26 AMto me
Indonesian
English
Translate messageTurn off for: Indonesian
02 Sep 2020 11:25:48 GMT+07:00ID Transaksi: 79W7455041636672P
Halo Baiduri Baiduri,
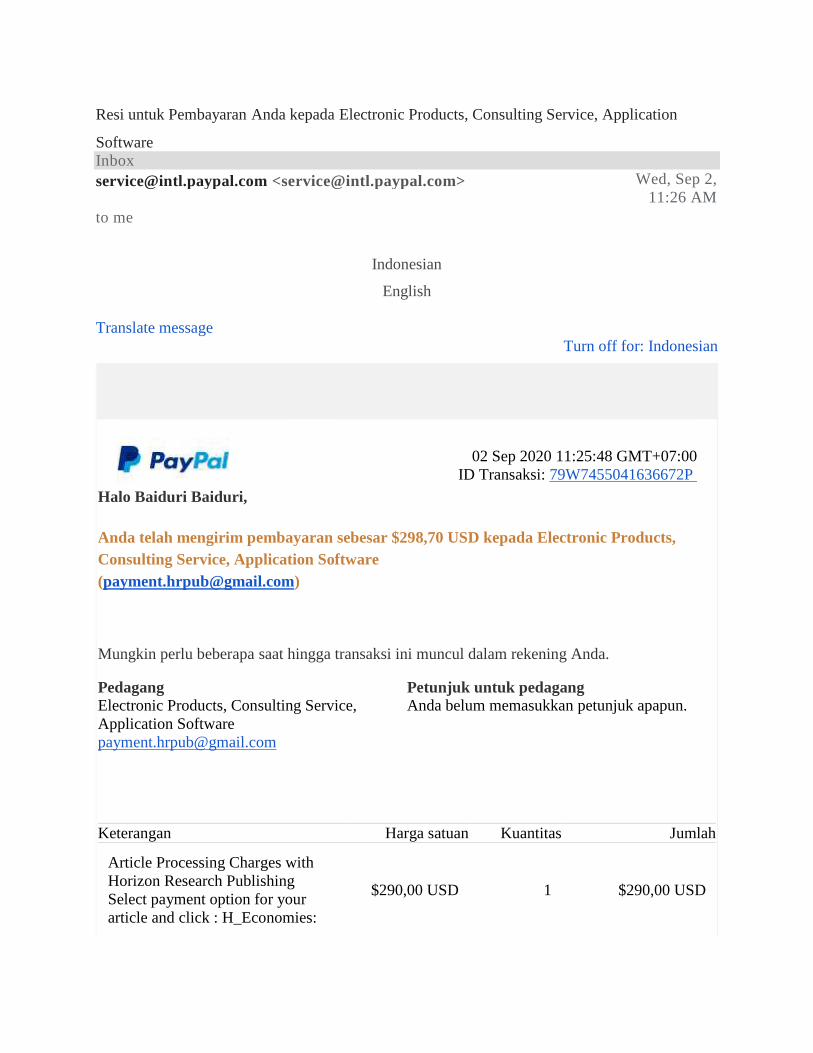
Anda telah mengirim pembayaran sebesar $298,70 USD kepada Electronic Products,Consulting Service, Application Software([email protected])
Mungkin perlu beberapa saat hingga transaksi ini muncul dalam rekening Anda.
Keterangan Harga satuan Kuantitas Jumlah
Article Processing Charges withHorizon Research PublishingSelect payment option for yourarticle and click : H_Economies:
$290,00 USD 1 $290,00 USD
PedagangElectronic Products, Consulting Service,Application [email protected]
Petunjuk untuk pedagangAnda belum memasukkan petunjuk apapun.
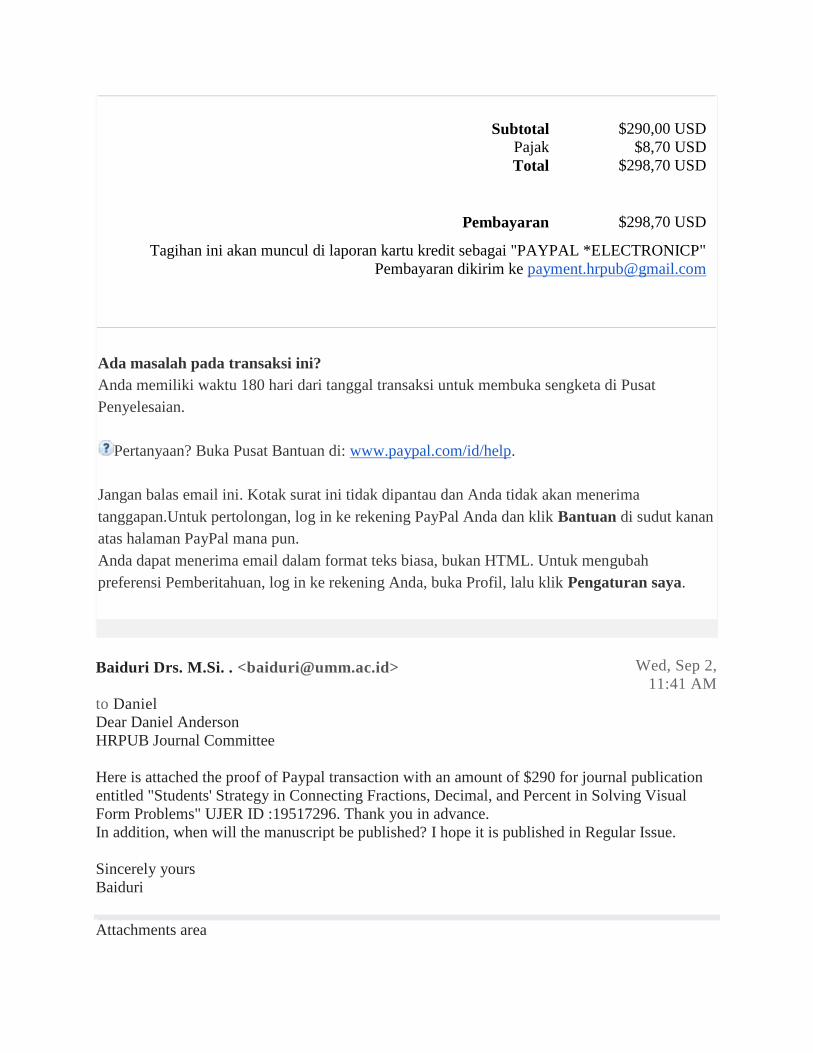
Subtotal $290,00 USDPajak $8,70 USDTotal $298,70 USD
Pembayaran $298,70 USD
Tagihan ini akan muncul di laporan kartu kredit sebagai "PAYPAL *ELECTRONICP"Pembayaran dikirim ke [email protected]
Ada masalah pada transaksi ini?Anda memiliki waktu 180 hari dari tanggal transaksi untuk membuka sengketa di PusatPenyelesaian.
Pertanyaan? Buka Pusat Bantuan di: www.paypal.com/id/help.
Jangan balas email ini. Kotak surat ini tidak dipantau dan Anda tidak akan menerimatanggapan.Untuk pertolongan, log in ke rekening PayPal Anda dan klik Bantuan di sudut kananatas halaman PayPal mana pun.Anda dapat menerima email dalam format teks biasa, bukan HTML. Untuk mengubahpreferensi Pemberitahuan, log in ke rekening Anda, buka Profil, lalu klik Pengaturan saya.
Baiduri Drs. M.Si. . <[email protected]> Wed, Sep 2,11:41 AM
to DanielDear Daniel AndersonHRPUB Journal Committee
Here is attached the proof of Paypal transaction with an amount of $290 for journal publicationentitled "Students' Strategy in Connecting Fractions, Decimal, and Percent in Solving VisualForm Problems" UJER ID :19517296. Thank you in advance.In addition, when will the manuscript be published? I hope it is published in Regular Issue.
Sincerely yoursBaiduri
Attachments area

Daniel Anderson <[email protected]> Thu, Sep 3,10:43 AM
to me
Dear Baiduri,
Thank you for your email.We have received your payment.
Best Regards
Daniel AndersonEditorial [email protected] Research Publishing, USAhttp://www.hrpub.org
Baiduri Drs. M.Si. . <[email protected]> Sun, Oct 4,6:03 AM
to Daniel
Dear Editor,
I hereby request information about my manuscript entitled "Students' Strategy in ConnectingFractions, Decimal, and Percent in Solving Visual Form Problems" UJER ID: 19517296. I reallyhope the manuscript can be published on the regular issue this month. Thank you for yourcooperation.
Best regards,Baiduri

Daniel Anderson Tue, Oct 6,10:57 PM
to me
Dear Baiduri,
Thank you for your email.Your paper is scheduled to be published on Vol.8 No.11 at the end of October.
Best Regards
Daniel AndersonEditorial [email protected] Research Publishing, USAhttp://www.hrpub.org
Baiduri Drs. M.Si. . <[email protected]> Wed, Oct 7,9:23 AM
to Daniel
Dear Daniel Anderson,
Thank you for your information.
Regards,Baiduri

Proof Reading before Publication (ID:19517296)InboxDaniel Anderson Tue, Oct 13, 9:42 AM (12
days ago)to meDear Baiduri,
Your manuscript has been accepted for publication. Authors are given a chance of checking theattached manuscript before publication. If we don't receive any confirmation or feedback of themanuscript before 10/16/2020, it will be regarded as the final version.
* Please carefully check the whole manuscript to ensure consistency and accuracy in grammar,spelling, punctuation and formatting.
All revisions should be highlighted on the attached manuscript.
Best Regards
Daniel AndersonEditorial [email protected] Research Publishing, USAhttp://www.hrpub.orgAttachments area
Baiduri Drs. M.Si. . Mon, Oct 19, 11:01AM (6 days ago)
Dear Editor, Thank you for your information. I think the manuscript is ready for publication.
Redards, Baiduri
Daniel Anderson Mon, Oct 19, 4:06 PM(6 days ago)
to meDear Baiduri,
Thank you for your response.
Best RegardsDaniel AndersonEditorial [email protected] Research Publishing, USAhttp://www.hrpub.org
Students’ Strategy in Connecting Fractions, Decimal,and Percent in Solving Visual Form Problems
Baiduri
Department of Mathematics Education, Universitas Muhammadiyah Malang, Indonesia*Corresponding Author: [email protected]
Copyright©2018 by authors, all rights reserved. Authors agree that this article remains permanently open access under theterms of the Creative Commons Attribution License 4.0 International License
Abstract Fractions, decimals, and percentages are a rationalnumber that is very important in mathematics and everyday life.However, there are still many students experiencing difficulties inunderstanding the concept. This study aims to describe the strategyof the student in connecting fractions, decimals, and percent insolving visual form problems. Descriptive research with a mixedapproach was used for this purpose, with 32 students of grade VII inthe middle school serving as research subjects. Data obtainedthrough the subject has written answers to four questions in theform of visuals, which are then analyzed descriptively. The analysisresults show that the subject's strategy of connecting fractions,decimals, and percent using conceptual and arithmetic operations,has not utilized the visual images provided optimally.
Keywords Decimal, Fraction, Percent, ProblemSolving
1. IntroductionRational numbers are the very thing in school
mathematics. Several studies have shown a positiverelationship between prior knowledge of rational numbersand advanced mathematical skills. Weak comprehension ofrational numbers hinders involvement in a variety of middleand upper income jobs [1], [2]. Conceptual concepts ofrational numbers (fractions, decimals, and percent) showmore complexity than integers, both in the scope ofapplication and the technical expertise needed to master therational number system [3]. This subject is also a problemfor elementary and secondary school students, since ingeneral they have known and experienced about rationalnumbers outside of school [1], [4]. The new surge offraction and decimal comprehension work is inspired byevidence that rational numbers are connected to advancemathematical learning, including algebra and probability [2],[5], [6].
The concepts of fractions and decimals are fundamentalin the elementary and secondary school mathematicscurriculum as a prerequisite for advanced mathematics,especially algebra, and to succeed in many professions
[7]–[9]. Unfortunately, mastery of fractions and decimalsstill poses great difficulties for students [7], [10], [11].There are two types of difficulties in dealing with fractionsand decimal material: (1) difficulties inherent in fractionsand decimals and (2) cultural contingent difficulties whichcan be reduced by increasing instruction and priorknowledge of students [11]. The difficulty of studentsunderstanding fractions and decimals is that integers are themost frequent and first type of numbers they know. Studentsshould avoid conceptualizing fractions and decimals as inintegers [12], more complex than integers by havingmultiple representations [13]–[15], and students have lesstime with problems relating to fractions and decimals [4].
Difficulty in understanding fractions and decimals willundoubtedly have implications for learning [10], [13], [16].Ideally, when students learn numbers during elementaryschool, they are allowed to make many connectionsbetween integers, fractions, decimals, and percent, whichsupports them in deepening their understanding ofproportionality and ratio [17]. However, the fact is thatfraction and decimal instructions usually start at differentlevels, spanning several years, and are often taughtseparately [7], [18], [19], and without allowing students tomake connections, which hinders their capability tocompletely comprehend rational numbers [4]. Learningrational numbers that emphasizes relational understandingand using representation is a matter of concern for theteacher [3]. Propaedeutic learning in fraction material isvery instrumental in shaping the concept of mathematics inelementary schools, and students achieve significantlybetter learning outcomes compared to students who haven'tyet used this approach.[16].
In an effort to reduce difficulties, provide appropriateexperience to improve students' informal knowledge anddevelop awareness of more meaningful connectivityconcepts and procedures; teachers should play a moreinvolved and direct role in the learning process.[4]. Helpingstudents develop an understanding of importantmathematical ideas is a constant challenge for teachers [20].If teachers don't even have an in-depth understanding ofbasic topics, they don't always know how to interpret ideas
and make them easy to understand, they often fail to conveyconcepts to be understood by students [21]. Teachers with apoor understanding of rational numbers and operationsinvolving fractions and decimals will be barriers forstudents in learning algebra [11]. Interventions using storyproblems provide a substantial advantage in learningfractions, decimals, and percentages [11]. Building acomprehension of the products with similar of rationalnumbers and the connection among fractions, decimals, andpercentages by developing a visual model of rationalnumbers is very important [4]
Based on the fact that understanding the concept ofrational numbers is of great importance and visual modelscan build a comprehension of the connection amongfractions, decimals, and percent, then in this study usingvisual form problems in an effort to explore strategies thatstudents do in determining fraction, decimal, and percentvalues and the relationship between the three. Problem-solving is one of the strategies in learning mathematics.
2. MethodsThis study aims to describe visual problem-solving
strategies related to rational numbers of junior high schoolstudents, without intervening on the subject. The type ofresearch used is descriptive with a qualitative andquantitative approach [22]. Grade VII, middle schoolstudents, numbered 32 people consisting of 10 (31.25%)boys, and 22 (68.75%) girls were used as research subjects.
The data in this study are the subject's problem-solvingstrategy obtained from the subject's written answers. Datacollection instruments in the form of fraction test questionsadopted from [20] consists of 4 questions, namely onequestion determines the fraction, decimal, and percentvalues of a shaded area and three questions make up an areaif a fraction, decimal, and percent value is given and therelationships among of them which are presented in Table 1.
Furthermore, the data that has been obtained is analyzeddescriptively by coding the truth of the subject's answers andproblem-solving strategies in connecting fractions, decimals,and percentages associated with understanding concepts.
Table 1. Research instruments
1 State the shaded area in the form of fractions, decimals, andpercent!Explain how to get the answer!
2 a) Shade the area in the picture next to which states the value is
0.725.
b) What is the fractional value of the shaded area? How do you get
it?
c) What percentage of the shaded area? How do you get it?
3 a) Shade, the area in the image next to that, state value .
b) What percentage of the shaded area? How do you get it?
c) What is the decimal number represented by the shaded area?
How do you get it?
4 a) Shade, the area in the image next to that, states value .
b) What is the fractional value of the shaded area? How do you get
it?
c) What is the decimal number represented by the shaded area?
How do you get it?
3. Results and DiscussionBased on the data obtained from the subject's written
answers, the exposure to the results is presented in two parts:the frequency distribution of the correctness of the answers,and the subject's problem-solving strategies in connectingfraction, decimal, and percent.
3.1. Distribution of Subject Answers
The distribution of subject answers is presented based onthe gender, question number, and gender, as presented inTable 1.
Table 2. Distribution of subject answers
Gender
Problem
number 1
Problem
number 2
Problem
number 3
Problem
number 4
Right False Right False Right False Right False
Male 10 0 5 5 5 5 5 5
Girl 22 0 10 12 10 12 10 12
TOTAL 32 0 15 17 15 17 15 17
Based on Table 1, for question number 1, declare fractions,decimals, and percent of the area shaded by the subject doesnot experience difficulties. All subjects can answer correctly.However, for questions, number 2 through number 4, grindthe area if the fractional, decimal, and percent values aregiven the subject has difficulty. Female students experienceddifficulties as much as 37.50% of the total subjects or54.45% of the total female subjects. In comparison, malestudents experienced difficulties of 15.63% of the totalsubjects or 50.00% of the total male subjects. This resultmeans that in solving problems from number 2 to number 4,male subjects are better than female. This result is in linewith the statement that males excellently in terms ofmathematics and spatial ability while females excellent interms of language and writing [23], [24]. Theproblem-solving strategies of the two are also different[25]–[27], male tend to be more flexible using more abstractstrategies and retrieval, whereas female tend to usemanipulative and more concrete strategies.
3.2. Problem Solving Strategies and Connecting amongFractions, Decimals, and Percent
3.2.1. Problem number 1
The subject counts the number of shaded squares and thetotal number of squares to determine the fraction value of theshaded area. Next, create or write the fractional form andsimplify it. In the given problem, 34 shaded squares arestating the numerator and 80 total stating the denominator.The fraction value obtained is
40
17
80
34
The subject's written answers are presented in Figure 1.
Figure 1. The subject’s strategy determining the fractional value of theshaded area
This question was answered correctly by all subjects. Thatmeans that through the visual representation of images, thesubject can understand the concept of fractions, part of the
whole. Using of visual representations of images is anexcellent way to present abstract ideas in mathematics,especially for students in primary education [4], [28], [29].
The subject performs a division operation to obtain a
decimal value80
34 or40
17 , so it gets 0.425. This strategy is
carried out by all subjects. While the strategy to find percentis done by multiplying operations, the decimal value x 100%and obtained 42.5%, 0.425 x 100%. All subjects also do thismethod. Another strategy undertaken by the subject is toperform multiplication operations of fraction values with
100%, %5,42%10040
17 .
3.2.2. Problem number 2 to number 3
The subject's strategy is to determine the number ofsquares to be shaded. First, the subject declares a decimal orpercent value in the form of fractions. Second uses theequivalence of fractions to obtain a simpler fraction, andthird, use the equivalence of fractions related to the numberof squares in the picture. The numerator of the fractionalvalue obtained states the number of squares to be shaded.These results are presented in Figure 2a. Another strategy iscarried out by the subject after taking the first step or decimal,or percent value is multiplied by the many squares given inthe image or by making an equation shown in Figure 2b.
Figure 2. The subject strategy determines the area to be shaded in question number 2
This strategy shows that the subject does not understandwell the concept of 1.00 (in decimal) and 100% of the givenobject. The new subject understands fractions, part of thewhole. That is due in learning, decimal, and percent aretaught separately with fractions and taught after learningfractions. This problem also happened in America, which isdifferent from South Korea [1], [18], and the subject canapply fractional equivalence in solving problems [13].
The subject's strategy to connect the fractional value ifgiven a decimal value using the decimal concept, which isdivided by 10, 100, or 1000 (question number 2), thensimplified with the concept of equivalent fractions, bydividing the numerator and denominator by the same number.Mathematically can be written,
49
29
25
25
1000
725725,0 .
Meanwhile, to determine the percent value by multiplyingthe decimal or fraction value by 100%,
or
%5,72%1001000
725 .
This result shows that looking for percent values by movingthe comma two steps to the right [20].
The subject's strategy to connect the decimal value andpercent if the fractional value is known (problem number 3),by directly conducting fraction multiplication operations and100%,
%5,37%1008
3
and division
375,0838
3 or 375,0
100
5,37%5,37 .
These subjects who answered correctly understood theconcept of percent, divided by 100.
The strategy used by the subjects in determining percent inthis study did not fully use the method of dividing thenumerator and denominator and moving the comma twoplaces to the right, or making fractions equivalent to thedenominator of 100, or assuming that the overall areapresented was 100%, determining the value percent for eachsquare area [20].
The strategy used by the subject in connecting percentwith a fraction (problem number 4), first divides the value ofpercent by 100, then simplifies by dividing the numeratorand denominator so that the desired fraction is obtained.Mathematically written,
8
7
25
25
100
175
100
1
2
175100
2
187%
2
187
Meanwhile, to connect with decimal by using the concept of
percent 875,0100
5,87%5,87 or using fraction division,
875,0878
7 . Overall the subject's strategy in connecting
(2a) (2b) Shaded area
fractions, decimals, and percentages based on thecomputation of fractions, has not yet benefited the visualsgiven in the form of rectangles. Besides, in determining thedecimal value, the subject can do easily by dividing thenumerator and denominator or divided by 100. This result isconsistent with previous research that decimal is easier tomaster and student performance on problems involvingdecimals are more reliable and quicker than fraction-relatedproblems [1], [2], [5], [12].
In general, the subject's strategy of connecting fractions,decimals, and percent is by the meaning of numbersconceptually. Fractions, decimals, and percent is onenotation of rational numbers. Mastering all three can be saidto have understood rational numbers. The importance ofunderstanding of rational numbers for student performanceand future work, a deep misunderstanding of fraction,decimal, and percentage arithmetic is a serious issue [11].One aspect that determines the effectiveness of learningrational numbers is how the sequence of notations is taught.Rational numbers are complicated constructs because theycan be represented in various symbols, and since eachsymbols have a variety of interpretations [1], [11]. It is noteasy for students to grasp all meanings of a rational numbernotation, let alone expand the interpretation from onenotation to another. Learning rational numbers in percentageorder first, then decimal, and the last fraction produces betterresults than the traditional sequence, where fractions aretaught first [1]
3. ConclusionThe concepts of fractions, decimals, and percent for
school students are very important because these topics arevery complex and essential for learning other mathematicalmaterial and are widely used in daily life. The strategy isused by junior school students to express fractions, decimals,and percent of the visual representation of a given image bycounting the many shaded areas (as a numerator) andcalculating all regions (as a denominator). After the fractionis obtained, the strategy subject connects to decimal bydividing the numerator and denominator, while to connect topercent by multiplying fractions by 100%.
The problem-solving strategy of determining (shading) anarea if given a fraction, decimal, and percent is done byconnecting decimal or percent to fractions, makingequivalent fractions based on the many regions that are madeas denominators and numerators of fractions that are equal tothe number the area to be shaded or to carry out the fraction,decimal, and percent multiplication and the number ofsquare multiplications given. The strategy for connectingpercent to decimal or fraction is to divide the value of percentby 100, instead of connecting the decimal or fraction topercent by multiplying it by 100%.
Junior school students undertake the strategies to connectamong fractions, decimals, and percentages still underliearithmetic and fraction arithmetic operations, not yet
optimally utilizing the visual images provided. On the otherhand, the visual model is very important in understandingabstract mathematical concepts. Therefore the use ofmultiple visuals in learning fractions, decimals, and percentshould be of concern to the teacher, especially on the topic offractions.
REFERENCES[1] J. Tian and R. S. Siegler, “Which Type of Rational
Numbers Should Students Learn First?,” Educ. Psychol.Rev., vol. 30, no. 2, pp. 351–372, 2018, doi:10.1007/s10648-017-9417-3.
[2] M. DeWolf, M. Bassok, and K. J. Holyoak, “Fromrational numbers to algebra: Separable contributions ofdecimal magnitude and relational understanding offractions,” J. Exp. Child Psychol., vol. 133, pp. 72–84,2015, doi: 10.1016/j.jecp.2015.01.013.
[3] B. Brown, “The relational nature of rational numbers,”Pythagoras, vol. 36, no. 1, pp. 1–8, 2015, doi:10.4102/pythagoras.v36i1.273.
[4] C. Scaptura, J. Suh, and G. Mahaffey, “Masterpieces toMathematics : Using Art to Teach Fraction, Decimal, andPercent Equivalents,” Math. Teach. Middle Sch., vol. 13,no. 1, pp. 24–28, 2007.
[5] M. Hurst and S. Cordes, “Rational-number comparisonacross notation: Fractions, decimals, and WholeNumbers,” J. Exp. Psychol. Hum. Percept. Perform., vol.42, no. 2, pp. 281–293, 2016, doi: 10.1037/xhp0000140.
[6] M. Hurst and S. Cordes, “A systematic investigation ofthe link between rational number processing and algebraability,” Br. J. Psychol., vol. 109, no. 1, pp. 99–117, 2017,doi: 10.1111/bjop.12244.
[7] M. A. Hurst and S. Cordes, “Children’s understanding offraction and decimal symbols and the notation-specificrelation to pre-algebra ability,” J. Exp. Child Psychol., vol.168, pp. 32–48, 2018, doi: 10.1016/j.jecp.2017.12.003.
[8] P. L. Nguyen, H. T. Duong, and T. C. Phan, “Identifyingthe concept fraction of primary school students: Theinvestigation in Vietnam,” Educ. Res. Rev., vol. 12, no. 8,pp. 531–539, 2017, doi: 10.5897/err2017.3220.
[9] F. Reinhold, S. Hoch, B. Werner, J. Richter-Gebert, and K.Reiss, “Learning fractions with and without educationaltechnology: What matters for high-achieving andlow-achieving students?,” Learn. Instr., vol. 65, no.101264, pp. 1–19, 2020, doi:10.1016/j.learninstruc.2019.101264.
[10] J. A. J. Danan and R. Gelman, “The problem with
percentages,” Philos. Trans. R. Soc. B Biol. Sci., vol. 373,no. 20160519, pp. 263–273, 2018, doi:10.1017/9781316659250.015.
[11] H. Lortie-Forgues, J. Tian, and R. S. Siegler, “Why islearning fraction and decimal arithmetic so difficult?,”Dev. Rev., vol. 38, pp. 201–221, 2015, doi:10.1016/j.dr.2015.07.008.
[12] T. Iuculano and B. Butterworth, “Rapid communicationUnderstanding the real value of fractions and decimals,”Q. J. Exp. Psychol., vol. 64, no. 11, pp. 2088–2098, 2011,doi: 10.1080/17470218.2011.604785.
[13] L.-K. Kor, S.-H. Teoh, S. S. E. Binti Mohamed, and P.Singh, “Learning to Make Sense of Fractions: SomeInsights from the Malaysian Primary 4 Pupils,” Int.Electron. J. Math. Educ., vol. 14, no. 1, pp. 169–182,2018, doi: 10.29333/iejme/3985.
[14] L. S. Fuchs, A. S. Malone, R. F. Schumacher, J. Namkung,and A. Wang, “Fraction Intervention for Students WithMathematics Difficulties: Lessons Learned From FiveRandomized Controlled Trials,” J. Learn. Disabil., vol.50, no. 6, pp. 631–639, 2017, doi:10.1177/0022219416677249.
[15] S. Getenet and R. Callingham, “Teaching fractions forunderstanding: addressing interrelated concepts,” in In:40th Annual Conference of the Mathematics EducationResearch Group of Australasia: 40 Years On: We Are StillLearning! (MERGA40), 2017, pp. 277–284.
[16] B. Lazić, S. Abramovich, M. Mrđa, and D. A. Romano,“On the Teaching and Learning of Fractions through aConceptual Generalization Approach,” Int. Electron. J.Math. Educ., vol. 12, no. 8, pp. 749–767, 2017, doi:10.13140/RG.2.2.21436.13448.
[17] J. HUI and K. PETTIGREW, “THE TREASURECHESTS: EXPLORING RELATIONSHIPS DECIMALS,AND PERCENTS AMONG FRACTIONS, DECIMALS,AND PERCENTS,” OAME/AOEM Gaz., no. March, pp.1–2, 2020, doi: 10.1007/s10964-013-9948.
[18] H. S. Lee, M. DeWolf, M. Bassok, and K. J. Holyoak,“Conceptual and procedural distinctions betweenfractions and decimals: A cross-national comparison,”Cognition, vol. 147, pp. 57–69, 2016, doi:10.1016/j.cognition.2015.11.005.
[19] M. Rapp, M. Bassok, M. DeWolf, and K. J. Holyoak,“Modeling discrete and continuous entities with fractions
and decimals,” J. Exp. Psychol. Appl., vol. 21, no. 1, pp.47–56, 2015, doi: 10.1037/xap0000036.
[20] M. S. Smith, E. A. Silver, and M. K. Stein, ImprovingInstruction in Rational Numbers and Proportionality.Teachers College, Columbia University New York. 2005.
[21] R. Rosli, D. Goldsby, A. J. Onwuegbuzie, M. M. Capraro,R. M. Capraro, and E. G. Y. Gonzalez, “Elementarypreservice teachers’ knowledge, perceptions and attitudestowards fractions: A mixed-analysis,” J. Math. Educ., vol.11, no. 1, pp. 59–76, 2020, doi:10.22342/jme.11.1.9482.59-76.
[22] Sugiyono, Metode penelitian kuantitatif, kualitatif, danR&D. Bandung: Alfabeta. 2016.
[23] M. Asis, N. Arsyad, and Alimuddin, “Profil KemampuanSpasial Dalam Menyelesaikan Masalah Geometri SiswaYang Memiliki Kecerdasan Logis Matematis TinggiDitinjau Dari Perbedaan Gender,” J. Daya Mat., vol. 3,no. 1, pp. 78–87, 2015, doi: 10.26858/jds.v3i1.1320.
[24] F. van Nes and M. Doorman, “Fostering young children’sspatial structuring ability,” Int. Electron. J. Math. Educ.,vol. 6, no. 1, pp. 27–39, 2011.
[25] Baiduri, “Profil Berpikir Relasional SIswa SD dalamMenyelesikan Masalah Matematika Ditinjau dariKemampuan Matematika dan Gender. Disertasi: PPSUniversitas Negeri Surabaya,” 2013.
[26] S. M. Reis and S. Park, “Gender differences inhigh-achieving students in math and science,” J. Educ.Gift., vol. 25, no. 1, pp. 52–73, 2001, doi:10.1177/016235320102500104.
[27] A. M. Steegh, T. N. Höffler, M. M. Keller, and I.Parchmann, “Gender differences in mathematics andscience competitions: A systematic review,” J. Res. Sci.Teach., vol. 56, no. 10, pp. 1431–1460, 2019, doi:10.1002/tea.21580.
[28] Baiduri, “Understanding of Fraction Concepts ofElementary School Students Through Problem Solving,”2020.
[29] C. Bruce, S. Bennett, and T. Flynn, “Rational NumberTeaching and Learning - Literature Review,” 2018.
Students’ Strategy in Connecting Fractions, Decimal,and Percent in Solving Visual Form Problems
Baiduri
Department of Mathematics Education, Universitas Muhammadiyah Malang, Indonesia*Corresponding Author: [email protected]
Copyright©2018 by authors, all rights reserved. Authors agree that this article remains permanently open access under theterms of the Creative Commons Attribution License 4.0 International License
Abstract Fractions, decimals, and percentages are a rationalnumber that is very important in mathematics and everyday life.However, there are still many students experiencing difficulties inunderstanding the concept due to its complexity in the scope ofapplication and technical. Difficulty in understanding fractions anddecimals will undoubtedly have implication for learning. This studyaims to describe visual problem-solving strategies related torational numbers of junior high school students in solving visualform problems. Descriptive research with a mixed approach wasused for this purpose, with 32 student of grade VII in the middleschool consisting of 10 (31.25%) boys, and 22 (68.75%) girls wereused as research subjects. Data obtained through the subject haswritten answers to four questions in the form of visuals, namely onequestion determines the fraction, decimal, and percent values of ashaded area and three questions make up an area if a fraction,decimal, and percent value is given and the relationships among ofthem, which are then analyzed descriptively. The analysis resultsshow that the subject's strategy of connecting fractions, decimals,and percent using conceptual and arithmetic operations, has notutilized the visual images provided optimally. On the other hand,the visual model is very important in understanding abstractmathematical concepts. Thus, the use of multiple visuals in learningfractions, decimals, and percent should be a concern to the teacher,especially on the topic of fractions.
Keywords Decimal, Fraction, Percent, ProblemSolving
1. IntroductionRational numbers are the very thing in school
mathematics. Several studies have shown a positiverelationship between prior knowledge of rational numbersand advanced mathematical skills. Weak comprehension ofrational numbers hinders involvement in a variety of middleand upper income jobs [1], [2]. Conceptual concepts ofrational numbers (fractions, decimals, and percent) showmore complexity than integers, both in the scope ofapplication and the technical expertise needed to master therational number system [3]. This subject is also a problem
for elementary and secondary school students, since ingeneral they have known and experienced about rationalnumbers outside of school [1], [4]. The new surge offraction and decimal comprehension work is inspired byevidence that rational numbers are connected to advancemathematical learning, including algebra and probability [2],[5], [6].
The concepts of fractions and decimals are fundamentalin the elementary and secondary school mathematicscurriculum as a prerequisite for advanced mathematics,especially algebra, and to succeed in many professions[7]–[9]. Unfortunately, mastery of fractions and decimalsstill poses great difficulties for students [7], [10], [11].There are two types of difficulties in dealing with fractionsand decimal material: (1) difficulties inherent in fractionsand decimals and (2) cultural contingent difficulties whichcan be reduced by increasing instruction and priorknowledge of students [11]. The difficulty of studentsunderstanding fractions and decimals is that integers are themost frequent and first type of numbers they know. Studentsshould avoid conceptualizing fractions and decimals as inintegers [12], more complex than integers by havingmultiple representations [13]–[15], and students have lesstime with problems relating to fractions and decimals [4].
Difficulty in understanding fractions and decimals willundoubtedly have implications for learning [10], [13], [16].Ideally, when students learn numbers during elementaryschool, they are allowed to make many connectionsbetween integers, fractions, decimals, and percent, whichsupports them in deepening their understanding ofproportionality and ratio [17]. However, the fact is thatfraction and decimal instructions usually start at differentlevels, spanning several years, and are often taughtseparately [7], [18], [19], and without allowing students tomake connections, which hinders their capability tocompletely comprehend rational numbers [4]. Learningrational numbers that emphasizes relational understandingand using representation is a matter of concern for theteacher [3]. Propaedeutic learning in fraction material isvery instrumental in shaping the concept of mathematics inelementary schools, and students achieve significantly
better learning outcomes compared to students who haven'tyet used this approach.[16].
In an effort to reduce difficulties, provide appropriateexperience to improve students' informal knowledge anddevelop awareness of more meaningful connectivityconcepts and procedures; teachers should play a moreinvolved and direct role in the learning process.[4]. Helpingstudents develop an understanding of importantmathematical ideas is a constant challenge for teachers [20].If teachers don't even have an in-depth understanding ofbasic topics, they don't always know how to interpret ideasand make them easy to understand, they often fail to conveyconcepts to be understood by students [21]. Teachers with apoor understanding of rational numbers and operationsinvolving fractions and decimals will be barriers forstudents in learning algebra [11]. Interventions using storyproblems provide a substantial advantage in learningfractions, decimals, and percentages [11]. Building acomprehension of the products with similar of rationalnumbers and the connection among fractions, decimals, andpercentages by developing a visual model of rationalnumbers is very important [4]
Based on the fact that understanding the concept ofrational numbers is of great importance and visual modelscan build a comprehension of the connection amongfractions, decimals, and percent, then in this study usingvisual form problems in an effort to explore strategies that
students do in determining fraction, decimal, and percentvalues and the relationship between the three. Problem-solving is one of the strategies in learning mathematics.
2. MethodsThis study aims to describe visual problem-solving
strategies related to rational numbers of junior high schoolstudents, without intervening on the subject. The type ofresearch used is descriptive with a qualitative andquantitative approach [22]. Grade VII, middle schoolstudents, numbered 32 people consisting of 10 (31.25%)boys, and 22 (68.75%) girls were used as research subjects.
The data in this study are the subject's problem-solvingstrategy obtained from the subject's written answers. Datacollection instruments in the form of fraction test questionsadopted from [20] consists of 4 questions, namely onequestion determines the fraction, decimal, and percentvalues of a shaded area and three questions make up an areaif a fraction, decimal, and percent value is given and therelationships among of them which are presented in Table 1.
Furthermore, the data that has been obtained is analyzeddescriptively by coding the truth of the subject's answers andproblem-solving strategies in connecting fractions, decimals,and percentages associated with understanding concepts.
Table 1. Research instruments
1 State the shaded area in the form of fractions, decimals, andpercent!Explain how to get the answer!
2 a) Shade the area in the picture next to which states the value is
0.725.
b) What is the fractional value of the shaded area? How do you get
it?
c) What percentage of the shaded area? How do you get it?
3 a) Shade, the area in the image next to that, state value .
b) What percentage of the shaded area? How do you get it?
c) What is the decimal number represented by the shaded area?
How do you get it?
4 a) Shade, the area in the image next to that, states value .
b) What is the fractional value of the shaded area? How do you get
it?
c) What is the decimal number represented by the shaded area?
How do you get it?
3. Results and DiscussionBased on the data obtained from the subject's written
answers, the exposure to the results is presented in two parts:the frequency distribution of the correctness of the answers,and the subject's problem-solving strategies in connectingfraction, decimal, and percent.
3.1. Distribution of Subject Answers
The distribution of subject answers is presented based onthe gender, question number, and gender, as presented inTable 1.
Table 2. Distribution of subject answers
Gender
Problem
number 1
Problem
number 2
Problem
number 3
Problem
number 4
Right False Right False Right False Right False
Male 10 0 5 5 5 5 5 5
Girl 22 0 10 12 10 12 10 12
TOTAL 32 0 15 17 15 17 15 17
Based on Table 1, for question number 1, declare fractions,decimals, and percent of the area shaded by the subject doesnot experience difficulties. All subjects can answer correctly.However, for questions, number 2 through number 4, grindthe area if the fractional, decimal, and percent values aregiven the subject has difficulty. Female students experienceddifficulties as much as 37.50% of the total subjects or54.45% of the total female subjects. In comparison, malestudents experienced difficulties of 15.63% of the totalsubjects or 50.00% of the total male subjects. This resultmeans that in solving problems from number 2 to number 4,male subjects are better than female. This result is in linewith the statement that males excellently in terms ofmathematics and spatial ability while females excellent interms of language and writing [23], [24]. The
problem-solving strategies of the two are also different[25]–[27], male tend to be more flexible using more abstractstrategies and retrieval, whereas female tend to usemanipulative and more concrete strategies.
3.2. Problem Solving Strategies and Connecting amongFractions, Decimals, and Percent
3.2.1. Problem number 1
The subject counts the number of shaded squares and thetotal number of squares to determine the fraction value of theshaded area. Next, create or write the fractional form andsimplify it. In the given problem, 34 shaded squares arestating the numerator and 80 total stating the denominator.
The fraction value obtained is
40
17
80
34
The subject's written answers are presented in Figure 1.
Figure 1. The subject’s strategy determining the fractional value of theshaded area
This question was answered correctly by all subjects. Thatmeans that through the visual representation of images, thesubject can understand the concept of fractions, part of thewhole. Using of visual representations of images is anexcellent way to present abstract ideas in mathematics,especially for students in primary education [4], [28], [29].
The subject performs a division operation to obtain a
decimal value80
34 or40
17 , so it gets 0.425. This strategy is
carried out by all subjects. While the strategy to find percentis done by multiplying operations, the decimal value x 100%and obtained 42.5%, 0.425 x 100%. All subjects also do thismethod. Another strategy undertaken by the subject is toperform multiplication operations of fraction values with
100%, %5,42%10040
17 .
3.2.2. Problem number 2 to number 3
The subject's strategy is to determine the number ofsquares to be shaded. First, the subject declares a decimal orpercent value in the form of fractions. Second uses theequivalence of fractions to obtain a simpler fraction, andthird, use the equivalence of fractions related to the numberof squares in the picture. The numerator of the fractionalvalue obtained states the number of squares to be shaded.These results are presented in Figure 2a. Another strategy iscarried out by the subject after taking the first step or decimal,or percent value is multiplied by the many squares given inthe image or by making an equation shown in Figure 2b.
Figure 2. The subject strategy determines the area to be shaded in question number 2
This strategy shows that the subject does not understandwell the concept of 1.00 (in decimal) and 100% of the givenobject. The new subject understands fractions, part of thewhole. That is due in learning, decimal, and percent aretaught separately with fractions and taught after learningfractions. This problem also happened in America, which isdifferent from South Korea [1], [18], and the subject canapply fractional equivalence in solving problems [13].
The subject's strategy to connect the fractional value ifgiven a decimal value using the decimal concept, which isdivided by 10, 100, or 1000 (question number 2), thensimplified with the concept of equivalent fractions, bydividing the numerator and denominator by the same number.Mathematically can be written,
49
29
25
25
1000
725725,0 .
Meanwhile, to determine the percent value by multiplyingthe decimal or fraction value by 100%,
or
%5,72%1001000
725 .
This result shows that looking for percent values by movingthe comma two steps to the right [20].
The subject's strategy to connect the decimal value andpercent if the fractional value is known (problem number 3),by directly conducting fraction multiplication operations and100%,
%5,37%1008
3
and division
375,0838
3 or 375,0
100
5,37%5,37 .
These subjects who answered correctly understood theconcept of percent, divided by 100.
The strategy used by the subjects in determining percent in
(2a) (2b) Shaded area
this study did not fully use the method of dividing thenumerator and denominator and moving the comma twoplaces to the right, or making fractions equivalent to thedenominator of 100, or assuming that the overall areapresented was 100%, determining the value percent for eachsquare area [20].
The strategy used by the subject in connecting percentwith a fraction (problem number 4), first divides the value ofpercent by 100, then simplifies by dividing the numeratorand denominator so that the desired fraction is obtained.Mathematically written,
8
7
25
25
100
175
100
1
2
175100
2
187%
2
187
Meanwhile, to connect with decimal by using the concept of
percent 875,0100
5,87%5,87 or using fraction division,
875,0878
7 . Overall the subject's strategy in connecting
fractions, decimals, and percentages based on thecomputation of fractions, has not yet benefited the visualsgiven in the form of rectangles. Besides, in determining thedecimal value, the subject can do easily by dividing thenumerator and denominator or divided by 100. This result isconsistent with previous research that decimal is easier tomaster and student performance on problems involvingdecimals are more reliable and quicker than fraction-relatedproblems [1], [2], [5], [12].
In general, the subject's strategy of connecting fractions,decimals, and percent is by the meaning of numbersconceptually. Fractions, decimals, and percent is onenotation of rational numbers. Mastering all three can be saidto have understood rational numbers. The importance ofunderstanding of rational numbers for student performanceand future work, a deep misunderstanding of fraction,decimal, and percentage arithmetic is a serious issue [11].One aspect that determines the effectiveness of learningrational numbers is how the sequence of notations is taught.Rational numbers are complicated constructs because theycan be represented in various symbols, and since eachsymbols have a variety of interpretations [1], [11]. It is noteasy for students to grasp all meanings of a rational numbernotation, let alone expand the interpretation from onenotation to another. Learning rational numbers in percentageorder first, then decimal, and the last fraction produces betterresults than the traditional sequence, where fractions aretaught first [1]
3. ConclusionThe concepts of fractions, decimals, and percent for
school students are very important because these topics arevery complex and essential for learning other mathematicalmaterial and are widely used in daily life. The strategy isused by junior school students to express fractions, decimals,and percent of the visual representation of a given image bycounting the many shaded areas (as a numerator) and
calculating all regions (as a denominator). After the fractionis obtained, the strategy subject connects to decimal bydividing the numerator and denominator, while to connect topercent by multiplying fractions by 100%.
The problem-solving strategy of determining (shading) anarea if given a fraction, decimal, and percent is done byconnecting decimal or percent to fractions, makingequivalent fractions based on the many regions that are madeas denominators and numerators of fractions that are equal tothe number the area to be shaded or to carry out the fraction,decimal, and percent multiplication and the number ofsquare multiplications given. The strategy for connectingpercent to decimal or fraction is to divide the value of percentby 100, instead of connecting the decimal or fraction topercent by multiplying it by 100%.
Junior school students undertake the strategies to connectamong fractions, decimals, and percentages still underliearithmetic and fraction arithmetic operations, not yetoptimally utilizing the visual images provided. On the otherhand, the visual model is very important in understandingabstract mathematical concepts. Therefore the use ofmultiple visuals in learning fractions, decimals, and percentshould be of concern to the teacher, especially on the topic offractions.
REFERENCES[1] J. Tian and R. S. Siegler, “Which Type of Rational
Numbers Should Students Learn First?,” Educ. Psychol.Rev., vol. 30, no. 2, pp. 351–372, 2018, doi:10.1007/s10648-017-9417-3.
[2] M. DeWolf, M. Bassok, and K. J. Holyoak, “Fromrational numbers to algebra: Separable contributions ofdecimal magnitude and relational understanding offractions,” J. Exp. Child Psychol., vol. 133, pp. 72–84,2015, doi: 10.1016/j.jecp.2015.01.013.
[3] B. Brown, “The relational nature of rational numbers,”Pythagoras, vol. 36, no. 1, pp. 1–8, 2015, doi:10.4102/pythagoras.v36i1.273.
[4] C. Scaptura, J. Suh, and G. Mahaffey, “Masterpieces toMathematics : Using Art to Teach Fraction, Decimal, andPercent Equivalents,” Math. Teach. Middle Sch., vol. 13,no. 1, pp. 24–28, 2007.
[5] M. Hurst and S. Cordes, “Rational-number comparisonacross notation: Fractions, decimals, and WholeNumbers,” J. Exp. Psychol. Hum. Percept. Perform., vol.42, no. 2, pp. 281–293, 2016, doi: 10.1037/xhp0000140.
[6] M. Hurst and S. Cordes, “A systematic investigation ofthe link between rational number processing and algebraability,” Br. J. Psychol., vol. 109, no. 1, pp. 99–117, 2017,doi: 10.1111/bjop.12244.
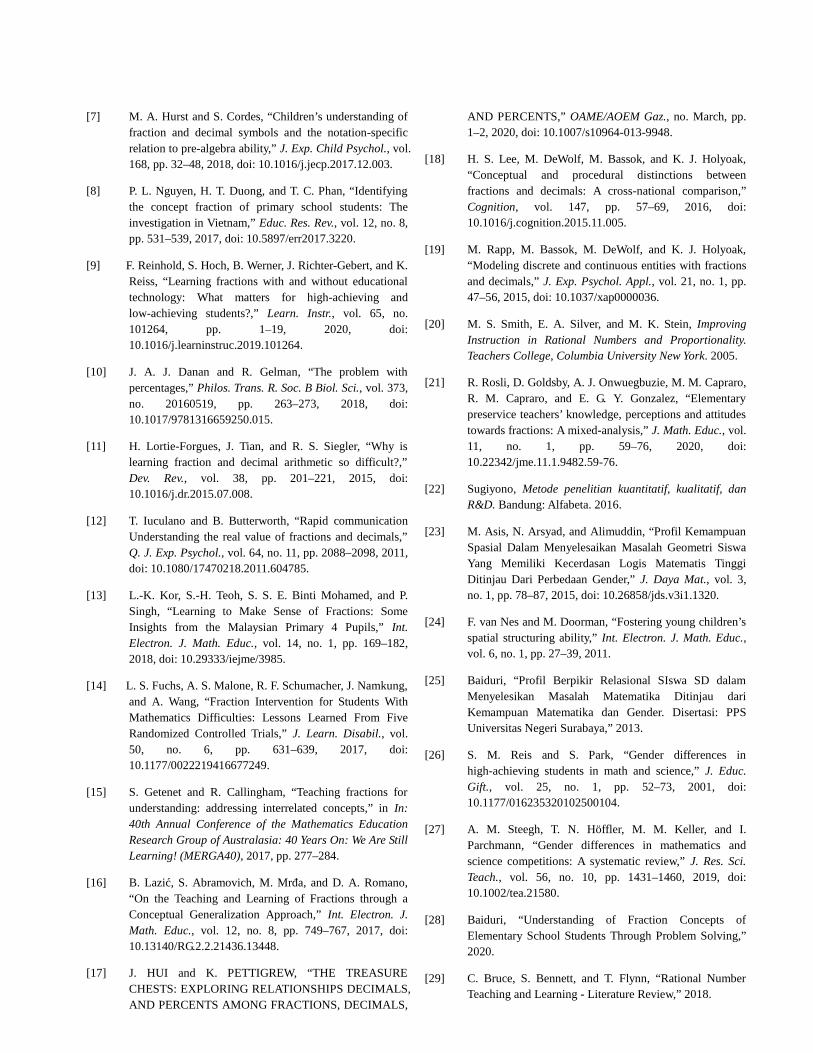
[7] M. A. Hurst and S. Cordes, “Children’s understanding offraction and decimal symbols and the notation-specificrelation to pre-algebra ability,” J. Exp. Child Psychol., vol.168, pp. 32–48, 2018, doi: 10.1016/j.jecp.2017.12.003.
[8] P. L. Nguyen, H. T. Duong, and T. C. Phan, “Identifyingthe concept fraction of primary school students: Theinvestigation in Vietnam,” Educ. Res. Rev., vol. 12, no. 8,pp. 531–539, 2017, doi: 10.5897/err2017.3220.
[9] F. Reinhold, S. Hoch, B. Werner, J. Richter-Gebert, and K.Reiss, “Learning fractions with and without educationaltechnology: What matters for high-achieving andlow-achieving students?,” Learn. Instr., vol. 65, no.101264, pp. 1–19, 2020, doi:10.1016/j.learninstruc.2019.101264.
[10] J. A. J. Danan and R. Gelman, “The problem withpercentages,” Philos. Trans. R. Soc. B Biol. Sci., vol. 373,no. 20160519, pp. 263–273, 2018, doi:10.1017/9781316659250.015.
[11] H. Lortie-Forgues, J. Tian, and R. S. Siegler, “Why islearning fraction and decimal arithmetic so difficult?,”Dev. Rev., vol. 38, pp. 201–221, 2015, doi:10.1016/j.dr.2015.07.008.
[12] T. Iuculano and B. Butterworth, “Rapid communicationUnderstanding the real value of fractions and decimals,”Q. J. Exp. Psychol., vol. 64, no. 11, pp. 2088–2098, 2011,doi: 10.1080/17470218.2011.604785.
[13] L.-K. Kor, S.-H. Teoh, S. S. E. Binti Mohamed, and P.Singh, “Learning to Make Sense of Fractions: SomeInsights from the Malaysian Primary 4 Pupils,” Int.Electron. J. Math. Educ., vol. 14, no. 1, pp. 169–182,2018, doi: 10.29333/iejme/3985.
[14] L. S. Fuchs, A. S. Malone, R. F. Schumacher, J. Namkung,and A. Wang, “Fraction Intervention for Students WithMathematics Difficulties: Lessons Learned From FiveRandomized Controlled Trials,” J. Learn. Disabil., vol.50, no. 6, pp. 631–639, 2017, doi:10.1177/0022219416677249.
[15] S. Getenet and R. Callingham, “Teaching fractions forunderstanding: addressing interrelated concepts,” in In:40th Annual Conference of the Mathematics EducationResearch Group of Australasia: 40 Years On: We Are StillLearning! (MERGA40), 2017, pp. 277–284.
[16] B. Lazić, S. Abramovich, M. Mrđa, and D. A. Romano,“On the Teaching and Learning of Fractions through aConceptual Generalization Approach,” Int. Electron. J.Math. Educ., vol. 12, no. 8, pp. 749–767, 2017, doi:10.13140/RG.2.2.21436.13448.
[17] J. HUI and K. PETTIGREW, “THE TREASURECHESTS: EXPLORING RELATIONSHIPS DECIMALS,AND PERCENTS AMONG FRACTIONS, DECIMALS,
AND PERCENTS,” OAME/AOEM Gaz., no. March, pp.1–2, 2020, doi: 10.1007/s10964-013-9948.
[18] H. S. Lee, M. DeWolf, M. Bassok, and K. J. Holyoak,“Conceptual and procedural distinctions betweenfractions and decimals: A cross-national comparison,”Cognition, vol. 147, pp. 57–69, 2016, doi:10.1016/j.cognition.2015.11.005.
[19] M. Rapp, M. Bassok, M. DeWolf, and K. J. Holyoak,“Modeling discrete and continuous entities with fractionsand decimals,” J. Exp. Psychol. Appl., vol. 21, no. 1, pp.47–56, 2015, doi: 10.1037/xap0000036.
[20] M. S. Smith, E. A. Silver, and M. K. Stein, ImprovingInstruction in Rational Numbers and Proportionality.Teachers College, Columbia University New York. 2005.
[21] R. Rosli, D. Goldsby, A. J. Onwuegbuzie, M. M. Capraro,R. M. Capraro, and E. G. Y. Gonzalez, “Elementarypreservice teachers’ knowledge, perceptions and attitudestowards fractions: A mixed-analysis,” J. Math. Educ., vol.11, no. 1, pp. 59–76, 2020, doi:10.22342/jme.11.1.9482.59-76.
[22] Sugiyono, Metode penelitian kuantitatif, kualitatif, danR&D. Bandung: Alfabeta. 2016.
[23] M. Asis, N. Arsyad, and Alimuddin, “Profil KemampuanSpasial Dalam Menyelesaikan Masalah Geometri SiswaYang Memiliki Kecerdasan Logis Matematis TinggiDitinjau Dari Perbedaan Gender,” J. Daya Mat., vol. 3,no. 1, pp. 78–87, 2015, doi: 10.26858/jds.v3i1.1320.
[24] F. van Nes and M. Doorman, “Fostering young children’sspatial structuring ability,” Int. Electron. J. Math. Educ.,vol. 6, no. 1, pp. 27–39, 2011.
[25] Baiduri, “Profil Berpikir Relasional SIswa SD dalamMenyelesikan Masalah Matematika Ditinjau dariKemampuan Matematika dan Gender. Disertasi: PPSUniversitas Negeri Surabaya,” 2013.
[26] S. M. Reis and S. Park, “Gender differences inhigh-achieving students in math and science,” J. Educ.Gift., vol. 25, no. 1, pp. 52–73, 2001, doi:10.1177/016235320102500104.
[27] A. M. Steegh, T. N. Höffler, M. M. Keller, and I.Parchmann, “Gender differences in mathematics andscience competitions: A systematic review,” J. Res. Sci.Teach., vol. 56, no. 10, pp. 1431–1460, 2019, doi:10.1002/tea.21580.
[28] Baiduri, “Understanding of Fraction Concepts ofElementary School Students Through Problem Solving,”2020.
[29] C. Bruce, S. Bennett, and T. Flynn, “Rational NumberTeaching and Learning - Literature Review,” 2018.

Peer Review Report
Notes
1. Please return the completed report by email within 21 days;
2. All comments should be made in this review report and not on the manuscript.
About HRPUBHorizon Research Publishing, USA (HRPUB) is a worldwide open access publisher serving the academicresearch and scientific communities by launching peer-reviewed journals covering a wide range of academicdisciplines. As an international academic organization for researchers & scientists, we aim to provideresearchers, writers, academic professors and students the most advanced research achievements in abroad range of areas, and to facilitate the academic exchange between them.
Manuscript InformationManuscript ID: 19517296
Manuscript Title: Students’ Strategy in Connecting Fractions, Decimal, and Percent in Solving Visual Form
Problems
Evaluation Report
General Comments
It is well-known that there are several resources like (Cuisenaire rods, fraction bars, counting sticks,
dominoes, playing cards, calculators, digit cards, dotted paper, counting bead string, decimal
placemat ...etc) that may be useful in developing and consolidating a number of concepts for
students like place value, decimals and percentages. Therefore, we conclude that the best way to
teach students these concepts (place value, decimals and percentages) is to use illustrative pictures
or some previous resourcesThis article adopted Students' Strategy in Connecting Fractions, Decimal, and Percent in SolvingVisual Form Problems. As for the title of this article, the title is written in a brief single phrase,which provides an informative structure that reflects the article’s aim. Besides, the abstract wascomprehensively written in a stand-alone paragraph. This research represents an applicablemethod, in which all procedures can be re-examined and re-used for a wide range of samples. Theresearch method was clearly limited into two parts: the frequency distribution of the correctness ofthe answers, and the subject's problem-solving strategies in connecting fraction, decimal, andpercent. Thereby, the methodology is good.
Advantage &Disadvantage
The advantage of this research is to use a type of the researches called descriptive research that todescribe the strategy of the student in connecting fractions, decimals, and percent in solving visualform problems where the author used a mixed approach was used for this purpose, with 32 studentsof grade VII in the middle school serving as research subjects. Data obtained through the subjecthas written answers to four questions in the form of visuals. Based on these data, the results werepresented in two parts: the frequency distribution of the correctness of the answers, and the subject'sproblem-solving strategies in connecting fractions, decimals, and percent which were thenanalyzed descriptively where the analysis results showed that the subject's strategy of connectingfractions, decimals, and percent using conceptual and arithmetic operations, has not utilized thevisual images provided optimally.

Horizon Research Publishing, USA http://www.hrpub.org/
The disadvantages of this research, are as follows:1. The author did not clear if the sample just from one school or more than one. If it is just fromone school, then it is better to be from different schools where the results are more accurate.2. Besides, the author mentioned that the sample was 32 (10 boys and 22 girls) and the author didnot explain why he takes it as that form. Why did the author not take the sample evenly (16 boysand 16 girls) or take it in a form (20 boys and 12 girls)?3. Does the number of sample 32 refer to something? Can a person take another number?4. The author clarified that the strategy which was used by junior school students to expressfractions, decimals, and percent of the visual representation of a given image which was bycounting the many shaded areas (as a numerator) and calculating all regions (as a denominator).After the fraction is obtained, the strategy subject connects to decimal by dividing the numeratorand denominator, while to connect to percent by multiplying fractions by 100%, but he did notexplain if there exists another strategy solves the problem of teaching the student these concepts?Where he can then present a comparison between them to explain which of them is better.
How to improve
The author can add an explanation which answers the points of disadvantages.
Comments to theauthor
Despite that there are some points that must occur in this research, but in my opinion, thisresearch could be accepted as it is.
Please rate the following: (1 = Excellent) (2 = Good) (3 = Fair) (4 = Poor)
Originality: 2
Contribution to the Field: 2
Technical Quality: 1
Clarity of Presentation : 1
Depth of Research: 2
Recommendation
Kindly mark with a ■
□ Accept As It Is
□ Requires Minor Revision
□ Requires Major Revision
□ Reject
Return Date: 3/8/2020
Peer Review Report
Notes
1. Please return the completed report by email within 21 days;
2. All comments should be made in this review report and not on the manuscript.
About HRPUBHorizon Research Publishing, USA (HRPUB) is a worldwide open access publisher serving the academicresearch and scientific communities by launching peer-reviewed journals covering a wide range of academicdisciplines. As an international academic organization for researchers & scientists, we aim to provideresearchers, writers, academic professors and students the most advanced research achievements in abroad range of areas, and to facilitate the academic exchange between them.
Manuscript InformationManuscript ID: 19517296
Manuscript Title: Students’ Strategy in Connecting Fractions, Decimal, and Percent in Solving Visual Form
Problems
Evaluation Report
General Comments
This paper describes the student's strategy in connecting fractions, tithes, andpercentages in solving visual problems by applying descriptive research to a group of 32students in a 7th grade middle school who answered four written questions. of images.
Advantage &Disadvantage
All the constituent elements of an article are present: summary, keywords, introduction,methodology, results, conclusion, bibliography. The title is suggestive of the topicaddressed in the article. The summary reflects the content of the article. The introductionlogically describes what the authors wanted to achieve and clearly exposes the problemunder investigation. The methodology applied is appropriate. The results are clearly andin logical sequence. The authors did an appropriate analysis. The statements in theConclusions section are supported by the results. Figures and tables accurately describethe data in the article. The article refers to previous research in an appropriate manner.The bibliographic references are correct and appropriate.Descriptive research is used when there is little information about the phenomenon. Forthis reason, descriptive research is usually a preliminary work for exhibition research,because knowing the properties of a particular phenomenon allows explanations forother aspects that are related.
How to improve
Relationships can be established between the data obtained, to classify them intocategories (called descriptive categories).
Horizon Research Publishing, USA http://www.hrpub.org/
Comments to theauthor
Descriptive research is used when there is little information about the phenomenon.
Please rate the following: (1 = Excellent) (2 = Good) (3 = Fair) (4 = Poor)
Originality: 2
Contribution to the Field: 2
Technical Quality: 1
Clarity of Presentation : 1
Depth of Research: 2
Recommendation
Kindly mark with a ■
□ Accept As It Is
□ Requires Minor Revision
□ Requires Major Revision
□ Reject
Return Date: 10 August 2020
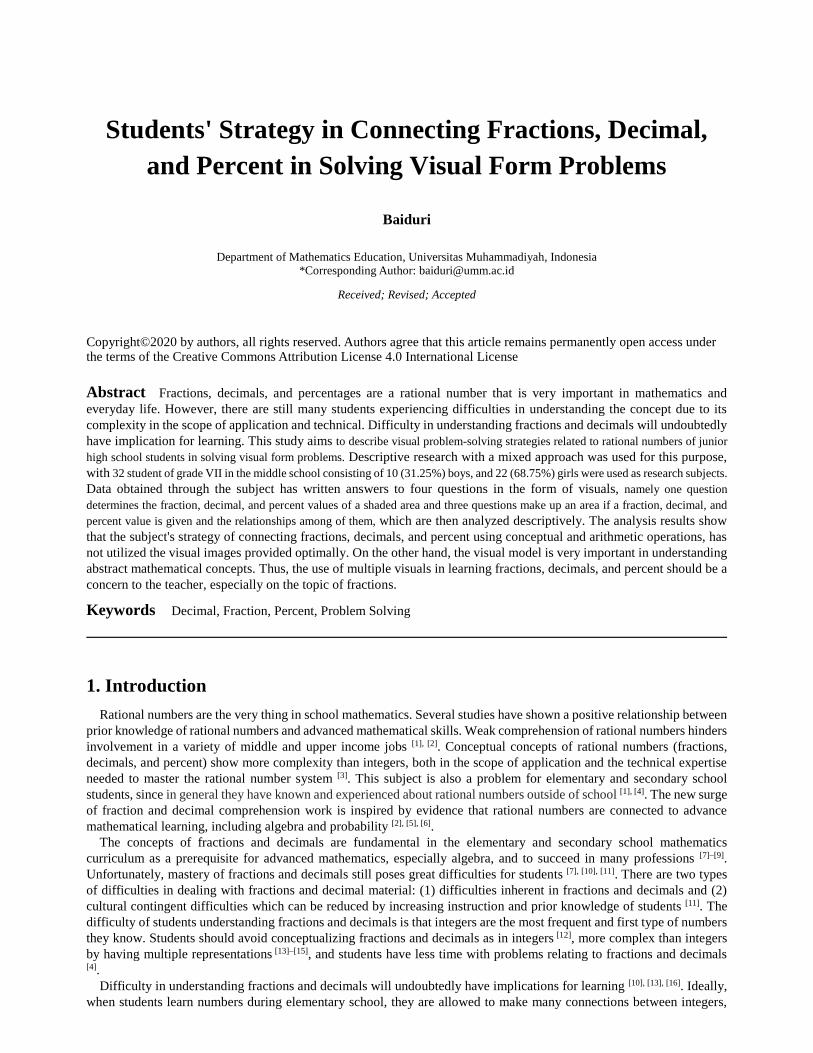
Students' Strategy in Connecting Fractions, Decimal,and Percent in Solving Visual Form Problems
Baiduri
Department of Mathematics Education, Universitas Muhammadiyah, Indonesia*Corresponding Author: [email protected]
Received; Revised; Accepted
Copyright©2020 by authors, all rights reserved. Authors agree that this article remains permanently open access underthe terms of the Creative Commons Attribution License 4.0 International License
Abstract Fractions, decimals, and percentages are a rational number that is very important in mathematics andeveryday life. However, there are still many students experiencing difficulties in understanding the concept due to itscomplexity in the scope of application and technical. Difficulty in understanding fractions and decimals will undoubtedlyhave implication for learning. This study aims to describe visual problem-solving strategies related to rational numbers of juniorhigh school students in solving visual form problems. Descriptive research with a mixed approach was used for this purpose,with 32 student of grade VII in the middle school consisting of 10 (31.25%) boys, and 22 (68.75%) girls were used as research subjects.Data obtained through the subject has written answers to four questions in the form of visuals, namely one questiondetermines the fraction, decimal, and percent values of a shaded area and three questions make up an area if a fraction, decimal, andpercent value is given and the relationships among of them, which are then analyzed descriptively. The analysis results showthat the subject's strategy of connecting fractions, decimals, and percent using conceptual and arithmetic operations, hasnot utilized the visual images provided optimally. On the other hand, the visual model is very important in understandingabstract mathematical concepts. Thus, the use of multiple visuals in learning fractions, decimals, and percent should be aconcern to the teacher, especially on the topic of fractions.
Keywords Decimal, Fraction, Percent, Problem Solving
1. Introduction
Rational numbers are the very thing in school mathematics. Several studies have shown a positive relationship betweenprior knowledge of rational numbers and advanced mathematical skills. Weak comprehension of rational numbers hindersinvolvement in a variety of middle and upper income jobs [1], [2]. Conceptual concepts of rational numbers (fractions,decimals, and percent) show more complexity than integers, both in the scope of application and the technical expertiseneeded to master the rational number system [3]. This subject is also a problem for elementary and secondary schoolstudents, since in general they have known and experienced about rational numbers outside of school [1], [4]. The new surgeof fraction and decimal comprehension work is inspired by evidence that rational numbers are connected to advancemathematical learning, including algebra and probability [2], [5], [6].
The concepts of fractions and decimals are fundamental in the elementary and secondary school mathematicscurriculum as a prerequisite for advanced mathematics, especially algebra, and to succeed in many professions [7]–[9].Unfortunately, mastery of fractions and decimals still poses great difficulties for students [7], [10], [11]. There are two typesof difficulties in dealing with fractions and decimal material: (1) difficulties inherent in fractions and decimals and (2)cultural contingent difficulties which can be reduced by increasing instruction and prior knowledge of students [11]. Thedifficulty of students understanding fractions and decimals is that integers are the most frequent and first type of numbersthey know. Students should avoid conceptualizing fractions and decimals as in integers [12], more complex than integersby having multiple representations [13]–[15], and students have less time with problems relating to fractions and decimals[4].
Difficulty in understanding fractions and decimals will undoubtedly have implications for learning [10], [13], [16]. Ideally,when students learn numbers during elementary school, they are allowed to make many connections between integers,
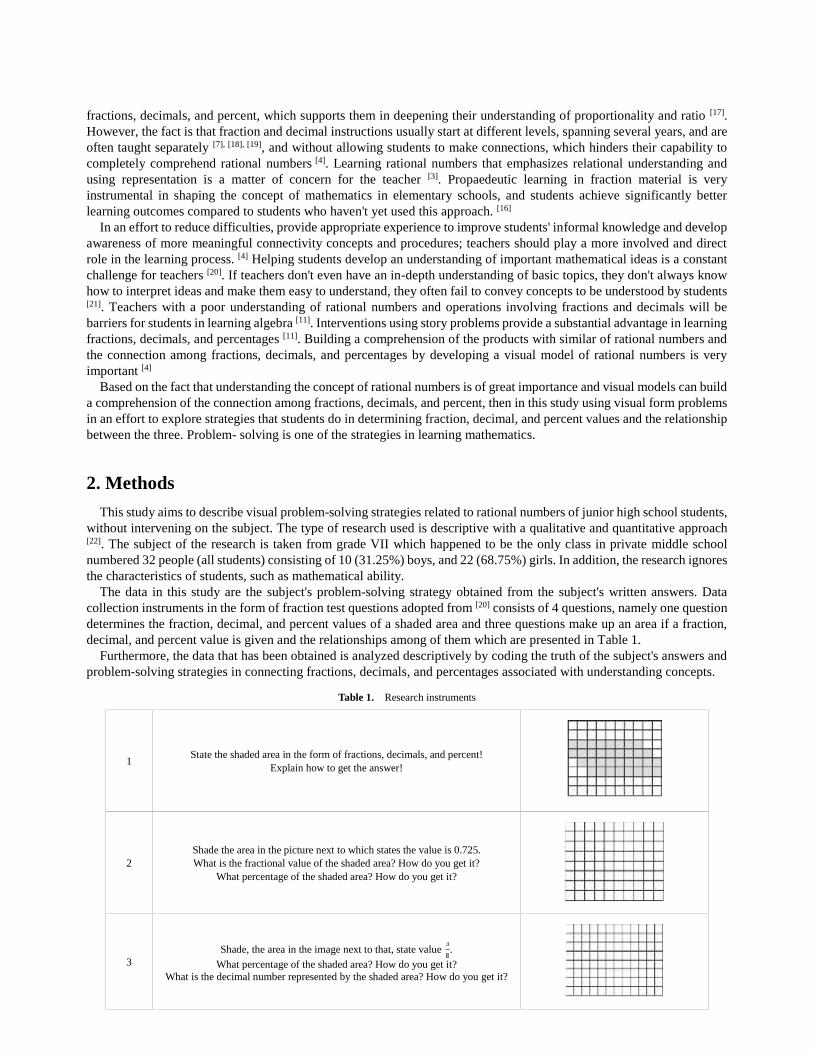
fractions, decimals, and percent, which supports them in deepening their understanding of proportionality and ratio [17].However, the fact is that fraction and decimal instructions usually start at different levels, spanning several years, and areoften taught separately [7], [18], [19], and without allowing students to make connections, which hinders their capability tocompletely comprehend rational numbers [4]. Learning rational numbers that emphasizes relational understanding andusing representation is a matter of concern for the teacher [3]. Propaedeutic learning in fraction material is veryinstrumental in shaping the concept of mathematics in elementary schools, and students achieve significantly betterlearning outcomes compared to students who haven't yet used this approach. [16]
In an effort to reduce difficulties, provide appropriate experience to improve students' informal knowledge and developawareness of more meaningful connectivity concepts and procedures; teachers should play a more involved and directrole in the learning process. [4] Helping students develop an understanding of important mathematical ideas is a constantchallenge for teachers [20]. If teachers don't even have an in-depth understanding of basic topics, they don't always knowhow to interpret ideas and make them easy to understand, they often fail to convey concepts to be understood by students[21]. Teachers with a poor understanding of rational numbers and operations involving fractions and decimals will bebarriers for students in learning algebra [11]. Interventions using story problems provide a substantial advantage in learningfractions, decimals, and percentages [11]. Building a comprehension of the products with similar of rational numbers andthe connection among fractions, decimals, and percentages by developing a visual model of rational numbers is veryimportant [4]
Based on the fact that understanding the concept of rational numbers is of great importance and visual models can builda comprehension of the connection among fractions, decimals, and percent, then in this study using visual form problemsin an effort to explore strategies that students do in determining fraction, decimal, and percent values and the relationshipbetween the three. Problem- solving is one of the strategies in learning mathematics.
2. Methods
This study aims to describe visual problem-solving strategies related to rational numbers of junior high school students,without intervening on the subject. The type of research used is descriptive with a qualitative and quantitative approach[22]. The subject of the research is taken from grade VII which happened to be the only class in private middle schoolnumbered 32 people (all students) consisting of 10 (31.25%) boys, and 22 (68.75%) girls. In addition, the research ignoresthe characteristics of students, such as mathematical ability.
The data in this study are the subject's problem-solving strategy obtained from the subject's written answers. Datacollection instruments in the form of fraction test questions adopted from [20] consists of 4 questions, namely one questiondetermines the fraction, decimal, and percent values of a shaded area and three questions make up an area if a fraction,decimal, and percent value is given and the relationships among of them which are presented in Table 1.
Furthermore, the data that has been obtained is analyzed descriptively by coding the truth of the subject's answers andproblem-solving strategies in connecting fractions, decimals, and percentages associated with understanding concepts.
Table 1. Research instruments
1State the shaded area in the form of fractions, decimals, and percent!
Explain how to get the answer!
2Shade the area in the picture next to which states the value is 0.725.What is the fractional value of the shaded area? How do you get it?
What percentage of the shaded area? How do you get it?
3Shade, the area in the image next to that, state value .
What percentage of the shaded area? How do you get it?What is the decimal number represented by the shaded area? How do you get it?
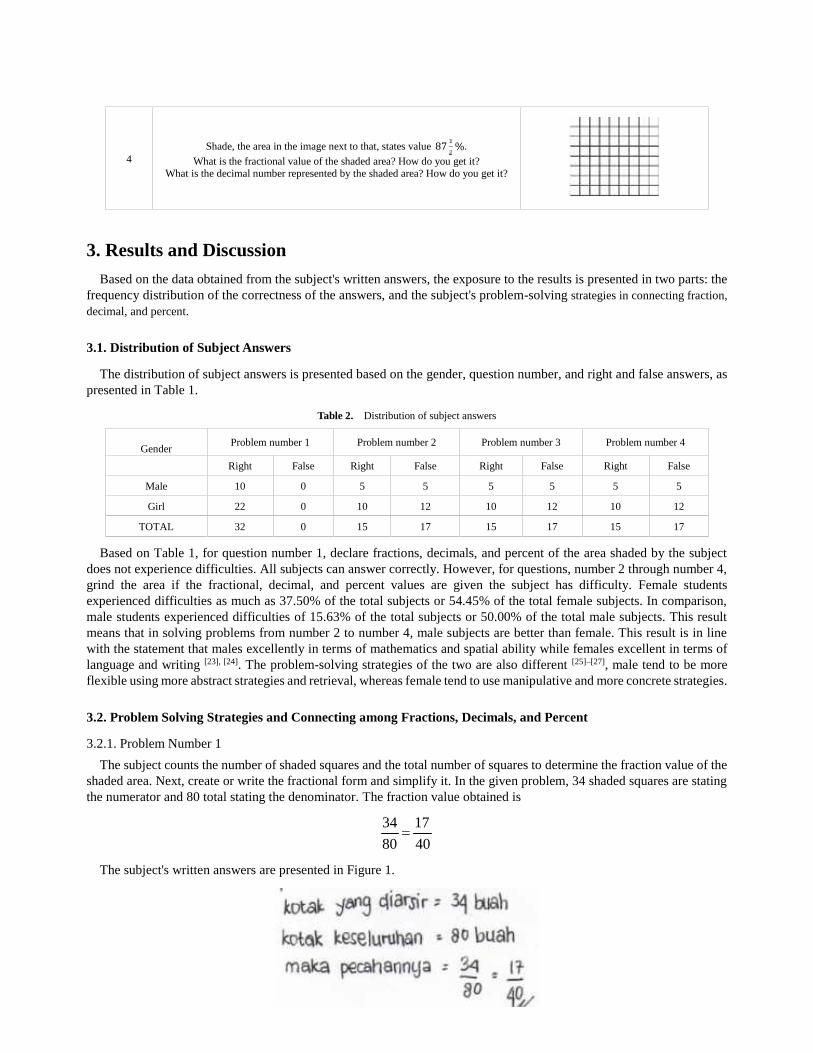
4Shade, the area in the image next to that, states value 87 %.
What is the fractional value of the shaded area? How do you get it?What is the decimal number represented by the shaded area? How do you get it?
3. Results and Discussion
Based on the data obtained from the subject's written answers, the exposure to the results is presented in two parts: thefrequency distribution of the correctness of the answers, and the subject's problem-solving strategies in connecting fraction,decimal, and percent.
3.1. Distribution of Subject Answers
The distribution of subject answers is presented based on the gender, question number, and right and false answers, aspresented in Table 1.
Table 2. Distribution of subject answers
GenderProblem number 1 Problem number 2 Problem number 3 Problem number 4
Right False Right False Right False Right False
Male 10 0 5 5 5 5 5 5
Girl 22 0 10 12 10 12 10 12
TOTAL 32 0 15 17 15 17 15 17
Based on Table 1, for question number 1, declare fractions, decimals, and percent of the area shaded by the subjectdoes not experience difficulties. All subjects can answer correctly. However, for questions, number 2 through number 4,grind the area if the fractional, decimal, and percent values are given the subject has difficulty. Female studentsexperienced difficulties as much as 37.50% of the total subjects or 54.45% of the total female subjects. In comparison,male students experienced difficulties of 15.63% of the total subjects or 50.00% of the total male subjects. This resultmeans that in solving problems from number 2 to number 4, male subjects are better than female. This result is in linewith the statement that males excellently in terms of mathematics and spatial ability while females excellent in terms oflanguage and writing [23], [24]. The problem-solving strategies of the two are also different [25]–[27], male tend to be moreflexible using more abstract strategies and retrieval, whereas female tend to use manipulative and more concrete strategies.
3.2. Problem Solving Strategies and Connecting among Fractions, Decimals, and Percent
3.2.1. Problem Number 1The subject counts the number of shaded squares and the total number of squares to determine the fraction value of the
shaded area. Next, create or write the fractional form and simplify it. In the given problem, 34 shaded squares are statingthe numerator and 80 total stating the denominator. The fraction value obtained is
The subject's written answers are presented in Figure 1.
40
17
80
34
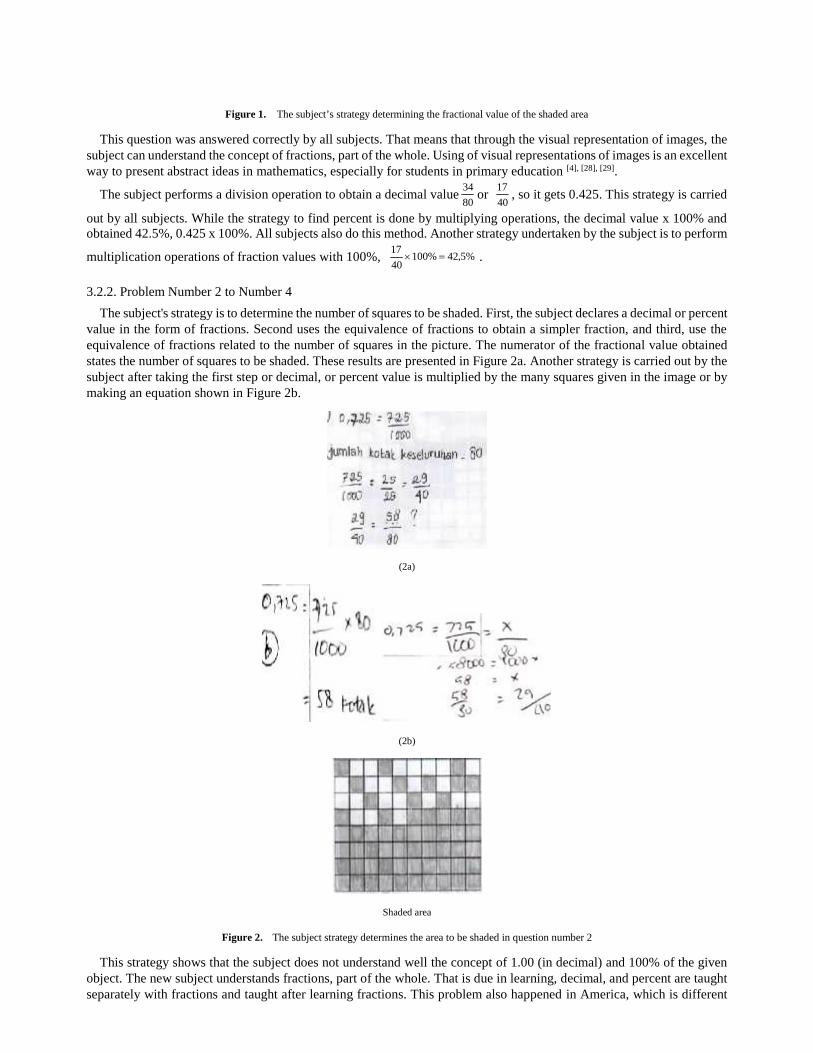
Figure 1. The subject’s strategy determining the fractional value of the shaded area
This question was answered correctly by all subjects. That means that through the visual representation of images, thesubject can understand the concept of fractions, part of the whole. Using of visual representations of images is an excellentway to present abstract ideas in mathematics, especially for students in primary education [4], [28], [29].
The subject performs a division operation to obtain a decimal value or , so it gets 0.425. This strategy is carried
out by all subjects. While the strategy to find percent is done by multiplying operations, the decimal value x 100% andobtained 42.5%, 0.425 x 100%. All subjects also do this method. Another strategy undertaken by the subject is to perform
multiplication operations of fraction values with 100%, .
3.2.2. Problem Number 2 to Number 4The subject's strategy is to determine the number of squares to be shaded. First, the subject declares a decimal or percent
value in the form of fractions. Second uses the equivalence of fractions to obtain a simpler fraction, and third, use theequivalence of fractions related to the number of squares in the picture. The numerator of the fractional value obtainedstates the number of squares to be shaded. These results are presented in Figure 2a. Another strategy is carried out by thesubject after taking the first step or decimal, or percent value is multiplied by the many squares given in the image or bymaking an equation shown in Figure 2b.
(2a)
(2b)
Shaded area
Figure 2. The subject strategy determines the area to be shaded in question number 2
This strategy shows that the subject does not understand well the concept of 1.00 (in decimal) and 100% of the givenobject. The new subject understands fractions, part of the whole. That is due in learning, decimal, and percent are taughtseparately with fractions and taught after learning fractions. This problem also happened in America, which is different
80
34
40
17
%5,42%10040
17
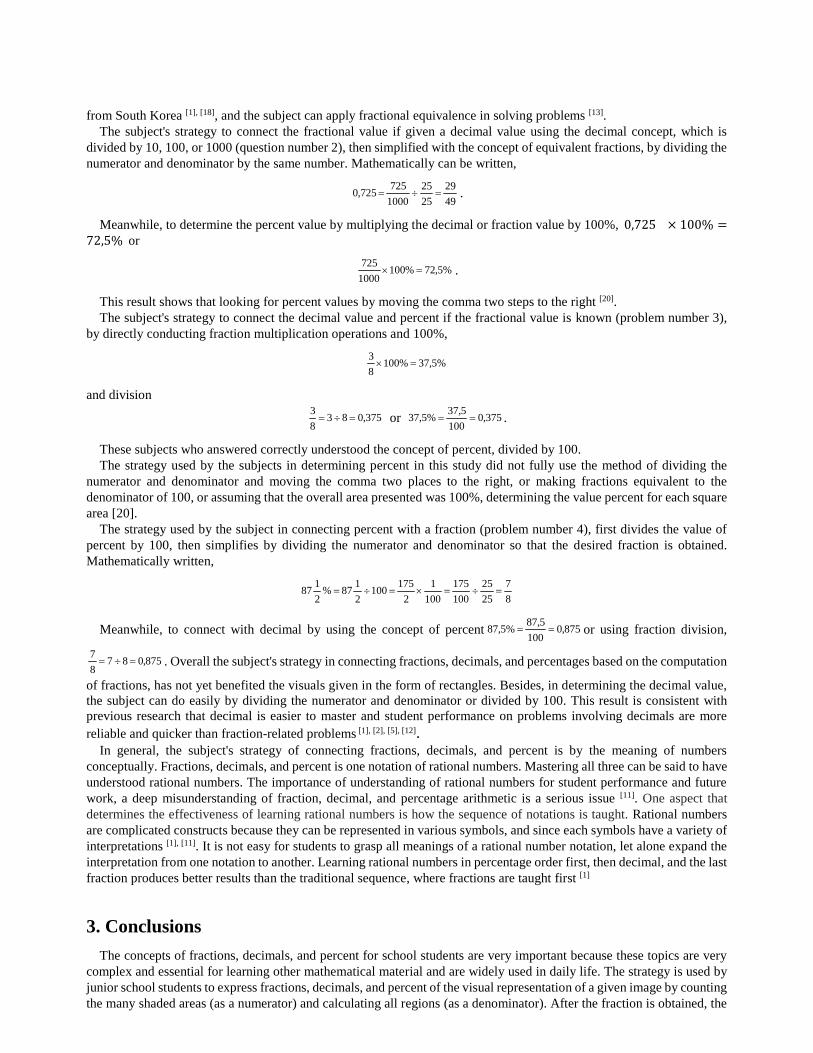
from South Korea [1], [18], and the subject can apply fractional equivalence in solving problems [13].The subject's strategy to connect the fractional value if given a decimal value using the decimal concept, which is
divided by 10, 100, or 1000 (question number 2), then simplified with the concept of equivalent fractions, by dividing thenumerator and denominator by the same number. Mathematically can be written,
.
Meanwhile, to determine the percent value by multiplying the decimal or fraction value by 100%, 0,725 × 100% =72,5% or
.
This result shows that looking for percent values by moving the comma two steps to the right [20].The subject's strategy to connect the decimal value and percent if the fractional value is known (problem number 3),
by directly conducting fraction multiplication operations and 100%,
and division
or .
These subjects who answered correctly understood the concept of percent, divided by 100.The strategy used by the subjects in determining percent in this study did not fully use the method of dividing the
numerator and denominator and moving the comma two places to the right, or making fractions equivalent to thedenominator of 100, or assuming that the overall area presented was 100%, determining the value percent for each squarearea [20].
The strategy used by the subject in connecting percent with a fraction (problem number 4), first divides the value ofpercent by 100, then simplifies by dividing the numerator and denominator so that the desired fraction is obtained.Mathematically written,
Meanwhile, to connect with decimal by using the concept of percent or using fraction division,
. Overall the subject's strategy in connecting fractions, decimals, and percentages based on the computation
of fractions, has not yet benefited the visuals given in the form of rectangles. Besides, in determining the decimal value,the subject can do easily by dividing the numerator and denominator or divided by 100. This result is consistent withprevious research that decimal is easier to master and student performance on problems involving decimals are morereliable and quicker than fraction-related problems [1], [2], [5], [12].
In general, the subject's strategy of connecting fractions, decimals, and percent is by the meaning of numbersconceptually. Fractions, decimals, and percent is one notation of rational numbers. Mastering all three can be said to haveunderstood rational numbers. The importance of understanding of rational numbers for student performance and futurework, a deep misunderstanding of fraction, decimal, and percentage arithmetic is a serious issue [11]. One aspect thatdetermines the effectiveness of learning rational numbers is how the sequence of notations is taught. Rational numbersare complicated constructs because they can be represented in various symbols, and since each symbols have a variety ofinterpretations [1], [11]. It is not easy for students to grasp all meanings of a rational number notation, let alone expand theinterpretation from one notation to another. Learning rational numbers in percentage order first, then decimal, and the lastfraction produces better results than the traditional sequence, where fractions are taught first [1]
3. Conclusions
The concepts of fractions, decimals, and percent for school students are very important because these topics are verycomplex and essential for learning other mathematical material and are widely used in daily life. The strategy is used byjunior school students to express fractions, decimals, and percent of the visual representation of a given image by countingthe many shaded areas (as a numerator) and calculating all regions (as a denominator). After the fraction is obtained, the
49
29
25
25
1000
725725,0
%5,72%1001000
725
%5,37%1008
3
375,0838
3 375,0
100
5,37%5,37
8
7
25
25
100
175
100
1
2
175100
2
187%
2
187
875,0100
5,87%5,87
875,0878
7
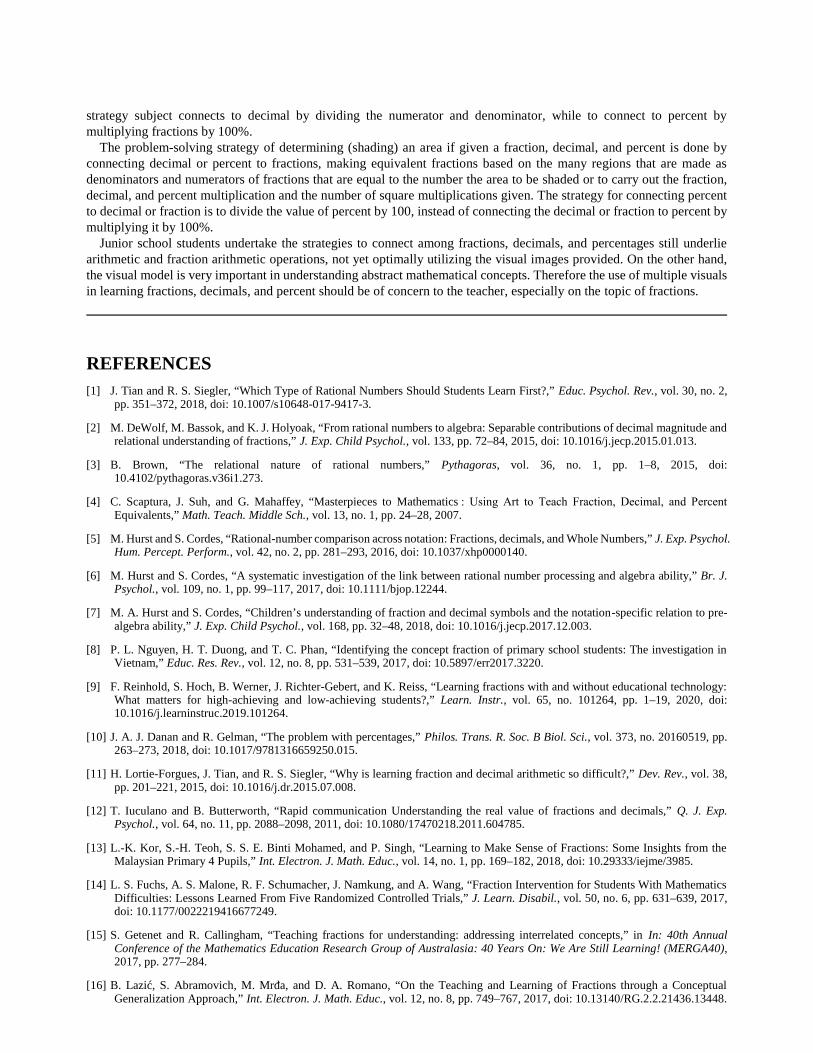
strategy subject connects to decimal by dividing the numerator and denominator, while to connect to percent bymultiplying fractions by 100%.
The problem-solving strategy of determining (shading) an area if given a fraction, decimal, and percent is done byconnecting decimal or percent to fractions, making equivalent fractions based on the many regions that are made asdenominators and numerators of fractions that are equal to the number the area to be shaded or to carry out the fraction,decimal, and percent multiplication and the number of square multiplications given. The strategy for connecting percentto decimal or fraction is to divide the value of percent by 100, instead of connecting the decimal or fraction to percent bymultiplying it by 100%.
Junior school students undertake the strategies to connect among fractions, decimals, and percentages still underliearithmetic and fraction arithmetic operations, not yet optimally utilizing the visual images provided. On the other hand,the visual model is very important in understanding abstract mathematical concepts. Therefore the use of multiple visualsin learning fractions, decimals, and percent should be of concern to the teacher, especially on the topic of fractions.
REFERENCES[1] J. Tian and R. S. Siegler, “Which Type of Rational Numbers Should Students Learn First?,” Educ. Psychol. Rev., vol. 30, no. 2,
pp. 351–372, 2018, doi: 10.1007/s10648-017-9417-3.
[2] M. DeWolf, M. Bassok, and K. J. Holyoak, “From rational numbers to algebra: Separable contributions of decimal magnitude andrelational understanding of fractions,” J. Exp. Child Psychol., vol. 133, pp. 72–84, 2015, doi: 10.1016/j.jecp.2015.01.013.
[3] B. Brown, “The relational nature of rational numbers,” Pythagoras, vol. 36, no. 1, pp. 1–8, 2015, doi:10.4102/pythagoras.v36i1.273.
[4] C. Scaptura, J. Suh, and G. Mahaffey, “Masterpieces to Mathematics : Using Art to Teach Fraction, Decimal, and PercentEquivalents,” Math. Teach. Middle Sch., vol. 13, no. 1, pp. 24–28, 2007.
[5] M. Hurst and S. Cordes, “Rational-number comparison across notation: Fractions, decimals, and Whole Numbers,” J. Exp. Psychol.Hum. Percept. Perform., vol. 42, no. 2, pp. 281–293, 2016, doi: 10.1037/xhp0000140.
[6] M. Hurst and S. Cordes, “A systematic investigation of the link between rational number processing and algebra ability,” Br. J.Psychol., vol. 109, no. 1, pp. 99–117, 2017, doi: 10.1111/bjop.12244.
[7] M. A. Hurst and S. Cordes, “Children’s understanding of fraction and decimal symbols and the notation-specific relation to pre-algebra ability,” J. Exp. Child Psychol., vol. 168, pp. 32–48, 2018, doi: 10.1016/j.jecp.2017.12.003.
[8] P. L. Nguyen, H. T. Duong, and T. C. Phan, “Identifying the concept fraction of primary school students: The investigation inVietnam,” Educ. Res. Rev., vol. 12, no. 8, pp. 531–539, 2017, doi: 10.5897/err2017.3220.
[9] F. Reinhold, S. Hoch, B. Werner, J. Richter-Gebert, and K. Reiss, “Learning fractions with and without educational technology:What matters for high-achieving and low-achieving students?,” Learn. Instr., vol. 65, no. 101264, pp. 1–19, 2020, doi:10.1016/j.learninstruc.2019.101264.
[10] J. A. J. Danan and R. Gelman, “The problem with percentages,” Philos. Trans. R. Soc. B Biol. Sci., vol. 373, no. 20160519, pp.263–273, 2018, doi: 10.1017/9781316659250.015.
[11] H. Lortie-Forgues, J. Tian, and R. S. Siegler, “Why is learning fraction and decimal arithmetic so difficult?,” Dev. Rev., vol. 38,pp. 201–221, 2015, doi: 10.1016/j.dr.2015.07.008.
[12] T. Iuculano and B. Butterworth, “Rapid communication Understanding the real value of fractions and decimals,” Q. J. Exp.Psychol., vol. 64, no. 11, pp. 2088–2098, 2011, doi: 10.1080/17470218.2011.604785.
[13] L.-K. Kor, S.-H. Teoh, S. S. E. Binti Mohamed, and P. Singh, “Learning to Make Sense of Fractions: Some Insights from theMalaysian Primary 4 Pupils,” Int. Electron. J. Math. Educ., vol. 14, no. 1, pp. 169–182, 2018, doi: 10.29333/iejme/3985.
[14] L. S. Fuchs, A. S. Malone, R. F. Schumacher, J. Namkung, and A. Wang, “Fraction Intervention for Students With MathematicsDifficulties: Lessons Learned From Five Randomized Controlled Trials,” J. Learn. Disabil., vol. 50, no. 6, pp. 631–639, 2017,doi: 10.1177/0022219416677249.
[15] S. Getenet and R. Callingham, “Teaching fractions for understanding: addressing interrelated concepts,” in In: 40th AnnualConference of the Mathematics Education Research Group of Australasia: 40 Years On: We Are Still Learning! (MERGA40),2017, pp. 277–284.
[16] B. Lazić, S. Abramovich, M. Mrđa, and D. A. Romano, “On the Teaching and Learning of Fractions through a ConceptualGeneralization Approach,” Int. Electron. J. Math. Educ., vol. 12, no. 8, pp. 749–767, 2017, doi: 10.13140/RG.2.2.21436.13448.
[17] J. HUI and K. PETTIGREW, “THE TREASURE CHESTS: EXPLORING RELATIONSHIPS DECIMALS, AND PERCENTSAMONG FRACTIONS, DECIMALS, AND PERCENTS,” OAME/AOEM Gaz., no. March, pp. 1–2, 2020, doi: 10.1007/s10964-013-9948.
[18] H. S. Lee, M. DeWolf, M. Bassok, and K. J. Holyoak, “Conceptual and procedural distinctions between fractions and decimals:A cross-national comparison,” Cognition, vol. 147, pp. 57–69, 2016, doi: 10.1016/j.cognition.2015.11.005.
[19] M. Rapp, M. Bassok, M. DeWolf, and K. J. Holyoak, “Modeling discrete and continuous entities with fractions and decimals,” J.Exp. Psychol. Appl., vol. 21, no. 1, pp. 47–56, 2015, doi: 10.1037/xap0000036.
[20] M. S. Smith, E. A. Silver, and M. K. Stein, Improving Instruction in Rational Numbers and Proportionality. Teachers College,Columbia University New York. 2005.
[21] R. Rosli, D. Goldsby, A. J. Onwuegbuzie, M. M. Capraro, R. M. Capraro, and E. G. Y. Gonzalez, “Elementary preservice teachers’knowledge, perceptions and attitudes towards fractions: A mixed-analysis,” J. Math. Educ., vol. 11, no. 1, pp. 59–76, 2020, doi:10.22342/jme.11.1.9482.59-76.
[22] Sugiyono, Metode penelitian kuantitatif, kualitatif, dan R&D. Bandung: Alfabeta. 2016.
[23] M. Asis, N. Arsyad, and Alimuddin, “Profil Kemampuan Spasial Dalam Menyelesaikan Masalah Geometri Siswa Yang MemilikiKecerdasan Logis Matematis Tinggi Ditinjau Dari Perbedaan Gender,” J. Daya Mat., vol. 3, no. 1, pp. 78–87, 2015, doi:10.26858/jds.v3i1.1320.
[24] F. van Nes and M. Doorman, “Fostering young children’s spatial structuring ability,” Int. Electron. J. Math. Educ., vol. 6, no. 1,pp. 27–39, 2011.
[25] Baiduri, “Profil Berpikir Relasional SIswa SD dalam Menyelesikan Masalah Matematika Ditinjau dari Kemampuan Matematikadan Gender. Disertasi: PPS Universitas Negeri Surabaya,” 2013.
[26] S. M. Reis and S. Park, “Gender differences in high-achieving students in math and science,” J. Educ. Gift., vol. 25, no. 1, pp. 52–73, 2001, doi: 10.1177/016235320102500104.
[27] A. M. Steegh, T. N. Höffler, M. M. Keller, and I. Parchmann, “Gender differences in mathematics and science competitions: Asystematic review,” J. Res. Sci. Teach., vol. 56, no. 10, pp. 1431–1460, 2019, doi: 10.1002/tea.21580.
[28] Baiduri, “Understanding of Fraction Concepts of Elementary School Students Through Problem Solving,” 2020.
[29] C. Bruce, S. Bennett, and T. Flynn, “Rational Number Teaching and Learning - Literature Review,” 2018.

Submission author:Assignment title:Submission title:
File name:File size:
Page count:Word count:
Character count:Submission date:
Submission ID:
Digital ReceiptThis receipt acknowledges that Turnitin received your paper. Below you will find the receiptinformation regarding your submission.
The first page of your submissions is displayed below.
Baiduri BaiduriLiterasi InformasiStudents' strategy in connetingUJER-19517296.docx359.7K73,62820,05819-Aug-2020 12:57PM (UTC+0700)1371298330
Copyright 2020 Turnitin. All rights reserved.

Students' strategy in connetingby Baiduri Baiduri
Submission date: 19-Aug-2020 12:57PM (UTC+0700)Submission ID: 1371298330File name: UJER-19517296.docx (359.7K)Word count: 3628Character count: 20058
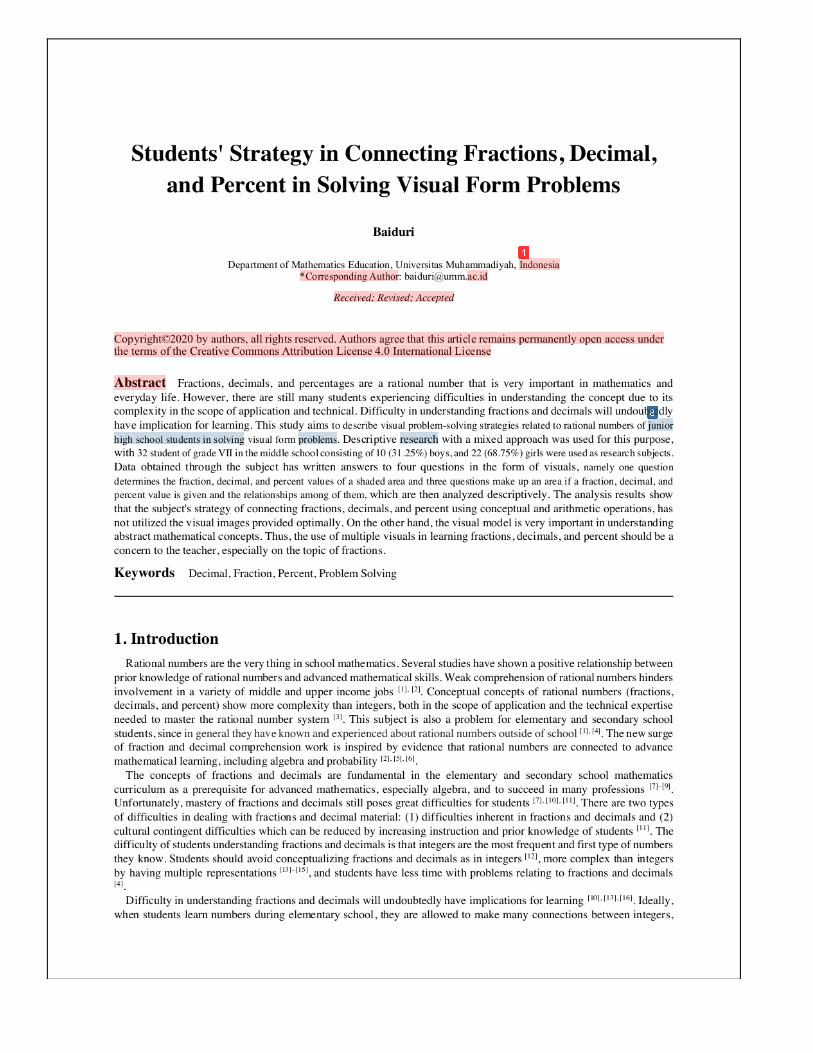
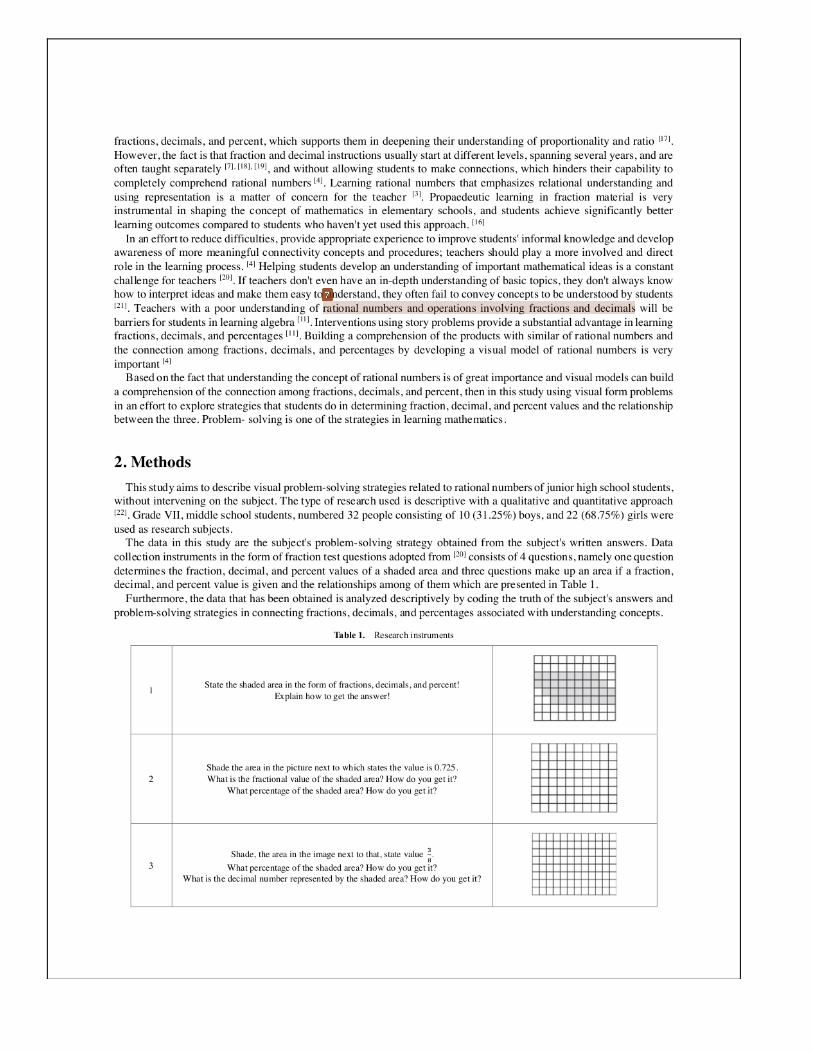
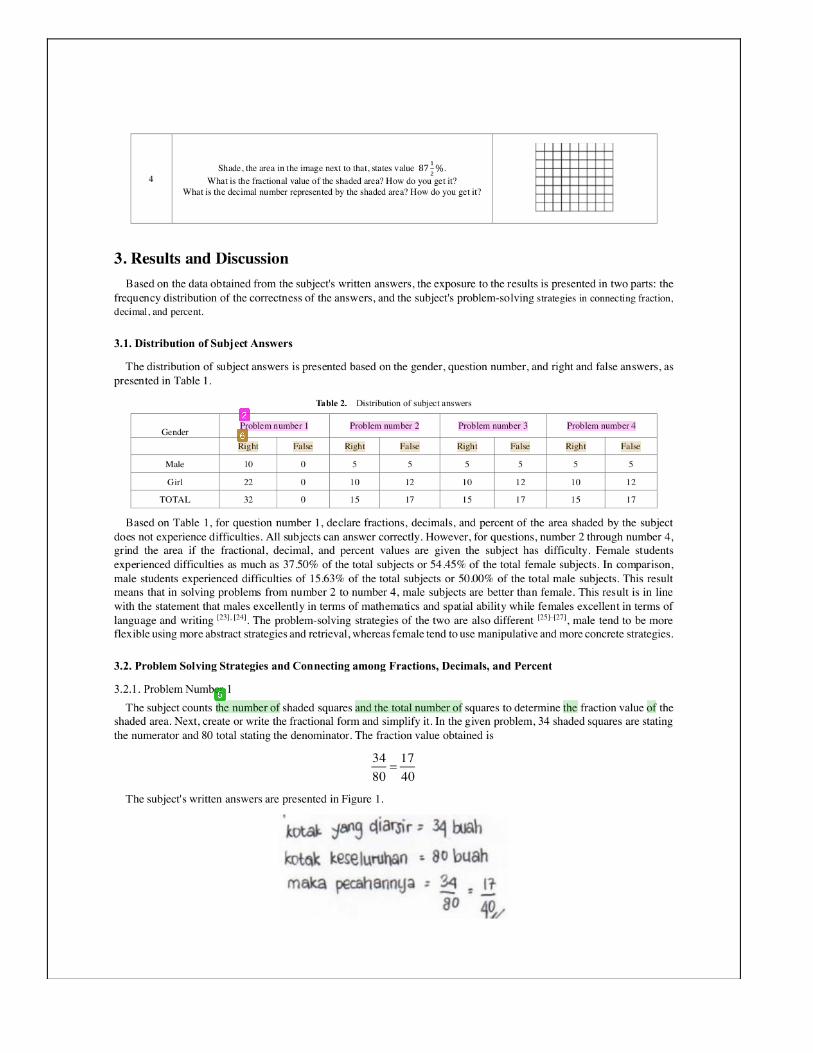
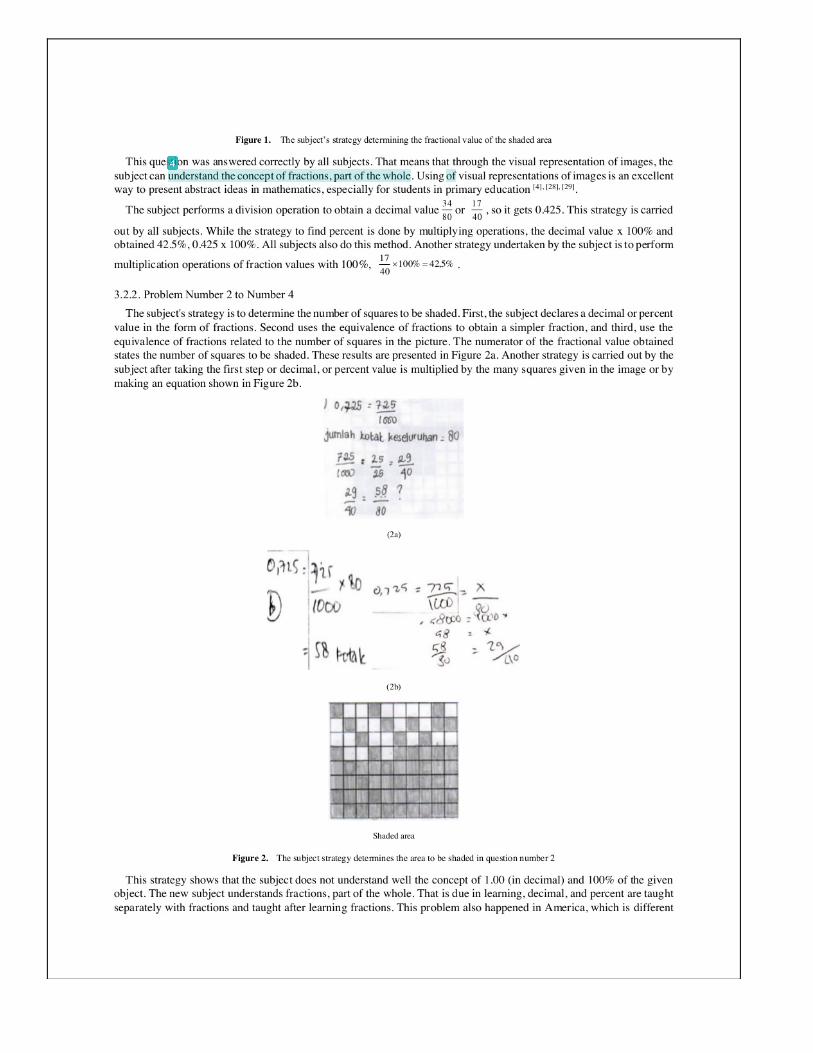
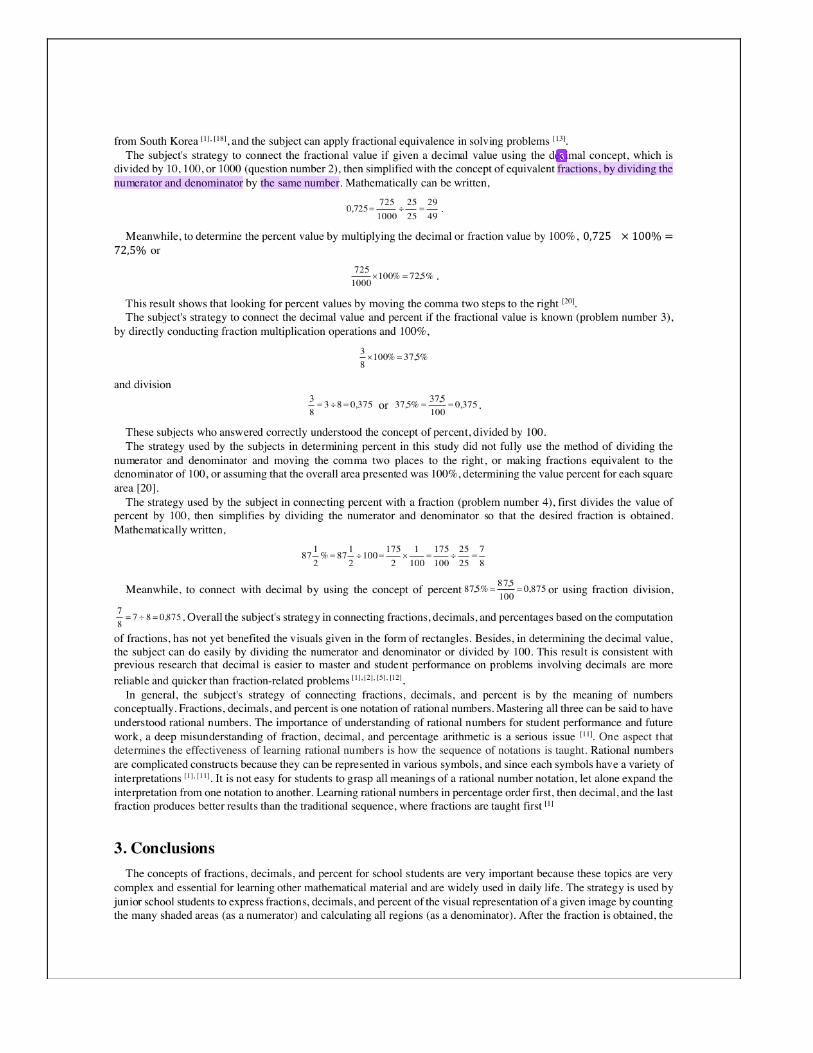
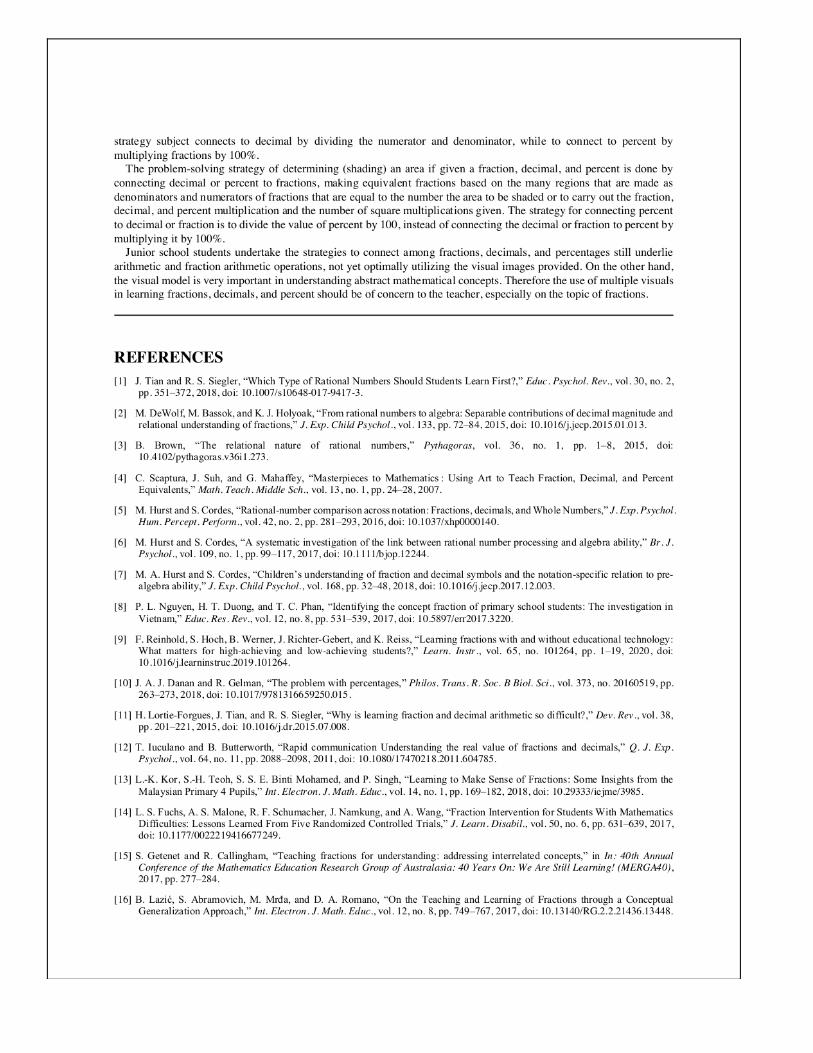
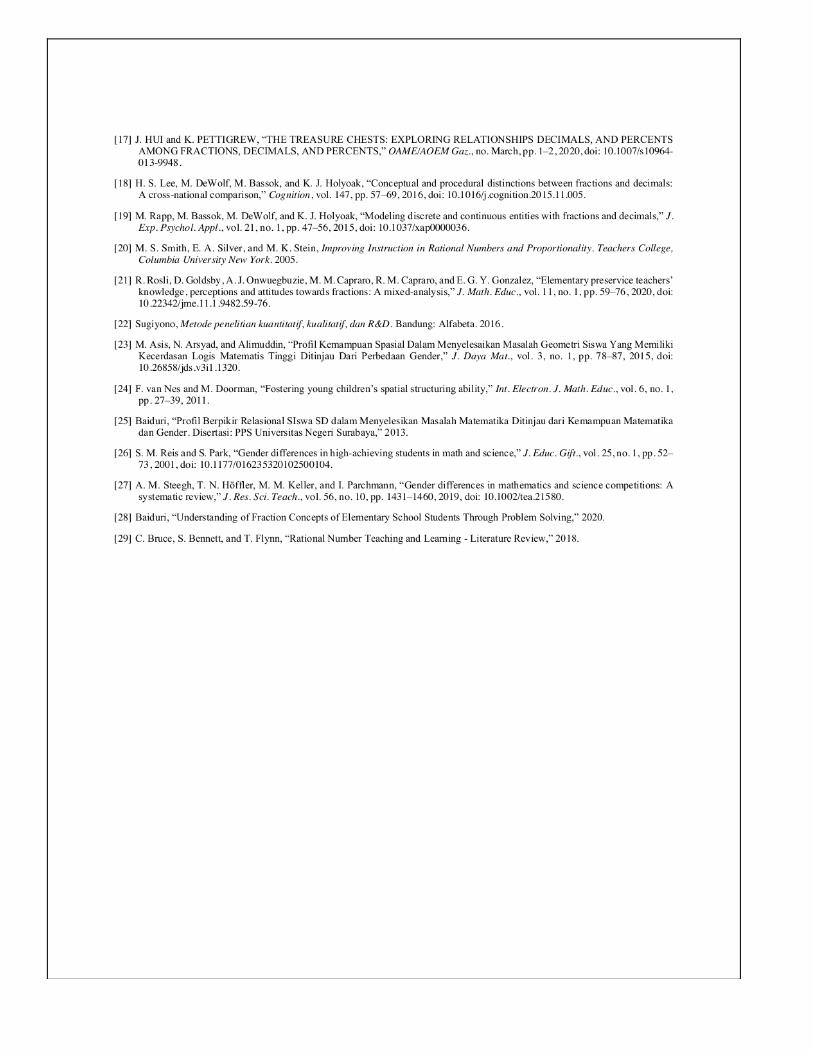
4%SIMILARITY INDEX
3%INTERNET SOURCES
2%PUBLICATIONS
2%STUDENT PAPERS
1 1%
2 <1%
3 <1%
4 <1%
5 <1%
Students' strategy in connetingORIGINALITY REPORT
PRIMARY SOURCES
Submitted to Universitas MuhammadiyahSurakartaStudent Paper
www.safaribooksonline.comInternet Source
Liew-Kee Kor, Sian-Hoon Teoh, Siti SyardiaErdina Binti Mohamed, Parmjit Singh. "Learningto Make Sense of Fractions: Some Insights fromthe Malaysian Primary 4 Pupils", InternationalElectronic Journal of Mathematics Education,2018Publication
Irfan Fauzi, Didi Suryadi. "Learning Obstacle theAddition and Subtraction of Fraction in Grade 5Elementary Schools", MUDARRISA: JurnalKajian Pendidikan Islam, 2020Publication
journals.plos.orgInternet Source
citeseerx.ist.psu.edu
6 <1%
7 <1%
8 <1%
Exclude quotes On
Exclude bibliography On
Exclude matches Off
Internet Source
journals.sagepub.comInternet Source
www.science.govInternet Source

FINAL GRADE
/0
Students' strategy in connetingGRADEMARK REPORT
GENERAL COMMENTS
Instructor
PAGE 1
PAGE 2
PAGE 3
PAGE 4
PAGE 5
PAGE 6
PAGE 7

HRPUB Publication Agreement
Horizon Research Publishing (HRPUB) is a worldwide open access publisher with over 50 peer-reviewed journals coveringa wide range of academic disciplines. As an international academic organization, we aim to enhance the academic atmosphere,show the outstanding research achievement in a broad range of areas, and to facilitate the academic exchange betweenresearchers.
The LICENSEE is Horizon Research Publishing(HRPUB), and
The LICENSOR is BAIDURI
The purpose of this agreement is to establish a mutually beneficial working relationship between The LICENSEE and TheLICENSOR.
WHEREAS it is the goal of the LICENSEE to provide an open access platform andWHEREAS the LICENSOR is willing to furnish electronically readable files in accordance with the terms of this Agreement:
Manuscript Title: Students' Strategy in Connecting Fractions, Decimal, and Percent in Solving Visual Form Problems
Manuscript ID: UJER-19517296
It is mutually agreed as follows:
COPYRIGHT:1. LICENSOR retains all copyright interest or it is retained by other copyright holder, as appropriate and agrees that the
manuscript remains permanently open access in LICENSEE's site under the terms of the Creative Commons AttributionInternational License (CC BY). LICENSEE shall have the right to use and archive the content for the purpose of creatinga HRPUB record and may reformat or paraphrase to benefit the display of the HRPUB record.
LICENSEE RESPONSIBILITIES:2. LICENSEE shall:a. Correct significant errors to published records for critical fields, described as the title, author, or bibliographic
citationfields;b. Provide free access to the full-text content of published articles;c. Provide availability to the perpetual archive with exception for unavailability due to maintenance of the server,installation
or testing of software, loading of data, or downtime outside the control of the LICENSEE.
LICENSOR RESPONSIBILITIES:3. LICENSOR shall confirm that:
a. Copyrighted materials have not been used in the manuscript without permissionb. The manuscript is free from plagiarism and has not been published previously;c. All of the facts contained in the material are true and accurate.
Please sign to indicate acceptance of this Agreement.
LICENSOR LICENSEE – Horizon Research Publishing
Signature of Authorized LICENSOR Representative Signature of HRPUB OfficerDate Date
BaiduriUniversity of Muhammadiyah Malang
Jl Raya Tlogomas, 246
August 19, 2020
Dear Daniel Anderson,
We wish to submit a new manuscript entitled “Student’s Strategy in Connecting Fractions,Decimal, and Percent in Solving Visual Form Problems” for consideration by UJER- HRPUBJournal.
We confirm that this work is original and has not been published elsewhere nor is it currentlyunder consideration for publication elsewhere.
In this paper, we report on the student’s strategy of connecting fractions, decimals, and percentusing conceptual and arithmetic operations, has not utilized the visual images providedoptimally. On the other hand, the visual model is very important in understanding abstractmathematical concepts.
The research comprehensively provides the explanation of strategy among student in solvingvisual form problems and connect it to the fraction, decimal, and percent concept. Thus, theresearch may be utilized by the teacher in monitoring the student’s progress of learning. Inaddition, the research also displays the important of visual model in understanding the abstractmathematical concept
Please address all correspondence concerning this manuscript to me at [email protected].
Thank you for your consideration of this manuscript.
Sincerely,
Baiduri

Students' Strategy in Connecting Fractions, Decimal,and Percent in Solving Visual Form Problems
Baiduri
Department of Mathematics Education, Universitas Muhammadiyah, Indonesia*Corresponding Author: [email protected]
Received ; Revised August 20, 2020; Accepted
Cite This Paper in the following Citation Styles
(a): [1] Baiduri , "Students' Strategy in Connecting Fractions, Decimal, and Percent in Solving Visual Form Problems,"Universal Journal of Educational Research, Vol. x, No. x, pp. 3310 - 3322, 2020. DOI: 10.13189/ujer.2020.0x0x0x.
(b): Baiduri (2020). Students' Strategy in Connecting Fractions, Decimal, and Percent in Solving Visual Form Problems.Universal Journal of Educational Research, 8(8), 3310 - 3322. DOI: 10.13189/ujer.2020.0x0x0x.
Copyright©2020 by authors, all rights reserved. Authors agree that this article remains permanently open access underthe terms of the Creative Commons Attribution License 4.0 International License
Abstract Fractions, decimals, and percentages are arational number that is very important in mathematics andeveryday life. However, there are still many studentsexperiencing difficulties in understanding the concept dueto its complexity in the scope of application and technical.Difficulty in understanding fractions and decimals willundoubtedly have implication for learning. This study aimsto describe visual problem-solving strategies related torational numbers of junior high school students in solvingvisual form problems. Descriptive research with a mixedapproach was used for this purpose, with 32 students ofgrade VII in the middle school consisting of 10 (31.25%)boys, and 22 (68.75%) girls were used as researchsubjects. Data obtained through the subject has writtenanswers to four questions in the form of visuals, namelyone question determines the fraction, decimal, and percentvalues of a shaded area and three questions make up anarea if a fraction, decimal, and percent value is given andthe relationships among of them, which are then analyzeddescriptively. The analysis results show that the subject'sstrategy of connecting fractions, decimals, and percentusing conceptual and arithmetic operations, has not utilizedthe visual images provided optimally. On the other hand,the visual model is very important in understandingabstract mathematical concepts. Thus, the use of multiplevisuals in learning fractions, decimals, and percent shouldbe a concern to the teacher, especially on the topic offractions.
Keywords Decimal, Fraction, Percent, ProblemSolving
1. Introduction
Rational numbers are the very thing in schoolmathematics. Several studies have shown a positiverelationship between prior knowledge of rational numbersand advanced mathematical skills. Weak comprehension ofrational numbers hinders involvement in a variety ofmiddle and upper income jobs [1], [2]. Conceptualconcepts of rational numbers (fractions, decimals, andpercent) show more complexity than integers, both in thescope of application and the technical expertise needed tomaster the rational number system [3]. This subject is alsoa problem for elementary and secondary school students,since in general they have known and experienced aboutrational numbers outside of school [1], [4]. The new surgeof fraction and decimal comprehension work is inspired byevidence that rational numbers are connected to advancemathematical learning, including algebra and probability[2], [5], [6].
The concepts of fractions and decimals are fundamentalin the elementary and secondary school mathematicscurriculum as a prerequisite for advanced mathematics,especially algebra, and to succeed in many professions [7]–[9]. Unfortunately, mastery of fractions and decimals stillposes great difficulties for students [7], [10], [11]. Thereare two types of difficulties in dealing with fractions anddecimal material: (1) difficulties inherent in fractions anddecimals and (2) cultural contingent difficulties which canbe reduced by increasing instruction and prior knowledgeof students [11]. The difficulty of students understandingfractions and decimals is that integers are the most frequentand first type of numbers they know. Students should avoid
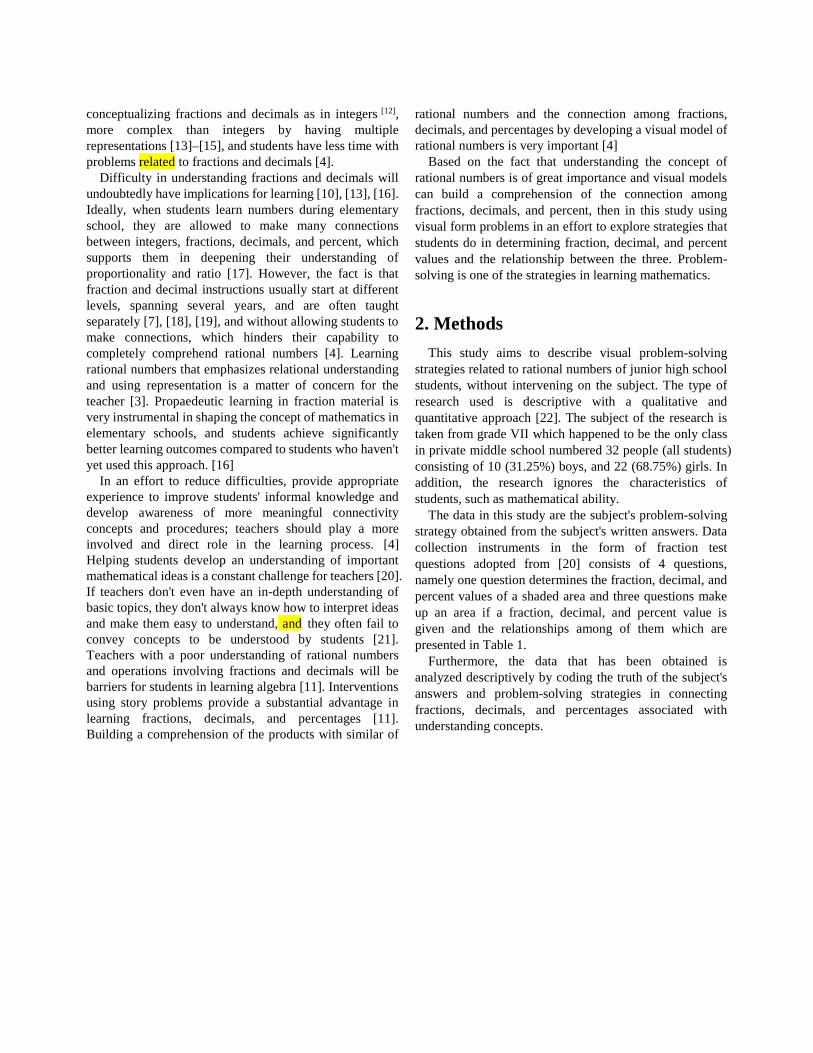
conceptualizing fractions and decimals as in integers [12],more complex than integers by having multiplerepresentations [13]–[15], and students have less time withproblems related to fractions and decimals [4].
Difficulty in understanding fractions and decimals willundoubtedly have implications for learning [10], [13], [16].Ideally, when students learn numbers during elementaryschool, they are allowed to make many connectionsbetween integers, fractions, decimals, and percent, whichsupports them in deepening their understanding ofproportionality and ratio [17]. However, the fact is thatfraction and decimal instructions usually start at differentlevels, spanning several years, and are often taughtseparately [7], [18], [19], and without allowing students tomake connections, which hinders their capability tocompletely comprehend rational numbers [4]. Learningrational numbers that emphasizes relational understandingand using representation is a matter of concern for theteacher [3]. Propaedeutic learning in fraction material isvery instrumental in shaping the concept of mathematics inelementary schools, and students achieve significantlybetter learning outcomes compared to students who haven'tyet used this approach. [16]
In an effort to reduce difficulties, provide appropriateexperience to improve students' informal knowledge anddevelop awareness of more meaningful connectivityconcepts and procedures; teachers should play a moreinvolved and direct role in the learning process. [4]Helping students develop an understanding of importantmathematical ideas is a constant challenge for teachers [20].If teachers don't even have an in-depth understanding ofbasic topics, they don't always know how to interpret ideasand make them easy to understand, and they often fail toconvey concepts to be understood by students [21].Teachers with a poor understanding of rational numbersand operations involving fractions and decimals will bebarriers for students in learning algebra [11]. Interventionsusing story problems provide a substantial advantage inlearning fractions, decimals, and percentages [11].Building a comprehension of the products with similar of
rational numbers and the connection among fractions,decimals, and percentages by developing a visual model ofrational numbers is very important [4]
Based on the fact that understanding the concept ofrational numbers is of great importance and visual modelscan build a comprehension of the connection amongfractions, decimals, and percent, then in this study usingvisual form problems in an effort to explore strategies thatstudents do in determining fraction, decimal, and percentvalues and the relationship between the three. Problem-solving is one of the strategies in learning mathematics.
2. Methods
This study aims to describe visual problem-solvingstrategies related to rational numbers of junior high schoolstudents, without intervening on the subject. The type ofresearch used is descriptive with a qualitative andquantitative approach [22]. The subject of the research istaken from grade VII which happened to be the only classin private middle school numbered 32 people (all students)consisting of 10 (31.25%) boys, and 22 (68.75%) girls. Inaddition, the research ignores the characteristics ofstudents, such as mathematical ability.
The data in this study are the subject's problem-solvingstrategy obtained from the subject's written answers. Datacollection instruments in the form of fraction testquestions adopted from [20] consists of 4 questions,namely one question determines the fraction, decimal, andpercent values of a shaded area and three questions makeup an area if a fraction, decimal, and percent value isgiven and the relationships among of them which arepresented in Table 1.
Furthermore, the data that has been obtained isanalyzed descriptively by coding the truth of the subject'sanswers and problem-solving strategies in connectingfractions, decimals, and percentages associated withunderstanding concepts.
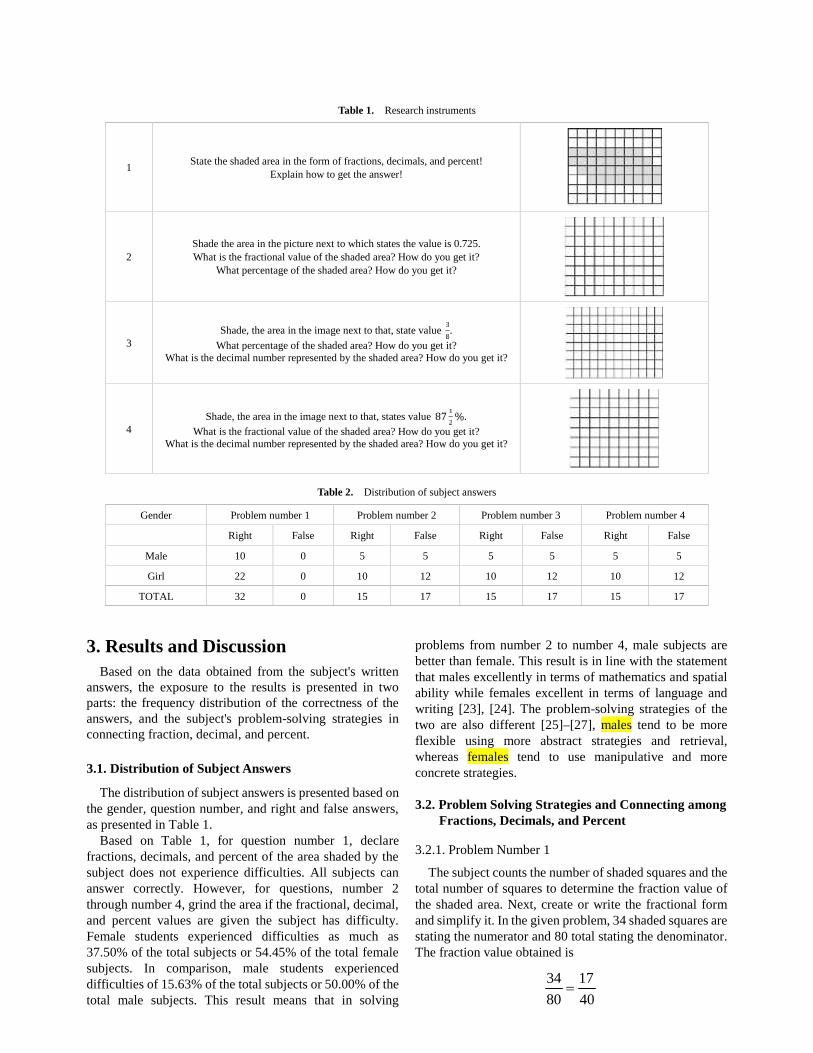
Table 1. Research instruments
1State the shaded area in the form of fractions, decimals, and percent!
Explain how to get the answer!
2Shade the area in the picture next to which states the value is 0.725.What is the fractional value of the shaded area? How do you get it?
What percentage of the shaded area? How do you get it?
3Shade, the area in the image next to that, state value .
What percentage of the shaded area? How do you get it?What is the decimal number represented by the shaded area? How do you get it?
4Shade, the area in the image next to that, states value 87 %.
What is the fractional value of the shaded area? How do you get it?What is the decimal number represented by the shaded area? How do you get it?
Table 2. Distribution of subject answers
Gender Problem number 1 Problem number 2 Problem number 3 Problem number 4
Right False Right False Right False Right False
Male 10 0 5 5 5 5 5 5
Girl 22 0 10 12 10 12 10 12
TOTAL 32 0 15 17 15 17 15 17
3. Results and DiscussionBased on the data obtained from the subject's written
answers, the exposure to the results is presented in twoparts: the frequency distribution of the correctness of theanswers, and the subject's problem-solving strategies inconnecting fraction, decimal, and percent.
3.1. Distribution of Subject Answers
The distribution of subject answers is presented based onthe gender, question number, and right and false answers,as presented in Table 1.
Based on Table 1, for question number 1, declarefractions, decimals, and percent of the area shaded by thesubject does not experience difficulties. All subjects cananswer correctly. However, for questions, number 2through number 4, grind the area if the fractional, decimal,and percent values are given the subject has difficulty.Female students experienced difficulties as much as37.50% of the total subjects or 54.45% of the total femalesubjects. In comparison, male students experienceddifficulties of 15.63% of the total subjects or 50.00% of thetotal male subjects. This result means that in solving
problems from number 2 to number 4, male subjects arebetter than female. This result is in line with the statementthat males excellently in terms of mathematics and spatialability while females excellent in terms of language andwriting [23], [24]. The problem-solving strategies of thetwo are also different [25]–[27], males tend to be moreflexible using more abstract strategies and retrieval,whereas females tend to use manipulative and moreconcrete strategies.
3.2. Problem Solving Strategies and Connecting amongFractions, Decimals, and Percent
3.2.1. Problem Number 1
The subject counts the number of shaded squares and thetotal number of squares to determine the fraction value ofthe shaded area. Next, create or write the fractional formand simplify it. In the given problem, 34 shaded squares arestating the numerator and 80 total stating the denominator.The fraction value obtained is
40
17
80
34
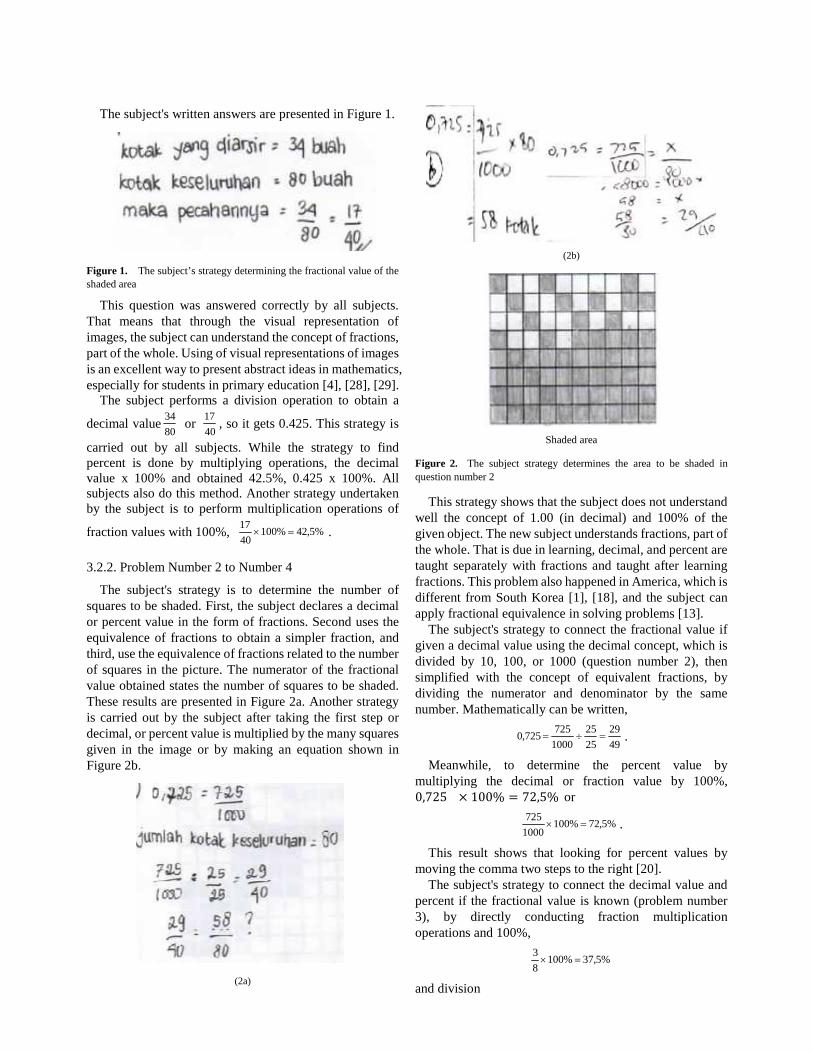
The subject's written answers are presented in Figure 1.
Figure 1. The subject’s strategy determining the fractional value of theshaded area
This question was answered correctly by all subjects.That means that through the visual representation ofimages, the subject can understand the concept of fractions,part of the whole. Using of visual representations of imagesis an excellent way to present abstract ideas in mathematics,especially for students in primary education [4], [28], [29].
The subject performs a division operation to obtain a
decimal value or , so it gets 0.425. This strategy is
carried out by all subjects. While the strategy to findpercent is done by multiplying operations, the decimalvalue x 100% and obtained 42.5%, 0.425 x 100%. Allsubjects also do this method. Another strategy undertakenby the subject is to perform multiplication operations of
fraction values with 100%, .
3.2.2. Problem Number 2 to Number 4
The subject's strategy is to determine the number ofsquares to be shaded. First, the subject declares a decimalor percent value in the form of fractions. Second uses theequivalence of fractions to obtain a simpler fraction, andthird, use the equivalence of fractions related to the numberof squares in the picture. The numerator of the fractionalvalue obtained states the number of squares to be shaded.These results are presented in Figure 2a. Another strategyis carried out by the subject after taking the first step ordecimal, or percent value is multiplied by the many squaresgiven in the image or by making an equation shown inFigure 2b.
(2a)
(2b)
Shaded area
Figure 2. The subject strategy determines the area to be shaded inquestion number 2
This strategy shows that the subject does not understandwell the concept of 1.00 (in decimal) and 100% of thegiven object. The new subject understands fractions, part ofthe whole. That is due in learning, decimal, and percent aretaught separately with fractions and taught after learningfractions. This problem also happened in America, which isdifferent from South Korea [1], [18], and the subject canapply fractional equivalence in solving problems [13].
The subject's strategy to connect the fractional value ifgiven a decimal value using the decimal concept, which isdivided by 10, 100, or 1000 (question number 2), thensimplified with the concept of equivalent fractions, bydividing the numerator and denominator by the samenumber. Mathematically can be written,
.
Meanwhile, to determine the percent value bymultiplying the decimal or fraction value by 100%,0,725 × 100% = 72,5% or
.
This result shows that looking for percent values bymoving the comma two steps to the right [20].
The subject's strategy to connect the decimal value andpercent if the fractional value is known (problem number3), by directly conducting fraction multiplicationoperations and 100%,
and division
80
34
40
17
%5,42%10040
17
49
29
25
25
1000
725725,0
%5,72%1001000
725
%5,37%1008
3
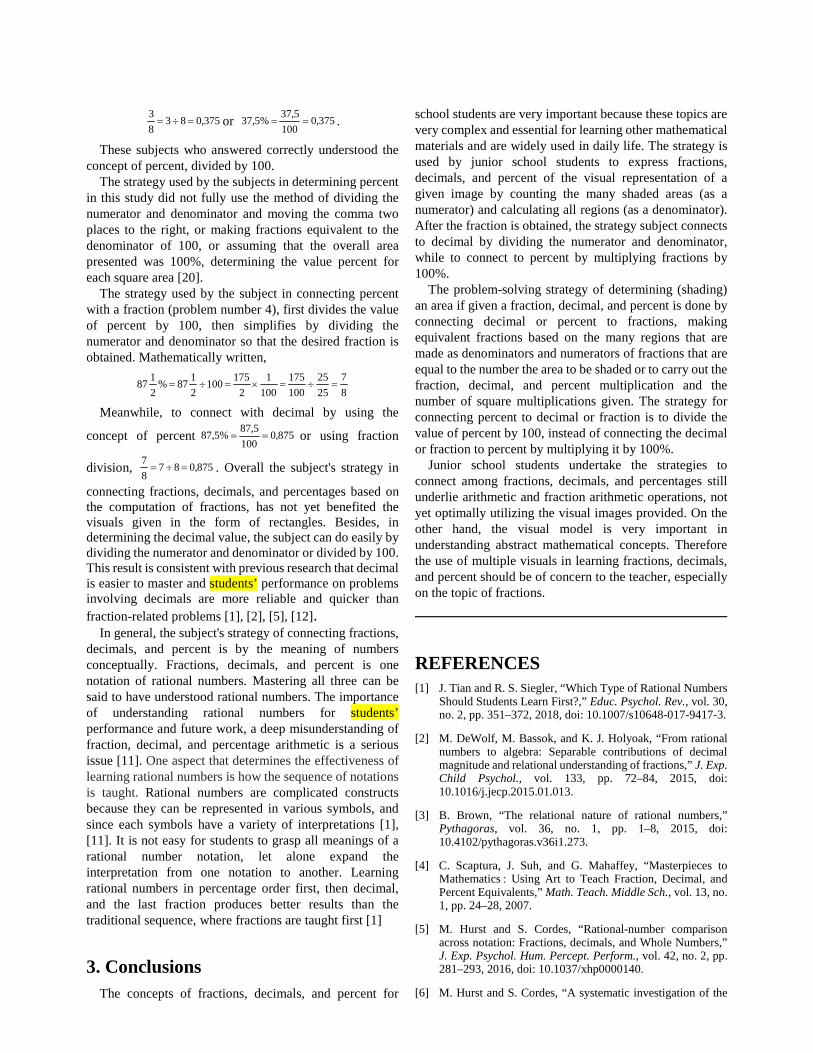
or .
These subjects who answered correctly understood theconcept of percent, divided by 100.
The strategy used by the subjects in determining percentin this study did not fully use the method of dividing thenumerator and denominator and moving the comma twoplaces to the right, or making fractions equivalent to thedenominator of 100, or assuming that the overall areapresented was 100%, determining the value percent foreach square area [20].
The strategy used by the subject in connecting percentwith a fraction (problem number 4), first divides the valueof percent by 100, then simplifies by dividing thenumerator and denominator so that the desired fraction isobtained. Mathematically written,
Meanwhile, to connect with decimal by using the
concept of percent or using fraction
division, . Overall the subject's strategy in
connecting fractions, decimals, and percentages based onthe computation of fractions, has not yet benefited thevisuals given in the form of rectangles. Besides, indetermining the decimal value, the subject can do easily bydividing the numerator and denominator or divided by 100.This result is consistent with previous research that decimalis easier to master and students’ performance on problemsinvolving decimals are more reliable and quicker thanfraction-related problems [1], [2], [5], [12].
In general, the subject's strategy of connecting fractions,decimals, and percent is by the meaning of numbersconceptually. Fractions, decimals, and percent is onenotation of rational numbers. Mastering all three can besaid to have understood rational numbers. The importanceof understanding rational numbers for students’performance and future work, a deep misunderstanding offraction, decimal, and percentage arithmetic is a seriousissue [11]. One aspect that determines the effectiveness oflearning rational numbers is how the sequence of notationsis taught. Rational numbers are complicated constructsbecause they can be represented in various symbols, andsince each symbols have a variety of interpretations [1],[11]. It is not easy for students to grasp all meanings of arational number notation, let alone expand theinterpretation from one notation to another. Learningrational numbers in percentage order first, then decimal,and the last fraction produces better results than thetraditional sequence, where fractions are taught first [1]
3. ConclusionsThe concepts of fractions, decimals, and percent for
school students are very important because these topics arevery complex and essential for learning other mathematicalmaterials and are widely used in daily life. The strategy isused by junior school students to express fractions,decimals, and percent of the visual representation of agiven image by counting the many shaded areas (as anumerator) and calculating all regions (as a denominator).After the fraction is obtained, the strategy subject connectsto decimal by dividing the numerator and denominator,while to connect to percent by multiplying fractions by100%.
The problem-solving strategy of determining (shading)an area if given a fraction, decimal, and percent is done byconnecting decimal or percent to fractions, makingequivalent fractions based on the many regions that aremade as denominators and numerators of fractions that areequal to the number the area to be shaded or to carry out thefraction, decimal, and percent multiplication and thenumber of square multiplications given. The strategy forconnecting percent to decimal or fraction is to divide thevalue of percent by 100, instead of connecting the decimalor fraction to percent by multiplying it by 100%.
Junior school students undertake the strategies toconnect among fractions, decimals, and percentages stillunderlie arithmetic and fraction arithmetic operations, notyet optimally utilizing the visual images provided. On theother hand, the visual model is very important inunderstanding abstract mathematical concepts. Thereforethe use of multiple visuals in learning fractions, decimals,and percent should be of concern to the teacher, especiallyon the topic of fractions.
REFERENCES[1] J. Tian and R. S. Siegler, “Which Type of Rational Numbers
Should Students Learn First?,” Educ. Psychol. Rev., vol. 30,no. 2, pp. 351–372, 2018, doi: 10.1007/s10648-017-9417-3.
[2] M. DeWolf, M. Bassok, and K. J. Holyoak, “From rationalnumbers to algebra: Separable contributions of decimalmagnitude and relational understanding of fractions,” J. Exp.Child Psychol., vol. 133, pp. 72–84, 2015, doi:10.1016/j.jecp.2015.01.013.
[3] B. Brown, “The relational nature of rational numbers,”Pythagoras, vol. 36, no. 1, pp. 1–8, 2015, doi:10.4102/pythagoras.v36i1.273.
[4] C. Scaptura, J. Suh, and G. Mahaffey, “Masterpieces toMathematics : Using Art to Teach Fraction, Decimal, andPercent Equivalents,” Math. Teach. Middle Sch., vol. 13, no.1, pp. 24–28, 2007.
[5] M. Hurst and S. Cordes, “Rational-number comparisonacross notation: Fractions, decimals, and Whole Numbers,”J. Exp. Psychol. Hum. Percept. Perform., vol. 42, no. 2, pp.281–293, 2016, doi: 10.1037/xhp0000140.
[6] M. Hurst and S. Cordes, “A systematic investigation of the
375,0838
3 375,0
100
5,37%5,37
8
7
25
25
100
175
100
1
2
175100
2
187%
2
187
875,0100
5,87%5,87
875,0878
7
link between rational number processing and algebra ability,”Br. J. Psychol., vol. 109, no. 1, pp. 99–117, 2017, doi:10.1111/bjop.12244.
[7] M. A. Hurst and S. Cordes, “Children’s understanding offraction and decimal symbols and the notation-specificrelation to pre-algebra ability,” J. Exp. Child Psychol., vol.168, pp. 32–48, 2018, doi: 10.1016/j.jecp.2017.12.003.
[8] P. L. Nguyen, H. T. Duong, and T. C. Phan, “Identifying theconcept fraction of primary school students: Theinvestigation in Vietnam,” Educ. Res. Rev., vol. 12, no. 8, pp.531–539, 2017, doi: 10.5897/err2017.3220.
[9] F. Reinhold, S. Hoch, B. Werner, J. Richter-Gebert, and K.Reiss, “Learning fractions with and without educationaltechnology: What matters for high-achieving andlow-achieving students?,” Learn. Instr., vol. 65, no. 101264,pp. 1–19, 2020, doi: 10.1016/j.learninstruc.2019.101264.
[10] J. A. J. Danan and R. Gelman, “The problem withpercentages,” Philos. Trans. R. Soc. B Biol. Sci., vol. 373, no.20160519, pp. 263–273, 2018, doi:10.1017/9781316659250.015.
[11] H. Lortie-Forgues, J. Tian, and R. S. Siegler, “Why islearning fraction and decimal arithmetic so difficult?,” Dev.Rev., vol. 38, pp. 201–221, 2015, doi:10.1016/j.dr.2015.07.008.
[12] T. Iuculano and B. Butterworth, “Rapid communicationUnderstanding the real value of fractions and decimals,” Q. J.Exp. Psychol., vol. 64, no. 11, pp. 2088–2098, 2011, doi:10.1080/17470218.2011.604785.
[13] L.-K. Kor, S.-H. Teoh, S. S. E. Binti Mohamed, and P. Singh,“Learning to Make Sense of Fractions: Some Insights fromthe Malaysian Primary 4 Pupils,” Int. Electron. J. Math.Educ., vol. 14, no. 1, pp. 169–182, 2018, doi:10.29333/iejme/3985.
[14] L. S. Fuchs, A. S. Malone, R. F. Schumacher, J. Namkung,and A. Wang, “Fraction Intervention for Students WithMathematics Difficulties: Lessons Learned From FiveRandomized Controlled Trials,” J. Learn. Disabil., vol. 50,no. 6, pp. 631–639, 2017, doi: 10.1177/0022219416677249.
[15] S. Getenet and R. Callingham, “Teaching fractions forunderstanding: addressing interrelated concepts,” in In: 40thAnnual Conference of the Mathematics Education ResearchGroup of Australasia: 40 Years On: We Are Still Learning!(MERGA40), 2017, pp. 277–284.
[16] B. Lazić, S. Abramovich, M. Mrđa, and D. A. Romano, “Onthe Teaching and Learning of Fractions through aConceptual Generalization Approach,” Int. Electron. J.Math. Educ., vol. 12, no. 8, pp. 749–767, 2017, doi:10.13140/RG.2.2.21436.13448.
[17] J. HUI and K. PETTIGREW, “THE TREASURE CHESTS:
EXPLORING RELATIONSHIPS DECIMALS, ANDPERCENTS AMONG FRACTIONS, DECIMALS, ANDPERCENTS,” OAME/AOEM Gaz., no. March, pp. 1–2,2020, doi: 10.1007/s10964-013-9948.
[18] H. S. Lee, M. DeWolf, M. Bassok, and K. J. Holyoak,“Conceptual and procedural distinctions between fractionsand decimals: A cross-national comparison,” Cognition, vol.147, pp. 57–69, 2016, doi: 10.1016/j.cognition.2015.11.005.
[19] M. Rapp, M. Bassok, M. DeWolf, and K. J. Holyoak,“Modeling discrete and continuous entities with fractionsand decimals,” J. Exp. Psychol. Appl., vol. 21, no. 1, pp. 47–56, 2015, doi: 10.1037/xap0000036.
[20] M. S. Smith, E. A. Silver, and M. K. Stein, ImprovingInstruction in Rational Numbers and Proportionality.Teachers College, Columbia University New York. 2005.
[21] R. Rosli, D. Goldsby, A. J. Onwuegbuzie, M. M. Capraro, R.M. Capraro, and E. G. Y. Gonzalez, “Elementary preserviceteachers’ knowledge, perceptions and attitudes towardsfractions: A mixed-analysis,” J. Math. Educ., vol. 11, no. 1,pp. 59–76, 2020, doi: 10.22342/jme.11.1.9482.59-76.
[22] Sugiyono, Metode penelitian kuantitatif, kualitatif, danR&D. Bandung: Alfabeta. 2016.
[23] M. Asis, N. Arsyad, and Alimuddin, “Profil KemampuanSpasial Dalam Menyelesaikan Masalah Geometri SiswaYang Memiliki Kecerdasan Logis Matematis TinggiDitinjau Dari Perbedaan Gender,” J. Daya Mat., vol. 3, no. 1,pp. 78–87, 2015, doi: 10.26858/jds.v3i1.1320.
[24] F. van Nes and M. Doorman, “Fostering young children’sspatial structuring ability,” Int. Electron. J. Math. Educ., vol.6, no. 1, pp. 27–39, 2011.
[25] Baiduri, “Profil Berpikir Relasional SIswa SD dalamMenyelesikan Masalah Matematika Ditinjau dariKemampuan Matematika dan Gender. Disertasi: PPSUniversitas Negeri Surabaya,” 2013.
[26] S. M. Reis and S. Park, “Gender differences inhigh-achieving students in math and science,” J. Educ. Gift.,vol. 25, no. 1, pp. 52–73, 2001, doi:10.1177/016235320102500104.
[27] A. M. Steegh, T. N. Höffler, M. M. Keller, and I. Parchmann,“Gender differences in mathematics and sciencecompetitions: A systematic review,” J. Res. Sci. Teach., vol.56, no. 10, pp. 1431–1460, 2019, doi: 10.1002/tea.21580.
[28] Baiduri, “Understanding of Fraction Concepts ofElementary School Students Through Problem Solving,”2020.
[29] C. Bruce, S. Bennett, and T. Flynn, “Rational NumberTeaching and Learning - Literature Review,” 2018.