Embed Size (px)
Citation preview

NBER WORKING PAPER SERIES
STUDENTS CHOOSING COLLEGES:UNDERSTANDING THE MATRICULATION DECISION AT A HIGHLY SELECTIVE PRIVATE INSTITUTION
Peter NurnbergMorton Schapiro
David Zimmerman
Working Paper 15772http://www.nber.org/papers/w15772
NATIONAL BUREAU OF ECONOMIC RESEARCH1050 Massachusetts Avenue
Cambridge, MA 02138February 2010
The views expressed herein are those of the authors and do not necessarily reflect the views of theNational Bureau of Economic Research.
NBER working papers are circulated for discussion and comment purposes. They have not been peer-reviewed or been subject to the review by the NBER Board of Directors that accompanies officialNBER publications.
© 2010 by Peter Nurnberg, Morton Schapiro, and David Zimmerman. All rights reserved. Short sectionsof text, not to exceed two paragraphs, may be quoted without explicit permission provided that fullcredit, including © notice, is given to the source.

Students Choosing Colleges: Understanding the Matriculation Decision at a Highly SelectivePrivate InstitutionPeter Nurnberg, Morton Schapiro, and David ZimmermanNBER Working Paper No. 15772February 2010, Revised March 2010JEL No. I21
ABSTRACT
The college choice process can be reduced to three questions:
1)Where does a student apply?
2)Which schools accept the students?
3)Which offer of admission does the student accept? This paper addresses question three. Specifically, we offer an econometric analysis of the matriculationdecisions made by students accepted to Williams College, one of the nation’s most highly selectivecolleges and universities. We use data for the Williams classes of 2008 through 2012 to estimate ayield model. We find that—conditional on the student applying to and being accepted by Williams—applicantquality as measured by standardized tests, high school GPA and the like, the net price a particularstudent faces (the sticker price minus institutional financial aid), the applicant’s race and geographicorigin, plus the student’s artistic, athletic and academic interests, are strong predictors of whether ornot the student will matriculate.
Peter NurnbergWilliams Project on the Economics of Higher EducationMears West, Williams CollegeWilliamstown, MA [email protected]
Morton SchapiroOffice of the PresidentNorthwestern University633 Clark StreetEvanston, IL [email protected]
David ZimmermanDepartment of EconomicsWilliams CollegeSouth Academic Building24 Hopkins Hall DriveWilliamstown, MA 01267and [email protected]
DRAFT
Students Choosing Colleges: Understanding the Matriculation Decision at a Highly Selective Private Institution
Peter Nurnberg Morton Schapiro David Zimmerman
Williams College Northwestern University Williams College
August 2009
I. Introduction
The college choice process can be reduced to three questions:
1) Where does a student apply?
2) Which schools accept the students? 3) Which offer of admission does the student accept? This paper addresses question three. Specifically, we offer an econometric analysis
of the matriculation decisions made by students accepted to Williams College, one of the
nation’s most highly selective colleges and universities. We use data for the Williams
classes of 2008 through 2012 to estimate a yield model. We find that—conditional on the
student applying to and being accepted by Williams—applicant quality as measured by
standardized tests, high school GPA and the like, the net price a particular student faces
(the sticker price minus institutional financial aid), the applicant’s race and geographic
origin, plus the student’s artistic, athletic and academic interests, are strong predictors of
whether or not the student will matriculate.
While getting accepted into a selective college seems to be a public obsession,
there is less focus (except by the colleges themselves) on the matriculation decision. Yet,
while colleges choose students, students also select colleges. The tables turn when,

2
around April 1st, students, parents, guidance counselors and their friends relax their
efforts at proving an applicant is worth a bulky envelope (or increasingly these days a
cheerful e-mail message), and colleges and universities, regardless of how selective, go
on the offensive through their myriad “conversion” activities.
While the economics literature on the matriculation decision is sparse, the college
choices made by prospective students significantly impact individuals, colleges, and
society in general.1 On a personal level, a student’s matriculation decision likely impacts
his or her development during college as well as post-college opportunities. On the
college level, matriculation decisions impact financial aid expenditures and the academic
and demographic composition of the student body. On a societal level, different
concentration levels of specific types of students likely lead to different social outcomes.
The analysis presented here is most salient to selective institutions of higher
education. Yield management is a central responsibility of all selective institutions.
Schools can only accommodate a relatively fixed number of freshmen and selective
institutions are eager to enroll the “best” possible freshman class. The competition for
talented students is intense, and even the most selective colleges and universities must
admit a substantially larger number of students than the number of available slots in order
to fill their freshman classes. But there is an asymmetric risk for these institutions.
Small, moderate or even substantial under-yields can typically be remedied by admitting
students from the waitlist. However, since these schools typically have tight limitations
on the number of students they can accommodate, even moderate over-yields are
problematic and capable of generating significant expenses and/or embarrassment for a
1 The main components of the literature include Avery and Hoxby (2003), Chapman (1981), Linsenmeier (2006), Perry and Rumpf (1984), and Weiler (1996).

3
college. Thus, it would be especially beneficial for selective colleges to have a rigorous
way of predicting which admitted students will matriculate and which will not.
The results presented here identify the predictive power of different parts of an
accepted student’s application, casting light on which of these personal characteristics
indicate that an applicant intends or does not intend to come to Williams. These findings
are then used to calculate the probability that a given student will matriculate at Williams,
thereby allowing us to estimate the overall yield from a given batch of accepted students.
While this analysis is based on Williams-specific variables and data, the general
theoretical framework presented in this paper can be applied to all institutions and a
researcher with access to data from other selective institutions can engage in an
analogous examination based on that institution’s admission and financial aid variables.
The paper proceeds as follows: section II lays out a simple model of the
matriculation decision, section III discusses the data used in the analysis, section IV
presents the empirical results, section V discusses applications of the model, and section
VI concludes.
II. A Model of the Matriculation Decision
Figure 1 illustrates and provides a structural framework for the matriculation
decision.

4
Figure 1: The Matriculation Decision Schematic
The matriculation decision is influenced by many factors. A college education is
an unusual type of good; it is simultaneously a consumption good—similar to a country
club membership—and an investment product—similar to an annuity. Both of these
aspects of a college impact the utility a student derives from a particular institution. For
an individual applicant, the consumption utility of a school is determined by the quality
of the match between the applicant’s preferences and the school’s fundamental
characteristics. For example, an art history-loving student might derive a large
consumption benefit from a school with a first-rate art history department, and a city life
enthusiast could derive a big consumption benefit from a school located in a major
metropolitan area. Alternatively, the investment utility derived from a particular school
is determined by the quality of the career options—in terms of expected lifetime financial
remuneration, prestige and occupational satisfaction—available to a student upon
graduation from the institution. The investment utility of a college is difficult to properly

5
conceptualize and specify. Since the vast majority of students in this analysis were likely
bound for other “top” colleges, this component of utility is best described in relative
terms. It is the lifetime earnings and non-financial occupational benefit increase that
stems from going to the given institution instead of taking the next best option in the
student’s college choice set. Thus, the magnitude of this benefit is related to the quality
of the applicant’s choice set. The better—however the individual student defines
better—the student’s choice set, the lower this relative value of investment utility will be.
Direct and indirect costs are also important factors in the matriculation decision.
In addition to evaluating the potential utility provided by different institutions, students
must also consider the relative costs of different institutions and other options—i.e. direct
entry into the workforce. These financial and opportunity costs differ from institution to
institution and are highly influenced by the student’s college choice set. Under this
framework, the costs and utility associated with a given institution—for a particular
student—combine to generate the indirect utility value that the student derives from
attending that institution. If that indirect utility value exceeds the indirect utility of all of
the other options available to the student, the student should matriculate at the school. If
that indirect utility is exceeded by the indirect utility of at least one of the student’s other
options, the student should not matriculate at the school.
This theoretical framework suggests the following empirical model of a student’s
decision to matriculate at a specific institution.
Probability(Matriculation) = F(X)
Under this construction, X is a vector of student characteristics. Since this model is for a
particular institution, the college’s characteristics are not included in the specification.

6
Rather, the student’s attributes capture the quality of the match between the applicant and
the institution and proxy for the student’s opportunity set. The X vector contains
variables representing the applicant’s academic achievements, extra-curricular
achievements, high-school activities, academic interests, extra-curricular interests,
demographic characteristics, contact with the institution, and relationship to the
institution or its officers. The vector also includes direct cost variables specific to the
student.
III. The Data
The model presented above is applied to the group of students admitted during the
regular decision process to the Williams College classes of 2008, 2009, 2010, 2011 and
2012. All of the data used in this analysis were provided by the Williams College
admissions and financial aid offices.
Williams is a highly selective liberal arts college in western Massachusetts with
an enrollment of around 2,000 undergraduate students. A perennially top-ranked
institution, Williams generally accepts between 15% and 20% of its applicants.
However, due to intense competition from other elite institutions and a policy of
admitting the “best” applicants regardless of whether or not they are likely to matriculate,
Williams’ matriculation rate for students admitted regular decision has recently hovered
around 35%.2
In order to generate a model that can be used to predict admissions yield in future
years, this analysis only uses information available to the school at the time of the
2 Williams’ early admissions program is binding.

7
admissions decision. These data include race, gender, geographic origin, high school
type, extra-curricular activities and interests, athlete status, connections to the institution,
potential future donations to the school, legacy connections, academic interests, overall
academic rating, overall non-academic rating, contact between the applicant and the
school, net price of the institution, financial aid status, and subjective variables designed
to capture desirable applicant qualities that appear in recommendation letters or essays
but are not sufficiently measured by traditional applicant characteristics. The primary
variables of interest are discussed below.
III.1 Average Academic and Average Non-Academic Reader Ratings
Academic and non-academic ratings are subjective measures determined by the
college’s admissions officers. After evaluating the applicant’s SAT scores, high school
grades, essays, class rank, high school academic program, support from the high school
administration, AP test score—or IB test scores—and teacher recommendations,
admissions readers assign the applicant an academic rating from the scale 1 – 9, with 1
being the best.3 Similarly, after evaluating the applicant’s extra-curricular activities, non-
academic awards, community service work, non-academic skills—i.e. special musical,
athletic, acting, or other ability—and other non-academic activities, admissions readers
3 While the academic reader ratings are somewhat subjective, they are strongly influenced by the following guidelines. Academic 1: at top or close to top of HS class / A record / exceptional academic program / 1520 – 1600 composite SAT I score; Academic 2: top 5% of HS class / mostly A record / extremely demanding academic program / 1450 – 1520 composite SAT I score; Academic 3: top 10% of HS class / many A grades / very demanding academic program / 1390 – 1450 composite SAT I score; Academic 4: top 15% of HS class / A – B record / very demanding academic program / 1310 – 1400 composite SAT I score; Academic 5: top 20% of HS class / B record / demanding academic program / 1260 – 1320 composite SAT I score; Academic 6: top 20% of HS class / B record / average academic program / 1210 – 1280 composite SAT I score; Academic 7: top 25% of HS class / mostly B record / less than demanding program / 1140 – 1220 composite SAT I score; Academic 8: top 33% of HS class / mostly B record or below / concern about academic program / 1000 – 1180 composite SAT I score; Academic 9: everyone else.

8
assign the applicant a non-academic rating from the scale 1 – 5, with 1 again being the
best.4 Around 60% of the admitted students in the data set had academic ratings of one or
two. Roughly 75% of the admitted students had non-academic ratings of two or three.
III.2 Attributes
Recorded and assigned by the admissions office, the attributes proxy for qualities
that are in some way desirable to the Williams community. This analysis uses the
following attributes: alumni grandparent, alumni other, alumni parent, alumni sibling,
studio art, development or future fundraising potential, dance, institutional connection,
intellectual vitality, local, music, politically active, religious, research science,
economically disadvantaged, social service, theater, top athlete, tier 2 athlete, and tier 3
athlete. Strong candidates have many attributes—they are well rounded—or are
especially talented with regard to a specific attribute. Unfortunately, the admissions
office does not record the strength of the attributes assigned to each applicant. All of the
attributes except for the intellectual vitality attribute are relatively self-explanatory. The
intellectual vitality attribute is given to an applicant that demonstrates “extraordinary
academic depth / talent as usually revealed in the recommendations” or a student who
admissions officers believe will be “a classroom catalyst who would have a significant
4 While the non-academic reader ratings are somewhat subjective, they are strongly influenced by the following guidelines. Non-academic 1: at least two activities / at least 3 consecutive years of involvement in one activity / top regional or national standing in an activity / student exhibits a rare level of leadership and engagement; Non-academic 2: at least two activities / at least 3 consecutive years of involvement in one activity / top local standing in two activities / student exhibits high-level work in differeing activities; Non-Academic 3: at least two activities / at least 3 consecutive years of involvement in one activity / top local standing in one activity / student exhibits high-level work in one area and long-term commitment to activities; Non-Academic 4: at least two activities / at least 2 consecutive years of involvement in one activity / moderate level of achievement in two activities / the student participates in a few activities for less than two years; Non-Acemic 5: everyone else.

9
impact in labs or class discussion.”5 Recommendation letters with phrases such as “the
smartest kid I have taught in 30 years” or “learns for the sake of learning” or “goes above
and beyond expectations” or “drives the conversation in the classroom” or “challenges
peers to more deeply engage the material” commonly lead to a student being given the
intellectual vitality tag. Of the 2,901 admitted students in the data set, 27% received the
intellectual vitality attribute.
III.3 Financial Aid
Sticker prices at selective private colleges are not cheap. Thus it is reasonable to
assume that financial aid packages significantly influence matriculation decisions.
Williams meets the total demonstrated need of all admitted students. The Williams
grant—the amount by which Williams reduces the sticker price—is used as the measure
of financial aid. This analysis takes net price to be the difference between the average,
over the five year sample period, of Williams’ annual comprehensive fees and the
individual student’s Williams grant.6 Just under half of the admitted students in the data
set were offered grant aid. Within the subgroup of students who were offered grants, the
majority of grants fell between 50% and 75% of the sticker price.
III.4 Geography
The data set includes each applicant’s zip code, home state, and country.
Williams’ applicants come from around the world, but the majority of Williams’ admitted
5 From the Williams Admissions Office’s Attributes Long Descriptions Class of 2010 spreadsheet. This reference document is used to train new admissions officers. 6 The comprehensive fee for each student equals the average of the comprehensive fees from fiscal years 2004, 2005, 2006 and 2007. The average comprehensive fee for that period was $43,442.

10
and matriculating domestic students come from the northeast and the east and west coast
of the United States. Matriculation rates range from 28% for students from the West to
41% for students from the Northeast. Outside of the United States, matriculation rates
range from 16% in South and Central America to 44% in East Asia and 46% in non-USA
North America.
III.5 Contact Between the Student and the School
The admissions office records all contact between applicants and admissions
officers. Such contact ranges from the applicant visiting campus and signing up at the
admissions office (walk in) before a campus tour, to the student attending a local evening
information session, to an admissions officer traveling to the student’s high school, to the
student attending a summer open house, to the applicant attending a college fair manned
by either a Williams alumnus or a Williams staff member. An individual applicant can
have multiple points of contact with the school. The data show that fewer than 15% of
admitted students signed up at the admissions office and only around 5% attended a
Williams-run information session at their high school.
III.6 Early Write Notification
Not all students who apply regular decision are notified of the admissions office’s
decision at the same time. Most accepted students are notified of their acceptance at the
end of March. However, some students receive what the admissions office calls “early
write” acceptances. These students receive personalized letters between the beginning of
February and the end of March. The early write notifications tend to be sent to students

11
who have two qualities: they are very attractive to the admissions officers and the
admissions officers think there is a significant chance they might matriculate somewhere
else.
III.7 Denied Aid
This dummy variable equals one if the student applied for financial aid but was
not offered any grant aid.
IV. Empirical Results
The fully specified model generates the following probit results.7 To illustrate the
main implications of the model, the results of a single regression are presented in two
tables. In the specification presented here, the reader ratings enter the model as dummy
variables—with a rating of one as the omitted category—in order to allow for a non-
linear relationship between the reader ratings and the probability of matriculation. The
coefficients on these reader rating variables are reported first.8 The tables report the
marginal effects—calculated at the means—of the explanatory variables.
Table 1: The Reader Rating Dummy Variables
7 This paper only includes one specification of the model. The results from additional specifications are available upon request. 8 Other specifications of this model include terms interacting the reader rating dummy variables with race and gender variables. In those models, only the terms interacting the African American variable and the academic reader ratings were significant. Including those interaction terms did not meaningfully impact the coefficients on the other variables in the model. Those results are not presented here, but they are available upon request.

12
Except for the small decline between the ACAD3 and ACAD4 coefficients, the
magnitude of the reader rating coefficients increases monotonically as the numerical
reader rating score increases—for both the academic and the non-academic reader
ratings. Recall that numerically higher reader ratings are associated with worse applicant
quality. Thus, this result implies that applicants with worse—numerically larger—reader
ratings are more likely to matriculate than their peers. By construction, these coefficients
represent the percentage point difference in the probability of matriculation when a
student moves from the base case—reader ratings of 1—to the category represented by
the dummy variable. The following figure displays these coefficients.
Figure 2: The Academic Reader Rating Coefficients

13
This plot shows the impact of moving between reader ratings on the probability of
matriculation. The matriculation probability jump from moving between ACAD1 and
ACAD2 is almost identical to the jump from moving between ACAD2 and ACAD3, as
moving to the numerically higher reader rating increases the probability of matriculation
by around 20 percentage points. These results imply that there are substantial differences
in the opportunity sets available to students with ACAD1, ACAD2, and ACAD3 ratings.
Moving from an ACAD3 to an ACAD4 does not meaningfully alter the probability of
matriculation. Thus, the model indicates that—ceteris paribus—students with ACAD3
and ACAD4 ratings have similar opportunity sets. Finally, moving from an ACAD4
rating to an ACAD5 rating increases the probability of matriculation by 7 percentage
points, moving from an ACAD5 to an ACAD6 increases the probability of matriculation
by 9 percentage points, and moving from an ACAD6 to an ACAD7, ACAD8 or ACAD9
increases the probability of matriculation by 6 percentage points. Thus, there appears to
be a substantial change in opportunity sets as students move along the worse portion of
14
the reader rating scale—though less than the change in opportunity sets as applicants
move from being ACAD1s to ACAD2s or ACAD2s to ACAD3s. The results are similar
for the non-academic reader ratings. The coefficients on the other variables in the
model are reported below.
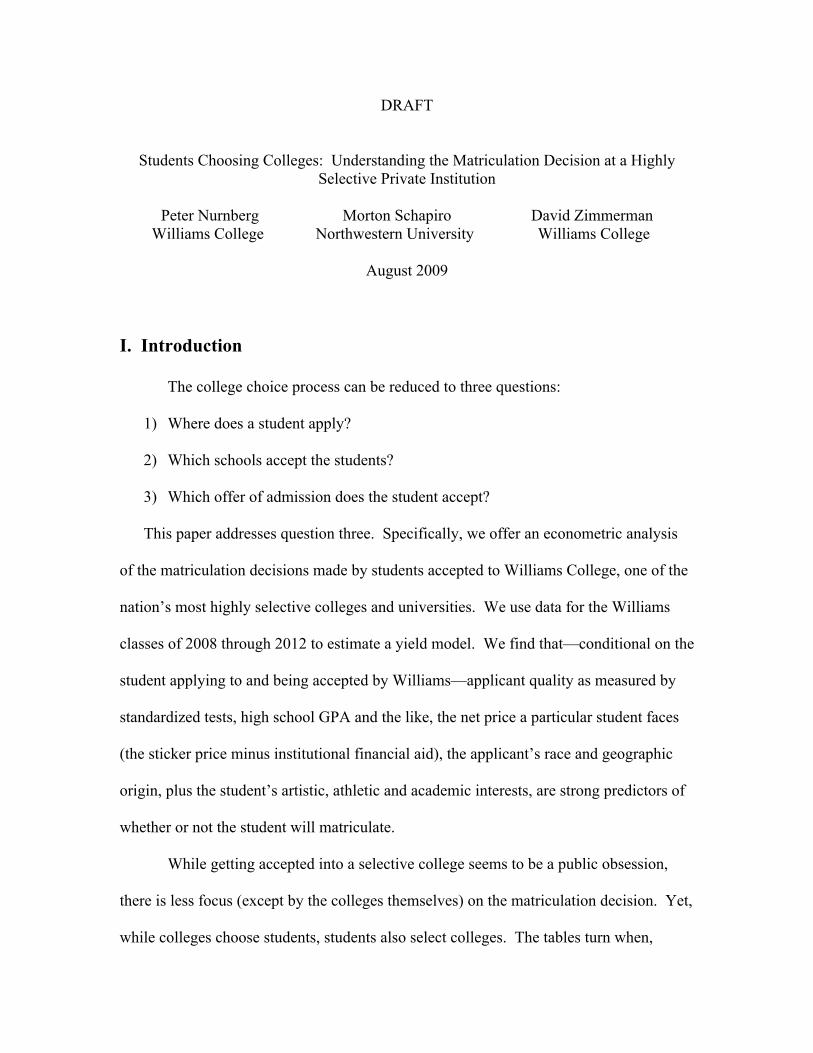
Table 2: The Remaining Variables

15

16
This specification explains just under 20% of the variation in the matriculation
variable. The race variables are among the strongest predictors of matriculation. When
all other applicant characteristics are controlled for, minority applicants are substantially
less likely than their white counterparts to enroll at Williams if accepted. The probability
of matriculation for an African American student is over 32 percentage points lower than
the probability of matriculation for a white student. The probability of matriculation for a
Hispanic student is over 23 percentage points lower than the probability of matriculation
for a white student.
The studio art attribute variable is statistically significant with a sizable
coefficient. Applicants with strong studio art backgrounds are 13 percentage points less
likely to come to Williams than applicants without that attribute. At the other extreme,
the coefficients on top and middle athlete are positive, significant, and quite large (11 and

17
20 percentage points). Self-reported pre-enrollment academic interests are also very
important. Students determined to pursue research science interests are less interested in
coming to Williams than their peers—their probability of matriculation is 6 percentage
points lower than that of students without this interest. Alternatively, students who do
not know what academic interests they want to pursue are 10 percentage points more
likely than students with social science interests to matriculate.
The impact of net price on the probability of matriculation is also significant, but
the magnitude of the impact—and implicitly the elasticity of demand for a Williams
education—is small. A $5,000 increase in net price only reduces the probability of
matriculation by only 1.3 percentage points, 20% of the impact, for example, of a
research science interest. This result may simply be picking up the fact that, for a given
student, while differences in net price may be important, the limited spread in aid offers
among highly selective institutions might make it difficult to pick up the full impact of
this variable. However, students who are denied aid altogether are substantially less
likely to matriculate at Williams—the probability of matriculation falls by 12 percentage
points. The admissions office’s recruiting efforts also seem to have important influences
on the probability of matriculation. A student who visits the admissions office is 12
percentage points more likely to attend Williams than a student who does not. The
distance between Williams and the student’s home also has a key impact on the
matriculation decision. The adverse matriculation impact of living in an urban area is
equivalent to the impact of moving an additional 2205 kilometers away from Williams.
The proxy variables for unquantifiable applicant quality are also highly
significant. Students who receive the intellectual vitality tag are 9 percentage points less

18
likely than their peers to matriculate, which is equal to the effect of early write
notification. On the other hand, legacy status increases the probability of matriculation
by 6 percentage points.
The results presented here provide no evidence of causal relationships between
the explanatory variables in the model and the probability of matriculation. For example,
the positive impact of signing up in the admissions office before a campus tour could
either indicate the presence of a compelling tour guide, an otherwise unmeasured interest
in attending Williams, or some combination of the two. However, these results identify a
range of powerful predictors of the probability of matriculation.
V. Applications of the Model and Empirical Results
The work presented here has numerous practical applications. Admissions and
financial aid officers from selective institutions can use this approach with their own
institutions’ data to perform the following analyses.
V.1 Assigning Matriculation Probabilities to Individual Applicants
Using this model to assign estimated matriculation probabilities to individual
applicants is a straightforward application of the results presented above. The
coefficients reported above are the marginal effects at the mean. However, with the
model given above, the same statistical package—in this case STATA version 10—will
also compute the probit regression coefficients. With those regression coefficients, the
probit value for a given applicant can be computed by multiplying each coefficient by the
corresponding variable value for the applicant, and summing across all of the variables.
When input into the standard normal cumulative distribution function, this probit value is

19
uniquely mapped to an estimated probability of matriculation between zero and one.
Table 3 presents some sample estimated probabilities computed from the results of the
above model and hypothetical applicant variable values.
Table 3: Hypothetical Predicted Probabilities

20

21
V.2 Forecasting the Total Number of Matriculants
This application is an extension of the previous application. The technique
described in the prior subsection can be used to compute an estimated probability of
matriculation for each applicant in a pool of admitted students. Once all of those
probabilities have been computed, the forecast can be made in two ways. Under the first
method, the model is calibrated by selecting a cutoff probability such that for a base data
set the number of students with estimated probabilities above the cutoff equals the
number of students in the base data set who actually matriculated. The forecast is then
made by predicting that all students in the new data set with an estimated probability of
matriculation greater than or equal to the cutoff will matriculate and all others will not
matriculate. The number of students with predicted probabilities greater than or equal to
the cutoff is the predicted yield. Alternatively, the yield can be computed by simply
summing all of the estimated probabilities and rounding to the nearest whole number.
The two methods generate very similar predictions.9 Under the first method, the
applicant by applicant predictions can also be used to predict the composition of the class
along demographic, gender or any other lines.
V.3 Forecasting the Financial Aid Budget
Finally, the analysis in the previous subsection can be further extended to predict
the financial aid budget needed to cover the grants offered to a pool of admitted students.
This analysis is performed by transforming the applicant by applicant predictions
generated from the first technique in the previous subsection into a dummy variable that
takes on the value one if the applicant is predicted to matriculate and zero otherwise. For 9 These methods were both highly accurate when applied to the Williams class of 2013 data.

22
each applicant, this new dummy variable is then multiplied by the grant offered to the
student.10 The predicted aid budget from the applicant pool is computed by summing
these products across all of the applicants in the data set.
Finally, with the explosion of merit aid over the past two decades, this type of
analysis could go a long way in minimizing economic rents, as smaller merit aid
packages could be offered to students whose characteristics indicate that they are likely to
matriculate regardless of the net price they face.
VI. Conclusion
The empirical analysis described above, while based on Williams College, can be
easily applied elsewhere. However, if Williams is representative of other selective
schools, it should be noted that even with the presence of an extensive range of
explanatory variables, much of the total variation in matriculation decisions remains
unexplained. Perhaps it is the weather on preview day, or the attractiveness of the tour
guide that attracts or repels a prospective student. Or perhaps the analysis might benefit
from nuanced measures of college name brand recognition—and the connotations
associated with different names.
The analysis of college yield could provide fertile ground for future researchers.
The paucity of empirical studies, and the overall importance of the subject, suggest that
further work is warranted.
10 An identical analysis can be performed with loan or any other type of aid offers.

References
Avery, C., & Hoxby, C. (2003). Do and should financial aid packages affect students' college choices? NBER Working Paper No. W9482. Available at SSRN: http://ssrn.com/abstract=379801
Chapman, D. (1981). A model of student college choice. The Journal of Higher
Education, 52 (5), 490-505. Hossler, Don. (1999). Effective Admissions Recruitment. New Directions for Higher
Education, Volume 1999, Issue 108, 15-30. In a Shifting Era of Admissions, Colleges Are Sweating, New York Times (3/7/2009).
http://www.nytimes.com/2009/03/08/education/08yield.html?_r=1&hp. Linsenmeier, D. et al. (2006). Financial aid packages and college enrollment decisions:
an econometric case study. The Review of Economics and Statistics, 88 (1), 126-145.
Monks, J. (2009). The impact of merit-based financial aid on college enrollment: A field
experiment. Economics of Education Review, 28, 99-106. Perry, R., & Rumpf, D. (1984). Predicting the likelihood of matriculation for college
applicants. Research in Higher Education, 21 (3), 317-328. Weiler, W. (1996). Factors influencing the matriculation choices of high ability students.
Economics of Education Review, 15 (1), 23-36.


![Choosing a Bible -- Understanding Bible Translation Differences [Ryken; Crossway, 2005]](https://img.pdfslide.us/doc/110x75/577d36851a28ab3a6b935355/choosing-a-bible-understanding-bible-translation-differences-ryken-crossway.jpg)