Embed Size (px)
Citation preview
1 | P a g e
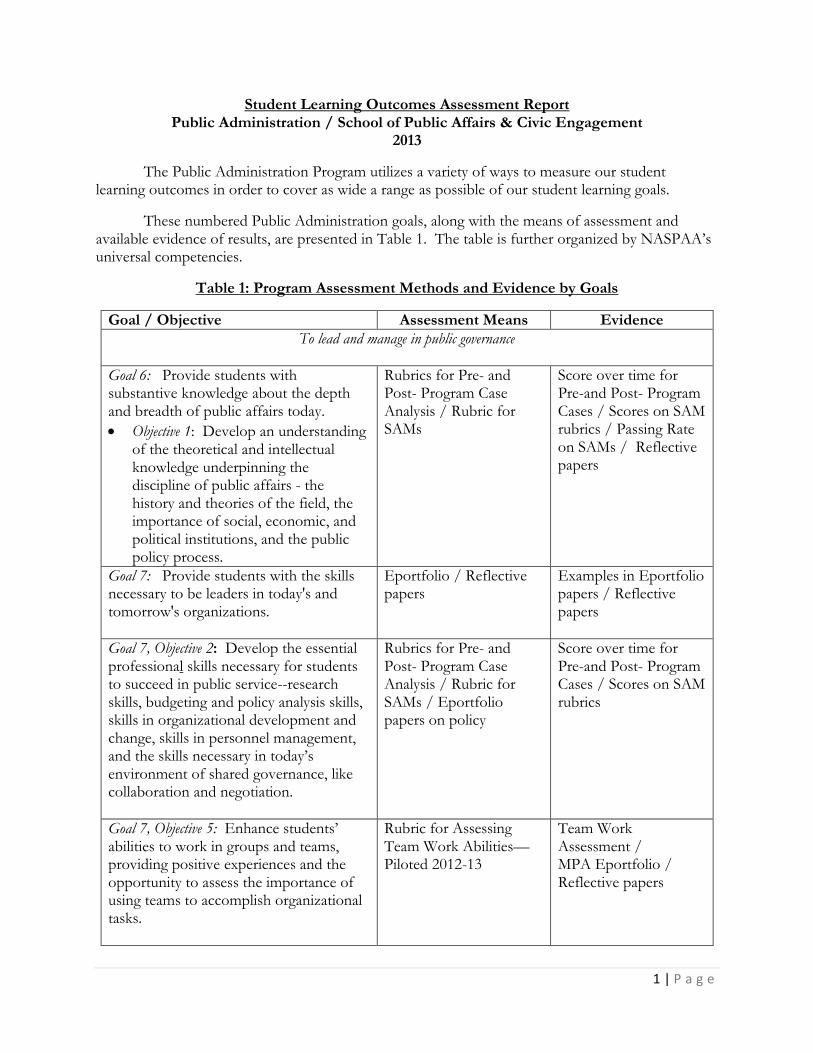
Student Learning Outcomes Assessment Report Public Administration / School of Public Affairs & Civic Engagement
2013
The Public Administration Program utilizes a variety of ways to measure our student learning outcomes in order to cover as wide a range as possible of our student learning goals.
These numbered Public Administration goals, along with the means of assessment and available evidence of results, are presented in Table 1. The table is further organized by NASPAA’s universal competencies.
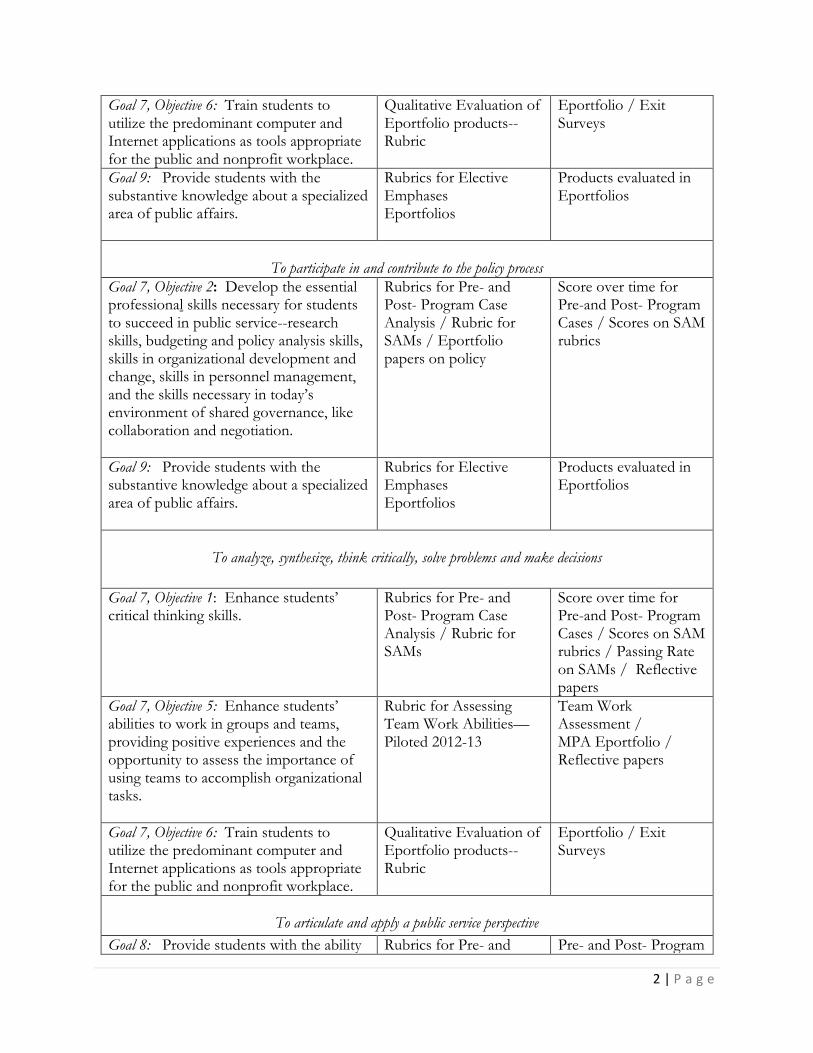
Table 1: Program Assessment Methods and Evidence by Goals
Goal / Objective Assessment Means Evidence
To lead and manage in public governance
Goal 6: Provide students with substantive knowledge about the depth and breadth of public affairs today.
Objective 1: Develop an understanding of the theoretical and intellectual knowledge underpinning the discipline of public affairs - the history and theories of the field, the importance of social, economic, and political institutions, and the public policy process.
Rubrics for Pre- and Post- Program Case Analysis / Rubric for SAMs
Score over time for Pre-and Post- Program Cases / Scores on SAM rubrics / Passing Rate on SAMs / Reflective papers
Goal 7: Provide students with the skills necessary to be leaders in today's and tomorrow's organizations.
Eportfolio / Reflective papers
Examples in Eportfolio papers / Reflective papers
Goal 7, Objective 2: Develop the essential professional skills necessary for students to succeed in public service--research skills, budgeting and policy analysis skills, skills in organizational development and change, skills in personnel management, and the skills necessary in today’s environment of shared governance, like collaboration and negotiation.
Rubrics for Pre- and Post- Program Case Analysis / Rubric for SAMs / Eportfolio papers on policy
Score over time for Pre-and Post- Program Cases / Scores on SAM rubrics
Goal 7, Objective 5: Enhance students’ abilities to work in groups and teams, providing positive experiences and the opportunity to assess the importance of using teams to accomplish organizational tasks.
Rubric for Assessing Team Work Abilities—Piloted 2012-13
Team Work Assessment / MPA Eportfolio / Reflective papers
2 | P a g e
Goal 7, Objective 6: Train students to utilize the predominant computer and Internet applications as tools appropriate for the public and nonprofit workplace.
Qualitative Evaluation of Eportfolio products-- Rubric
Eportfolio / Exit Surveys
Goal 9: Provide students with the substantive knowledge about a specialized area of public affairs.
Rubrics for Elective Emphases Eportfolios
Products evaluated in Eportfolios
To participate in and contribute to the policy process
Goal 7, Objective 2: Develop the essential professional skills necessary for students to succeed in public service--research skills, budgeting and policy analysis skills, skills in organizational development and change, skills in personnel management, and the skills necessary in today’s environment of shared governance, like collaboration and negotiation.
Rubrics for Pre- and Post- Program Case Analysis / Rubric for SAMs / Eportfolio papers on policy
Score over time for Pre-and Post- Program Cases / Scores on SAM rubrics
Goal 9: Provide students with the substantive knowledge about a specialized area of public affairs.
Rubrics for Elective Emphases Eportfolios
Products evaluated in Eportfolios
To analyze, synthesize, think critically, solve problems and make decisions
Goal 7, Objective 1: Enhance students’ critical thinking skills.
Rubrics for Pre- and Post- Program Case Analysis / Rubric for SAMs
Score over time for Pre-and Post- Program Cases / Scores on SAM rubrics / Passing Rate on SAMs / Reflective papers
Goal 7, Objective 5: Enhance students’ abilities to work in groups and teams, providing positive experiences and the opportunity to assess the importance of using teams to accomplish organizational tasks.
Rubric for Assessing Team Work Abilities—Piloted 2012-13
Team Work Assessment / MPA Eportfolio / Reflective papers
Goal 7, Objective 6: Train students to utilize the predominant computer and Internet applications as tools appropriate for the public and nonprofit workplace.
Qualitative Evaluation of Eportfolio products-- Rubric
Eportfolio / Exit Surveys
To articulate and apply a public service perspective
Goal 8: Provide students with the ability Rubrics for Pre- and Pre- and Post- Program
3 | P a g e
to be sensitive and knowledgeable about ethical, diversity international issues and public sector values in the public and nonprofit sectors.
Post- Program Case Analysis / Rubric for SAMs / Eportfolio papers
Case Analysis & Rubric / Eportfolio / Strategic Assessment Memos / Reflective papers
To communicate and interact productively with a diverse and changing workforce and citizenry
Goal 7, Objective 3: Develop students’ skills so that they can write effectively and concisely for an audience of professionals.
Rubrics for Pre- and Post- Program Case Analysis / Rubric for SAMs / Eportfolio papers
Score over time for Pre-and Post- Program Cases / Scores on SAM rubrics / Passing Rate on SAMs / Reflective papers
Goal 7, Objective 4: Develop students’ oral presentation skills so that they can effectively present to small and larger groups (by providing both experience and the opportunity to develop confidence while speaking in public).
Oral Presentation Assessment Rubric and Videos
Scores and Videos of Capstone Presentations / Reflective papers
Goal 8: Provide students with the ability to be sensitive and knowledgeable about ethical, diversity international issues and public sector values in the public and nonprofit sectors.
Rubrics for Pre- and Post- Program Case Analysis / Rubric for SAMs / Eportfolio papers
Pre- and Post- Program Case Analysis & Rubric / Eportfolio / Strategic Assessment Memos / Reflective papers
This year, we have assessed the overall performance of our students via the pre- and post-test case assessment, oral presentations, and have piloted two new kinds of assessment—a team work assessment tool and a method for assessing our elective emphases, beginning with Urban Administration. In addition, we are presenting the 11th year of our indirect exit survey results.
Pre- and Post- Program Case Analysis One of the most important assessments of our Program is the Pre- and Post- Program Case Analysis. Students read a case when they begin our first course, PA 700, and are asked to analyze the issues within the case, applying one of Woodrow Wilson’s important readings about administration. They then repeat that process in the capstone course, PA 800. The two analyses are scored according to a rubric in order to assess critical thinking skills, writing and knowledge about public administration.
Ideally, we would like to match up individual student’s pre-test score with their post-test score. But the faculty worked for several years on the rubric, ending up with several “false starts.” Therefore, the actual measurement of this analysis began in Spring 2010. The median number of semesters to finish our program is 7 semesters. The period from Spring 2010 to Spring 2013 contains 8 semesters so there are still a limited number of students who can be individually matched—20, at this point.
4 | P a g e
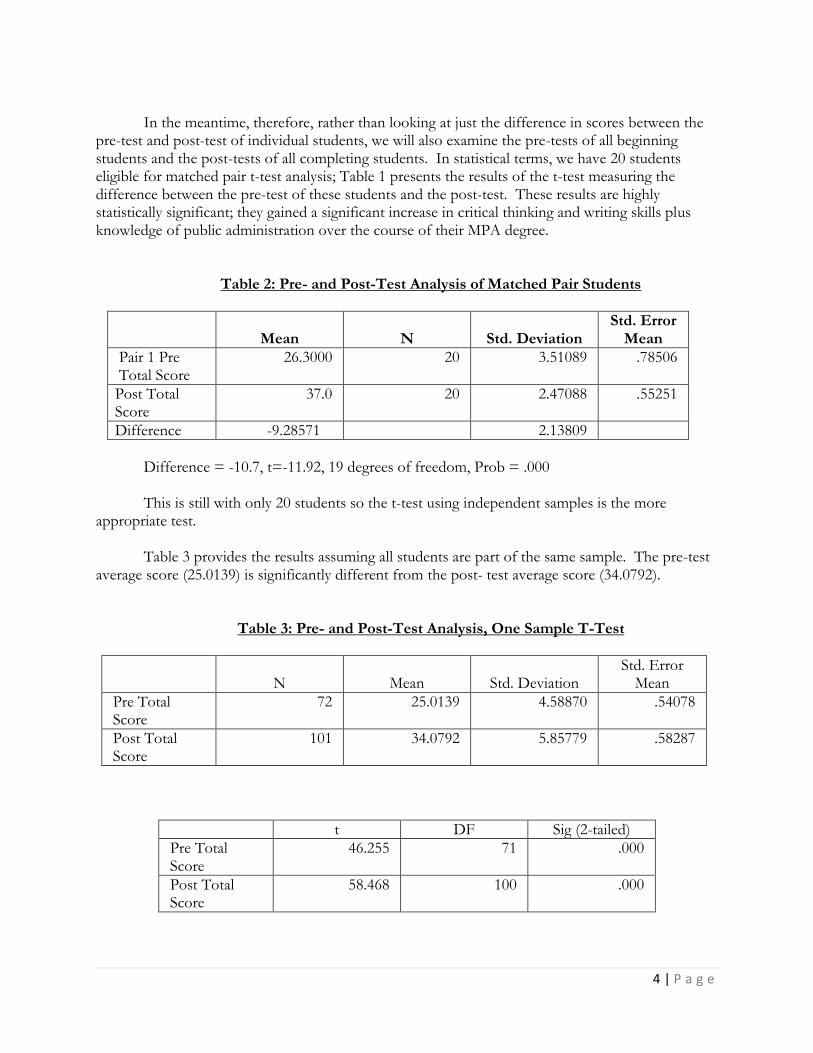
In the meantime, therefore, rather than looking at just the difference in scores between the
pre-test and post-test of individual students, we will also examine the pre-tests of all beginning students and the post-tests of all completing students. In statistical terms, we have 20 students eligible for matched pair t-test analysis; Table 1 presents the results of the t-test measuring the difference between the pre-test of these students and the post-test. These results are highly statistically significant; they gained a significant increase in critical thinking and writing skills plus knowledge of public administration over the course of their MPA degree.
Table 2: Pre- and Post-Test Analysis of Matched Pair Students
Mean N Std. Deviation
Std. Error Mean
Pair 1 Pre Total Score
26.3000 20 3.51089 .78506
Post Total Score
37.0 20 2.47088 .55251
Difference -9.28571 2.13809
Difference = -10.7, t=-11.92, 19 degrees of freedom, Prob = .000
This is still with only 20 students so the t-test using independent samples is the more appropriate test. Table 3 provides the results assuming all students are part of the same sample. The pre-test average score (25.0139) is significantly different from the post- test average score (34.0792).
Table 3: Pre- and Post-Test Analysis, One Sample T-Test
N Mean Std. Deviation
Std. Error Mean
Pre Total Score
72 25.0139 4.58870 .54078
Post Total Score
101 34.0792 5.85779 .58287
t DF Sig (2-tailed)
Pre Total Score
46.255 71 .000
Post Total Score
58.468 100 .000
5 | P a g e
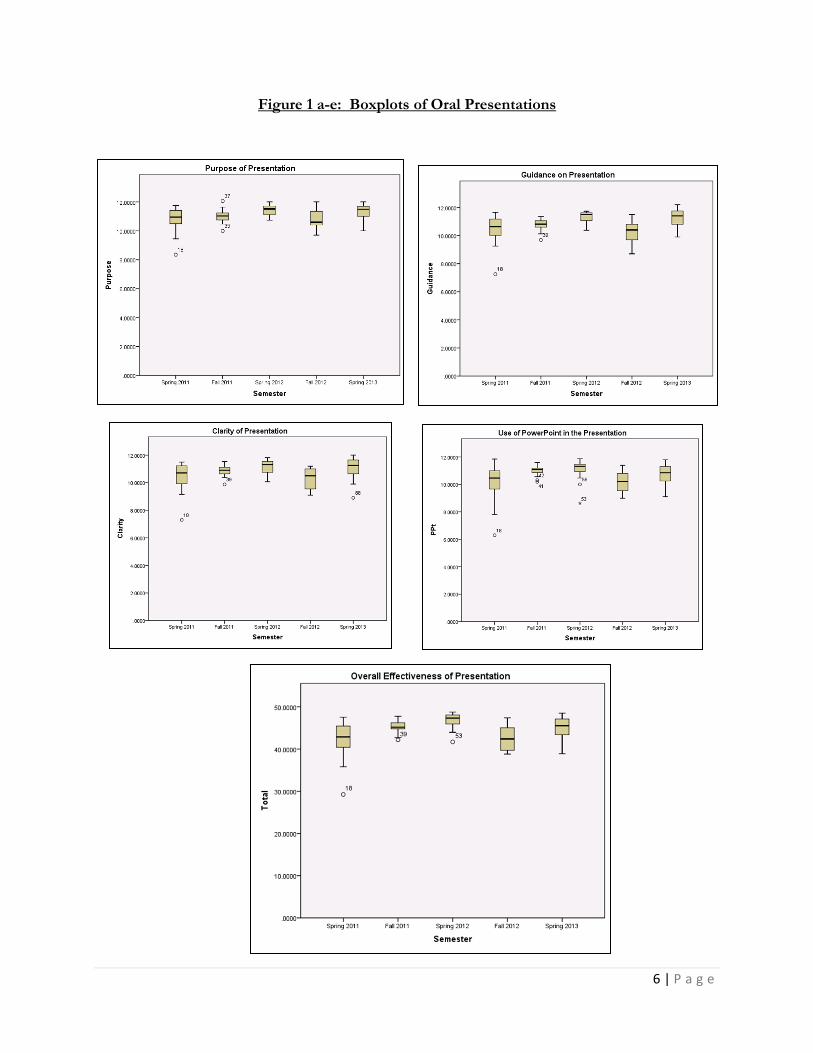
Therefore, we may assume that students completing the program have made significant improvements in writing, critical thinking and knowledge of public administration when compared to their colleagues beginning the program. We can conclude that the MPA Program does make a significant difference in these areas. Oral Presentations The next element of the program being assessed is students’ ability to make oral presentations. The rubric for oral presentation incorporates scoring on Purpose of presentation, Clarity of presentation, Guidance to listeners, appropriate and professional usage of PowerPoint, and Total Overall Presentation score. Each student is scored by all of their classmates; then each student’s score in each area is an average of their classmates’ views on how they did on each element. This assessment has been completed for the past three semesters in PA 800: Capstone Course. For the past four semesters, these presentations have also been videotaped; these videotapes are kept in the MPA network space and are available to NASPAA accreditation teams as evidence of student accomplishment in oral presentations.
Each boxplot box has a central line that is the median score on that element for that semester. The “whiskers” above and below are the lower and upper quartiles; the small circles are outliers (with the student number of that student). The height of the box indicates the difference between the 25th and 75th percentiles.
Figures 1 a-d all indicate the median value for Purpose, Guidance, Clarity and PowerPoint have all increased over the five semester period, indicating an improvement in each of these elements in student presentations over even three semesters. This increase is even more pronounced in Figure 1e, the boxplot reflecting Total Score for presentations; there is a steady increase in the score over the period seen here. Even the outliers show an increase, none are as low as in the first semester being evaluated. In addition, the scores are grouped more tightly around the mean, indicating more students are doing better overall.
We conclude that, while there continue to be outliers, overall, students are improving in their ability to conduct effective oral presentations. We need to continue providing formal instruction in this area, however.
6 | P a g e
Figure 1 a-e: Boxplots of Oral Presentations
7 | P a g e
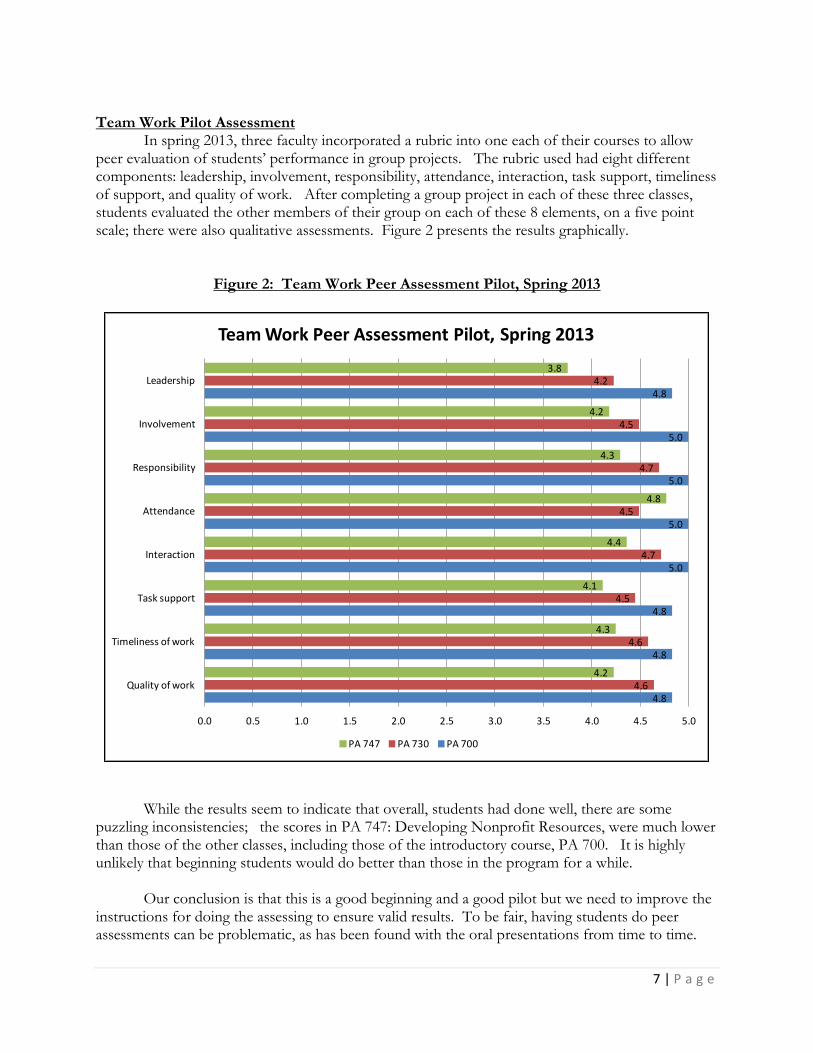
Team Work Pilot Assessment In spring 2013, three faculty incorporated a rubric into one each of their courses to allow peer evaluation of students’ performance in group projects. The rubric used had eight different components: leadership, involvement, responsibility, attendance, interaction, task support, timeliness of support, and quality of work. After completing a group project in each of these three classes, students evaluated the other members of their group on each of these 8 elements, on a five point scale; there were also qualitative assessments. Figure 2 presents the results graphically.
Figure 2: Team Work Peer Assessment Pilot, Spring 2013
While the results seem to indicate that overall, students had done well, there are some puzzling inconsistencies; the scores in PA 747: Developing Nonprofit Resources, were much lower than those of the other classes, including those of the introductory course, PA 700. It is highly unlikely that beginning students would do better than those in the program for a while. Our conclusion is that this is a good beginning and a good pilot but we need to improve the instructions for doing the assessing to ensure valid results. To be fair, having students do peer assessments can be problematic, as has been found with the oral presentations from time to time.
4.8
4.8
4.8
5.0
5.0
5.0
5.0
4.8
4.6
4.6
4.5
4.7
4.5
4.7
4.5
4.2
4.2
4.3
4.1
4.4
4.8
4.3
4.2
3.8
0.0 0.5 1.0 1.5 2.0 2.5 3.0 3.5 4.0 4.5 5.0
Quality of work
Timeliness of work
Task support
Interaction
Attendance
Responsibility
Involvement
Leadership
Team Work Peer Assessment Pilot, Spring 2013
PA 747 PA 730 PA 700
8 | P a g e
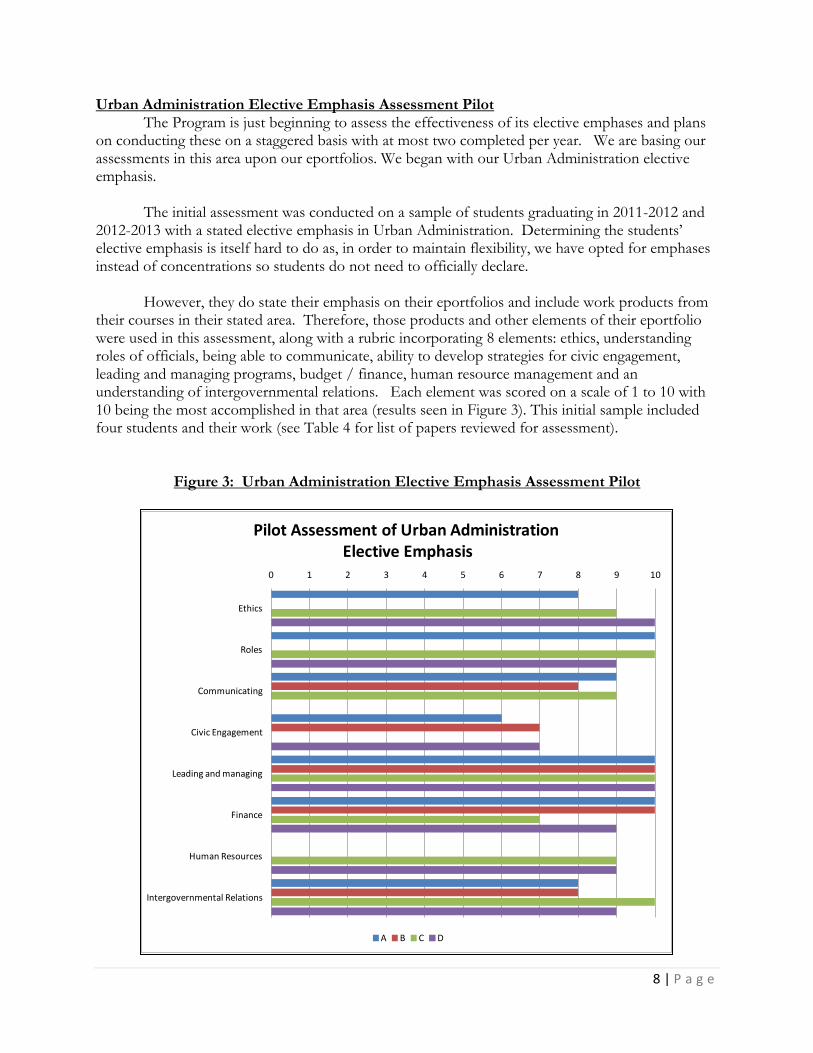
Urban Administration Elective Emphasis Assessment Pilot The Program is just beginning to assess the effectiveness of its elective emphases and plans on conducting these on a staggered basis with at most two completed per year. We are basing our assessments in this area upon our eportfolios. We began with our Urban Administration elective emphasis. The initial assessment was conducted on a sample of students graduating in 2011-2012 and 2012-2013 with a stated elective emphasis in Urban Administration. Determining the students’ elective emphasis is itself hard to do as, in order to maintain flexibility, we have opted for emphases instead of concentrations so students do not need to officially declare. However, they do state their emphasis on their eportfolios and include work products from their courses in their stated area. Therefore, those products and other elements of their eportfolio were used in this assessment, along with a rubric incorporating 8 elements: ethics, understanding roles of officials, being able to communicate, ability to develop strategies for civic engagement, leading and managing programs, budget / finance, human resource management and an understanding of intergovernmental relations. Each element was scored on a scale of 1 to 10 with 10 being the most accomplished in that area (results seen in Figure 3). This initial sample included four students and their work (see Table 4 for list of papers reviewed for assessment).
Figure 3: Urban Administration Elective Emphasis Assessment Pilot
0 1 2 3 4 5 6 7 8 9 10
Ethics
Roles
Communicating
Civic Engagement
Leading and managing
Finance
Human Resources
Intergovernmental Relations
Pilot Assessment of Urban AdministrationElective Emphasis
A B C D
9 | P a g e
What is immediately apparent is that some of the 8 elements cannot be assessed based upon the work available and so, in the future, a more prescriptive approach to selecting products for the eportfolio will have to utilized if this process is used for elective emphases assessment. However, given the results available and seen in Figure 3, it is clear that students have made progress in developing expertise in the areas that could be assessed.
One exception is that of developing strategies for civic engagement; there was little work included in this area. More explicit assignments in civic engagement will need to be incorporated into the curriculum, a decision that had already been made based upon other factors. More work will have to be done on how to assess this and the other elective emphases.
Table 4: Selected Urban Administration Elective Emphasis Papers Used for Pilot Assessment
Selected Papers, Presentations and Projects
Analysis of Fresno County Budget
Book review of ES Savas 2005 book on Privatization in the City
Briefing on meeting of SF Police Commission
Charleston, South Carolina: City Policy & Management Overview paper
City of Modesto Economic Development efforts
Critical review of Bay Area police department websites
East LA Stakeholder analysis— prison siting case
Economic Development—Tools for Public Administrators presentation ppt
Emergency Medical Services. Urban services fact sheet developed as part of a group project
Essay on the book, “Adapted City”
Increasing Moderate Income Housing in SF policy analysis
Information technology in local government finance research paper
Interview with City of Berkeley Redevelopment head
Kings County budget analysis presentation ppt
Leadership case study: Corey Booker, Mayor of Newark, NJ
Orderly growth in Solano County policy brief
Ottawa’s transit system presentation ppt
PA 705 / 706 paper. The Oakland Enterprise Zone and Unemployment Rate: How an economic development program can affect the unemployment rate. Statistical analysis with control data from other cities
Program Budget—Nassau County (team project)
Ranked choice voting presentation in 800 presentation ppt
Research paper on Pittsburgh government, policy issues, service delivery and leadership.
Scanlon interview—head of SAM Trans transit organization. Well written
Spatial Analysis of Community Development Block Grant Public Services Programs and Economic Self-Sufficiency in San Francisco. Statistical analysis from 705 706 sequence.
Summary of article “Professional Management and Service Levels in Small U.S. Communities”
10 | P a g e
Exit Survey Results Finally, the results of the exit survey are seen in Appendix I. In general, the 2012-2013 rankings of MPA program features were improved over last year’s results (which had gone down from the previous year so a more accurate statement is the results regained their previous high scores. Last year, we believed the drop were a result of the unrest among students about being asked to pay higher fees in order to stay at the Downtown Center. If this is true, then these could be attributed to a settling down of the students and more focus upon their academic program. Improving knowledge in public administration in general as well as in a specific subfield are the two highest scoring areas. These are followed by size of classes conducive to learning, improving professional skills, quality of elective courses, and perceived improvement in quality of writing skills.
Once again, the lowest scoring areas are the program’s ability to improve the student’s computer skills and their view on career assistance resources. The faculty believe that most students now come into the program with high levels of computer skills and so, the ability to increase those even more is difficult. The faculty have discussed these two areas to a great extent and have subsequently developed several strategies to improve service in these areas.
The other continually low scoring area was advising, which has now risen substantially.
Results for our summary questions indicate a very high proportion of students continue to believe the program has resulted in their feeling prepared for entry and mid-career level jobs and has put them on track to achieve their career goals. In addition, we have an explicit goal of providing a combination of theory and practice across our curriculum; these results indicate students continue to believe we are achieving that goal (4.42 average in 2011-2012 on a 7 point scale where 1 equals Theory and 7 equals Practice; 4 is a perfect balance between the two).
Changes As A Result of Assessment Changes being made include:
Two changes being made as a result of the data seen in our assessments is the incorporation of more explicit and formal training in doing oral presentations and team work projects. Students are overall, doing well in these areas but there are lingering issues and more formal training is required.
The team work rubric and instructions are being improved in order to ensure higher validity.
Eportfolio requirements are being revised so that they can be better used to assess our elective emphases. In addition, we are contemplating having each student complete a separate reflective paper just on the elective emphasis so that we can better understand what they have learned in that portion of the program.
Beginning in Fall 2013, our new curriculum with civic engagement strategies built in will be implemented for all students, not just those in urban administration.
A faculty member is being assigned to coordinate career activities and resources so that consistent workshops are offered to students and we can ensure any gaps are being filled.
New 1 unit courses and a series of workshops on specific software and computer tasks are being implemented beginning in the fall to address the issue of computer skills.
11 | P a g e
Finally, the Program will be undertaking a comprehensive review of all our rubrics; they have been developed in a very incremental fashion and need some standardizing.
Conclusions Program faculty will continue to evaluate our progress in helping students achieve our learning goals. When we detect patterns indicating improvements are needed, we make changes in our program. We will be working on our assessment processes next year in more depth, as we review all our rubrics and implement our schedule to evaluating all elective emphases.
12 | P a g e
Appendix I: Student Exit Survey Assessment Results, 2003 - 2013
2002-2003
2003-2004
2004-2005
2005-2006
2006-2007
2007-2008
2008-2009
2009-2010
2010-2011
SM Cohort
2011-2012
2012-2013 Total
n = 15 n = 28 n = 41 n=48 n=32 n=34 n=13 n=20
n= 53 n=15 n=16 n=32 n=296
Evaluations (Ranked By 2010-2011 Results) (scale is 1 to 7 where 7 is the best)
Improve Knowledge of General PA 6.4 6.5 6.5 6.5 6.5 6.5 6.5 6.4 6.7 6.7 6.4 6.69 6.5 + Improve Knowledge of Specific Area 5.5 6.2 5.9 6.3 6.3 6.2 6.3 6.45 6.6 6.4 6.3 6.58 6.3 + Size of Classes Conducive to Learning 6.0 5.9 5.5 5.7 5.4 5.9 5.9 6 6.6 6.9 6.0 6.41 6.0 + Improve Professional Skills 5.7 6.0 6.0 5.9 6.0 6.0 6.3 6.85 6.2 6.1 6.1 6.38 6.1 + Quality of Elective Classes 5.9 6.4 5.9 5.8 6.2 5.8 5.9 6.15 6.4 6.1 6.1 6.22 6.1 + Help to Improve Writing 4.9 5.7 5.6 5.3 5.8 5.7 6.2 6.1 6.2 6.3 6.2 6.13 5.8
Ability to Schedule Core Classes Sufficient 6.1 5.6 5.5 5.6 5.0 5.1 5.9 5.5 6.3 6.7 5.1 6.06 5.6 +++ Quality of Faculty 5.9 6.0 5.8 5.9 5.7 5.7 6.2 5.85 6.2 5.9 6.1 5.91 5.9
Quality of Core Classes 5.6 5.8 5.7 5.6 5.3 5.5 5.9 5.85 6.1 5.9 5.9 5.84 5.7 Access to Courses Sufficient
to My Needs 5.8 5.3 5.4 5.3 4.9 5.0 5.6 5.05 6.0 6.4 5.3 5.78 5.4 + Help to Improve Presentations 5.4 5.5 5.6 5.7 6.0 5.5 5.9 5.7 6.1 6.1 5.3 5.69 5.7 + Ability to Schedule Electives Sufficient 5.8 5.6 5.4 5.6 5.4 5.4 5.9 5.1 6.2 6.6 4.9 5.62 5.6 ++ Library Resources Sufficient to My Needs 5.1 5.1 5.0 4.9 5.0 5.1 5.5 5.75 5.7 6.1 5.4 5.59 5.3 + Advising Sufficient to My Needs 5.6 5.2 4.7 4.8 4.8 4.9 5.6 5.1 5.3 4.5 5.3 5.58 5.1 + Help to Improve Ability to Work in Teams - 6.0 5.3 5.6 5.8 5.8 5.7 5.85 5.9 5.7 5.6 5.52 5.7
Quality of Outside Electives 5.8 5.3 5.4 5.2 5.6 5.1 5.5 5.33 5.8 n/a 5.9 5.31 5.4
13 | P a g e
Computer Resources Sufficient to My Needs 5.6 5.7 5.3 5.0 5.3 5.1 5.3 4.85 5.2 5.5 5.3 5.30 5.2
Improve Computer Skills 4.9 4.8 4.6 4.4 5.1 4.7 5.4 4.7 4.9 5.1 4.1 4.59 4.7 + Career Assistance Resources Sufficient 4.5 4.8 4.0 3.2 4.2 4.1 5.0 4.3 4.6 4.2 4.2 4.96 4.3 ++
+ = increase / ++ = increase of at least 0.5 / +++ = increase of at least 1.0
Summary Measures (scale is 1 to 7 where 7 is the best)
MPA Has Prepared Me Well for Job / Career 5.9 5.8 5.9 6.0 5.9 6.0 6.0 6.1 6.3 6.20 5.7 6.2 6.0 ++ As Result of MPA, I Feel Qualified for Entry Level Job 6.2 6.5 6.3 6.5 6.3 6.6 6.4 6.8 6.6 6.73 6.0 6.5 6.5 ++ As Result of MPA, I Feel Qualified for Mid-Level Job 6.1 6.0 5.9 5.8 5.7 6.0 6.0 6.4 6.4 6.47 5.4 6.1 6.0 ++ Balance Between Theory (1) and Practice (7) Achieved (4 = balance; 1=Theory; 7=Practice) 4.4 4.2 4.1 4.4 3.8 4.2 4.58 4.2 4.2 4.33 4.31 4.42 4.22
I Believe I am on Right Career Track Compared to Beginning of Program-- Yes 100.0% 96.0% 100.0% 95.2% 100% 100% 100% 100% 100% 80% 100% 100% 99.0%
14 | P a g e
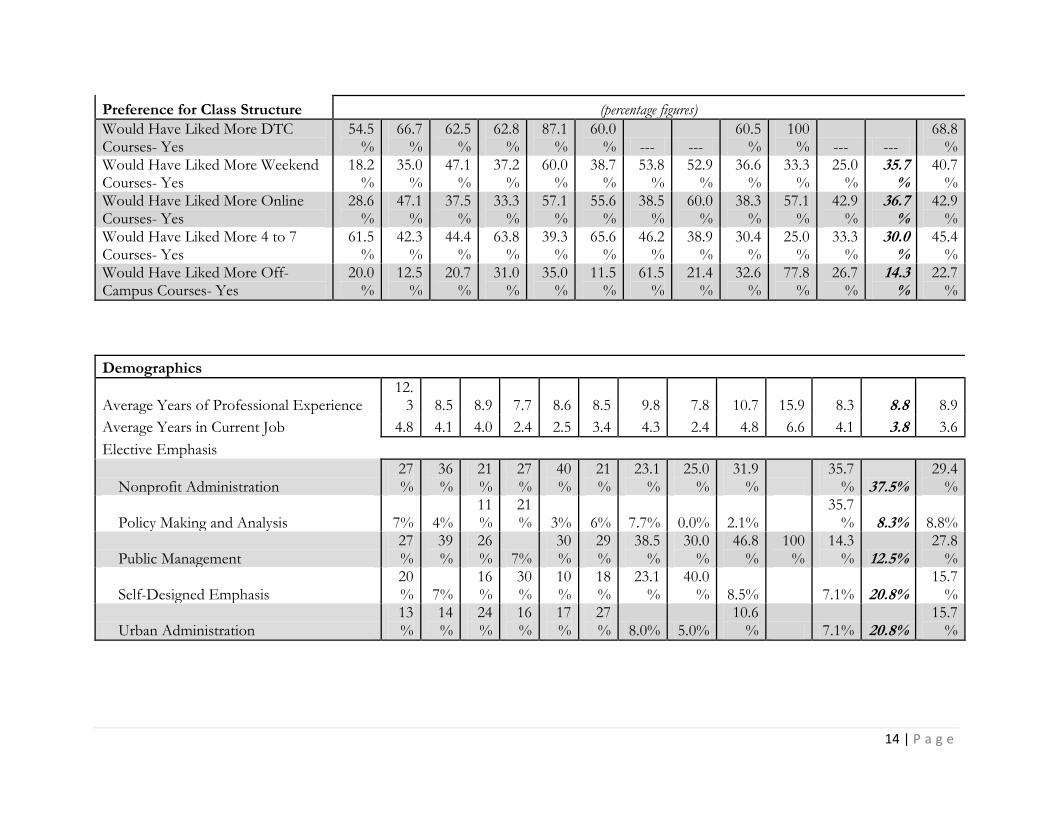
Preference for Class Structure (percentage figures)
Would Have Liked More DTC Courses- Yes
54.5%
66.7%
62.5%
62.8%
87.1%
60.0% --- ---
60.5%
100% --- ---
68.8%
Would Have Liked More Weekend Courses- Yes
18.2%
35.0%
47.1%
37.2%
60.0%
38.7%
53.8%
52.9%
36.6%
33.3%
25.0%
35.7%
40.7%
Would Have Liked More Online Courses- Yes
28.6%
47.1%
37.5%
33.3%
57.1%
55.6%
38.5%
60.0%
38.3%
57.1%
42.9%
36.7%
42.9%
Would Have Liked More 4 to 7 Courses- Yes
61.5%
42.3%
44.4%
63.8%
39.3%
65.6%
46.2%
38.9%
30.4%
25.0%
33.3%
30.0%
45.4%
Would Have Liked More Off-Campus Courses- Yes
20.0%
12.5%
20.7%
31.0%
35.0%
11.5%
61.5%
21.4%
32.6%
77.8%
26.7%
14.3%
22.7%
Demographics
Average Years of Professional Experience 12.
3 8.5 8.9 7.7 8.6 8.5 9.8 7.8 10.7 15.9 8.3 8.8 8.9
Average Years in Current Job 4.8 4.1 4.0 2.4 2.5 3.4 4.3 2.4 4.8 6.6 4.1 3.8 3.6
Elective Emphasis
Nonprofit Administration 27%
36%
21%
27%
40%
21%
23.1%
25.0%
31.9%
35.7% 37.5%
29.4%
Policy Making and Analysis 7% 4% 11%
21% 3% 6% 7.7% 0.0% 2.1%
35.7% 8.3% 8.8%
Public Management 27%
39%
26% 7%
30%
29%
38.5%
30.0%
46.8%
100%
14.3% 12.5%
27.8%
Self-Designed Emphasis 20% 7%
16%
30%
10%
18%
23.1%
40.0% 8.5% 7.1% 20.8%
15.7%
Urban Administration 13%
14%
24%
16%
17%
27% 8.0% 5.0%
10.6% 7.1% 20.8%
15.7%