Embed Size (px)
Citation preview

5Using a Single-Nucleotide Polymorphism to Predict Bitter-Tasting Ability
Copyright © 2006, Dolan DNA Learning Center, Cold Spring Harbor Laboratory. All rights reserved.
STUDENT LAB INSTRUCTIONS
INTRODUCTION
Mammals are believed to distinguish only five basic tastes: sweet, sour,bitter, salty, and umami (the taste of monosodium glutamate). Tasterecognition is mediated by specialized taste cells that communicate withseveral brain regions through direct connections to sensory neurons.Taste perception is a two-step process. First, a taste molecule binds to aspecific receptor on the surface of a taste cell. Then, the taste cellgenerates a nervous impulse, which is interpreted by the brain. Forexample, stimulation of “sweet cells” generates a perception of sweetnessin the brain. Recent research has shown that taste sensation ultimately isdetermined by the wiring of a taste cell to the cortex, rather than the typeof molecule bound by a receptor. So, for example, if a bitter taste receptoris expressed on the surface of a “sweet cell,” a bitter molecule is perceivedas tasting sweet.
A serendipitous observation at DuPont, in the early 1930s, first showeda genetic basis to taste. Arthur Fox had synthesized somephenylthiocarbamide (PTC), and some of the PTC dust escaped into theair as he was transferring it into a bottle. Lab-mate C.R. Noller complainedthat the dust had a bitter taste, but Fox tasted nothing—even when hedirectly sampled the crystals. Subsequent studies by Albert Blakeslee, atthe Carnegie Department of Genetics (the forerunner of Cold SpringHarbor Laboratory), showed that the inability to taste PTC is a recessivetrait that varies in the human population.
Bitter-tasting compounds are recognized by receptor proteins on thesurface of taste cells. There are approximately 30 genes for differentbitter taste receptors in mammals. The gene for the PTC taste receptor,TAS2R38, was identified in 2003. Sequencing identified three nucleotide
Albert Blakeslee using a votingmachine to tabulate results of
taste tests at the AAASConvention, 1938. (Courtesy Cold
Spring Harbor LaboratoryResearch Archives)

Learning CenterDNA KITS
positions that vary within the human population—each variable positionis termed a single nucleotide polymorphism (SNP). One specificcombination of the three SNPs, termed a haplotype, correlates moststrongly with tasting ability.
Analogous changes in other cell-surface molecules influence the activityof many drugs. For example, SNPs in serotonin transporter and receptorgenes predict adverse responses to anti-depression drugs, includingPROZAC® and Paxil®.
In this experiment, a sample of human cells is obtained by salinemouthwash. DNA is extracted by boiling with Chelex resin, which bindscontaminating metal ions. Polymerase chain reaction (PCR) is then usedto amplify a short region of the TAS2R38 gene. The amplified PCR productis digested with the restriction enzyme HaeIII, whose recognitionsequence includes one of the SNPs. One allele is cut by the enzyme, andone is not—producing a restriction fragment length polymorphism(RFLP) that can be separated on a 2% agarose gel.
Each student scores his or her genotype, predicts their tasting ability, andthen tastes PTC paper. Class results show how well PTC tasting actuallyconforms to classical Mendelian inheritance, and illustrates the modernconcept of pharmacogenetics—where a SNP genotype is used to predictdrug response.
Blakeslee, A.F. (1932). Genetics of Sensory Thresholds: Taste for Phenyl Thio Carbamide.Proc. Natl. Acad. Sci. U.S.A. 18:120-130.
Fox, A.L. (1932). The Relationship Between Chemical Constitution and Taste. Proc. Natl.Acad. Sci. U.S.A. 18:115-120.
Kim, U., Jorgenson, E., Coon, H., Leppert, M., Risch, N., and Drayna, D. (2003). PositionalCloning of the Human Quantitative Trait Locus Underlying Taste Sensitivity toPhenylthiocarbamide. Science 299:1221-1225.
Mueller, K.L., Hoon, M.A., Erlenbach, I., Chandrashekar, J., Zuker, C.S., and Ryba, N.J.P. (2005).The Receptors and Coding Logic for Bitter Taste. Nature 434:225-229.
Scott, K. (2004). The Sweet and the Bitter of Mammalian Taste. Current Opin. Neurobiol.14:423-427.
Using a Single-Nucleotide Polymorphism to Predict Bitter-Tasting Ability
Copyright © 2006, Dolan DNA Learning Center, Cold Spring Harbor Laboratory. All rights reserved.
6

7Using a Single-Nucleotide Polymorphism to Predict Bitter-Tasting Ability
– +
LAB FLOW
I. ISOLATE DNA BY SALINE MOUTHWASH
II. AMPLIFY DNA BY PCR
III. DIGEST PCR PRODUCTS WITH HaeIII
IV. ANALYZE PCR PRODUCTS BY GEL ELECTROPHORESIS

Learning CenterDNA KITS
Using a Single-Nucleotide Polymorphism to Predict Bitter-Tasting Ability
Copyright © 2006, Dolan DNA Learning Center, Cold Spring Harbor Laboratory. All rights reserved.
8
Your teacher may instruct you tocollect a small sample of cells toobserve under a microscope.
Before pouring off supernatant,check to see that pellet is firmlyattached to tube. If pellet is looseor unconsolidated, carefully usemicropipet to remove as muchsaline solution as possible.
METHODS
I. ISOLATE DNA BY SALINE MOUTHWASH
1. Use a permanent marker to label a 1.5-mL tube and paper cup withyour assigned number.
2. Pour saline solution into your mouth, and vigorously rinse your cheekpockets for 30 seconds.
3. Expel saline solution into the paper cup.
4. Swirl the cup gently to mix cells that may have settled to the bottom.Use a micropipet with a fresh tip to transfer 1000 µL of the solutioninto your labeled 1.5-mL microcentrifuge tube.
5. Place your sample tube, along with other student samples, in abalanced configuration in a microcentrifuge, and spin for 90 secondsat full speed.
6. Carefully pour off supernatant into the paper cup. Try to remove mostof the supernatant, but be careful not to disturb the cell pellet at thebottom of the tube. (The remaining volume will reach approximatelythe 0.1 mark of a graduated tube.)
7. Set a micropipet to 30 µL. Resuspend cells in the remaining saline bypipetting in and out. Work carefully to minimize bubbles.
8. Withdraw 30 µL of cell suspension, and add it to a PCR tubecontaining 100 µL of Chelex®. Label the cap and side of the tubewith your assigned number.
9. Place your PCR tube, along with other student samples, in a thermalcycler that has been programmed for one cycle of the followingprofile. The profile may be linked to a 4°C hold program. If you areusing a 1.5-mL tube, use a heat block or boiling water bath.
Boiling step: 99°C 10 minutes
10. After boiling, vigorously shake the PCR tube for 5 seconds.
Reagents (at each student station)
0.9% saline solution, 10 mL10% Chelex®, 100 µL (in 0.2- or 0.5-mL PCR
tube)
Supplies and Equipment
Permanent markerPaper cupMicropipets and tips (10–1000 µL)1.5-mL microcentrifuge tubesMicrocentrifuge tube rackMicrocentrifuge adaptersMicrocentrifugeThermal cycler (or water bath or heat
block)Container with cracked or crushed iceVortexer (optional)
Food particles will not resuspend.
The near-boiling temperature lysesthe cell membrane, releasing DNAand other cell contents.
Alternatively, you may add the cellsuspension to Chelex in a 1.5-mLtube and incubate in a boilingwater bath or heat block.

9Using a Single-Nucleotide Polymorphism to Predict Bitter-Tasting Ability
Copyright © 2006, Dolan DNA Learning Center, Cold Spring Harbor Laboratory. All rights reserved.
11. Place your tube, along with other student samples, in a balancedconfiguration in a microcentrifuge, and spin for 90 seconds at fullspeed. If your sample is in a PCR tube, one or two adapters will beneeded to spin the tube in a microcentrifuge designed for 1.5-mL tubes.
12. Use a micropipet with a fresh tip to transfer 30 µL of the clearsupernatant into a clean 1.5-mL tube. Be careful to avoid pipettingany cell debris and Chelex® beads.
13. Label the cap and side of the tube with your assigned number. Thissample will be used for setting up one or more PCR reactions.
14. Store your sample on ice or at –20°C until you are ready to continuewith Part II.
II. AMPLIFY DNA BY PCR
1. Obtain a PCR tube containing a Ready-To-Go™ PCR Bead. Label withyour assigned number.
2. Use a micropipet with a fresh tip to add 22.5 µL of PTC primer/loadingdye mix to the tube. Allow the bead to dissolve for a minute or so.
3. Use a micropipet with a fresh tip to add 2.5 µL of your cheek cell DNA(from Part I) directly into the primer/loading dye mix. Insure that nocheek cell DNA remains in the tip after pipeting.
4. Store your sample on ice until your class is ready to begin thermal cycling.
5. Place your PCR tube, along with other student samples, in a thermalcycler that has been programmed to the following profile for 30cycles if you use ethidium bromide or 35 cycles if you are usingCarolinaBLU™. The profile may be linked to a 4°C hold program aftercycling is completed.
Denaturing step: 94°C 30 seconds Annealing step: 64°C 45 secondsExtending step: 72°C 45 seconds
6. After cycling, store the amplified DNA on ice or at –20°C until you areready to continue with Part III.
To use adapters, “nest” the sampletube within sequentially largertubes: 0.2 mL within 0.5 mL within1.5 mL. Remove caps from tubesused as adapters.
The primer/loading dye mix will turnpurple as the PCR bead dissolves.
Reagents (at each student station)
*Cheek cell DNA, 2.5 µL (from Part I)*PTC primer/loading dye mix, 22.5 µLReady-To-GoTM PCR beads (in 0.2-mL or
0.5-mL PCR tube)
Shared Reagent
Mineral oil, 5 mL (depending on thermalcycler)
*Store on ice
Supplies and Equipment
Permanent markerMicropipet and tips (1–100 µL)Microcentrifuge tube rackThermal cycler Container with cracked or crushed ice
If the reagents become splatteredon the wall of the tube, pool themby pulsing in a microcentrifuge orby sharply tapping the tubebottom on the lab bench.
If your thermal cycler does nothave a heated lid: Prior to thermalcycling, you must add a drop ofmineral oil on top of your PCRreaction. Be careful not to touchthe dropper tip to the tube orreaction, or the oil will becontaminated with your sample.

Learning CenterDNA KITS
Using a Single-Nucleotide Polymorphism to Predict Bitter-Tasting Ability
Copyright © 2006, Dolan DNA Learning Center, Cold Spring Harbor Laboratory. All rights reserved.
10
III. DIGEST PCR PRODUCTS WITH HaeIII
1. Label a 1.5-mL tube with your assigned number and with a “U”(undigested).
2. Use a micropipet with a fresh tip to transfer 10 µL of your PCRproduct to the “U” tube. Store this sample on ice until you are readyto begin Part IV.
3. Use a micropipet with a fresh tip to add 1 µL of restriction enzymeHaeIII directly into the PCR product remaining in the PCR tube. Labelthis tube with a “D” (digested).
4. Mix and pool reagents by pulsing in a microcentrifuge or by sharplytapping the tube bottom on the lab bench.
5. Place your PCR tube, along with other student samples, in a thermalcycler that has been programmed for one cycle of the followingprofile. The profile may be linked to a 4°C hold program.
Digesting step: 37°C 30 minutes
6. Store your sample on ice or in the freezer until you are ready to beginPart IV.
IV. ANALYZE PCR PRODUCTS BY GEL ELECTROPHORESIS
1. Seal the ends of the gel-casting tray with masking tape, and insert awell-forming comb.
The DNA in this tube will not bedigested with the restrictionenzyme HaeIII.
If you used mineral oil during PCR,pierce your pipet tip through themineral oil layer to withdraw thePCR product in Step 2 and to addthe HaeIII enzyme in Step 3.
Reagents (at each student station)
*PCR product (from Part II), 25 µL
Shared Reagent
*Restriction enzyme HaeIII, 10 µL
*Store on ice
Supplies and Equipment
Permanent marker1.5-mL microcentrifuge tubesMicrocentrifuge tube rack Micropipet and tips (1–20 µL)Thermal cycler (or water bath or heat
block)Container with cracked or crushed ice
Reagents (at each student station)
*Undigested PCR product (from Part III), 10 µL
*HaeIII-digested PCR product (from Part III), 16 µL
Shared Reagents
*pBR322/BstNI marker2% agarose in 1× TBE, 50 mL1× TBE, 300 mL Ethidium bromide (1 µg/mL), 250 mL orCarolinaBLU™ Gel and Buffer Stain, 7 mLCarolinaBLU™ Final Stain, 375 mL
*Store on ice
Supplies and Equipment
Micropipet and tips (1–20 µL)Microcentrifuge tube rackGel electrophoresis chamberPower supplyStaining traysLatex glovesUV transilluminator (for use withethidium bromide)
White light transilluminator (for use withCarolinaBLU™)
Digital or instant camera (optional) Water bath (60°C)Container with cracked or crushed ice
Alternatively, you may incubate thereaction in a 37°C water bath orheat block. Thirty minutes is theminimum time needed forcomplete digestion. If timepermits, incubate reactions for 1 ormore hours.
2. Pour 2% agarose solution to a depth that covers about 1/3 the heightof the open teeth of the comb.
3. Allow the gel to solidify completely. This takes approximately 20minutes.
4. Place the gel into the electrophoresis chamber, and add enough 1×TBE buffer to cover the surface of the gel.
5. Carefully remove the comb, and add additional 1× TBE buffer to justcover and fill in wells—creating a smooth buffer surface.
6. Use a micropipet with a fresh tip to load 20 µL of pBR322/BstNI sizemarkers into the far left lane of the gel.
7. Use a micropipet with a fresh tip to add 10 µL of the undigested (U)and 16 µL of the digested (D) sample/loading dye mixture intodifferent wells of a 2% agarose gel, according to the diagram below.
8. Run the gel at 130 V for approximately 30 minutes. Adequateseparation will have occurred when the cresol red dye front hasmoved at least 50 mm from the wells.
9. Stain the gel using ethidium bromide or CarolinaBLU™:
a. For ethidium bromide, stain 10–15 minutes. Decant stain back intothe storage container for reuse, and rinse the gel in tap water. Usegloves when handling ethidium bromide solution and stained gels oranything that has ethidium bromide on it. Ethidium bromide is aknown mutagen, and care should be taken when using and disposingof it.
b. For CarolinaBLU™, follow directions in the Instructor Planningsection.
10. View the gel using transillumination, and photograph it using adigital or instant camera.
11Using a Single-Nucleotide Polymorphism to Predict Bitter-Tasting Ability
Copyright © 2006, Dolan DNA Learning Center, Cold Spring Harbor Laboratory. All rights reserved.
Transillumination, where the lightsource is below the gel, increasesbrightness and contrast.
Destaining the gel for 5–10minutes in tap water leechesunbound ethidium bromide fromthe gel, decreasing backgroundand increasing contrast of thestained DNA.
Avoid pouring an overly thick gel,which is more difficult to visualize.The gel will become cloudy as itsolidifies.
Do not add more buffer thannecessary. Too much buffer abovethe gel channels electrical currentover the gel, increasing runningtime.
100-bp ladder may also be used asa marker.
If you used mineral oil during PCR,pierce your pipet tip through themineral oil layer to withdraw thePCR products. Do not pipet anymineral oil.
Expel any air from the tip beforeloading. Be careful not to push thetip of the pipet through thebottom of the sample well.
MARKER STUDENT 1 STUDENT 2 STUDENT 3pBR322/ U D U D U D
BstNI

Learning CenterDNA KITS
Using a Single-Nucleotide Polymorphism to Predict Bitter-Tasting Ability
Copyright © 2006, Dolan DNA Learning Center, Cold Spring Harbor Laboratory. All rights reserved.
12
BIOINFORMATICS
For a better understanding of the experiment, do the following bioinformaticsexercises before you analyze your results.
Biological information is encoded in the nucleotide sequence of DNA.Bioinformatics is the field that identifies biological information in DNAusing computer-based tools. Some bioinformatics algorithms aid theidentification of genes, promoters, and other functional elements of DNA.Other algorithms help determine the evolutionary relationships betweenDNA sequences.
Because of the large number of tools and DNA sequences available on theInternet, experiments done in silico (in silicon, or on the computer) nowcomplement experiments done in vitro (in glass, or test tube). Thismovement between biochemistry and computation is a key feature ofmodern biological research.
In Part I, you will use the Basic Local Alignment Search Tool (BLAST) toidentify sequences in biological databases and to make predictions aboutthe outcome of your experiments. In Part II, you will find and copy thehuman PTC taster and non-taster alleles. In Part III, you will discover thechromosome location of the PTC tasting gene. In Part IV, you will explorethe evolutionary history of the gene.
NOTE: The links in these bioinformatics exercises were correct at the timeof printing. However, links and labels within the NCBI Internet sitechange occasionally. When this occurs, you can find updated exercises athttp://bioinformatics.dnalc.org.
I. Use BLAST to Find DNA Sequences in Databases (Electronic PCR)
1. Initiate a BLAST search.
a. Open the Internet site of the National Center for BiotechnologyInformation (NCBI) www.ncbi.nlm.nih.gov.
b. Click on BLAST in the top speed bar.
c. Click on the link nucleotide BLAST under the heading Basic BLAST.
d. Enter the sequences of the primers into the Search window. Theseare the query sequences.
e. Omit any non-nucleotide characters from the window, becausethey will not be recognized by the BLAST algorithm.
f. Under Choose Search Set, select the Nucleotide collection (nr/nt)database from the drop-down menu.
The following primer set was used in the experiment:
5’-CCTTCGTTTTCTTGGTGAATTTTTGGGATGTAGTGAAGAGGCGG-3’ (Forward Primer)5'-AGGTTGGCTTGGTTTGCAATCATC-3' (Reverse Primer)

13Using a Single-Nucleotide Polymorphism to Predict Bitter-Tasting Ability
Copyright © 2006, Dolan DNA Learning Center, Cold Spring Harbor Laboratory. All rights reserved.
g. Under Program Selection, optimize for somewhat similar sequencesby selecting blastn.
h. Click on BLAST! and the query sequences are sent to a server at theNational Center for Biotechnology Information in Bethesda,Maryland. There, the BLAST algorithm will attempt to match theprimer sequences to the millions of DNA sequences stored in itsdatabase. While searching, a page showing the status of yoursearch will be displayed until your results are available. This maytake only a few seconds, or more than a minute if a lot of othersearches are queued at the server.
2. The results of the BLAST search are displayed in three ways as youscroll down the page:
a. First, a graphical overview illustrates how significant matches, orhits, align with the query sequence. Matches of differing lengthsare coded by color.
b. This is followed by a list of significant alignments, or hits, with linksto Accession information.
c. Next, is a detailed view of each primer sequence (query) aligned tothe nucleotide sequence of the search hit (subject). Notice that amatch to the forward primer (nucleotides 1–42), and a match tothe reverse primer (nucleotides 44–68) are within the sameAccession. Also notice that position 43 of the forward primer ismissing. What does this mean?
3. Determine the predicted length of the product that the primer setwould amplify in a PCR reaction (in vitro):
a. In the list of significant alignments, notice the E-values in thecolumn on the right. The Expectation or E-value is the number ofalignments with the query sequence that would be expected tooccur by chance in the database. The lower the E-value, the higherthe probability that the hit is related to the query. What does the E-value of 6e-12 mean?
b. Note the names of any significant alignments that have E-valuesless than 0.1. Do they make sense? What do they have in common?
c. Scroll down to the Alignments section to see exactly where the twoprimers have landed in a subject sequence.
d. The lowest and highest nucleotide positions in the subjectsequence indicate the borders of the amplified sequence.Subtracting one from the other gives the difference between thetwo coordinates.
e. However, the actual length of the fragment includes both ends, soadd 1 nucleotide to the result to determine the exact length of thePCR product amplified by the two primers.

Learning CenterDNA KITS
Using a Single-Nucleotide Polymorphism to Predict Bitter-Tasting Ability
Copyright © 2006, Dolan DNA Learning Center, Cold Spring Harbor Laboratory. All rights reserved.
14
II. Find and Copy the Human (Homo sapiens) PTC Taster andNon-taster Alleles
1. In the list of significant alignments, select the hit containing thehuman taster allele from among those with the lowest E-values.
2. Click on the Accession link at the left to open the sequencedatasheet for this hit.
3. At the top of the report, note basic information about the sequence,including its basepair length, database accession number, source, andreferences.
4. In the middle section of the report, note annotations of gene andregulatory features, with their beginning and ending nucleotide positions(xx .. xx). Identify the feature(s) contained between the nucleotidepositions identified by the primers, as determined in 3.d above.
5. The bottom section of the report lists the entire nucleotide sequenceof the gene or DNA sequence that contains the PCR product.Highlight all the nucleotides between the beginning of the forwardprimer and end of reverse primer. Paste this sequence into a textdocument. Then, delete all non-nucleotide characters and spaces. Thisis the amplicon or amplified product.
6. Repeat Steps 1–5 to copy the human non-taster allele.
III. Use Map Viewer to Determine the Chromosome Location of theTAS2R38 Gene
1. Return to the NCBI home page, then click on Map Viewer located inthe Hot Spots column on the right.
2. Find Homo sapiens (humans) in the table to the right and click on the“B” icon under the Tools header. If more than one build is displayed,select the one with the highest number, as this will be the mostrecent version.
3. Enter the primer sequences into the search window. Omit any non-nucleotide characters from the window, because they will not berecognized by the BLAST algorithm.
4. Select BLASTN from the drop-down menu under Program and click onBegin Search.
5. Click on View report to retrieve the results.
6. Click on [Human genome view] in the list of Other reports at the top ofthe page to see the chromosome location of the BLAST hit. On whatchromosome have you landed?
7. Click on the marked chromosome number to move to the TAS2R38 locus.
8. Click on the small blue arrow labeled Genes seq to display genes. TheTAS2R38 gene occupies the whole field of the default view, whichdisplays 1/10,000 of the chromosome. Move the zoom out toggle on the
15Using a Single-Nucleotide Polymorphism to Predict Bitter-Tasting Ability
Copyright © 2006, Dolan DNA Learning Center, Cold Spring Harbor Laboratory. All rights reserved.
left to 1/1000 to see the chromosome region surrounding TAS2R38 andits nearest gene “neighbors.” What genes are found on either side ofTAS2R38? How do their structures differ from TAS2R38? Click on theirnames and follow links for more information about them.
9. Click on the blue arrow at the top of the chromosome image to scrollup the chromosome. Look at each of the genes. Scroll up one morescreen, and look at those genes. What do most of these genes have incommon with TAS2R38, and what can you conclude?
10. Zoom out to view 1/100 of the chromosome for a better view of thisregion.
IV. Use Multiple Sequence Alignment to Explore the Evolution ofTAS2R38 Gene
1. Return to your original BLAST results, or repeat Part I above to obtaina list of significant alignments.
2. Find sequences of the TAS2R38 gene from chimpanzee (Pantroglodytes), bonobo (Pan paniscus), and gorilla. Use only entries listedas “complete cds” (coding sequence). For each, open its Accession link,copy its complete nucleotide sequence from the bottom of thedatasheet, and paste the sequence into a text document.
3. Open the BioServers Internet site at the Dolan DNA Learning Centerwww.bioservers.org.
4. Enter Sequence Server using the button in the left-hand column. (Youcan register if you want to save your work for future reference.)
5. Create PTC gene sequences for comparison:
a. Click on Create Sequence at the top of the page.
b. Copy one of the TAS2R38 sequences (from Step 2 above), and pasteit into the Sequence window. Enter a name for the sequence, andclick OK. Your new sequence will appear in the workspace at thebottom half of the page.
c. Repeat Steps a. and b. for each of the human and primatesequences from Step 2. Also create a sequence for the forwardprimer used in your PCR amplification, and for the amplicon.
6. Compare each of the following sets of sequences:
• Human PTC taster vs. human PTC non-taster vs. 221 basepairamplicon.
• Human PTC taster vs. human PTC non-taster.
• Human PCT taster vs. human PTC non-taster vs. chimpanzee vs.bonobo vs. gorilla.
• Forward primer vs. human PTC taster vs. human PTC non-taster.
a. Click on the Check Box in the left-hand column to compare two ormore sequences.

Learning CenterDNA KITS
Using a Single-Nucleotide Polymorphism to Predict Bitter-Tasting Ability
Copyright © 2006, Dolan DNA Learning Center, Cold Spring Harbor Laboratory. All rights reserved.
16
b. Click on Compare in the grey bar. (The default operation is amultiple sequence alignment, using the CLUSTAL W algorithm.)The checked sequences are sent to a server at Cold Spring HarborLaboratory, where the CLUSTAL W algorithm will attempt to aligneach nucleotide position.
c. The results will appear in a new window. This may take only a fewseconds, or more than a minute if a lot of other searches arequeued at the server.
d. The sequences are displayed in rows of 25 nucleotides. Yellowhighlighting denotes mismatches between sequences or regionswhere only one sequence begins or ends before another.
e. To view the entire gene, enter 1100 as the number of nucleotidesto display per page, then click Redraw.
f. Repeat Steps a–e for each of the four sets of sequences to bealigned.
g. Human PTC taster vs. human PTC non-taster vs. 221 basepairamplicon. What does the initial stretch of highlighted sequencesmean? Where does the amplicon track along with the two humanalleles? At what position in the gene is the SNP examined in theexperiment, and what is the difference between taster and non-taster alleles?
h. Human PTC taster vs. human PTC non-taster. List the nucleotideposition(s) and nucleotide differences of any additional SNP(s).Count triplets of nucleotides from the initial ATG start codon todetermine codon(s) affected by SNP(s). Use a standard geneticcode chart to determine if an amino acid is changed by each SNP.
i. Human PTC taster vs. human PTC non-taster vs. chimpanzee vs.bonobo vs. gorilla. What is the ancestral (original) state of this geneat nucleotide positions 145, 785, and 886? Are other primatestasters or non-tasters, and what does this suggest about thefunction of bitter taste receptors? What patterns do you notice inSNPs at other locations in the gene?
j. Forward primer vs. human PTC taster vs. human PTC non-taster.Where does the primer bind? What discrepancy do you noticebetween the primer sequence and the TAS2R38 gene sequence?Of what importance is this to the experiment?

17Using a Single-Nucleotide Polymorphism to Predict Bitter-Tasting Ability
RESULTS AND DISCUSSION
The following diagram shows how PCR amplification and restrictiondigestion identifies the G-C polymorphism in the TAS2R38 gene. The “C”allele, on the right, is digested by HaeIII and correlates with PTC tasting.
Copyright © 2006, Dolan DNA Learning Center, Cold Spring Harbor Laboratory. All rights reserved.
Learning CenterDNA KITS
Using a Single-Nucleotide Polymorphism to Predict Bitter-Tasting Ability
Copyright © 2006, Dolan DNA Learning Center, Cold Spring Harbor Laboratory. All rights reserved.
18
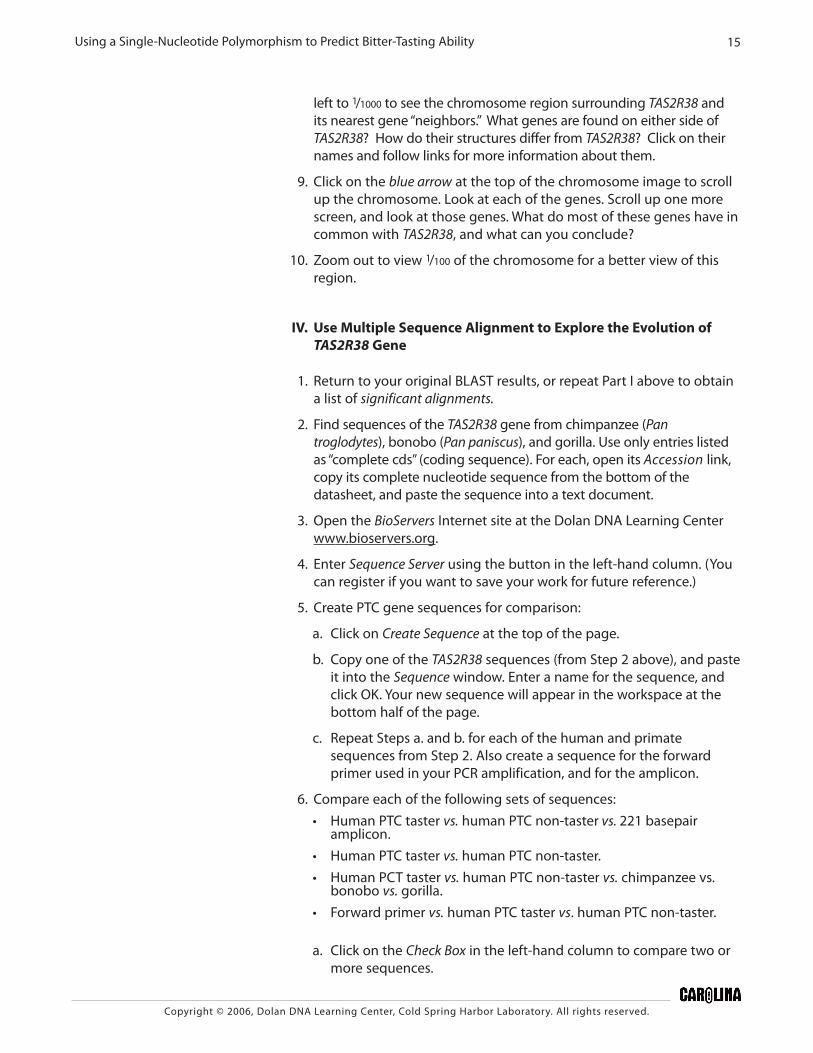
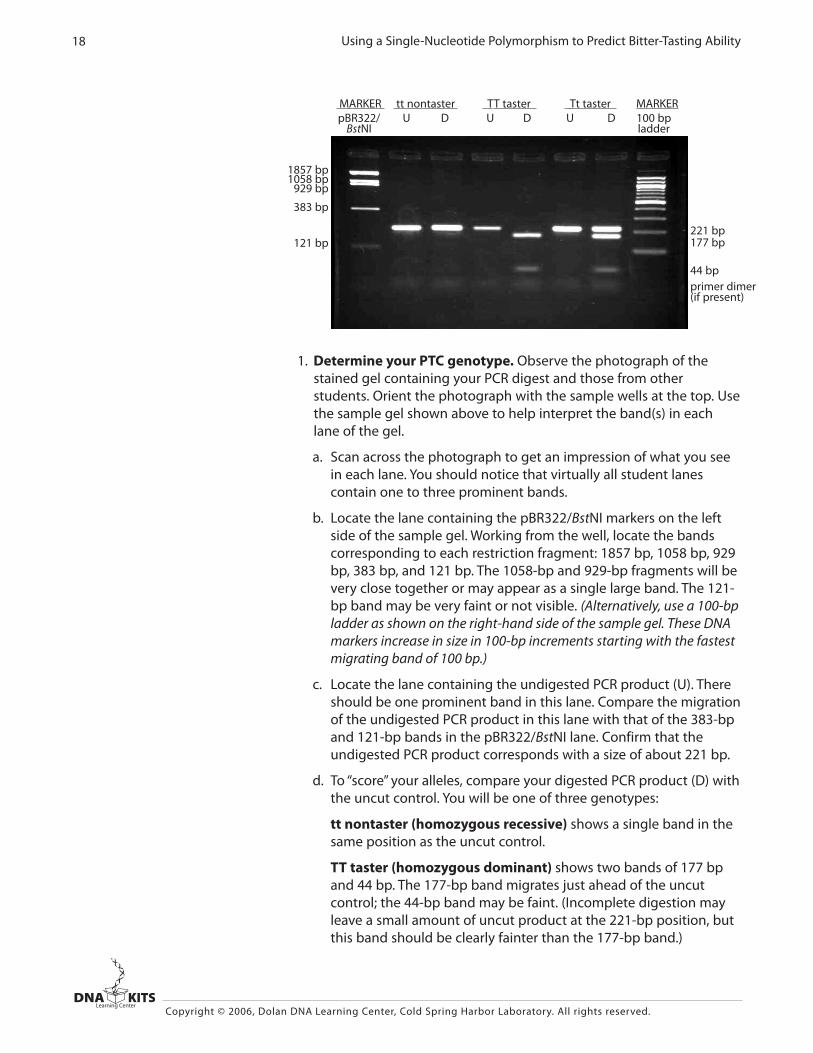
1. Determine your PTC genotype. Observe the photograph of thestained gel containing your PCR digest and those from otherstudents. Orient the photograph with the sample wells at the top. Usethe sample gel shown above to help interpret the band(s) in eachlane of the gel.
a. Scan across the photograph to get an impression of what you seein each lane. You should notice that virtually all student lanescontain one to three prominent bands.
b. Locate the lane containing the pBR322/BstNI markers on the leftside of the sample gel. Working from the well, locate the bandscorresponding to each restriction fragment: 1857 bp, 1058 bp, 929bp, 383 bp, and 121 bp. The 1058-bp and 929-bp fragments will bevery close together or may appear as a single large band. The 121-bp band may be very faint or not visible. (Alternatively, use a 100-bpladder as shown on the right-hand side of the sample gel. These DNAmarkers increase in size in 100-bp increments starting with the fastestmigrating band of 100 bp.)
c. Locate the lane containing the undigested PCR product (U). Thereshould be one prominent band in this lane. Compare the migrationof the undigested PCR product in this lane with that of the 383-bpand 121-bp bands in the pBR322/BstNI lane. Confirm that theundigested PCR product corresponds with a size of about 221 bp.
d. To “score” your alleles, compare your digested PCR product (D) withthe uncut control. You will be one of three genotypes:
tt nontaster (homozygous recessive) shows a single band in thesame position as the uncut control.
TT taster (homozygous dominant) shows two bands of 177 bpand 44 bp. The 177-bp band migrates just ahead of the uncutcontrol; the 44-bp band may be faint. (Incomplete digestion mayleave a small amount of uncut product at the 221-bp position, butthis band should be clearly fainter than the 177-bp band.)
MARKER tt nontaster TT taster Tt taster MARKERpBR322/ U D U D U D 100 bp
BstNI ladder
221 bp177 bp
44 bpprimer dimer(if present)
1857 bp1058 bp
929 bp
383 bp
121 bp

19Using a Single-Nucleotide Polymorphism to Predict Bitter-Tasting Ability
Tt taster (heterozygous) shows three bands that represent bothalleles—221 bp, 177 bp, and 44 bp. The 221-bp band must bestronger than the 177-bp band. (If the 221-bp band is fainter, it isan incomplete digest of TT.)
e. It is common to see a diffuse (fuzzy) band that runs just ahead ofthe 44-bp fragment. This is “primer dimer,” an artifact of the PCRreaction that results from the primers overlapping one anotherand amplifying themselves. The presence of primer dimer, in theabsence of other bands, confirms that the reaction contained allcomponents necessary for amplification.
f. Additional faint bands at other positions occur when the primersbind to chromosomal loci other than the PTC gene and give rise to“nonspecific” amplification products.
2. Determine your PTC phenotype. First, place one strip of controltaste paper in the center of your tongue for several seconds. Note thetaste. Then, remove the control paper, and place one strip of PTC tastepaper in the center of your tongue for several seconds. How wouldyou describe the taste of the PTC paper, as compared to the control:strongly bitter, weakly bitter, or no taste other than paper?
3. Correlate PTC genotype with phenotype. Record class results in thetable below.
According to your class results, how well does TAS2R38 genotypepredict PTC-tasting phenotype? What does this tell you aboutclassical dominant/recessive inheritance?
4. How does the HaeIII enzyme discriminate between the C-Gpolymorphism in the TAS2R38 gene?
5. The forward primer used in this experiment incorporates part of theHaeIII recognition site, GGCC. How is this different from the sequenceof the human TAS2R38 gene? What characteristic of the PCR reactionallows the primer sequence to “override” the natural gene sequence?Draw a diagram to support your contention.
6. Research the terms synonymous and nonsynonymous mutation.Which sort of mutation is the G-C polymorphism in the TAS2R38 gene?By what mechanism does this influence bitter taste perception?
7. Research other mutations in the TAS2R38 gene and how they mayinfluence bitter taste perception.
Copyright © 2006, Dolan DNA Learning Center, Cold Spring Harbor Laboratory. All rights reserved.
Phenotype
Genotype Strong taster Weak taster Nontaster
TT (homozygous)
Tt (heterozygous)
tt (homozygous)

Learning CenterDNA KITS
8. The frequency of PTC nontasting is higher than would be expected ifbitter-tasting ability were the only trait upon which natural selectionhad acted. In 1939, the geneticist R.A. Fisher suggested that the PTCgene is under “balancing” selection—meaning that a possiblenegative effect of losing this tasting ability is balanced by somepositive effect. Under some circumstances, balancing selection canproduce heterozygote advantage, where heterozygotes are fitter thanhomozygous dominant or recessive individuals. What advantagemight this be in the case of PTC?
9. Research how the methods of DNA typing used in this experimentdiffer from those used in forensic crime labs. Focus on: a) type(s) ofpolymorphism used, b) method for separating alleles, and c) methodsfor insuring that samples are not mixed up.
10. What ethical issues are raised by human DNA typing experiments?
Using a Single-Nucleotide Polymorphism to Predict Bitter-Tasting Ability
Copyright © 2006, Dolan DNA Learning Center, Cold Spring Harbor Laboratory. All rights reserved.
20