Embed Size (px)
Citation preview
Genome-Wide Patterns of NucleotidePolymorphism in Domesticated RiceAna L. Caicedo
1[¤a, Scott H. Williamson
2[, Ryan D. Hernandez
2, Adam Boyko
2, Adi Fledel-Alon
2¤b, Thomas L. York
2,
Nicholas R. Polato3
, Kenneth M. Olsen1¤c
, Rasmus Nielsen2¤d
, Susan R. McCouch3
, Carlos D. Bustamante2*
,
Michael D. Purugganan1,4,5*
1 Department of Genetics, North Carolina State University, Raleigh, North Carolina, United States of America, 2 Department of Biological Statistics and Computational
Biology, Cornell University, Ithaca, New York, United States of America, 3 Department of Plant Breeding and Genetics, Cornell University, Ithaca, New York, United States of
America, 4 Department of Biology, New York University, New York, New York, United States of America, 5 Center for Comparative Functional Genomics, New York University,
New York, New York, United States of America
Domesticated Asian rice (Oryza sativa) is one of the oldest domesticated crop species in the world, having fed morepeople than any other plant in human history. We report the patterns of DNA sequence variation in rice and its wildancestor, O. rufipogon, across 111 randomly chosen gene fragments, and use these to infer the evolutionary dynamicsthat led to the origins of rice. There is a genome-wide excess of high-frequency derived single nucleotidepolymorphisms (SNPs) in O. sativa varieties, a pattern that has not been reported for other crop species. We developedseveral alternative models to explain contemporary patterns of polymorphisms in rice, including a (i) selectivelyneutral population bottleneck model, (ii) bottleneck plus migration model, (iii) multiple selective sweeps model, and(iv) bottleneck plus selective sweeps model. We find that a simple bottleneck model, which has been the dominantdemographic model for domesticated species, cannot explain the derived nucleotide polymorphism site frequencyspectrum in rice. Instead, a bottleneck model that incorporates selective sweeps, or a more complex demographicmodel that includes subdivision and gene flow, are more plausible explanations for patterns of variation indomesticated rice varieties. If selective sweeps are indeed the explanation for the observed nucleotide data ofdomesticated rice, it suggests that strong selection can leave its imprint on genome-wide polymorphism patterns,contrary to expectations that selection results only in a local signature of variation.
Citation: Caicedo AL, Williamson SH, Hernandez RD, Boyko A, Fledel-Alon A, et al. (2007) Genome-wide patterns of nucleotide polymorphism in domesticated rice. PLoSGenet 3(9): e163. doi:10.1371/journal.pgen.0030163
Introduction
Domestication is a complex, cumulative evolutionaryprocess in which human use of organisms leads to morpho-logical and/or behavioral changes distinguishing domesti-cated species from their wild ancestors [1,2]. Beginning withCharles Darwin [3,4], there has been strong interest in thestudy of domestication of crop species as a means ofunderstanding the nature of selection. Moreover, domestica-tion and the development of agriculture are arguably themost important technological innovations in human history[5]. Crop plant domestication was the linchpin of theNeolithic Revolution 10,000–12,000 years ago, in whichhunter-gatherer groups transitioned into sedentary agricul-tural societies that gave rise to current human cultures [6].With domestication came the availability of food surpluses,and this agricultural development led to craft specializations,art, religious and social hierarchies, writing, urbanization,and the origin of the state [5].
One of the earliest domesticated crop species is cultivatedAsian rice, Oryza sativa L., which has become the world’s mostwidely grown crop and has also assumed the stature of a keymodel system in plant biology. Rice consumption constitutesabout 20% of the world’s caloric intake, and in Asiancountries, where over half of the world’s population lives,rice often represents over 50% of the calories consumed [7].Because of its small genome size, rice has been the first cropplant to have its whole genome sequenced [8–10].
A wealth of morphological, physiological, and ecological
variation exists within cultivated Asian rice, reflected in the
large number of recognized cultivars or strains [11,12]. Two
main rice varietal groups, O. sativa indica and O. sativa japonica,have been recognized since ancient China [13]. Although
phenotypic distinctions between these groups is not always
straightforward, indica varieties tend to be found throughout
Editor: Gil McVean, University of Oxford, United Kingdom
Received February 20, 2007; Accepted August 6, 2007; Published September 28,2007
A previous version of this article appeared as an Early Online Release on August 6,2007 (doi:10.1371/journal.pgen.0030163.eor).
Copyright: � 2007 Caicedo et al. This is an open-access article distributed underthe terms of the Creative Commons Attribution License, which permits unrestricteduse, distribution, and reproduction in any medium, provided the original authorand source are credited.
Abbreviations: AIC, Akaike information criterion; GOF, goodness-of-fit; SNP, singlenucleotide polymorphism; STS, sequence-tagged site(s)
* To whom correspondence should be addressed. E-mail: [email protected] (CDB);[email protected] (MDP)
[ These authors contributed equally to this work.
¤a Current address: Department of Biology, University of Massachusetts, Amherst,Massachusetts, United States of America
¤b Current address: Department of Human Genetics, University of Chicago,Chicago, Illinois, United States of America
¤c Current address: Department of Biology, Washington University, St. Louis,Missouri, United States of America
¤d Current address: Centre for Bioinformatics, University of Copenhagen, Denmark
PLoS Genetics | www.plosgenetics.org September 2007 | Volume 3 | Issue 9 | e1631745
the tropical regions of Asia and are primarily grown inlowland conditions, while japonica types are differentiatedinto tropical japonica, distributed in upland tropical regions,and temperate japonica, a recently derived group cultivated intemperate regions [11,13,14]. Additional variety groupsinclude aus, drought-tolerant rice from Bangladesh and WestBengal, and aromatic, fragrant rice from the Himalayan range[14,15]. All rice varieties have a predominantly self-fertilizingmating system [13]. Both morphological and isozyme datahave established that O. rufipogon Griff., a partially outcrossingspecies native to southern Asia, is the wild ancestor ofdomesticated rice [13].
In this paper, we describe the levels and patterns of DNAsequence polymorphism across the rice genome and that ofits wild ancestor, O. rufipogon. To our knowledge this is thefirst genome-wide characterization of sequence variation indomesticated Asian rice, and we show that rice contains aunique pattern of excess high-frequency derived singlenucleotide polymorphisms (SNPs) that has not been reportedin other species. We develop four models to explain patternsof genetic variation in O. sativa and O. rufipogon, including asimple selectively neutral bottleneck model that has been
previously thought to be the dominant demographic forceshaping levels of nucleotide variation in crop species. Wedemonstrate that this simple bottleneck model is inadequateto explain the origin of domesticated rice. We conclude thateither positive selection has made a significant impact ongenomic polymorphism patterns, or that domesticationinvolved an extremely severe bottleneck (;99.5% reduction)coupled with gene flow among modern varieties and betweendomesticated rice and its wild ancestor.
Results/Discussion
Nucleotide Variation in the Rice GenomeTo assess levels and patterns of polymorphism in the rice
genome, we sequenced one hundred eleven randomly chosengene fragments (sequence-tagged sites or STS) in a diversepanel of Oryza accessions, including 72 from O. sativa and 21from O. rufipogon (Tables S1 and S2). Average silent(synonymous and noncoding) site nucleotide diversity (hp)across all sampled loci in O. sativa is approximately 3.20 3
10�3 (Table 1). Levels of polymorphism in the wild ancestralspecies, O. rufipogon, are predictably higher than rice, with amean silent hp of 5.19 3 10�3 (Table 1). These levels ofpolymorphism are lower than those observed for maize, adomesticated outcrossing species [16], and Arabidopsis thaliana,a selfing, wild species [17,18].To determine if any genetic differentiation due to
population structure among rice groups is evident in theseSTS sequences, we used the Bayesian clustering programSTRUCTURE [19]. The highest likelihood obtained was with amodel specifying K ¼ 7 groups (Figure 1; Table S1). Fivegroups occur within O. sativa and correspond to thetraditional variety designations, as described previously [14].Evidence of some limited geographical population structureis also observed in O. rufipogon (Figure 1; Table S1). Neighbor-joining analysis of the concatenated STS sequences (FigureS1) revealed two distinct clusters within cultivated rice; onecomprises a tropical japonica, temperate japonica, and aromaticrice lineage, and another consists of aus and indica rice. Theapparent monophyly of these major groups is consistent withat least two domestication events in rice [14,20–24]. Thenesting of the aromatic and the temperate japonica variety groupswithin tropical japonica suggests the first two groups originatedfrom secondary divergence events from the latter, although
Table 1. Average Diversity Measures in Oryza spp. across 111 STS Regions
Statistic Category O. sativa O. rufipogon
Combined aromatica aus indica japonica temperate japonica tropical japonica
hpb per Kb Total sites 2.29 1.26 1.20 1.35 1.11 0.418 1.15 3.57
Silent sitesc 3.20 1.86 1.69 1.91 1.47 0.510 1.57 5.19
hWd per Kb Total sites 2.11 1.32 1.12 1.58 1.23 0.693 1.27 3.70
Silent sites 2.92 1.97 1.57 2.21 1.67 0.948 1.70 5.42
Tajima’s De Total sites 0.2784 �0.2225 0.0148 �0.3382 �0.2642 �0.8459 �0.4137 �0.2710
Silent sites 0.2223 �0.2768 0.0588 �0.2177 �0.3619 �1.1115 �0.4677 �0.3040
aValues for the aromatic group are based on 110 STS.bAverage nucleotide diversity across all sequenced STS fragments.cSilent site estimates include synonymous and noncoding sites.dAverage values for Watterson’s estimate of theta across all sequenced STS fragments.eAverage Tajima’s D across all sequenced STS fragments.doi:10.1371/journal.pgen.0030163.t001
PLoS Genetics | www.plosgenetics.org September 2007 | Volume 3 | Issue 9 | e1631746
Polymorphism in Domesticated Rice
Author Summary
Domesticated Asian rice is one of the oldest and most importantcrops in the world. Two main rice evolutionary lineages have beenidentified, and are thought to have been independently domes-ticated in Asia. We have examined patterns of DNA sequencevariation in the genomes of rice and its wild ancestor to makeinferences about the origin of domesticated rice. Populationbottlenecks (a reduction in the size of the founding population) inthe evolutionary transition from wild to cultivated species has longbeen thought to be the dominant force shaping patterns ofmolecular evolution during domestication. We find that thenucleotide variation patterns in rice are inconsistent with a simplebottleneck model. Rice genetic variation, however, can be explainedby either a model that incorporates both a bottleneck and migrationamong rice variety groups, or a model that incorporates abottleneck and multiple rounds of artificial selection on rice.Selection by humans is believed to have played an important roleduring crop domestication, and these results may suggest thatstrong, recurrent selection can leave a signal that can be observedthroughout the genomes of domesticated species.
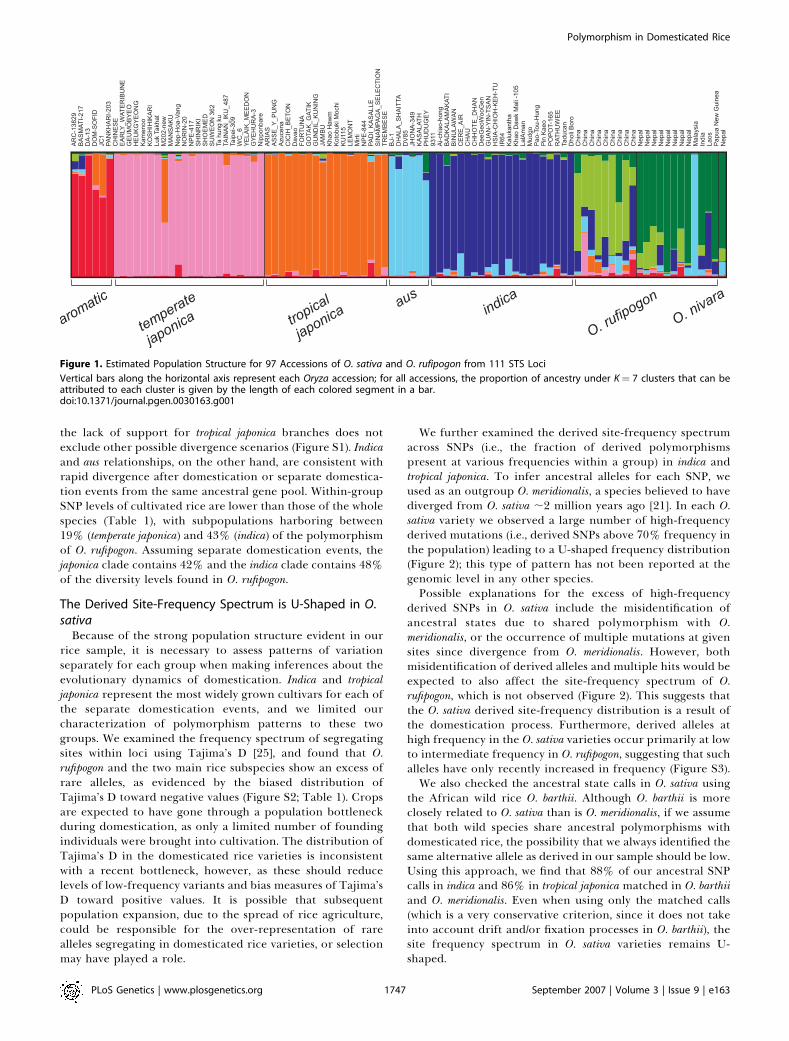
the lack of support for tropical japonica branches does notexclude other possible divergence scenarios (Figure S1). Indicaand aus relationships, on the other hand, are consistent withrapid divergence after domestication or separate domestica-tion events from the same ancestral gene pool. Within-groupSNP levels of cultivated rice are lower than those of the wholespecies (Table 1), with subpopulations harboring between19% (temperate japonica) and 43% (indica) of the polymorphismof O. rufipogon. Assuming separate domestication events, thejaponica clade contains 42% and the indica clade contains 48%of the diversity levels found in O. rufipogon.
The Derived Site-Frequency Spectrum is U-Shaped in O.sativa
Because of the strong population structure evident in ourrice sample, it is necessary to assess patterns of variationseparately for each group when making inferences about theevolutionary dynamics of domestication. Indica and tropicaljaponica represent the most widely grown cultivars for each ofthe separate domestication events, and we limited ourcharacterization of polymorphism patterns to these twogroups. We examined the frequency spectrum of segregatingsites within loci using Tajima’s D [25], and found that O.rufipogon and the two main rice subspecies show an excess ofrare alleles, as evidenced by the biased distribution ofTajima’s D toward negative values (Figure S2; Table 1). Cropsare expected to have gone through a population bottleneckduring domestication, as only a limited number of foundingindividuals were brought into cultivation. The distribution ofTajima’s D in the domesticated rice varieties is inconsistentwith a recent bottleneck, however, as these should reducelevels of low-frequency variants and bias measures of Tajima’sD toward positive values. It is possible that subsequentpopulation expansion, due to the spread of rice agriculture,could be responsible for the over-representation of rarealleles segregating in domesticated rice varieties, or selectionmay have played a role.
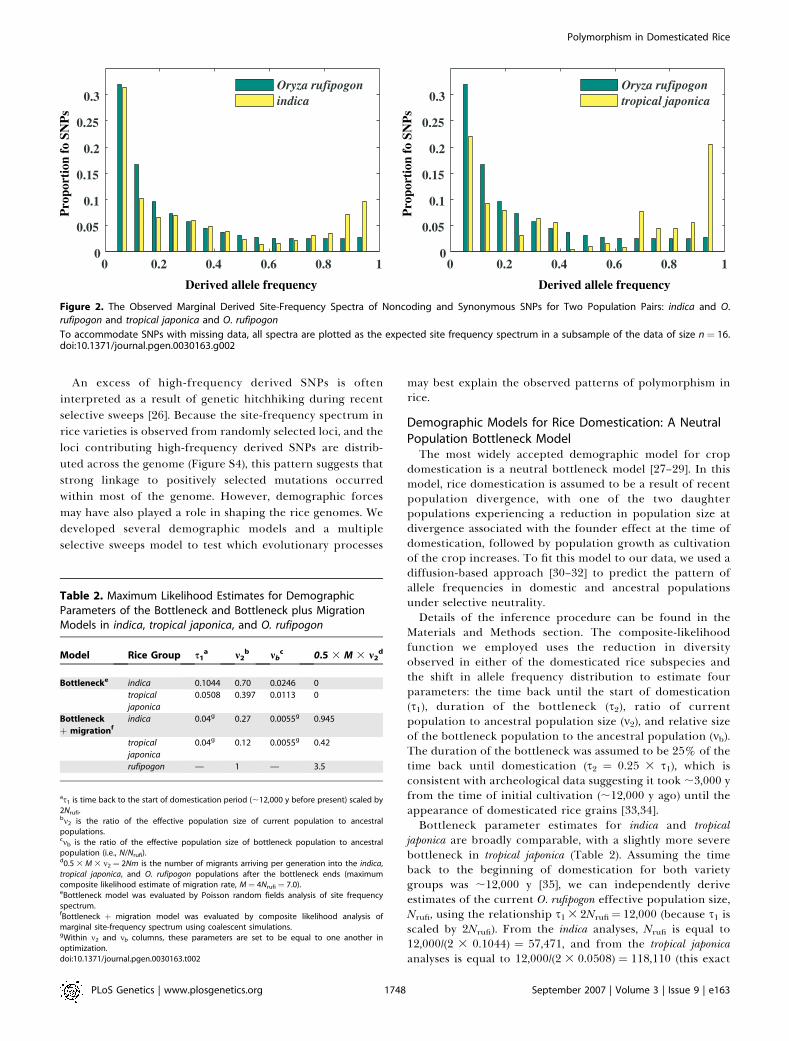
We further examined the derived site-frequency spectrumacross SNPs (i.e., the fraction of derived polymorphismspresent at various frequencies within a group) in indica andtropical japonica. To infer ancestral alleles for each SNP, weused as an outgroup O. meridionalis, a species believed to havediverged from O. sativa ;2 million years ago [21]. In each O.sativa variety we observed a large number of high-frequencyderived mutations (i.e., derived SNPs above 70% frequency inthe population) leading to a U-shaped frequency distribution(Figure 2); this type of pattern has not been reported at thegenomic level in any other species.Possible explanations for the excess of high-frequency
derived SNPs in O. sativa include the misidentification ofancestral states due to shared polymorphism with O.meridionalis, or the occurrence of multiple mutations at givensites since divergence from O. meridionalis. However, bothmisidentification of derived alleles and multiple hits would beexpected to also affect the site-frequency spectrum of O.rufipogon, which is not observed (Figure 2). This suggests thatthe O. sativa derived site-frequency distribution is a result ofthe domestication process. Furthermore, derived alleles athigh frequency in the O. sativa varieties occur primarily at lowto intermediate frequency in O. rufipogon, suggesting that suchalleles have only recently increased in frequency (Figure S3).We also checked the ancestral state calls in O. sativa using
the African wild rice O. barthii. Although O. barthii is moreclosely related to O. sativa than is O. meridionalis, if we assumethat both wild species share ancestral polymorphisms withdomesticated rice, the possibility that we always identified thesame alternative allele as derived in our sample should be low.Using this approach, we find that 88% of our ancestral SNPcalls in indica and 86% in tropical japonica matched in O. barthiiand O. meridionalis. Even when using only the matched calls(which is a very conservative criterion, since it does not takeinto account drift and/or fixation processes in O. barthii), thesite frequency spectrum in O. sativa varieties remains U-shaped.
Figure 1. Estimated Population Structure for 97 Accessions of O. sativa and O. rufipogon from 111 STS Loci
Vertical bars along the horizontal axis represent each Oryza accession; for all accessions, the proportion of ancestry under K¼ 7 clusters that can beattributed to each cluster is given by the length of each colored segment in a bar.doi:10.1371/journal.pgen.0030163.g001
PLoS Genetics | www.plosgenetics.org September 2007 | Volume 3 | Issue 9 | e1631747
Polymorphism in Domesticated Rice
An excess of high-frequency derived SNPs is ofteninterpreted as a result of genetic hitchhiking during recentselective sweeps [26]. Because the site-frequency spectrum inrice varieties is observed from randomly selected loci, and theloci contributing high-frequency derived SNPs are distrib-uted across the genome (Figure S4), this pattern suggests thatstrong linkage to positively selected mutations occurredwithin most of the genome. However, demographic forcesmay have also played a role in shaping the rice genomes. Wedeveloped several demographic models and a multipleselective sweeps model to test which evolutionary processes
may best explain the observed patterns of polymorphism inrice.
Demographic Models for Rice Domestication: A NeutralPopulation Bottleneck ModelThe most widely accepted demographic model for crop
domestication is a neutral bottleneck model [27–29]. In thismodel, rice domestication is assumed to be a result of recentpopulation divergence, with one of the two daughterpopulations experiencing a reduction in population size atdivergence associated with the founder effect at the time ofdomestication, followed by population growth as cultivationof the crop increases. To fit this model to our data, we used adiffusion-based approach [30–32] to predict the pattern ofallele frequencies in domestic and ancestral populationsunder selective neutrality.Details of the inference procedure can be found in the
Materials and Methods section. The composite-likelihoodfunction we employed uses the reduction in diversityobserved in either of the domesticated rice subspecies andthe shift in allele frequency distribution to estimate fourparameters: the time back until the start of domestication(s1), duration of the bottleneck (s2), ratio of currentpopulation to ancestral population size (m2), and relative sizeof the bottleneck population to the ancestral population (mb).The duration of the bottleneck was assumed to be 25% of thetime back until domestication (s2 ¼ 0.25 3 s1), which isconsistent with archeological data suggesting it took ;3,000 yfrom the time of initial cultivation (;12,000 y ago) until theappearance of domesticated rice grains [33,34].Bottleneck parameter estimates for indica and tropical
japonica are broadly comparable, with a slightly more severebottleneck in tropical japonica (Table 2). Assuming the timeback to the beginning of domestication for both varietygroups was ;12,000 y [35], we can independently deriveestimates of the current O. rufipogon effective population size,Nrufi, using the relationship s1 3 2Nrufi¼ 12,000 (because s1 isscaled by 2Nrufi). From the indica analyses, Nrufi is equal to12,000/(2 3 0.1044) ¼ 57,471, and from the tropical japonicaanalyses is equal to 12,000/(2 3 0.0508) ¼ 118,110 (this exact
Figure 2. The Observed Marginal Derived Site-Frequency Spectra of Noncoding and Synonymous SNPs for Two Population Pairs: indica and O.
rufipogon and tropical japonica and O. rufipogon
To accommodate SNPs with missing data, all spectra are plotted as the expected site frequency spectrum in a subsample of the data of size n¼ 16.doi:10.1371/journal.pgen.0030163.g002
Table 2. Maximum Likelihood Estimates for DemographicParameters of the Bottleneck and Bottleneck plus MigrationModels in indica, tropical japonica, and O. rufipogon
Model Rice Group s1a m2
b mbc 0.5 3 M 3 m2
d
Bottlenecke indica 0.1044 0.70 0.0246 0
tropical
japonica
0.0508 0.397 0.0113 0
Bottleneck
þ migrationf
indica 0.04g 0.27 0.0055g 0.945
tropical
japonica
0.04g 0.12 0.0055g 0.42
rufipogon — 1 — 3.5
as1 is time back to the start of domestication period (;12,000 y before present) scaled by2Nrufi.bm2 is the ratio of the effective population size of current population to ancestralpopulations.cmb is the ratio of the effective population size of bottleneck population to ancestralpopulation (i.e., N/Nrufi).d0.5 3 M 3 m2 ¼ 2Nm is the number of migrants arriving per generation into the indica,tropical japonica, and O. rufipogon populations after the bottleneck ends (maximumcomposite likelihood estimate of migration rate, M ¼ 4Nrufi ¼ 7.0).eBottleneck model was evaluated by Poisson random fields analysis of site frequencyspectrum.fBottleneck þ migration model was evaluated by composite likelihood analysis ofmarginal site-frequency spectrum using coalescent simulations.gWithin m2 and mb columns, these parameters are set to be equal to one another inoptimization.doi:10.1371/journal.pgen.0030163.t002
PLoS Genetics | www.plosgenetics.org September 2007 | Volume 3 | Issue 9 | e1631748
Polymorphism in Domesticated Rice
value of Nrufi is important in scaling all of the estimatedparameters into years and number of individuals). The indica-derived Nrufi estimate implies bottleneck and currentestimated population size (Ne) for indica of (mb 3 Nrufi) ¼1,413 and (m2 3 Nrufi) ¼ 40,229 respectively. The secondestimate suggests a bottleneck and current Ne sizes for tropicaljaponica of (mb 3 Nrufi) ¼ 1,334 and (m2 3 Nrufi) ¼ 46,889,respectively.
The differences in estimates of Nrufi from each analysiscould be attributable to differences in the founding pop-ulation of each variety group or differences in the timing ofeach domestication event. We note, however, that a bottle-neck model conditioned on coincident domestication forindica and tropical japonica (equal s1 values) differs only by 1.8log likelihood units (unpublished data), suggesting that equaltiming of domestication is likely to have occurred. Anindependent estimate of Nrufi can be found by using theestimated scaled population silent mutation rates (hW¼ 4Nrufi
l¼ 5.42 3 10�3 per bp; Table 1) and the observation that theO. rufipogon site-frequency spectrum is consistent with that ofa population of long-term constant size (Figure 2). Assuminga neutral mutation rate of 10�8 per bp, yields a point estimateof Nrufi ¼ 135,500, which is slightly higher, but close to theestimates found by conditioning on the start of domestica-tion.
Demographic Models for Rice Domestication: A ComplexModel Incorporating Subdivision, Bottlenecks, andMigration
It is important to note that population bottlenecks alonewould not generate the strong excess of high-frequencyderived alleles and strong U-shaped site-frequency spectrumobserved in O. sativa (Figure 2) [36]. In order to explain thisaspect of the data, we considered several demographicmodels that included ancient subdivision in the ancestor ofrice, a bottleneck at the time of domestication for eachdomesticated varietal group, and limited gene flow betweenthe independently domesticated rice groups indica and tropicaljaponica. Ancient, strong subdivision is not evident in our O.rufipogon sample (Figure 1); Fst between Chinese and non-Chinese O. rufipogon is low, about 0.16, and no interior modesare evident in the site-frequency spectrum of O. rufipogon, asexpected under subdivision. However, it is possible forlimited gene flow in O. rufipogon to lead to some differ-entiation of allele frequency between groups, but not somuch that it would have a strong effect on a combined O.rufipogon sample. Furthermore, the population bottlenecksinduced by independent domestication events could amplifyany allele frequency differentiation between indica and tropicaljaponica, and limited gene flow between these two groupscould introduce ancestral alleles into each population,causing mutations previously fixed in one group to beobserved as high-frequency derived alleles in the other.
To test the effect of ancestral population substructurewithin O. rufipogon prior to the domestication of the two O.sativa groups, we fit the parameters of a complex demo-graphic model to our data using a composite likelihoodtechnique (see Materials and Methods). We began byexploring a model with seven demographic parameters,which consists of O. rufipogon being subdivided into twodemes of equal size, sharing on average MR migrants pergeneration. Current-day indica varieties are descended from
one of these demes, while tropical japonica varieties descendfrom the other. During the domestication process, eachpopulation underwent a bottleneck that began s1 generationsago (in units 2Nrufi) and had severity mb (the ratio of thereduced population size to the ancestral size). After s2¼ 0.253 s1 generations (;3,000 y), both indica and tropical japonicapartially recovered, instantaneously reaching a fraction tIand tJ of the ancestral size, respectively. Contemporary geneflow (since domestication) between tropical japonica, O.rufipogon, and indica is captured by the last parameter, theaverage number of migrants per generation between thesedemes (MS). This model was conceived because it incorpo-rates key demographic features of rice or crop domestication(e.g., bottlenecks, two domestication events) and couldconceptually generate the observed derived SNP site fre-quency spectrum.In preliminary analyses, we found that the migration rate
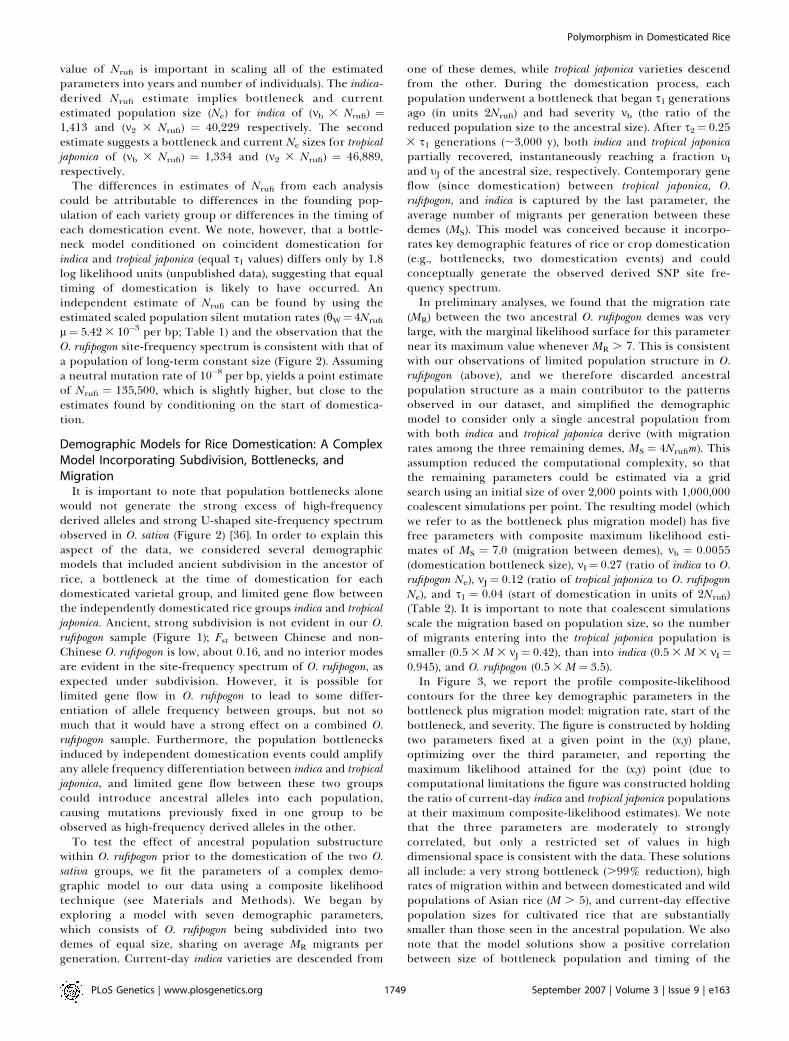
(MR) between the two ancestral O. rufipogon demes was verylarge, with the marginal likelihood surface for this parameternear its maximum value whenever MR . 7. This is consistentwith our observations of limited population structure in O.rufipogon (above), and we therefore discarded ancestralpopulation structure as a main contributor to the patternsobserved in our dataset, and simplified the demographicmodel to consider only a single ancestral population fromwith both indica and tropical japonica derive (with migrationrates among the three remaining demes, MS ¼ 4Nrufim). Thisassumption reduced the computational complexity, so thatthe remaining parameters could be estimated via a gridsearch using an initial size of over 2,000 points with 1,000,000coalescent simulations per point. The resulting model (whichwe refer to as the bottleneck plus migration model) has fivefree parameters with composite maximum likelihood esti-mates of MS ¼ 7.0 (migration between demes), mb ¼ 0.0055(domestication bottleneck size), mI¼ 0.27 (ratio of indica to O.rufipogon Ne), mJ ¼ 0.12 (ratio of tropical japonica to O. rufipogonNe), and s1 ¼ 0.04 (start of domestication in units of 2Nrufi)(Table 2). It is important to note that coalescent simulationsscale the migration based on population size, so the numberof migrants entering into the tropical japonica population issmaller (0.5 3 M 3 mJ¼ 0.42), than into indica (0.5 3 M 3 mI ¼0.945), and O. rufipogon (0.5 3 M ¼ 3.5).In Figure 3, we report the profile composite-likelihood
contours for the three key demographic parameters in thebottleneck plus migration model: migration rate, start of thebottleneck, and severity. The figure is constructed by holdingtwo parameters fixed at a given point in the (x,y) plane,optimizing over the third parameter, and reporting themaximum likelihood attained for the (x,y) point (due tocomputational limitations the figure was constructed holdingthe ratio of current-day indica and tropical japonica populationsat their maximum composite-likelihood estimates). We notethat the three parameters are moderately to stronglycorrelated, but only a restricted set of values in highdimensional space is consistent with the data. These solutionsall include: a very strong bottleneck (.99% reduction), highrates of migration within and between domesticated and wildpopulations of Asian rice (M . 5), and current-day effectivepopulation sizes for cultivated rice that are substantiallysmaller than those seen in the ancestral population. We alsonote that the model solutions show a positive correlationbetween size of bottleneck population and timing of the
PLoS Genetics | www.plosgenetics.org September 2007 | Volume 3 | Issue 9 | e1631749
Polymorphism in Domesticated Rice
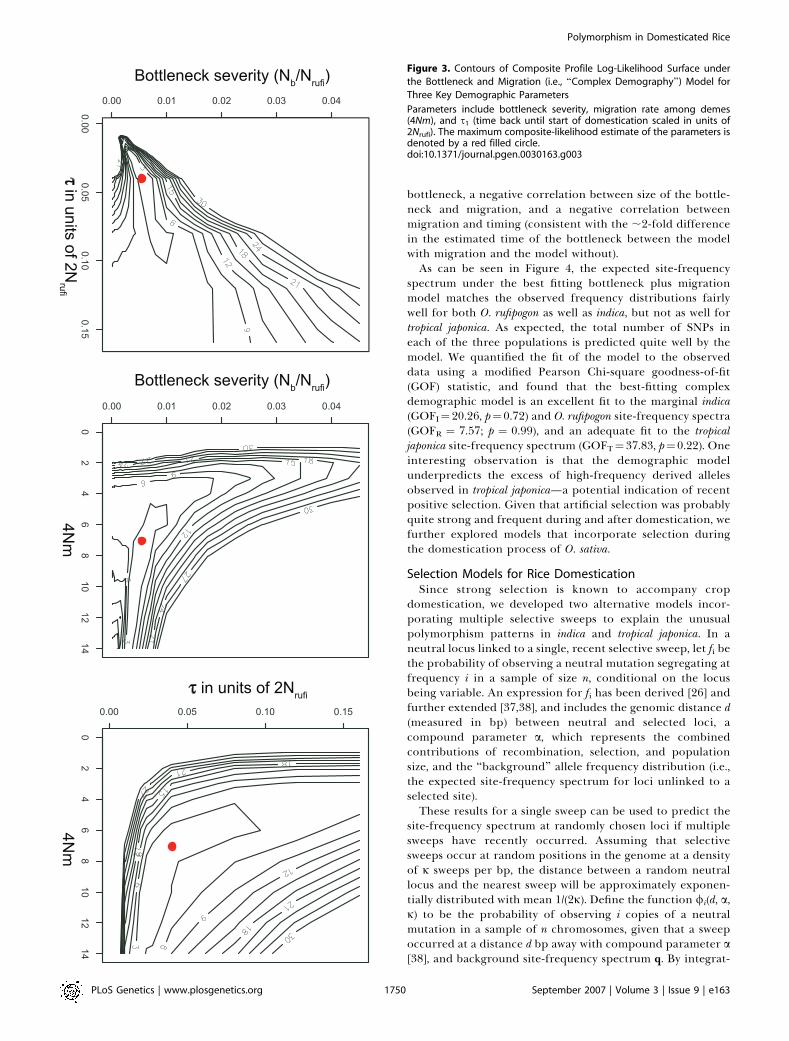
bottleneck, a negative correlation between size of the bottle-neck and migration, and a negative correlation betweenmigration and timing (consistent with the ;2-fold differencein the estimated time of the bottleneck between the modelwith migration and the model without).As can be seen in Figure 4, the expected site-frequency
spectrum under the best fitting bottleneck plus migrationmodel matches the observed frequency distributions fairlywell for both O. rufipogon as well as indica, but not as well fortropical japonica. As expected, the total number of SNPs ineach of the three populations is predicted quite well by themodel. We quantified the fit of the model to the observeddata using a modified Pearson Chi-square goodness-of-fit(GOF) statistic, and found that the best-fitting complexdemographic model is an excellent fit to the marginal indica(GOFI¼20.26, p¼0.72) and O. rufipogon site-frequency spectra(GOFR ¼ 7.57; p ¼ 0.99), and an adequate fit to the tropicaljaponica site-frequency spectrum (GOFT¼37.83, p¼0.22). Oneinteresting observation is that the demographic modelunderpredicts the excess of high-frequency derived allelesobserved in tropical japonica—a potential indication of recentpositive selection. Given that artificial selection was probablyquite strong and frequent during and after domestication, wefurther explored models that incorporate selection duringthe domestication process of O. sativa.
Selection Models for Rice DomesticationSince strong selection is known to accompany crop
domestication, we developed two alternative models incor-porating multiple selective sweeps to explain the unusualpolymorphism patterns in indica and tropical japonica. In aneutral locus linked to a single, recent selective sweep, let fi bethe probability of observing a neutral mutation segregating atfrequency i in a sample of size n, conditional on the locusbeing variable. An expression for fi has been derived [26] andfurther extended [37,38], and includes the genomic distance d(measured in bp) between neutral and selected loci, acompound parameter a, which represents the combinedcontributions of recombination, selection, and populationsize, and the ‘‘background’’ allele frequency distribution (i.e.,the expected site-frequency spectrum for loci unlinked to aselected site).These results for a single sweep can be used to predict the
site-frequency spectrum at randomly chosen loci if multiplesweeps have recently occurred. Assuming that selectivesweeps occur at random positions in the genome at a densityof j sweeps per bp, the distance between a random neutrallocus and the nearest sweep will be approximately exponen-tially distributed with mean 1/(2j). Define the function /i(d, a,j) to be the probability of observing i copies of a neutralmutation in a sample of n chromosomes, given that a sweepoccurred at a distance d bp away with compound parameter a[38], and background site-frequency spectrum q. By integrat-
Figure 3. Contours of Composite Profile Log-Likelihood Surface under
the Bottleneck and Migration (i.e., ‘‘Complex Demography’’) Model for
Three Key Demographic Parameters
Parameters include bottleneck severity, migration rate among demes(4Nm), and s1 (time back until start of domestication scaled in units of2Nrufi). The maximum composite-likelihood estimate of the parameters isdenoted by a red filled circle.doi:10.1371/journal.pgen.0030163.g003
PLoS Genetics | www.plosgenetics.org September 2007 | Volume 3 | Issue 9 | e1631750
Polymorphism in Domesticated Rice
ing over the distance between the sampled locus and theunknown target of the sweep, the marginal probability, Pi, ofobserving a randomly chosen SNP at frequency i in a sampleof n chromosomes is a function of j, a, and q [38]:
Piðj; a; qÞ ¼
Z‘
0
/iðd; a; qÞe�2jddd
Xn�1j¼1
Z‘
0
/jðd; a; qÞe�2jddd
ð1Þ
This probability can be used to calculate the compositelikelihood of the data and estimate the parameters j and a(see Materials and Methods). It should be noted that thisequation assumes that the neutral locus is affected only by thenearest selective sweep.
We considered two distinct models. The first is a model inwhich strong selection is the only force that has acted indomesticated rice populations, and uses the normalized O.rufipogon site-frequency spectrum as the background fre-quency distribution. The second, a bottleneck plus sweepsmodel, allows multiple selective sweeps to affect patterns ofvariation immediately following a population size change.The background site-frequency spectrum in the latter casecan be approximated using the predictions of a simplifiedneutral bottleneck model. The bottleneck plus sweeps modelincorporates the sweep density j, the compound parameter a(the combined contributions of recombination, selection, andpopulation size), and a bottleneck severity parameter m.
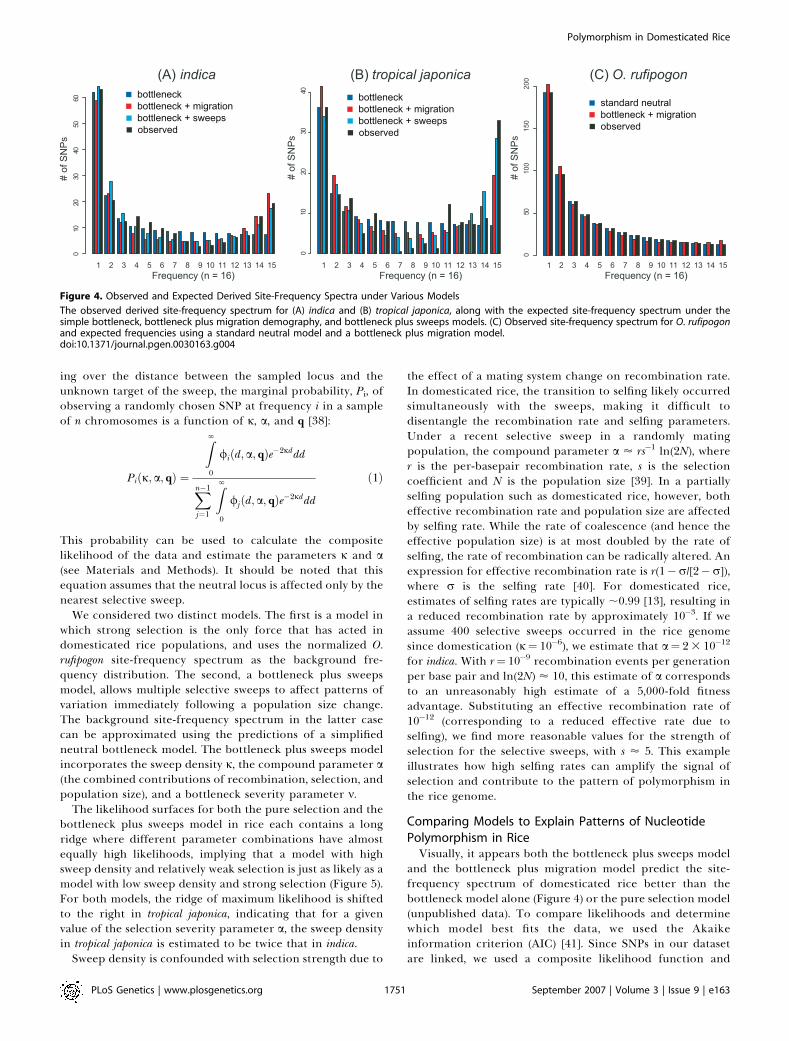
The likelihood surfaces for both the pure selection and thebottleneck plus sweeps model in rice each contains a longridge where different parameter combinations have almostequally high likelihoods, implying that a model with highsweep density and relatively weak selection is just as likely as amodel with low sweep density and strong selection (Figure 5).For both models, the ridge of maximum likelihood is shiftedto the right in tropical japonica, indicating that for a givenvalue of the selection severity parameter a, the sweep densityin tropical japonica is estimated to be twice that in indica.
Sweep density is confounded with selection strength due to
the effect of a mating system change on recombination rate.In domesticated rice, the transition to selfing likely occurredsimultaneously with the sweeps, making it difficult todisentangle the recombination rate and selfing parameters.Under a recent selective sweep in a randomly matingpopulation, the compound parameter a ’ rs�1 ln(2N), wherer is the per-basepair recombination rate, s is the selectioncoefficient and N is the population size [39]. In a partiallyselfing population such as domesticated rice, however, botheffective recombination rate and population size are affectedby selfing rate. While the rate of coalescence (and hence theeffective population size) is at most doubled by the rate ofselfing, the rate of recombination can be radically altered. Anexpression for effective recombination rate is r(1�r/[2�r]),where r is the selfing rate [40]. For domesticated rice,estimates of selfing rates are typically ;0.99 [13], resulting ina reduced recombination rate by approximately 10�3. If weassume 400 selective sweeps occurred in the rice genomesince domestication (j¼ 10�6), we estimate that a¼ 23 10�12
for indica. With r¼ 10�9 recombination events per generationper base pair and ln(2N) ’ 10, this estimate of a correspondsto an unreasonably high estimate of a 5,000-fold fitnessadvantage. Substituting an effective recombination rate of10�12 (corresponding to a reduced effective rate due toselfing), we find more reasonable values for the strength ofselection for the selective sweeps, with s ’ 5. This exampleillustrates how high selfing rates can amplify the signal ofselection and contribute to the pattern of polymorphism inthe rice genome.
Comparing Models to Explain Patterns of NucleotidePolymorphism in RiceVisually, it appears both the bottleneck plus sweeps model
and the bottleneck plus migration model predict the site-frequency spectrum of domesticated rice better than thebottleneck model alone (Figure 4) or the pure selection model(unpublished data). To compare likelihoods and determinewhich model best fits the data, we used the Akaikeinformation criterion (AIC) [41]. Since SNPs in our datasetare linked, we used a composite likelihood function and
Figure 4. Observed and Expected Derived Site-Frequency Spectra under Various Models
The observed derived site-frequency spectrum for (A) indica and (B) tropical japonica, along with the expected site-frequency spectrum under thesimple bottleneck, bottleneck plus migration demography, and bottleneck plus sweeps models. (C) Observed site-frequency spectrum for O. rufipogonand expected frequencies using a standard neutral model and a bottleneck plus migration model.doi:10.1371/journal.pgen.0030163.g004
PLoS Genetics | www.plosgenetics.org September 2007 | Volume 3 | Issue 9 | e1631751
Polymorphism in Domesticated Rice
simulations to assign p-values to the observed AIC statistic(see Materials and Methods).
For indica, the bottleneck plus sweeps model is significantlybetter than the neutral bottleneck model (K ¼ �17.18, p ,
0.05) as is the bottleneck plus migration model (K¼�14.19, p, 0.05). For tropical japonica, we also reject the neutralbottleneck model in favor of both the bottleneck plus sweepsmodel (K ¼ �56.88, p , 0.01) and the bottleneck plusmigration model (K¼�53.60, p , 0.01). For both rice varietygroups, the AIC for the bottleneck plus sweeps model wasslightly lower than for the bottleneck plus migration models(K ¼�2.26, indica; K ¼�3.28, japonica), but this difference islikely not statistically meaningful given the various assump-tions made. A separate (but not independent) assessment iscomparing the fit of the predictions of each model to thedata. The bottleneck plus sweeps model fits the marginal site-frequency spectrum of indica quite well (GOF ¼ 13.86; p ¼0.92), and does a slightly better job explaining the site-frequency spectrum of tropical japonica than does the complexdemographic model incorporating bottlenecks plus migra-tion (GOFsweeps þ bottleneck ¼ 31.21, p ¼ 0.33; GOFbottlenecks þmigration ¼ 37.83; p ¼ 0.22). These results underscore theimportance of jointly modeling demographic and selectiveeffects when considering the evolution of domesticated cropspecies.
Domestication and the Shaping of Genome-WidePolymorphism Patterns in RicePopulation bottlenecks are believed to be the primary
demographic event associated with crop species origins, andare the accepted mechanism to explain observed genome-wide polymorphism levels among these taxa. There have beenconcerted efforts to model the impact of population bottle-necks on domesticated species genomes [27–29,42–44]. Itappears from our results, however, that a population bottle-neck alone is inadequate to explain the observed nucleotidepolymorphism patterns in rice, one of the oldest and the mostpredominant food crop species in the world.A more complex demographic scenario involving very
strong bottlenecks that led to the fixation of alternatealleles during the two rice domestication events, withconcurrent gene flow between variety groups, can explainthe site-frequency spectrum of indica and O. rufipogon.However, this pure demography model requires a bottle-neck 4-fold stronger in indica and twice as strong in tropicaljaponica relative to the model that incorporates selection(Figure 5; Table 2), and a relatively high migration ratebetween domesticated rice and wild O. rufipogon popula-tions. It is also important to note that the model is a poor fitto the observed frequency distribution of alleles in tropicaljaponica.
Figure 5. Composite Likelihood Surfaces in indica and tropical japonica under Models Incorporating Selection
A density plot of the marginal composite log-likelihood surface of the parameters a and j, with the bottleneck severity t fixed to its estimate, under thebottleneck plus sweeps model for (A) indica and (B) tropical japonica. The composite log-likelihood surface of the parameters a and j under the pureselection model for (C) indica and (D) tropical japonica. The composite log-likelihood is represented as a deviation from the maximum log-likelihood,with lighter values representing higher composite likelihoods. Numbers above (A) and (B) indicate the total number of sweeps in the rice genomecorresponding to each value of j, and numbers to the right of (B) and (D) represent the selection coefficient, s, corresponding to each value of a,substituting an effective recombination rate of r ¼ 10�12 and ln(2N) ¼ 10 into the expression: a ’ rs�1 ln(2N), then solving for s.doi:10.1371/journal.pgen.0030163.g005
PLoS Genetics | www.plosgenetics.org September 2007 | Volume 3 | Issue 9 | e1631752
Polymorphism in Domesticated Rice
Domestication, however, is characterized by strong direc-tional selection on a suite of traits that lead to the establish-ment of cultivated species as distinct entities from their wildprogenitors within agricultural settings. We show that, incontrast to the complex demographic model, a simplebottleneck with sweeps model fits data from both tropicaljaponica and indica well without requiring an extremely strongdomestication bottleneck. Since domesticated Asian rice hasbeen subject to artificial selection, the selection plusdemography model is a very plausible explanation for theobserved strong excess of high-frequency derived alleles indomesticated rice varieties, and is consistent with recentreports about domestication genes in rice [45,46].
Positive selection on specific genes results in reductions invariation within a genome through selective sweeps [47,48].Unlike bottlenecks, however, selection is thought to havelargely localized effects on genome variation. Our resultssuggest that a model that incorporates selection can explainpatterns of nucleotide variation in a set of genome-widemarkers. We suggest two reasons why selective sweeps duringdomestication could cause a genome-wide effect in O. sativaand not in other cereal crop species such as maize. First, theorigin of domesticated Asian rice is associated with atransition to self-fertilization, which results in a low effectiverecombination rate and greatly increases the genomicdistance affected by selection. Second, O. sativa possessessuch a small genome (,400 Mb) that it is likely that a fewdozen to hundreds of selective sweeps could leave a genome-wide imprint.
Interestingly, under the bottleneck plus selective sweepsmodel, the dynamics of domestication appear to differ insignificant ways between indica and tropical japonica. Despitethe fact that these two variety groups were domesticated fromthe same species and both have contributed significantly toAsian agriculture, it appears that the number of selectiveevents and/or the bottleneck severity differs between them. Itis possible that the two subspecies would diverge from eachother in the demographic patterns associated with domes-tication, given that they were established by differentcultures. If this is correct, then tropical japonica appears tohave undergone a more severe bottleneck associated withdomestication. Alternatively, it may be that the establishmentof tropical japonica, which includes landraces that expanded toupland growing areas, may be associated with strongerselection pressures on a larger number of traits.
The process of domestication is one of recent, rapid speciesevolution, and studies on the dynamics of this process informour understanding of the origins and diversification of newspecies. Simple demographic scenarios that have beenemployed in the past may not fully capture the domesticationprocess of some crop species such as Asian rice. Our modelsindicate that selection and population bottlenecks together,or more complex scenarios that invoke very strong bottle-necks and current gene flow, could be responsible fordetermining genome-wide variation in the rice genome, afinding that has not been described in other domesticatedspecies. Domesticated crop species are particularly suitablesubjects in which to study the interaction between demo-graphic events and selection in shaping species character-istics, and exploring the relative contributions of these forcesrequire developing predictions for patterns of DNA poly-morphism using models that allow selection to vary in timing
(i.e., both during and after population bottlenecks) andstrength. Nevertheless, our findings do underscore thepossible role that selection may play in shaping genomicvariation in domesticated species, reinforcing our apprecia-tion of the foresight showed by Charles Darwin nearly acentury-and-a-half ago [3] when he sought to illustrate thepower of selection by drawing on the lessons learned from theevolution of domesticated species.
Materials and Methods
Samples. A panel of 72 O. sativa accessions was chosen to representthe diversity found within the species. These include representativesof five major subpopulations identified in a previous study [14],including 21 indica, 18 tropical japonica, 21 temperate japonica, six aus, andsix aromatic accessions (Table S1). Most accessions are landraces, butfive accessions studied correspond to modern cultivars. Also includedin the panel were 21 accessions of the wild progenitor of rice, O.rufipogon, along with one sample each of O. nivara (a close relative of O.rufipogon not believed to have contributed to the ancestry ofcultivated rice) and the outgroup species O. barthii and O. meridionalis(Table S1).
DNA was extracted from single plants as described in [49] withminor modifications. All O. sativa and one O. rufipogon accession(International Rice Germplasm Collection [http://www.irri.org/grc/]#105491) were self-fertilized for two generations prior to initiatingthe study. Seeds from O. rufipogon from Nepal were collected in thefield by H. J. Koh and colleagues (Seoul National University); all otherseeds were obtained from germplasm repositories as summarized inTable S1.
PCR and DNA sequencing. A total of 121 approximately 400–600bp gene regions across the rice genome were chosen at random forsequencing from a set of 6,591 ESTs [50]. Four fragments were alsoselected from genes coding for well-known allozymes, including:catalase, acid phosphatase, pgi-a, and Adh. Primers were designedfrom the Nipponbare genomic sequence available from Grameneusing Primer3 [51]. Primers were designed in exons, and attemptswere made to include both exon and intron sequence within eachfragment. DNA sequencing was carried out in Genaissance’ssequencing facilities (New Haven, Connecticut, United States) asdescribed in [52]. Amplification and sequencing were successful for111 fragments referred to as STS (Table S2). Approximately 54 kbpper accession were sequenced, composed of, on average, 55% codingand 45% noncoding sequence.
Base-pair calls, quality score assignment, and construction ofcontigs were carried out using the Phred and Phrap programs (CodonCode). Sequence alignment and editing were carried out withBioLign Version 2.09.1 (Tom Hall, North Carolina State University,Raleigh, North Carolina, United States). Heterozygous sites wereidentified with Polyphred (Deborah Nickerson, University of Wash-ington, Seattle, Washington, United States) and by visually inspectingchromatograms for double peaks. Heterozygous sites were rare for O.sativa. For heterozygous O. sativa and O. rufipogon sequences,heterozygous sites were labeled with ambiguity codes. For all analyses,the published sequence of Nipponbare was included.
To assess the sequencing error rate, 18 randomly chosen STSfragments were resequenced in a single direction for four Oryzaaccessions. Only three discordant base pairs within a single individualin a single fragment sequence were observed. This corresponds tothree errors in 33,193 resequenced bp, or a sequencing error rate ofless than 0.01%.
Diversity analyses. Population structure among O. sativa and O.rufipogon accessions was evaluated with STRUCTURE 2.1 [19] using anadmixture model with no linkage. To limit the effect of correlationbetween SNPs due to linkage, one SNP per fragment (the SNP withthe highest minor allele frequency across the entire accession set) wasused in the analysis. O. sativa is primarily selfing, and most accessionsexist as homozygotes; thus, SNP data were considered haploid for thisspecies. O. rufipogon is partially outcrossing, a condition that cannotbe adequately represented by considering each locus as diploid; thus,SNP data for O. rufipogon were also considered haploid. Becausealternate alleles could occur at a given site in heterozygous O.rufipogon accessions, ten datasets were created with randomly chosenalternative base pairs in heterozygous individuals. Analyses werecarried out for all ten datasets. All analyses had a burn-in length of50,000 iterations and a run length of 100,000 iterations. Threereplicates at each value of K (population number) were carried out.
PLoS Genetics | www.plosgenetics.org September 2007 | Volume 3 | Issue 9 | e1631753
Polymorphism in Domesticated Rice

Simulations were run with uncorrelated allele frequencies. Resultswere entirely consistent among replicate runs within datasets andamong datasets; the results from one run are presented in Figure 1and Table S1.
To assess relationships among Oryza accessions, all STS fragmentalignments were concatenated to form a single dataset. Relationshipswere estimated with a neighbor-joining analysis as implemented inPAUP* version 4.0 b3 [53]. Distances were calculated using theKimura two-parameter model. Branch bootstrap estimates wereobtained from 1,000 replicates.
Perl scripts were written to assess levels of nucleotide variation(hW) and nucleotide diversity (hp) and Tajima’s D across rice groupsfor all STS fragments, and to calculate the frequency distributions ofderived SNPs across the genome. For O. sativa accessions, whereheterozygotes were rare, all measures were calculated consideringeach accession as contributing a single haplotype; for O. rufipogonpopulation measures, each accession was considered to contributetwo haplotypes, except for one accession (International RiceGermplasm Collection [http://www.irri.org/grc/] #105491) from Ma-laysia, which had been selfed for several generations prior to thisstudy.
Analysis of the neutral bottleneck model. Under a neutralbottleneck model, the history of rice domestication is representedby recent population divergence, with one of the two daughterpopulations experiencing a size bottleneck at divergence associatedwith the founder effect at the time of domestication. We use thesample frequencies of variable noncoding and synonymous nucleo-tides in the STS alignments (i.e., the site-frequency spectrum ofputatively neutral SNPs) to infer the parameters of the bottleneckmodel. Our analytical approach makes use of standard Wright-Fisherpopulation genetic theory within a Poisson random field setting [54–57]. The assumptions of this model include independence amongSNPs, no selection, an underlying Poisson process governingmutations, and a piecewise constant population of large sizeamenable to modeling using diffusion approximations.
The model we employ is an extension of Williamson et al. [58],where we present the relevant population and statistical inferencetheory for modeling a population experiencing a recent size change.The key addition to our previous model is a second size change event,corresponding to the post-bottleneck growth phase. This amounts tomodeling the components of the site-frequency spectrum (X1, X2, . . .,Xn) as independent Poisson random variables with mean:
EðXiÞ ¼h2
Z1
0
ni
� �xið1� xÞn�if ðx; HÞdx ð2Þ
where h is the genome-wide mutation rate, x represents the(unknown) population frequencies of mutations, and f(x;H) is thedistribution of mutation frequencies given demographic historyparameters H ¼ fm,s1,s2g. These parameters are: the time back untilthe start of domestication (s1), duration of the bottleneck (s2), ratio ofcurrent population to ancestral population size (m2), and relative sizeof the bottleneck population to the ancestral population (mb). Theduration of the bottleneck was assumed to be 25% of the time backuntil domestication (s2 ¼ 0.25 3 s1), which is consistent witharchaeological data suggesting domestication took 3,000 y and began12,000 y ago. The mutation rate, h, was estimated from the number ofsynonymous and noncoding segregating SNPs assuming O. rufipogonrepresented a population of constant size. This assumption is quitereasonable given the excellent concordance between the O. rufipogonand the predictions of the standard neutral model (Figure 4), and isequivalent to using Watterson’s (1975) estimator of h. In order toaccount for missing data, we fitted the population bottleneck modelusing the projected site-frequency spectrum for a sample of n ¼ 16chromosomes.
Alternative demographic scenarios for rice domestication. Weconsidered alternative demographic scenarios, in which ancestralpopulation subdivision, followed by gene flow between rufipogon,indica, and tropical japonica, led to an excess of high-frequency derivedalleles in domesticated rice groups, as well as a simpler model that hasno ancestral substructure. For these models, the composite likelihoodfunction was based on the marginal site-frequency spectrum of eachof the three groups analyzed. For ease of notation, let Sind, Sjap, andSruf be the number of SNPs for which we could distinguish ancestralfrom derived alleles using the outgroup (223, 172, and 636,respectively). Let y denote the set of derived allele counts for eachSNP, with y�
ind, y�jap, and y�
ruf referring to set of SNPs for indica, tropicaljaponica, and O. rufipogon (with lengths Sind, Sjap, and Sruf , respectively).To account for missing data, let n refer to the number of
chromosomes sequenced at each SNP, with n�ind, n�
jap, and n�ruf the
vector for each group (again with lengths Sind, Sjap, and Sruf,respectively). For a given demographic model discussed above (theparameters of which we collectively denote H), the compositelikelihood function is written as
LðyjHÞ ¼ fPrðSindjHÞYSindk¼1
Prðyindk ; nindk jHÞg
3fPrðSjapjHÞYSjapk¼1
Prðyjapk ; njapk jHÞg
3fPrðSruf ijHÞYSrufk¼1
Prðyruik ; nrufk jHÞg
ð3Þ
where Pr(S�jH) is assumed to follow a Poisson probability ofobserving S� SNPs in a given population under the demographicmodel H assuming the population scaled mutation rate h ¼ 148.6(estimated using the observed number of SNPs in O. rufipogon), andPrðy:; n:jHÞ is the probability of observing a SNP configuration in agiven population under the demographic model. It is important tonote that the inference scheme assumes the allele frequencydistributions, conditional on the observed number of segregatingsites and demographic parameters, are independent among popula-tions. This composite-likelihood function (like all composite-like-lihood functions) must, therefore, be taken as an approximation ofthe true likelihood function since it ignores dependencies amongSNPs due to linkage and among populations due to shared variation.To account for missing data at an arbitrary SNP k in population x, weset
Prðyxk; nxkjHÞ ¼XNX�ðnxk�yxkÞ
j¼yxk
Pyxk ðH;NxÞ if no missingdata
jyxk
� �Nx � jnxk � yxk
� �
Nx
nxk
� � Pj H;Nxð Þ
2664
3775 otherwise
8>>>>>><>>>>>>:
ð4Þ
where Pz(H,Nx) is the expected proportion of SNPs at a frequency z ina sample of Nx chromosomes under the demographic model H, andthe fraction within the summation represents the hypergeometricprobability of sampling yxk derived alleles in a subsample of nxkchromosomes if the unknown frequency of the SNP were j out of Nx(summed over all possible underlying SNP frequencies, j). Details oncalculating the expected number of SNPs in each population as wellas Pz(H,Nx) are described below.
Optimizing complex neutral demographic models. For a given setof parameters, H, we determine the expected site-frequency spectrafor all three populations (O. rufipogon, indica, and tropical japonica) using100,000 iterations of the coalescent simulation program ms [1]conditional on the observed genome-wide estimate of h for O.rufipogon. To generate data under this model, we used the followingcode:
ms 80 200000 –t 148.6487 –r 148.6487 111 –I 3 21 18 41 M–en 0.5*0.75*s1 1 mB –en 0.5*0.75*s12mB –ej 0.5*s1 1 3 –ej s1 2 3�em0.5*s1 3 1 0 –em 0.5*s1 3 2 0 �n 1 mI –n 2 mJ.
Note that the factor 0.75 enters from the assumption that thebottleneck lasted 3,000 y of the 12,000 y time since domesticationbegan, and 0.5 enters since ms scales time in units of 4N generations.
To optimize the three- and five-dimensional likelihood surface, weused an iterative technique, whereby a very coarse grid is initiallychosen for each parameter, followed by successively tighter intervalscontaining the previous iteration’s maximum likelihood estimates.Because we were pooling data across 111 STS loci, we generated ourexpected site-frequency spectrum accordingly. Although recombina-tion within or between STS loci will not affect the expected numberof segregating sites or the expected site frequency spectrum under aneutral demographic model, it does impact the rate at whichsimulations will approach them. We therefore assumed 111 mostlyindependent loci of equal size when generating our expectations.
Modified Pearson Goodness-of-Fit test. In order to compare the fitof the demographic model to the observed data accounting formissing genotypes and partial selfing, we considered a projection ofthe observed and predicted site-frequency spectra into a sample ofsize n¼16 chromosomes from each of the three populations using thehypergeometric distribution. The ‘‘observed’’ data can be thought ofas the predicted SFS in a subsample of n¼16 based on the actual SNPdata assuming each of the O. sativa accessions contributes onechromosome to the observed allele frequency spectrum, and each of
PLoS Genetics | www.plosgenetics.org September 2007 | Volume 3 | Issue 9 | e1631754
Polymorphism in Domesticated Rice
the O. rufipogon accessions contributes two, with the exception of oneaccession that was known to have been purified. The ‘‘expected’’ dataare the predicted marginal site-frequency spectrum at the maximumcomposite-likelihood estimates of the parameters from the complexdemographic model that includes bottlenecks in the two domes-ticated populations, migration within domesticated populations, andmigration between domesticated and ancestral populations. Therewere 45 observed data points (15 segregating site-frequency spectrumcomponents multiplied by three populations), and the GOF statisticfor a given population was tabulated as GOF ¼
P15i¼1ðObsi�ExpiÞ2
Expi. In
order to assign a p-value, we simulated 10,000 datasets eachcontaining 111 independent loci with no recombination within lociunder the best-fitting demographic model. For each dataset, we thencalculated the GOF test statistic using the expected site-frequencyspectrum from Figure 4 scaled to the observed number of segregatingsites within each of the subpopulations. Ideally, one would re-estimate the demographic parameters in order to fully mimic theinference procedure we used. Unfortunately, estimation of thedemographic parameters was extremely computationally intensivefor each dataset; the single observed STS data point analyzed here,for example, took over a week of computer time on a dedicated 100-node computing cluster.
Composite likelihood under multiple sweeps models. Conditioningon the observed number of segregating sites in the dataset, the site-frequency spectrum is multinomially distributed with frequencyprobabilities according to Equation 1. For the pure selection model,the composite likelihood is:
‘sðj; ajxÞ ¼Xn�1i¼1
xilogðPiðj; a; qrÞÞ ð5Þ
where qr is the normalized site-frequency spectrum of O. rufipogon.For the bottleneck plus multiple sweeps model, the compositelikelihood is:
‘sðj;a; mjxÞ ¼Xn�1i¼1
x�ilogðPiðj;a; qmÞÞ ð6Þ
where qm is the predicted spectrum from a neutral bottleneck modelwith severity m. Equations 5 and 6 can be maximized to quantify thenumber and strength of selective sweeps in domestic rice, and theoptimization of Equation 5 provides an estimate of the severity of thepopulation bottleneck that preceded the selective sweep.
The background site-frequency spectrum for the bottleneck plusmultiple sweeps model. The bottleneck plus sweeps model assumesthat a short bottleneck (representing to the founding of domesticpopulations) precedes the selective sweeps. To calculate the back-ground site-frequency spectrum at the end of the bottleneck and thebeginning of the selective sweeps, we again used numerical methodsto solve the one-population diffusion equation with population sizechanges:
@
@tf ðq; tÞ 1
2@2
@q2qð1� qÞ
mðtÞ f ðq; tÞ� �
ð7Þ
In this case, the recovery time, s1, was set to 0, corresponding to theassumption that new mutations since the bottleneck do not make astrong contribution to the observed SFS. Because the bottleneckduration, s2, and the severity, m, are confounded parameters, we set s2¼ 0.01 and allow m to vary. With f(q,s2) as the numerical solution toEquation 7 evaluated at time s2, we calculate the background site-frequency spectrum qm as:
qm½i� ¼Z1
0
ni
� �qið1� qÞn�if ðq; s2Þdq ð8Þ
AIC as a test statistic for comparing non-nested models. Toproperly interpret differences in AIC between models, we simulated10,000 datasets of 111 nonrecombining loci under the null hypothesisof the best-fitting neutral bottleneck model using the ms coalescentsimulation program [59]. Because we did not allow recombinationwithin loci, these simulations conservatively account for the effects oflinkage. For each simulated dataset, we found the maximumcomposite likelihoods under each model (bottleneck, bottleneck plusmigration, multiple sweeps, and bottleneck plus sweeps) and
calculated the AIC value. The AIC statistic of model i is defined as:AICi ¼�2(lmaxi � ki) where lmaxi is the maximum likelihood undermodel i and ki is the number of free parameters in model i. We used K¼ AIC1 � AIC2 as a test statistic for comparing the bottleneck andalternative models using a one-tailed test: the p-value was estimatedas the proportion of simulations under the null distribution with K .Kobs.
Supporting Information
Figure S1. Clustering of Oryza Accessions Based on Neighbor-JoiningAnalysis of Concatenated STS Sequences
Numbers by branches are bootstraps of 1,000 replicates. Onlybranches with a bootstrap value higher than 60% for major clades(five or more accessions) are labeled. The monophyly of each ricevariety group is well supported, with the exception of tropical japonica.The accession M202-new is an elite temperate japonica line that hasbeen subjected to possible crosses with other groups, perhapsexplaining its inclusion within the tropical japonica.Found at doi:10.1371/journal.pgen.0030163.sg001 (409 KB EPS).
Figure S2. Frequency Distribution of Tajima’s D Values for All STSSampled in (A) indica, (B) tropical japonica, and (C) O. rufipogonFound at doi:10.1371/journal.pgen.0030163.sg002 (373 KB EPS).
Figure S3. The Distribution of Allele Frequency in O. rufipogon forDerived Alleles That Are at High Frequency in indica or tropicaljaponicaNotably, most alleles are at low to intermediate frequency in O.rufipogon, consistent with multiple selective sweeps in O. sativa, anddiscounting the possibility of misidentification of ancestral alleles orinterspecific introgression being responsible for the pattern observedin rice. HFD, high-frequency derived SNPs.
Found at doi:10.1371/journal.pgen.0030163.sg003 (390 KB EPS).
Figure S4. The Genomic Distribution of STS Fragments ContributingHigh-Frequency Derived SNPs in indica and tropical japonicaIn each group, high-frequency derived SNPs occur in ten of 12 ricechromosomes. Fragments containing high-frequency derived SNPscomprise a large portion of fragments containing any variation at allin each O. sativa group. In both rice groups, the sample of STSfragments used to construct the site-frequency spectrum is slightlylower than 111 due to missing data in O. meridionalis.Found at doi:10.1371/journal.pgen.0030163.sg004 (433 KB EPS).
Table S1. Oryza Accessions Used in the Study and Inferred AncestryCoefficients
Found at doi:10.1371/journal.pgen.0030163.st001 (45 KB XLS).
Table S2. STS Fragment Information and Silent Sites DiversityMeasures for the Various Oryza Groups
Found at doi:10.1371/journal.pgen.0030163.st002 (133 KB XLS).
Accession Numbers
The National Center for Biotechnology Information GenBank (http://www.ncbi.nlm.nih.gov/Genbank) ID numbers for the sequences andalignments discussed in this article are EF000002–EF010509.
Acknowledgments
We are grateful to two anonymous reviewers for suggestions thatmuch improved the manuscript.
Author contributions. RN, SRM, CDB, and MDP conceived theexperiments. ALC, KMO, and MDP designed the experiments. ALCcollected the data. ALC, SHW, RDH, and CDB analyzed the data. AB,AFA, NRP, TLY, and SRM and contributed materials/analysis tools.ALC, SHW, CDB, and MDP wrote the paper.
Funding. This work was funded by the US National ScienceFoundation Plant Genome Research Program..
Competing interests. The authors have declared that no competinginterests exist.
PLoS Genetics | www.plosgenetics.org September 2007 | Volume 3 | Issue 9 | e1631755
Polymorphism in Domesticated Rice

References1. Hancock JF (2004) Plant evolution and the origin of crop species.
Cambridge (Massachusetts): CABI Publishing. 313 p.2. Mannion AM (1999) Domestication and the origins of agriculture: an
appraisal. Prog Phys Geogr 23: 37–56.3. Darwin C (1859) On the origin of species. London: John Murray.4. Darwin C (1868) The variation of animals and plants under domestication.
London: John Murray.5. Armelagos GJ, Harper KN (2005) Genomics at the origins of agriculture,
part one. Evol Anthropol 14: 68–77.6. Diamond J (2002) Evolution, consequences and future of plant and animal
domestication. Nature 418: 700–707.7. FAO (2005) FAOSTAT data, in last update 2003. http://faostat.fao.org/site/
346/DesktopDefault.aspx?PageID¼346. Accessed 1 August 2007.8. Yu J, Hu SN, Wang J, Wong GKS, Li SG, et al. (2002) A draft sequence of the
rice genome (Oryza sativa L. ssp indica). Science 296: 79–92.9. Goff SA, Ricke D, Lan TH, Presting G, Wang RL, et al. (2002) A draft
sequence of the rice genome (Oryza sativa L. ssp japonica). Science 296: 92–100.
10. IRGSP (2005) The map-based sequence of the rice genome. Nature 436:793–800.
11. Takahashi N, Hamamura K, Tsunoda S, Sakamoto S, Sato Y (1997)Differentiation of ecotypes in cultivated rice. In: Matsuo T, Futsuhara Y,Kikuchi F, Yamaguchi H, editors. Science of the rice plant. Tokyo: Foodand agriculture policy research center. pp. 112–160.
12. Jackson MT (1997) Conservation of rice genetic resources: the role of theInternational Rice Genebank at IRRI. Plant Mol Biol 35: 61–67.
13. Oka HI (1988) Origin of cultivated rice. Tokyo: Japan Scientific SocietiesPress and Elsevier Science Publishers. 254 p.
14. Garris AJ, Tai TH, Coburn J, Kresovich S, McCouch S (2005) Geneticstructure and diversity in Oryza sativa L. Genetics 169: 1631–1638.
15. Glaszmann JC (1987) Isozymes and classification of Asian rice varieties.Theor Appl Genet 74: 21–30.
16. Tenaillon MI, Sawkins MC, Anderson LK, Stack SM, Doebley J, et al. (2002)Patterns of diversity and recombination along chromosome 1 of maize (Zeamays ssp mays L.). Genetics 162: 1401–1413.
17. Schmid KJ, Ramos-Onsins S, Ringys-Beckstein H, Weisshaar B, Mitchell-Olds T (2005) A multilocus sequence survey in Arabidopsis thaliana revealsa genome-wide departure from a neutral model of DNA sequencepolymorphism. Genetics 169: 1601–1615.
18. Nordborg M, Hu TT, Ishino Y, Jhaveri J, Toomajian C, et al. (2005) Thepattern of polymorphism in Arabidopsis thaliana. PLoS Biol 3: 1289–1299.
19. Pritchard JK, Stephens M, Donnelly P (2000) Inference of populationstructure using multilocus genotype data. Genetics 155: 945–959.
20. Cheng CY, Motohashi R, Tsuchimoto S, Fukuta Y, Ohtsubo H, et al. (2003)Polyphyletic origin of cultivated rice: based on the interspersion pattern ofSINEs. Mol Biol Evol 20: 67–75.
21. Zhu QH, Ge S (2005) Phylogenetic relationships among A-genome speciesof the genus Oryza revealed by intron sequences of four nuclear genes. NewPhytol 167: 249–265.
22. Vitte C, Ishii T, Lamy F, Brar D, Panaud O (2004) Genomic paleontologyprovides evidence for two distinct origins of Asian rice (Oryza sativa L.).Mol Genet Genomics 272: 504–511.
23. Londo JP, Chiang YC, Hung KH, Chiang TY, Schaal BA (2006)Phylogeography of Asian wild rice, Oryza rufipogon, reveals multipleindependent domestications of cultivated rice, Oryza sativa. Proc Natl AcadSci U S A 103: 9578–9583.
24. Second G (1982) Origin of the genic diversity of cultivated rice (Oryza-Spp)—study of the polymorphism scored at 40 isoenzyme loci. Jpn J Genet57: 25–57.
25. Tajima F (1989) Statistical-method for testing the neutral mutationhypothesis by DNA polymorphism. Genetics 123: 585–595.
26. Fay JC, Wu CI (2000) Hitchhiking under positive Darwinian selection.Genetics 155: 1405–1413.
27. Wright SI (2005) The effects of artificial selection on the maize genome.Science 310: 54–54.
28. Tenaillon MI, U’Ren J, Tenaillon O, Gaut BS (2004) Selection versusdemography: a multilocus investigation of the domestication process inmaize. Mol Biol Evol 21: 1214–1225.
29. Eyre-Walker A, Gaut RL, Hilton H, Feldman DL, Gaut BS (1998)Investigation of the bottleneck leading to the domestication of maize.Proc Natl Acad Sci U S A 95: 4441–4446.
30. Takahata N (1991) Genealogy of neutral genes and spreading of selectedmutations in a geographically structured population. Genetics 129: 585–595.
31. Tachida H, Iizuka M (1991) Fixation probability in spatially changingenvironments. Genet Res 58: 243–251.
32. Maruyama T (1970) On fixation probability of mutant genes in a subdividedpopulation. Genet Res 15: 221-&.
33. Lu HY, Liu ZX, Wu NQ, Berne S, Saito Y, et al. (2002) Rice domesticationand climatic change: phytolith evidence from East China. Boreas 31: 378–385.
34. Zhao ZJ (1998) The middle Yangtze region in China is one place where ricewas domesticated: phytolith evidence from the Diaotonghuan cave,northern Jiangxi. Antiquity 72: 885–897.
35. Normile D (1997) Archaeology—Yangtze seen as earliest rice site. Science275: 309–309.
36. Wakeley J, Hey J (1997) Estimating ancestral population parameters.Genetics 145: 847–855.
37. Kim Y, Stephan W (2003) Selective sweeps in the presence of interferenceamong partially linked loci. Genetics 164: 389–398.
38. Nielsen R, Williamson S, Kim Y, Hubisz MJ, Clark AG, et al. (2005) Genomicscans for selective sweeps using SNP data. Genome Res 15: 1566–1575.
39. Durrett R, Schweinsberg J (2004) Approximating selective sweeps. TheorPopul Biol 66: 129–138.
40. Nordborg M (2000) Linkage disequilibrium, gene trees and selfing: anancestral recombination graph with partial self-fertilization. Genetics 154:923–929.
41. Burnham KP, Anderson DR (1998) Model selection and inference: apractical information-theoretic approach. New York: Springer-Verlag.353 p.
42. Vigouroux Y, Mitchell S, Matsuoka Y, Hamblin M, Kresovich S, et al. (2005)An analysis of genetic diversity across the maize genome using micro-satellites. Genetics 169: 1617–1630.
43. Thuillet AC, Bataillon T, Poirier S, Santoni S, David JL (2005) Estimation oflong-term effective population sizes through the history of durum wheatusing microsatellite data. Genetics 169: 1589–1599.
44. Muller MH, Poncet C, Prosperi JM, Santoni S, Ronfort J (2006)Domestication history in the Medicago sativa species complex: inferencesfrom nuclear sequence polymorphism. Mol Ecol 15: 1589–1602.
45. Li C, Zhou A, Sang T (2006) Rice domestication by reducing shattering.Science 311: 1936–1939.
46. Sweeney MT, Thomson MJ, Cho Y, Park YJ, Williamson SH (2007) Globaldissemination of a single mutation conferring white pericarp in rice. PLoSGenet 3: e133. doi:10.1371/journal.pgen.0030133
47. Maynard Smith J, Haigh J (2004) The hitch-hiking effect of a favourablegene. Genet Res 23: 23–35.
48. Kaplan NL, Hudson RR, Langley CH (1989) The hitchhiking effect revisited.Genetics 123: 887–899.
49. McCouch SR, Kochert G, Yu ZH, Wang ZY, Khush GS, et al. (1988)Molecular mapping of rice chromosomes. Theor Appl Genet 76: 815–829.
50. Wu JZ, Maehara T, Shimokawa T, Yamamoto S, Harada C, et al. (2002) Acomprehensive rice transcript map containing 6591 expressed sequencetag sites. Plant Cell 14: 525–535.
51. Rozen S, Skaletsky HJ (2000) In: Krawetz S, Misener S, editors.Bioinformatics methods and protocols: methods in molecular biology.Totowa (New Jersey): Humana Press. pp. 365–386.
52. Olsen KM, Caicedo AL, Polato N, McClung A, McCouch S, et al. (2006)Selection under domestication: evidence for a sweep in the rice Waxygenomic region. Genetics 173: 975–983.
53. Swofford DL (2000) PAUP* Phylogenetic analysis using parsimony (* andother methods). Sunderland, Massachusetts: Sinauer Associates.
54. Sawyer SA, Hartl DL (1992) Population-genetics of polymorphism anddivergence. Genetics 132: 1161–1176.
55. Bustamante CD, Wakeley J, Sawyer S, Hartl DL (2001) Directional selectionand the site-frequency spectrum. Genetics 159: 1779–1788.
56. Bustamante CD, Nielsen R, Hartl DL (2003) Maximum likelihood andBayesian methods for estimating the distribution of selective effects amongclasses of mutations using DNA polymorphism data. Theor Popul Biol 63:91–103.
57. Williamson S, Fledel-Alon A, Bustamante CD (2004) Population genetics ofpolymorphism and divergence for diploid selection models with arbitrarydominance. Genetics 168: 463–475.
58. Williamson S, Perry SM, Bustamante CD, Orive ME, Stearns MN, et al.(2005) A statistical characterization of consistent patterns of humanimmunodeficiency virus evolution within infected patients. Mol Biol Evol22: 456–468.
59. Hudson RR (2002) Generating samples under a Wright-Fisher neutralmodel of genetic variation. Bioinformatics 18: 337–338.
PLoS Genetics | www.plosgenetics.org September 2007 | Volume 3 | Issue 9 | e1631756
Polymorphism in Domesticated Rice