Embed Size (px)
Citation preview

Illinois State University Illinois State University
ISU ReD: Research and eData ISU ReD: Research and eData
Theses and Dissertations
8-8-2017
Student Demographic And Academic Characteristics That Predict Student Demographic And Academic Characteristics That Predict
Community College Student Success In Online Courses Community College Student Success In Online Courses
Jennifer L. Davidson Illinois State University, [email protected]
Follow this and additional works at: https://ir.library.illinoisstate.edu/etd
Part of the Community College Education Administration Commons, Community College Leadership
Commons, Higher Education Administration Commons, Higher Education and Teaching Commons, and
the Instructional Media Design Commons
Recommended Citation Recommended Citation Davidson, Jennifer L., "Student Demographic And Academic Characteristics That Predict Community College Student Success In Online Courses" (2017). Theses and Dissertations. 788. https://ir.library.illinoisstate.edu/etd/788
This Dissertation is brought to you for free and open access by ISU ReD: Research and eData. It has been accepted for inclusion in Theses and Dissertations by an authorized administrator of ISU ReD: Research and eData. For more information, please contact [email protected].

STUDENT DEMOGRAPHIC AND ACADEMIC CHARACTERISTICS THAT PREDICT
COMMUNITY COLLEGE STUDENT SUCCESS IN ONLINE COURSES
Jennifer L. Davidson
190 Pages
Online student success is a concern for higher education institutions especially
community colleges with open enrollment admission. This study analyzed online student success
using online GPA (dependent variable) and both demographic and academic characteristics of
online students (independent variables) to determine which characteristics significantly
correlated to and predicted student success in online courses. The sample included an
unduplicated count of 4,046 online students enrolled in at least one online course during fall
2015 and spring 2016 at a public, Midwestern community college. Six research questions and
twelve hypotheses were used to determine which independent variables led online students to a
higher online GPA. Analysis was completed separately for students taking at least one online
course and students taking only online courses using descriptive statistics, t tests, correlation
coefficients, cross-tabulations, and logistic regression. The most significant finding was a large
positive relationship between cumulative GPA and online GPA. There was also a significant,
positive correlation between online GPA and cumulative credit hours as well as online GPA and
number of online courses taken. There was a significant, negative correlation between online
GPA and course withdrawals. Additionally, a higher online GPA was identified for older,
female, and White online students while a lower online GPA was found for Black online
students. Findings also indicated a significant difference in online GPA for both online student

groups based on computer experience and remedial coursework along with a significant
difference in online GPA just for online only students based on financial aid.
KEYWORDS: Distance education; Online learning; Online courses; Student success;
Demographic characteristics; Academic characteristics; Predictor variables; Correlation;
Community college

STUDENT DEMOGRAPHIC AND ACADEMIC CHARACTERISTICS THAT PREDICT
COMMUNITY COLLEGE STUDENT SUCCESS IN ONLINE COURSES
JENNIFER L. DAVIDSON
A Dissertation Submitted in Partial
Fulfillment of the Requirements
for the Degree of
DOCTOR OF PHILOSOPHY
Department of Educational Administration and Foundations
ILLINOIS STATE UNIVERSITY
2017

Copyright 2017 Jennifer L. Davidson

STUDENT DEMOGRAPHIC AND ACADEMIC CHARACTERISTICS THAT PREDICT
COMMUNITY COLLEGE STUDENT SUCCESS IN ONLINE COURSES
JENNIFER L. DAVIDSON
COMMITTEE MEMBERS:
Mohamed Nur-Awaleh, Chair
Lydia Kyei-Blankson
James Palmer
John Rugutt

i
ACKNOWLEDGMENTS
I am truly thankful to have successfully persisted to the end of my doctoral journey, and
getting to this point would not have been possible with understanding, encouragement, and
support from numerous people. First, I would like to thank Dr. Michael LaRocco, Dr. Lyle
Hicks, Dr. Don Maier, and Dr. Jim Haefner who served as mentors throughout my career and
wrote letters of support for my admission into the doctoral program. Next, I would like to thank
my chair, Dr. Mohamed Nur-Awaleh. From the very beginning when I was just inquiring about
admission into the Ph.D. program as well as throughout my coursework and the completion of
my dissertation, Dr. Nur-Awaleh was encouraging and supportive providing guidance during
each phase of the degree. I am truly grateful that he believed in my abilities to complete the
program, and he pushed me to present my work at conferences. In addition to my dissertation
chair, I am also thankful to have had an outstanding dissertation committee: Dr. Lydia Kyei-
Blankson, Dr. James Palmer, and Dr. John Rugutt. Each committee member also taught at least
one of my classes during the program, so they each consistently offered wonderful suggestions
and challenged me with questions which led me to a better dissertation in the end.
I cannot thank my family enough for allowing me to pursue my long-time dream. I
dedicate this work to my husband Eric along with my three children Ella, Jori, and Cody who
had to endure and sacrifice weekends without me each month as well as evenings and additional
nights and weekends when I had to skip different activities or events in order to go to class or
complete my assignments. My parents and relatives, although living at a distance, also played a
role in helping support me as I advanced through the program. I am also grateful for their
support.

ii
Throughout my program, I was lucky to have so many exceptional faculty members
teaching my courses each semester. Each one offered a different perspective and provided unique
contributions to my education. Thanks a million to Carol in the EAF office who was always so
helpful and quick to respond to any inquiry. I was part of the higher education weekend cohort
three which was another true blessing; each member of the cohort was a lifeline right when you
needed a hand. This tremendous group of individuals was always there with kind words and we
pushed each other to continue the journey each semester. I cannot imagine a better support group
to continue to stay connected with.
My coworkers, current and former, have also been a big help in asking me how things
were going throughout my program, and helping keep me accountable as I reached different
milestones along the way. Some of them were also going through a doctoral program at the same
time so it was great to have others to lean who understood what I was going through. A special
thanks to Dr. Kathleen Hickey who was willing to review my work to offer detailed feedback. I
also appreciated the assistance and support I received throughout my program from Nancy Koran
in the Information Technology Department as well as Dr. Sadya Khan and Aaron Roe in the
Institutional Research and Planning Department at the college where I work. These two
departments provided me access to data for various class projects over the last few years as well
as for my dissertation. I am forever grateful for their help.
I could not have gotten to this point without the support from each of these wonderful
people. My dream has become a reality, and each person mentioned above truly made a
difference in my life during this process. I thank you all from the bottom of my heart.
J. L. D.

iii
CONTENTS
Page
ACKNOWLEDGMENTS i
CONTENTS iii
TABLES x
FIGURES xiv
CHAPTER I: INTRODUCTION TO THE STUDY 1
Introduction 1
Higher Education Enrollment 1
Distance Education Enrollment 2
Distance Education Course Success 5
Background and Study Setting 5
Statement of the Problem 7
Purpose of the Study 9
Research Design and Questions 9
Definition of Terms 11
Conceptual Definitions 11
Operational Definitions 12
Theoretical Framework 14
Significance of the Study 19
Limitations 22
Summary 24
Organization of the Study 25

iv
CHAPTER II: REVIEW OF RELEVANT LITERATURE 26
Introduction 26
Problem Statement 26
Generations of Distance Education 27
Distance Education Theories 30
Autonomy 31
Structure 32
Dialogue 33
Distance Education Students 34
Impact of Distance Education on Higher Education 36
Factors Contributing to Online Student Success 37
Age 38
Gender 39
Ethnicity 40
Grade Point Average 40
Enrollment Status 41
Underprepared Students 42
Total Credit Hours 43
Online Coursework 43
Course Withdrawals 44
Other Factors 45
Distance 45
Time since last course 45
v
Computer experience 46
Financial aid 46
Online student groups 46
Summary 47
CHAPTER III: METHODOLOGY AND PROCEDURES 50
Introduction 50
Statement of the Problem 50
Purpose of the Study 50
Research Questions and Related Hypotheses 51
Research Design 54
Data Sources and Data Collection Procedures 55
Data Sources 55
Sample Population 56
Data Collection Procedures 56
Data Analysis 57
Ethical Considerations 60
Summary 60
CHAPTER IV: RESULTS, ANALYSIS, AND DISCUSSION 62
Introduction 62
Descriptive Statistics of Study Population 63
Enrollment 63
Gender 65
Age 66

vi
Distance from Campus 67
Ethnicity 70
Program of Study 71
Student Level 71
Enrollment Status 72
Course Enrollment 73
Time since Last Course 74
Course Withdrawals 76
Remedial Coursework 78
Financial Aid Award 80
Computer Coursework 81
Total Online Courses 82
Cumulative Credit Hours 83
Grade Point Average 84
Online Student Success 86
Successful online GPA 86
Successful online course grades 87
Research Issue 89
Research Question One 90
Distance from Campus and Online GPA 91
Financial Aid Award and Online GPA 93
Computer Experience and Online GPA 94
Remedial Coursework and Online GPA 95

vii
Research Question Two 97
Relationships between Study Variables 98
Age and Online GPA 99
Gender and Online GPA 100
Ethnicity and Online GPA 101
Research Question Three 104
Relationships between Study Variables 105
Cumulative GPA and Online GPA 108
Enrollment Status and Online GPA 109
Semester Gap and Online GPA 110
Course Withdrawals and Online GPA 111
Cumulative Credit Hours and Online GPA 112
Online Courses and Online GPA 113
Research Question Four 114
Online Student Regression Model 114
Online Only Student Regression Model 116
Research Question Five 118
First Regression Models 118
Online students 118
Online only students 119
Second Regression Models 120
Online students 120
Online only students 121

viii
Research Question Six 123
Online Student Regression Model 124
Online Only Student Regression Model 125
Summary 127
CHAPTER V: SUMMARY, CONCLUSIONS, IMPLICATIONS, LIMITATIONS, AND
RECOMMENDATIONS 130
Introduction 130
Overview and Purpose of Study 130
Study Population 131
Research Design and Methodology 131
Summary of Findings 133
General Study Outcomes 133
Research Question One 135
Distance 135
Financial aid 136
Computer experience 137
Remedial coursework 138
Research Question Two 139
Age 141
Gender 142
Ethnicity 143
Research Question Three 144

ix
Cumulative GPA 145
Cumulative credit 146
Online courses 146
Course withdrawals 147
Enrollment status 147
Semester gap 148
Research Question Four 149
Research Question Five 151
Research Question Six 154
Summary 155
Implications 157
Limitations 163
Recommendations for Future Research 165
Conclusions 168
REFERENCES 170
APPENDIX A: FACTORS PRIOR TO ENROLLMENT THAT IMPACT
ONLINE STUDENT SUCCESS 187
APPENDIX B: FACTORS AFTER ENROLLMENT THAT IMPACT
ONLINE STUDENT SUCCESS 188
APPENDIX C: RESEARCH USING EXISTING DATA TO EXAMINE
FACTORS OF ONLINE COURSE SUCCESS 189
APPENDIX D: APPROVED INSTITUTIONAL REVIEW BOARD
RESEARCH PROPOSAL FORM 190

x
TABLES
Table Page
1. Total Duplicated Credit Student Enrollment 64
2. Total Duplicated Online Student Enrollment by Semester and Type of Student 64
3. Overall Online Student Enrollment by Type of Student 65
4. Gender Comparison by Type of Student 65
5. Online Student Age by Type of Student 66
6. Traditional vs. Nontraditional Student Age by Type of Student 66
7. Age Groups by Type of Student 67
8. Residency Status by Type of Student 68
9. Summary of Miles from Campus by Type of Student 69
10. Distance from Campus by Type of Student 69
11. Ethnicity Comparison by Type of Student 70
12. Program of Study by Type of Student 71
13. Student Level by Type of Student 72
14. Enrollment Status by Type of Student 73
15. Total Course Enrollment Summary by Semester and Type of Student 73
16. Number of Courses Taken by Semester and Type of Student 74
17. Summary of Semesters since Last Course by Semester and Type of Student 75
18. Semesters since Last Course by Semester and Type of Student 76
19. Course Section Withdrawals by Semester and Type of Section 77
20. Number of Course Withdrawals by Type of Student 77
21. Summary of Course Withdrawals by Type of Student 78

xi
22. Percent of Remedial Courses Taken by Semester 78
23. Number of Remedial Courses Taken by Semester and Type of Student 79
24. Percent of Students with Financial Aid Awards by Semester and Type of Student 80
25. Summary of Financial Aid Awards by Semester and Type of Student 81
26. Number of Computer Courses Passed by Type of Student 81
27. Computer Courses Passed since 2010 for Online Students 82
28. Online Course Summary by Semester and Type of Student 82
29. Number of Online Courses by Type of Student 83
30. Summary of Cumulative Credit Hours Earned by Semester and Type of Student 84
31. Online GPA Count by Semester and Type of Student 85
32. Mean GPA by Semester and Type of Student 86
33. Online GPA 2.0 and Higher by Semester and Type of Student 87
34. Overall Course Sections by Semester and Type of Section 87
35. Online Course Sections Passed with A, B, or C Grades by Semester 88
36. Online GPA Summary by Type of Student 91
37. Online GPA Means by Distance and Type of Student 92
38. Online GPA Means by Financial Aid Award and Type of Student 93
39. Online GPA Means by Computer Experience and Type of Student 94
40. Online GPA Means by Remedial Coursework and Type of Student 96
41. Correlation Coefficients between Online GPA and Online Student
Demographics 98
42. Correlation Coefficients between Online GPA and Online Only Student
Demographics 99
43. Online GPA and Age Cross-tabulation by Type of Student 100
xii
44. Online GPA and Gender Cross-tabulation by Type of Student 101
45. Online GPA 2.0 and Higher by Ethnicity and by Type of Student 102
46. Online GPA and Ethnicity Cross-tabulation by Type of Student 103
47. Correlation Coefficients between Online GPA and Academic Variables for
Online Students 106
48. Correlation Coefficients between Online GPA and Academic Variables for
Online Only Students 107
49. Online GPA and Cumulative GPA Cross-tabulation by Type of Student 108
50. Online GPA and Enrollment Status Cross-tabulation by Type of Student 110
51. Regression Coefficients for Demographic Characteristics of Online Students 115
52. Regression Coefficients for Demographic Characteristics of Online Only Students 117
53. Regression Coefficients for Academic Characteristics of Online Students
(First Model) 119
54. Regression Coefficients for Academic Characteristics of Online Only Students
(First Model) 120
55. Regression Coefficients for Academic Characteristics of Online Students
(Second Model) 121
56. Regression Coefficients for Academic Characteristics of Online Only Students
(Second Model) 122
57. Regression Coefficients for Demographic and Academic Characteristics of Online
Students 125
58. Regression Coefficients for Demographic and Academic Characteristics of
Online Only Students 126
59. Summary of Significant Mean Difference in Online GPA by Type of Student 136
60. Correlation Summary for Online GPA and Demographic Characteristics
by Type of Student 140
61. Chi-Square Summary for Online GPA and Demographic Characteristics
by Type of Student 141

xiii
62. Correlation Summary for Online GPA and Academic Characteristics
by Type of Student 144
63. Chi-Square Summary for Online GPA and Academic Characteristics
by Type of Student 145
64. Demographic Predictors of Online GPA by Type of Student 150
65. Academic Predictors of Online GPA by Type of Student (First Models) 152
66. Academic Predictors of Online GPA by Type of Student (Second Models) 153
67. Demographic and Academic Predictors of Online GPA by Type of Student 154

xiv
FIGURES
Figure Page
1. Initial Conceptual Model of Demographic and Academic Online Student
Characteristics that Impact Online Student Success 18
2. A Model of the Demographic and Academic Online Student Characteristics
that Predict Online Student Success for the Overall Online Student Group 156
3. A Model of the Demographic and Academic Student Characteristics
that Predict Online Student Success for the Online Only Student Group 157

1
CHAPTER I: INTRODUCTION TO THE STUDY
Introduction
Online courses have become regular offerings at all types of higher education intuitions
to better serve a diverse population of students. In fall 2015, nearly 20 million students attended
colleges and universities in the United States; 29.8% had taken an online course at some point
during their program, 15.4% were currently enrolled in at least one online course, and over
14.4% were solely taking online courses that semester (National Center for Education Statistics,
2016). Comparable online enrollment figures were found for undergraduate students and two-
year, public college students such as those at the community college from this study. With an
increased popularity of online courses, it is key for colleges to understand demographic and
academic characteristics of online students that lead to successful online course completion.
Higher Education Enrollment
Enrollment at higher education institutions in the United States dropped more than
662,000 students or 3.2% between fall 2012 and fall 2015; this change was triggered by a nearly
10% decline in enrollment at undergraduate two-year schools during this time (Allen & Seaman,
2017). When examining the overall fall 2015 higher education enrollment by type of institution,
the majority (72.3%) of students were enrolled at public institutions while 20.8% of students
studied at non-profit institutions, and only 6.9% of students studied at for-profit institutions
(Allen & Seaman, 2017). A downward enrollment trend was identified for all types of higher
education institutions between 2012 and 2015. Public institutions experienced an enrollment
decline of nearly 4%; there was a drop of nearly 3% for non-profit institutions; and enrollment
was down over 31% at for-profit institutions which led to a combined overall decline of 5% and
a drop of nearly a million students (Allen & Seaman, 2017).

2
In fall 2015, community colleges enrolled 41% of all undergraduate higher education
students, and 40% of first-time freshmen (American Association of Community Colleges, 2017);
however, enrollment at public two-year colleges in the United States decreased more than
885,000 students or 12.5% between fall 2009 and fall 2015 (National Center for Education
Statistics, 2016). When reviewing enrollment specifically at Illinois community colleges, there
was an overall 20.9% enrollment decline from 383,960 students down to 304,173 statewide
between fall 2009 and fall 2016 (Illinois Community College Board, 2017). The community
college in this study also experienced an enrollment decline over 15% within the same time
period dipping from over 17,750 students enrolled in credit courses in fall 2009 down to about
15,000 in fall 2016 based on census enrollment data from the Institutional Research and Planning
department (IR). With fewer students enrolling in higher education regardless of sector, the
competition to enroll these students has increased.
Distance Education Enrollment
Despite the overall shrinking of enrollment in higher education, the number of students
taking distance education courses, also known as online education and online learning, has been
steadily increasing (Allen & Seaman, 2017; Hart, 2012; Jost, Rude-Parkins, & Githens, 2012;
McIntire, 2015; Parke et al., 2010; Wilson et al., 2015). During fall 2015, over six million
students in the United States took at least one online course, and more than 2.9 million students
(one in seven students) took all their courses entirely online; nearly three-quarters of
undergraduate students (72.7%) taking online courses in fall 2015 were enrolled at public
institutions (Allen & Seaman, 2017). In addition, almost 30% of all higher education students in
fall 2015 were taking at least one course online which was an increase of 11% over fall 2012,
and half of these online students enrolled at public institutions; just about 50% of students taking

3
online courses in fall 2015 were taking all of their courses online (Allen & Seaman, 2017).
Within the Illinois community college system, the overall annual credit headcount for online
enrollments in the state increased 21.1% between 2010 and 2014, but there was only a 1.8%
increase between 2013 and 2014 (Wilson et al., 2015). The number of online students is no
longer expanding exponentially for all types of institutions; however, overall online enrollment
has continued to grow.
Distance education enrollment fluctuations between 2012 and 2015 varied by type of
institution and sector. Out of the over six million higher education students taking at least one
online course in fall 2015, most online students were enrolled at public institutions (67.8%),
17.8% of online students studied at non-profit institutions, and 14.5% were enrolled online at
for-profit institutions (Allen & Seaman, 2017). The largest enrollment growth for undergraduate
distance education between 2012 and 2015 was by far at non-profit, two-year schools (460%)
followed by non-profit four-year schools (41.7%) and public four-year schools (29.8%) (Allen &
Seaman, 2017). The largest decline in undergraduate distance education enrollment was at for-
profit institutions where the decline was more than 22% for both two- and four-year schools;
distance education enrollment at two-year public institutions was nearly flat with a slight decline
(0.6%) during this three-year period (Allen & Seaman, 2017). Graduate distance enrollment
increased at public institutions (20.4%) and non-profit institutions (33%), but declined at for-
profit institutions (-2.3%); online enrollment was impacted by large enrollment changes that
occurred at a few very large institutions (Allen & Seaman, 2017).
Up until fall 2015 community colleges continued to enroll the most students taking at
least one online course (Ginder & Stearns, 2014; Lokken, 2016; Pearson Foundation, 2011).
More specifically, Ginder and Stearns (2014) reported out of all public two-year college students

4
in fall 2012 over 670,000 students (9.8%) were enrolled exclusively in online courses, and nearly
1.2 million students (17.3%) were enrolled in some online courses. According to Allen and
Seaman (2017), between fall 2012 and fall 2015 distance education enrollment at public two-
year institutions declined by 11,462 students or -0.6%; the distance education enrollment for
public four-year institutions during the same time period increased by nearly 30%, or 425,714
students, making the total distance enrollment slightly higher in fall 2015 at public four-year
institutions than the public two-year institutions. For the first time in a dozen years, online
enrollments nationally for community colleges was flat during the 2015-16 academic years
(Lokken, 2017).
Along with increasing higher education distance enrollments, the number of high school
students in the United States taking online classes is also increasing (Picciano, Seaman, & Day,
2011). There are 25 states that have full-time, virtual K-12 charter schools that enrolled about
275,000 students in 2014-15 (Evergreen Education Group, 2015). More specifically, the number
of high school students in Illinois taking online courses through the Illinois Virtual School (IVS)
in fiscal year 2016 was 52.6% higher than in fiscal year 2015 (Illinois Virtual School, 2016). The
IVS was created by the Illinois State Board of Education to offer high school students across the
state fully online curriculum; IVS also supports local high schools and homeschool students by
providing expanded online course offerings that allow students the opportunity to make up credit
or take courses not available at their regular high school (Illinois Virtual School, 2016). In some
states such as Alabama, Florida, Michigan, Idaho, Virginia, Wisconsin, Georgia, and Tennessee,
high school students are mandated to take at least one online course to graduate (Sheehy, 2012).
Although Illinois has a lower number of K-12 students in online education than about two-thirds
of the other states with virtual schools (Evergreen Education Group, 2015), as more high school

5
students choose online courses, the demand and expectation for online courses to be widely
available in higher education will continue to expand.
Distance Education Course Success
While there has been tremendous growth in the number of students taking online courses,
the online course pass rates for these students are lower than they are for campus-based courses
(Hachey, Wladis, & Conway, 2012; Hart, 2012; Lehman & Conceicao, 2014; Moore & Kearsley,
2012; Xu & Jaggars, 2011a, 2011b). In addition, not all students are ready, academically or
physically, or able to engage with learning in an online environment which plays a role in their
lack of success (Xu & Jaggars, 2013). Consistently lower course success rates achieved by online
students demonstrate how critical it is to ascertain which specific factors impact successful
online course completion.
Due to the increased popularity and availability of online courses coupled with lower
online course success rates, colleges need to identify and address lower student performance
particularly for their online students. In order to make a positive impact on online student
success, this study examined existing online student data from one community college. The
purpose was to uncover correlates and predictors of online student success that could be used to
increase success for current and future online community college students.
Background and Study Setting
This study was conducted at a community college in the Midwest where there are
currently thousands of students enrolled in hundreds of online, credit-bearing course sections
offered each semester. According to the fall 2015 census, the Institutional Research and Planning
(IR) department reported there were 2,353 students taking one or more online credit courses
generating a total of 10,282 credit hours. When this online student credit enrollment figure

6
(2,353 students) is compared to the total college credit headcount (15, 016 students), 15.6% of all
students took an online course in fall 2015 or approximately one in six students. Credit
headcount for online courses increased by 8.7% (n = 188) between fall 2014 and fall 2015 while
the overall credit headcount for the college decreased by 1.8% (n = 270) during the same time
period.
During fall 2015 half of these 2,353 online students were enrolled full-time, and 62%
identified as female. Nearly three-fourths were enrolled in a transfer degree program. The
majority (85% or n = 1,993) of these online students had taken previous college courses online.
The average age of online students was 25 years old. More than half (57% or n = 1,333) of the
online students were between 17 and 22 years old, and nearly a quarter (24% or n = 566) were
between 23 and 30 years old. Most online students enrolled in just one (69% or n = 1,620) or two
(23% or n = 531) online courses. Many (71% or n = 1,673) of these online students were also
enrolled in classes that met on campus.
When specifically examining the enrollment data for online students during the last ten
years as provided by the college’s IR department, there were a few noticeable trends. When
comparing fall 2015 to fall 2006, the average age of online students at this college has decreased
from 26 to 25 years old. There was a 6% increase in online students under 23 years old as well as
a 4% increase in male students taking online courses. There were 13% more Hispanic students
enrolled in online classes while 19% fewer White students enrolled in online classes. Since fall
2006 the number of online course sections this college offered increased more than 80% from 92
to 166 online sections, and the online unduplicated credit student enrollment increased more than
50% from 1,564 to 2,353 online students during the same 10 year period. Based on these shifting

7
demographics for online students, colleges should regularly monitor the types of students
enrolling and successfully completing online courses to identify online student success factors.
In addition to shifting demographics for online students at this Midwestern community
college, lower course success rates for online students raise concerns due to the increasing
enrollment in online courses over the last ten years. Based on data gathered from the grade
dashboard made available by IR, the percentage of students who passed an online course with a
grade of A, B, or C in fall 2015 was considerably lower (63.9%) than students who passed an on-
campus (75.7%) or hybrid course (77.6%). Most of the courses offered in an online format at this
college are also offered either on-campus or in a hybrid format. The difference in course success
rates between on-campus and online students is alarming, and must be further examined and
addressed.
Statement of the Problem
The rising popularity of online courses at community colleges along with the lower
course success rates of online students emphasize the importance of identifying and better
understanding the factors that lead students to successfully complete online courses. Research
about the success of online students have shown increased access to distance education did not
lead to improved success in the online environment (Hachey et al., 2012; Lehman & Conceicao,
2014; Moore & Kearsley, 2012; Xu & Jaggars, 2011a, 2011b). Despite the lower student success
rates, online courses are critical because they assist students who would otherwise have no
means to pursue an education (Bettinger & Loeb, 2017, Clinefelter & Aslansian, 2016; Lokken,
2016). According to Clinefelter and Aslansian (2016) “up to 50% of online college students
would not have, probably would not have, or are unsure whether they would have attended their
current program if the program were not offered online” (p. 46). In addition to programs that are

8
completely online, colleges also allow residential students to take online classes. The
Massachusetts Institute of Technology (MIT) Office of Digital Learning (2017) completed a
recent pilot that allowed some residential students to take an online course because these students
needed flexibility to overcome stress and scheduling conflicts; the pilot results showed benefits
for the students including new teaching strategies such as real-time feedback and on-demand
learning. Xu and Jaggars (2013) concluded online courses allowed students to take extra courses
to assist in program completion despite the lower performance often noted for online students.
While online courses initially appear convenient, classes offered in this format have led to lower
course success rates.
When comparing online course success rates from this Midwestern community college to
other community colleges using the 2016 National Community College Benchmark Project
(NCCBP), data results are distressing. Nearly half of community colleges in the United States
participate in this annual benchmarking project, and data on success rates in online courses are
provided to the college’s IR department annually. The NCCBP is designed to help community
colleges benchmark their performance in 150 areas, and percentile ranks are calculated from all
data submitted. In fall 2014 the percentage of students from this Midwestern community college
who passed their online course with a grade of A, B, or C was 61.9%. This online course success
rate is an eight percentage point improvement over the success rate in 2007 (54%); however,
based on the latest NCCBP data this only positions the college in the 18th percentile for online
course success when compared to peer institutions. The college continues to fall below the
national median for online course success, which was 67% in 2014.
Moreover, the percentage of students who successfully completed their online course at
this Midwestern community college without withdrawing (regardless of final grade) increased
9
seven percent in the last eight years from 76% in fall 2006 to 83% in fall 2014; however, based
on NCCBP data the college is positioned in the 18th percentile for online course completion. The
college has been continuously below the national median for online course completion, which
gradually improved over time to 88% in fall 2014. These data show it is imperative for this
Midwestern community college to identify factors that can help improve online student success.
Purpose of the Study
The purpose of this study was to generate a conceptual model of online student success as
a function of student demographic and academic characteristics. The model was based on
previous models, and it was tested by examining existing online student data at a Midwestern
community college. Results from the quantitative analyses in this study can be used to predict
and increase community college student online course success over time. Data used for the study
included specific demographic and academic characteristics for students taking online courses as
well as online student grade data during the 2015-2016 academic year. Demographic student data
were collected by the college at the time of admission as part of the application and stored in the
student information system; academic student data were entered and updated each semester
during students’ enrollment at the college.
Research Design and Questions
This quantitative study used a correlational research design that explored several research
questions and tested various hypotheses. Research questions focused primarily on factors that
correlated with and predicted online course success based on academic and demographic
characteristics of online community college students. The dependent variable in this study was
online student success which was defined as students who persisted to the end of the course and
earned a grade of A, B, or C; an online GPA was calculated for each student based on all online

10
courses the student passed during the semester, and an online GPA of 2.0 or higher was
considered successful. The independent variables were different demographic and academic
student characteristics of online students. Six research questions guided this study:
1. What difference in online GPA exists based on an online student’s distance from campus,
financial aid award, previous computer courses passed, and remedial courses?
2. How do demographic characteristics of online students (age, ethnicity, and gender)
correlate to online GPA?
3. How do academic factors of online students (cumulative GPA, enrollment status, time
since last course, course withdrawals, cumulative credit hours, and total online courses
completed) correlate to online GPA?
4. Which demographic characteristics of online students most significantly predict a
successful online GPA?
5. Which academic factors of online students most significantly predict a successful online
GPA?
6. What combination of demographic characteristics and academic factors of online students
most significantly predicts a successful online GPA?
Based on the evidence identified through the literature review, a conceptual model of
online community college student success was generated. It was hypothesized that some
demographic and academic student characteristics significantly impact online student success.
More specifically, successful online community college students were theorized to be older,
White, and female. Additionally, it was theorized these successful online students had taken
courses more recently, were primarily enrolled part-time with no financial aid, had previous
online course experience, had completed more credit hours overall, had fewer previous

11
withdrawals, and had maintained a high overall GPA. Based on results identified in the study,
several implications and recommendations for continuous improvement were generated for
community colleges seeking to increase online course and program offerings.
Definition of Terms
The following explanations describe key conceptual and operational terms used as part of
this study.
Conceptual Definitions
Credit course. Any course offered by institutions of higher education that upon successful
course completion results in the award of credit hours on a student record.
Cumulative grade point average (GPA). A number that represents the average value for
all of a student’s final grades for all semesters of enrollment combined.
Distance education. Courses and programs in which students are learning in a separate
location than the teacher, and communication is facilitated using technology. Distance education
is also known as online education and online learning.
Dual enrollment. A high school student who is also enrolled in one or more college
courses.
Freshman or First-Year student. A student who has earned less than 30 credit hours.
Full-time student. A student who is enrolled in 12 or more credit hours during a semester.
Grade point average (GPA). A number that represents the average value for all of a
student’s final grades which is calculated at the end of each semester.
Nontraditional student. A student who is 25 years or older, and who is often working,
married, and has children or other outside responsibilities that conflict with taking courses.

12
Part-time students. A student who is enrolled in less than 12 credit hours during a
semester.
Sophomore or Second-Year student. A student who has earned at least 30 credit hours,
but has not earned a degree.
Traditional education. Courses and programs in which the student and the teacher
regularly meet face-to-face on the college campus.
Traditional student. A student who is less than or equal to 24 years old.
Operational Definitions
Computer experience. Experience related to whether or not a student had previously
completed and passed a computer-related college course with the grade of A, B, C, or D.
Course withdrawal. A course in which a student does not drop during the 100% refund
period, and a letter grade of W is recorded on the student’s record.
Credit hour. One unit of academic credit earned equals one credit hour. Total credit hours
includes all credit hours a student has earned.
Credit student enrollment. The count of students who are enrolled in credit-bearing
courses at the census point during each semester.
Distance from campus. The number of miles calculated using zip codes between the
college campus and the student’s home either within the community college district or outside of
the district boundaries.
Duplicated enrollment. Students who were enrolled during both fall 2015 and spring
2016 were counted once for each of these semesters, or twice in the overall enrollment count.
13
Enrollment status. Student enrollment status is determined by the number of credit hours
for which a student is enrolled during the semester. Full-time students are enrolled in 12 or more
credit hours while part-time students are enrolled in less than 12 credit hours during the semester.
Ethnicity. In this study, ethnicity was broken down into eight categories: American
Indian, Asian, Black, Hawaiian, Hispanic, White, more than one race, and International.
Gender. This variable was categorized as either male or female.
Hybrid course. A course in which students and faculty meet on campus for at least one-
third of the total course contact hours while using a learning management system for delivery of
the remaining course content.
Occupational program. A career certificate or an Associate of Applied Science degree
that is designed to provide students will skills to enter the workforce.
Online course. In this study online courses offered at least 80% of the content at a
distance using the Internet. This content is delivered via a learning management system,
including the facilitation of communication (faculty to student, student to student, and student to
content), collection of student work, and student performance assessment. Most online courses
are completed without having to visit campus in person, but some courses in this study required
students to come to campus for orientation and/or testing.
Online only student. A student who is only taking online courses during a semester.
Online student. A student who is taking at least one course online during a semester.
Online student success. Success in this study is identified as students who earned an
online GPA of 2.0 or higher for a semester.
Program of study. The certificate or degree a student is actively pursuing at the college.

14
Remedial coursework. Any courses under 100-level a student has taken to prepare for
college-level coursework.
Time since last course or semester gap. A calculation of the number of semesters between
fall 2015 or spring 2016 and the student’s previous semester of enrollment at the college.
Transfer program. A two-year degree that is designed to help the students transfer to a
four-year school where the students will pursue additional coursework or degrees.
Unduplicated enrollment count. Students who were enrolled during both fall 2015 and
spring 2016 were only counted once in the enrollment count.
Theoretical Framework
There are a variety of factors that impact online student success at community colleges,
and it is critical to understand the concepts related to this research topic that helped shape this
study. At community colleges across Illinois students are primarily nontraditional with an
average age of 30 years old; they are mainly enrolled part-time, and spend less time on campus
than students at residential colleges (Illinois Community College Board, 2016). This can lead
students to be less engaged with the campus, and students do not always understand what is
required for them to succeed in an online class. Whether students are ready or not, they often
enroll in online classes because they believe the courses will be easier since they do not have to
attend class on campus, or they enroll due to scheduling conflicts; however, background
characteristics, academic performance, lack of readiness, difficulties with technology, and lack
of contact and connection with faculty and other students in an online class can lead to isolation
and lower course success rates and attrition for some online students (Doherty, 2006; Hachey et
al., 2012; Harrell & Bower, 2011; Lehman & Conceicao, 2014).
15
Online student success rates have been defined in different ways by researchers which
has led to mixed findings and made it difficult to compare results from one study to another.
Many studies describe online student success based on completion of an online course with a
grade of A, B, C, or D while those who fail or withdraw from the online course are considered
unsuccessful (e.g., Aragon & Johnson, 2008; Dupin & Bryant, 2004; Fetzner, 2013; Muse,
2003). Other studies narrow the definition of successful online course completion to grades of A,
B, and C, considering those who withdraw or earn a grade of D or F to be unsuccessful (e.g.,
Hachey et al., 2012; Wilson & Allen, 2011; Wladis, Conway, & Hachey, 2015; Wojciechowski
& Palmer, 2005). Occasionally online student success has been defined simply as students who
pass an online class and only those who fail are unsuccessful because those who withdraw have
been excluded from the study (e.g., Doherty, 2006). Sometimes online student success has been
examined as student persistence to the end of the course regardless of final grade, and only
students who withdraw are considered unsuccessful (e.g., Harrell & Bower, 2011). With so many
different definitions of online student success, it is more challenging to determine how the results
of one study relate to those of another.
At present there is no validated model for increasing online student success or reducing
online student attrition (Wladis et al., 2015). Reasons why students drop out of online courses
and college are not all clear cut; multiple variables influence student decisions, making online
course dropout more difficult to understand. Community colleges serve a large population of
nontraditional students who typically lack social connections to the college, and enter college
with a wide range of experiences and abilities (Johnson, Mejia, & Cook, 2015). Because
community colleges are open-access institutions, not all students are ready to take college-level
courses or courses offered in an online format. Although students who need developmental

16
courses do not necessarily have a significantly different online course completion rate (Aragon &
Johnson, 2008), students with lower academic readiness often have poor performance because
they do not always acclimate easily to the online course environment (Jost et al., 2012; Xu &
Jaggars, 2011b). Students with higher previous academic performance and more years of
education completed are more likely to succeed in online courses while students with
unsuccessful prior attempts are more likely to fail in future online course attempts (Fisher, 2010;
Hachey et al., 2012; Harrell & Bower, 2011; Moore & Kearsley, 2012). Students’ lack of
readiness along with the differences between face-to-face and online classes compound the
difficulties some students face when taking online classes.
The model of nontraditional student attrition developed by Bean and Metzner (1985), and
subsequently modified by Metzner and Bean (1987), is a starting point for a theoretical
framework for online student success. This model employs Tinto’s (1975, 1982, 1988) model of
dropout behavior; however, Bean and Metzner recognized the foundation of Tinto’s work was
focused on traditional students who attended a residential four-year university and dropped out
of college due to a lack of social and academic integration on campus. Bean and Metzner knew
that nontraditional students are less integrated into their institutions because they are older, part-
time students living off-campus; their model downplayed the social interaction emphasized in
Tinto’s (1975) work, and instead focused on outside factors that have an important influence on
nontraditional student attrition. Bean and Metzner’s (1985) model consisted of four sets of
factors that impact dropout decisions: (a) poor academic performance; (b) intent to leave; (c)
defining variables (age, enrollment status, and residence) and background variables (educational
goals, high school performance, ethnicity, and gender); and (d) environmental variables (work,

17
support, family responsibilities, and finances). In this model environmental factors are highly
important.
Similarly, Kember (1989, 1990) created a model of dropout for distance education that
was adapted from Tinto’s (1975) model of dropout behavior and Bean and Metzner’s (1985)
nontraditional student attrition model; Kember recognized that Tinto’s model focused on
traditional students, and that Bean and Metzner focused on nontraditional students attending
classes on campus. Thus he developed a new model more suitable for distance education
students. Kember’s (1989, 1990) model described how entry characteristics led distance
education students down either a positive path of social and academic integration or a negative
path where external concerns led to academic incompatibility which impacted their success in an
online course.
More recently, Rovai (2003) created a persistence model to better identify which online
students are more likely to persevere as well as those who are most likely to drop out of online
courses. Rovai synthesized elements from Tinto’s (1975) traditional student integration model
with components from Bean and Metzner’s (1985) nontraditional student attrition model while
incorporating specific characteristics of distance learners. This newer model divided the student
factors prior to admission from those internal and external factors that impacted students after
they were admitted, theorizing how both sets of variables led to the decision to complete or drop
out of an online course. Although Rovai’s (2003) model is the newest one available to help
identify distance education students who are likely to drop out and be unsuccessful, this model
has not been validated and it is dated.
With the understanding that online students cannot succeed without persisting to the end
of a course, this study generated a conceptual model of online student success (see Figure 1)

18
based on demographic and academic characteristics of online students using a framework that
included elements primarily from the online persistence models developed by Kember (1989,
1990) and Rovai (2003) which were designed based on the earlier models from Tinto (1975) and
Bean and Metzner (1985). Many of these online success factors are determined before students
enter the community college (background and environmental variables) while other factors occur
after enrollment. Success factors examined as part of this study were grouped into two
categories: factors prior to enrollment and factors after enrollment. Each set of variables
interacted and impacted academic outcomes for online students.
Figure 1. Initial Conceptual Model of Demographic and Academic Online Student
Characteristics that Impact Online Student Success.
Although institutional data are readily available to help identify trends of online student
success, they are underutilized. This study used exiting data to determine which factors
significantly correlated with and predicted online student success since no prior in-depth analysis
had been completed on these data at this Midwestern community college. The conceptual model

19
in this study assumed academic performance and certain student demographic characteristics
impacted online student success.
Significance of the Study
In 2009, President Obama implemented a challenge for the United States to have the
highest proportion of college graduates in the world by 2020 which meant the United States
would have to increase its current number of graduates by 50 percent (U.S. Department of
Education, 2011). In response to this challenge, Illinois set a goal for 60 percent of all adults
between 25 and 64 years old to have a college credential by 2025; to help reach this goal,
benchmarks for number of credentials to be awarded each year are set through 2025 (Illinois
Community College Board, 2015). With the largest number of online students enrolled at public
institutions including the community college (Ginder & Stearns, 2014; Lokken, 2016; Pearson
Foundation, 2011), and with low course success rates identified for online students (Hachey et
al., 2012; Hart, 2012; Lehman & Conceicao, 2014; Moore & Kearsley, 2012; Xu & Jaggars,
2011a, 2011b) it will clearly impede the state’s credential attainment goals if online student
success does not improve.
Higher education institutions need to know more about factors that influence student
success in online courses because the interest and demand for distance education in predicted to
continue (Allen, Seaman, Poulin, & Straut, 2016). Carey (2015) stated “the number of additional
people who will want a college education over the next 20 years could exceed the number of
people who have ever been to college in all human history” (p. 224). Institutions need to identify
those factors that lead to online student success, and establish across campus collaboration and
commitment to increasing online student readiness and success.

20
This study used existing data so there was no direct benefit to the students who already
graduated or transferred; however, current and future online students will benefit from results of
this study. By understanding what leads to student success in online courses, this research will
assist in the development of a profile of students who will be most likely to successfully
complete online courses. Using this profile, the college can provide students with more realistic
online course expectations, and help students identify skills they need to successfully complete
online courses. It is critical to provide additional opportunities for online students to gather
course information and expectations before the semester begins to help them succeed.
Results of this study can be used to provide students with early access to information
about how to succeed in online classes that will lead to improved knowledge and awareness of
online course expectations; it will also provide students increased institutional support.
Improvement in online student readiness and support will increase online students’ confidence
and successful online course completion, in turn, leading more students to enroll in future online
classes. As online course completion rates improve and more students enroll in additional online
classes, online student retention across semesters and between years will also improve.
Increased online student retention will cause more online students to finish their degree
or certificate programs. Increasing college certificate and degree attainment is currently both a
state and a national goal (Illinois Community College Board, 2015; U.S. Department of
Education, 2011). Although credential attainment is important, “…what matters is the learning
inherent in that credential: the knowledge, skills and abilities a student has developed while
earning it” (Lumina Foundation, 2016, p.1). Increased learning and success will also lead to an
increased likelihood that community college students will successfully transfer to a four-year

21
institution to continue their studies. These changes in online student success, retention, and
degree completion would be significant for both students and for the institution.
Another group that might benefit from results of this study are online faculty. Results
from this study may lead to more efficient use of faculty support resources. Information gained
about how to best help online students succeed can be used to increase online faculty expertise
by delivering targeted, ongoing faculty training and support for online course design and
development. This training will help faculty improve their online teaching effectiveness, and
identify online students likely to struggle so they can provide early interventions. Ultimately,
online learning interventions should have a sizeable impact on successful online course
completion.
Research examining student success in online courses at the community college is
prevalent, but findings about the factors that predict online student success are mixed; student
success in online courses remains a problem. There is no single factor that can account for low
online student success (Fetzner, 2013) so obtaining data explaining why students complete or do
not complete online courses is critical. Findings from this study may provide the impetus for
future research related to factors that increase online student success. There is need for research
on whether factors that influence online student success vary by institutional type. It is also
possible results of this study may be significant in terms of future policy creation that could lead
this college to consider of minimum qualifications or registration restrictions for online courses
to increase online student success. As more evidence is gathered about student success in online
courses and programs, these data can provide leaders an opportunity to create positive change in
online student success.

22
Limitations
Merriam (2009) stated “all research designs can be discussed in terms of their relative
strengths and limitations,” and limitations are shortcomings of the study that impact the
conclusions that can be drawn from the results which should be disclosed (p. 50). As with all
research, there were some limitations to this study. Limitations included the sample population,
potential database errors, open access to online courses, the scope of the study, and the
quantitative research design.
The first limitation to the study was the sample population. The study focused on two
semesters of archival data from one community college; since those data included just one
instance in time, results may change during a different time period and they may not generalize
to other groups of students or other institution types which is a threat to external validity. A
future long-term quantitative study should be conducted to determine if research findings about
online student success vary over time, and if intervention strategies implemented to improve
online student success were effective.
In addition to the study sample limitations, there were limits to the accuracy of data in the
student information system. Demographic characteristics stored in the system were self-reported
by the students as part of their application. If the application was a paper version, it is possible
these data could have been entered into the system incorrectly. It is also possible the student did
not provide all of their background information so some data might be missing.
Based on both previous research and this study, some student characteristics increased
the chance for online course success such as cumulative GPA. At this community college there
were also no restrictions in place to stop students who were less likely to succeed from enrolling
in online courses regardless of their course history or GPA. Furthermore, students who were

23
taking online courses may or may not have preferred this course delivery method. Some students
might have taken an online class to speed up progress towards degree completion while others
might have enrolled in an online course because it was the only course that fit into their schedule
during a particular semester. These factors impacted online student success.
The scope of the study was another limitation. This study focused solely on demographic
and academic factors related to individual online students; however, these were not the only
factors that impacted online student success. Course design, student support, and faculty
preparation also played a significant role. While many individual online courses were offered at
this community college, there were no completely online programs of study available. Not all
active programs offered online courses so this limited the online course selection. Some online
courses at this community college required students to come to campus for in-person orientation
or proctored testing. Not all online students could take a course requiring campus visits, so this
limited which students could enroll in online courses. Also, if students were unaware of required
on campus meetings for an online course when they registered it may have led them to withdraw
or fail.
This study did not take into account online course design which was impacted by the
level of faculty training. Faculty at the community college in this study were only required to
take one internet course development workshop prior to teaching online for the first time.
Faculty then presented their developed online materials at a public forum where they described
and reflected on the development process they used to set up their online course. After that, no
additional online course development training was required for faculty who continue teaching
online. Online faculty were also not currently required to have student evaluations in their online

24
courses, so there was no formal mechanism to gather feedback from students about how the
course content, course design, or support factors contributed to their success in the online course.
Finally, since this study was solely quantitative, it would be beneficial to develop future
follow-up studies that incorporate different research methods such as observing or speaking
directly to students and faculty. Data analysis in the current study provided solid background
information for the current state of online student success at a community college; however, a
related future qualitative study would allow additional data to be gathered directly from online
students and online faculty which would help validate findings and develop a deeper
understanding of those data from the perspective of user experiences. Despite the limitations of
the study, findings were valuable and provided important analysis for data currently available
that had not been thoroughly investigated at this community college.
Summary
In order to meet the needs of higher education students with varied backgrounds
institutions have been offering more online courses and programs over the last dozen years
(Allen et al., 2016). While overall higher education enrollment is declining, these increased
online offerings have led to higher online enrollment (Allen et al., 2016; Jost et al., 2012;
McIntire, 2015; Parke et al., 2010; Wilson et al., 2015). Online courses increase access to higher
education, and they appeal especially to working students because they offer the benefit and
opportunity for scheduling flexibility. The negative consequence of this phenomenon is a lower
success rate for online students when compared to on-campus students (Hachey et al., 2012;
Hart, 2012; Jost et al., 2012; Lehman & Conceicao, 2014; Moore & Kearsley, 2012; Xu &
Jaggars, 2011a, 2011b). In order to reverse this trend, more data are needed about what leads to
25
student success in online courses. As information is collected strategies can be executed to
support online students and increase online course success.
Organization of the Study
Chapter one introduced the study by providing an overview of higher education
enrollment, distance education enrollment and course success, the statement of the problem, the
purpose and significance of the study, definition of terms, theoretical framework, research
questions, and limitations of the study. Chapter Two provides a summary of relevant literature
that describes the development of distance education and its students along with various factors
that impact success of online community college students. Next, Chapter Three describes the
quantitative research strategies and procedures utilized to examine the data for this study along
with ethical considerations. Chapter Four provides an in-depth description of the study’s results
for each research question. Finally, Chapter Five offers the summary, conclusions, implications,
and recommendations based on the study.

26
CHAPTER II: REVIEW OF RELEVANT LITERATURE
Introduction
Studies about the success of online students have shown that although access to distance
education has increased it has not lead students to equal success in the online environment.
Overwhelmingly, no significant differences in student learning outcomes have been identified
based on course delivery mode; however, research consistently identified lower student success
rates for online courses when compared to success rates in face-to-face courses with fewer online
students being retained until course completion (Hachey et al., 2012; Jost et al., 2012; Lehman &
Conceicao, 2014; Lokken, 2016; Moore & Kearsley, 2012; WCET, 2010; Xu & Jaggars, 2011a,
2011b). Occasionally, studies have shown that distance education students outperformed
campus-based students who were taking the same course with the same instructor (Neumann &
Neumann, 2016; U.S. Department of Education, 2009). Based on this information the learning
environment does not predict student success, and success varies for different types of students
and from one learning environment to another (Moore & Kearsley, 2012).
This review of relevant literature first aimed to examine the progression of distance
education along with the theories of distance education. Next, the review focused on the types of
students who take online courses, and the impact of distance education on higher education.
Finally, this review emphasized pre-enrollment and post-enrollment student factors that
contribute to online student success, including demographic and academic characteristics.
Related research for these various factors areas are included as part of this review.
Problem Statement
The rising popularity of online courses at the community college and the inconsistency in
success rates between online students and face-to-face students help underscore the importance

27
of identifying and better understanding the factors that lead students to successful online course
completion. Once online success factors are identified, colleges should examine their current
online student population along with their distance education policies and practices, and use the
findings to plan and implement interventions that will increase successful online course
completion.
Generations of Distance Education
Historically, distance education started as independent study, self-directed learning, and
open education (Wedemeyer, 1975); it progressed through several different generations over
time based on advances in technology including correspondence, broadcast radio and television,
audio and video conferencing, and computer or web-based education (Moore, 2003; Moore &
Kearsley, 2012). Each of these generations of distance education still exists today, and is used for
different purposes in different locations (Archer & Garrison, 2010). Each generation built upon
the available previous technology, and helped shape the expansion of distance education and the
way teaching at a distance was structured.
Correspondence education provided the groundwork for anyone without easy access to
education to study and receive instruction from home despite being located in a different place
than the instructor (Garrison, 1985). It helped bridge the time and distance barriers of education,
and it created the potential to educate a large number of students using printed materials and mail
service. This individualized type of education was quite different than face-to-face education. It
was cost effective, but it was basically one-way communication between teacher and student
with a significant delay in feedback (asynchronous distance education) based on the speed of
mail delivery, and this negatively impacted student satisfaction and dropout rates. There was also
criticism of the lack of quality for correspondence education (Archer & Garrison, 2010).

28
Education using broadcast radio for education emerged next. It had potential, but this
instructional method lacked support from faculty and administrators due to an absence of
interaction between instructor and student. Use of telephone and teleconferencing as a methods
of education developed and were also less viable because they only allowed for a limited number
of participants, and there were time constraints requiring everyone to be learning at the same
time (synchronous distance education) (Archer & Garrison, 2010; Garrison, 1985). Television
stations also began broadcasting instructional programs with the support of the Ford Foundation;
there was more support for this model than for radio, but the interaction was still deficient
(Moore & Kearsley, 2012).
The development of open universities starting in the late 1960’s provided a
comprehensive approach for offering programs for adults exclusively via distance education.
This expansion of distance education combined correspondence with audio and video as well as
radio and television, but initially these programs were set-up with no control over faculty,
resources, or academic credit and degrees (Moore & Kearsley, 2012). After learning from this
initial model, the concept of open universities spread, and these institutions developed and
retained control over all aspects of distance education: curriculum, faculty, support, and funding.
When audio and video conferencing began in distance education it provided the
opportunity for two-way communication which was closer to the traditional educational model
(Moore & Kearsley, 2012). Instructors could now teach a class in one location, and broadcast
audio and video from their classroom to students in another location which led to some
simultaneously group interaction (synchronous distance education). These early attempts at
interactive distance education allowed students and faculty to be together at the same time which
augmented quality, but the number of participants was limited, and technology was expensive

29
(Archer & Garrison, 2010; Garrison, 1985; Hurst, 2001). Finally, computer-based and internet-
based courses and programs became more commonly available after the World Wide Web was
developed. With the increased computer speed it led to the possibility of more efficient,
effective, and interactive education along with the tremendous improvement, growth, and
popularity of distance education.
The growth of distance education represented “one of the transformational innovations in
American higher education” (Thelin, 2011, p. 368). Online learning currently, much like
correspondence, radio, and television learning of the past, provides the learner with flexible,
innovative learning methods where learning is accessible when and where it is most convenient.
Distance education requires a shift in responsibility of learning from the teacher to the learner,
and places an increased emphasis on the course design and curriculum content itself.
Many shifts have occurred in distance education based on the evolution of technology.
Each method of distance education had different advantages and disadvantages based on the
interaction and independence available as part of class. Correspondence education led to an
awareness that education was possible outside of the traditional classroom methods; students
could maintain high independence, but interaction and quality was low. Audio and video
education allowed students both lower independence and lower interaction within class. Current
technology provides the potential for distance education courses to be more robust. Carey (2015)
explained that “organizations will need to use technology to provide something markedly better
than what traditional schools offer” (p. 89). Unfortunately, the credibility issues of the early
forms of distance education are still evident in higher education today. According to Allen et al.
(2016), just over 41% of institutions included distance education in their strategic plan, and less
than 30% of academic leaders believed their faculty accepted “the value and legitimacy of online

30
education” (p. 26); these trends have not improved in the last dozen years. Distance education
has promise because it currently allows institutions to expand their reach while offering higher
student independence and higher interaction within online courses than was available in the past,
but as shown by perpetually low online course success rates there is undeniably room for
improvement.
Distance Education Theories
The term distance education has been used interchangeably with online education and
online learning. Definitions for distance education have been around for nearly four decades.
Wedemeyer (1978) described learning using technology as having some key differences to
traditional classroom teaching: (a) teaching and learning happened anytime and anywhere even if
teachers and students were not in the same place at the same time; (b) greater responsibility for
learning was placed on the student; (c) used all effective teaching media and technology; and, (d)
provided the opportunity for teaching to adapt to individual differences (pp. 10-11). Similarly,
Keegan (1980) described distance education as having six main elements: (a) separation of
teacher and learner; (b) influence of an educational organization; (c) use of technical media; (d)
two-way communication between teacher and student; (e) possibility of occasional meetings;
and, (f) participation in industrialized form of education that separates distance education from
other forms of education (p. 33). These early definitions are comparable to more recent
definitions. For example, Moore and Kearsley (2012) defined distance education as “teaching
and planned learning in which teaching normally occurs in a different place from learning,
requiring communication through technologies” (p. 2), and they emphasized the importance of
using the term distance education instead of distance learning because the word education
designates a mutual experience involving both learners and teachers. Over time there has been

31
tremendous change and growth in distance education through the use of online courses and
programs, and technological innovations continue to shape distance education at all types of
higher education institutions.
Despite this growth no comprehensive, unifying theory for distance education or online
learning exists (Hachey, Conway, & Wladis, 2013; Garrison, Anderson, & Archer, 2010)
although some theories have been developed to specifically help colleges understand the features
of distance education that impact student success. The distance between the teacher and the
learner is historically what distinguished distance education from traditional education, and this
distance or separation influences teaching and learning. Three critical elements interconnected
with distance in teaching and learning are described in the theory of transactional distance
(Moore & Kearsley, 2012) including (a) learner independence (autonomy), (b) course design
(structure), and (c) two-way communication using technology (dialogue). These three elements
will be further discussed. Knowledge of these features leads to a better understanding of what
makes distance education different, and what factors impact distance education student success.
Autonomy
Student success in distance education depends on the needs and characteristics of the
learners, and autonomy consists of learner’s freedom to make self-directed decisions about
learning (Andrade, 2012; Moore & Kearsley, 2012). How a learner interacts with structure and
dialogue in a distance education course is explained through adult learning theory (Dewey,
1916/2013; Knowles, 1974; Lindemann, 1961/1989), constructivist learning theory (Bruner,
1985; Moore, 2016), and self-regulated learning theory (Andrade, 2012; Zimmerman, 2002).
These theories describe how adult students are independent individuals who come to campus
with much experience which allows them to be autonomous, and actively participate in their own

32
learning. Self-regulated learning allows students to efficiently create knowledge by having
responsibility for when, where, and how they learn; they take control of learning by actively
participating and relying more on themselves for the structure of the course than the instructor
(Andrade, 2012; Andrade & Butler, 2009). As these adult learners face new situations they shape
or construct their learning and actively create new knowledge through problem solving and
integrating new information using their prior knowledge and experience (Bruner, 1985; Dewey
1916/2013; Knowles, 1974; Lindeman, 1961/1989; Moore, 2016). When the distance education
learner is more self-directed and has a higher level of autonomy, he can be more comfortable
with greater transactional distance in a course that includes less dialogue and less structure while
a learner who is less independent will need increased dialogue and structure in the course to help
reduce transactional distance so he can be more successful.
Structure
Structure describes the specific course design components which vary by course and
instructor. Unlike traditional education, distance education courses are typically structured to
emphasize written communication which allows for additional reflection on the concepts that can
lead increased critical thinking skills (Garrison, Anderson, & Archer, 2000). Student success also
depends on how well the course structure meets the needs of the individual learners, and
promotes an online learning community. As clarified in the community of inquiry theory (Archer
& Garrison, 2010; Garrison et al., 2000, 2010), courses that create online community through the
interaction and interdependence of cognitive presence, social presence, and teaching presence
can improve student success. Teaching presence is the structure and processes used within the
class to facilitate an appropriate course design which allows participants to develop a sense of
belonging and a social identity as part of class communication (social presence); the presence of

33
the teacher also encourages communication and critical thinking that produces knowledge
(cognitive presence) (Archer & Garrison, 2010; Garrison et al., 2000; 2010). Teaching presence
for distance education depends on the technical ease, knowledge, and expertise of the faculty
members. Online course structure is critically related to how much dialogue will occur within the
course.
Dialogue
Dialogue refers to all interactions that take place during the course. There are three main
types of interactions for effective distance education: (a) student to student, (b) student to
instructor, and (c) student to content (Moore & Kearsley, 2012). Interaction and two-way
communication are used in distance education to minimize the detachment between instructor
and student. In distance education courses communication takes place through use of technology,
and as interaction within a distance education course increases it minimizes the distance or
isolation for the learner. Student success in distance education can be enhanced by increased
dialog and interaction along with the use of effective communication methods that capitalize on
technology to reach new audiences using a variety of teaching methods as described in the theory
of communication (Perraton, 1981) and the theory of teaching-learning conversations
(Holmberg, 1988, 1995). These theories explained how distance is minimized using guided two-
way conversation as a means to facilitate learning in distance education by promoting
independence and freedom of choice for students while enhancing personal relationships.
Throughout history, the student and the instructor were in separate locations for all
formats of distance education, and that distance often had an adverse effect on the teaching and
learning process. It is important to minimize the effect of transactional distance in order for
effective online learning to occur (Moore & Kearsley, 2012). Learner autonomy, dialogue, and

34
structure work together to increase or decrease the effect of transactional distance. Perfecting the
balance between autonomy, dialogue, and structure is difficult as each class has a variety learners
with different needs and abilities. Each one of these related theories in conjunction with
knowledge about transactional distance theory can provide a framework to help colleges identify
academic and demographic characteristics of online students that lead to an increased sense of
distance; this knowledge can lead to a better understanding of distance education students in
order to enhance student success. As more is discovered about what causes online students to
succeed, new theories can be developed and existing theories can be adapted to incorporate
additional dimensions relevant to improving distance education.
Distance Education Students
Overall enrollment in higher education in fall 2014 was over 20.5 million students, and
72% of these students were studying at public institutions (Poulin & Straut, 2016). The number
of these higher education students taking one or more distance education courses continues to
rise. Eighty-five percent of students taking online courses along with courses in other formats in
fall 2014 were enrolled at public institutions (Poulin & Straut, 2016). Close to 30% of two-year
students in fall 2014, had taken some or all of their courses online, and nearly 11% of those
students were taking courses exclusively online (National Center of Educational Statistics,
2015). Other recently predicted general trends of higher education included declining college
enrollment and high school graduates with increasing enrollments for students over 25 years old,
part-time students, non-White students, females, and students at public institutions (Hussar &
Bailey, 2016). When examining all higher education sectors, community colleges had the lowest
decrease in overall enrollment over the last five years including a decrease in the number of
students over 24 years old (Juszkiewicz, 2016). Community colleges in Illinois serve a majority

35
of public higher education students (65%) as well as two-thirds of minority students (Illinois
Community College Board, 2016).
According to the American Association of Community Colleges (2017), generally
community colleges students are attending part-time (62%) and taking credit classes (59%);
these students are largely White (48%), first generation (36%), single parents (17%) who are
working (62% of full-time students and 73% of part-time students work). During 2014 in Illinois,
the average age for online community college students was higher than a traditional college
students at 27.5 years old with a mean age of 23.6 years old; almost three-fourths of the online
community college students were White (72.7%), and nearly two-thirds (64.7%) were female
(Wilson et al., 2015). Additionally, Illinois community colleges reported a combined increase of
21% in online enrollments between 2010 and 2014, and in 2014 nearly 20% of all credit
enrollments were based on distance education (Wilson et al., 2015).
The online course format is convenient and provides access to education for busy learners
who also have other responsibilities such as work and family (Bailey, Jaggars, & Jenkins, 2015).
Early distance education courses and programs were originally intended to serve part-time, adult
learners (Matthews, 1999). Adult students who enrolled in distance education appreciated having
control over and making decisions about their learning (Lehman & Conceicao, 2014; Moore &
Kearsley, 2012). These older students were generally more motivated and self-directed; they had
life experiences to bring into the online class that helped them to understand how to apply the
course concepts directly to their work (Lehman & Conceicao, 2014). Recently, Clinefelter and
Aslanian (2016) found that students who are taking online courses are now younger, and they are
increasingly single with fewer children. Although the age of online students has been decreasing,
it was evident even as early as 1998 that some traditional-aged students were interested in using

36
online classes to ease their schedules (Matthews, 1999). As the online student profile changes,
institutions need to examine and rethink their approaches to student academic support and
services to ensure online students succeed.
Impact of Distance Education on Higher Education
Distance education has been around in many formats for more than a century; it has
expanded and changed with advances in technology. Distance education was developed based on
adult learning principles (Archer & Garrison, 2010; Moore, 2003), and it has become a very
central component in higher education. Adults have various situational, institutional, and
dispositional barriers to learning (Cross, 1981), and distance education initially existed to address
these barriers and provide access to education for adult students who would otherwise have no
opportunity to learn (Archer & Garrison, 2010; Holmberg, 1988; Saba, 2011). Now distance
education attracts all types of students who are willing to take online courses out of both
convenience and need.
Enrollment in distance education has grown exponentially over the last 20 years (Allen et
al., 2016). Technology has been used to automate, individualize, and improve teaching and
learning since the invention of programmed instruction using teaching machines in the early to
mid-1900s (Skinner, 1958). Despite the longevity and growing popularity for technology-based
higher education, it is still not completely acknowledged with equal quality and legitimacy as
traditional campus-based education (Allen et al., 2016). Although developments in technology
enhanced possibilities for communication and interaction in distance education it did not
improve student success. When distance education is compared to campus-based or traditional
education there is a long trend of growing distance education student participation rates;
however, there is also a trend of lower online student course success and completion rates that

37
needs to be addressed (Hachey et al., 2012; Hart, 2012; Johnson et al., 2015; Lehman &
Conceicao, 2014; Moore & Kearsley, 2012; Xu & Jaggars, 2011a, 2011b).
Factors Contributing to Online Student Success
The online course opportunities provided by community colleges are substantial, and the
research about which factors significantly impact online student success at the community
college is increasing, but results have been mixed. The goal of this review is to examine research
on distance education at the community college to identify the student factors that have the most
influence on student success in online courses. It is important to pinpoint factors and student
characteristics that are positively related to student success in online courses, and that influence
and help predict successful completion as well as non-completion of online courses at the
community college. Community college students are typically older students who attend part-
time due to their family and work responsibilities outside of the classroom; they choose online
courses because they believe it will be easier to fit them into their busy schedule, but research
has shown not all students who take online courses succeed.
Many factors that influence student success in online courses have been identified
through research, and they relate to three primary categories: student factors, course factors, or
support factors. This study emphasized how pre-enrollment and post-enrollment student factors,
including both demographic and academic characteristics, predicted community college student
success in online courses. Overall research revealed varied results for individual student factors
that impacted online success; even the factors that were significant predictors or correlates of
online success in some studies had no relationship or the opposite relationships to online student
success in other studies (see Appendices A and B). With conflicting research results, more data
analysis is needed to help predict online student success.

38
Based on the previous research findings, including over 20 studies examining existing
institutional data (see Appendix C), online student success for this study was predicted to be
significantly correlated with age, gender, ethnicity, grade point average, enrollment status,
cumulative credit hours, online course experience, and course withdrawals. Each of these factors
will be further examined.
Age
Research has identified a significant difference between community college students who
successfully completed an online course and those who did not based on student age. Recently,
Clinefelter and Aslanian (2016) found that students enrolling in online courses are now younger,
and they are increasingly single with fewer children. Many studies also identified younger
students were at risk of being less successful in online courses, and they needed additional
support to succeed (Cummings, 2009; Doherty, 2006; Gregory, 2016; McPhaul-Moore, 2013;
Moore, Bartkovich, Fetzner, & Ison, 2002; Muse, 2003; Porta-Merida, 2009; Riordan, 2013;
Williams, 2008; Wladis et al., 2015; Wojciechowski & Palmer, 2005; Xu & Jaggars, 2013).
These studies indicated older students were more likely to succeed in online courses while other
studies found no significant differences in successful online course completion by age (Akpom,
2013; Aragon & Johnson, 2008; Foster, 2012; Gibson, 2015; Jost et al., 2012; Riordan, 2013).
This study examined online student age as it related to online student success, and results
were significant. In spring 2016 the average age of online students was 34.9, and 58% of
students taking online courses at this Midwestern community college were 17 to 22 years old. If
younger students are increasingly more likely to enroll in online courses, and they are also less
likely to succeed, it is important for colleges to be prepared to intervene and assist to improve
online student success.

39
Gender
Some research revealed a significant difference between community college students who
completed an online course and those who did not based on gender. Females tended to enroll
more frequently in online courses because they needed the increased flexibility to fit classes in
with their other responsibilities (Aragon & Johnson, 2008; Doherty, 2006; Xu & Jaggars, 2011a).
Many studies identified a positive correlation between female students and online success
(Aragon & Johnson, 2008; Doherty, 2006; Porta-Merida, 2009; Wladis et al, 2015; Xu &
Jaggars, 2013). On the other hand, one study found women may be more likely to fail or drop out
of online science, technology, engineering, and mathematics courses (Wladis et al., 2015).
Additionally, differences have been identified in the impact of gender on online course success
based on lower and higher achieving students; in the lower GPA group, females earned
significantly higher grades than males, but in the middle and higher GPA groups no differences
were found in online success related to gender (Kupczynski, Brown, Holland, & Uriegas, 2014).
Numerous other studies also found no significant difference in online course success based on
gender even though females enrolled in online courses usually outnumbered males (Akpom,
2013; Bull, 2015; Cummings, 2009; Gregory, 2016; James, Swan, & Daston, 2016; Jost et al.,
2012; Moore et al., 2002; Riordan, 2013; Wilson & Allen, 2011; Wojciechowski & Palmer,
2005).
This study identified significant results when examining online student success and
gender. In spring 2016, 63% of students taking online courses at this Midwestern community
college were female. Since such a large percentage of online students are female, it is important
for the college to better understand what will help them succeed. Additionally, the percent of

40
male students taking online courses at this college is increasing, so if male students are at risk of
poor performance interventions should be planned to support them.
Ethnicity
Community colleges are open access institutions so most programs are available to any
student who applies; only some programs have selective admission criteria. Most studies showed
no significant difference between community college students who finished an online course and
those who did not based on race or ethnicity (Aragon & Johnson, 2008; Gibson, 2015; Jost et al.,
2012; Wladis et al., 2015). A few studies have identified a significant difference in online course
success rates based on ethnicity, and found White students were more successful than students of
other ethnicities (Berling, 2010; Bull, 2015; Moore et al., 2002; Palacios & Wood, 2016; Porta-
Merida, 2009; Rodriguez, 2011; Williams, 2008; Xu & Jaggars, 2013).
This study examined ethnicity as it related to online student success, and results indicated
it was a significant factor. At this Midwestern community college during fall 2015, 66% of
online students were White which is a decrease of 17% from fall 2006. If the number of minority
students taking online courses at this college has increased, and minorities are less successful in
online courses, it means an increasing number of students may be at risk for lower performance
in online classes so the college needs to plan ways to help these students.
Grade Point Average
Grade point average (GPA) has been the most significant predictor of online student
success across all studies examined. All studies examined showed GPA had a significant impact
in predicting community college student success in online courses. Research concluded a higher
GPA was related to lower course withdrawal rate (Aragon & Johnson, 2008; Harrell & Bower,
2011) and higher online course success (Akpom, 2013, Aragon & Johnson, 2008, Berling, 2010;
41
Bull, 2015; Cochran, Campbell, Baker, & Leeds, 2014; Cummings, 2009; Dupin-Bryant, 2004;
Foster, 2012; Gibson, 2015; Harrell & Bower, 2011; Hawkins, 2012; Jost et al., 2012; McPhaul-
Moore, 2013; Muse, 2003; Porta-Merida, 2009; Riordan, 2013; Rodriguez, 2011; Smith, 2005;
Wilson & Allen, 2011; Wladis et al., 2015; Wojciechowski & Palmer, 2005; Xu & Jaggars,
2013). If students have a lower GPA it could lead community college students to drop out
regardless of course format. Bettinger and Loeb (2017) and Xu and Jaggars (2013) both
identified negative effects to online course success for students with poor previous academic
performance. Bettinger and Loeb (2017) specifically found students who take online courses
earn a lower GPA, receive worse grades, learn less, and are more likely to drop out.
This study examined online student success based on cumulative GPA, and results were
significant. This Midwestern community college had not previously examined the GPA of its
online students in relation to their success. This study provided data to show successful online
students at this community college followed the same pattern as other studies having higher
GPAs.
Enrollment Status
The majority of community college students enroll part-time (Allen et al., 2016;
American Association of Community Colleges, 2017; Illinois Community College Board, 2016).
Some research indicated students enrolled in fewer total credit hours during the semester were
more likely to succeed in their online courses (Doherty, 2006; Gregory, 2016; Hawkins, 2012;
Moore et al., 2002; Riordan, 2013; Rodriguez, 2011) while other studies showed students
enrolling in more total hours were significantly more likely to complete their online courses
(Aragon & Johnson, 2008; Smith, Lange & Huston, 2012). Additionally, some studies found no

42
relationship between student enrollment status and final grades for online courses (Akpom, 2013;
Muse, 2003; Wladis et al., 2015; Wojciechowski & Palmer, 2005).
Although research showed mixed results for online student success based on enrollment
status, this study identified some significant results. More online students at this Midwestern
community college were attending part-time. In some cases part-time students were identified as
more likely to succeed in online courses. The college should do more to urge students to be
mindful of their course load if they choose to enroll in online courses.
Underprepared Students
Students who enroll in college have a wide range of abilities, and not all students are
ready for college-level classes. Students lack of readiness along with the differences between
face-to-face and online classes compound the difficulties some students face. Although students
who needed developmental courses did not necessarily have a significantly different online
course completion rate (Aragon & Johnson, 2008), students with lower academic readiness often
had poor performance because they did not always adapt easily to the online course environment
(Jost et al., 2012; Xu & Jaggars, 2011a, 2011b). Students with higher previous academic
performance and more formal education were more likely to succeed in online courses while
students who placed into remedial courses were more likely to fail in online course attempts
(Fisher, 2010; Hachey et al., 2012; Harrell & Bower, 2011; Jost et al., 2012). The success of
underprepared students was often hindered when they took online courses. Online course
completion rates have been lower for students who were referred into remedial courses based on
low placement scores (Xu & Jaggars, 2011a, 2011b, 2013).
Not all students are equally prepared for what to expect or what is required for success in
online classes which is evident due to their lower online course success rates. In order to help

43
students be more prepared for online classes, this study examined online student success
assuming students who took remedial courses were less successful. This Midwestern community
college had not previously examined remedial course taking for its online students. This study
confirmed online students were less successful if they were taking remedial courses and were
less prepared for college-level coursework.
Total Credit Hours
In most studies examined, significantly higher success rates were noted in online classes
for students who had completed more credit hours overall (Berling 2010; Bull, 2015; Cochran et
al., 2014; Cummings, 2009; Doherty, 2006; Dupin-Bryant, 2004; Foster, 2012; Gregory, 2016;
Moore et al., 2002; Smith et al., 2012; Wilson & Allen, 2011; Wojciechowski & Palmer, 2005).
The previous success in higher education helped these students succeed in their online classes.
One study found a significant negative relationship between credit hours earned and online
course success (Rodriguez, 2011), and students with fewer hours were more successful.
This study examined online student success finding cumulative credit hours earned was a
significant positive factor. This Midwestern community college had not previously examined the
total credit hours earned by its online students in relation to their success. This study confirmed
online students were more successful if they were further along in their program.
Online Coursework
Previous online course success was a significant predictor for future online course
success in nearly all studies examined. Students with previous successful online course
experiences were much more likely to succeed in future online courses while students with
unsuccessful prior attempts were more likely to fail in future online course attempts (Dupin-
Bryant, 2004; Hachey et al., 2013; Hachey et al., 2012; McPhaul-Moore, 2013; Moore et al.,
44
2002; Porta-Merida, 2009; Williams, 2008; Wladis et al., 2015; Wojciechowski & Palmer, 2005;
Xu & Jaggars, 2011b). Community college students who had more unsuccessful online course
attempts were less likely to be successful in future online courses, and future success was less
predictable for students with mixed previous online course success or no experience with online
courses (Smith et al., 2012). Two studies found no significant relationship between previous
online courses and future online course success (Apkom, 2013; Muse, 2003), and another study
found that students with fewer online courses completed were more likely to succeed in their
current online course (Smith, 2005).
This study examined online student success assuming students who had previously taken
online classes would perform better overall that those who have never taken an online class. This
Midwestern community college had not previously examined the previous coursework for its
online students in relation to their success. This study provided some significant research
findings indicating online students were more successful if they had already taken online
courses.
Course Withdrawals
Most research did not examine prior course withdrawals in relation to online course
success. Wojciechowski and Palmer (2005) identified a negative correlation between previous
course withdrawals and online student success; students who had more withdrawals were less
successful in their online courses. Research conducted by Cochran, Campbell, Baker, and Leeds
(2014) identified students who had previously withdrawn from their online courses were more
likely to withdrawn again leading to an unsuccessful online course attempt.
Since there was limited information in previous research about the connection between
previous course withdrawals and online student success, this factor was included in this study.

45
This Midwestern community college had not previously examined the number of previous
withdrawals of its online students. This study examined online student success assuming students
who had previously withdrawn from more classes would perform worse overall that those who
had fewer withdrawals. Some of the significant research findings supported this assumption.
Other Factors
There are some additional student characteristics that also impacted online student
success, but have been the subject of fewer studies. The following student factors were examined
as part of this study because this Midwestern community college had never examined those data,
and it also provided an original contribution to the sparse literature available in these areas: (a)
distance to campus; (b) time since last course; (c) computer experience; (d) financial aid award;
and (e) online student groups.
Distance. Research about how distance from campus influenced online student success in
higher education was very limited; only one study was identified. Hawkins (2012) identified a
negative relationship between distance and online student success. Although no significant
findings were identified for any online students in this study, results provided additional research
about how distance from campus impacted online student success.
Time since last course. Only one other study that examined how time off between
semesters of enrollment, or semester gap, impacted online student success was located. Muse
(2003) found a positive relationship between online student success and the time since the
students’ last course. Analyzing how semester gap influenced online student success in this study
added needed research findings. Results of this study showed this factor was not significantly
related to online student success.

46
Computer experience. Research is less available to help determine how computer
experience is related to online student success. Dupin-Bryant (2004) identified a positive
relationship between computer experience and online student success while Harrell and Bower
(2011) found that students who identified themselves as having higher technological skills had
lower online student success. Also, some studies did not find any significance between computer
experience and online success (Akpom, 2013, Cummings, 2009; Muse, 2003; Riordan, 2013,
Shaw, Burrus, & Ferguson, 2016). Based on limited research on how computer experience
impacted online student success, the significant research findings from this study were needed.
Financial aid. Some studies examined students who were eligible for financial aid or
who had accepted a financial aid award and found no significance related to their online success
(Aragon & Johnson, 2008; Berling, 2010; Foster, 2012; Gibson, 2015; Riordan, 2013). A few
studies, including this one, found a negative relationship between financial aid and online student
success (Gregory, 2016; Rodriguez, 2011) while one study identified a positive relationship for
students who were awarded financial aid (Bull, 2015). Significant results from this study added
needed research on the impact of financial aid on online student success.
Online student groups. Another way this study made a new contribution to existing
research about online student success was by analyzing data for two separate online student
groups: online students who also took courses in other formats and online only students. Few
studies separated these populations for analysis. James, Swan, and Daston (2016) explored
online student success by analyzing data about students who took courses exclusively online
separately from those who took a mix of both online and on campus courses. James et al. (2016)
found that students who took only some of their courses online attempted more credit hours and
were retained at a higher rate than those taking courses exclusively online or on campus. In

47
contrast, another study looked at students who had ever taken any online courses as just one
group and found successful online course completion rates were lower than successful on
campus course completion rates (Xu & Jaggars, 2011b). Studies separating online students into
multiple groups for analysis are limited, and should be subject to more investigation. At the
community college in this study, 71% of students taking online courses were also taking campus-
based courses while 29% of students were taking exclusively online courses. Based on these
figures it was important to determine if demographic and academic student characteristics related
to online course success were different between these two groups.
Overall research has shown primarily mixed results for factors that impact online student
success. In previous studies, community college student gender and ethnicity were less predictive
of success in online courses overall; however, GPA, age, previous credits earned, and prior
online course experience were more significant predictors for online student success. Variations
in research results could be based on the participants chosen for the studies, the differences in
definition of student success, the sample size used in the study, the fluctuation in community
college student registration patterns, or the types of courses the students took. With so many
variables and definitions to consider, it makes it more difficult to compare the research results
obtained.
Summary
Online course enrollment has been increasing for many years, and this trend is not
predicted to change in the near future (Allen et al., 2016). Clearly the growth, interest, and
demand for distance education have had a significant impact on community colleges and other
higher education institutions. Since research shows student success for online courses is lower
than it is for campus-based courses there is an increased need to continue to research online

48
education to help identify student factors that lead to increased success for online students
especially in the community college setting where the number of students enrolled in online
courses is the highest (Ginder & Stearns, 2014; Lokken, 2016).
Many studies have been conducted to identify which factors led to online student success
at community colleges, but there have been wide-ranging results; this leaves unanswered
questions about the most important factors impacting online student success and what colleges
should focus on to improve online student success rates. There are many variables for online
courses and programs that impact student success including student characteristics, course
design, and support factors. Due to the acknowledged lower success rates for online students it is
imperative to continue to identify the factors that help students succeed in the online learning
environment (Allen et al., 2016; Moore & Kearsley, 2012). Since community college online
student enrollment continues to increase and they serve the largest number of online students
ongoing research is needed specifically to help this population succeed as younger students
continue to enroll in online courses (Ginder & Stearns, 2014; Lokken, 2016; Pearson Foundation,
2011).
Student data is continuously collected and maintained at all institutions, and it should be
examined and analyzed more frequently to identify factors that can be used to help improve
online student success. This study explored community college student success factors, and the
results enhance the literature already available. The data obtained from this study can be used in
conjunction with previous research findings to design and implement initiatives intended to assist
online students. As more evidence is gathered about student factors that lead to success in online
courses and programs, these data can provide leaders in higher education with new knowledge

49
and an opportunity to improve student success and completion in distance education. The
research methods and procedures used during this study are described in Chapter Three.

50
CHAPTER III: METHODOLOGY AND PROCEDURES
Introduction
As previously noted, there has been a rise of online student enrollment in higher
education coupled with low online course success rates. In order to determine what factors
impact online student success, a quantitative study was conducted. This chapter will provide
details about the study population sample, research questions and design, data sources and
collection procedures, data analysis employed in this study as well as ethical considerations.
Statement of the Problem
The rising popularity of online courses at community colleges in light of the lower course
success rates of online students emphasize the importance of identifying and better
understanding the factors that lead students to successfully complete online courses. Research
about the success of online students have shown increased access to distance education did not
lead to improved success in the online environment (Hachey et al., 2012; Lehman & Conceicao,
2014; Moore & Kearsley, 2012; Xu & Jaggars, 2011a, 2011b). Despite the lower student success
rates, online courses are critical because they serve a population of students who would
otherwise have no means to pursue an education (Clinefelter & Aslansian, 2016; Lokken, 2016).
According to Clinefelter and Aslansian (2016) “up to 50% of online college students would not
have, probably would not have, or are unsure whether they would have attended their current
program if the program were not offered online” (p. 46). While online courses appear convenient
on the surface, classes offered in this format do not lead every student to success.
Purpose of the Study
The purpose of this study was to generate a conceptual model of online student success as
a function of student demographic and academic characteristics by examining existing online

51
student data at a Midwestern community college. Results from the quantitative analysis of this
study can be used to predict and increase community college student online course success over
time. Data used for the study included specific demographic and enrollment characteristics for
students taking online courses as well as online student grade data during the 2015-2016
academic year. These demographic data were collected by the college at the time of admission as
part of the application, and academic data were updated in the student record system at the end of
each semester during students’ enrollment at the college.
Research Questions and Related Hypotheses
This study analyzed existing data related to both demographic and academic
characteristics that impacted online student success. Success for online students was measured
based on students who earned a GPA of 2.0 or higher for all online courses during the semester.
The following research questions and hypotheses guided this study:
1. What difference in online GPA exists based on an online student’s distance from campus,
financial aid award, previous computer courses passed, and remedial courses?
H0: There is no significant difference in online GPA based on distance from campus,
financial aid award, previous computer courses, and remedial courses.
H1: There is a significant difference in online GPA based on distance from campus, financial
aid award, previous computer courses, and remedial courses.
In order to determine if differences existed between students who earned an online GPA of 2.0 or
higher and students who earned an online GPA under 2.0 based on distance from campus,
financial aid award, computer courses, and remedial courses, independent samples t-tests were
performed for each of the four independent variables using the Statistical Package for the Social
Sciences (SPSS).

52
2. How do demographic characteristics of online students (age, ethnicity, and gender)
correlate to online GPA?
H0: Age, ethnicity, and gender have no correlation to online GPA.
H1: Age, ethnicity, and gender have a correlation to online GPA.
In order to determine which independent demographic variables were significantly related to the
dependent variable online student success (students who earned online GPA of 2.0 or higher),
SPSS was used to compute the Pearson correlation coefficients. A two-way contingency table
was also created to evaluate whether statistical relationships existed between online GPA for
students and each independent demographic variable.
3. How do academic factors of online students (cumulative GPA, enrollment status, time
since last course, course withdrawals, cumulative credit hours, and total online courses
completed) correlate to online GPA?
H0: Cumulative GPA, enrollment status, time since last course, course withdrawals,
cumulative credit hours, and total online courses do not correlate to online GPA.
H1: Cumulative GPA, enrollment status, semesters since last course, course withdrawals,
cumulative credit hours, and total online courses have a correlation to online GPA.
Similar to research question two, Pearson correlation coefficients were computed using SPSS to
determine the relationship between online GPA for students as it relates to the various
independent academic variables. A two-way contingency table was also created to evaluate
whether statistical relationships existed between online student success and each independent
academic variable.
4. Which demographic characteristics of online students most significantly predict a
successful online GPA?

53
H0: Age, ethnicity, and gender do not predict a successful online GPA.
H1: Age, ethnicity, and gender predict a successful online GPA.
In order to answer research question four, logistic regression was conducted with SPSS to
determine which independent demographic student variables were predictors of a successful
online GPA.
5. Which academic factors of online students most significantly predict a successful online
GPA?
H0: Cumulative GPA, enrollment status, semesters since last course, course withdrawals,
cumulative credit hours, and total online courses completed do not predict a successful online
GPA.
H1: Cumulative GPA, enrollment status, time since last course, course withdrawals,
cumulative credit hours, and total online courses completed predict a successful online GPA.
In order to answer research question five, logistic regression was conducted to determine which
independent academic student variables were predictors of online student success.
6. What combination of demographic characteristics and academic factors of online students
most significantly predicts a successful online GPA?
H0: A combination of demographic characteristics and academic factors of online students
does not predict a successful online GPA.
H1: A combination of demographic characteristics and academic factors of online students
predicts a successful online GPA.
In order to answer research question six, a logistic regression model was conducted to determine
which combination of independent demographic and academic student variables were the best
predictors of online student success.

54
The academic and demographic variables that were part of this study and impacted online
student success could be grouped into two categories. Some factors related to the research
questions in this study were variables in place prior a student enrolling such as (a) age, (b)
gender, (c) ethnicity, (d) distance to campus, (e) financial aid award, and (f) time since last
course. Other variables did not come into place until after students started to take courses such as
(a) enrollment status, (b) cumulative credit hours, (c) remedial courses, (d) computer related
courses, (e) online courses, (f) course withdrawals, and (g) course format. All of the variables
impacted student outcomes including course completion and GPA. Figure 1 contains a
conceptual model of the variables prior to and after enrollment impacting online student success
used in this study.
Research Design
This study was conducted at a large, Midwestern community college. According to the
college’s research department, the college enrolls over 32,000 credit and noncredit students on
an annual basis. The focus of this correlational study was to test twelve hypotheses about online
course success based on academic and demographic characteristics of online community college
students. According to Creswell (2003) a quantitative research approach is appropriate when “the
problem is identifying factors that influence an outcome, the utility of an intervention, or
understanding the best predictors of outcomes” (p. 21-22). A quantitative method is also used
when the study is “an inquiry into a social or human problem, based on testing a theory
composed of variables, measured with numbers, and analyzed with statistical procedures, in
order to determine whether the predictive generalizations of the theory hold true” (Creswell,
2003, p. 2). This study was designed to use previous research findings to identify the correlates
of online student success as well as to isolate what student characteristics predict online student

55
success for this college. Since online course success has been lower than campus-based courses
at this college, identifying correlates or predictors of online success will allow the college to
understand the best ways to intervene to help online students succeed
Data Sources and Data Collection Procedures
This study was classified as exempt from Institutional Review Board (IRB) review by the
Office of Research Ethics and Compliance at Illinois State University, and submission of an IRB
protocol was not required. The research involved the use of existing data with student identifiers
removed so the project did not meet the definition of human subject research. Permission was
received for the study upon review by the study college’s IRB (see Appendix D). After project
approval by the study college, archival data comprised of community college students taking
online credit-bearing courses was provided to the researcher. Various demographic and academic
student characteristics along with course taking patterns for online students were extracted and
provided in the dataset.
Data Sources
For this study existing data for online credit students were extracted and compiled by the
college’s IR department using the student information system. This system stores all student
admissions data including student demographic and background information along with
academic performance data that is recorded for enrolled students at the end of each semester. The
benefit to using archival data is that these data already exist, and they do not have to be created.
According to Vogt, Gardner, and Haeffele (2012), secondary data analysis is a “type of archival
research conducted on data…that have been collected by others… not original to the researcher”
(p. 351). Data about online students at this college were readily available and had not previously
been analyzed. Data were provided to the researcher in Excel format for analysis.

56
Sample Population
The sample for this study included all degree and certificate-seeking students at one
Midwestern community college who took at least one online, credit course during fall 2015 or
spring 2016. The sample included both students who successfully completed their online
coursework during these semesters as well as those who were unsuccessful. Most of the online
students in this study also took courses in other formats during the semester. In addition to
looking at all students who took online classes, this study also analyzed students who only took
only courses separately. The total duplicated student enrollment count for this study was 4,903
online students during the two semesters combined, and there was a duplicated enrollment count
of 1,425 for online only students.
Data Collection Procedures
After receiving approval from the local college’s Institutional Review Board, existing
data including students taking online courses during fall 2015 and spring 2016 was obtained
from the college’s IR department. The data set included a variety of available independent
variables related to online student academic performance as well as student demographics and
enrollment characteristics as available including age, gender, ethnicity, grade point average,
enrollment status, program of study, credit hours attempted, credit hours earned, number of
course withdrawals, remedial coursework, number of online courses, distance from campus, and
transfer credit awards. Study variables were analyzed and comparisons were made to determine
which factors significantly predicted online student success for both online students who also
took courses on campus or in a hybrid format, and students taking only online courses.

57
Data Analysis
Data in this study were analyzed using SPSS. A correlational research design was used to
explore and examine the relationships among the variables (Green & Salkind, 2014). Correlation
analysis is appropriate for determining the degree of the relationship between variables, and this
design assisted in weighing variables against other variables without suggesting one caused
another (Vogt, Vogt, Gardner & Haeffele, 2014). The goal of the study was to find an association
between successful online course completion and demographic and academic student factors.
The correlations between variables were tested for statistical significance, and used to help draw
conclusions about what led to online student success.
Online course success was the dependent variable in this study, and it was determined
based on the students’ online GPA calculated by using final semester grades recorded in the
student record system, and included the dataset for all online courses completed during the
semester. SPSS was used to transform online GPA into two categories: successful online
students who received an online GPA of 2.0 or higher were coded as “1,” and unsuccessful
students who received an online GPA under 2.0 were coded as “0.” Students who dropped their
online courses within the refund period were excluded from the analysis because no grades
appear on record for these students. The independent variables included within this study were
student demographics and background characteristics as well as academic performance variables
as previously described. Online student data were analyzed to determine what factors were
significant in predicting online student success for each group: online students who took at least
one course online and students taking only online courses.
Both descriptive and inferential statistics were generated for online students and online
only students to show which factors most influenced and predicted online student success.

58
Descriptive analysis including percentages, means, and standard deviations were performed.
These data were a vital part of the narrative to provide “a key diagnostic role” that helped
pinpoint problems and led to deeper analysis (Vogt et al., 2014, p. 206). Descriptive statistics
were used to explore, understand, and summarize all of the data in this study.
Inferential statistics were utilized in order to analyze complex relationships among study
variables as well as to make predictions and draw conclusions about the online student success at
the community college (Vogt et al., 2014). First, independent samples t tests were performed to
determine if there was a significant difference in mean online GPA based on an online student’s
distance from campus, financial aid award, computer courses, or remedial courses. Overall, eight
t tests were completed: one for each of the four variables for both the online student group and
the online only student group. Effect size was calculated using a one-way analysis of variance
(ANOVA). Next, Pearson correlation coefficients were generated to measure the strength of the
association between online GPA, the dependent variable, and both the demographic independent
variables (age, gender, and ethnicity) and the academic independent variables (enrollment status,
time since last course, course withdrawals, cumulative credit, and online courses) in the study.
Correlation coefficients were examined for both the online student group and the online only
student group. Then, two-way contingency table analyses were generated for both the online
student group and the online only student group to help summarize the relationship between a
successful online GPA and demographic and academic student characteristics.
Additionally, a total of eight binary logistic regression models were constructed using the
enter method as part of the research design, four for online students and four for online only
students, to look at the effect of multiple predictors on the outcome of online student success.
Logistic regression is appropriate when the dependent variable (outcome) is categorical such as

59
the one in this study: successful or unsuccessful completion of an online course; this study
included a variety of independent variables, and when using multiple logistic regression these
variables can be of any type (Vogt et al., 2014). Using logistic regression helped explain and test
a model to predict the odds a student would successfully complete an online course (outcome or
dependent variable) based on the variance of the independent or known factors or predictor
variables (student characteristics and academic performance) (Vogt et al., 2014). The influences
of the different independent factors related to successful online course completion were
investigated using demographic characteristics first and then academic factors.
The first two logistic regression models were built to determine which demographic
student characteristics were significant in predicting online student success. Regression models
were built separately for all online students and online only students. The next two logistic
regression models were built to determine which academic student characteristics were
significant in predicting online student success. These two models used six academic
characteristics, and there was one model for all online students and another one for online only
students. Following these models, two additional models were built by eliminating three
academic characteristics that were not significant predictors in the previous models. Lastly, two
logistic regression models were built using both demographic and academic characteristics to
determine how a combination of factors were significant in predicting online student success for
online students and online only students.
The purpose of the data analysis in this study was to identify demographic and academic
characteristics that correlated with and predicted online student success. Existing student data at
one large community college were used for this study. Results were examined for both all online
students as well as online only students.

60
Ethical Considerations
Although this researcher was also employed as a dean at the community college where
the study took place, ethical procedures were used in collecting, analyzing, and reporting all
findings from these data. Only those data provided by the college’s IR department were used in
this study despite other data the researcher had access to as an employee in academic affairs at
the college. In order to gain access to data for this study, approval was sought and received
through a research request submission to the IR department at the Midwestern community
college (see Appendix D). After approval was received, the online student records were gathered
by the research office. Once the dataset was finalized, the data was de-identifed prior to analysis
so there was no way to trace the data back to any particular student. To maintain confidentiality
these data were kept secure at the residential dwelling in the researcher’s password protected,
private laptop. No unethical manipulation of these data was involved as part of the analysis that
would have skewed results in favor of the institution.
The research from this study involved no procedures for which written consent would
normally be required outside of the research context since data was not gathered from human
subjects. There was no risk associated or expected from this study, and results are only presented
as an aggregate. Benefits of the study justify any unforeseen or unintended risks.
Summary
This chapter detailed the research questions, research design, data sources and data
collection procedures, data analysis, and ethical considerations for this quantitative study.
Existing student record data were extracted from the student record system by the IR department
and provided in order for the researcher to examine academic and demographic factors that
impacted and predicted online student success. Data analysis included both descriptive and

61
inferential statistics. Descriptive statistics helped better understand the profile of online students
at this community college. The inferential statistics including t-tests, correlations, and cross-
tabulations were examined to see how online student success differed by student characteristics
or student performance. Eight binary logistic regression models were developed to determine
which variables helped to significantly predict online student success. Chapter Four will provide
specific details about results from the data analysis in this study.

62
CHAPTER IV: RESULTS, ANALYSIS, AND DISCUSSION
Introduction
The purpose of this study was to generate a conceptual model of community college
online student success as a function of student demographic and academic characteristics. Data
used in this study were obtained from a large, Midwestern community college. This quantitative
study used a correlational research design to identify the demographic and academic
characteristics that helped predict and draw conclusions about online student success. Results of
this study were guided by these six research questions:
1. What difference in online GPA exists based on an online student’s distance from campus,
financial aid award, previous computer courses passed, and remedial courses?
2. How do demographic characteristics of online students (age, ethnicity, and gender)
correlate to online GPA?
3. How do academic factors of online students (cumulative GPA, enrollment status, time
since last course, course withdrawals, cumulative credit hours, and total online courses
completed) correlate to online GPA?
4. Which demographic characteristics of online students most significantly predict a
successful online GPA?
5. Which academic factors of online students most significantly predict a successful online
GPA?
6. What combination of demographic characteristics and academic factors of online students
most significantly predicts a successful online GPA?
Detailed analyses of archival data were performed; this chapter presents a summary of the results
including both descriptive and inferential statistics.

63
Descriptive Statistics of Study Population
In order to examine the study population more closely, online students were divided up
into two groups for analysis. The first group studied included all students taking at least one
online course. In addition to the overall online student group, students enrolled in only online
courses were examined as a separate group to identify any differences that existed between the
groups. Analyses for data related to an individual online student such as (a) age, (b) gender, (c)
ethnicity, (d) distance from campus, and (e) enrollment status were typically completed using the
combination of unduplicated enrollment data from fall 2015 and spring 2016. Other analyses
were completed using fall 2015 or spring 2016 data; some examples include (a) time since last
course, (b) remedial coursework, (c) financial aid award, (d) cumulative credit hours, (e)
cumulative GPA, and (f) online GPA. Descriptive statistics for each variable will follow.
Enrollment
The total census day duplicated credit enrollment at this large, Midwestern community
college was 30,661 students during the 2015-2016 academic year: 15,016 students during fall
2015 and 15,645 students in spring 2016. This study focused only on online, credit students
seeking a degree or certificate. The college census day report for fall 2015 identified 2,353
students who had taken at least one online course during the semester, and of those students
2,345 were seeking a degree or certificate. The college census day enrollment report for spring
2016 identified 2,564 students taking at least one online credit course, and of those students
2,558 were degree or certificate seeking. As seen in Table 1, the overall duplicated online credit
student enrollment at the college during the 2015-2016 academic year was 4,903. These were all
degree and certificate-seeking students enrolled in at least one course online during one or both

64
of the two (fall and spring) semesters. This online enrollment figure represents 16% of the total
college duplicated enrollment during fall 2015 and spring 2016.
Table 1
Total Duplicated Credit Student Enrollment
Semester
Total Credit
Student
Enrollment
Online Student
Enrollment
Percent
Online
Fall 2015 15,016 2,345 15.6%
Spring 2016 15,645 2,558 16.4%
Total 30,661 4,903 16.0%
As seen in Table 2, out of the 4,903 online students enrolled online during the fall and
spring semesters 1,425 took all of their courses online; this figure represents 4.65% of the total
student enrollment, and 29% of the total online student enrollment. Out of the 2,345 online
degree and certificate seeking students in fall 2015, 679 (29%) took all of their courses online.
Similarly, 746 (29.2%) of the 2,558 degree and certificate seeking students took only online
courses in spring 2016. Conversely, about 71% of online students were also enrolled in hybrid or
face-to-face courses in addition to their online courses during these two semesters.
Table 2
Total Duplicated Online Student Enrollment by Semester and Type of Student
Semester Online
Students
Online Only
Students
Percent
Online Only
Fall 2015 2,345 679 29.0%
Spring 2016 2,558 746 29.2%
Total 4,903 1,425 29.1%

65
It is important to note that some students were enrolled in online courses during both fall
and spring semesters. There were 857 students who took online courses during both fall 2015
and spring 2016, and when these students were counted only once the unduplicated overall count
of online student enrollment was 4,046. There were 239 online only students enrolled during
both fall 2015 and spring 2016, and when these students were counted only once the
unduplicated count of online only enrollment was 1,186 students (see Table 3).
Table 3
Overall Online Student Enrollment by Type of Student
Type of Student
Duplicated
Online
Enrollment
Online Students
Enrolled in both
Semesters
Unduplicated
Online
Enrollment
Online Students 4,903 857 4,046
Online Only Students 1,425 239 1,186
Gender
The majority (61.8% or n = 2,500) of the online students enrolled during fall 2015 and
spring 2016 were female while only 38.2% (n = 1,546) were male. As shown in Table 4, the
gender for online only students was similar to the overall online student population: two-thirds
(66.3% or n = 786) of the students were female and one-third (33.7% or n = 400) were male.
Table 4
Gender Comparison by Type of Student
Online Students Online Only Students
Gender n % n %
Female 2,500 61.8% 786 66.3%
Male 1,546 38.2% 400 33.7%
Total 4,046 100.0% 1,186 100.0%

66
Age
The mean age for the online student population during fall 2015 and spring 2016 was
nearly 25 years old with a median of 22 years old, and mode of 19 years old. The students who
were taking only online courses were found to be older; the mean age was just over 28 years old,
the median was 25 years old, and the mode was 21 years old (see Table 5).
Table 5
Online Student Age by Type of Student
Type of Student N M Median Mode SD
Online Students 4,046 24.99 22.00 19.00 8.52
Online Only Students 1,186 28.32 25.00 21.00 9.73
The age range for online students was 16 years old to 65 years old. When reviewing the
online student population as either traditional (less than or equal to 24 years old) or
nontraditional students (greater than or equal to 25 years old), considerably more students were
younger. Table 6 shows over two-thirds (67.3% or n = 2,721) of the online students were
traditional aged while only about one-third (32.7% or n = 1,325) were nontraditional aged.
Table 6
Traditional vs. Nontraditional Student Age by Type of Student
Online Students Online Only Students
Age Groups n % n %
24 or under 2,721 67.3% 579 48.8%
25 and over 1,325 32.7% 607 51.2%
Total 4,046 100.0% 1,186 100.0%

67
The age of the online only students was higher than the age for the overall online student
population. Just over half (51.2% or n = 607) of the online only students were nontraditional and
just under half (48.8% or n = 579) were traditional students.
When inspecting the age groups for the overall online student population nearly half
(48.6% or n = 1,967) of these students were in the 18 to 21 year old group, more than one-fifth
(21.6% or n = 873) were in the 22 to 25 year old group, and 18.1% (n = 733) were in the group
of students who were over 30 years old (see Table 7). When examining age groups for online
only students there was a higher percentage of older students. The largest percentage (29.8% or n
= 353) of online only students were in the over 30 year old group while 27.3% (n = 324) were in
the 22 to 25 year old group followed closely by 26.1% (n = 309) of online only students who
were in the 18 to 21 year old group.
Table 7
Age Groups by Type of Student
Online Students Online Only Students
Age Groups n % n %
17 or under 33 0.8% 8 0.7%
18 - 21 1,967 48.6% 309 26.1%
22 - 25 873 21.6% 324 27.3%
26 - 30 440 10.9% 192 16.2%
Over 30 733 18.1% 353 29.8%
Total 4,046 100.0% 1,186 100.0%
Distance from Campus
When examining the residency status for online students the majority (82.3% or n =
3,329) lived within the community college district while about one-sixth (15.7% or n = 636) of
online students lived outside of the district. As shown in Table 8, there were also 70 (1.7%)

68
International students taking online courses and 11 (0.3%) online students who lived in another
state. Although 98% (n = 3,965) of students lived in Illinois including both in-district and out-of-
district students, there were also online students enrolled from six other states: Colorado,
Indiana, Iowa, Michigan, Tennessee, and Wisconsin.
As shown in Table 8, the residency status of the students who took only online classes
was similar to the overall online student group: 82% (n = 972) lived in the district while 17.3%
(n = 205) of the students lived outside of the district, and only a few (0.5% or n = 6) students
lived out-of-state or were International (0.3% or n = 3). Although 99.3% (n = 1,178) of online
only students lived in Illinois, there were also students taking all of their classes online who lived
in Colorado, Indiana, Michigan, Tennessee, and Wisconsin.
Table 8
Residency Status by Type of Student
Online Students Online Only Students
Residency Status n % n %
In-district 3,329 82.3% 972 82.0%
Out-of-district 636 15.7% 205 17.3%
Out-of-state 11 0.3% 6 0.5%
International 70 1.7% 3 0.3%
Total 4,046 100.0% 1,186 100.0%
The distance a student lived from campus was calculated in miles by entering the zip
code where the online student lived and the zip code for the main college campus using the zip
code distance calculator found at www.zip-codes.com. Students who lived in the same zip code
as the college were coded as zero miles. Two zip codes in the dataset were invalid leaving 134
different valid zip codes for 4,044 online students, and 1,185 online only students. Online
students lived an average of 9.02 miles from campus with a standard deviation of 20.25 (see
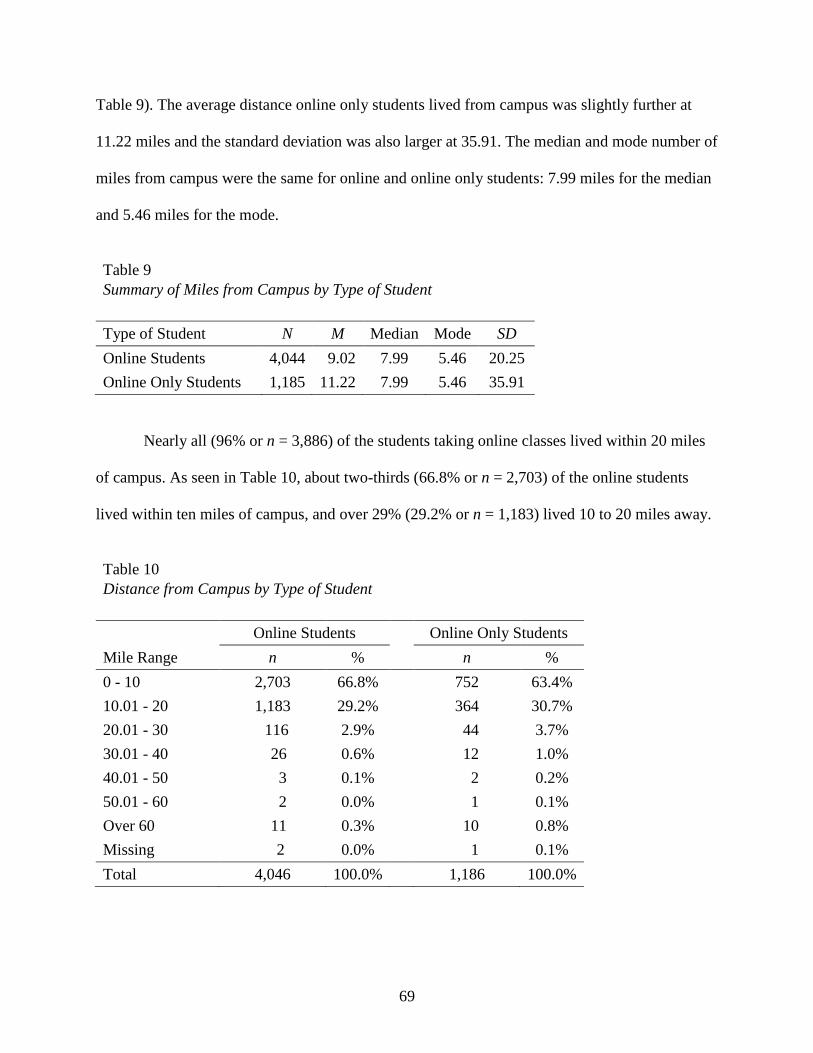
69
Table 9). The average distance online only students lived from campus was slightly further at
11.22 miles and the standard deviation was also larger at 35.91. The median and mode number of
miles from campus were the same for online and online only students: 7.99 miles for the median
and 5.46 miles for the mode.
Table 9
Summary of Miles from Campus by Type of Student
Type of Student N M Median Mode SD
Online Students 4,044 9.02 7.99 5.46 20.25
Online Only Students 1,185 11.22 7.99 5.46 35.91
Nearly all (96% or n = 3,886) of the students taking online classes lived within 20 miles
of campus. As seen in Table 10, about two-thirds (66.8% or n = 2,703) of the online students
lived within ten miles of campus, and over 29% (29.2% or n = 1,183) lived 10 to 20 miles away.
Table 10
Distance from Campus by Type of Student
Online Students Online Only Students
Mile Range n % n %
0 - 10 2,703 66.8% 752 63.4%
10.01 - 20 1,183 29.2% 364 30.7%
20.01 - 30 116 2.9% 44 3.7%
30.01 - 40 26 0.6% 12 1.0%
40.01 - 50 3 0.1% 2 0.2%
50.01 - 60 2 0.0% 1 0.1%
Over 60 11 0.3% 10 0.8%
Missing 2 0.0% 1 0.1%
Total 4,046 100.0% 1,186 100.0%

70
These figures were similar for online only students. There were 1,116 (94.1%) online only
students who lived within 20 miles of campus: the majority (63.4% or n = 752) lived within 10
miles of campus, and just over 30% (30.7% or n = 364) lived 10 to 20 miles away.
Ethnicity
Online students in this study reported a variety of ethnicities, and a summary of this
breakdown can be found in Table 11. The top three ethnicities represented by online students
were as follows: White (60.5% or n = 2,448) followed by Hispanic (16.6% or n = 672), and
Black (8.4% or n = 340). Only 2.4% (n = 97) of online students were Asian while 1.9% (n = 78)
of online students claimed more than one race. Additionally, 1.7% (n = 70) of online students
were International, and 0.2% (n = 10) were American Indian. The ethnicity was unknown for 330
(8.2%) online students.
Table 11
Ethnicity Comparison by Type of Student
Online Students Online Only Students
Ethnicity n % n %
White 2,448 60.5% 730 61.6%
Hispanic 672 16.6% 162 13.7%
Black 340 8.4% 131 11.0%
American Indian 10 0.2% 2 0.2%
Hawaiian 1 0.0% 1 0.1%
Asian 97 2.4% 27 2.3%
More than one race 78 1.9% 20 1.7%
International 70 1.7% 3 0.3%
Unknown 330 8.2% 110 9.3%
Total 4,046 100.0% 1,186 100.0%

71
Similarly, most of the online only students also identified with one of three ethnicities:
White (61.6% or n = 730), Hispanic (13.7% or n = 162), or Black (11% or n = 131). A few
online only students were also Asian (2.3% or n = 27), American Indian (0.2% or n = 2),
Hawaiian (0.1% or n = 1), International (0.3% or n = 3). Furthermore, 20 (1.7%) students had
more than one race. The ethnicity was unknown for 110 (9.3%) online only students.
Program of Study
As seen in Table 12, over three-fourths (75.8% or n = 3,067) of online students were
enrolled in transfer programs, and about one-fourth (24.2% or n = 979) were enrolled in
occupational certificate or degree programs. Likewise, nearly 80% (78% or n = 925) of the
online only students were enrolled in transfer programs while 22% (n = 261) were enrolled in
occupational programs.
Table 12
Program of Study by Type of Student
Online Students Online Only
Students
Program n % n %
Transfer 3,067 75.8% 925 78.0%
Occupational 979 24.2% 261 22.0%
Total 4,046 100.0% 1,186 100.0%
Student Level
As displayed in Table 13, most (61.4% or n = 2,484) of the online students had
sophomore or second-year status while half as many (32.1% or n = 1,299) were freshmen or
first-year students; additionally, there were 17.3% (n = 698) of online students who had some
transfer credit. A few (0.3% or n = 12) online students enrolled at this community college during
fall 2015 and spring 2016 were dual enrolled both in high school and this community college.

72
Some (6.2% or n = 251) students were unclassified meaning they did not meet minimum
requirements for entrance as regular college-level students, already had an associate’s degree or
higher, or were course enrollees only without the intention of earning a degree or certificate.
Table 13
Student Level by Type of Student
Online Students Online Only Students
Student Level n % n %
Dual Enrolled 12 0.3% 7 0.6%
Freshmen 1,299 32.1% 452 38.1%
Sophomore 2,484 61.4% 611 51.5%
Unclassified 251 6.2% 116 9.8%
Total 4,046 100.0% 1,186 100.0%
A higher percentage of online only students were freshmen or first-year students with
fewer sophomore or second-year students when compared to all online students as seen in Table
13. Just over half (51.5% or n = 611) of the online only students were sophomores or second-
year while 38.1% (n = 452) were freshmen or first-year students. There were also several (0.6%
or n = 7) online only students who were dual enrolled in both high school and online college
courses which was similar to the overall online student population.
Enrollment Status
The breakdown of enrollment status was different for online students and online only
students. As displayed in Table 14, the enrollment status of online students was split fairly
evenly between those enrolled part-time (50.8% or n = 2,056) and full-time (49.2% or n = 1,990)
during the study. On the other hand, online only students were primarily enrolled part-time
(90.2% or n = 1,070) with only about 10% (9.8% or n = 116) enrolled full-time.

73
Table 14
Enrollment Status by Type of Student
Online Students Online Only Students
Enrollment Status n % n %
Part-time 2,056 50.8% 1,070 90.2%
Full-time 1,990 49.2% 116 9.8%
Total 4,046 100.0% 1,186 100.0%
Course Enrollment
The average number of total courses taken by online students in a semester was 3.30
courses for fall 2015 and 3.26 courses for spring 2016; the median and the mode for online
students were both four courses for fall and spring (see Table 15). The average number of
courses online only students took was lower at only 1.85 courses during both fall 2015 and
spring 2016; the median and the mode for online only students were both just one course for both
fall and spring.
Table 15
Total Course Enrollment Summary by Semester and Type of Student
Fall 2015 N M Median Mode SD
Online Students 2,345 3.30 4.00 4.00 1.42
Online Only Students 679 1.85 1.00 1.00 1.09
Spring 2016 N M Median Mode SD
Online Students 2,558 3.26 4.00 4.00 1.41
Online Only Students 746 1.85 1.00 1.00 1.07
The total number of classes that online students enrolled in each semester, including all
course formats, varied as shown in Table 16. The highest number of courses an online student
was taking during fall 2015 semester was eight courses (less than 1.0% or n = 1), and during

74
spring 2016 it was nine courses (less than 1.0% or n = 1). About 30% of online students during
fall 2015 (29.5% or n = 691) and spring 2016 (30.3% or n = 775) were taking four courses.
Table 16
Number of Courses Taken by Semester and Type of Student Online Students Online Only Students
Fall 2015 Courses n % n %
1 341 14.5% 341 50.2%
2 419 17.9% 196 28.9%
3 381 16.2% 69 10.2%
4 691 29.5% 52 7.7%
5 443 18.9% 20 2.9%
6 61 2.6% 0 0.0%
7 8 0.3% 1 0.1%
8 1 0.0% 0 0.0%
Total 2,345 100.0% 679 100.0%
Online Students Online Only Students
Spring 2016 Courses n % n %
1 379 14.8% 379 50.8%
2 461 18.0% 197 26.4%
3 427 16.7% 88 11.8%
4 775 30.3% 70 9.4%
5 446 17.4% 10 1.3%
6 59 2.3% 2 0.3%
7 8 0.3% 0 0.0%
8 2 0.1% 0 0.0%
9 1 0.0% 0 0.0%
Total 2,558 100.0% 746 100.0%
Time since Last Course
The time fall 2015 students had between semesters of enrollment, or semester gap,
ranged from zero for new students to 101 semesters; the range in spring 2016 was zero to 87
semesters between enrollments (see Table 17). When examining the number of semesters since

75
online and online only students had previously taken a course prior to fall 2015, between 10.5%
and 11.8% of the students were new and had a zero semester enrollment gap. The largest
percentage (42% or n = 984) of the fall online students and online only students (34.9% or n =
237) were enrolled in the previous semester and had a one semester enrollment gap. During the
spring 2016 there were fewer (8.1% or n = 207) new online students than new online only
students (12.5% or n = 93). When compared to fall online students, a higher percentage of spring
online students were enrolled in the previous term: 74.2% (n = 1,897) of all online students and
54.4% (n = 406) of online only students. Also, there were more (18.1% or n = 135) online only
students with a longer semester gap of four or more semesters than online students (10.2% or n =
262).
Table 17
Summary of Semesters since Last Course by Semester and Type of Student
Online Students Online Only Students
Fall 2015 Semester Gap n % n %
0 247 10.5% 80 11.8%
1 984 42.0% 237 34.9%
2 749 31.9% 180 26.5%
3 89 3.8% 40 5.9%
4 - 101 276 11.8% 142 20.9%
Total 2,345 100.0% 679 100.0%
Online Students Online Only Students
Spring 2016 Semester Gap n % n %
0 207 8.1% 93 12.5%
1 1,897 74.2% 406 54.4%
2 93 3.6% 61 8.2%
3 99 3.9% 51 6.8%
4 - 87 262 10.2% 135 18.1%
Total 2,558 100.0% 746 100.0%

76
The average number of semesters between fall 2015 and the students’ last course was
higher (3.84 semesters) for online only students than for online students (2.68 semesters) as seen
in Table 18. The median number of semesters between courses prior to fall 2015 for online
students was one semester with a standard deviation of 6.11, and for fall online only students it
was two semesters with a standard deviation of 8.53. Similar findings were identified for spring
2016 with a higher mean number of semesters between enrollments for online only students. The
mode was one semester between enrollments for both online student groups and both semesters.
Table 18
Semesters since Last Course by Semester and Type of Student
Fall 2015 N M Median Mode SD
Online Students 2,345 2.68 1.00 1.00 6.11
Online Only Students 679 3.84 2.00 1.00 8.53
Spring 2016 N M Median Mode SD
Online Students 2,558 2.33 1.00 1.00 6.09
Online Only Students 746 3.51 1.00 1.00 8.63
Course Withdrawals
The 2,345 online students during fall 2015 were enrolled for 7,731 course sections
including all course formats, and 2,558 students enrolled in spring 2016 and took 8,347 course
sections for a combined total of 16,078 course sections over the two semesters (see Table 19). In
fall 2015 online students started with 7,731 course sections, and there were 1,227 (15.9%)
section withdrawals overall during the semester; 545 of the fall 2015 section withdrawals were
online course sections which is 7.0% of the total sections and 44.4% of the withdrawn sections.
In spring 2016 initially there were 8,347 course sections counting all course formats taken by
online students, and before the end of the semester there were 1,165 (14.0%) section withdrawals

77
in total; of these withdrawals 560 were online course sections which is 6.7% of the total sections
taken and 48.1% of the withdrawn sections.
Table 19
Course Section Withdrawals by Semester and Type of Section
Course Section Withdrawals
Semester Total
Sections
Withdrawn
Sections
% of
Total
Online
Section
Withdrawals
% Online
Withdrawals
% of Total
Sections
Fall 2015 7,731 1,227 15.9% 545 44.4% 7.0%
Spring 2016 8,347 1,165 14.0% 560 48.1% 6.7%
Overall 16,078 2,392 14.9% 1,105 46.2% 6.9%
Table 20 displays the total number of course withdrawals made by online students; these
figures include course withdrawals prior to and during fall 2015 and spring 2016. The range of
total withdrawals for online students was 0 to 33 courses. About one-third (35.1% or n = 1,420)
Table 20
Number of Course Withdrawals by Type of Student Online Students Online Only Students
Course
Withdrawals n % n %
0 1,420 35.1% 370 31.2%
1 858 21.2% 231 19.5%
2 563 13.9% 173 14.6%
3 364 9.0% 112 9.4%
4 - 33 841 20.8% 300 25.3%
Total 4,046 100.0% 1,186 100.0%
of online students never withdrew from any courses, approximately another third (35.1% or n =
1,421) of students had a total of one or two course withdrawals, and the remaining (29.8% or n =
1,205) students had three or more course withdrawals. Online only students also had about one

78
third (31.2% or n = 370) of students without any course withdrawals, another third (34.1% or n =
404) with one or two course withdrawals, and the remaining third (34.7% or n = 412) with three
or more course withdrawals.
The average number of course withdrawals was 2.10 courses for all online students, and
2.17 courses for online only students as displayed in Table 21. The median number of course
withdrawals was one course for both online students and online only students. The mode number
of course withdrawals was zero for both online and online only student groups so most online
students had never withdrawn from a course.
Table 21
Summary of Course Withdrawals by Type of Student
Type of Student N M Median Mode SD
Online Students 4,046 2.10 1.00 0.00 2.92
Online Only Students 1,186 2.17 1.00 0.00 3.41
Remedial Coursework
The total number of remedial sections taken by online and online only students is found
in Table 22. When examining the total course sections for fall 2015 and spring 2016 combined,
there were 16,078 total course sections taken by online and online only students. There were
only 835 (5.2%) remedial course sections out of the total course sections taken during this time.
Table 22
Percent of Remedial Courses Taken by Semester
Semester Total Course
Sections
Total Remedial
Course Sections
% Remedial
of Total
Fall 2015 7,731 401 5.2%
Spring 2016 8,347 434 5.2%
Overall 16,078 835 5.2%

79
Table 23 provides a summary of the number of remedial courses online and online only
students were taking during fall 2015 and spring 2016. Most online students were not taking any
remedial classes: 85.1% (n = 1,995) of students in fall 2015 had no remedial courses, and 85.5%
(n = 2,186) of students in spring 2016 were not taking any remedial courses. During fall 2015,
13.1% (n = 308) of online students were taking one remedial course, and during spring 2016
only12.7% (n = 324) of students were taking one remedial courses. Under 2% of online students
were taking two or three remedial courses each semester.
Table 23
Number of Remedial Courses Taken by Semester and Type of Student
Online Students Online Only Students
Fall 2015 n % n %
0 1,995 85.1% 611 90.0%
1 308 13.1% 65 9.6%
2 33 1.4% 2 0.3%
3 9 0.4% 1 0.1%
Total 2,345 100.0% 679 100.0%
Online Students Online Only Students
Spring 2016 n % n %
0 2,186 85.5% 655 87.8%
1 324 12.7% 82 11.0%
2 34 1.3% 7 0.9%
3 14 0.5% 2 0.3%
Total 2,558 100.0% 746 100.0%
Much like the overall online students, most of online only students did not take any
remedial courses: 90% (n = 611) in fall 2015 took no remedial courses, and 87.8% (n = 655) in
spring 2016 took no remedial courses. About 10% (9.6% or n = 65) of online only students took
one remedial course in fall 2015, and 11% (n = 82) took one remedial course in spring 2016.

80
Less than 0.5% (n = 3) of online only students in fall 2015 took two or three remedial courses,
and just over 1% (1.2% or n = 9) of online only students in spring 2016 took two or three
remedial courses.
Financial Aid Award
Over one-third of students taking online courses during fall 2015 and spring 2016 were
using financial aid to help pay for their courses (see Table 24). There were 819 (34.9%) online
students out of 2,345 who received financial aid during fall 2015, and 958 (37.5%) online
students out of 2,558 who accepted a financial aid award during spring 2016 which was a
duplicated total of 1,777 online students with financial aid. Fewer online only students received
financial aid awards. There were 205 (30.2%) online only students out of 679 in fall 2015 who
received financial aid, and 181 (24.3%) online only students out of 746 in spring 2016 who
received financial aid; this was a duplicated total of 386 online only students with financial aid.
Table 24
Percent of Students with Financial Aid Awards by Semester and Type of Student
Fall 2015 Overall Total Total with Financial Aid %
Online Students 2,345 819 34.9%
Online Only Students 679 205 30.2%
Spring 2016 Overall Total Total with Financial Aid %
Online Students 2,558 958 37.5%
Online Only Students 746 181 24.3%
For online students the mean financial aid award amount during fall 2015 was $1,837.56
and during spring 2016 it was $1,916.46 (see Table 25). The median financial aid award was
$2,109 in fall 2015 and $2,165 in spring 2016, and the mode financial aid award amount was
$2,887 for both semesters for online students. For online only students the mean financial aid
award was $1770.46 during fall 2015 and $1,493.33 in spring 2016. The median financial aid

81
award for online only students was $1,512 in fall 2015 and $1,444 during spring 2016 while the
mode financial aid award was $2,887 in fall 2015 and $1,444 during spring 2016.
Table 25
Summary of Financial Aid Awards by Semester and Type of Student
Fall 2015 N M Median Mode SD
Online Students 819 1,837.56 2109.00 2887.00 944.19
Online Only Students 205 1,770.46 1512.00 2887.00 971.48
Spring 2016 N M Median Mode SD Online Students 958 1,916.46 2165.00 2887.00 936.52 Online Only Students 181 1,493.33 1444.00 1444.00 869.05
Computer Coursework
Table 26 shows of the 4,046 unduplicated students taking online courses during fall 2015
and spring 2016, only about one-fourth (24.4% or n = 989) of these students had ever passed one
or more computer-related courses with a grade of A, B, C, or D, and slightly fewer (22.2% or n =
263) online only students had passed computer courses of the 1,186 unduplicated online only
student count. Most online and online only students had not passed any computer courses.
Table 26
Number of Computer Courses Passed by Type of Student Online Students Online Only Students
Courses Passed n % n %
0 3,057 75.6% 923 77.8%
1 685 16.9% 183 15.4%
2 291 7.2% 75 6.3%
3 10 0.2% 4 0.3%
4 1 0.0% 0 0.0%
5 0 0.0% 0 0.0%
6 2 0.0% 1 0.1%
Total 4,046 100.0% 1,186 100.0%

82
When looking just at computer courses passed since 2010, there were 734 (18.1%) online
students who had passed a computer course. These 734 online students passed a total of 1,166
courses since 2010; the distribution of the five different computer courses they passed is shown
in Table 27. Most of the students who took and passed a computer course had taken either
Microsoft Office I (84.0% or n = 980) or Introduction to Computer Systems (11.4% or n = 133).
Table 27
Computer Courses Passed since 2010 for Online Students
Computer Course n %
Personal Computer Basics 33 2.8%
Internet Basics 4 0.3%
Introduction to Computer Systems 133 11.4%
Microsoft Office I 980 84.0%
Microsoft Office II 16 1.4%
Total 1,166 100.0%
Total Online Courses
The average number of courses online students had ever taken was 4.26 in fall and 4.08
during spring 2016; for online only students the average number of online courses taken was
higher with an average of 5.25 courses in fall 2015 and 4.95 during spring 2016 (see Table 28).
Table 28
Online Course Summary by Semester and Type of Student
Fall 2015 N M Median Mode SD
Online Students 2,345 4.26 3.00 1.00 3.85
Online Only Students 679 5.25 4.00 1.00 4.67
Spring 2016 N M Median Mode SD
Online Students 2,558 4.08 3.00 1.00 3.67
Online Only Students 746 4.95 4.00 2.00 4.66

83
For online students during both fall 2015 and spring 2016, the median was three online courses
and the mode was one online course; for online only students the median number of online
courses ever taken was four courses while the mode was one course during fall 2015 and two
courses during spring 2016.
Table 29 displays the total number of online courses ever taken by the online students at
the completion of this study; these figures included all online courses taken before and during the
study. The overall number of online courses ever taken by the online students ranged from 1 to
42 online courses. Online only students had taken more online courses overall. The highest
percentage (29% or n = 1,174) of online students had previously taken just one online course
while 28.7% (n = 341) of the online only students had previously taken six or more online
courses.
Table 29
Number of Online Courses by Type of Student
Online Students Online Only Students
Online Courses n % n %
1 1,174 29.0% 275 23.2%
2 788 19.5% 219 18.5%
3 521 12.9% 144 12.1%
4 422 10.4% 129 10.9%
5 311 7.7% 78 6.6%
6 - 42 830 20.5% 341 28.7%
Total 4,046 100.0% 1,186 100.0%
Cumulative Credit Hours
Table 30 provides a summary of cumulative credit hours earned by online students. When
comparing the mean, median, and mode for cumulative credit hours earned by online students,
students taking only online courses had earned fewer credit hours overall. The average number
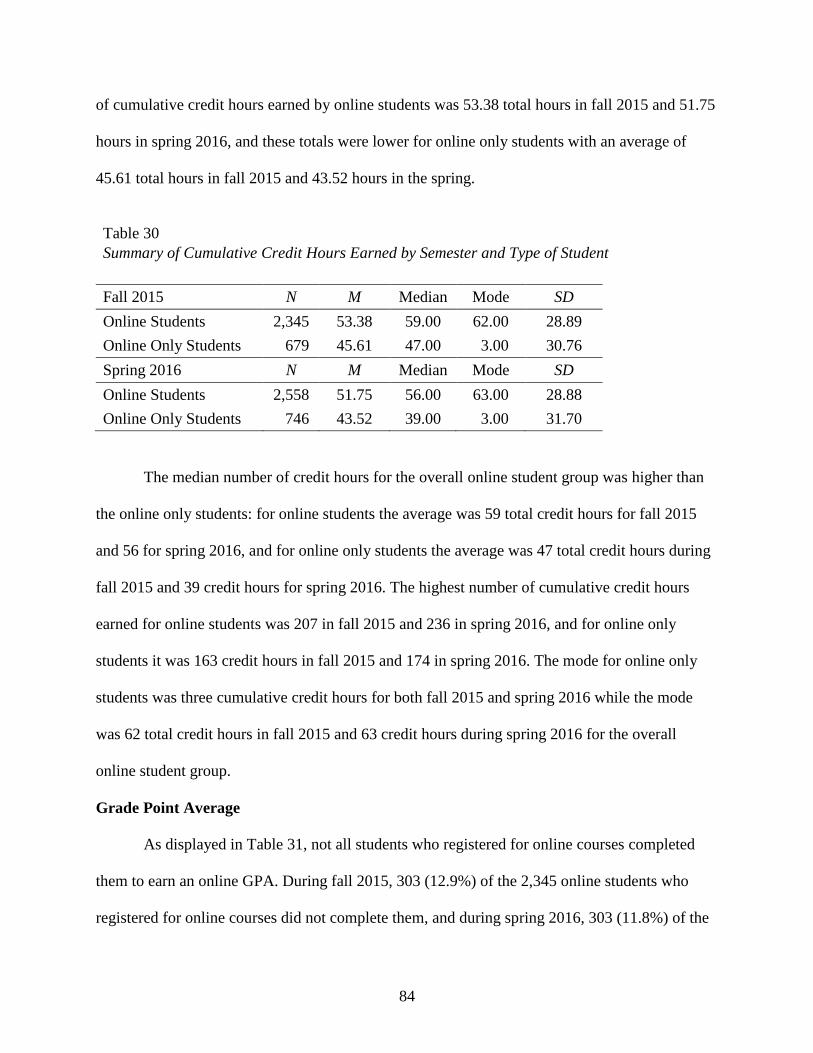
84
of cumulative credit hours earned by online students was 53.38 total hours in fall 2015 and 51.75
hours in spring 2016, and these totals were lower for online only students with an average of
45.61 total hours in fall 2015 and 43.52 hours in the spring.
Table 30
Summary of Cumulative Credit Hours Earned by Semester and Type of Student
Fall 2015 N M Median Mode SD
Online Students 2,345 53.38 59.00 62.00 28.89
Online Only Students 679 45.61 47.00 3.00 30.76
Spring 2016 N M Median Mode SD Online Students 2,558 51.75 56.00 63.00 28.88 Online Only Students 746 43.52 39.00 3.00 31.70
The median number of credit hours for the overall online student group was higher than
the online only students: for online students the average was 59 total credit hours for fall 2015
and 56 for spring 2016, and for online only students the average was 47 total credit hours during
fall 2015 and 39 credit hours for spring 2016. The highest number of cumulative credit hours
earned for online students was 207 in fall 2015 and 236 in spring 2016, and for online only
students it was 163 credit hours in fall 2015 and 174 in spring 2016. The mode for online only
students was three cumulative credit hours for both fall 2015 and spring 2016 while the mode
was 62 total credit hours in fall 2015 and 63 credit hours during spring 2016 for the overall
online student group.
Grade Point Average
As displayed in Table 31, not all students who registered for online courses completed
them to earn an online GPA. During fall 2015, 303 (12.9%) of the 2,345 online students who
registered for online courses did not complete them, and during spring 2016, 303 (11.8%) of the
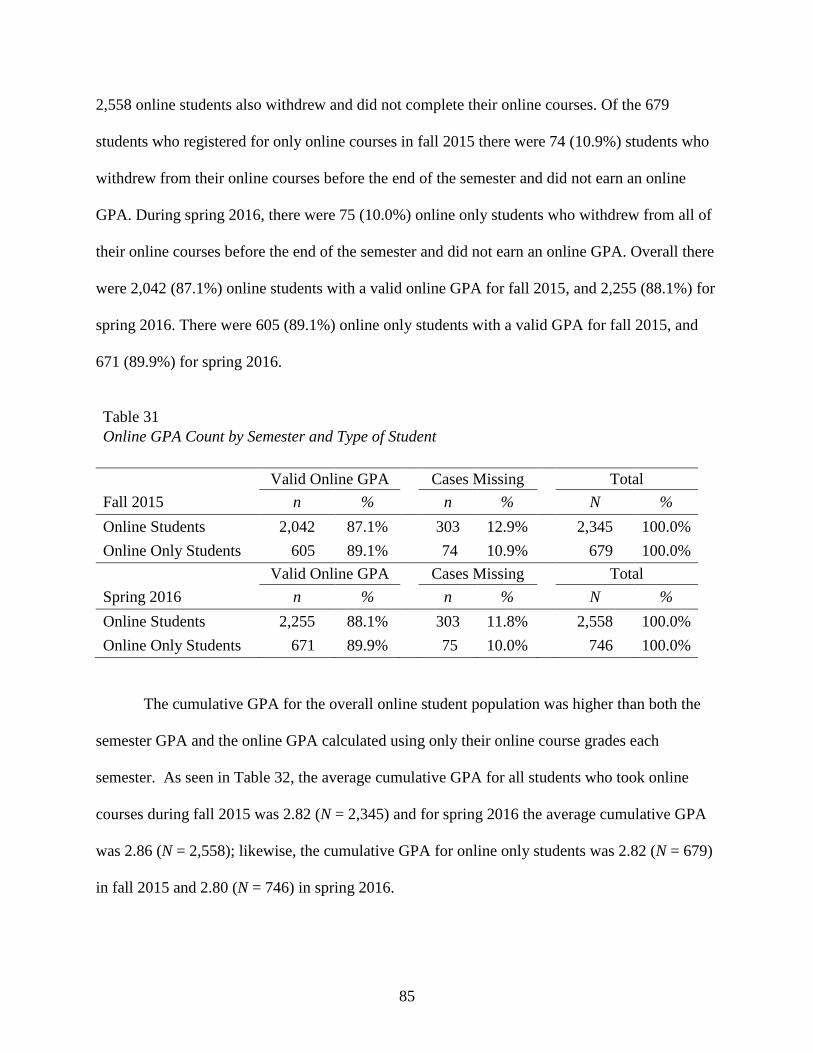
85
2,558 online students also withdrew and did not complete their online courses. Of the 679
students who registered for only online courses in fall 2015 there were 74 (10.9%) students who
withdrew from their online courses before the end of the semester and did not earn an online
GPA. During spring 2016, there were 75 (10.0%) online only students who withdrew from all of
their online courses before the end of the semester and did not earn an online GPA. Overall there
were 2,042 (87.1%) online students with a valid online GPA for fall 2015, and 2,255 (88.1%) for
spring 2016. There were 605 (89.1%) online only students with a valid GPA for fall 2015, and
671 (89.9%) for spring 2016.
Table 31
Online GPA Count by Semester and Type of Student
Valid Online GPA Cases Missing Total
Fall 2015 n % n % N %
Online Students 2,042 87.1% 303 12.9% 2,345 100.0%
Online Only Students 605 89.1% 74 10.9% 679 100.0%
Valid Online GPA Cases Missing Total
Spring 2016 n % n % N %
Online Students 2,255 88.1% 303 11.8% 2,558 100.0%
Online Only Students 671 89.9% 75 10.0% 746 100.0%
The cumulative GPA for the overall online student population was higher than both the
semester GPA and the online GPA calculated using only their online course grades each
semester. As seen in Table 32, the average cumulative GPA for all students who took online
courses during fall 2015 was 2.82 (N = 2,345) and for spring 2016 the average cumulative GPA
was 2.86 (N = 2,558); likewise, the cumulative GPA for online only students was 2.82 (N = 679)
in fall 2015 and 2.80 (N = 746) in spring 2016.
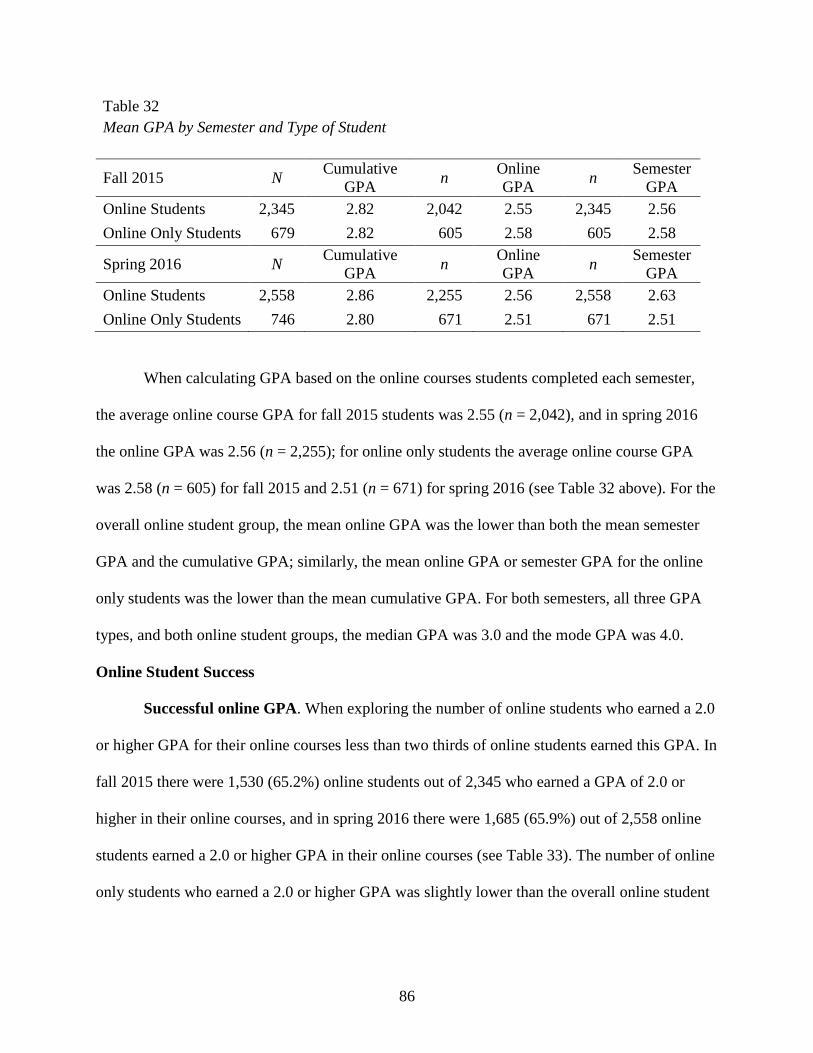
86
Table 32
Mean GPA by Semester and Type of Student
Fall 2015 N Cumulative
GPA n
Online
GPA n
Semester
GPA
Online Students 2,345 2.82 2,042 2.55 2,345 2.56
Online Only Students 679 2.82 605 2.58 605 2.58
Spring 2016 N Cumulative
GPA n
Online
GPA n
Semester
GPA
Online Students 2,558 2.86 2,255 2.56 2,558 2.63
Online Only Students 746 2.80 671 2.51 671 2.51
When calculating GPA based on the online courses students completed each semester,
the average online course GPA for fall 2015 students was 2.55 (n = 2,042), and in spring 2016
the online GPA was 2.56 (n = 2,255); for online only students the average online course GPA
was 2.58 (n = 605) for fall 2015 and 2.51 (n = 671) for spring 2016 (see Table 32 above). For the
overall online student group, the mean online GPA was the lower than both the mean semester
GPA and the cumulative GPA; similarly, the mean online GPA or semester GPA for the online
only students was the lower than the mean cumulative GPA. For both semesters, all three GPA
types, and both online student groups, the median GPA was 3.0 and the mode GPA was 4.0.
Online Student Success
Successful online GPA. When exploring the number of online students who earned a 2.0
or higher GPA for their online courses less than two thirds of online students earned this GPA. In
fall 2015 there were 1,530 (65.2%) online students out of 2,345 who earned a GPA of 2.0 or
higher in their online courses, and in spring 2016 there were 1,685 (65.9%) out of 2,558 online
students earned a 2.0 or higher GPA in their online courses (see Table 33). The number of online
only students who earned a 2.0 or higher GPA was slightly lower than the overall online student

87
population: there were 378 (55.7%) online only students out of 679 in fall 2015, and there were
480 (64.3%) out of 746 in spring 2016 who earned a 2.0 or higher GPA.
Table 33
Online GPA 2.0 and Higher by Semester and Type of Student
Online Students Online Only Students
Semester N
Online GPA
2.0 and
Higher
% Online
GPA 2.0+ N
Online GPA
2.0 and
Higher
% Online
GPA 2.0+
Fall 2015 2,345 1,530 65.2% 679 378 55.7%
Spring 2016 2,558 1,685 65.9% 746 480 64.3%
Successful online course grades. As displayed in Table 34, out of the 16,078 course
sections taken by online students during fall 2015 and spring 2016, 37.9% (n = 6,100) of these
course sections taken were online. In fall 2015 online students took 2,867 online course sections
which was 37.1% of the total sections taken that semester. In spring 2016 online students took
3,233 online course sections which was 38.7% of total sections taken that semester.
Table 34
Overall Course Sections by Semester and Type of Section
Course Sections
Semester Total Taken Online % Online
Fall 2015 7,731 2,867 37.1%
Spring 2016 8,347 3,233 38.7%
Overall 16,078 6,100 37.9%
As found in Table 35, online students took a combined total of 6,100 online course
sections during fall 2015 and spring 2016. Overall, students passed more than three-quarters
(77.2% or n = 4,710) of these online course sections with a grade of A, B, or C. During fall 2015
there was a total of 2,867 online course sections taken by online students. Of these online course
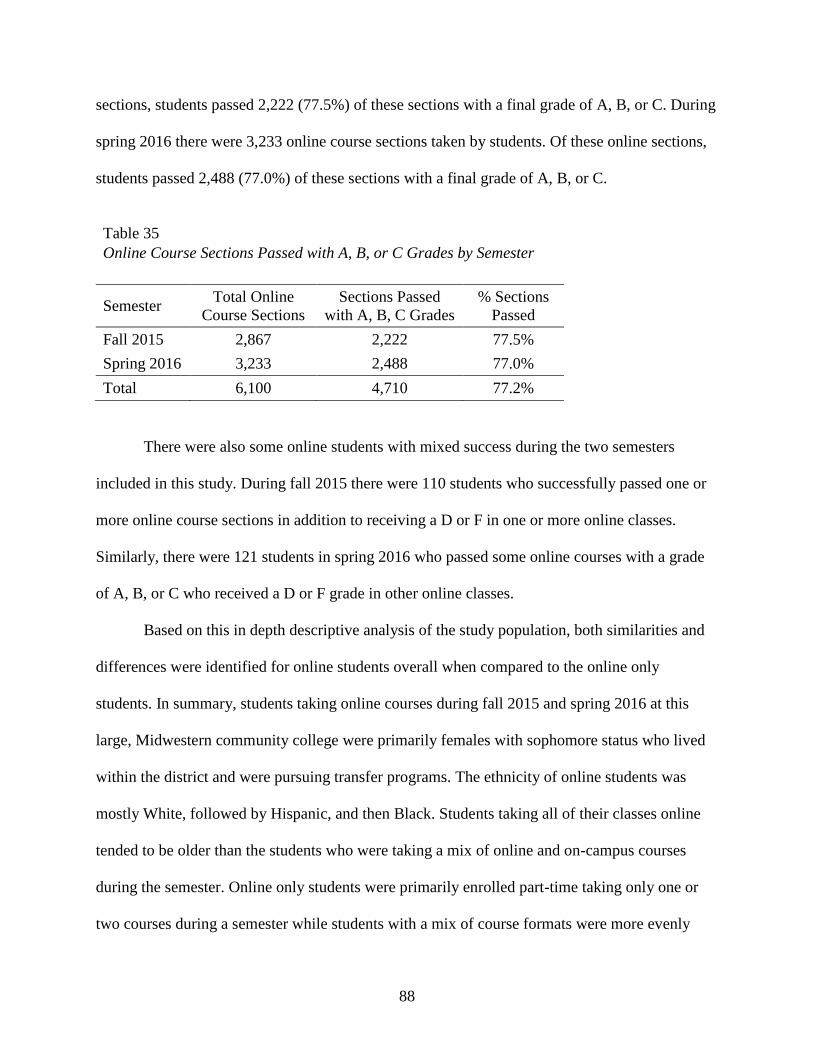
88
sections, students passed 2,222 (77.5%) of these sections with a final grade of A, B, or C. During
spring 2016 there were 3,233 online course sections taken by students. Of these online sections,
students passed 2,488 (77.0%) of these sections with a final grade of A, B, or C.
Table 35
Online Course Sections Passed with A, B, or C Grades by Semester
Semester Total Online
Course Sections
Sections Passed
with A, B, C Grades
% Sections
Passed
Fall 2015 2,867 2,222 77.5%
Spring 2016 3,233 2,488 77.0%
Total 6,100 4,710 77.2%
There were also some online students with mixed success during the two semesters
included in this study. During fall 2015 there were 110 students who successfully passed one or
more online course sections in addition to receiving a D or F in one or more online classes.
Similarly, there were 121 students in spring 2016 who passed some online courses with a grade
of A, B, or C who received a D or F grade in other online classes.
Based on this in depth descriptive analysis of the study population, both similarities and
differences were identified for online students overall when compared to the online only
students. In summary, students taking online courses during fall 2015 and spring 2016 at this
large, Midwestern community college were primarily females with sophomore status who lived
within the district and were pursuing transfer programs. The ethnicity of online students was
mostly White, followed by Hispanic, and then Black. Students taking all of their classes online
tended to be older than the students who were taking a mix of online and on-campus courses
during the semester. Online only students were primarily enrolled part-time taking only one or
two courses during a semester while students with a mix of course formats were more evenly

89
split between full- and part-time taking about four courses each semester. Most students taking
online courses were not enrolled in any remedial courses, and some online students had
previously passed a computer-related course. About a third of online students did not have any
course withdrawals while another third had withdrawn from one or two courses over time. About
two-thirds of the online students had been previously enrolled for courses within the last two
semesters, and over one-third of online students were receiving financial aid during the semester.
The mean, median, mode, and maximum value for cumulative credit hours were higher for the
overall online group than for the online only group. For both semesters and both online student
groups, the cumulative GPA was the highest GPA, and the online GPA was the lowest GPA. Just
under two-thirds of online students earned an online GPA of 2.0 or higher, but only about six of
ten online only students earned an online GPA of 2.0 or higher. When examining overall online
course sections in the study, students passed over three-fourths of these sections with a grade of
A, B, or C during fall 21015 and spring 2016. Some patterns were identified when examining
demographic and academic factors related to online students success; these patterns will be
further explored as part of the inferential statistics generated to answer the six research questions.
Research Issue
The purpose of this study was to identify factors that contributed to the success of online
community college students so a model of success could be generated. Online success was
identified as online students who earned an online GPA of 2.0 or higher during the semester.
Community college online courses provide students access and convenience to complete courses
at a low cost while allowing students the flexibility to maintain their other responsibilities.
According to Allen and Seaman (2017) at the same time the overall higher education enrollment
has been declining for more than a dozen years, the number of students taking courses online has
90
been increasing. This trend of increasing online enrollment would be positive except that there
have been mixed findings on factors that impact online student success, and research shows
online students have not been as successful as students who take courses in a traditional, campus-
based format (Hachey et al., 2012; Lehman & Conceicao, 2014; Moore & Kearsley, 2012; Xu &
Jaggars, 2011a, 2011b). There is an increased need for more evidence about factors that lead to
student success in online courses. Once obtained, this data can provide higher education leaders
with information to improve online student success. The rest of this chapter is dedicated to
describing the data analysis and inferential statistics specifically completed to address each of the
six research questions related to online student success.
Research Question One
The first research question centered on what difference in online GPA existed based on
online students’ distance from campus, whether or not they had a financial aid award, if they had
previously passed computer courses, and whether or not they had taken remedial courses during
the study. The following were the related hypotheses:
H0: There is no significant difference in online GPA based on distance from campus,
financial aid award, previous computer courses, and remedial courses.
H1: There is a significant difference in online GPA based on distance from campus, financial
aid award, previous computer courses, and remedial courses.
Only data for online students who completed their online coursework during the study were
analyzed to address research question one. There were 3,530 (87.2%) online students out of the
4,046 unduplicated fall 2015 and spring 2016 combined online student total who earned an
online GPA by persisting until the end of the semester while 516 (12.8%) students did not
complete their online course(s) and did not have an online GPA (see Table 36). Out of the 1,186

91
unduplicated students taking only online courses, 1,064 (89.7%) students earned an online GPA
by completing their online coursework during the study while 122 (10.3%) students did not
complete their online course(s).
Table 36
Online GPA Summary by Type of Student
Valid Online GPA Cases Missing Total
Type of Student n % n % N %
Online Students 3,530 87.2% 516 12.8% 4,046 100.0%
Online Only Students 1,064 89.7% 122 10.3% 1,186 100.0%
Eight separate independent samples t tests were conducted using SPSS to evaluate the
research hypothesis that a significant difference existed in online GPA for online students and
online only students based on distance, financial aid, computer experience, and remedial
coursework. The effect size for significant findings were interpreted using eta squared (η2) from
a one-way ANOVA based on Cohen’s (1988) guidelines: small (0.01), medium (0.06), or large
(0.14). Results of each t test will follow.
Distance from Campus and Online GPA
In order to determine if there was a significant difference in online GPA for online and
online only students based on their distance from campus, independent samples t tests were
performed. First, distance from campus was calculated using the zip code of the student’s home
and the zip code of the main college campus. Next, distance was separated into two groups:
students who lived 10 or fewer miles from campus, and those who lived more than 10 miles from
campus. These groups for distance from campus were chosen because the mean distance from
campus for online students was 9.02 miles, and for online only students the mean distance was
11.22 miles.

92
When the independent samples t test was performed for the overall online student group,
the Levene’s Test was not significant so equal variances between these groups could be assumed.
Results from the t test for online students overall showed no significant difference in success
based on student distance from campus t (3,526) = .30, p = .77 so the null hypothesis was
accepted (see Table 37). Online students who lived 10 or fewer miles from campus had a higher
online GPA (M = 2.55, SD = 1.49) than students who lived over 10 miles away (M = 2.53, SD =
1.49), but the difference was not significant.
Table 37
Online GPA Means by Distance and Type of Student
Distance from Campus
0 – 10 miles
10.01 miles and
further t df
Online Students 2.55 2.53 0.30 3,526
(1.49) (1.49)
Online Only Students 2.56 2.61 -0.57 835.15
(1.51) (1.41)
Note. Standard Deviations appear in parenthesis below means.
When the independent samples t test was performed for the online only student group, the
Levene’s Test was significant so equal variances between these groups could not be assumed.
The t test results for online only students showed no significant difference in success based on
student distance from campus t (835.15) = -.57, p = .57 so the null hypothesis was accepted (see
Table 37). Online only students who lived more than 10 miles from campus had a higher online
GPA (M = 2.61, SD = 1.41) than students who lived 10 miles or less (M = 2.56, SD = 1.51), but
the difference was not significant.

93
Financial Aid Award and Online GPA
In order to identify if there was a significant difference in online GPA for online and
online only students based on their financial aid award, independent samples t tests were
generated. Prior to the analysis, the financial aid variable was broken down into the following
two groups for both online students groups: students who received a financial aid award during
the study, and those who did not. When the independent samples t test was performed for the
overall online group, the Levene’s Test was not significant so equal variances between these
groups could be assumed. Results of the t test for online students showed no significant
difference in success based on student financial aid award t (3,528) = 1.11, p = .27 (see Table
38). Online students who received no financial aid had a higher online GPA (M = 2.56, SD =
1.49) than those who received some financial aid (M = 2.50, SD = 1.47), but the difference was
not significant. The null hypothesis was accepted for online students because those who received
financial aid and those who did not were different in their online course success.
Table 38
Online GPA Means by Financial Aid Award and Type of Student
Financial Aid Award
No Yes t df
Online Students 2.56 2.50 1.11 3,528
(1.49) (1.47)
Online Only
Students 2.66 2.27 3.51* 1,062
(1.46) (1.50)
Note. * p < .001. Standard Deviations appear in parenthesis below means.
When an independent samples t test was performed for online only students the Levene’s
Test was not significant so equal variances between these groups was assumed. There was a
significant difference in success based on receiving a financial aid award for online only students

94
t (1,062) = 3.51, p < .001. Online only students who received no financial aid had a significantly
higher online GPA (M = 2.66, SD = 1.46) than those who received some financial aid (M = 2.27,
SD = 1.50). Based on these results, online only students who received financial aid and those
who did not were different in their online course success so the null hypothesis was rejected.
Although the differences in online GPA were significant, practically speaking financial aid
award only had a small effect as defined by Cohen (1988), and it explained about 1% of the
variance in online GPA as assessed by eta squared (η2) using a one-way ANOVA.
Computer Experience and Online GPA
Before assessing if computer experience led to a significant difference in online GPA for
online and online only students, computer experience was divided into two categories: students
who previously completed at least one computer course with a grade of A, B, C, or D, and those
who did not take or pass any computer course. When the independent samples t test was
performed for the overall online student group, the Levene’s Test was significant so equal
variances between these groups could not be assumed. Results of the t test identified a
statistically significant group difference based on computer experience, t (1,775.50) = -6.18, p <
.001 (see Table 39).
Table 39
Online GPA Means by Computer Experience and Type of Student
Passed Computer Courses
No Yes t df
Online Students 2.46 2.79 -6.18* 1,775.50
(1.53) (1.31)
Online Only Students 2.51 2.81 -3.03** 440.23
(1.51) (1.30)
Note. * p < .001. ** p =.003. Standard Deviations appear in parenthesis below means.
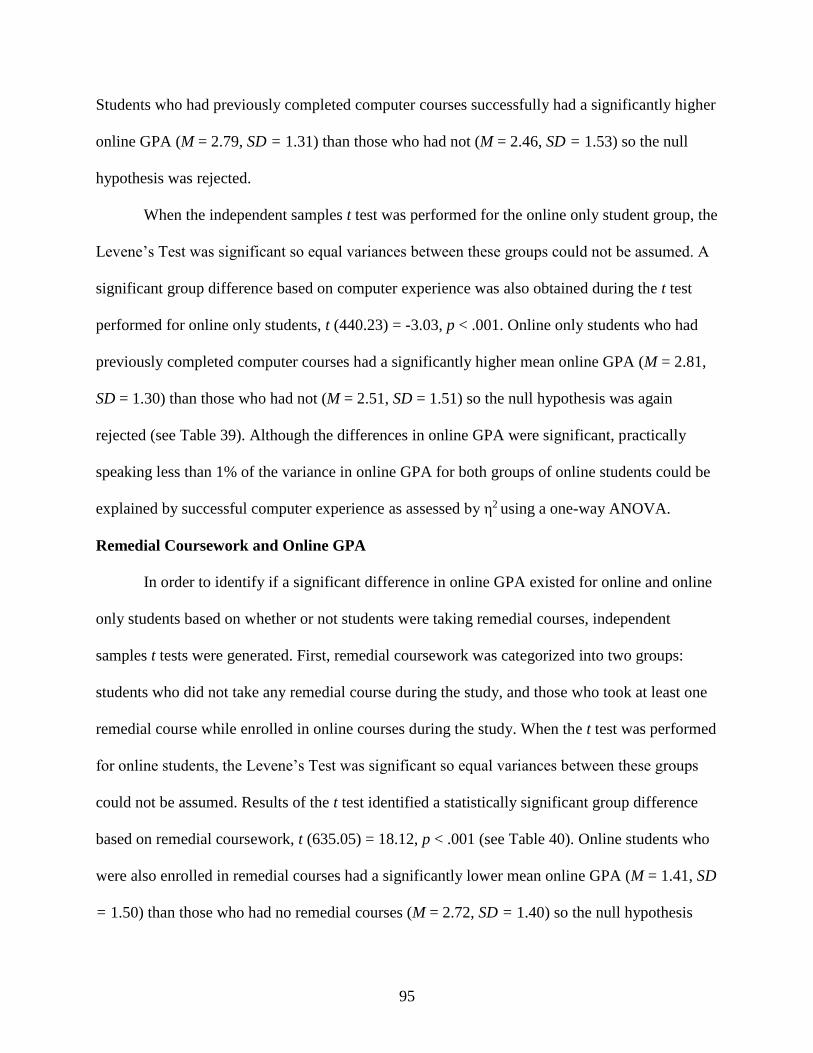
95
Students who had previously completed computer courses successfully had a significantly higher
online GPA (M = 2.79, SD = 1.31) than those who had not (M = 2.46, SD = 1.53) so the null
hypothesis was rejected.
When the independent samples t test was performed for the online only student group, the
Levene’s Test was significant so equal variances between these groups could not be assumed. A
significant group difference based on computer experience was also obtained during the t test
performed for online only students, t (440.23) = -3.03, p < .001. Online only students who had
previously completed computer courses had a significantly higher mean online GPA (M = 2.81,
SD = 1.30) than those who had not (M = 2.51, SD = 1.51) so the null hypothesis was again
rejected (see Table 39). Although the differences in online GPA were significant, practically
speaking less than 1% of the variance in online GPA for both groups of online students could be
explained by successful computer experience as assessed by η2 using a one-way ANOVA.
Remedial Coursework and Online GPA
In order to identify if a significant difference in online GPA existed for online and online
only students based on whether or not students were taking remedial courses, independent
samples t tests were generated. First, remedial coursework was categorized into two groups:
students who did not take any remedial course during the study, and those who took at least one
remedial course while enrolled in online courses during the study. When the t test was performed
for online students, the Levene’s Test was significant so equal variances between these groups
could not be assumed. Results of the t test identified a statistically significant group difference
based on remedial coursework, t (635.05) = 18.12, p < .001 (see Table 40). Online students who
were also enrolled in remedial courses had a significantly lower mean online GPA (M = 1.41, SD
= 1.50) than those who had no remedial courses (M = 2.72, SD = 1.40) so the null hypothesis

96
was rejected. Over 9% of the variance in online GPA for online students was explained by
remedial coursework as assessed by η2 using a one-way ANOVA; this is a medium effect size as
defined by Cohen (1988).
When the t test was performed for online only students, the Levene’s Test was also
significant so equal variances between these groups could not be assumed. The t test performed
for online only students produced similar results, t (127.12) = 14.26, p < .001. Online only
students who were not taking remedial courses had a significantly higher mean online GPA (M =
2.75, SD = 1.40) than those who were enrolled in remedial courses (M = 0.95, SD = 1.17) so the
null hypothesis was rejected again (see Table 40). These differences for online only students
were more significant since between 12 and 13% of the variance in online GPA was explained
by remedial coursework as assessed by η2 using a one-way ANOVA, and this is a medium to
large effect size as defined by Cohen (1988).
Table 40
Online GPA Means by Remedial Coursework and Type of Student
Taking Remedial Courses
No Yes t df
Online Students 2.72 1.41 18.12* 635.05
(1.40) (1.50)
Online Only
Students 2.75 0.95 14.26* 127.12
(1.40) (1.17)
Note. * p < .001. Standard Deviations appear in parenthesis below means.
In order to answer research question one, eight independent samples t tests were
performed to determine if a significant difference in online GPA existed for online students and
online only students based on four independent variables: distance from campus, financial aid
award, computer course experience, and remedial coursework. First, no significant difference

97
was found based on distance from campus. Second, although no significant findings were
generated for online students based on financial aid award, a significant difference was identified
for online only students based on financial aid; online only students who received no financial
aid had a significantly higher online GPA, but the variance in online GPA explained by financial
aid was small. Finally, there was a significant difference identified for both online student groups
based on computer experience as well as remedial coursework. A significantly higher mean
online GPA was identified for online and online only students who had previously taken
computer-related courses although the effect size was small. Online and online only students
who were not taking remedial coursework also had a significantly higher mean online GPA and
this was a medium effect size.
Research Question Two
The second research question for this study concentrated on how the demographic
characteristics of age, ethnicity, and gender for online students correlated to online GPA. The
following were the related hypotheses:
H0: Age, ethnicity, and gender have no correlation to online GPA.
H1: Age, ethnicity, and gender have a correlation to online GPA.
As found in research question one, fall 2015 and spring 2016 data were combined and
unduplicated for the analysis. In order to determine which independent demographic variables
(age, ethnicity, and gender) were significantly related to the dependent variable (online GPA),
SPSS was used to compute the Pearson correlation coefficients. Two-way contingency table
analyses were also created for both online students and online only students to evaluate whether
statistical relationships existed between a successful online GPA and the demographic variables.

98
The Cramér’s V values for effect size were interpreted based on Cohen’s (1988) guidelines as
small (0.1), medium (0.3), or large (0.5).
Relationships between Study Variables
Correlation coefficients were generated to measure the strength of relationships between
online GPA and age, ethnicity, and gender to answer research question two. As seen in Table 41,
all three of the correlation coefficients associated with online GPA were statistically significant
at either the 0.01 or the 0.05 level so the null hypothesis was rejected. Age (r = .126, p < .01) and
gender (r = .081, p < .01) were positively correlated with online GPA while ethnicity (r = -.040,
p < .05) was negatively correlated with online GPA; these were all small correlations.
Table 41
Correlation Coefficients between Online GPA and Online Student Demographics
Variable Age Ethnicity Gender
Age 1.000 - -
Ethnicity .031* 1.000 -
Gender .060** -.005 1.000
Online GPA .126** -.040* .081**
** p < .01. * p < .05.
For online only students, two of three correlation coefficients generated between online
GPA and demographic independent variables were significant: age and ethnicity. Table 42
displays all of the correlation coefficients generated. There was a significant, but small positive
correlation between age and online GPA (r = .183, p < .01) while ethnicity had a small negative
correlation with online GPA (r = -.073, p < .05).
Two-way contingency table analyses were also conducted for online and online only
students to evaluate whether age, ethnicity, or gender were significantly related to a successful
online GPA. Online GPA was separated into two groups to distinguish a successful online GPA

99
of 2.0 or higher from an unsuccessful online GPA under 2.0 for analysis. Students who did not
complete their online courses were excluded since they did not earn an online GPA during the
study. The relationship between online GPA and the three independent demographic variables
will be further discussed.
Table 42
Correlation Coefficients between Online GPA and Online Only Student Demographics
Variable Age Ethnicity Gender
Age 1.000 - -
Ethnicity .000 1.000 -
Gender .091** .017 1.000
Online GPA .183** -.073* -.034
** p < .01. * p < .05.
Age and Online GPA
Table 43 shows results for the two-way contingency table analysis for age and online
GPA. For this analysis, age was separated into two groups: traditional and nontraditional
students. When comparing the online GPA of traditional and nontraditional online students there
was a significant relationship with a very small effect, Pearson χ2 (1, N = 3,530) = 13.60, p <
.001, Cramér’s V = .062.
As displayed in Table 43, there were more traditional online students (65.2% or n =
1,710) who earned a successful online GPA than nontraditional online students (34.8% or n =
914). When comparing online GPA of traditional and nontraditional online only students using a
two-way contingency table analysis there was also a significant relationship with a small effect,
Pearson χ2 (1, N = 1,064) = 9.11, p = .003, Cramér’s V = .093. As shown in Table 43, there were
more nontraditional online only students (54.1% or n = 366) with a successful online GPA than
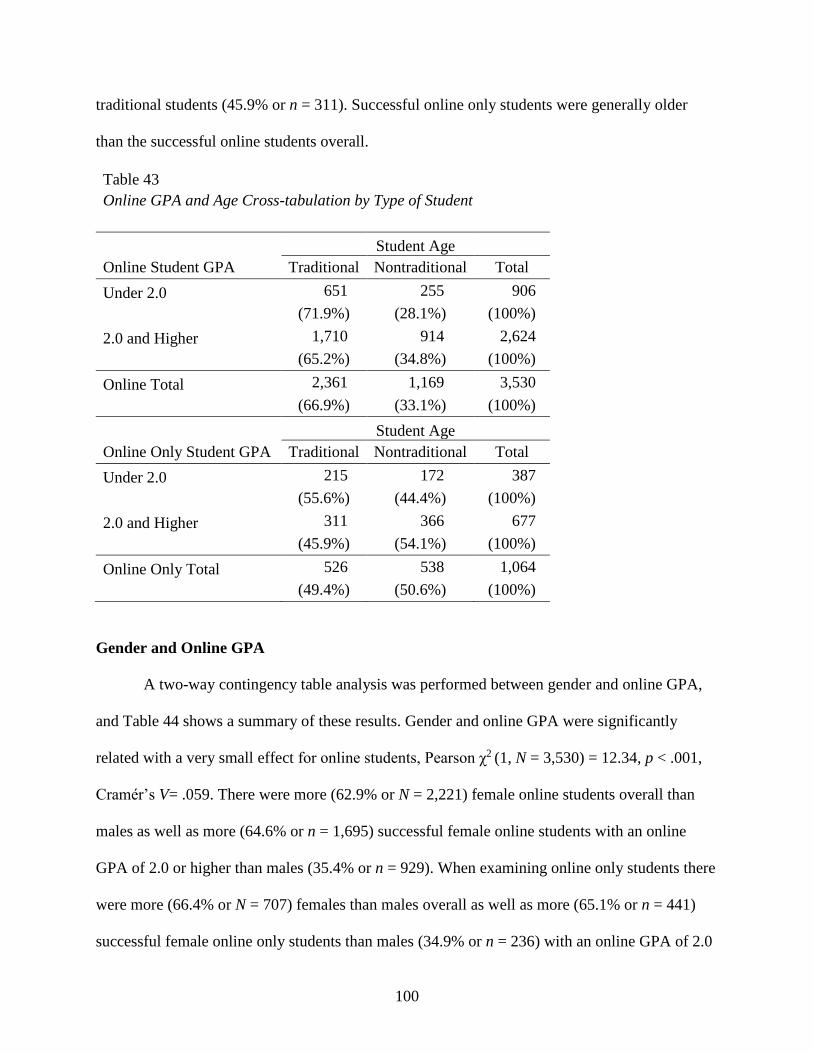
100
traditional students (45.9% or n = 311). Successful online only students were generally older
than the successful online students overall.
Table 43
Online GPA and Age Cross-tabulation by Type of Student
Student Age
Online Student GPA Traditional Nontraditional Total
Under 2.0 651 255 906
(71.9%) (28.1%) (100%)
2.0 and Higher 1,710 914 2,624
(65.2%) (34.8%) (100%)
Online Total 2,361 1,169 3,530
(66.9%) (33.1%) (100%)
Student Age
Online Only Student GPA Traditional Nontraditional Total
Under 2.0 215 172 387
(55.6%) (44.4%) (100%)
2.0 and Higher 311 366 677
(45.9%) (54.1%) (100%)
Online Only Total 526 538 1,064
(49.4%) (50.6%) (100%)
Gender and Online GPA
A two-way contingency table analysis was performed between gender and online GPA,
and Table 44 shows a summary of these results. Gender and online GPA were significantly
related with a very small effect for online students, Pearson χ2 (1, N = 3,530) = 12.34, p < .001,
Cramér’s V= .059. There were more (62.9% or N = 2,221) female online students overall than
males as well as more (64.6% or n = 1,695) successful female online students with an online
GPA of 2.0 or higher than males (35.4% or n = 929). When examining online only students there
were more (66.4% or N = 707) females than males overall as well as more (65.1% or n = 441)
successful female online only students than males (34.9% or n = 236) with an online GPA of 2.0

101
or higher (see Table 44). The relationship between a successful online GPA and gender was not
significant for online only students, Pearson χ2 (1, N = 1,064) = 1.43, p = .232, Cramér’s V =
.037.
Table 44
Online GPA and Gender Cross-tabulation by Type of Student
Gender
Online Student GPA Female Male Total
Under 2.0 526 380 906
(58.1%) (41.9%) (100%)
2.0 and Higher 1,695 929 2,624
(64.6%) (35.4%) (100%)
Online Total 2,221 1,309 3,530
(62.9%) (37.1%) (100%)
Gender
Online Only Student GPA Female Male Total
Under 2.0 266 121 387
(68.7%) (31.3%) (100%)
2.0 and Higher 441 236 677
(65.1%) (34.9%) (100%)
Online Only Total 707 357 1,064
(66.4%) (33.6%) (100%)
Ethnicity and Online GPA
When online GPA and online student ethnicity were examined using a two-way
contingency table analysis results indicated a significant relationship with a small effect, Pearson
χ2 (8, N = 3,530) = 54.21, p < .001, Cramér’s V = .124. Online students of some ethnicities were
more successful than others. As shown in Table 45, nearly two-thirds (63.3% or n = 1,661) of all
online students with a successful online GPA of 2.0 or higher were White, and over 15% (15.5%
or n = 408) of the students were Hispanic followed by Black (6.5% or n = 171), Asian (2.7% or n
= 71), more than one race (2.0% or n = 52), International (1.8% or n = 47), and American Indian

102
(0.2% or n = 6). There were no Hawaiian online students with an online GPA of 2.0 or higher,
and nearly 8% of student ethnicities were unknown or missing (7.9% or n = 208).
Ethnicity for online only students and online GPA were also found to be significantly
related with a small effect, Pearson χ2 (8, N = 1,064) = 22.04, p = .005, Cramér’s V = .144.
Online only students of some ethnicities were more successful than others. As found in Table 45,
nearly two-thirds (64.7% or n = 438) of all online only students with a successful online GPA
were White and 14% (n = 95) of the online only students were Hispanic followed by Black
(7.7% or n = 52), Asian (2.5% or n = 17), more than one race (1.8% or n = 12), International
(0.1% or n = 1), and American Indian (0.3% or n = 2). There were no online only students with
an online GPA of 2.0 or higher that were Hawaiian, and about 9% (8.9% or n = 60) of student
ethnicities were unknown or missing.
Table 45
Online GPA 2.0 and Higher by Ethnicity and by Type of Student Online GPA 2.0 and Higher Online Students Online Only Students
Ethnicity n % n %
White 1,661 63.3% 438 64.7%
Hispanic 408 15.5% 95 14.0%
Black 171 6.5% 52 7.7%
American Indian 6 0.2% 2 0.3%
Hawaiian 0 0.0% 0 0.0%
Asian 71 2.7% 17 2.5%
More than one race 52 2.0% 12 1.8%
International 47 1.8% 1 0.1%
Unknown 208 7.9% 60 8.9%
Total 2,624 100.0% 677 100.0%

103
Table 46 shows some of the online student ethnicities and the percent of students within
each ethnicity that earned a successful online GPA as well as those who did not. When
examining online success within each specific ethnicity, American Indian online students had the
highest success rate with 85.7% (n = 6) earning an online GPA of 2.0 or higher followed by
Asian (81.6% or n = 71), and then White online students (77.6% or n = 1,661). Black online
students had only 60.6% (n = 171) earning an online GPA of 2.0 or higher which was the lowest
percentage of success for all online ethnic groups.
Table 46 Online GPA and Ethnicity Cross-tabulation by Type of Student
Ethnicity
Online Student
GPA
American
Indian Asian White Hispanic International Black
Under 2.0 1 16 480 180 20 111
(14.3%) (18.4%) (22.4%) (30.6%) (29.9%) (39.4%)
2.0 and Higher 6 71 1,661 408 47 171
(85.7%) (81.6%) (77.6%) (69.4%) (70.1%) (60.6%)
Online Total 7 87 2,141 588 67 282
(100%) (100%) (100%) (100%) (100%) (100%)
Ethnicity
Online Only
Student GPA
American
Indian Asian White Hispanic International Black
Under 2.0 0 6 217 56 2 59
(0.0%) (26.1%) (33.1%) (37.1%) (66.7%) (53.2%)
2.0 and Higher 2 17 438 95 1 52
(100%) (73.9%) (66.9%) (62.9%) (33.3%) (46.8%)
Online Only
Total 2 23 655 151 3 111
(100%) (100%) (100%) (100%) (100%) (100%)
When examining online success within each specific ethnicity for online only students,
American Indian students had the highest success rate with 2 out of 2 (100%) students earning an

104
online GPA of 2.0 or higher followed by Asian (73.9% or n = 17) and then White online students
(66.9% or n = 438). Only 52 out of 111 (46.8%) Black online students earned an online GPA of
2.0 or higher which was the lowest of all groups except International online students which was
33.3% or 1 out of 3 students (see Table 46).
Demographic variables had a small, but significant effect on online GPA. All three
demographic student variables (age, gender, and ethnicity) examined in conjunction with online
GPA as part of research question two significantly correlated to online GPA for online students
overall while only age and ethnicity were significantly correlated to online GPA for online only
students; the same significant results were achieved for each online group using two-way
contingency table analyses. Overall, for online students with a higher online GPA, there was a
higher percentage of younger, female, and White students; for online only students there was
also a higher percentage of female and White students, but these students were typically older.
Research Question Three
The third research question for this study focused on which academic factors of online
students (cumulative GPA, enrollment status, time since last course, course withdrawals,
cumulative credit hours, and total online courses) correlated to online GPA. The following were
the related hypotheses:
H0: Cumulative GPA, enrollment status, time since last course, course withdrawals,
cumulative credit hours, and total online courses do not correlate to online GPA.
H1: Cumulative GPA, enrollment status, semesters since last course, course withdrawals,
cumulative credit hours, and total online courses have a correlation to online GPA.
Similar to research question two, Pearson correlation coefficients were computed using SPSS to
determine the relationship between online GPA and the various independent academic variables:

105
cumulative GPA, enrollment status, time since last course, previous withdrawals, cumulative
credit hours, and online courses. Two-way contingency table analyses were also created for both
online student groups to evaluate whether statistical relationships existed between a successful
online GPA and these independent academic variables. The Cramér’s V values for effect size
were interpreted based on Cohen’s (1988) definitions as small (0.1), medium (0.3), or large (0.5).
Data for online and online only students who completed their online coursework during
fall 2015 were analyzed to address research question three. As previously shown in Table 31,
there were 2,042 (87.1%) online students out of the 2,345 total fall 2015 online students who
earned an online GPA by persisting until the end of their online courses while 303 (12.9%)
students did not complete their online courses, and they did not have an online GPA. Out of the
679 online only students for fall 2015 there were 74 (10.9%) students who did not complete their
online courses while 605 (89.1%) students completed their online courses to earn an online GPA.
Only data from online students who had a valid online GPA were analyzed.
Relationships between Study Variables
Correlation coefficients were produced to measure the relationship strength between
online GPA and (a) cumulative GPA, (b) enrollment status, (c) semester gap since last course,
(d) total course withdrawals, (e) cumulative credit hours, and (f) total online courses. As seen in
Table 47, four of the six correlation coefficients associated with online GPA were statistically
significant at the 0.01 level for online students: cumulative GPA, total online courses, total
withdrawals, and cumulative credit hours. For these variables the null hypothesis was rejected.
The null hypothesis was accepted for enrollment status and semester gap since last course
because results were not significant. There were 15 significant correlation coefficients out of the
22 total generated between study variables: six were negatively correlated while nine were

106
positively correlated. Most of the significant correlations generated were small, but several of
these correlations were more medium or large. The correlation between cumulative GPA and
online GPA was the largest (r =.704) followed by cumulative GPA and cumulative credit (r
=.395), online GPA and cumulative credit (r =.292), and online courses and cumulative credit (r
=.286); all of these correlations were significant at the 0.01 level.
Table 47
Correlation Coefficients between Online GPA and Academic Variables for Online Students
Variable Cumulative
GPA
Online
Courses
Enrollment
Status
Semester
Gap
Total
Withdrawals
Cumulative
Credit
Cumulative GPA 1.00 - - - - -
Online Courses .107** 1.00 - - - -
Enrollment Status -.018 -.043* 1.00 - - -
Semester Gap -.021 -.079** -.142** 1.00 - -
Total Withdrawals -.162** .060** -.038 .027 1.00 -
Cumulative Credit .395** .286** .139** -.067** .071** 1.00
Online GPA .704** .072** -.035 .040 -.111** .292**
** p < 0.01. * p < 0.05.
Correlation coefficients were also generated for online only students to measure the
strength of relationships between online GPA along with (a) cumulative GPA, (b) enrollment
status, (c) semester gap since last course, (d) total course withdrawals, (e) cumulative credit
hours, and (f) total online courses. As seen in Table 48, only three of the correlation coefficients
associated with online GPA for online only students were statistically significant: cumulative
GPA, enrollment status, and cumulative credit hours.
Out of 22 total correlation coefficients generated between study variables, nine were
significant: seven were positively correlated while two were negatively correlated. Most of the
significant correlations generated were small, but several of these correlations had a medium or
large effect. The correlation between cumulative GPA and online GPA was the largest (r =.693)

107
followed by online courses and cumulative credit (r =.356), cumulative GPA and cumulative
credit (r =.261), and enrollment status and online courses (r = .239); all of these correlations
were significant at the 0.01 level.
Table 48
Correlation Coefficients between Online GPA and Academic Variables for Online Only Students
Variable Cumulative
GPA
Online
Courses
Enrollment
Status
Semester
Gap
Total
Withdrawals
Cumulative
Credit
Cumulative GPA 1.00 - - - - -
Online Courses .091* 1.00 - - - -
Enrollment Status -.025 .239** 1.00 - - -
Semester Gap -.054 -.148** -.063 1.00 - -
Total Withdrawals -.053 .085 -.081 .041 1.00 -
Cumulative Credit .261** .356** .065 -.046 .137** 1.00
Online GPA .693** .024 -.101* .039 .019 .166**
** p < 0.01. * p < 0.05.
In addition to the correlations generated between the dependent and independent
variables, two-way contingency table analyses were also conducted as an additional measure to
evaluate whether or not academic characteristics were significantly related to a successful online
GPA for each online student group. Online GPA from fall 2015 was separated into two groups to
distinguish a successful online GPA of 2.0 or higher from an unsuccessful online GPA under 2.0.
The online and online only students who did not complete their online courses were excluded
from this analysis since they did not earn an online GPA during the study. The relationship
between online GPA and for the independent academic variables as measured by the two-way
contingency table analyses for the overall online student group and the online only student group
will be further discussed.

108
Cumulative GPA and Online GPA
For the overall online student population, the largest correlation between any two
academic study variables was found between cumulative GPA and online GPA. There was a
large, positive, and significant correlation between cumulative GPA and online GPA for both
online students (r = .704, p = .01) as previously shown in Table 47, and online only students (r =
.693, p = .01) as seen in Table 48; as cumulative GPA increased online GPA also significantly
increased and online students had higher online success.
Table 49
Online GPA and Cumulative GPA Cross-tabulation by Type of Student
Cumulative GPA
Online Student GPA Less than
2.0
2.0 through
2.99
3.0 and
higher Total
Under 2.0 212 250 50 512
(41.4%) (48.8%) (9.8%) (100.0%)
2.0 and Higher 31 551 948 1,530
(2.0%) (36.0%) (62.0%) (100.0%)
Online Total 243 801 998 2,042
(11.9%) (39.2%) (48.9%) (100.0%)
Cumulative GPA
Online Only Student
GPA
Less than
2.0
2.0 through
2.99
3.0 and
higher Total
Under 2.0 81 114 32 227
(35.7%) (50.2%) (14.1%) (100.0%)
2.0 and Higher 5 110 263 378
(1.3%) (29.1%) (69.6%) (100.0%)
Online Only Total 86 224 295 605
(14.2%) (37.0%) (48.8%) (100.0%)
There were more than 1,000 values for cumulative GPA, so in order to conduct a two-
way contingency table analysis these GPA values were divided into three groups: less than 2.0,
between 2.0 and 2.99, and 3.0 and higher. When examining the cumulative GPA of successful

109
online students with an online GPA of 2.0 and higher using a two-way contingency table
analysis, 62% (n = 948) of successful online students had a cumulative GPA of 3.0 or higher and
69.6% (n = 263) of successful online only students had a cumulative GPA of 3.0 or higher (see
Table 49). Cumulative GPA and online GPA were significantly related with a large effect for
online students, Pearson χ2 (2, N = 2,042) = 729.83, p < .001, Cramér’s V = .598 as well as for
online only students Pearson χ2 (8, N = 605) = 224.41, p < .001, Cramér’s V = .609.
Enrollment Status and Online GPA
For online students there was a small, negative correlation (r = -.035) between
enrollment status and online GPA so as the total number of hours in which online students were
enrolled for during the semester increased their online GPA decreased, but this correlation was
not significant (see Table 47). When examining the enrollment status of online students along
with online GPA of 2.0 and higher using two-way contingency table analysis, 49.5% (n = 757)
were taking classes part-time and 50.5% (n = 773) were taking classes full-time (see Table 50).
Enrollment status and online GPA were not significantly related, Pearson χ2 (2, N = 2,042) =
1.26, p = .261, Cramér’s V = .025.
When looking at the correlation between the enrollment status of online only students and
their online GPA the result was small, negative, and significant (r = -.101, p < .05); as the
number of hours online only students were enrolled for during the semester increased their online
GPA decreased (see Table 48). Unlike the overall online population, online only students with an
online GPA of 2.0 or higher were primarily (90.5% or n = 342) taking courses part-time with
only 9.5% (n = 36) enrolled full-time (see Table 50). Despite the high percentage of part-time
online only students, the two-way contingency table analysis indicated enrollment status and

110
online GPA were not significantly related, Pearson χ2 (1, N = 605) = 1.56, p = .211, Cramér’s V =
.051.
Table 50
Online GPA and Enrollment Status Cross-tabulation by Type of Student
Enrollment Status
Online Student GPA Part-time Full-time Total
Under 2.0 268 244 512
(52.3%) (47.7%) (100.0%)
2.0 and Higher 757 773 1,530
(49.5%) (50.5%) (100.0%)
Online Total 1,025 1,017 2,042
(50.2%) (49.8%) (100.0%)
Enrollment Status Online Only Student
GPA Part-time Full-time Total
Under 2.0 198 29 227
(87.2%) (12.8%) (100.0%)
2.0 and Higher 342 36 378
(90.5%) (9.5%) (100.0%)
Online Only Total 540 65 605
(89.3%) (10.7%) (100.0%)
Semester Gap and Online GPA
As shown earlier on Table 47, there was a small, positive correlation (r = .040) between
semester enrollment gap for online students and their online GPA, but this correlation was not
significant. The number of semesters between enrollments for online students ranged from 0 to
101 semesters. Students with a semester gap of zero were new, and of the students who earned
an online GPA of 2.0 or higher 9.5% (n = 146) were new. When a two-way contingency table
analysis was performed, semester gap and online GPA were found to be significantly related
with a small effect, Pearson χ2 (43, N = 2,042) = 68.56, p = .008, Cramér’s V = .183. Nearly half

111
(46.1% or n =705) of the online students with an online GPA of 2.0 or higher had a one semester
gap which means they were enrolled in the previous semester. Close to one-third (29.7% or n =
455) of the online students with an online GPA of 2.0 or higher had a two semester gap meaning
they took the summer semester off before their fall 2015 enrollment.
As seen previously on Table 48, there was a small, positive correlation (r = .039)
between semester enrollment gap and online GPA for online only students, but this correlation
was not significant. When reviewing the two-way contingency table analysis for online only
students with an online GPA of 2.0 and higher along with number of semesters between
enrollments, results were not significant, Pearson χ2 (34, N = 605) = 24.37, p = .888, Cramér’s V
= .201. Despite the lack of significant findings, more than one-third (36.5% or n = 138) of the
successful online only students had been enrolled during the previous semester, and about one-
fourth (25.7% or n = 97) had taken the previous semester off.
Course Withdrawals and Online GPA
As displayed before in Table 47, there was a significant, small, negative correlation (r =
-.111, p < .01) between total course withdrawals for online students and their online GPA; as the
number of course withdrawals for online students increased their online GPA significantly
decreased indicating lower online success. Out of the 2,345 fall 2015 online students, 1,278
(62.6%) students had a least one course withdrawal while 764 (37.4%) students had none. The
number of total course withdrawals for online students who earned an online GPA of 2.0 or
higher in fall 2015 ranged from 0 to 24 withdrawals. More than 40% (40.1% or n = 613) of the
online students with an online GPA of 2.0 or higher had no course withdrawals. There were
22.4% (n = 343) of these students with an online GPA of 2.0 or higher who had one course
withdrawal, 12.4% (n = 343) had two withdrawals, and 12.4% (n = 189) had three withdrawals.

112
When a two-way contingency table analysis was performed, total course withdrawals and online
GPA were also found to be significantly related with a small effect, Pearson χ2 (21, N = 2,042) =
50.72, p < .001, Cramér’s V = .158.
As shown earlier in Table 48, there was a small, positive correlation (r = .019) between
total course withdrawals and online GPA for online only students; as the number of course
withdrawals for online only students increased their online GPA increased, but this increase was
not significant. For online only students, there was also no significant relationship identified
between total course withdrawals and online GPA of 2.0 and higher using a two-way
contingency table analysis, Pearson χ2 (16, N = 368) = 13.30, p = .630, Cramér’s V = .190.
Cumulative Credit Hours and Online GPA
For the online students in fall 2015 who had earned an online GPA of 2.0 or higher, the
cumulative credit hours they had earned ranged from 0 to 207 credit hours. After completing a
two-way contingency table analysis, cumulative credit hours and online GPA were found to be
significantly related with a medium effect, Pearson χ2 (167, N = 2,042) = 324.22, p < .001,
Cramér’s V = .398. As found previously in Table 47, there was a significant, medium, positive
correlation (r = .292, p < .01) between cumulative credit hours and online GPA; as the number of
credit hours online students earned increased, their online GPA also significantly increased
demonstrating higher online success.
For online only students who had earned an online GPA of 2.0 or higher, no significant
relationship was found between cumulative credit hours earned and online GPA during the two-
way contingency table analysis, Pearson χ2 (122, N = 605) = 141.10, p = .114, Cramér’s V = .483.
As seen before in Table 48, there was a significant, small, positive correlation (r = .166, p < .01)
between cumulative credit hours of online only students and online GPA; as the number of credit

113
hours an online only student earned increased, their online GPA also significantly increased
signifying higher online success.
Online Courses and Online GPA
The total number of online courses that students in fall 2015 had taken ranged from 1 to
42 courses. A two-way contingency table analysis was completed for online students based on
total online courses and online GPA, and a significant relationship with a small effect was
identified, Pearson χ2 (25, N = 2,042) = 39.95, p = .030, Cramér’s V = .140. As seen earlier in
Table 47, there was a significant, small, positive correlation (r = .072, p < .01) between total
online courses and online GPA; as the number of online courses students had taken increased
their online GPA also increased indicating higher online success.
For online only students the relationship between total online courses and online GPA of
2.0 or higher was not found to be significant during the two-way contingency table analysis,
Pearson χ2 (23, N = 605) = 17.69, p = .774, Cramér’s V = .171. As displayed previously in Table
48, there was a small, positive correlation (r = .024) between total online courses and online
GPA for online only students; as the number of online courses online only students took
increased their online GPA also increased, but not significantly.
Of the six independent academic variables that were examined as part of research
question three, four of these were significantly correlated to online GPA for online students
overall: (a) cumulative GPA, (b) course withdrawals, (c) cumulative credit, and (d) online
courses. When examining the relationship between the academic variables and online GPA using
two-way contingency table analysis, these four variables were also significantly related to online
GPA for the overall online student population, and semesters since last course also had a
significant relationship with online GPA. Enrollment status was not significantly related to

114
online GPA for the online students overall. When reviewing results for which academic
characteristics correlated to success for online only students fewer variables were significant.
Only three of the six variables were significantly correlated to online GPA: (a) cumulative GPA,
(b) enrollment status, and (c) cumulative credit hours earned. When examining the relationship
between the academic variables and online GPA by performing two-way contingency table
analysis only cumulative credit was significant for online only students.
Research Question Four
The fourth research question for this study focused on which demographic characteristics
of online and online only students most significantly predicted a successful online GPA. The
following were the related hypotheses:
H0: Age, ethnicity, and gender do not predict student success in online courses.
H1: Age, ethnicity, and gender predict student success in online courses.
In order to answer research question four, binary logistic regression was conducted for
online students and online only students to determine which independent demographic student
variables were predictors of a successful online GPA. The dependent variable was categorical:
online GPA was categorized as either under 2.0 (unsuccessful) and coded as “0,” or 2.0 and
higher (successful) and coded as “1.” Fall 2015 and spring 2016 data were combined and
unduplicated for this analysis. The three independent variables used in this model were student
demographics: age, gender, and ethnicity. All three demographic variables were entered at the
same time using the enter method.
Online Student Regression Model
In the logistic regression model for online students, the Hosmer and Lemeshow Test was
not significant (p = .738) which implied the prediction model fit significantly better to the data

115
than the null model without predictors for online students. Also, the Omnibus Tests of model
coefficients was significant (p < .001) also indicating the model was a good fit. Logistic
regression results indicated the overall prediction model including all demographic variables
correctly classified 74.2% of the cases for online students using the default cut off value of .500
to classify each outcome which was essentially no change from the base model (74.3%). The
regression coefficients are shown in Table 51.
Table 51
Regression Coefficients for Demographic Characteristics of Online Students
B Wald df p Exp(B)
Age .027 26.596 1 .000 1.027
Gender -.317 15.608 1 .000 .728
Ethnicity 61.314 8 .000
White .314 4.860 1 .027 1.369
Hispanic -.090 .313 1 .576 .914
Black -.644 12.512 1 .000 .525
American Indian .898 .678 1 .410 2.456
Hawaiian -22.192 .000 1 1.000 .000
Asian .634 4.236 1 .040 1.885
2 or more races .182 .341 1 .559 1.199
International -.028 .008 1 .927 .973
Constant .394 4.315 1 .038 1.484
In this regression model, age, gender, and ethnicity were significant predictors of a
successful GPA so the null hypothesis was rejected. Based on the Cox & Snell R2 and
Nagelkerke R2, only 2 to 4% of online success or having an online GPA of 2.0 or higher was
explained by the demographic variables in the model. Based on the odds ratio values higher than
one for the significant variables, older online students were 2 to 3% more likely to have an online
GPA of 2.0 or higher than younger students (Exp(B) = 1.027, p = .027). White online students
were nearly 37% more likely to have an online GPA of 2.0 than other races (Exp(B) = 1.369, p <

116
.001) as were Asian online students who were nearly 89% more likely to have an online GPA of
2.0 or higher (Exp(B) = 1.885, p = .040). Black online students were about 47.5% less likely to
earn a successful online GPA based on the odds ratio value less than one (Exp(B) = .525, p <
.001). Male online students were about 27.2% less likely than females to earn an online GPA of
2.0 or higher based on the odds ratio value less than one (Exp(B) = .728, p < .001).
Online Only Student Regression Model
Results of another logistic regression model built for online GPA and demographic
characteristics of online only students was similar to the model for the overall online student
population. The Hosmer and Lemeshow Test was not significant (p = .632) which implied the
prediction model fit significantly better to the data than the null model without predictors for
online students, and the Omnibus Tests of model coefficients was significant (p < .001) also
indicating the model was a good fit. Logistic regression results indicated the overall prediction
model including all three demographic variables correctly classified 64.9% of the cases for
online only students using the default cut off value of .500 to classify each outcome which was
slightly higher than the base model (63.6%). The regression coefficients are shown in Table 52.
Using the output from the logistic regression model, the null hypothesis was rejected for age and
ethnicity, but it was accepted for gender.
Based on the Cox & Snell R2 and Nagelkerke R2, only 4 to 6% of online success for
online only students was explained by these three demographic variables. The most significant
variable in this model was age, and based on the odds ratio being higher than one; as age
increased online only students were 3 to 4% more likely to have an online GPA of 2.0 or higher
(Exp(B) = 1.038, p < .001). Ethnicity was significant overall (p < .001), and Black students were
over 47% less likely to earn an online GPA of 2.0 or higher (Exp(B) = .528, p = .026).

117
Table 52
Regression Coefficients for Demographic Characteristics of Online Only Students
B Wald df p Exp(B)
Age .037 24.631 1 .000 1.038
Gender .155 1.221 1 .269 1.168
Ethnicity 21.275 8 .006
White .284 1.596 1 .206 1.328
Hispanic .175 .423 1 .515 1.192
Black -.639 4.945 1 .026 .528
American Indian 20.879 .000 1 .999 1167993762.0
Hawaiian -21.357 .000 1 1.000 .000
Asian .687 1.730 1 .188 1.987
2 or more races .153 .085 1 .771 1.165
International -1.119 .804 1 .370 .327
Constant -.671 4.979 1 .026 .511
For research question four, logistic regression models were built between online GPA
and three demographic student characteristics including age, ethnicity, and gender to ascertain
which were significant predictors of online student success. The prediction models created for
both online and online only students were a good fit, and they correctly classified about the same
number or slightly more cases than the base models. Based on the prediction model created for
online students, age and gender as well as ethnicity significantly predicted whether an online
student would be more likely to earn an online GPA of 2.0 or higher. The prediction model for
online only students showed only age and ethnicity were the significant predictors of whether
students would be successful in online courses. For both models, older students and students of
White and Asian ethnicities were more likely to have an online GPA of 2.0 or higher while Black
online and online only students were much less likely to experience online student success.
Although there were significant findings gathered from these prediction models, the data showed
only a small portion of online student success could be explained by the demographic variables.

118
Research Question Five
Research question five focused on which academic factors of online and online only
students were most significant in predicting a successful online GPA. These were the related
hypotheses:
H0: Cumulative GPA, enrollment status, semesters since last course, course withdrawals,
cumulative credit hours, and total online courses completed do not predict a successful online
GPA.
H1: Cumulative GPA, enrollment status, time since last course, withdrawals, cumulative
credit hours, and total online courses completed predict a successful online GPA.
First Regression Models
In order to answer research question five, binary logistic regression was conducted for
online students and online only students to determine which independent academic student
variables were predictors of a successful online GPA. Fall 2015 and spring 2016 data were
combined and unduplicated for this analysis. The dependent variable online GPA was
categorized as either under 2.0 (unsuccessful) and coded as “0” or 2.0 and higher (successful)
and coded as “1.” The independent variables were the following student academic
characteristics: cumulative GPA, enrollment status, semester enrollment gap, total course
withdrawals, cumulative credit hours, and total online courses. All academic variables were
entered at the same time using the enter method.
Online students. For the logistic regression model generated for online students, the
Hosmer and Lemeshow Test was significant (p = .025) which implied the prediction model did
not fit significantly better to the data than the null model without predictors; however, the
Omnibus Tests of model coefficients was significant (p < .001) indicating the model was a good

119
fit. Logistic regression results indicated the overall prediction model including all academic
variables correctly classified 81.4% of the cases using the default cut off value of .500 to classify
each outcome which higher than the base model (71.8%) that used no predictor variables so the
null hypothesis was rejected. The regression coefficients are shown in Table 53.
Based on the Cox & Snell R2 and Nagelkerke R2, 29 to 42% of online success or having
an online GPA of 2.0 or higher, was explained by the variables in the model. Based on the odds
ratios higher than one of the significant variables, for every increase in cumulative GPA online
students were eight times more likely to earn an online GPA of 2.0 or higher (Exp(B) = 8.08, p <
.001). Also, online students with higher total credit hours earned were significantly more likely
to earn an online GPA of 2.0 or higher.
Table 53
Regression Coefficients for Academic Characteristics of Online Students (First Model)
B Wald df p Exp(B)
Cumulative GPA 2.089 190.127 1 .000 8.080
Enrollment Status -.133 .715 1 .398 .875
Semester Gap .012 .559 1 .455 1.012
Total Withdrawals .011 .129 1 .719 1.011
Cumulative Credit .010 7.443 1 .006 1.010
Total Online Courses -.020 1.079 1 .299 .980
Constant -5.014 140.128 1 .000 .007
Online only students. For the logistic regression model generated for online only
students, the Hosmer and Lemeshow Test was not significant (p = .089) which implied the
prediction model fit significantly better to the data than the null model without predictors;
likewise, the Omnibus Tests of model coefficients was significant (p < .001) also indicating the
model was a good fit. Logistic regression results indicated the overall prediction model including
all academic variables correctly classified 75.3% of the cases using the default cut off value of

120
.500 to classify each outcome which much higher than the base model (57.3%) so the null
hypothesis was rejected. The regression coefficients are shown in Table 54.
Based on the Cox & Snell R2 and Nagelkerke R2, between 29 to 40% of online success
was explained by these six academic student characteristics. Based on the odds ratios higher than
one for the significant variable, for every increase in cumulative GPA online only students were
nearly ten times more likely to earn an online GPA of 2.0 or higher (Exp(B) = 9.942, p < .001).
Table 54
Regression Coefficients for Academic Characteristics of Online Only Students (First Model)
B Wald df p Exp(B)
Cumulative GPA 2.297 70.535 1 .000 9.942
Enrollment Status -.167 .185 1 .667 .846
Semester Gap .022 1.197 1 .274 1.022
Total Withdrawals .027 .393 1 .531 1.027
Cumulative Credit -.002 .098 1 .755 .998
Total Online Courses .000 .000 1 1.000 1.000
Constant -6.182 57.274 1 .000 .002
Second Regression Models
Results from the first regression model for online students indicated the overall model fit
of three predictors (enrollment status, semesters since last course, and total course withdrawals)
were the least statistically reliable in determining online student success (see Table 53). These
three variables were removed, and two new logistic regression models were created using the
remaining three academic variables: cumulative GPA, cumulative credit, and total online
courses.
Online students. For the second logistic regression model for online students, the
Hosmer and Lemeshow Test was not significant (p = .740) which implied the prediction model
fit significantly better to the data than the null model without predictors; similarly, the Omnibus

121
Tests of model coefficients was significant (p < .001) also indicating the model was a good fit.
After removing the three insignificant academic predictor variables, 84.7% of the cases were
accurately classified using the default cut off value of .500 to classify each outcome which was
higher than null model (74.3%) as well as the first logistic regression prediction model for all six
academic variables (81.4%) so the null hypothesis was rejected. The coefficients regression for
the second model using academic characteristics is shown in Table 55.
Table 55
Regression Coefficients for Academic Characteristics of Online Students (Second Model)
B Wald df p Exp(B)
Cumulative GPA 2.294 614.742 1 .000 9.913
Cumulative Credit .006 8.567 1 .003 1.006
Total Online Courses -.010 .440 1 .507 .990
Constant -5.360 473.298 1 .000 .005
Similar to the first model, based on the odds ratio higher than one for the significant
variables for every increase in cumulative GPA online students were about ten times more likely
to earn an online GPA of 2.0 or higher (Exp(B) = 9.913, p < .001). Also, as total credit hours
increased online students were significantly more likely to earn an online GPA of 2.0 or higher
(Exp(B) = 1.006, p = .003). The Cox & Snell R2 and Nagelkerke R2 for the second model
indicated about 35% to 52% of online student success was explained by the variables cumulative
credit hours, cumulative GPA, and number of online courses.
Online only students. A second logistic regression model was built for online only
students eliminating the same three insignificant academic predictor variables for comparison
purposes to the online student group. The Hosmer and Lemeshow Test was not significant (p =
.316) which implied the prediction model fit significantly better to the data than the null model
without predictors; similarly, the Omnibus Tests of model coefficients was significant (p < .001)

122
also indicating the model was a good fit. After removing the three unimportant academic
predictor variables, 80.2% of the cases were accurately classified using the default cut off value
of .500 to classify each outcome which was higher than the null model (63.6%) as well as the
first logistic regression prediction model for academic variables (75.3%) so the null hypothesis
was rejected.
The Cox & Snell R2 and Nagelkerke R2 for the second model indicated about 39% to
54% of online student success was explained by the variables cumulative credit hours,
cumulative GPA, and number of online courses for online only students. The regression
coefficients for the second model using academic characteristics of online only students is shown
in Table 56.
Table 56
Regression Coefficients for Academic Characteristics of Online Only Students (Second Model)
B Wald df p Exp(B)
Cumulative GPA 2.548 228.687 1 .000 12.780
Cumulative Credit -.001 .139 1 .709 .999
Total Online Courses .007 .124 1 .725 1.007
Constant -6.573 179.253 1 .000 .001
Similar to the first regression model for online only students, based on the odds ratio higher than
one for the significant variable as cumulative GPA increased online only students were nearly
thirteen times more likely to earn an online GPA of 2.0 (Exp(B) = 12.780, p < .001). Students
who had a higher number of total online courses earned also had higher odds to earn an online
GPA of 2.0 or higher, but this variable was not significant.
To answer research question five, logistic regression models were initially built for online
students and online only students to determine which of the six academic student characteristics

123
including (a) cumulative GPA, (b) enrollment status, (c) semesters since last course, (d) total
course withdrawals, (e) cumulative earned credit, and (f) total online courses were most
predictive of a successful online GPA. Both models were a good fit, and the prediction models
correctly classified more cases than the base models. Based on the first models generated for
online GPA, several variables were not significant predictors so a second model was generated
for each group of online students; the second models had an improved accuracy rate in predicting
students who would earn an online GPA of 2.0 or higher. Within the second models enrollment
status, semesters since last course, and total course withdrawals were removed from the analyses.
In model two for online students, two variables significantly predicted that a student would be
more likely to earn an online GPA of 2.0 or higher (cumulative GPA and total credit earned)
while only one variable was a significant predictor for a successful GPA for online only students
(cumulative GPA).
Research Question Six
The sixth research question for this study focused on how a combination of academic and
demographic online student characteristics significantly predicted a successful online GPA. The
following were the related hypotheses:
H0: A combination of demographic characteristics and academic factors of online students
does not predict a successful online GPA.
H1: A combination of demographic characteristics and academic factors of online students
predicts a successful online GPA.
In order to answer research question six, binary logistic regression was conducted. Fall 2015 and
spring 2016 data were combined and unduplicated for this analysis. Prediction models were built
based on previously generated models for online students and online only students to identify

124
which demographic and academic student characteristics were the best predictors of a successful
online GPA. Online GPA was the dependent variable, and it was categorized as either under 2.0
and coded as “0” or 2.0 and higher and coded as “1.” Based on results from the previous logistic
regression models created separately for student demographic and academic characteristics, the
independent demographic variables used in this regression model were age, gender, and ethnicity
while the academic variables used were cumulative GPA, cumulative credit hours, and total
online courses. For this model, these six independent variables were entered at the same time
using the enter method.
Online Student Regression Model
The logistic regression model built for online students used the three demographic and
three academic variables as previously described. The Hosmer and Lemeshow Test was not
significant (p = .612) which implied the prediction model fit significantly better to the data than
the null model without predictors. The Omnibus Tests of model coefficients was also significant
(p < .001) indicating the model fit significantly better than the data from the null model without
predictors. The regression coefficients from this logistic regression model are shown in Table 57.
Logistic regression results indicated the overall model including a combination of all
demographic and academic variables correctly classified 85.2% of the cases using the default cut
off value of .500 to classify each outcome which was higher than the base model (74.3%), and
had the highest accuracy of prediction for any model generated so the null hypothesis was
rejected.
Based on the Cox & Snell R2 and Nagelkerke R2 about 35% to 52% of online success, or
having an online GPA of 2.0 or higher, was explained by the variables in this model. In this
model, two variables were significant in predicting that a student would earn an online GPA of

125
2.0 or higher: cumulative GPA and cumulative credit. Based on the odds ratio higher than one, as
cumulative GPA increased online students were nearly ten times more likely to earn a successful
GPA (Exp(B) = 9.874, p < .001). Also, as cumulative credit increased online GPA significantly
increased (Exp(B) = 1.006, p = .003).
Table 57
Regression Coefficients for Demographic and Academic Characteristics of Online Students
B Wald df p Exp(B)
Age -.002 .061 1 .806 .998
Gender -.165 2.418 1 .120 .848
Ethnicity 5.687 8 .682
White .131 .489 1 .484 1.140
Hispanic .013 .313 1 .576 .914
Black -.644 .014 1 .905 .971
American Indian .038 .001 1 .974 1.039
Hawaiian -23.516 .000 1 1.000 .000
Asian .241 .360 1 .549 1.272
2 or more races .694 2.427 1 .119 2.001
International -.432 1.012 1 .315 .649
Cumulative GPA 2.290 598.034 1 .000 9.874
Cumulative Credit .006 8.913 1 .003 1.006
Total Online Courses -.014 .893 1 .345 .986
Constant .394 4.315 1 .038 1.484
Online Only Student Regression Model
The logistic regression model generated for online only students used the same
demographic and academic variables as for the overall online student group. The Hosmer and
Lemeshow Test was not significant (p = .073) which implied the prediction model fit
significantly better to the data than the null model without predictors; the Omnibus Tests of
model coefficients was also significant (p < .001) indicating the model fit significantly better
than the data from the null model without predictors. Results indicated the overall model

126
including a combination of demographic and academic variables correctly classified 80.2% of
the cases using the default cut off value of .500 to classify each outcome which was higher than
the base model (63.6%), and it was the highest accuracy of all prediction models created for
online only students so the null hypothesis was rejected. The regression coefficients from this
logistic regression model are shown in Table 58.
Based on the Cox & Snell R2 and Nagelkerke R2 about 40% to 55% of online success, or
having an online GPA of 2.0 or higher, was explained by the variables in this model. In this
model for online only students, cumulative GPA was the only variable that significantly
predicted a student would earn an online GPA of 2.0 or higher. Based on the odds ratio, as
cumulative GPA increased online only students were nearly thirteen times more likely to earn a
successful GPA (Exp(B) =12.807, p < .001).
Table 58
Regression Coefficients for Demographic and Academic Characteristics of Online Only Students
B Wald df p Exp(B)
Age .011 1.147 1 .284 1.011
Gender .162 .765 1 .382 1.175
Ethnicity 5.682 8 .683
White .107 .122 1 .726 1.113
Hispanic .368 1.000 1 .317 1.445
Black -.329 .695 1 .404 .719
American Indian 20.113 .000 1 .999 543020740.4
Hawaiian -22.349 .000 1 1.000 .000
Asian .444 .380 1 .537 1.558
2 or more races .612 .697 1 .404 1.844
International -1.332 .851 1 .356 .264
Cumulative GPA 2.550 211.195 1 .000 12.807
Cumulative Credit -.002 .530 1 .467 .998
Total Online Courses .011 .284 1 .594 1.011
Constant .394 4.315 1 .038 .001

127
Using results gathered from the logistic regression models in research questions four and
five, new logistic regression models were built between online GPA and a combination of both
demographic student characteristics (age, ethnicity, and gender) and academic student
characteristics (cumulative GPA, cumulative credit earned, and total online courses) to help
answer research question six. Both final prediction models were a good fit; these models
correctly classified more cases than the base models, and had the highest classification rates of
any models generated. Based on the prediction model for online students, only two academic
variables significantly predicted that an online student would be more likely to earn an online
GPA of 2.0 or higher: cumulative GPA and cumulative credit. Only one academic variable in the
online only student model significantly predicted online student success: cumulative GPA. None
of the demographic variables were significant in these models which indicated demographic
characteristics were less predictive of online student success than academic characteristics.
Summary
In order to answer the six research questions in this study, a variety of analyses including
descriptive statistics, t tests, Pearson correlation coefficients, two-way contingency table
analysis, and logistic regression were performed to identify which demographic and academic
variables were significantly correlated to or predicted online student success for online and
online only students. Results of research question one indicated there was no significant
difference in online GPA for online or online only students based on distance from campus while
online and online only students had a significantly higher mean online GPA if they had
previously passed computer courses or took no remedial courses during the study. Also, while
there was no significant difference in online GPA for online students based on their financial aid

128
award, there was a significant difference in online GPA for online only students based on
financial aid award.
Results of research question two identified that age, ethnicity, and gender were
significantly correlated to online GPA for online students while only age and ethnicity were
significantly correlated to online success for online only students. The same significant
relationships were identified between online GPA and the demographic characteristics for both
online groups during the two-way contingency table analyses.
As part of research question three, significant correlations were observed between the
online GPA for students taking online courses and their (a) cumulative GPA, (b) course
withdrawals, (c) cumulative credit, and (d) total online courses. Significant correlations were
also found between the online GPA for students taking only online courses and their (a)
cumulative GPA, (b) enrollment status, and (c) cumulative credit. Using two-way contingency
table analysis to examine the relationship between online GPA and academic student
characteristics lead to slightly different results. For online students there was a significant
relationship between successful online GPA and a semester gap in addition to cumulative GPA,
course withdrawals, cumulative credit, and total online courses. For online only students, a
significant relationship was found between a successful online GPA and cumulative GPA, but no
significant relationship was identified based on enrollment status or cumulative credit.
Based on results from various logistic regression models that were created to answer
research questions four, five, and six, academic student characteristics were more predictive of
which students would earn a higher online GPA than demographic student characteristics.
Although age, gender, and ethnicity were identified as significant predictors of online student
success as part of research question four, as part of research question six these demographic

129
characteristics were not significant. As part of research question five and six, for online students
cumulative GPA was the most significant predictor of which students were most likely to earn an
online GPA of 2.0 or higher along with cumulative credit earned while for online only students
cumulative GPA was the only significant academic predictor of earning an online GPA of 2.0 or
higher. These research results, as well as conclusions and implications of the findings, are
discussed in more detail in Chapter Five.

130
CHAPTER V: SUMMARY, CONCLUSIONS, IMPLICATIONS, LIMITATIONS, AND
RECOMMENDATIONS
Introduction
This study targeted students taking online classes at a Midwestern community college to
examine which demographic and academic factors led to online student success. This chapter
begins with an overview and the purpose of the study as well as a reminder about the study
population and the research design. It also provides a summary of findings obtained from this
study that were explained in detail in the previous chapter along with guidance for using the
results in higher education. In addition, this chapter will offer implications, limitations,
recommendations for future research, and conclusions.
Overview and Purpose of Study
Within higher education the number of online classes and the enrollment in these classes
has been increasing for over a decade (Allen & Seaman, 2017; Jost et al., 2012; McIntire, 2015;
Parke et al., 2010; Wilson et al., 2015). This trend has been more pronounced at the community
colleges where the largest number of online courses have typically been available (Ginder &
Stearns, 2014; Illinois Community College Board, 2015). For students who complete online
courses there is no significant difference in course outcomes when compared with student
outcomes in face-to-face courses (WCET, 2010); however, although online course enrollments
have continued to increase research has also shown online course success rates are lower than
success rates for campus-based courses (Hachey et al., 2012; Hart, 2012; Jost et al., 2012;
Lehman & Conceicao, 2014; Moore & Kearsley, 2012; Xu & Jaggars, 2011a, 2011b). There are
many factors that impact online student success. Since many of the previous studies generated
different or mixed findings about the factors that impact online student success, the purpose of

131
this study was to generate a conceptual model of online student success as a factor of students’
demographic and academic characteristics. The study sought to examine existing online
community college student data to define the critical elements that correlated to and predicted
online student success. Significant findings from this study were compared to the findings from
previous studies to identify similarities and differences as well as to offer recommendations for
both practical use in higher education and needed future research.
Study Population
The research for this study focused on all degree and certificate seeking community
college students at one institution who took at least one online, credit course during fall 2015 or
spring 2016. The secondary data received from the college’s IR department included information
about both students who completed their online coursework successfully as well as those who
were unsuccessful and withdrew from their online courses. The overall population of students
taking online courses during these two semesters was a duplicated enrollment count of 4,903, or
an unduplicated online enrollment count of 4,046. The majority (71%) of the online students
were also taking classes on campus or in a hybrid format while others (29%) were taking only
online courses. The duplicated enrollment count for students taking only online courses was
1,425, and the unduplicated online only enrollment was 1,186 students. The analysis and results
for each of these online student groups were compared for each research question.
Research Design and Methodology
A correlational research methodology was used for this study, and secondary data from a
large, Midwestern community college was examined. Descriptive statistics, t tests, Pearson
correlation coefficients, two-way contingency table analysis, and logistic regression were
performed to determine whether or not any of the demographic independent variables (age,

132
gender, and ethnicity) or academic independent variables (distance from campus, financial aid
award, previous computer courses, remedial courses, cumulative GPA, enrollment status, time
since last course, course withdrawals, cumulative credit hours, and total online courses)
significantly influenced success in online courses or the dependent variable which was
operationalized as online GPA. The following six research questions guided this study:
1. What difference in online GPA exists based on an online student’s distance from campus,
financial aid award, previous computer courses passed, and remedial courses?
2. How do demographic characteristics of online students (age, ethnicity, and gender)
correlate to online GPA?
3. How do academic factors of online students (cumulative GPA, enrollment status, time
since last course, course withdrawals, cumulative credit hours, and total online courses
completed) correlate to online GPA?
4. Which demographic characteristics of online students most significantly predict a
successful online GPA?
5. Which academic factors of online students most significantly predict a successful online
GPA?
6. What combination of demographic characteristics and academic factors of online students
most significantly predicts a successful online GPA?
By addressing all six research questions and the related 12 hypotheses, the goal was to identify
significant correlates and predictors of online student success. In the next section, a summary of
these research findings is provided.

133
Summary of Findings
This section summarizes the primary discoveries regarding online student success that
resulted from this quantitative study. Results are reported for the overall group of students who
took at least one online class as well as for those students who took only online courses. For a
complete explanation of all data findings, please refer to Chapter Four.
General Study Outcomes
Total online student credit enrollment (N = 2,345) at this community college in fall 2015
was 15.6% of the total credit enrollment (N = 15,016) for the semester; about one in six students
took at least one online course. Nationally, during the same semester, about 30% of higher
education students were enrolled at least one online course (Allen & Seaman, 2017); this
community college falls 50% below the national average for percentage of online student
enrollment. In this study, about 29% of students at this community college took all of their
courses online which is under 5% of the total fall 2015 credit enrollment. Nationally, in fall
2015, about one in seven students took all of their courses online (Allen & Seaman, 2017) which
is nearly three times higher than figures for this community college. Despite a growing number
of online course sections and increased online student enrollment over the last ten years at this
community college, figures for fall 2015 online enrollment fell well below the national average.
Demographic characteristics for online students in this study show both similarities and
differences to community college enrollment trends within Illinois and across the United States.
Two-thirds (66.3%) of the online only students in this study were female while about 62% of
online students overall were female. These percentages of female students were higher than the
national community college trends identified by the 2016 National eLearning Report where 60%
of online students were female (Lokken, 2017), and it is also higher than national figures

134
reported by the American Association of Community Colleges (2017) where 56% of all students
were female. The percentage of females in this study is also higher than trends for Illinois
community colleges where under 56% of all students were female (Illinois Community College
Board, 2017). Nationally, as well as across Illinois including at this community college, the
majority of community college students reported their ethnicity as White, followed by Hispanic,
and then Black (American Association of Community Colleges, 2017; Illinois Community
College Board, 2017). Most of the online students in this study lived near campus; more than
82% lived in-district, and about two-thirds lived 10 miles or less from campus. In fall 2016
across Illinois about 88% of all community college students lived in district (Illinois Community
College Board, 2017). This high statistic for in-district students is not unusual because
community colleges have a mission to mainly serve the people in their district.
At the community college in this study, the population of students taking online courses
was younger than anticipated; over 67% were traditional aged. This is slightly younger than the
rest of the state according to the Illinois Community College Board (2017) as they reported 65%
of all students were nontraditional aged in fall 2016. In contrast, the online only students in this
study were older overall, and more evenly split with about half traditional and half
nontraditional. Students taking online classes were fairly evenly split between part-time (49.2%)
and full-time (50.8 %) enrollment status, but students who were only taking online courses were
90% part-time. These figures are a little different than for all community college students
nationally as reported by the American Association of Community Colleges (2017) where 62%
of students were part-time as well as numbers reported within Illinois by the Illinois Community
College Board (2017) where 64% of all students were part-time.

135
Online students in this study were taking an average of about three courses during a
semester with a median and mode of four courses while online only students were taking fewer
than two courses on average with a median and mode of just one course during the semester.
Online only students also had a larger average enrollment gap of between three and four
semesters between enrollments. This is a longer time between enrollments than for online
students overall who averaged only two or three semesters off between enrollments.
Overall trends for gender, residency status, and ethnicity of online students within this
study followed community college enrollment trends across Illinois and the United States. There
were also some differences in trends identified for enrollment status and age for this community
college when compared to the local and national enrollment trends. Demographic online student
characteristics as well as various academic online student characteristics are further explored
within the results from the six specific research questions.
Research Question One
What difference in online GPA exists based on an online student’s distance from campus,
financial aid award, previous computer courses passed, and remedial courses?
In order to address research question one, independent samples t tests were completed.
As a result, several significant differences were identified. Significant mean differences in online
GPA for both online student groups were identified based on remedial coursework and computer
experience, and a significant mean difference was identified for online only students based on
financial aid award. No significant difference in online GPA was identified based on distance. A
summary of the t test results is found in Table 59; additional discussion will follow.
Distance. First, no significant difference in online GPA was found for either the overall
online student group or the online only student group based on distance from campus (see Table

136
59). Few studies analyzed student success based on distance; however, Hawkins (2012)
identified distance as a significant negative predictor of online student success. According to
Hawkins (2012) students who lived further away from campus were significantly less successful.
In this study, online only students who lived further from campus had a higher online GPA than
those who lived closer while the students in the overall online student group who lived closer had
a higher online GPA than those who lived further away; none of these differences were
significant. Due to the mixed findings in this study along with very little other research available
regarding how distance relates to online student success, additional research is needed.
Table 59
Summary of Significant Mean Difference in Online GPA by Type of Student
Online GPA
t test variables Online
Students
Online Only
Students
Distance not significant not significant
Financial Aid not significant significant**
Computer Experience significant** significant*
Remedial Coursework significant** significant**
** p < .001. * p =.003.
Financial aid. Second, no significant difference in online GPA for the overall online
student group was found based on whether or not the online student had received financial aid
during the semester, but a significant difference in online GPA was identified for the online only
student group (see Table 59). For online only students in this study, those who did not receive
financial aid during the semester had a significantly higher online GPA than those who were
awarded some financial aid although the effect size was small. A limited number of studies
tested the relationship between online student success and financial aid. One study found a

137
positive relationship between financial aid and online student success (Bull, 2015) while a few
studies, including this one, identified a significant, negative correlation between online student
success and financial aid awards (Gregory, 2016; Rodriguez, 2011). Several other studies did not
identify any significant findings related to financial aid and online student success (Aragon &
Johnson, 2008; Berling, 2010; Foster, 2012; Gibson, 2015; Riordan, 2013). Within the studies
that analyzed the impact of financial aid on online student success, the variable was defined in
different ways. Some studies used only financial aid awards that were accepted by students when
examining online student success (Berling, 2010; Foster, 2012; Gibson, 2015; Riordan, 2013),
other studies used financial aid eligibility regardless of whether or not the awards were accepted
(Aragon & Johnson, 2008; Gregory, 2016), and a few studies examined multiple variables for
financial aid such as application, eligibility, and ability to pay (Bull, 2015; Rodriguez, 2011).
The ability to pay for online courses and then complete the needed coursework to succeed is an
important issue. Based on these varying results, and the fact that 58% of community college
students use some type of financial aid (American Association of Community Colleges, 2017),
additional research should be conducted to determine the impact of financial aid on online
student success.
Computer experience. Next, when comparing the online GPA mean values, students in
both the overall online group and the online only student group who had successfully passed at
least one computer course had a significantly higher online GPA when compared to online
students who had not taken or passed any computer courses, but the effect size was small (see
Table 59). Previous research identified mixed findings related to online student success based on
computer skills or experience with technology. Similar to this study, Dupin-Bryant (2004) also
identified a significant, positive correlation between computer experience and online GPA while

138
Harrell and Bower (2011) identified a significant, negative correlation between computer
experience and online student success. Several other studies identified no significance between
computer experience and online student success (Akpom, 2013; Cummings, 2009; Muse, 2003;
Riordan, 2013; Shaw et al., 2016).
Within these studies, computer experience was either determined through self-reported
data collected from students using a survey (Akpom, 2013; Dupin-Bryant, 2004; Harrell &
Bower, 2011; Muse, 2003; Shaw et al., 2016), or based on computer coursework students had
completed (Cummings, 2009; Riordan, 2013) similar to this study. It is intuitive to think that
students with better computer skills would perform better in online classes much like results
from this study indicate, but research has not always shown that to be the case likely due to many
other variables that impact online student success. With limited research existing and a mix of
findings available, additional research is needed to better understand the relationship between
computer experience and online student success.
Remedial coursework. Finally, students in both the overall online student group and the
online only student group who took no remedial courses during the semester had a significantly
higher mean online GPA than those students who were enrolled in one or more remedial courses;
the effect size was medium to large (see Table 59). One previous study found no significant
correlation between online student success for students who were underprepared for college-
level work and needed remediation and those who entered directly into college-level work
(Aragon & Johnson, 2008). Several other studies, in addition to this study, identified lower
online student success for students who needed remedial work (Fisher, 2010; Hachey et al.,
2012; Harrell & Bower, 2011; Jost, et al., 2012; Xu & Jaggars, 2011a, 2011b, 2013). It is
important to advise students effectively in order to help them succeed. These results indicated

139
students taking remedial courses tended to have lower performance in online courses; colleges
should make an effort to caution students taking remedial courses about also enrolling in online
classes in which they are less likely to succeed.
The significant results from research question one indicated colleges should encourage
online students to take a computer-related course or have a certain level of computer competency
prior to enrolling in an online course. These computer skills may allow students to feel more
comfortable in the online learning environment so they are able to better focus on the required
coursework instead spending additional time navigating the online learning management system.
Additionally, results from research question one also showed students with weaker academic
skills or those who placed into remedial coursework tended to have more trouble succeeding in
the online environment. Colleges should inform students who are registering for remedial
courses to avoid taking them online or at the same time as online courses in order to have a better
chance for online course success. Furthermore, results indicated students who took only online
courses, who did not have any financial aid award, had a significantly higher online GPA.
Finally, online and online only students were no more likely to succeed if they lived further from
campus, and regardless of how far the students lived from campus many online students were
still able to succeed. Since findings were mixed, online students should not be discouraged from
taking online classes based on distance from campus or financial aid status.
Research Question Two
How do demographic characteristics of online students (age, ethnicity, and gender)
correlate to online GPA?
In order answer research question two and identify which demographic characteristics
were significantly related to online GPA for the overall online student group and the online only

140
student group, Pearson correlation coefficients were generated and two-way contingency table
analyses were conducted. A summary of significant correlations between the dependent variable
and the independent demographic variables is found in Table 60. Similarly, the summary of the
significant Chi-Square findings from the two-way contingency table analysis is in Table 61.
Table 60
Correlation Summary for Online GPA and Demographic Characteristics by Type of Student
Online GPA
Demographic
Characteristics Online Students
Online Only
Students
Age Significant (+)** Significant (+)**
Gender Significant (+)** Not significant
Ethnicity Significant (-)* Significant (-)*
** p < .01. * p <.05.
After creating Pearson correlation coefficients to examine the relationship between online
GPA and demographic student characteristics (see Table 60), there were several significant
findings. For the overall online student group, there was a significant, positive correlation
between online GPA and age (r = .126, p < .01) as well as gender (r = .081, p < .01), and there
was a significant, negative correlation between online GPA and ethnicity (r = -.040, p < .05);
these were all small correlations. For online only students, online GPA and age were positively
correlated (r = .183, p < .01) while online GPA and ethnicity were negatively correlated (r = -
.073, p < .05); both of these correlations were significant and small.
Two-way contingency table analyses were generated for both the online student group
and the online only student group to examine the relationship between online GPA and
demographic characteristics. For online students a significant relationship was identified between
online GPA and age, gender, and ethnicity (see Table 61); the effect of these variables on online
GPA were very small or small. For online only students age and ethnicity were significantly
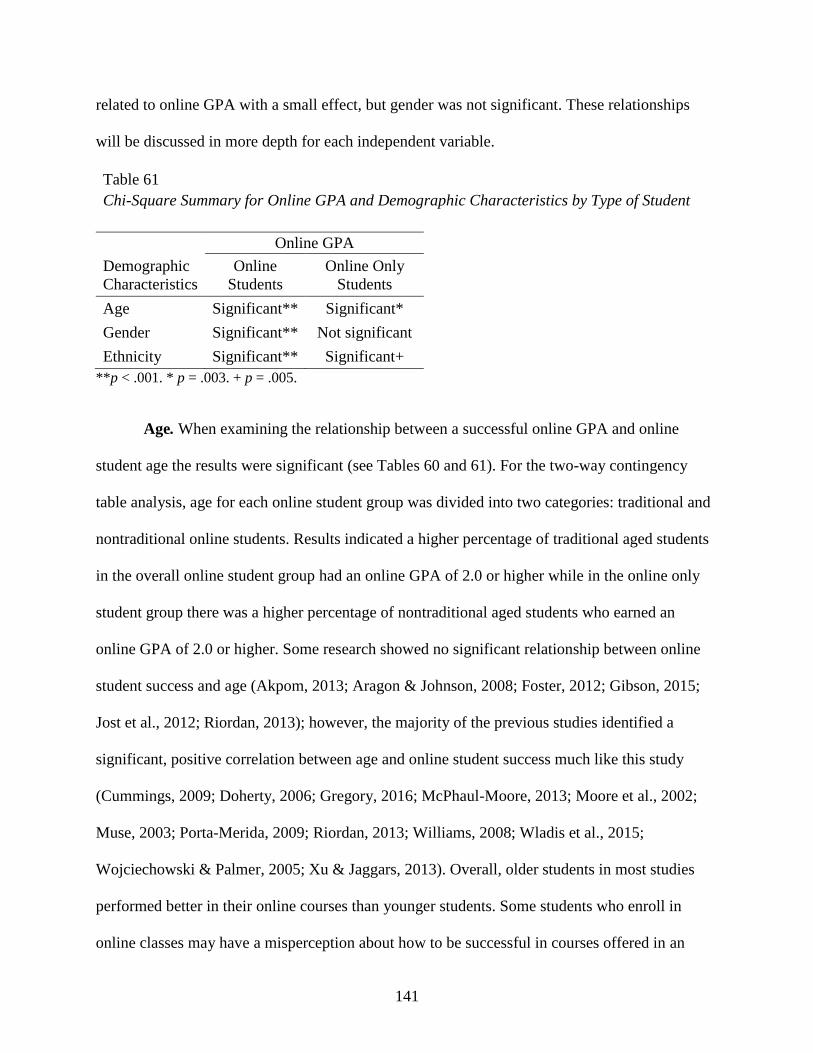
141
related to online GPA with a small effect, but gender was not significant. These relationships
will be discussed in more depth for each independent variable.
Table 61
Chi-Square Summary for Online GPA and Demographic Characteristics by Type of Student
Online GPA
Demographic
Characteristics
Online
Students
Online Only
Students
Age Significant** Significant*
Gender Significant** Not significant
Ethnicity Significant** Significant+
**p < .001. * p = .003. + p = .005.
Age. When examining the relationship between a successful online GPA and online
student age the results were significant (see Tables 60 and 61). For the two-way contingency
table analysis, age for each online student group was divided into two categories: traditional and
nontraditional online students. Results indicated a higher percentage of traditional aged students
in the overall online student group had an online GPA of 2.0 or higher while in the online only
student group there was a higher percentage of nontraditional aged students who earned an
online GPA of 2.0 or higher. Some research showed no significant relationship between online
student success and age (Akpom, 2013; Aragon & Johnson, 2008; Foster, 2012; Gibson, 2015;
Jost et al., 2012; Riordan, 2013); however, the majority of the previous studies identified a
significant, positive correlation between age and online student success much like this study
(Cummings, 2009; Doherty, 2006; Gregory, 2016; McPhaul-Moore, 2013; Moore et al., 2002;
Muse, 2003; Porta-Merida, 2009; Riordan, 2013; Williams, 2008; Wladis et al., 2015;
Wojciechowski & Palmer, 2005; Xu & Jaggars, 2013). Overall, older students in most studies
performed better in their online courses than younger students. Some students who enroll in
online classes may have a misperception about how to be successful in courses offered in an

142
online format. Results from this study indicated colleges should provide information to
traditional students who are interested in taking all online courses so they are more prepared to
face the differences in instructional methods, and know what to expect in the online course
format so they are more likely to succeed.
Gender. When investigating the relationship between a successful online GPA and
online student gender the results were significant only for the overall online student group, but
not for the online only student group (see Tables 60 and 61). In the studies that indicated
percentages, between two-thirds and three-quarters of the online course participants were female.
Some research revealed a significant correlation between online student success and gender;
female students performed better than males, and this was largely due to online course flexibility
(Aragon & Johnson, 2008; Doherty, 2006; Porta-Merida, 2009; Wladis et al., 2015; Xu &
Jaggars, 2013). Many other studies found no significant difference in online student success
based on gender (Akpom, 2013; Berling, 2010; Bull, 2015; Cummings, 2009; Foster, 2012;
Gibson, 2015; Gregory, 2016; Jost et al., 2012; Moore et al., 2002, Riordan, 2013; Wilson &
Allen, 2011; Wojciechowski & Palmer, 2005). These studies did not all examine the same types
of online courses, and most studies combined results from multiple online courses together
which makes a comparison more difficult since each student will enroll in online courses in
different disciplines based on their program of study and what classes are being offered online.
Based on the mixed findings, it is unlikely gender alone predicts online success; however,
institutions should be aware that studies have found lower online success for male online
students. Colleges should find ways to assist all online students, but in particular male students
who may be a risk for lower online success.

143
Ethnicity. When examining the correlation between a successful online GPA and online
student ethnicity the results were significant for both online student groups (see Table 60). The
two-way contingency table analysis results in this study also indicated a significant relationship
between ethnicity and online GPA (see Table 61); overall, a higher percentage of non-minority
students had an online GPA of 2.0 or higher. When looking at the online student groups, the
highest percentage of students who earned an online GPA of 2.0 or higher reported their
ethnicity as White, followed by Hispanic, and then Black. Previous research about the
relationship between ethnicity and online student success are mixed with some ethnicities having
higher online student success. Some previous studies found no significant difference in online
student success based on ethnicity (Aragon & Johnson, 2008; Gibson, 2015; Jost et al., 2012;
Wladis et al., 2015) while other studies found non-minority or White online students were more
successful than other groups which is similar to this study (Berling, 2010; Bull, 2015; Moore et
al., 2002; Palacios & Wood, 2016; Porta-Merida, 2009; Williams, 2008; Xu & Jaggars, 2013).
The number of online students across different ethnicities in this study was not equal, and the
online success rate for each ethnic category was different. There were only a few American
Indian online and online only students, but they earned the highest percentage students with an
online GPA of 2.0 or higher followed by Asian and then White students with Black online and
online only students far below the other ethnic groups in successful online achievement.
Each higher education institution has a different student population based on online
course and program offerings, location of the college, and type of the institution. The student
population at a community college primarily reflects the communities included within its district
boundaries. These differences in student populations across institutions likely contributed to the
mixed findings for the online student success of various ethnicities in previous studies. Although

144
other studies had mixed findings, and the significant findings from this study are institution
specific, the information can be used to help online students of certain identified ethnicities who
are less likely to succeed by providing them with resources and information about online courses
and strategies to help them be more successful.
Research Question Three
How do academic factors of online students (cumulative GPA, enrollment status, time
since last course, course withdrawals, cumulative credit hours, and total online courses) correlate
to online GPA?
To address research question three, Pearson correlation coefficients and two-way
contingency table analyses were generated for the six academic student characteristics and online
GPA; a variety of significant findings were identified for both online student groups. A summary
of the significant correlations between the dependent variable and independent academic
variables is located in Table 62. Similarly, a summary of the significant Chi-Square findings
from the two- way contingency table analysis for the demographic variable and each academic
variable in research question three can be found in Table 63.
Table 62
Correlation Summary for Online GPA and Academic Characteristics by Type of Student
Online GPA
Academic
Characteristics Online Students
Online Only
Students
Cumulative GPA Significant (+)** Significant (+)**
Enrollment Status Not significant Significant (-)*
Semester Gap Not significant Not significant
Course Withdrawals Significant (-)** Not significant
Cumulative Credit Significant (+)** Significant (+)**
Online Courses Significant (+)** Not significant
** p < .01. * p <.05.

145
There were some differences in the academic characteristics that were significantly
related to online GPA. For example, the semester gap or time students took off between
semesters of enrollment was not significantly correlated to a successful online GPA for either
online student group, but within the Chi-Square analysis these two variables were significantly
related for the overall online student population. Also, for online only students there were fewer
significant variables identified than for the overall online student group. These relationships will
be further discussed.
Table 63
Chi-Square Summary for Online GPA and Academic Characteristics by Type of Student
Online GPA
Academic
Characteristics Online Students
Online Only
Students
Cumulative GPA Significant** Significant**
Enrollment Status Not significant Not significant
Semester Gap Significant* Not significant
Course Withdrawals Significant** Not significant
Cumulative Credit Significant** Not significant
Online Courses Significant+ Not significant
** p < .001. * p =.008. + p =.030.
Cumulative GPA. The most significant finding was a large, positive correlation between
cumulative GPA and online GPA for the overall online student group (r = .704, p < .01) and for
the online only student group (r = .693, p < .01). This finding was consistent with results from
numerous previous studies; online students with a higher previous GPA were identified as more
likely to succeed in online courses (Akpom, 2013; Aragon & Johnson, 2008; Berling, 2010; Bull,
2015; Cochran et al., 2014; Cummings, 2009; Dupin-Bryant, 2004; Foster, 2012; Gibson, 2015;

146
Harrell & Bower, 2011; Hawkins, 2012; Jost et al., 2012; McPhaul-Moore, 2013; Muse, 2003,
Porta-Merida, 2009; Riordan, 2013; Rodriquez, 2011; Smith, 2005; Wilson & Allen, 2011;
Wladis et al., 2015; Wojciechowski & Palmer, 2005; Xu & Jaggars, 2013). Since the correlation
between cumulative GPA and online student success is such a strong, well-documented finding
throughout the literature, colleges should consider implementing a minimum GPA standard for
students taking online courses.
Cumulative credit. The second largest, significant correlation was identified between
cumulative credit hours earned and online GPA for the overall online student group (r = .292, p
< .01) and for the online only student group (r = .166, p < .01). There was one previous study
that identified a significant, negative correlation between online student success and total credit
hours earned (Rodriquez, 2011), but numerous previous studies identified a positive relationship
meaning students who had a higher number of total credit hours earned had higher grades in
online courses just as found in this study (Berling, 2010; Bull, 2015; Cochran et al., 2014;
Cummings, 2009; Doherty, 2006; Dupin-Bryant, 2004; Foster, 2012; Gregory, 2016; Moore et
al., 2002; Smith et al., 2012; Wilson & Allen, 2011; Wojciechowski & Palmer, 2005). This
finding supports implementing a policy or encouraging students not to take online courses at the
beginning of their program to increase their chance for online success.
Online courses. Another significant, positive correlation was found between online GPA
and the number of online courses a student had taken. This relationship was not significant for
the online only student group, but in the overall online student group as the number of online
courses students had taken increased so did their online GPA (r = .072, p < .01). This same
correlation was also identified in many previous studies (Dupin-Bryant, 2004; Hachey et al.,
2013; Hachey et al., 2012; McPhaul-Moore, 2013; Moore et al., 2002; Porta-Merida, 2009;

147
Williams, 2008, Wladis et al., 2015; Wojciechowski & Palmer, 2005; Xu & Jaggars, 2011b).
Apkom (2013) and Muse (2003) found no significant correlation between online GPA and the
number of online courses a student had taken while Smith (2005) found a negative correlation
between online GPA and number of online courses. Although the finding in this study was a
small correlation, the majority of studies show that if students have previously taken online
courses they tended to do better in future online courses. This finding is further support for
suggesting or requiring some students take online courses later in their program to help increase
their online success.
Course withdrawals. A significant, negative correlation was found in this study between
the total number of course withdrawals and online GPA (r = -.111, p < .01) for the overall online
student group although this finding was not significant for the online only student group. Not
many previous studies examined course withdrawals in relation to online student success;
however, a few other studies also found that a higher number of course withdrawals for online
students led to lower online course success (Cochran et al., 2014; Wojciechowski & Palmer,
2005). This information can be helpful for academic advisors who speak with students prior to
registration. If students have a history of frequent course withdrawals, the online course format
may not be best option for them. Since little research is available about the impact of course
withdrawals and online student success additional research should be pursued.
Enrollment status. No significant correlation was identified between enrollment status
and online GPA for the overall online student group; however, for the online only student group
enrollment status had a significant, small, negative correlation to online GPA (r = -.101, p < .05).
In this study, nearly all (90%) of online only students were taking classes part-time which may
explain why this finding was significant only for this population. Previous studies have mixed

148
findings when examining enrollment status with online student success. Some studies found no
significant correlation between how many credit hours a student was taking and online student
success (Akpom, 2013; Muse, 2003; Wladis et al., 2015; Wojciechowski & Palmer, 2005), and a
few studies found a positive correlation between enrollment hours and online student success
(Aragon & Johnson, 2008; Smith et al., 2012). The results of several other studies matched this
study identifying a negative correlation between online student success and enrollment status;
this means students who were taking fewer credit hours during the semester had higher online
student success (Doherty, 2006; Gregory, 2016; Hawkins, 2012; Moore et al., 2002; Riordan,
2013; Rodriguez, 2011). Although the findings for enrollment status and online success were
mixed, and additional research would be beneficial, the existing evidence can be used by
academic advisors who might suggest that students take fewer courses overall when they enroll
in online courses to increase their chances of online success.
Semester gap. When examining the time students took off between semesters of
enrollment the findings were not significant for either online student group in this study. Only
one other study that examined how an enrollment gap was related to online student success was
identified. Muse (2003) found a significant positive relationship between online student success
and time off between semesters of enrollment which would mean online students performed
better after a longer time off between courses. This is contrary to what would normally be
expected where students who are continuously enrolled would perform better. Since the research
on this variable is limited, additional research should be performed to help better understand how
the gap a student has between semesters of enrollment impacts online student success.
Two different analyses were conducted for both online student groups to identify which
academic student characteristics significantly related to online GPA in order to answer research

149
question three. There were more significant correlations for the overall online student group than
the online only group. Cumulative GPA had highest positive correlation to online GPA with a
large effect followed by cumulative credit with a medium effect; these two characteristics were
the only significant findings for both online student groups. In addition, for the overall online
student group the number of course withdrawals had a small, negative correlation to online GPA,
and the number of online courses taken had a small, positive correlation to online GPA.
Enrollment status was negatively correlated to online GPA for the online only student group also
with a small effect size. Furthermore, semester gap or time between enrollments was
significantly related to online GPA in the Chi-Square analysis with a small effect for the overall
online student group. Based on these significant findings, colleges should consider implementing
policies that limit enrollment in online courses based on cumulative GPA and cumulative credit
earned. This policy would allow students only to enroll in online courses after they have
established a record of successful coursework which would increase their odds of online success.
Research Question Four
Which demographic characteristics of online students most significantly predict a
successful online GPA?
In order to answer research question four, two logistic regression models were built to
determine which demographic factors were the most significant predictors of a successful online
GPA; one model was created for the overall online student group, and another model for the
online only student group. A summary of significant predictors is in Table 64. The regression
model for online students correctly classified 74.2% of all cases (same as base model), and the
model for online only students was not as accurate correctly classifying 64.9% of all cases

150
(slightly higher than base model); both models had high classification rates between 94% and
100% for an online GPA of 2.0 or higher.
All three demographic factors were significant for the overall online student model: age,
gender, and ethnicity (p < .001). The specific odds of earning an online GPA of 2.0 or higher
were higher as the age of the online student increased (Exp(B) = 1.027, p < .001). Additionally,
online students of two ethnicities had higher odds of earning an online GPA of 2.0 or higher:
White (Exp(B) = .728, p < .001) and Asian (Exp(B) = 1.885, p = .040). Online students who were
Black had lower odds of earning an online GPA of 2.0 or higher (Exp(B) = .525, p < .001).
Furthermore, the odds of online success was lower for males than females for overall online
student group (Exp(B) = .728, p < .001).
Table 64
Demographic Predictors of Online GPA by Type of Student
Online GPA
Demographic
Characteristics
Online
Students
Online Only
Students
Age Significant** Significant**
Gender Significant** Not significant
Ethnicity Significant** Significant*
** p < .001. * p = .006.
Results of the logistic regression model built for the online only student group were
similar to the model built for online students. Older students had increased odds for a higher
online GPA (Exp(B) = 1.038, p < .001) while Black online students had lower odds of online
success (Exp(B) = .528, p = .026); however, results for gender and other ethnicities were not
significant in predicting a higher online GPA. These findings mirror results from research

151
question two as well as the other studies related to demographic characteristics as previously
discussed.
Based on the logistic regression models built using demographic characteristics to answer
research question four, there were more significant predictors of online student success identified
for the overall online student group than for the online only student group. Age, gender, and
ethnicity were significant predictors of whether online students overall would earn an online
GPA of 2.0 or higher while only age and ethnicity were significant predictors of whether or not
online only students would earn an online GPA of 2.0 or higher. Based on these significant
results, additional support is needed for certain online students: younger, male, or Black.
Research Question Five
Which academic factors of online students most significantly predict a successful online
GPA?
Four logistic regression models were built to identify which academic factors
significantly predicted an online GPA of 2.0 or higher in order to respond to research question
five; two models were built for the overall online student group along with two additional
models for the online only student group. A summary of significant predictors from the first set
of models is in Table 65, and a summary of significant predictors from the follow-up models are
in Table 66. For the overall online student group, out of the six academic student factors
examined in the first two models (cumulative GPA, enrollment status, semesters since last
course, course withdrawals, cumulative credit hours, and total outline courses) only cumulative
GPA (Exp(B) = 8.080, p < .001) and cumulative credit (Exp(B) = 1.010, p = .006) were
significant predictors of whether or not online students would earn an online GPA of 2.0 or
higher.
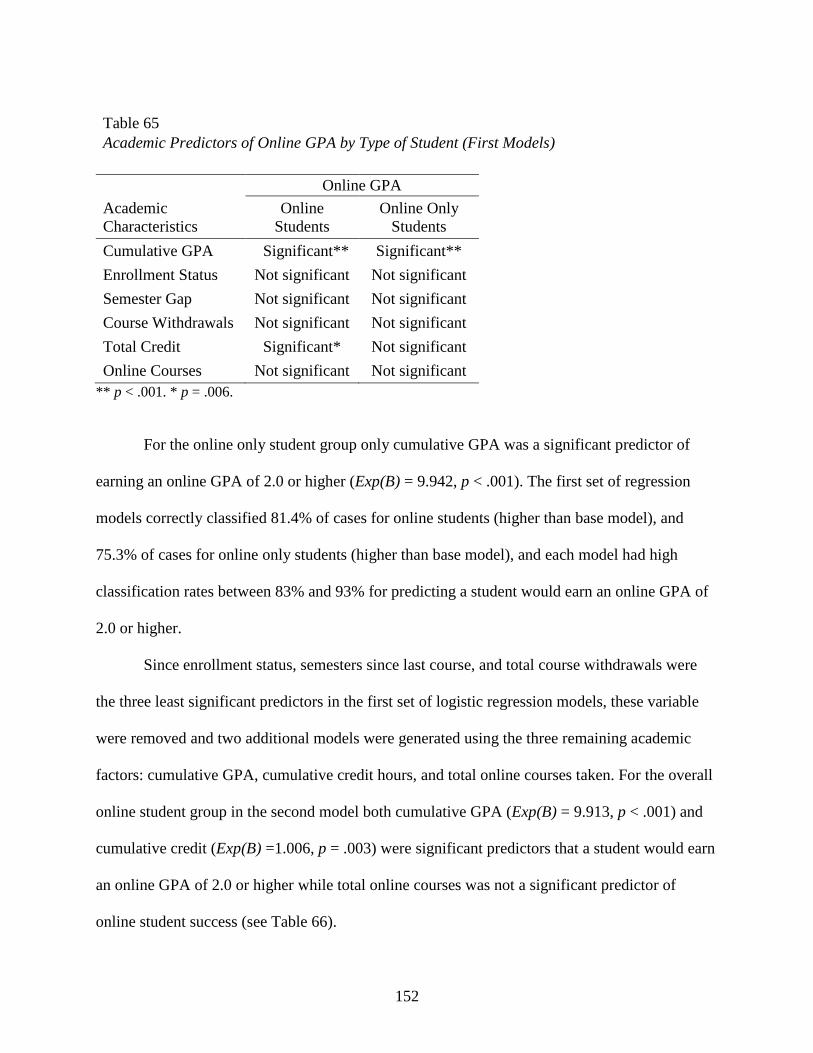
152
Table 65
Academic Predictors of Online GPA by Type of Student (First Models)
Online GPA
Academic
Characteristics
Online
Students
Online Only
Students
Cumulative GPA Significant** Significant**
Enrollment Status Not significant Not significant
Semester Gap Not significant Not significant
Course Withdrawals Not significant Not significant
Total Credit Significant* Not significant
Online Courses Not significant Not significant
** p < .001. * p = .006.
For the online only student group only cumulative GPA was a significant predictor of
earning an online GPA of 2.0 or higher (Exp(B) = 9.942, p < .001). The first set of regression
models correctly classified 81.4% of cases for online students (higher than base model), and
75.3% of cases for online only students (higher than base model), and each model had high
classification rates between 83% and 93% for predicting a student would earn an online GPA of
2.0 or higher.
Since enrollment status, semesters since last course, and total course withdrawals were
the three least significant predictors in the first set of logistic regression models, these variable
were removed and two additional models were generated using the three remaining academic
factors: cumulative GPA, cumulative credit hours, and total online courses taken. For the overall
online student group in the second model both cumulative GPA (Exp(B) = 9.913, p < .001) and
cumulative credit (Exp(B) =1.006, p = .003) were significant predictors that a student would earn
an online GPA of 2.0 or higher while total online courses was not a significant predictor of
online student success (see Table 66).
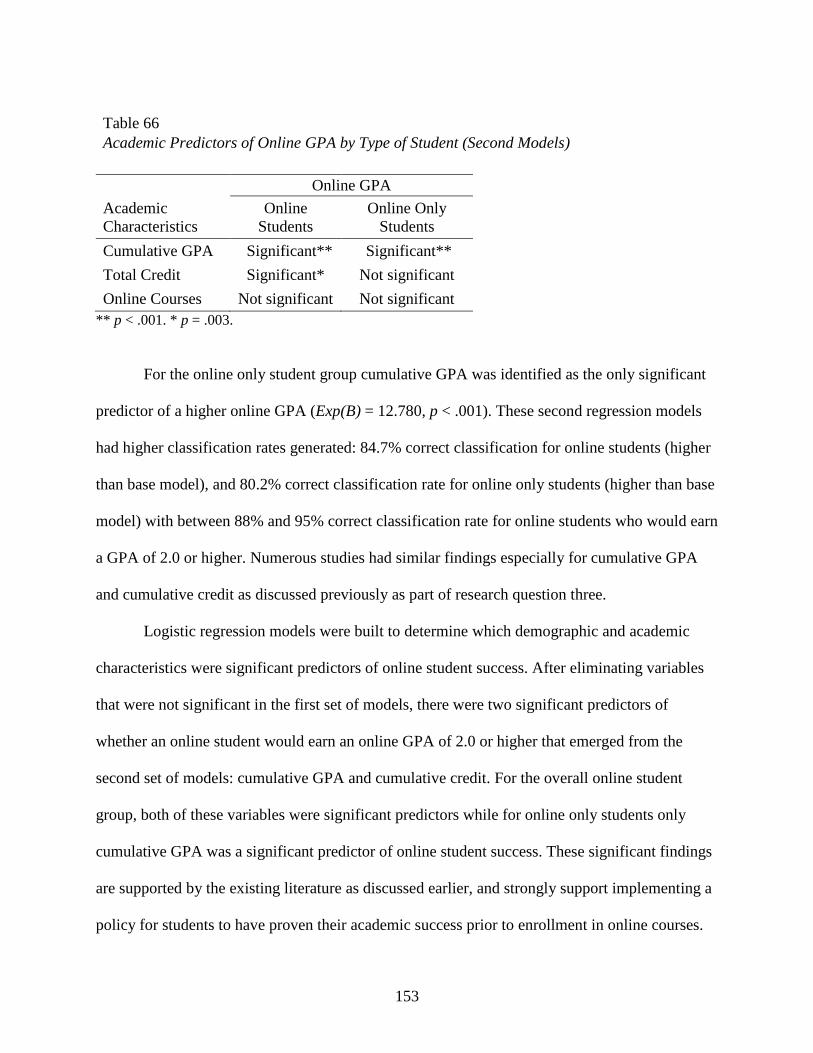
153
Table 66
Academic Predictors of Online GPA by Type of Student (Second Models)
Online GPA
Academic
Characteristics
Online
Students
Online Only
Students
Cumulative GPA Significant** Significant**
Total Credit Significant* Not significant
Online Courses Not significant Not significant
** p < .001. * p = .003.
For the online only student group cumulative GPA was identified as the only significant
predictor of a higher online GPA (Exp(B) = 12.780, p < .001). These second regression models
had higher classification rates generated: 84.7% correct classification for online students (higher
than base model), and 80.2% correct classification rate for online only students (higher than base
model) with between 88% and 95% correct classification rate for online students who would earn
a GPA of 2.0 or higher. Numerous studies had similar findings especially for cumulative GPA
and cumulative credit as discussed previously as part of research question three.
Logistic regression models were built to determine which demographic and academic
characteristics were significant predictors of online student success. After eliminating variables
that were not significant in the first set of models, there were two significant predictors of
whether an online student would earn an online GPA of 2.0 or higher that emerged from the
second set of models: cumulative GPA and cumulative credit. For the overall online student
group, both of these variables were significant predictors while for online only students only
cumulative GPA was a significant predictor of online student success. These significant findings
are supported by the existing literature as discussed earlier, and strongly support implementing a
policy for students to have proven their academic success prior to enrollment in online courses.

154
Research Question Six
What combination of demographic characteristics and academic factors of online students
most significantly predicts a successful online GPA?
In order to address research question six, two logistic regression models were built using
both academic and demographic characteristics to see if combining these factors led to a better
prediction of which students would earn an online GPA of 2.0 or higher. A summary of
significant predictors is in Table 67. These two models used all three demographic variables
from research questions two and four (age, gender, and ethnicity) as well as only the three
academic variables from the second logistic regression models in research question five
(cumulative GPA, cumulative credit hours, and total online courses).
Table 67
Demographic and Academic Predictors of Online GPA by Type of Student
Online GPA
Academic
Characteristics
Online
Students
Online Only
Students
Age Not significant Not significant
Gender Not significant Not significant
Ethnicity Not significant Not significant
Cumulative GPA Significant** Significant**
Total Credit Significant* Not significant
Online Courses Not significant Not significant
** p < .001. * p = .003.
For the overall online student group both cumulative GPA (Exp(B) = 9.874, p < .001) and
cumulative credit (Exp(B) =1.006, p = .003) were significant predictors that a student would earn
an online GPA of 2.0 or higher, but no other predictors were significant. These finding mirrors
results of research question three. The model for the overall online student group correctly

155
classified 85.2% of cases overall and was highly successful in predicting those students who
would earn an online GPA of 2.0 or higher with a 95% correct classification rate.
As seen in Table 67 for the logistic regression model built for the online only student
group, the only significant predictor of online student success was cumulative GPA (Exp(B) =
12.807, p < .001). In this model for online only students, about 81% of cases were correctly
classified overall with 89% success in predicting an online GPA of 2.0 or higher. The
classification rates for an online GPA of 2.0 and higher in these last two regression models were
the highest rates for any models generated in this study. As discussed in the significant findings
for research question three, community colleges should consider recommendations or policies
that encourage students to take online courses later in their program and discourage students with
poor academic records to enroll in online courses.
Summary
After analysis for each research question was completed, the initial conceptual model of
factors that impact online student success as shown in Figure 1 was modified based on the
significant findings from each of the six research questions. As a result, two new online student
success models were generated. The success model for the overall online student group is shown
in Figure 2, and a success model based on results for students who took only online classes is
located in Figure 3. Distance to campus was not a significant correlate or predictor of online
student success in this study so it was removed from both online student models. The other
factors from the original conceptual model that were not significant correlates or predictors of
online GPA for either online student group were eliminated from each model.

156
Figure 2. A Model of the Demographic and Academic Online Student Characteristics that
Predict Online Student Success for the Overall Online Student Group.
There are both similarities and differences between the two online student success models
to discuss. First, as shown in the figures, both models include the following variables that
significantly impacted academic outcomes and online student success in this study: age,
ethnicity, cumulative credit hours, cumulative GPA, remedial courses, and computer courses. No
matter if the online students were also taking courses in other formats or if they were taking only
online courses these were the factors that significantly impacted their online course success.
In addition to the parts of these two online student success models that are the same, there
are also some differences between them. The success model for the overall online student group
in Figure 2 includes gender, time since last course, course withdrawals, and online courses which
were significant factors for this group; these factors are not found in Figure 3. There were two
different significant factors for the online only student group so financial aid and enrollment
status are listed just in Figure 3. The findings related to the significant demographic and
academic characteristics prior to and after enrollment included in these online student success
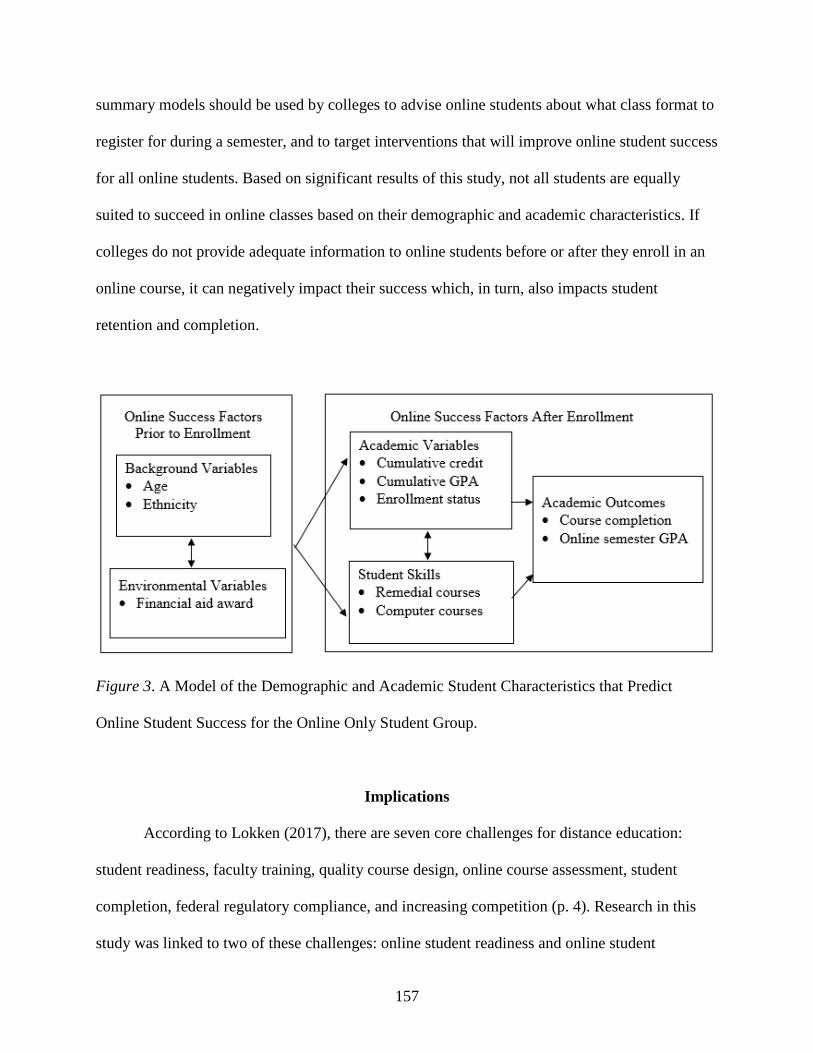
157
summary models should be used by colleges to advise online students about what class format to
register for during a semester, and to target interventions that will improve online student success
for all online students. Based on significant results of this study, not all students are equally
suited to succeed in online classes based on their demographic and academic characteristics. If
colleges do not provide adequate information to online students before or after they enroll in an
online course, it can negatively impact their success which, in turn, also impacts student
retention and completion.
Figure 3. A Model of the Demographic and Academic Student Characteristics that Predict
Online Student Success for the Online Only Student Group.
Implications
According to Lokken (2017), there are seven core challenges for distance education:
student readiness, faculty training, quality course design, online course assessment, student
completion, federal regulatory compliance, and increasing competition (p. 4). Research in this
study was linked to two of these challenges: online student readiness and online student
158
completion. The purpose of this study was to identify which demographic and academic factors
were significantly correlated to or predicted online success for community college students.
Results of this study acknowledged particular demographic and academic student characteristics
that played a significant role in online student success. When reviewing the findings generated
by the six research questions in the study, each one had significant findings; some of these
findings were also supported by the literature as previously described.
The trend to promote access to higher education has led to a growth in online courses;
however, studies have shown success rates for online courses are consistently lower than on-
campus course success rates, and they need to be improved so understanding what factors lead to
online student success is especially important (Hachey et al., 2012; Lehman & Conceicao, 2014;
Moore & Kearsley, 2012; Xu & Jaggars, 2011a, 2011b). Although the growth rate for distance
education has slowed down, some higher education institutions are still planning expansion for
online offerings. One current example is in California where the governor recently requested the
community college system to develop a completely online college to further improve availability
and affordability with more online courses and programs (Ashford, 2017). This proposed plan
will likely serve more students and reach new audiences so the issue of online student success
must be considered during the development phase. As colleges seek to increase online course
and program offerings, the factors that have been identified as significant correlates and
predictors of online student success through this study and other previous research should be
examined so policies related to online enrollment along with systems of support for online
students can be created and implemented at the time online courses and programs are launched.
As a growing number of college students take at least one online course, it is imperative
for colleges to understand what factors lead to online student success, and to confirm online

159
students have clear expectations about what it takes to be successful in online courses. Colleges
need to identify a variety of research-based strategies that lead students to succeed in online
courses, and find ways to disseminate this information to online students so they know how
online course requirements may be different from classes meeting on campus. As this study
indicated, it is especially important to provide information and support for online students who
are more likely to perform poorly in online courses such as those who have earned little or no
previous college credit, are minorities, need remedial coursework, have never taken an online
course, or have a low GPA. The results from this study can inform academic advisors who could
suggest online students take fewer courses, avoid remedial courses, and complete a computer
course prior to enrollment. Advisors could also recommend for students with a low cumulative
GPA to avoid enrolling in online courses. Some of the challenges of online student success might
also be counteracted by requiring students to complete an online learning orientation and
readiness assessment prior to enrollment in their first online since some research identified these
tactics had a positive effect on online student success (Cho, 2012; Fisher, 2010; Hall, 2011;
Harrell, 2008; Jennings, 2013; Koehnke, 2013; Vaill, 2013).
Some of the differences noted in this study between students taking online courses along
with courses in other formats and those students who are only taking online courses make perfect
sense. Most (over 90%) of the online only students in this study were attending school part-time
so they took fewer credit hours each semester and accumulated less credit each year as compared
to online students taking a mix of course formats who were enrolled full-time. Online only
students who attended part-time were also eligible for less financial aid as shown in the study.
On the other hand, this study showed older students performed better in online courses, and
online only students in this study were older than other online students taking a mix of course

160
formats, so it would have made sense for the online only students to have had a higher online
GPA out of the two online students groups, but this was only the case for fall 2015 and not
spring 2016. By the same token, when looking at the percentage of online and online only
students who earned an online GPA of 2.0 or higher, it was anticipated online only students
would have a higher percentage with an online GPA of 2.0 or higher, but instead the percentage
was higher for online students overall instead of online only students for both semesters. Since
this study had some inconsistent results about what specifically led online students in one group
to succeed over another, more research should be conducted to further explore differences in
online success between students taking online courses along with courses in other formats, and
those taking courses only online. Additionally, more should be done to connect online students
with online learning requirements before and during the semester in order to significantly impact
online student success (Fisher, 2010; Hibbard, 2013; Lewis, 2010). It is very important for
colleges to be able to serve online students completely at a distance to help them succeed; these
students must have access to the same resources and services as available to on-campus students
in order to ensure online student success.
Although this study confirmed that demographic characteristics of online students were
less predictive of online student success than academic characteristics, these factors cannot be
ignored. The average age of online students at the community college in this study decreased
over the past ten years from an average of 26 years old to 25 years old. This trend is supported
by the Lokken (2017) as part of the 2016 National eLearning Report that stated 53% of online
community college students are between 18 and 25 years old. On the contrary, distance
education was initially designed to serve older students who had a family and a job. Community
college students, regardless of age, often have an adult lifestyle and are often working and

161
attending college part time and the flexibility of online courses are appealing (American
Association of Community Colleges, 2017). Some research identified a significant difference
between community college students who completed an online course and those who did not
based on age; younger students were more at-risk for being less successful and they needed more
support to succeed (Wladis et al., 2015; Xu & Jaggars, 2011b). Other studies found no
significant differences between age and successful online course completion (Aragon & Johnson,
2008; Jost et al., 2012). Colleges need to track online enrollment trends regularly so as the
demographic characteristics of online students shift they can ensure the online courses and
programs offered are designed to meet and support the needs of all online learners who may
enroll.
Not all significant research findings hold true in every situation or at all institutions. For
example, as previously discussed, some research has shown higher online course success for
older, female students who took fewer credit hours, and had previous college and online
experience. Based on a qualitative study completed by Davidson (2016), success in the online
course environment was possible at a community college for both traditional and nontraditional
male and female online students even while they were working full- or part-time and taking 12 to
15 credit hours in a semester; these students were successful in their online classes regardless of
their age, gender, enrollment status, previous college experience, or online course experience.
Although this study identified a significantly higher percentage of females over males who were
successful in online classes, the study also concluded that demographic characteristics were less
predictive of online student success. Since academic characteristics in this study more
conclusively predicted online success, colleges should use these data to create policies or
procedures to better support online learners and promote online success.

162
The three main significant variables from this study to consider when implementing new
policies or procedures related to enrollment in online courses include cumulative GPA,
cumulative credit hours, and remedial courses. Based on extensive research about online student
success conducted at community colleges and other types of higher education institutions,
cumulative GPA has been a universal significant predictor of online student success. The
research as previously described has shown students who have a higher cumulative GPA also
have higher success in online courses. This study identified the majority of online and online
only students who were successful had a cumulative GPA of 3.0 or higher. With this
information, in increase online student success colleges should consider a recommended or
required minimum GPA in order for students to register in online courses and remain in online
programs. Another significant predictor of online student success was cumulative credit earned.
As described earlier, students with a higher number of earned credit hours demonstrated higher
online course success. Colleges should consider encouraging or requiring new college students to
wait until their second semester or later to take online courses if they have no previous online
experience to increase online student success. Finally, students who were taking remedial
courses in this study had a significantly lower online GPA than those taking no remedial courses.
Based on this finding, colleges should consider a policy of no concurrent online courses when
students are registered in remedial courses to improve the odds of online student success.
In order to best serve online students it is important for students, instructors, and
administrators to use existing research to identify more specifically what factors lead some
students to succeed while others struggle in online courses. For community college students
enrolled in online courses, some studies indicated it was critical to identify what was causing
online students to struggle as early as possible so measures could be implemented to help online
163
students persist and succeed (Liu, Gomez, & Yen, 2009; Smith et al., 2012). This information
will allow colleges to provide additional support and resources to help online students
understand online course expectations prior to enrollment so they successfully complete online
course materials. Using existing research findings, colleges can support online students before
they enroll in an online course as well as throughout their online learning experiences, and
implement policies and intervention strategies to have a positive impact on online student
success.
Limitations
Although procedures were followed to make this study reliable, there were several
limitations that should be discussed. First, these data were secondary and self-reported. Second,
this college offers online courses, but it does not offer any degree or certificate completely
online. Also, the format of online courses at this college permits instructors to require certain
campus meetings. Finally, no analysis was completed specifically on the types of online courses
taken, the extent of faculty training and experience, or the quality of these online courses in
relationship to online student success. These limitations could be overcome through additional
research.
The first limitation relates to the secondary data used for the study. These data were
extracted by the college’s IR department. Demographic data came from self-reported information
gathered as part of the admission application and stored in the student record system. Although
the application for admission had recently been converted to an electronic process, some
applications were still submitted in paper form which required a manual data entry process from
information received on the application. It is possible there were data entry errors or missing or
inaccurate data based on answers the applicant did or did not provide as part of the application.

164
Another limitation was that the community college in this study did not offer completely
online programs. This means online courses were just another course format option for students,
and based on course availability students may have taken online courses even if it was not their
preferred method of instruction. In addition, this college allows any student to enroll in online
classes without understanding the nuances of taking courses in an online format. Furthermore,
this community college also permits instructors to require students taking online courses to come
to campus for an orientation session, or to take exams in the testing center during the semester.
All of these factors can negatively impact students who enroll in an online class at this
community college because students may not know what to expect when taking online courses,
and believe they will be able to complete the online course entirely at a distance.
Lastly, and most importantly, this study did not examine the type of online courses taken,
the quality of the online courses, or the experience and training of faculty members teaching in
the online environment which are all critical factors for online student success. Online courses
from different disciplines do not have the same level of difficulty, and they require different
skills which also impacts online student success. The training and support for faculty teaching
online classes varies from college to college. Some colleges have more robust faculty training
opportunities, while other colleges have very little training available. This community college
requires all faculty to take one specific training course to help them develop and teach their first
online course; however, after that required online course development training no additional
training courses are required for faculty to further enhance their online teaching skills prior to
teaching additional online courses. The level of experience an online faculty member has
teaching online will significantly impact the online student experience and ultimately the success
of the online students. There is often no mandated consistency in structure between online course

165
sections so with hundreds of online course sections available and a wide variety of faculty, both
full- and part-time, teaching these courses, online students do not all have the same quality of
online experiences.
Despite the limitations of this study, valuable results were obtained for data that were
currently available and had not been thoroughly investigated at this community college. Many of
the significant findings from this study supported outcomes identified in previous research.
Moreover, some of the variables used in the study had not been well researched yet which added
value to the existing literature about online student success and gave more significance to the
findings. The limitations of this study led to a variety of recommendations for the focus of future
research projects related to online student success.
Recommendations for Future Research
This study examined two semesters of existing data for online students at one public
Midwestern community college. Based on the limitations previously described, it is necessary to
pursue additional research to build upon and validate these findings. First, this study should be
repeated at different types of institutions including community colleges with completely online
programs. Next, longitudinal studies should be conducted since much of the research involves
only a semester or two of data. Additionally, qualitative research should be conducted to
supplement these quantitative results. Furthermore, more research into the success of different
online student populations should be completed. Finally, the types of online courses in which
students succeed should be examined to help determine more about the quality of these courses.
Gathering additional research related to online student success is necessary to help counteract
low online student success rates identified in this study as well as in other studies.

166
It is important to repeat this study at other community colleges of different sizes and
different locations along with four-year colleges and universities, both public and private, to
confirm results can be generalized across populations. There are thousands of students who take
at least one credit bearing online course each semester at this Midwestern community college.
Most of the research examined in conjunction with this project were data analyzed over a short
period of time.
Another recommendation would be to complete a longitudinal study by formally tracking
online students and their success in online courses across semesters and from year to year to
identify other patterns of online success. This tracking should start from the semester in which
students take their first online course. Looking at student course taking patterns, online course
success across semesters, and progress toward degree completion is a critical piece in online
student success. It would be interesting to compare results of this study with research from
community college students who were able to take their entire program online since students at
this college do not have that option. With so many mixed findings and variations in students and
institutions, research is still needed to pinpoint the factors the lead to online community college
student success and ultimately to program completion.
Furthermore, this study involved a limited dataset and only quantitative data analysis so it
would be important to gather qualitative data to help further explore and confirm the factors that
impact online students and their success in online courses. Quantitative data analysis in this
study provided solid background information and trends for the current state of online student
success at this community college; however, a related follow-up qualitative study would allow
additional insights to be collected directly from online students and online faculty about what
leads to online community college success. These new insights would help validate the

167
quantitative findings, and develop a deeper understanding of these data from the perspective of
user experiences. Goertzen (2017) noted the following significant limitation to quantitative
research: “findings generated from quantitative research uncover behaviors and trends…it is
important to note that they do not provide insight into why people think, feel, or act in certain
ways” (p. 12). To help fill this observed data gap, interviews or focus groups with online
students could help verify and elaborate on the findings from this quantitative study. In addition,
speaking directly with online faculty members would be valuable because they can describe the
design of the class, the types of assignments used, and the level of interaction and participation
required for student success in their online classes.
This study examined two different online student populations while fewer other studies
separated out online only students from online students who also took courses in other formats.
More research is needed to compare these different online groups because there were some
differences between online student groups identified in this study as well as previous research.
Future research should also include studies that address essential areas related to online course
quality and faculty training and experience because these factors also influence online student
success.
It would also be beneficial to assess the types of online courses, and online course quality
as they relate to online course success. This would involve gaining access to review related
online course syllabi and online course sites for a variety of classes. This course audit would also
include reviewing student engagement and interaction within the online learning environment.
This examination would help verify the level of accuracy of the analysis completed in this
current study, and draw additional conclusions about online student success based on the quality
and content of online courses. Gathering specific information about the quality and type of

168
online courses students completed successfully would help better interpret and draw conclusions
about students’ online success overall.
Colleges continuously collect data for enrolled students related to their success, but these
data are not always analyzed in depth for all student populations. Data related to online students
that are readily available should be examined on a regular basis. First, quantitative analysis of
existing data can been conducted to identify patterns and trends. Then, additional qualitative
research can be completed to further support these findings. Finally, in depth review of online
course content and quality along with faculty training and experience teaching in the online
environment are also critical factors for online student success. It is important for colleges to
examine existing online student data along with findings from related research as well as to
generate new research that will identify ways to help promote and improve online student
success on their campuses.
Conclusions
Overall, this study provided useful information about various demographic and academic
factors that impact online community college student success. Online classes serve an important
role at community colleges, but this role is often different than at other colleges and universities
that offer programs completely online. Including online courses as options for community
college students is imperative because it often allows some students to take additional classes or
to remain enrolled within a program even as their situation or responsibilities change. Not all
students come to college intending to take courses in an online format, but some find themselves
enrolled in online courses based on course availability or changing circumstances related to
family or work responsibilities (Davidson, 2016). Online courses require different skills for both
the student and the instructor so adequate support is required to make them both successful. As

169
colleges continue to increase online course offerings special attention should be given to online
student success rates.
The research conducted as part of this study added significance and support to the
existing literature focusing on the performance of online students. Based on the study results, the
initial conceptual model of online student success was modified to display significant predictors
of online success for online students as well as online only students. Overall, this study revealed
demographic characteristics were less predictive of online student success than academic
characteristics. Although specific findings from this study cannot be generalized to all types and
sizes of institutions, when this information is used in conjunction with previous research findings
there are several academic online student characteristics that clearly have a significant impact
online student success including cumulative GPA and cumulative credit hours. Online courses
provide a great service to various populations of higher education students, but if online students
are not successful this service is irrelevant. Colleges need to examine these identified predictors
of online student success, and use this information to identify ways to help more online students
succeed.

170
REFERENCES
Akpom, R. (2013). Investigating the impact of orientation and detected characteristics
of first-time online students on their success rate in a community college setting
(Doctoral dissertation). Available from ProQuest Dissertations & Theses Global. (Order
No. 3615338)
Allen, I. E., & Seaman, J. (2017). Digital learning compass: Distance education enrollment
report 2017. Retrieved from
https://onlinelearningsurvey.com/reports/digtiallearningcompassenrollment2017.pdf
Allen, I. E., Seaman, J., Poulin, R., & Straut, T. T. (2016). Online report card: Tracking online
education in the United States. Retrieved from onlinelearningconsortium.org/2015Survey
American Association of Community Colleges. (2017). 2017 Fact sheet. Retrieved from
http://www.aacc.nche.edu/AboutCC/Documents/AACCFactSheet2017.pdf
Andrade, M. S. (2012). Self-regulated learning activities: Supporting success in online courses.
In J. S. Moore & A. D. Benson (Eds.), International Perspectives of Distance Learning in
Higher Education (pp. 111-132). Rijeka, Croatia: InTech. Retrieved from
http://cdn.intechopen.com/pdfs-wm/32519.pdf
Andrade, M. S., & Butler, E. L. (2009). A model for self-regulated distance language learning.
Distance Education, 30(1), 47-61. doi: 10.1080/01587910902845956
Aragon, S. R., & Johnson, E. S. (2008). Factors influencing completion and noncompletion of
community college online courses. American Journal of Distance Education, 22(3),
146-158. doi: 10.1080/08923640802239962
171
Archer, W., & Garrison, D. R. (2010). Distance education in the age of the internet. In C. E.
Kasworm, A. D. Rose, & J. M. Ross-Gordon (Eds.), Handbook of Adult and Continuing
Education (pp. 317-326). Thousand Oaks, CA: Sage Publications.
Ashford, E. (2017, June 21). California governor calls for new online college. American
Association of Community Colleges. Retrieved from
http://www.ccdaily.com/2017/06/california-governor-calls-new-online-college/
Bailey, T. R., Jaggars, S. S., & Jenkins, D. (2015). Redesigning America’s community colleges.
Cambridge, MA: Harvard University Press.
Bean, J. P., & Metzner, B. S. (1985). A conceptual model of nontraditional undergraduate
student attrition. Review of Educational Research, 55(4), 485-540.
doi: 10.3102/00346543055004485
Bettinger, E. & Loeb, S. (2017). Promises and pitfalls of online education. Retrieved from
https://www.brookings.edu/wp-
content/uploads/2017/06/ccf_20170609_loeb_evidence_speaks1.pdf
Bruner, J. S. (1985). Models of the learner. Educational Researcher, 14(6), 5-8.
doi: 10.3102/0013189X014006005
Bull, K. Z. (2015). Student characteristics that predict persistence and performance in
online courses and the face-to-face equivalents at a four-year private
Northeastern University (Doctoral dissertation). Retrieved from ProQuest Dissertations
& Theses Global. (Order No 10001067)
Carey, K. (2015). The end of college: Creating the future of learning and the university of
everywhere. New York, NY: Penguin Group.
172
Cho, M. (2012). Online student orientation in higher education: A developmental study.
Educational Technology Research and Development, 60(6), 1051-1069.
Clinefelter, D. L., & Aslanian, C. B. (2016). Online college students 2016: Comprehensive data
on demands and preferences. Louisville, KY: The Learning House, Inc. Retrieved from
http://www.learninghouse.com/wp-content/uploads/2016/07/OCS-2016-Report.pdf
Cochran, J. D., Campbell, S. M., Baker, H. M., & Leeds, E. M. (2014). The role of student
characteristics in predicting retention in online courses. Research in Higher Education,
55(1), 27-48. doi: 10.1007/s11162-013-9305-8
Cohen, J. (1988). Statistical power analysis for the behavioral sciences (2nd ed.). Hillsdale, NJ:
Lawrence Erlbaum Associates.
Creswell, J. W. (2003). Research design: Qualitative, quantitative, and mixed methods
approaches (2nd ed.). Thousand Oaks, CA: Sage Publications.
Cross, K. P. (1981). Adults as learners: Increasing participation and facilitating learning.
San Francisco, CA: Jossey-Bass.
Cummings, L. A. (2009). Predicting student success in online courses at a rural Alabama
community college (Doctoral dissertation). Retrieved from ProQuest Dissertations &
Theses Global. (Order No. 3366231)
Davidson, J. (2016). An exploration of factors identified by community college students that lead
to success in online courses. Unpublished manuscript, Department of Education,
Foundations, and Administration, Illinois State University, Normal, Illinois.
Dewey, J. (2013). Democracy and education. Rochester, NY: Starry Night Publishing. (Original
work published 1916)

173
Doherty, W. (2006). An analysis of multiple factors affecting retention in web-based
community college courses. Internet and Higher Education, 9(4), 245-255. Retrieved
from https://www.gwern.net/docs/conscientiousness/2006-doherty.pdf
Dupin-Bryant, P. A. (2004). Pre-entry variables related to retention in online distance
education. American Journal of Distance Education, 18(4), 199-206.
doi: 10.1207/s15389286ajde1804_2
Evergreen Education Group. (2015). Keeping pace with k-12 digital learning. Retrieved from
http://www.kpk12.com/wp-content/uploads/Evergreen_KeepingPace_2015.pdf
Fetzner, M. (2013). What do unsuccessful online students want us to know? Journal of
Asynchronous Learning Networks, 17(1), 13-27. Retrieved from
http://files.eric.ed.gov/fulltext/EJ1011376.pdf
Fisher, K. (2010). Student engagement in community college online education programs: An
exploration of six constructs with implications for practice (Doctoral dissertation).
Retrieved from https://repositories.lib.utexas.edu/bitstream/handle/2152/ETD-UT-2010-
05-952/FISHER-DISSERTATION.pdf
Foster, R. (2012). Predicting success for college students enrolled in an online, lab-based,
biology course for non-majors (Doctoral dissertation). Available from ProQuest
Dissertations & Theses Global. (Order No. 3554908)
Garrison, G. R. (1985). Three generations of technological innovations in distance education.
Distance Education, 6(2), 235-241. Retrieved from
http://www.c3l.uni-oldenburg.de/cde/media/readings/garrison85.pdf

174
Garrison, G. R., Anderson, T., & Archer, W. (2000). Critical inquiry in a text-based
environment: Computer conferencing in higher education. The Internet and Higher
Education, 2(2-3), 87-105. Retrieved from
http://cde.athabascau.ca/coi_site/documents/Garrison_Anderson_Archer_Critical_Inquiry
_model.pdf
Garrison, D. R., Anderson, T., & Archer, W. (2010). The first decade of the community of
inquiry framework: A retrospective. The Internet and Higher Education, 13(1), 5-9.
doi:10.1016/j.iheduc.2009.10.003
Gibson, J. M. (2015). The relationship of demographic and academic characteristics on student
academic success rates when using web-based delivery modalities (Doctoral
dissertation). Available from ProQuest Dissertations & Theses Global. (Order No.
10001063)
Ginder, S., & Stearns, C. (2014). Enrollment in distance education courses by state: Fall
2012. Research Triangle Park, NC: RTI International. Retrieved from
http://nces.ed.gov/pubs2014/2014023.pdf
Goertzen, M. J. (2017). Introduction to Quantitative Research and Data. Library Technology
Reports, 53(4), 12-18. Retrieved from
http://libproxy.lib.ilstu.edu/login?url=https://search-ebscohost-
com.libproxy.lib.ilstu.edu/login.aspx?direct=true&db=lih&AN=123202476&site=eds-
live&scope=site
Green, S. B., & Salkind, N. J. (2014). Using SPSS for Windows and Macintosh (7th ed.).
Upper Saddle River, NJ: Pearson Education.

175
Gregory, C. B. (2016). Community college student success in online versus equivalent face-to-
face courses (Doctoral dissertation). Available from ProQuest Dissertations & Theses
Global. (Order No. 10142813)
Hachey, A. C., Conway, K. M., & Wladis, C. W. (2013). Community colleges and
underappreciated assets: Using institutional data to promote success in online learning.
Online Journal of Distance Education Administration, 15(1). Retrieved from
http://www.westga.edu/~distance/ojdla/spring161/hachey_wladis.html
Hachey, A. C., Wladis, C. W., & Conway, K. M. (2012). Is the second time the charm?
Investigating trends in online re-enrollment, retention and success. Journal of
Educators Online, 9(1), 1-25. Retrieved from
http://files.eric.ed.gov/fulltext/EJ972049.pdf
Hall, D. P. (2011). Investigating the relationship between an orientation and social integration,
academic integration, and student retention for online community college students
(Doctoral dissertation). Retrieved from ProQuest Dissertations & Theses Global. (Order
No. 3442296)
Harrell, I. L. (2008). Increasing the success of online students. Inquiry, 13(1), 36-44. Retrieved
from http://files.eric.ed.gov/fulltext/EJ833911.pdf
Harrell, I. L., & Bower, B. L. (2011). Student characteristics that predict persistence in
community college online courses. American Journal of Distance Education, 25(3),
178-191. doi: 10.1080/08923647.2011.590107
Hart, C. (2012). Factors associated with student persistence in an online program of study: A
review of the literature. Journal of Interactive Online Learning, 11(1), 19-42. Retrieved
from http://www.ncolr.org/jiol/issues/pdf/11.1.2.pdf

176
Hawkins, C. D. (2012). Academic predictors of online course success in the community college.
(Doctoral dissertation). Retrieved from ProQuest Dissertations & Theses Global. (Order No.
3529172)
Hibbard, J. A. (2013). Rethinking online education: The impact of synchronous
telecommunication interactions on student success (Doctoral dissertation). Retrieved
from ProQuest Dissertations & Theses Global. (Order No. 3606183)
Holmberg, B. (1988). Perspectives of research on distance education. Retrieved from
http://files.eric.ed.gov/fulltext/ED298355.pdf
Holmberg, B. (1995). The evolution and the character of the practice of distance education.
Open Learning, 10(2), 47-53. Retrieved from
https://homer.lib.ilstu.edu/illiad/illiad.dll?Action=10&Form=75&Value=325326
Hurst, F. (2001). The death of distance learning? Educause Quarterly, 3, 58-60. Retrieved from
https://www.academia.edu/481647/The_Death_of_Distance_Learning
Hussar, W. J., & Bailey, T. M. (2016) Projections of education statistics to 2023.
Washington, DC: U.S. Department of Education. Retrieved from
http://nces.ed.gov/pubs2015/2015073.pdf
Illinois Community College Board. (2015). 60% by 2025 Graduation Goal. Retrieved from
https://www.iccb.org/iccb/wp-content/pdfs/60x2025/60_percent_by_2025_FY15.pdf
Illinois Community College Board. (2016). Illinois community college system facts. Retrieved
from www.iccb.org/iccb/wp-content/pdfs/IL_Community_Colleges_System_Facts.pdf
Illinois Community College Board. (2017). Fall student characteristics - 2017. Retrieved
from https://www.iccb.org/data/?page_id=1252

177
Illinois Virtual School. (2016). IVS now! Annual report. Retrieved from
https://ivsexternalpages.s3.amazonaws.com/pdfs/IVSNow-May2016.pdf
James, S., Swan, K., & Daston, C. (2016). Retention, progression and the taking of online
courses. Online Learning, 20(2), 75-96. Retrieved from
https://olj.onlinelearningconsortium.org/index.php/olj/article/view/780/204
Jennings, A. B. (2013). Searching for student success: Implementing immediacy in online
courses (Doctoral dissertation). Retrieved from ProQuest Dissertations & Theses Global.
(Order No. 3571831)
Johnson, H., Mejia, M. C., & Cook, K. (2015). Successful online courses in California’s
community colleges. San Francisco, CA: Public Policy Institute of California. Retrieved
from http://ppic.org/content/pubs/report/R_615HJR.pdf
Jost, B., Rude-Parkins, C., & Githens, R. P. (2012). Academic performance, age, gender, and
ethnicity in online courses delivered by two-year colleges. Community College Journal of
Research and Practice, 36(9), 656-669. doi: 10.1080/10668921003744876
Juszkiewicz, J. (2016). Trends in community college enrollment and completion data.
Washington, DC: American Association of Community Colleges. Retrieved from
www.aacc.nche.edu/Publications/Reports/Documents/Trends_CC_Enrollment_Final2016
Keegan, D. J. (1980). On defining distance education. Distance Education, 1(1), 13-36.
Retrieved from https://eric.ed.gov/?id=EJ276719
Kember, D. (1989). A longitudinal-process model of drop-out from distance education. Journal
of Higher Education, 60(3), 278-301. Retrieved from
http://www.jstor.org/stable/1982251
178
Kember, D. (1990). The use of a model to derive interventions which might reduce drop-out
from distance education courses. Higher Education, 20(1), 11-24. Retrieved from
http://www.jstor.org/stable/3447427
Knowles, M. S. (1974). Human resources development in OD. Public Administration Review,
34(2), 115-123. doi: 10.2307/974934
Koehnke, P. J. (2013). The impact of an online orientation to improve community college student
retention in online courses: An action research study (Doctoral dissertation). Retrieved
from ProQuest Dissertations & Theses Global. (Order No. 3568654)
Kupczynski, L., Brown, M., Holland, G., & Uriegas, B. (2014). The relationship between gender
and academic success online. Journal of Educators Online, 11(1). Retrieved from
http://files.eric.ed.gov/fulltext/EJ1020184.pdf
Lehman, R. M., & Conceicao, S. C. (2014). Motivating and retaining online students:
Research-based strategies that work. San Francisco, CA: Jossey-Bass.
Lewis, G. S. (2010). I would have had more success if…: Student reflections on their
performance in online and blended classes. American Journal of Business Education,
3(11), 13-21. Retrieved from http://files.eric.ed.gov/fulltext/EJ1058200.pdf
Lindeman, E. C. (1989). The meaning of adult education. Norman, OK: Oklahoma Research
Center for Continuing Professional and Higher Education. (Original work published
1961)
Liu, S. Y., Gomez, J., & Yen, C. (2009). Community college online course retention and final
grade: Predictability of social presence. Journal of Interactive Online Learning, 8(2),
165-182. Retrieved from
http://online2.sdccd.edu/bblearntrain/2013_2014/Liu_Gomez_Yen_2009.pdf

179
Lokken, F. (2016). Trends in eLearning: Tracking the impact of eLearning at community
colleges. Washington, DC: Instructional Technology Council. Retrieved from
http://www.itcnetwork.org/attachments/article/1137/ITC Survey Final small.pdf
Lokken, F. (2017). Trends in eLearning: Tracking the impact of eLearning at community
colleges. Washington, DC: Instructional Technology Council. Retrieved from
https://associationdatabase.com/aws/ITCN/asset_manager/get_file/154447?ver=203
Lumina Foundation. (2016). A stronger nation: Postsecondary learning builds the talent that
helps us rise. Retrieved from
https://www.luminafoundation.org/files/publications/stronger_nation/2016/A_Stronger_
Nation-2016-Full.pdf
Matthews, D. (1999). The origins of distance education and its use in the United States. THE
Journal, 27(2), 54-67. Retrieved from https://thejournal.com/Articles/1999/09/01/The-
Origins-of-Distance-Education-and-its-use-in-the-United-States.aspx
McIntire, M. E. (2015, July 20). When one state required online learning in high school colleges
saw changes too. The Chronicle of Higher Education. Retrieved from
http://chronicle.com/article/When-One-State-Required-Online/231737
McPhaul-Moore, E. (2013, January 1). Predictors of online learning success in a rural
community college (Doctoral dissertation). Retrieved from ProQuest Dissertations &
Theses Global. (Order No. 3574025)
Merriam, S. B. (2009). Qualitative research: A guide to design and implementation.
San Francisco, CA: Jossey-Bass.

180
Metzner, B. S., & Bean, J. P. (1987). The estimation of a conceptual model of nontraditional
undergraduate student attrition. Research in Higher Education, 27(1), 15-36. Retrieved
from http://www.jstor.org/stable/40195801
MIT Office of Digital Learning. (2017, June 12). MIT News. MIT pilots full-credit online
residential course. Retrieved from http://news.mit.edu/2017/mit-pilots-full-credit-online-
residential-course-0612
Moore, M. G. (2003). From Chautauqua to the virtual university: A century of distance
education in the United States. Retrieved from
http://files.eric.ed.gov/fulltext/ED482357.pdf
Moore, M. G. (2016). Practicalities in giving structure to dialogue. The American Journal of
Distance Education, 30(3), 131-132. doi: 10.1080/08923647.2016.1211450
Moore, K., & Bartkovich, J., Fetzner, M., & Ison, S. (2002). Success in cyberspace: Student
retention in online courses. Retrieved from http://files.eric.ed.gov/fulltext/ED472473.pdf
Moore, M. G., & Kearsley, G. (2012). Distance education: A systems view of online learning.
Belmont, CA: Wadsworth Cengage Learning.
Muse, H. J. (2003). The web-based community college student: An examination of factors
that lead to success and risk. Internet and Higher Education, 6(3), 241-61.
doi: 10.1016/S1096-7516(03)00044-7
National Center for Education Statistics. (2016). Digest of Education Statistics Table 311.15.
Retrieved from
https://nces.ed.gov/programs/digest/d16/tables/dt16_311.15.asp?current=yes

181
Neumann, Y., & Neumann, E. (2016, May 3). Lessons about online learning. Insider Higher Ed.
Retrieved from https://www.insidehighered.com/views/2016/05/03/what-weve-learned-
after-several-decades-online-learning-essay?width=775&height=500&iframe=true
Palacios, A. G., & Wood, J. L. (2016). Is online learning the silver bullet for men of color? An
institutional-level analysis of the California community college system. Community
College Journal of Research and Practice, 40(8), 643-655.
doi:10.1080/10668926.2015.1087893
Parke, S. J., Wilson, N. R., Barnard, J. E., Dufour, M. L., Tempel, C., Lally, D., Jorns, T., &
Newell, J. (2010). Online instruction in the Illinois community college system.
Springfield, IL: Illinois Community College Board. Retrieved from
http://iccb.org/pdf/reports/onlineinstruction3-2010.pdf
Pearson Foundation. (2011). Community college student survey. Retrieved from
http://knowledgecenter.completionbydesign.org/sites/default/files/293 Pearson
Foundation 2011.pdf
Perraton, H. (1981). A theory for distance education. Prospects, 11(1), 13-24.
doi: 10.1007/BF02254290
Picciano, A. G., Seaman, J., & Day, S. (2011). Online learning in Illinois high schools: Has the
time come? Retrieved from http://eric.ed.gov/?id=ED535142
Porta-Merida, S. (2009). Online learning success: Underlying constructs affecting student
attrition (Doctoral dissertation). Available from ProQuest Dissertations & Theses Global.
(Order No. 3354030)

182
Poulin, R., & Straut, T. T. (2016). WCET distance education enrollment report 2016. Retrieved
From http://wcet.wiche.edu/initiatives/research/WCET-Distance-Education-Enrollment-
Report-2016
Riordan, J. M. (2013). Students in online community college courses: An investigation into
factors that influence their success (Doctoral dissertation). Available from ProQuest
Dissertations & Theses Global. (Order No. 3644851)
Rodriguez, V. P. (2011). Relationships between student characteristics and student persistence
in online classes at a community college (Doctoral dissertation). Available from ProQuest
Dissertations & Theses Global. (Order No. 3485377)
Rovai, A. P. (2003). In search of higher persistence rates in distance education online programs.
Internet and Higher Education, 6(1), 1-16. doi: 10.1016/S1096-7516(02)00158-6
Saba, F. (2011). Distance education in the United States: Past, present, future. Retrieved from
http://distance-educator.com/wp-content/uploads/ET-article-Saba-11-12-2011.pdf
Shaw, M., Burrus, S., & Ferguson, K. (2016). Factors that influence student attrition in online
courses. Online Journal of Distance Learning Administration, 19(3). Retrieved from
http://www.westga.edu/~distance/ojdla/fall193/shaw_burrus_ferguson193.html
Sheehy, K. (2012). States, districts require online ed for high school graduation. Retrieved from
https://www.usnews.com/education/blogs/high-school-notes/2012/10/24/states-districts-
require-online-ed-for-high-school-graduation
Skinner, B. F. (1958). Teaching machines. Science, 128(3330), 967-977. Retrieved from
http://apps.fischlerschool.nova.edu/toolbox/instructionalproducts/edd8124/fall11/1958-
Skinner-TeachingMachines.pdf

183
Smith, C. K. (2005). Academic factors associated with online course completion at two-year
colleges (Doctoral dissertation). Available from ProQuest Dissertations & Theses
Global. (Order No. 3208798)
Smith, V. C., Lange, A., & Huston, D. R. (2012). Predictive modeling to forecast student
outcomes and drive effective interventions in online community college courses. Journal
of Asynchronous Learning Networks, 16(3), 51-61. Retrieved from
http://files.eric.ed.gov/fulltext/EJ982673.pdf
Thelin, J. R. (2011). A history of American higher education (2nd ed.). Baltimore, MD: The Johns
Hopkins University Press.
Tinto, V. (1975). Dropout from higher education: A theoretical synthesis of recent research.
Review of Educational Research, 45(1), 89-125. Retrieved from
http://www.jstor.org/stable/1170024
Tinto, V. (1982). Limits of theory and practice in student attrition. Journal of Higher Education,
53(6), 687–700. Retrieved from http://www.jstor.org/stable/1981525
Tinto, V. (1988). Stages of student departure: Reflections on the longitudinal character of student
leaving. Journal of Higher Education, 59(4), 438-455. Retrieved from
http://www.jstor.org/stable/1981920
U. S. Department of Education. (2009). Evaluation of evidence-based practices in online
learning: A meta-analysis and review of online learning studies. Washington, DC:
Author. Retrieved from https://www2.ed.gov/rschstat/eval/tech/evidence-based-
practices/finalreport.pdf

184
U. S. Department of Education. (2011). Meeting the nation’s 2020 goal: State targets for
increasing the number and percentage of college graduates with degrees. Retrieved from
https://www.whitehouse.gov/sites/default/files/completion_state_by_state.pdf
Vaill, A. L. (2013). Preparing online learners for success: Orientation methods and their impact
on learner readiness (Doctoral dissertation). Retrieved from ProQuest Dissertations &
Theses Global. (Order No. 3569898)
Vogt, W. P., Gardner, D. C., & Haeffele, L. M. (2012). When to use what research design. New
York, NY: The Guilford Press.
Vogt, W. P., Vogt, E. R., Gardner, D. C, & Haeffele, L. M. (2014). Selecting the right analyses
for your data: Quantitative, qualitative, and mixed methods. New York, NY:
The Guilford Press.
WCET. (2010). The no significant difference phenomenon. Retrieved from
http://nosignificantdifference.org
Wedemeyer, C. A. (1975). Implications of open learning for independent study. Retrieved from
http://files.eric.ed.gov/fulltext/ED112766.pdf
Wedemeyer, C. (1978). Learning through technology. Retrieved from
http://files.eric.ed.gov/fulltext/ED317155.pdf
Williams, M. J. (2008). The relationship between selected predictor variables and successful
completion of online courses (Doctoral dissertation). Available from ProQuest
Dissertations & Theses Global. (Order No. 3297562)
Wilson, D., & Allen, D. (2011). Success rates of online versus traditional college students.
Research in Higher Education Journal, 14. Retrieved from
http://www.aabri.com/manuscripts/11761.pdf

185
Wilson, N. R., Brooks, J., Dufour, M., Smith, J., Tempel, C., & Russell, C. (2015). Distance
education in the Illinois community college system. Springfield, IL: The Illinois
Community College Board. Retrieved from
http://www.iccb.state.il.us/pdf/reports/FY14_Distance_Education_Report.pdf
Wladis, C. W., Conway, K. M., & Hachey, A. C. (2015). The online STEM classroom – who
succeeds? An exploration of the impact of ethnicity, gender, and non-traditional
student characteristics in the community college context. Community College Review,
43(2), 142-164. doi: 10.1177/0091552115571729
Wojciechowski, A., & Palmer, L. B. (2005). Individual student characteristics: Can any be
predictors of success in online classes. Online Journal of Distance Learning
Administration, 8(2). Retrieved from
http://www.westga.edu/~distance/ojdla/summer82/wojciechowski82.pdf
Xu, D., & Jaggars, S. S. (2011a). Online and hybrid course enrollment and performance in
Washington state community and technical colleges. CCRC Working Paper No. 31.
New York, NY: Community College Research Center, Columbia University.
Retrieved from http://files.eric.ed.gov/fulltext/ED517746.pdf
Xu, D., & Jaggars, S. S. (2011b). The Effectiveness of distance education across Virginia's
community colleges: Evidence from introductory college-level math and English courses.
Educational Evaluation and Policy Analysis, 33(3), 360-377.
doi: 10.3102/0162373711413814

186
Xu, D., & Jaggars, S. S. (2013). Adaptability to online learning: Differences across types of
students and academic subject areas CCRC working paper no. 54. New York, NY:
Community College Research Center. Retrieved from
http://hdl.handle.net/10022/AC:P:19258
Zimmerman, B. J. (2002). Becoming a self-regulated learner: An overview. Theory Into
Practice, 41(2), 64-72. doi: 10.1207/s15430421tip4102_2

187
APPENDIX A: FACTORS PRIOR TO ENROLLMENT THAT IMPACT
ONLINE STUDENT SUCCESS
Factors Significant Correlate or Predictor of Student Success No Significant Relationship
Identified Positive Negative
Age Cummings, 2009; Davidson,
2017; Doherty, 2006; Gregory,
2016; McPhaul-Moore, 2013;
Moore et al., 2002; Muse,
2003; Porta-Merida, 2009;
Riordan, 2013; Williams, 2008;
Wladis, Conway, & Hachey,
2015; Wojciechowski &
Palmer, 2005; Xu & Jaggars,
2013
n/a Akpom, 2013; Aragon &
Johnson, 2008; Foster, 2012;
Gibson, 2015; Jost, Rude-
Parkins, & Githens, 2012;
Riordan, 2013
Distance from
campus
n/a Hawkins, 2012 Davidson, 2017
Ethnicity (non-minority)
Berling, 2010; Bull, 2015;
Davidson, 2017; Moore et al.,
2002; Palacios & Wood, 2016;
Porta-Merida, 2009;
Rodriguez, 2011; Williams,
2008; Xu & Jaggars, 2013
n/a Aragon & Johnson, 2008;
Gibson, 2015; Jost, Rude-
Parkins, & Githens, 2012;
Wladis, Conway, & Hachey,
2015
Financial Aid
Award
Bull, 2015 Davidson, 2017;
Gregory, 2016;
Rodriguez, 2011
Aragon & Johnson, 2008;
Berling, 2010; Foster, 2012,
Gibson, 2015; Riordan, 2013
Gender (Female)
Aragon & Johnson, 2008;
Davidson, 2017; Doherty,
2006; Porta-Merida, 2009;
Wladis, Conway, & Hachey,
2015; Xu & Jaggars, 2013
n/a Akpom, 2013; Berling, 2010;
Bull, 2015; Cummings, 2009;
Foster, 2012; Gibson, 2015;
Gregory, 2016; Jost, Rude-
Parkins, & Githens, 2012;
Moore et al., 2002; Riordan,
2013; Wilson & Allen, 2011;
Wojciechowski & Palmer,
2005
Marital Status (married)
Gregory, 2016 n/a n/a
Time since last
course
Muse, 2003 Davidson, 2017 n/a
Note: Studies in bold used existing community college data.

188
APPENDIX B: FACTORS AFTER ENROLLMENT THAT IMPACT
ONLINE STUDENT SUCCESS
Note: Studies in bold used existing community college data.
Positive Negative
Cumulative GPA Akpom, 2013; Aragon & Johnson, 2008;
Berling, 2010; Bull, 2015; Cochran,
Campbell, Baker, & Leeds, 2013;
Cummings, 2009; Davidson, 2017;
Dupin-Bryant, 2004; Foster, 2012;
Gibson, 2015; Harrell & Bower, 2011;
Hawkins, 2012; Jost, Rude-Parkins, &
Githens, 2012; McPhaul-Moore, 2013;
Muse, 2003; Porta-Merida, 2009; Riordan,
2013; Rodriguez, 2011; Smith, 2005;
Wilson & Allen, 2011; Wladis, Conway,
& Hachey, 2015; Wojciechowski &
Palmer, 2005; Xu & Jaggars, 2013
n/a n/a
Computer skills/
technology experience
Davidson, 2017; Dupin-Bryant, 2004 Harrell & Bower, 2011 Akpom, 2013; Cummings,
2009; Muse, 2003; Riordan,
2013; Shaw, Burrus &
Ferguson, 2016
Course withdrawals n/a Cochran, Campbell, Baker, &
Leeds, 2013; Davidson, 2017;
Wojciechowski & Palmer,
2005
n/a
Cumulative credits Berling, 2010; Bull, 2015; Cochran,
Campbell, Baker, & Leeds, 2013,
Cummings, 2009; Davidson, 2017;
Doherty, 2006; Dupin-Bryant, 2004;
Foster, 2012; Gregory, 2016; Moore et
al., 2002; Smith, Lange, & Huston, 2012;
Wilson & Allen, 2011; Wojciechowski &
Palmer, 2005
Rodriguez, 2011 n/a
Enrollment status Aragon & Johnson, 2008; Smith, Lange
& Huston, 2012
Davidson, 2017; Doherty,
2006; Gregory, 2016;
Hawkins, 2012; Moore et al.,
2002; Riordan, 2013;
Rodriguez, 2011
Akpom, 2013; Muse, 2003;
Wladis, Conway, & Hachey,
2015; Wojciechowski &
Palmer, 2005
Online course
experience
Davidson, 2017; Dupin-Bryant, 2004;
Hachey, Conway, Wladis, 2013; Hachey,
Wladis, & Conway, 2012; McPhaul-
Moore, 2013; Moore et al., 2002; Porta-
Merida, 2009; Williams, 2008; Wladis,
Conway, & Hachey, 2015;
Wojciechowski & Palmer, 2005; Xu &
Jaggars, 2011b
Smith, 2005 Apkom, 2013; Muse 2003
Remedial coursework n/a Davidson, 2017; Fisher, 2010;
Hachey, Wladis, & Conway,
2012; Harrell & Bower, 2011;
Jost, Rude-Parkins, &
Githens, 2012; Xu &
Jaggars, 2011a, 2011b, 2013
Aragon & Johnson, 2008
Factors Significant Correlate or Predictor of Student Success No Significant Relationship
Identified
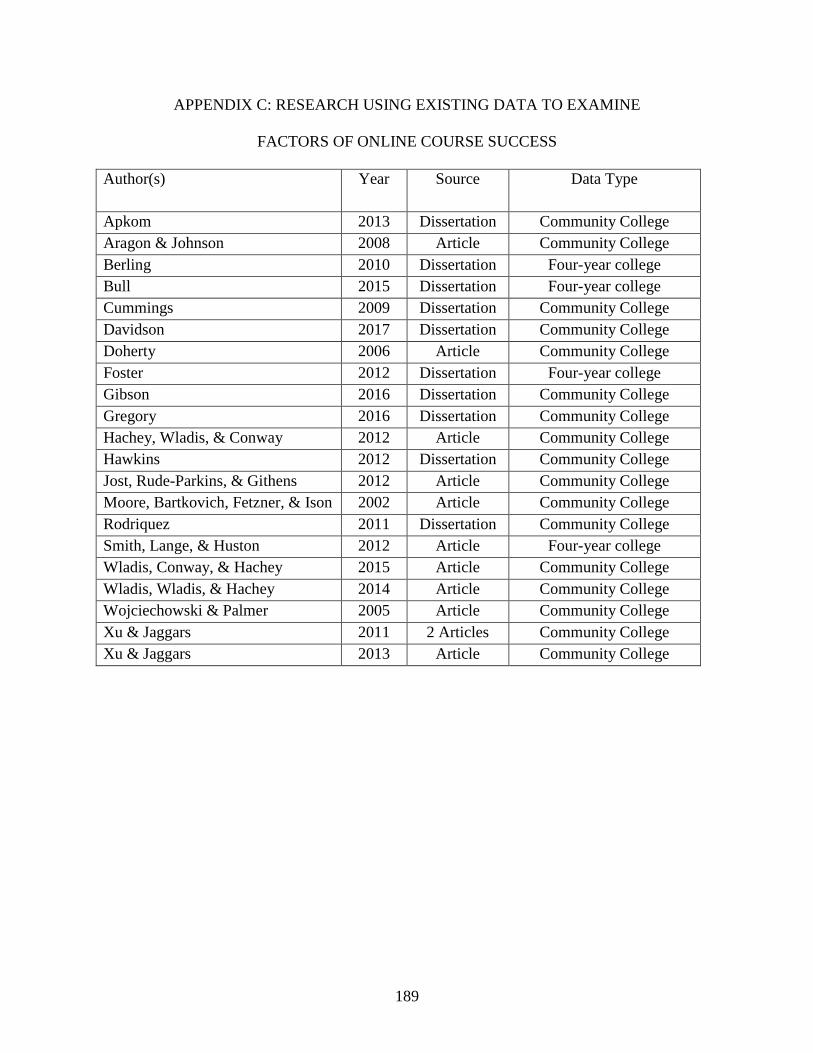
189
APPENDIX C: RESEARCH USING EXISTING DATA TO EXAMINE
FACTORS OF ONLINE COURSE SUCCESS
Author(s) Year Source Data Type
Apkom 2013 Dissertation Community College
Aragon & Johnson 2008 Article Community College
Berling 2010 Dissertation Four-year college
Bull 2015 Dissertation Four-year college
Cummings 2009 Dissertation Community College
Davidson 2017 Dissertation Community College
Doherty 2006 Article Community College
Foster 2012 Dissertation Four-year college
Gibson 2016 Dissertation Community College
Gregory 2016 Dissertation Community College
Hachey, Wladis, & Conway 2012 Article Community College
Hawkins 2012 Dissertation Community College
Jost, Rude-Parkins, & Githens 2012 Article Community College
Moore, Bartkovich, Fetzner, & Ison 2002 Article Community College
Rodriquez 2011 Dissertation Community College
Smith, Lange, & Huston 2012 Article Four-year college
Wladis, Conway, & Hachey 2015 Article Community College
Wladis, Wladis, & Hachey 2014 Article Community College
Wojciechowski & Palmer 2005 Article Community College
Xu & Jaggars 2011 2 Articles Community College
Xu & Jaggars 2013 Article Community College

190
APPENDIX D: APPROVED INSTITUTIONAL REVIEW BOARD
RESEARCH PROPOSAL FORM