Embed Size (px)
Citation preview
Masters Leadership
Program
October 8, 2013
San Antonio, Texas
Demographic Characteristics and
Trends, Texas and Bexar County
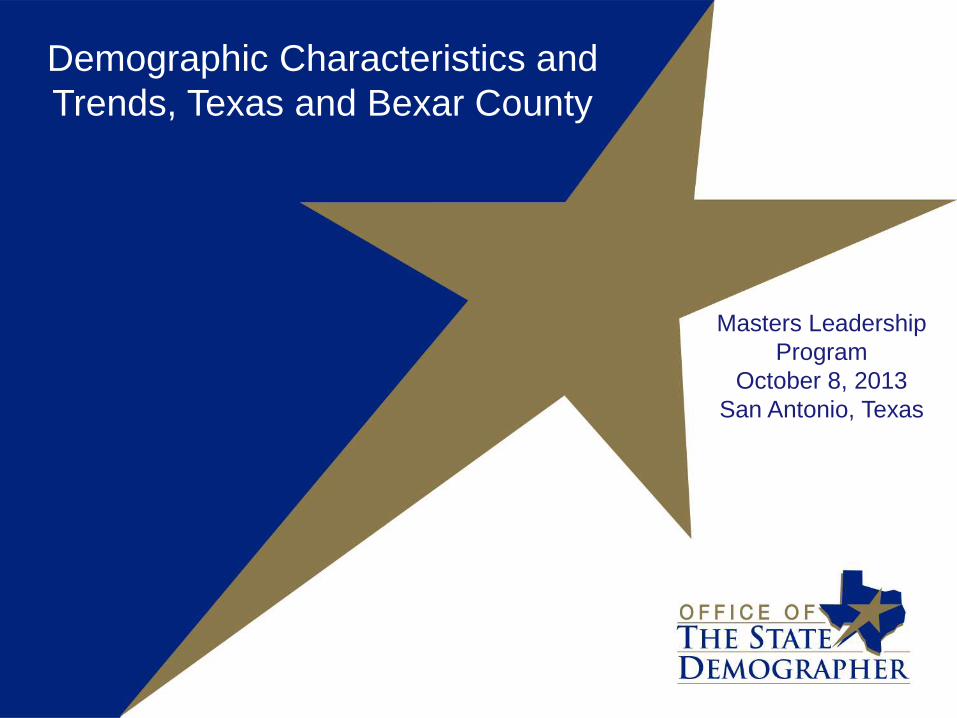
Growing States, 2000-2010
2
2000
Population*
2010
Population*
Numerical
Change
2000-2010
Percent
Change
2000-2010
United States 281,421,906 308,745,538 27,323,632 9.7%
Texas 20,851,820 25,145,561 4,293,741 20.6%
California 33,871,648 37,253,956 3,382,308 10.0%
Florida 15,982,378 18,801,310 2,818,932 17.6%
Georgia 8,186,453 9,687,653 1,501,200 18.3%
North Carolina 8,049,313 9,535,483 1,486,170 18.5%
Arizona 5,130,632 6,392,017 1,261,385 24.6%
Population values are decennial census counts for April 1 for 2000 and 2010.
Source: U.S. Census Bureau. 2000 and 2010 Census Count.
65% (2.8 million) of this change can be attributed to growth
of the Hispanic population
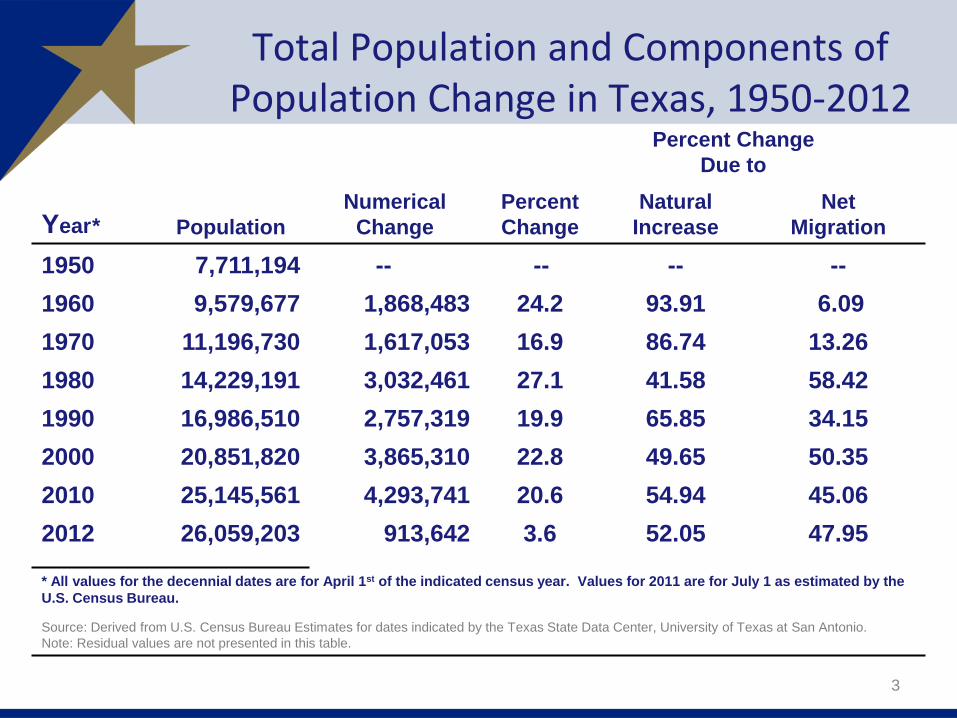
Percent Change
Due to
Year* Population
Numerical
Change
Percent
Change
Natural
Increase
Net
Migration
1950 7,711,194 -- -- -- --
1960 9,579,677 1,868,483 24.2 93.91 6.09
1970 11,196,730 1,617,053 16.9 86.74 13.26
1980 14,229,191 3,032,461 27.1 41.58 58.42
1990 16,986,510 2,757,319 19.9 65.85 34.15
2000 20,851,820 3,865,310 22.8 49.65 50.35
2010 25,145,561 4,293,741 20.6 54.94 45.06
2012 26,059,203 913,642 3.6 52.05 47.95
* All values for the decennial dates are for April 1st of the indicated census year. Values for 2011 are for July 1 as estimated by the
U.S. Census Bureau.
Source: Derived from U.S. Census Bureau Estimates for dates indicated by the Texas State Data Center, University of Texas at San Antonio.
Note: Residual values are not presented in this table.
Total Population and Components of Population Change in Texas, 1950-2012
3
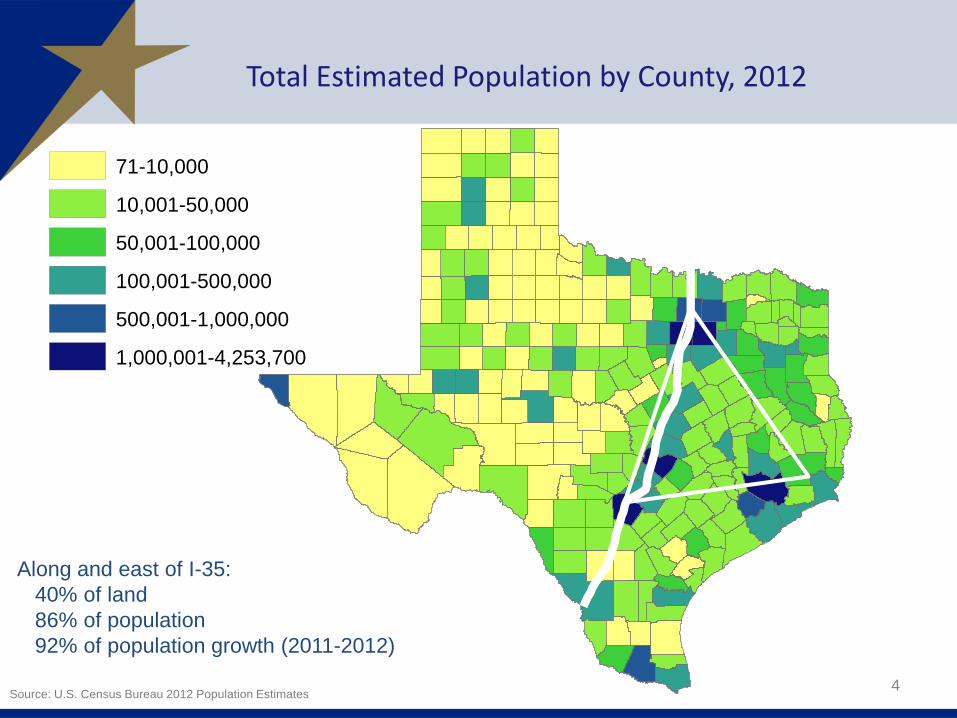
Total Estimated Population by County, 2012
4 Source: U.S. Census Bureau 2012 Population Estimates
Along and east of I-35:
40% of land
86% of population
92% of population growth (2011-2012)
Legend
POPESTIMATE2012
71-10,000
10,001-50,000
50,001-100,000
100,001-500,000
500,001-1,000,000
1,000,001-4,253,700
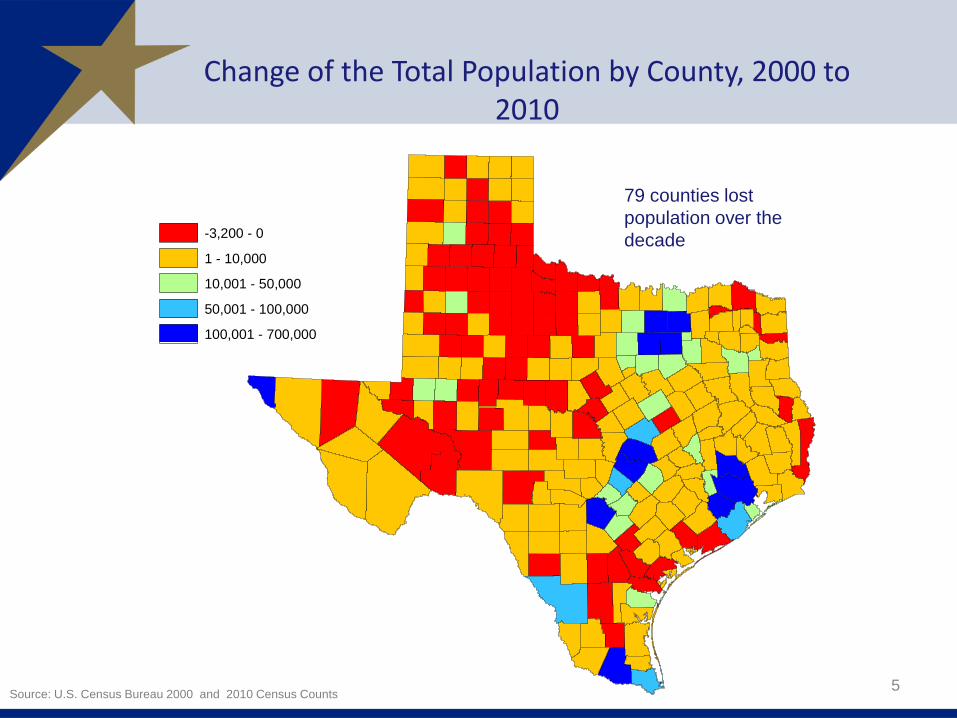
Change of the Total Population by County, 2000 to 2010
5 Source: U.S. Census Bureau 2000 and 2010 Census Counts
Legend
co48_d00
'PROJECTIONS X$'.totpopch0010
-3,200 - 0
1 - 10,000
10,001 - 50,000
50,001 - 100,000
100,001 - 700,000
79 counties lost
population over the
decade
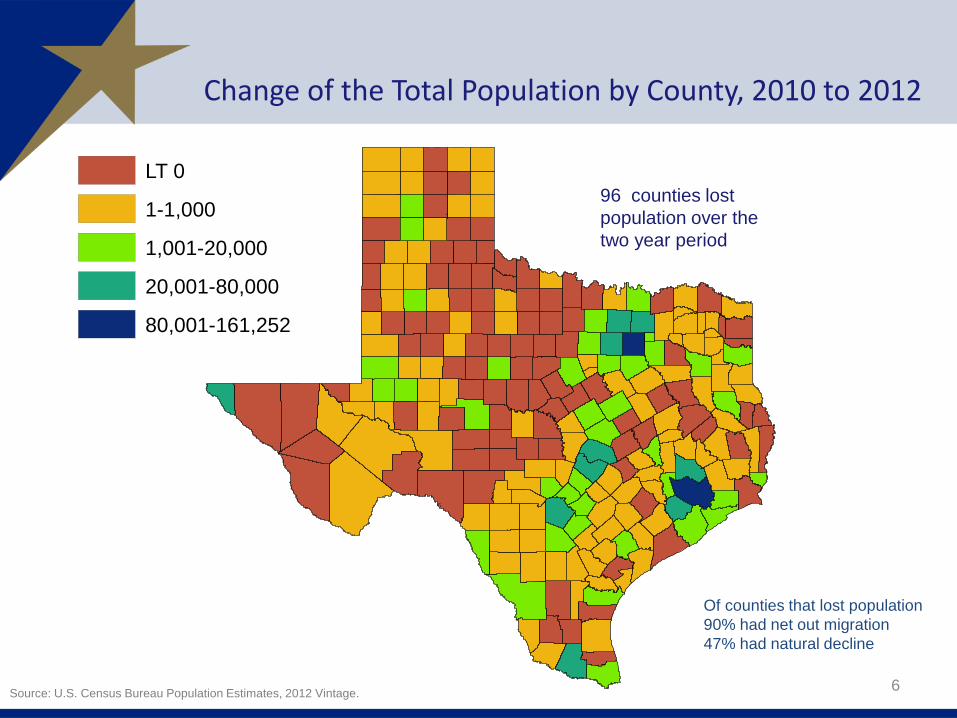
Change of the Total Population by County, 2010 to 2012
6 Source: U.S. Census Bureau Population Estimates, 2012 Vintage.
96 counties lost
population over the
two year period
Legend
tl_2010_48_county10
popchg4201072012
LT 0
1-1,000
1,001-20,000
20,001-80,000
80,001-161,252
Of counties that lost population
90% had net out migration
47% had natural decline
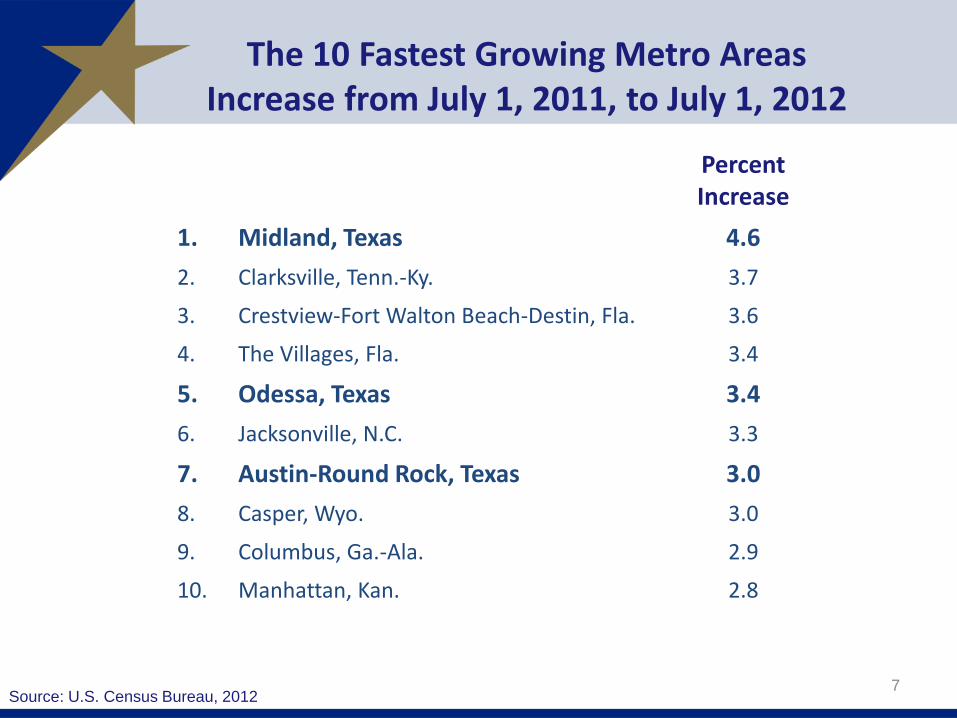
The 10 Fastest Growing Metro Areas Increase from July 1, 2011, to July 1, 2012
7
Percent Increase
1. Midland, Texas 4.6
2. Clarksville, Tenn.-Ky. 3.7
3. Crestview-Fort Walton Beach-Destin, Fla. 3.6
4. The Villages, Fla. 3.4
5. Odessa, Texas 3.4
6. Jacksonville, N.C. 3.3
7. Austin-Round Rock, Texas 3.0
8. Casper, Wyo. 3.0
9. Columbus, Ga.-Ala. 2.9
10. Manhattan, Kan. 2.8
Source: U.S. Census Bureau, 2012

The 10 Counties with the Largest Numeric Increase from July 1, 2011, to July 1, 2012
8
Numeric Increase
1. Harris, Texas 80,005
2. Los Angeles, Calif. 73,764
3. Maricopa, Ariz. 73,644
4. Dallas, Texas 45,827
5. San Diego, Calif. 38,880
6. King, Wash. 35,838
7. Travis, Texas 34,381
8. Orange, Calif. 34,017
9. Tarrant, Texas 32,997
10. Clark, Nev. 32,833
Source: U.S. Census Bureau, 2013
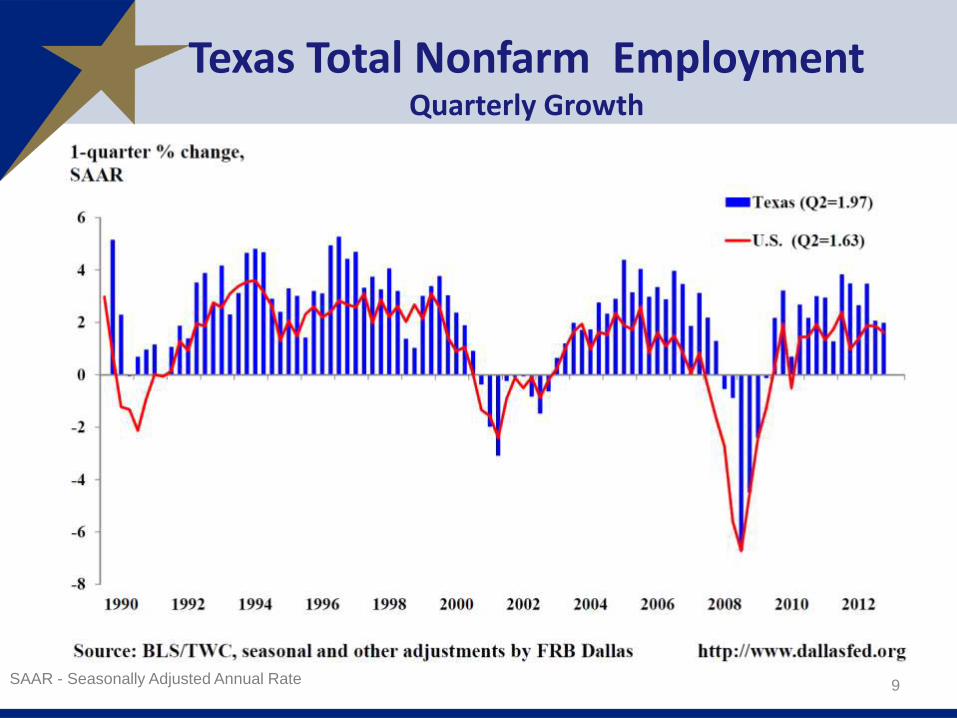
Texas Total Nonfarm Employment Quarterly Growth
9 SAAR - Seasonally Adjusted Annual Rate
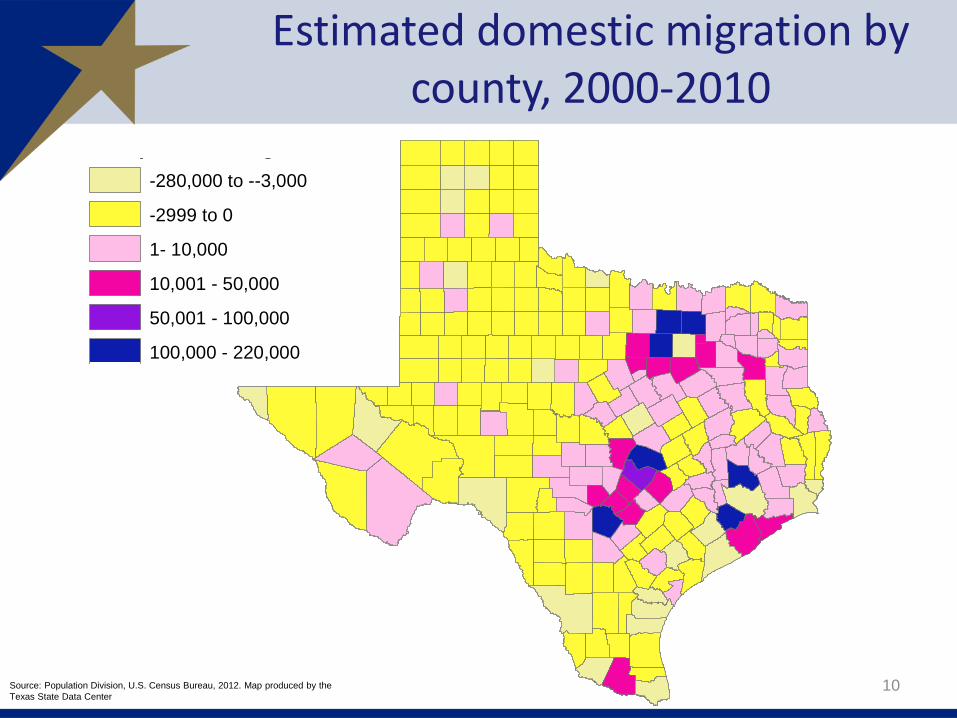
Estimated domestic migration by county, 2000-2010
10 Source: Population Division, U.S. Census Bureau, 2012. Map produced by the
Texas State Data Center
Legend
tl_2010_48_county10
Compoch$.domig
-280,000 to --3,000
-2999 to 0
1- 10,000
10,001 - 50,000
50,001 - 100,000
100,000 - 220,000
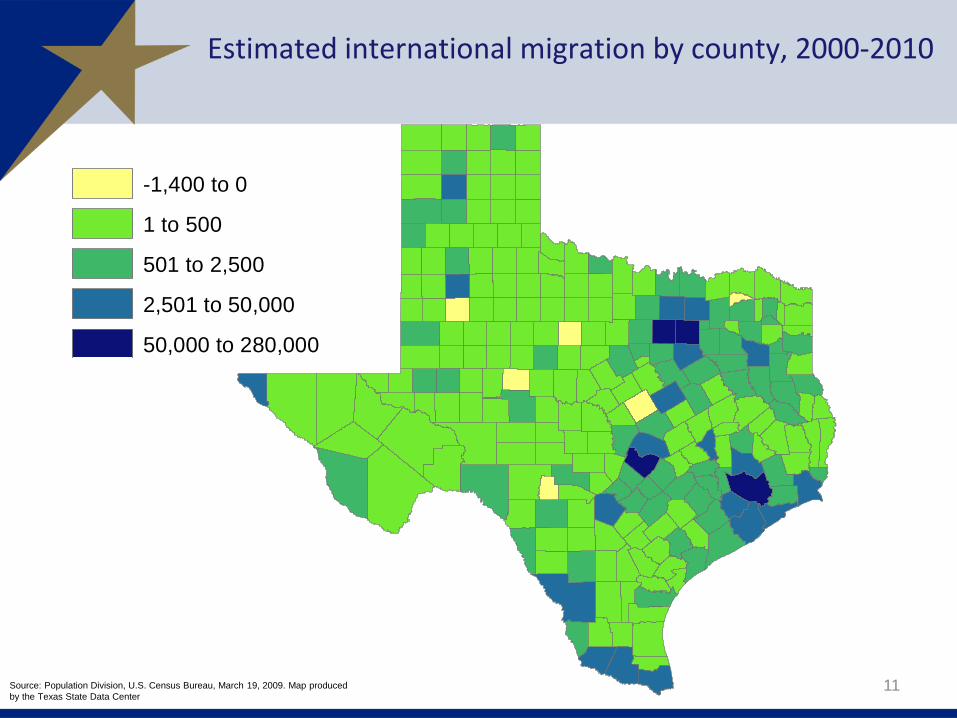
Estimated international migration by county, 2000-2010
Source: Population Division, U.S. Census Bureau, March 19, 2009. Map produced
by the Texas State Data Center
11
Legend
tl_2010_48_county10
Compoch$.inmig
-1,400 to 0
1 to 500
501 to 2,500
2,501 to 50,000
50,000 to 280,000
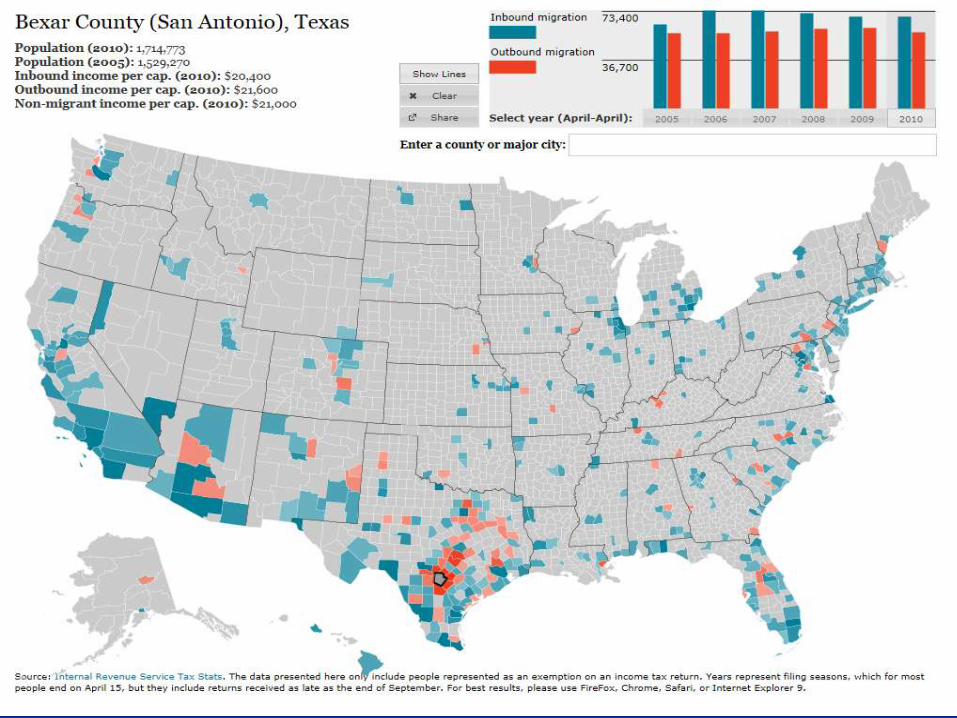
12
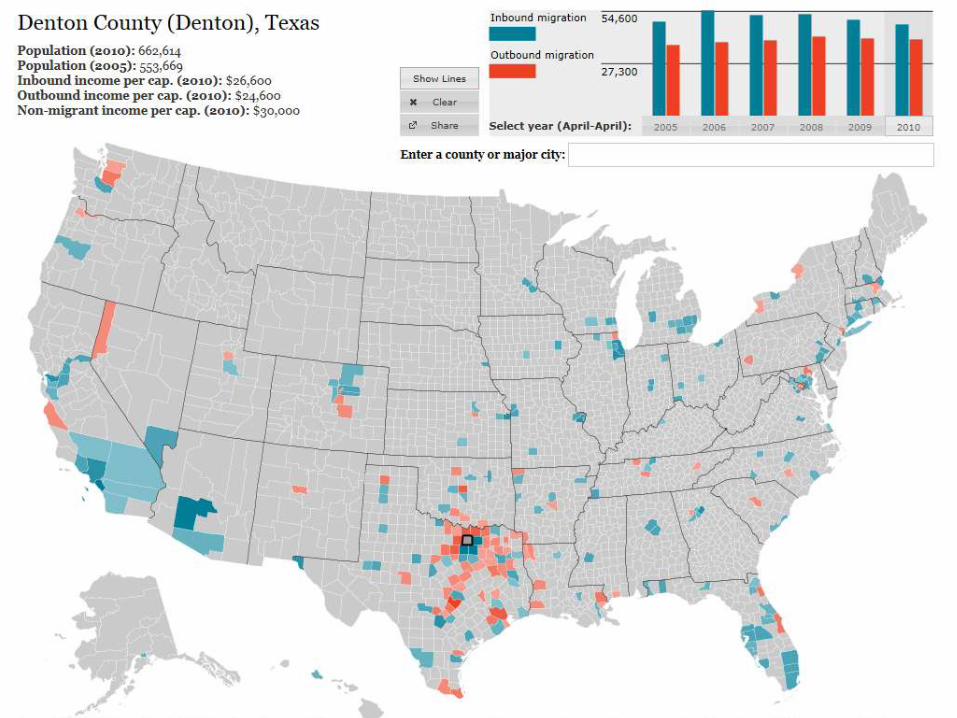
13 http://www.forbes.com/special-report/2011/migration.html
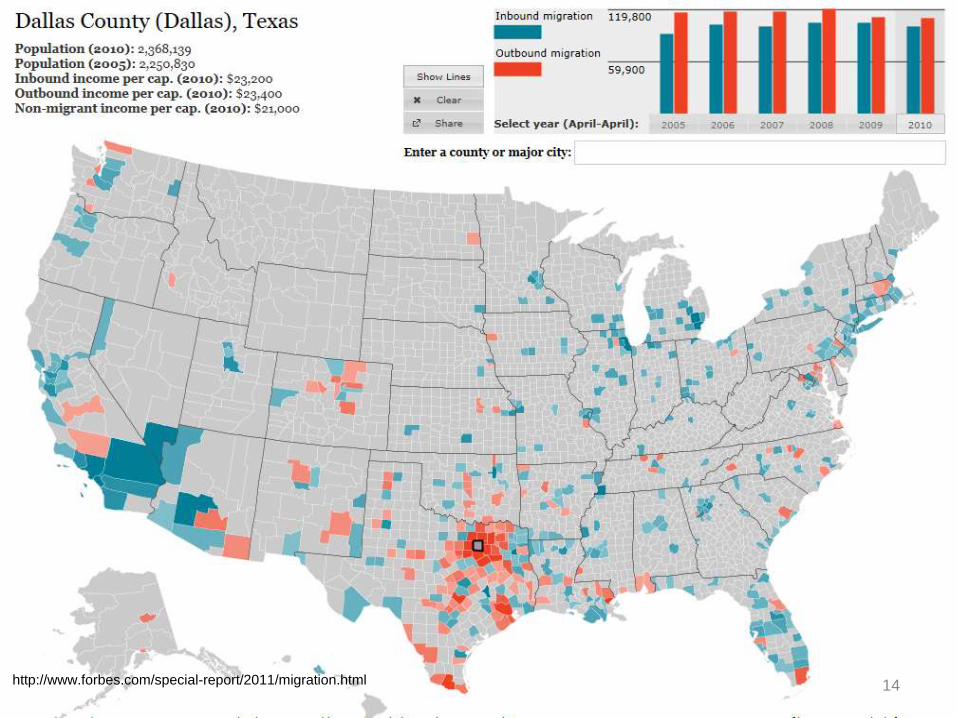
14 http://www.forbes.com/special-report/2011/migration.html
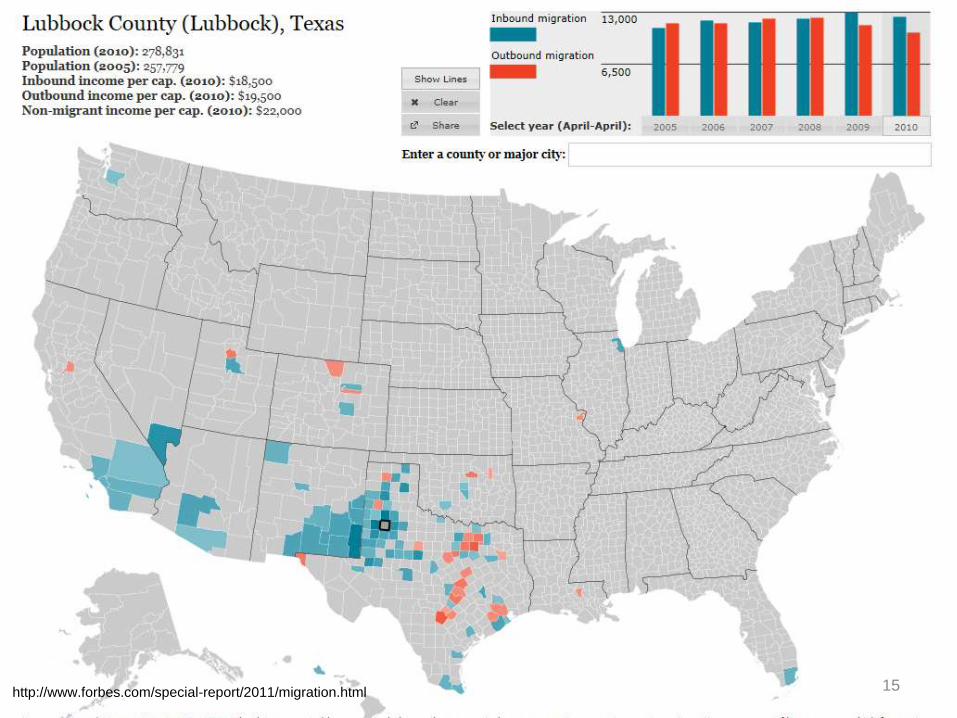
15 http://www.forbes.com/special-report/2011/migration.html
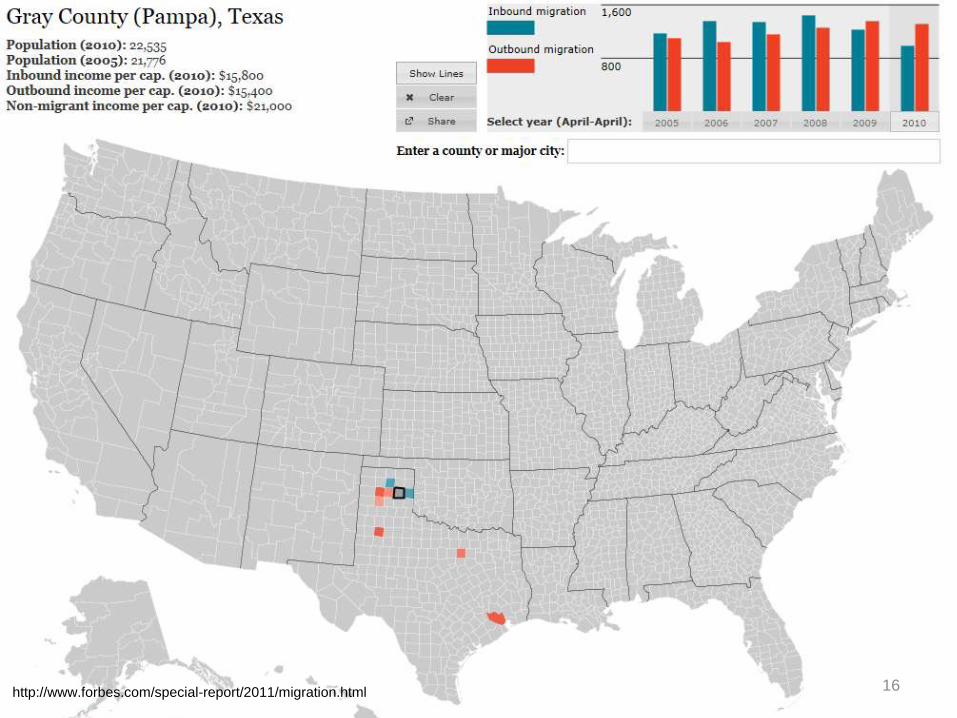
16 http://www.forbes.com/special-report/2011/migration.html
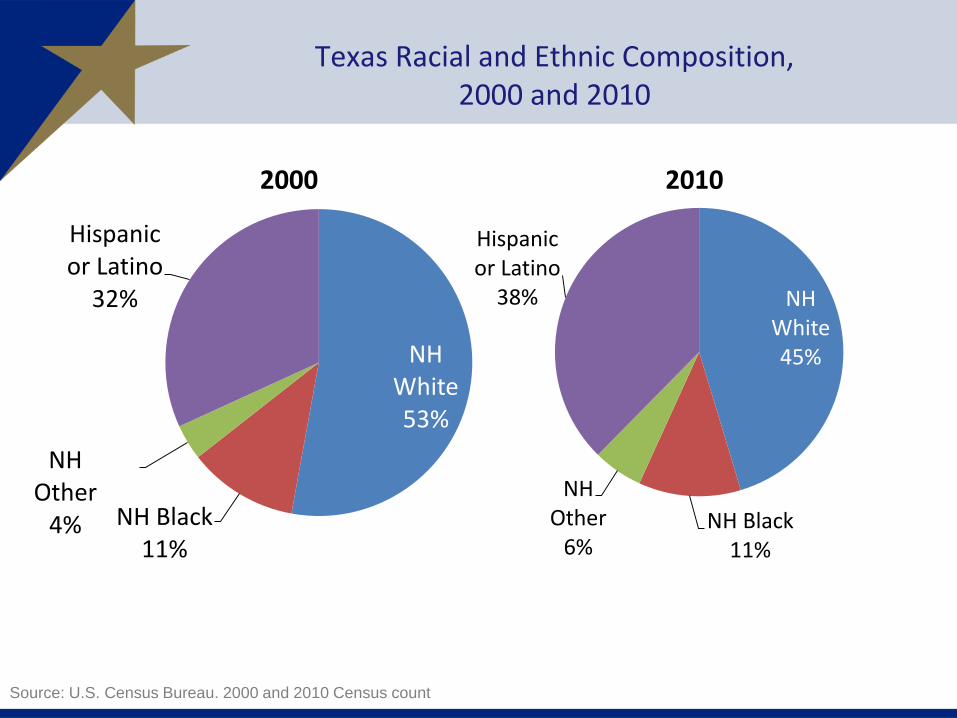
Texas Racial and Ethnic Composition, 2000 and 2010
NH White 53%
NH Black 11%
NH Other
4%
Hispanic or Latino
32%
2000
NH White 45%
NH Black 11%
NH Other
6%
Hispanic or Latino
38%
2010
Source: U.S. Census Bureau. 2000 and 2010 Census count
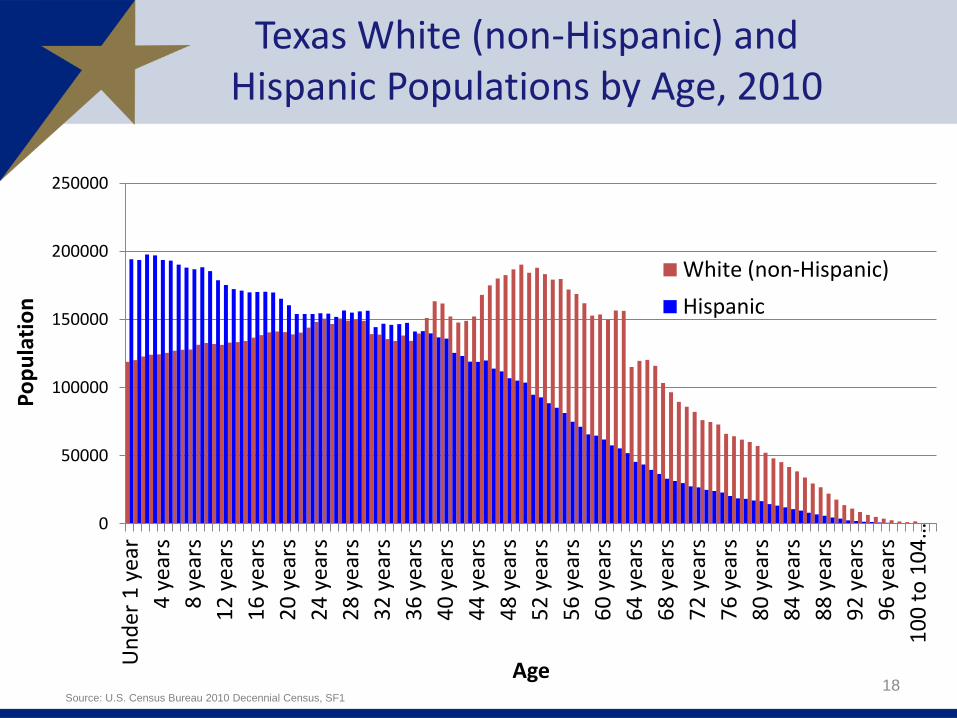
Texas White (non-Hispanic) and Hispanic Populations by Age, 2010
0
50000
100000
150000
200000
250000
Un
der
1 y
ear
4 y
ears
8 y
ears
12
yea
rs
16
yea
rs
20
yea
rs
24
yea
rs
28
yea
rs
32
yea
rs
36
yea
rs
40
yea
rs
44
yea
rs
48
yea
rs
52
yea
rs
56
yea
rs
60
yea
rs
64
yea
rs
68
yea
rs
72
yea
rs
76
yea
rs
80
yea
rs
84
yea
rs
88
yea
rs
92
yea
rs
96
yea
rs
10
0 t
o 1
04
…
Po
pu
lati
on
Age
White (non-Hispanic)
Hispanic
18 Source: U.S. Census Bureau 2010 Decennial Census, SF1
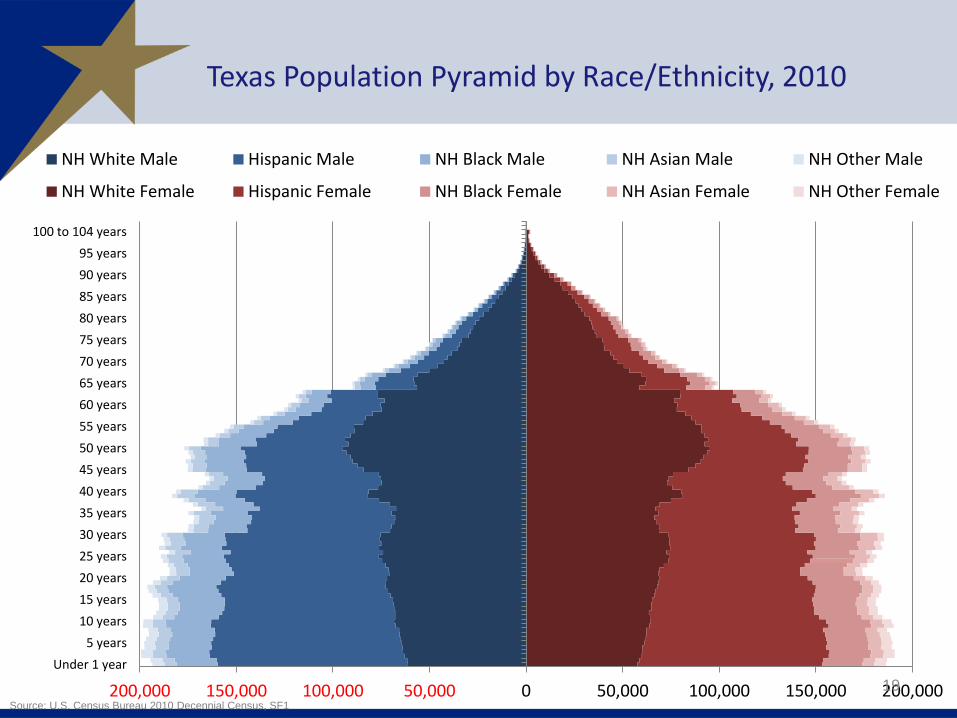
Texas Population Pyramid by Race/Ethnicity, 2010
200,000 150,000 100,000 50,000 0 50,000 100,000 150,000 200,000
Under 1 year
5 years
10 years
15 years
20 years
25 years
30 years
35 years
40 years
45 years
50 years
55 years
60 years
65 years
70 years
75 years
80 years
85 years
90 years
95 years
100 to 104 years
NH White Male Hispanic Male NH Black Male NH Asian Male NH Other Male
NH White Female Hispanic Female NH Black Female NH Asian Female NH Other Female
19 Source: U.S. Census Bureau 2010 Decennial Census, SF1
20
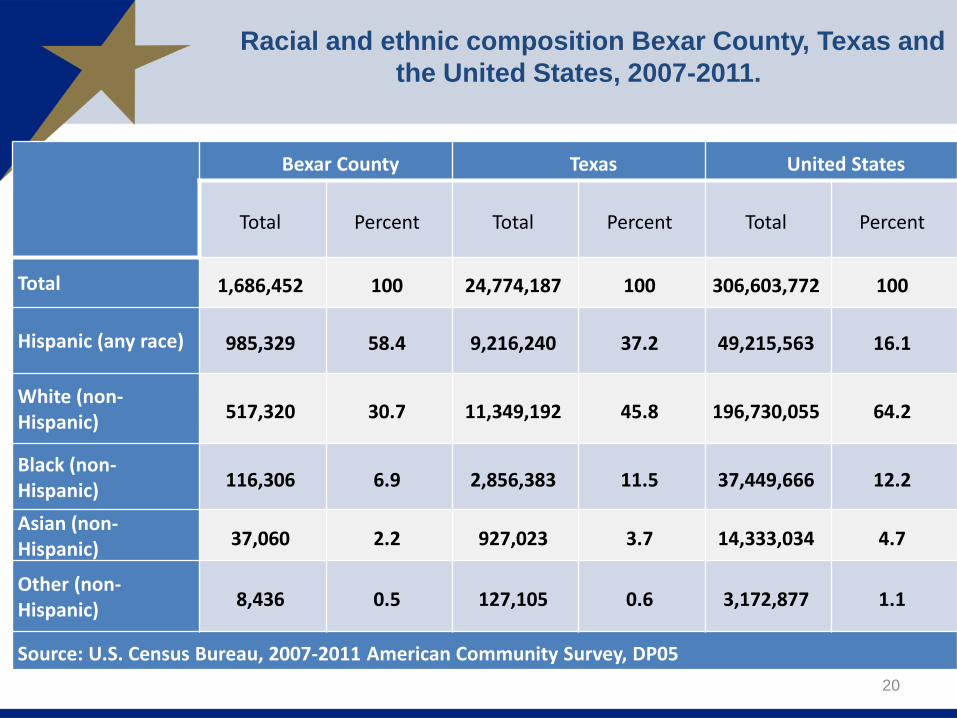
Bexar County Texas United States
Total Percent Total Percent Total Percent
Total 1,686,452 100 24,774,187 100 306,603,772 100
Hispanic (any race) 985,329 58.4 9,216,240 37.2 49,215,563 16.1
White (non-Hispanic) 517,320 30.7 11,349,192 45.8 196,730,055 64.2
Black (non-Hispanic) 116,306 6.9 2,856,383 11.5 37,449,666 12.2
Asian (non-Hispanic) 37,060 2.2 927,023 3.7 14,333,034 4.7
Other (non-Hispanic) 8,436 0.5 127,105 0.6 3,172,877 1.1
Source: U.S. Census Bureau, 2007-2011 American Community Survey, DP05
Racial and ethnic composition Bexar County, Texas and
the United States, 2007-2011.
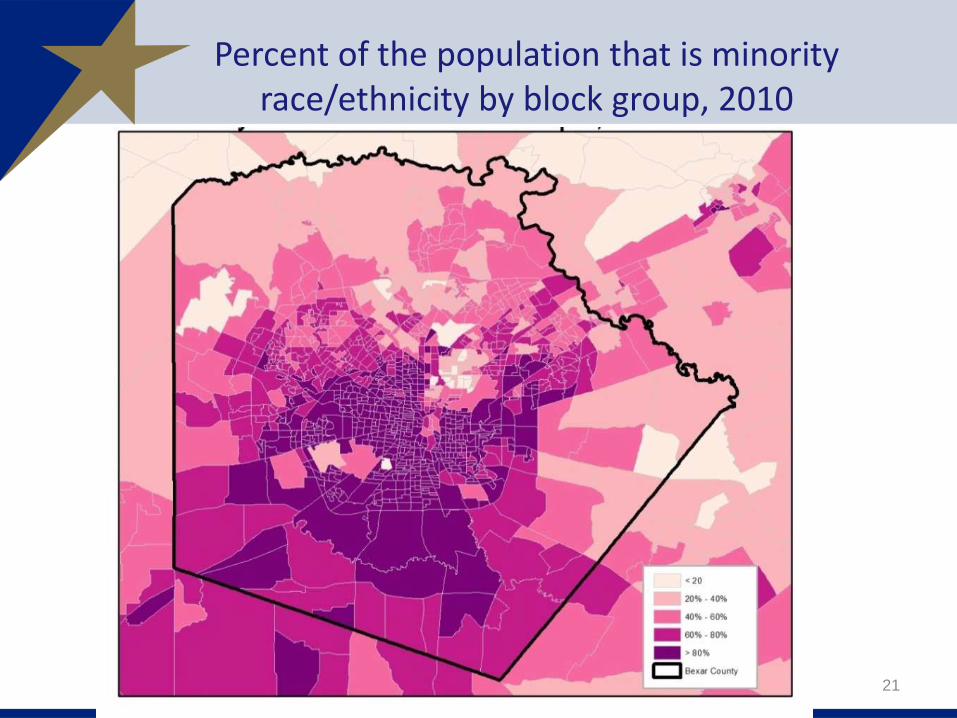
Percent of the population that is minority race/ethnicity by block group, 2010
21
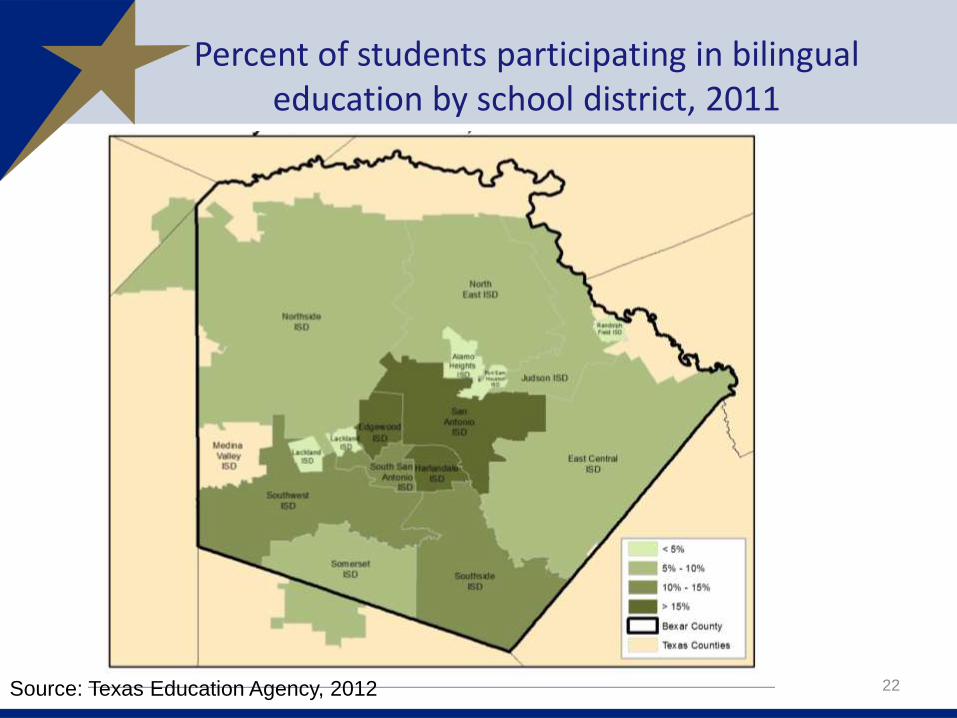
Percent of students participating in bilingual education by school district, 2011
22 Source: Texas Education Agency, 2012
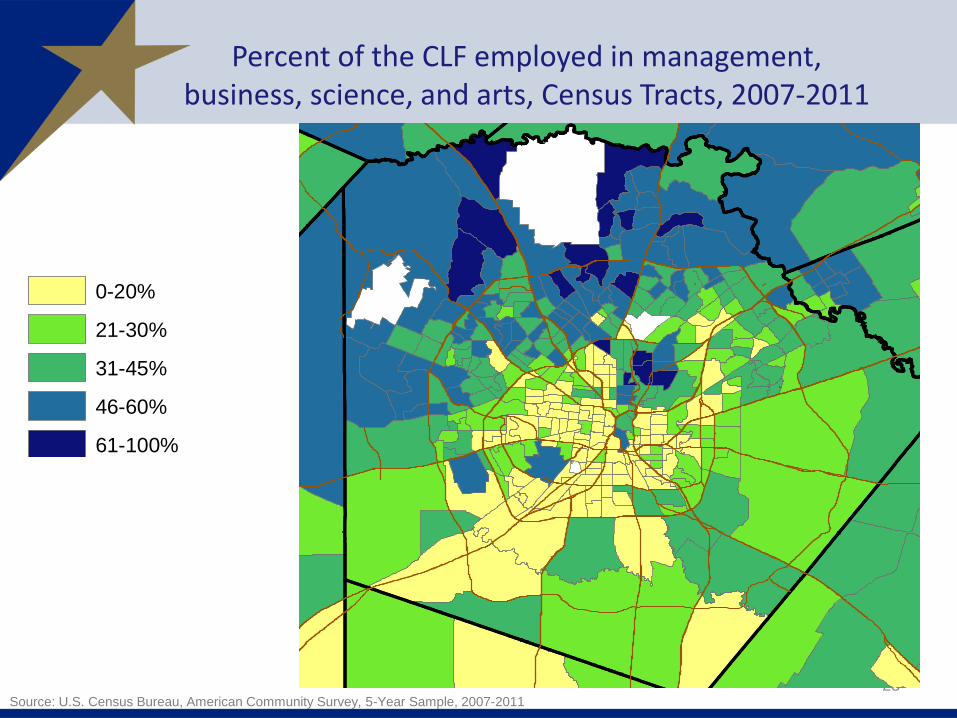
Percent of the CLF employed in management, business, science, and arts, Census Tracts, 2007-2011
23 Source: U.S. Census Bureau, American Community Survey, 5-Year Sample, 2007-2011
Legend
ACS_11_5YR_TRACT_48_TEXAS
DP3_HC03_VC41 Percent; OCCUPATION - Management, business, science, and arts occupations
0-20%
21-30%
31-45%
46-60%
61-100%
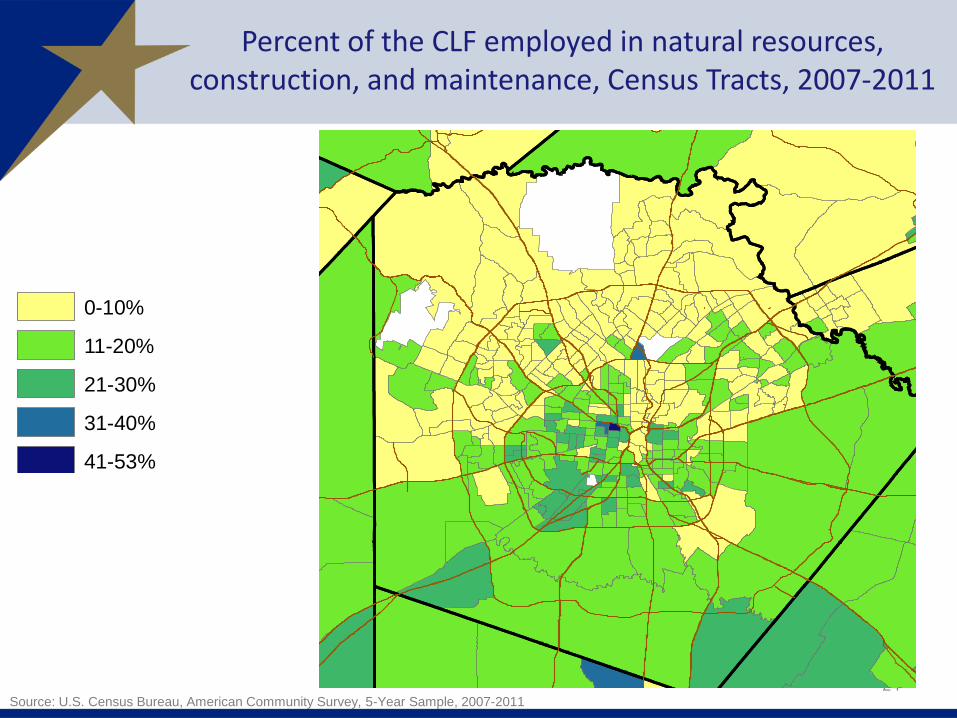
Percent of the CLF employed in natural resources, construction, and maintenance, Census Tracts, 2007-2011
24 Source: U.S. Census Bureau, American Community Survey, 5-Year Sample, 2007-2011
Legend
ACS_11_5YR_TRACT_48_TEXAS
DP3_HC03_VC44 Percent; OCCUPATION - Natural resources, construction, and maintenance occupations
0-10%
11-20%
21-30%
31-40%
41-53%
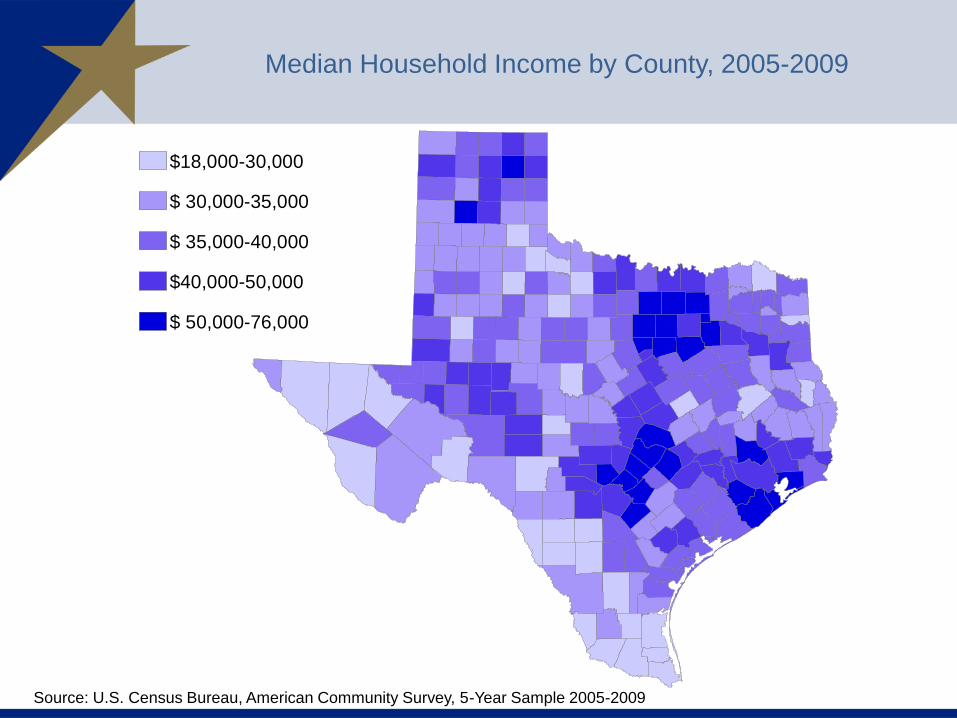
$18,000-30,000
$ 30,000-35,000
$ 35,000-40,000
$40,000-50,000
$ 50,000-76,000
Median Household Income by County, 2005-2009
Source: U.S. Census Bureau, American Community Survey, 5-Year Sample 2005-2009
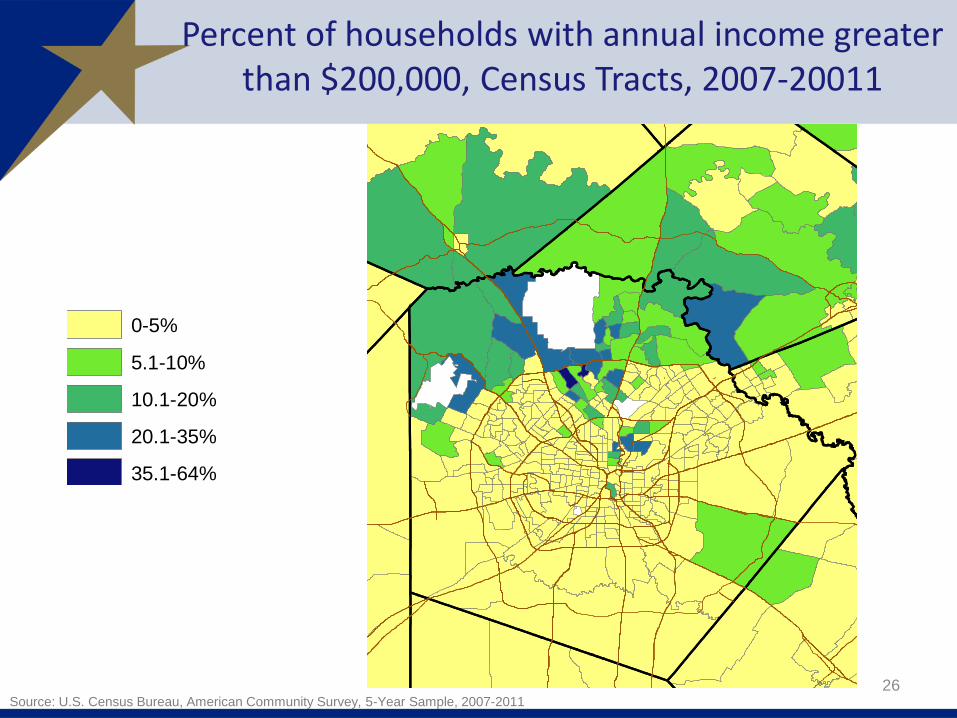
Percent of households with annual income greater than $200,000, Census Tracts, 2007-20011
26
Legend
ACS_11_5YR_TRACT_48_TEXAS
DP3_HC03_VC84 Percent; INCOME AND BENEFITS (IN 2011 INFLATION-ADJUSTED DOLLARS) - $200,000 or more
0-5%
5.1-10%
10.1-20%
20.1-35%
35.1-64%
Source: U.S. Census Bureau, American Community Survey, 5-Year Sample, 2007-2011
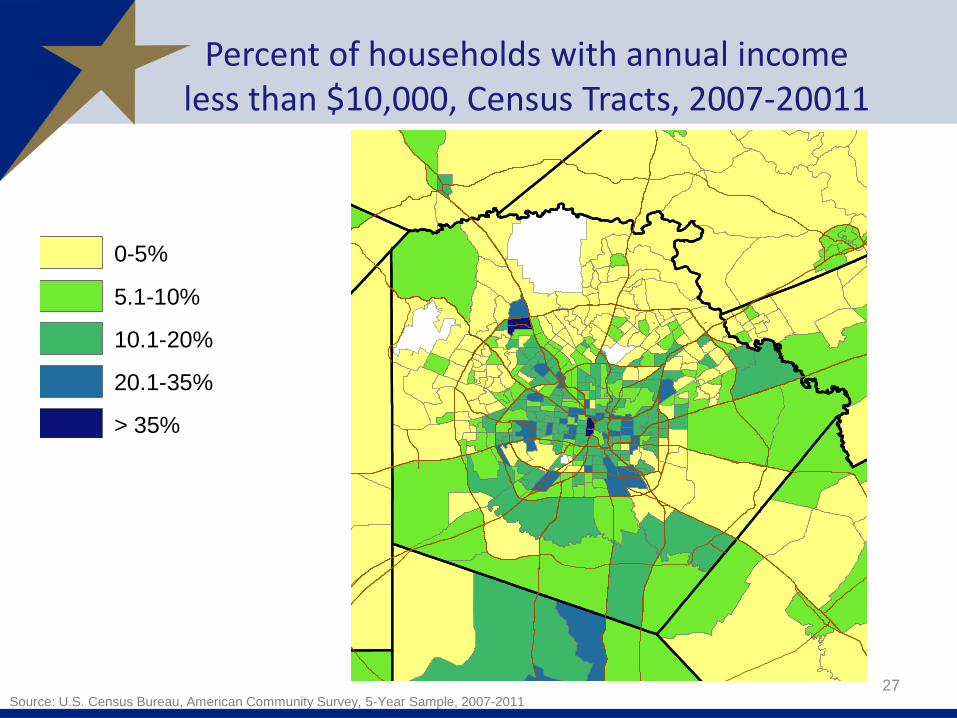
Percent of households with annual income less than $10,000, Census Tracts, 2007-20011
27
Legend
ACS_11_5YR_TRACT_48_TEXAS
DP3_HC03_VC75 Percent; INCOME AND BENEFITS (IN 2011 INFLATION-ADJUSTED DOLLARS) - Less than $10,000
0-5%
5.1-10%
10.1-20%
20.1-35%
> 35%
Source: U.S. Census Bureau, American Community Survey, 5-Year Sample, 2007-2011
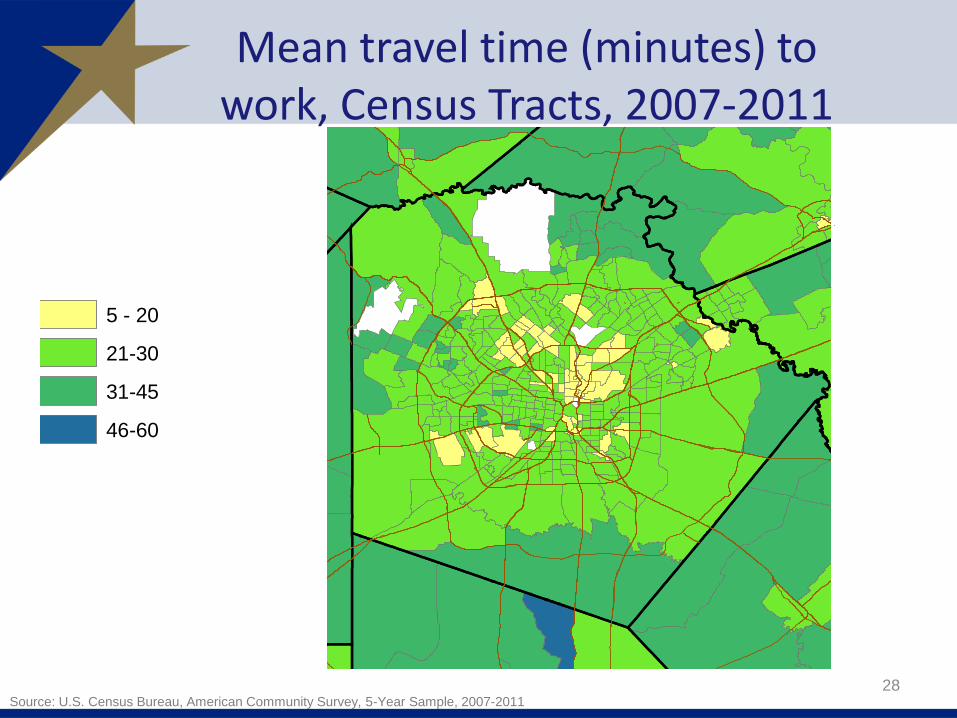
Mean travel time (minutes) to work, Census Tracts, 2007-2011
28
Legend
ACS_11_5YR_TRACT_48_TEXAS
DP3_HC01_VC36 Mean travel time to work
5 - 20
21-30
31-45
46-60
61-107
Source: U.S. Census Bureau, American Community Survey, 5-Year Sample, 2007-2011
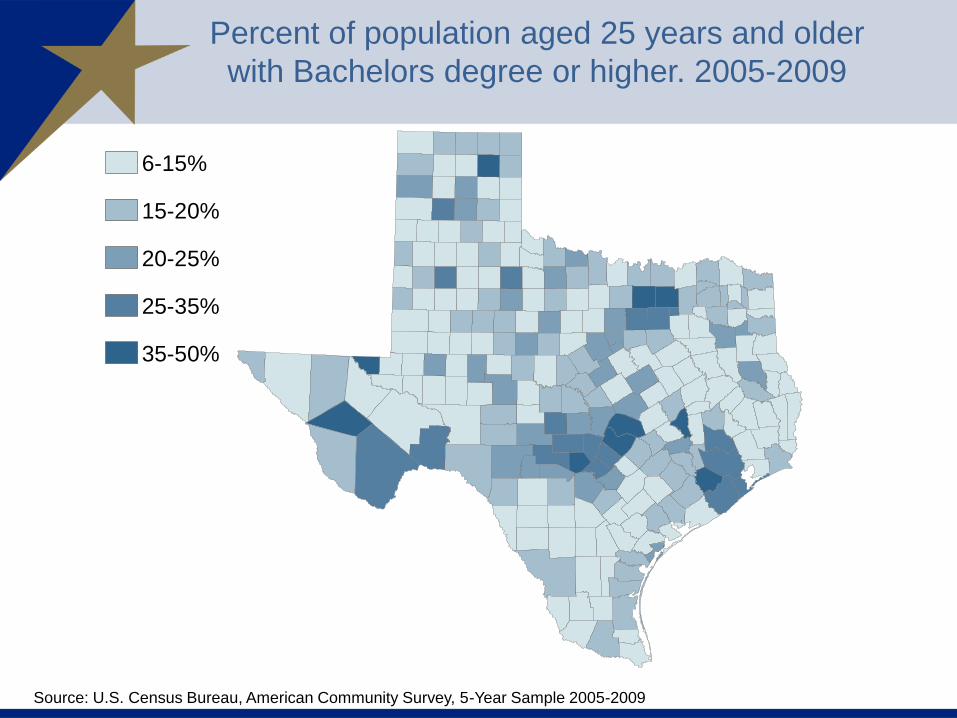
Percent of population aged 25 years and older
with Bachelors degree or higher. 2005-2009
Percent 25 + with Bachelors
6-15%
15-20%
20-25%
25-35%
35-50%
Source: U.S. Census Bureau, American Community Survey, 5-Year Sample 2005-2009
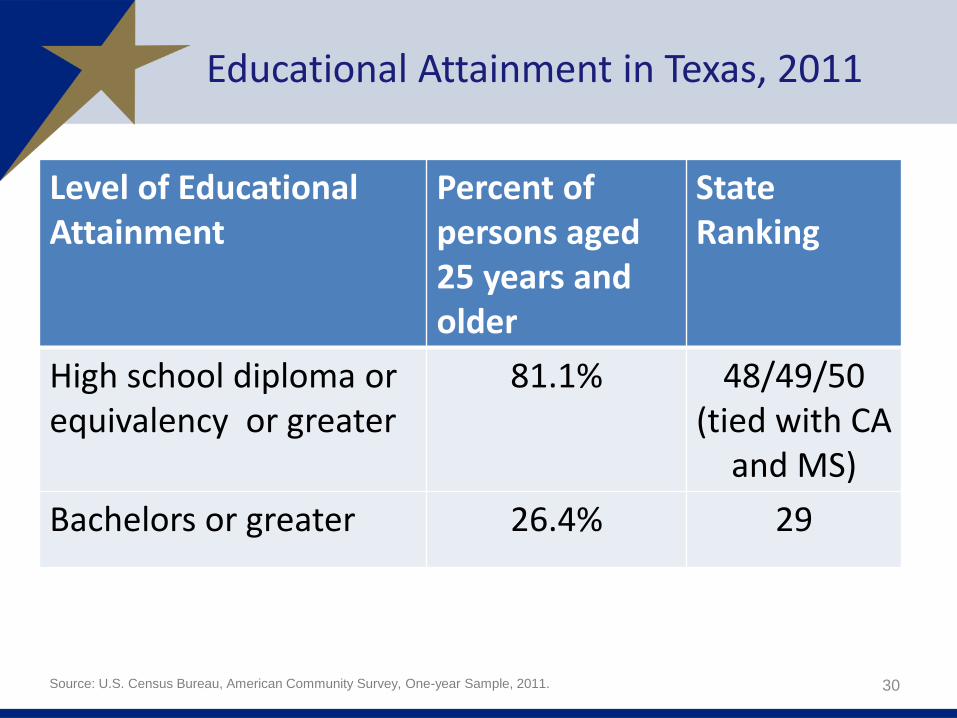
Educational Attainment in Texas, 2011
Level of Educational Attainment
Percent of persons aged 25 years and older
State Ranking
High school diploma or equivalency or greater
81.1% 48/49/50 (tied with CA
and MS)
Bachelors or greater 26.4% 29
30 Source: U.S. Census Bureau, American Community Survey, One-year Sample, 2011.
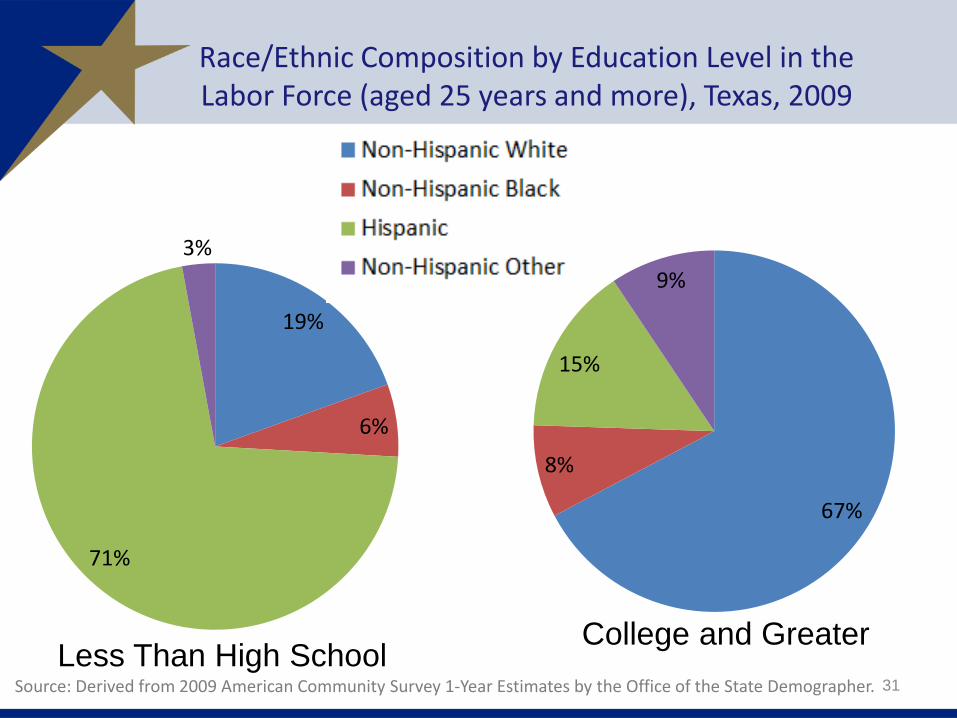
Race/Ethnic Composition by Education Level in the Labor Force (aged 25 years and more), Texas, 2009
19%
6%
71%
3%
31
67%
8%
15%
9%
Source: Derived from 2009 American Community Survey 1-Year Estimates by the Office of the State Demographer.
Less Than High School College and Greater
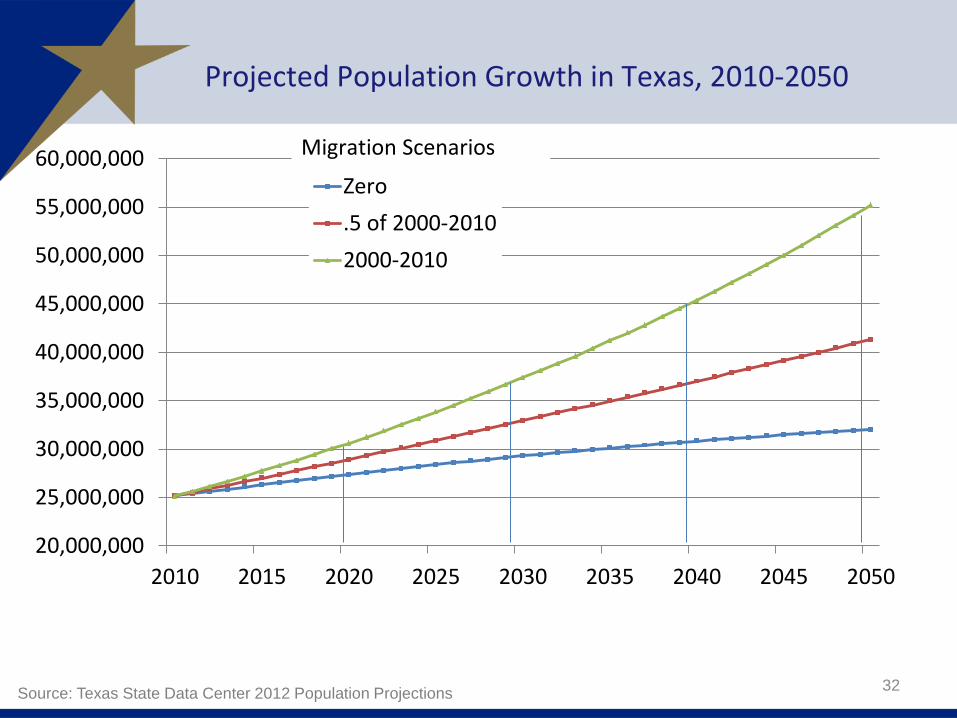
Projected Population Growth in Texas, 2010-2050
20,000,000
25,000,000
30,000,000
35,000,000
40,000,000
45,000,000
50,000,000
55,000,000
60,000,000
2010 2015 2020 2025 2030 2035 2040 2045 2050
Zero
.5 of 2000-2010
2000-2010
Migration Scenarios
32 Source: Texas State Data Center 2012 Population Projections
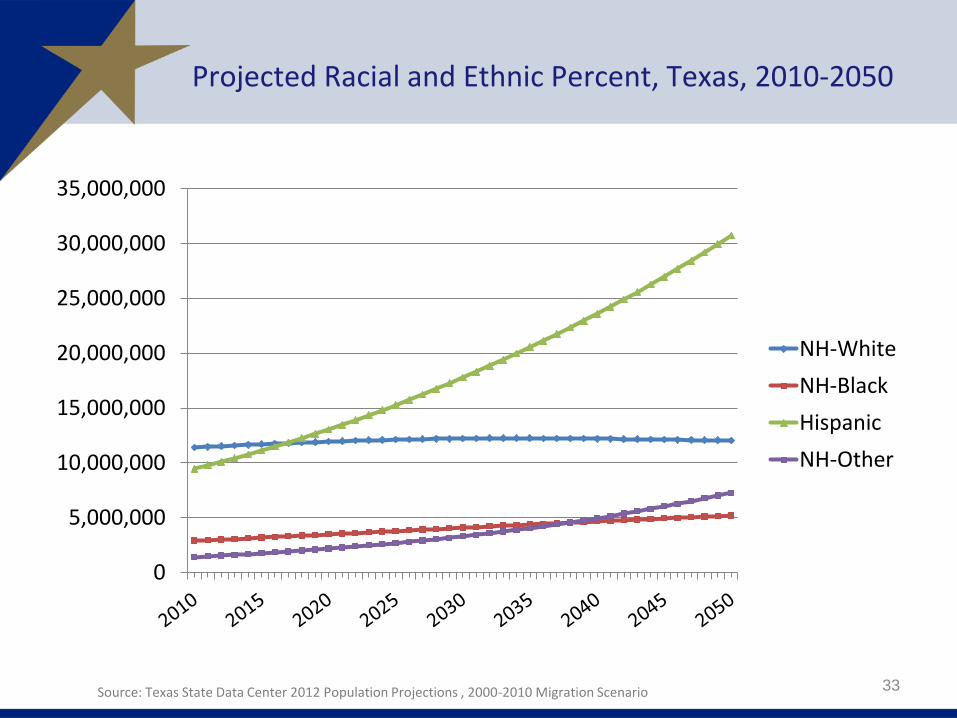
Projected Racial and Ethnic Percent, Texas, 2010-2050
0
5,000,000
10,000,000
15,000,000
20,000,000
25,000,000
30,000,000
35,000,000
NH-White
NH-Black
Hispanic
NH-Other
33 Source: Texas State Data Center 2012 Population Projections , 2000-2010 Migration Scenario
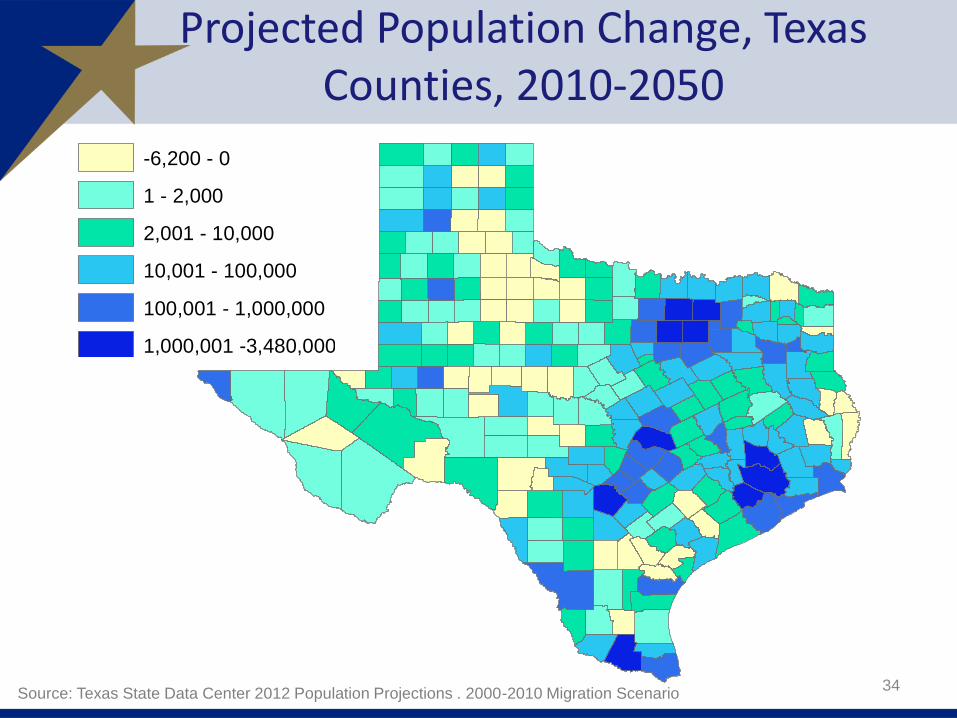
Projected Population Change, Texas Counties, 2010-2050
34 Source: Texas State Data Center 2012 Population Projections . 2000-2010 Migration Scenario
Legend
tl_2010_48_county10
F6
-6,200 - 0
1 - 2,000
2,001 - 10,000
10,001 - 100,000
100,001 - 1,000,000
1,000,001 -3,480,000
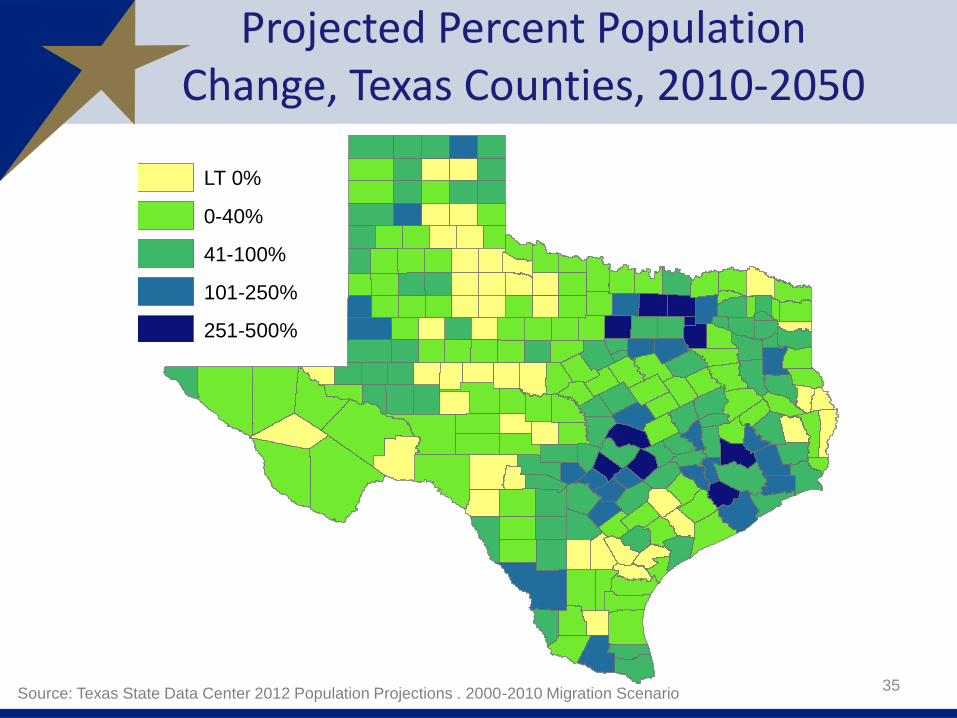
Projected Percent Population Change, Texas Counties, 2010-2050
35 Source: Texas State Data Center 2012 Population Projections . 2000-2010 Migration Scenario
Legend
tl_2010_48_county10
F5
LT 0%
0-40%
41-100%
101-250%
251-500%
36
37
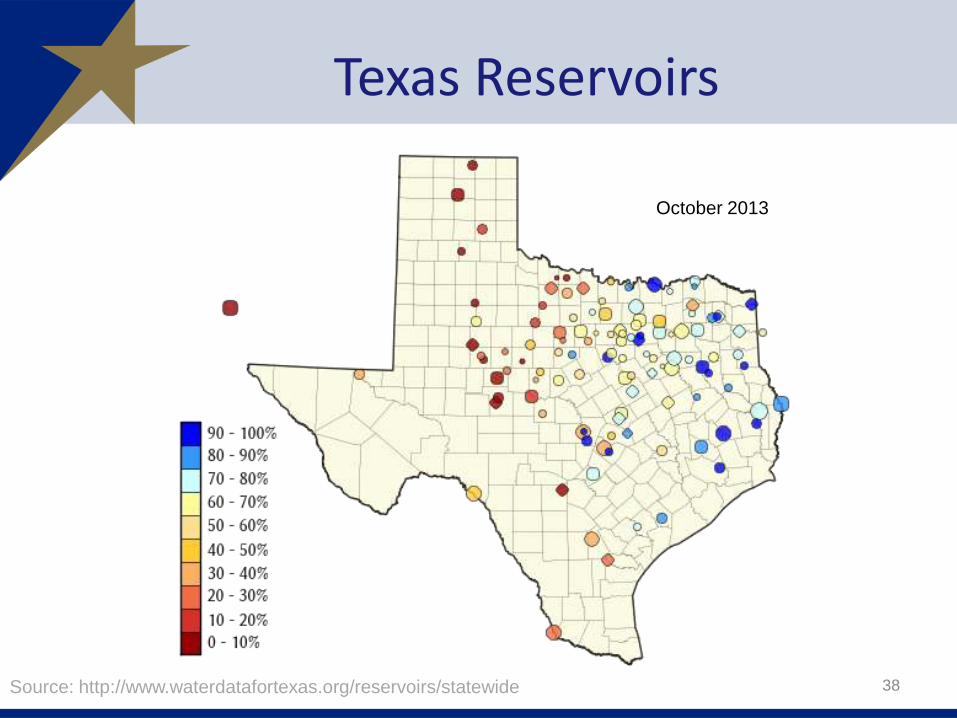
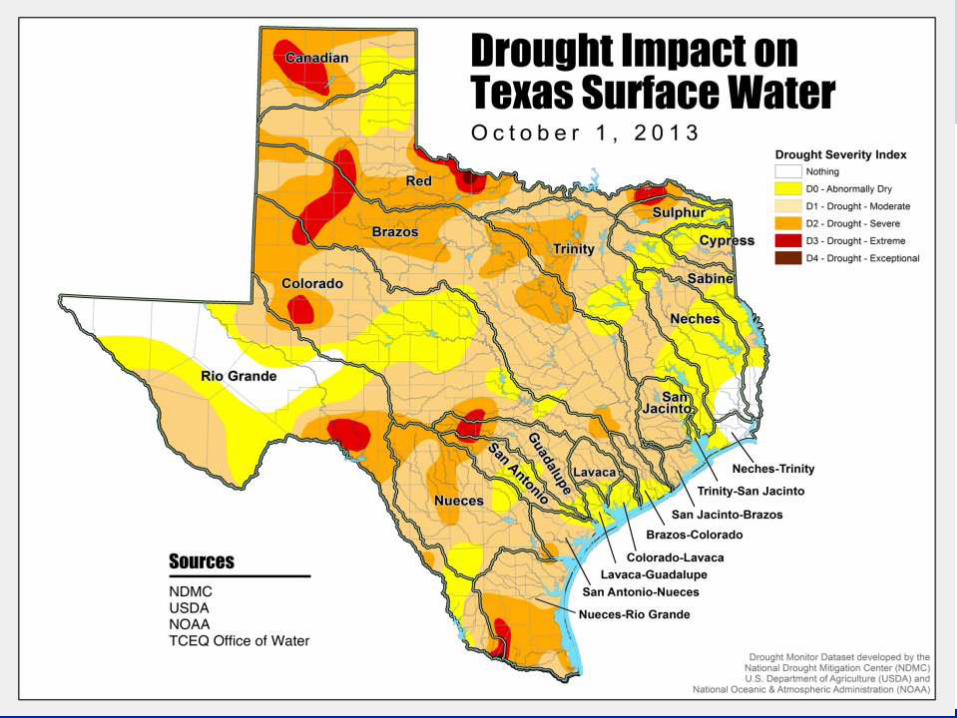
Texas Reservoirs
38 Source: http://www.waterdatafortexas.org/reservoirs/statewide
October 2013
39
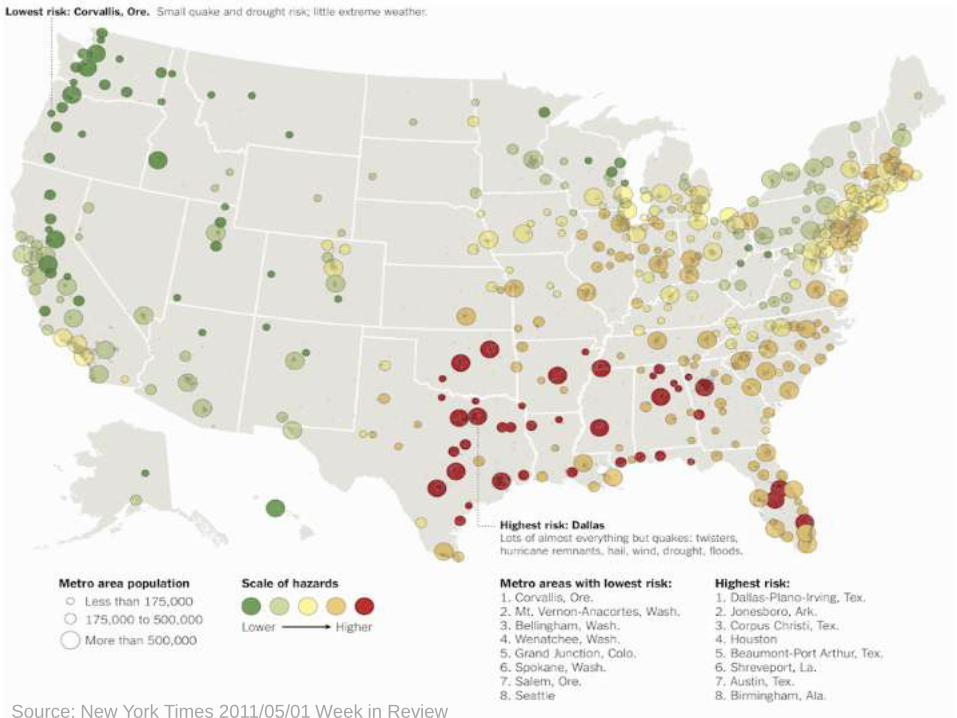
Source: New York Times 2011/05/01 Week in Review
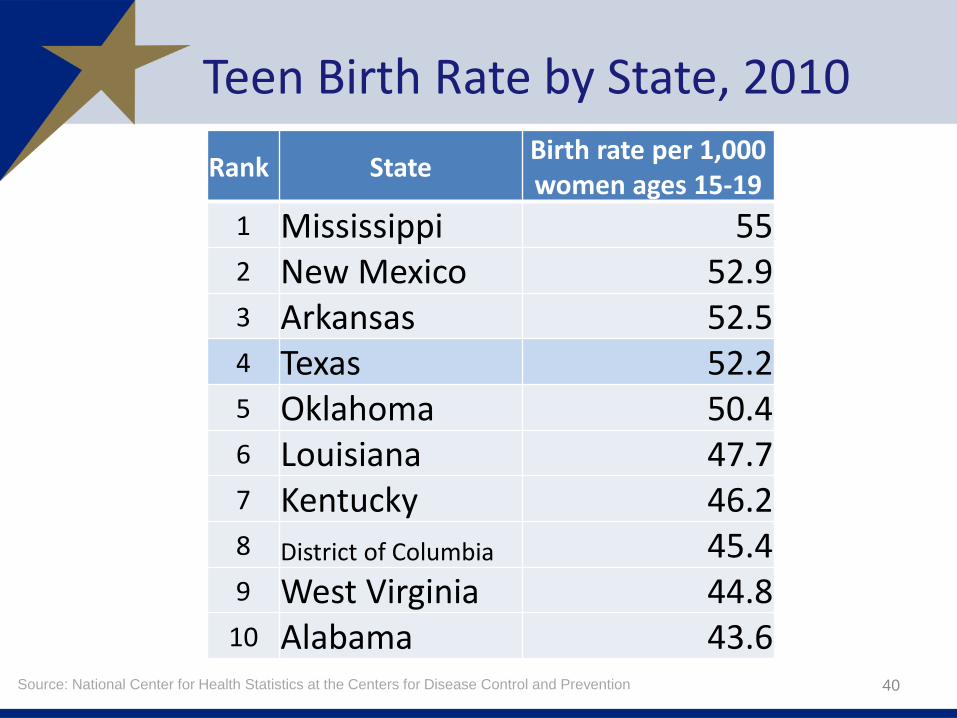
Teen Birth Rate by State, 2010
40 Source: National Center for Health Statistics at the Centers for Disease Control and Prevention
Rank State Birth rate per 1,000 women ages 15-19
1 Mississippi 55 2 New Mexico 52.9 3 Arkansas 52.5 4 Texas 52.2 5 Oklahoma 50.4 6 Louisiana 47.7 7 Kentucky 46.2 8 District of Columbia 45.4 9 West Virginia 44.8
10 Alabama 43.6
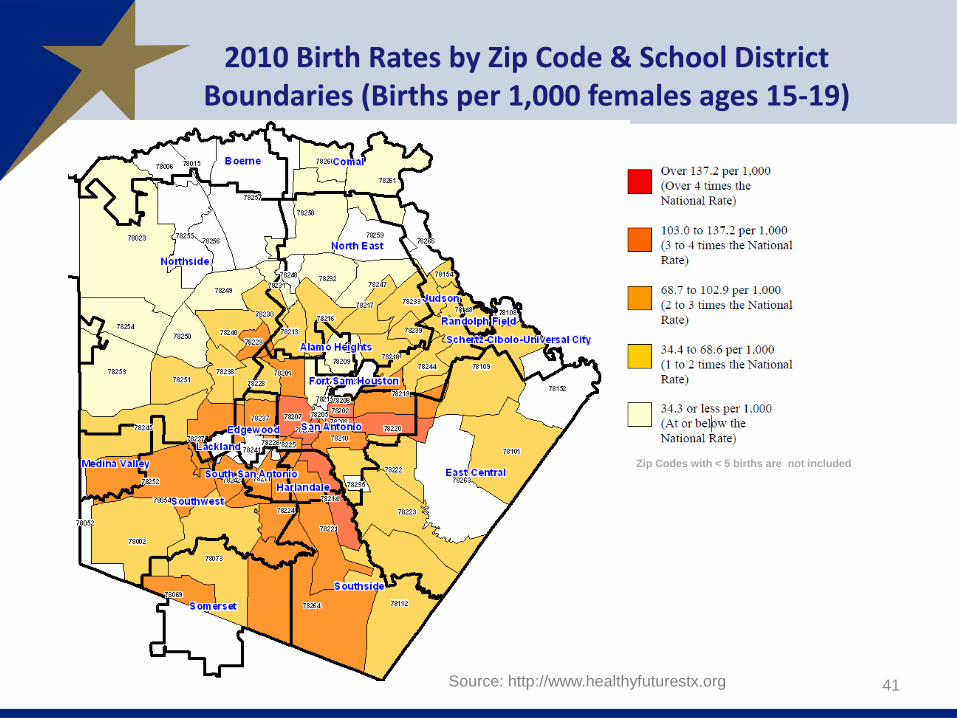
2010 Birth Rates by Zip Code & School District Boundaries (Births per 1,000 females ages 15-19)
41
Zip Codes with < 5 births are not included
Source: http://www.healthyfuturestx.org
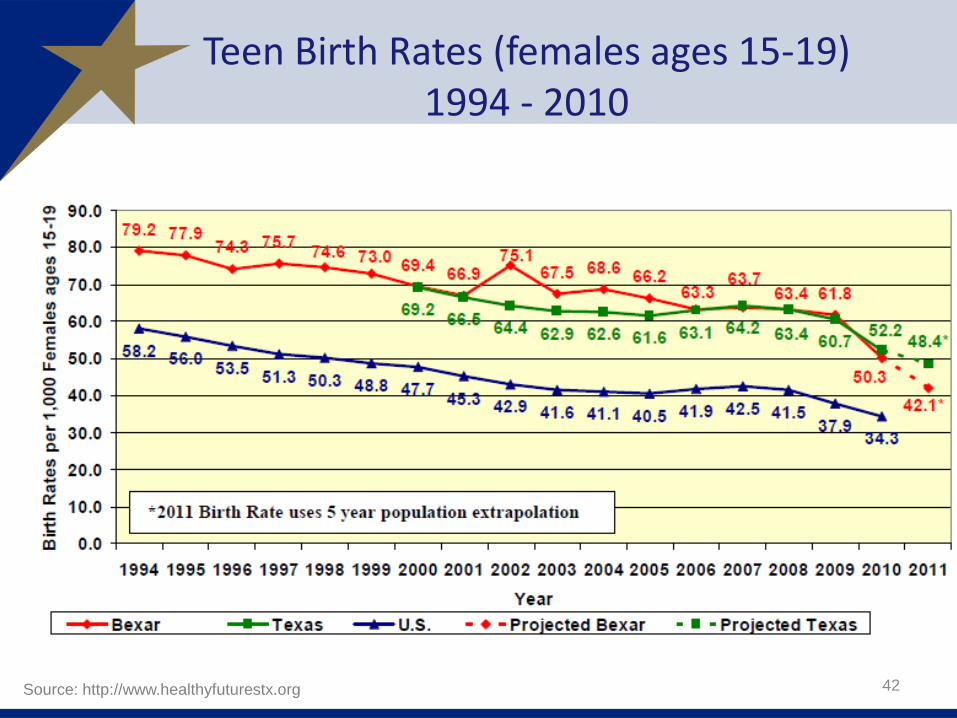
Teen Birth Rates (females ages 15-19) 1994 - 2010
42 Source: http://www.healthyfuturestx.org
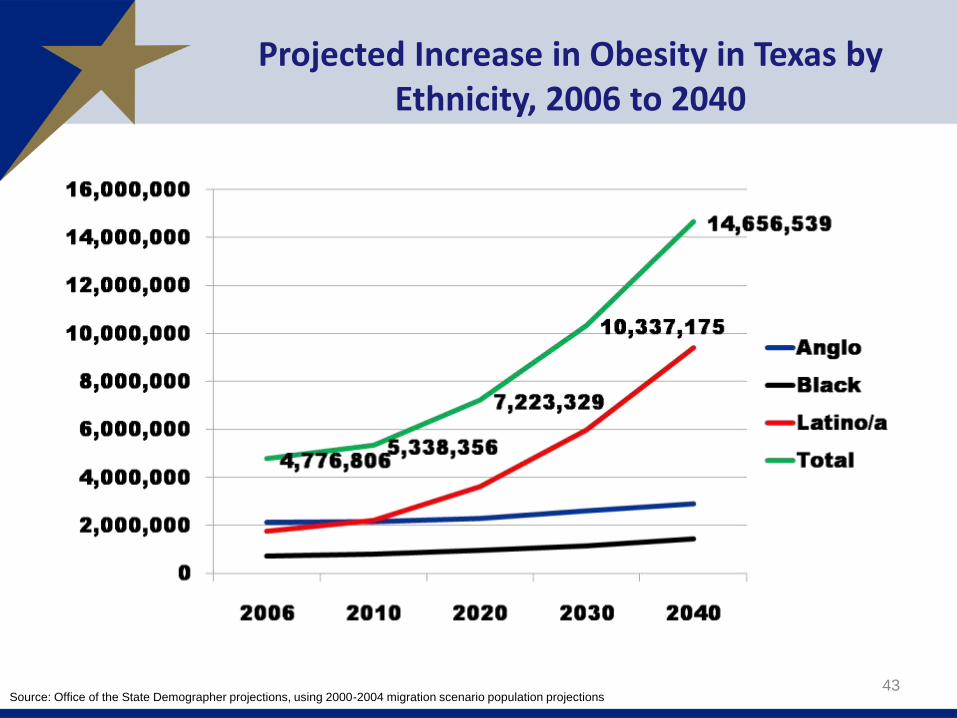
Projected Increase in Obesity in Texas by Ethnicity, 2006 to 2040
43 Source: Office of the State Demographer projections, using 2000-2004 migration scenario population projections
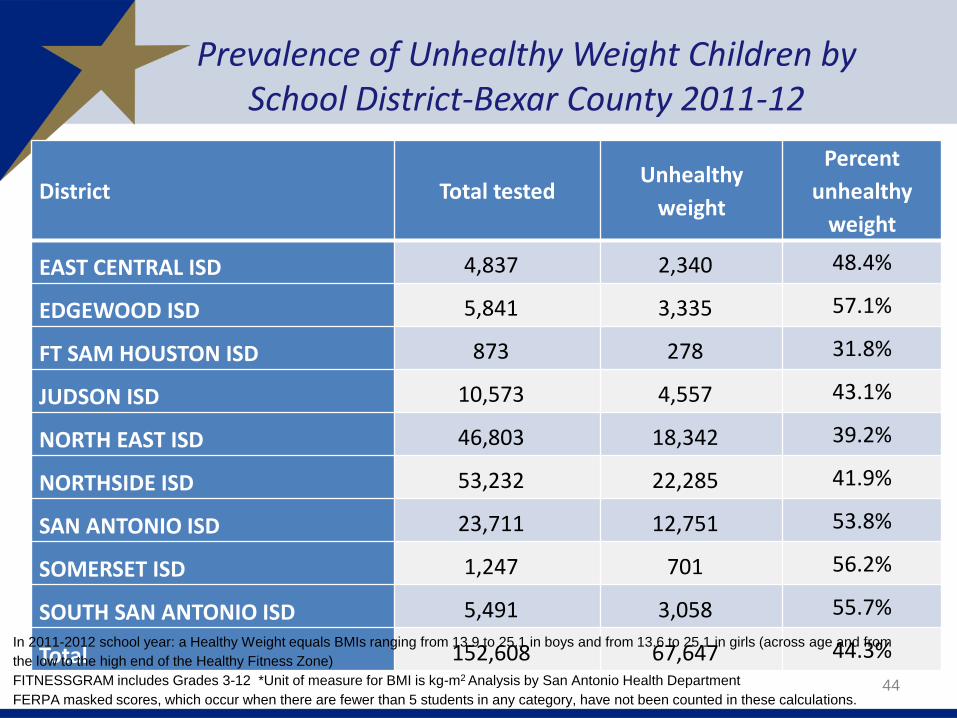
Prevalence of Unhealthy Weight Children by School District-Bexar County 2011-12
44
District Total tested Unhealthy
weight
Percent
unhealthy
weight
EAST CENTRAL ISD 4,837 2,340 48.4%
EDGEWOOD ISD 5,841 3,335 57.1%
FT SAM HOUSTON ISD 873 278 31.8%
JUDSON ISD 10,573 4,557 43.1%
NORTH EAST ISD 46,803 18,342 39.2%
NORTHSIDE ISD 53,232 22,285 41.9%
SAN ANTONIO ISD 23,711 12,751 53.8%
SOMERSET ISD 1,247 701 56.2%
SOUTH SAN ANTONIO ISD 5,491 3,058 55.7%
Total 152,608 67,647 44.3% In 2011-2012 school year: a Healthy Weight equals BMIs ranging from 13.9 to 25.1 in boys and from 13.6 to 25.1 in girls (across age and from
the low to the high end of the Healthy Fitness Zone)
FITNESSGRAM includes Grades 3-12 *Unit of measure for BMI is kg-m2 Analysis by San Antonio Health Department
FERPA masked scores, which occur when there are fewer than 5 students in any category, have not been counted in these calculations.
Demographics and Destiny
45

Contact
Office: (210) 458-6530 or (512) 463-8390
Email: [email protected]
Internet: http://osd.state.tx.us
46
Lloyd B. Potter, Ph.D.