Embed Size (px)
Citation preview
Livable Community Indicators for Sustainable Aging in PlaceMarch 2013
STUDY
Livable C
ommunity In
dicato
rs for Su
stainable A
ging in Place
The MetLife Mature Market Institute®The MetLife Mature Market Institute is Metropolitan Life Insurance Company’s (MetLife) centerof expertise in aging, longevity and the generations and is a recognized thought leader bybusiness, the media, opinion leaders and the public. The Institute’s groundbreaking research,insights, strategic partnerships and consumer education expand the knowledge and choices forthose in, approaching or working with the mature market.
The Institute supports MetLife’s long-standing commitment to identifying emerging issues andinnovative solutions for the challenges of life. MetLife, Inc. is a leading global provider ofinsurance, annuities and employee benefit programs, serving 90 million customers. Through itssubsidiaries and affiliates, MetLife holds leading market positions in the United States, Japan,Latin America, Asia, Europe, the Middle East and Africa.
For more information, please visit: www.MatureMarketInstitute.com.
200 Park AvenueNew York, NY [email protected]
Stanford Center on LongevityThe mission of the Stanford Center on Longevity is to redesign long life. The Center studies thenature and development of the human life span, looking for innovative ways to use scienceand technology to solve the problems of people over 50 in order to improve the well-being ofpeople of all ages. http://longevity.stanford.edu
Research for this report was conducted by Amanda Lehning, PhD, Postdoctoral Fellow at theUniversity of Michigan School of Social Work, and Annie Harmon, PhD Candidate, University of Michigan School of Public Health in collaboration with the Stanford Center on Longevity.
© 2013 MetLife
Insurance products: • Are Not FDIC Insured • Are Not a Condition of Any Bank Service • Are Not a Deposit Product • Offer No Bank/Affiliate Guarantee
Insurance Contracts are An Obligation Of The Issuing Insurance Company
2 Executive Summary
3 Key Findings
5 Introduction
7 Major Findings
9 Variety of Housing Options that are Accessible and Affordable
12 Features that Promote Access to the Community
16 Community Support and Services
23 Implications and Next Steps
25 Methodology
26 Appendix A: Recommendations for Future Assessment
30 Appendix B: Aging in Place Experts
31 Endnotes
Table of Contents
Executive Summary
2
Aging in place is the ability to remain in one’s own home or community in spiteof potential changes in health and functioning in later life. The concept of livablecommunities calls attention to the ways the physical, social, and economicinfrastructure of cities and towns can promote or hinder older residents’ ability to age in place. Aging in place has the potential to benefit not only older adults,but also their families, their communities, and their governments.
Sustainable aging in place involves helping older residents remain in theircommunity while also addressing the long-term economic, social, andenvironmental health of both current and future generations at every age. Basedon an extensive review of existing literature and interviews with aging in placeexperts, the MetLife Mature Market Institute in partnership with the StanfordUniversity Center on Longevity developed an initial list of indicators that can be measured using information that is readily available and adaptable to localgovernments, providing a low-cost way for local governments to begin toexamine the specific needs of their aging population. These indicators reflect aframework of how livable community characteristics influence aging in place.
• A livable community offers a variety of accessible, affordable, and visitable housing options so that olderadults have a place to live.
• A livable community has features that promote access to the community, including:
– Safe and walkable neighborhoods
– Transportation options
– Safe driving conditions
– Emergency preparedness
• A livable community provides a wide range of supports and services, and opportunities to participate in community life:
– Health care
– Supportive services
– General retail and services
– Healthy food
– Social integration
In recent years, a number of organizations have developed checklists and guidesdescribing the characteristics that could make a community more livable andfacilitative of elder health, well-being, and the ability to age in place. The indicatorsystem presented in this report differs from previous work in a number of ways:
• First, this indicator system was developed using existing research, rather thanthe preferences of older adults.
• Second, this indicator system is relatively low cost for the user, as it iscomprised of information that local governments can access through existingdata sources rather than incurring the costs and labor of collectinginformation directly from community residents.
• Third, this indicator system describes how the various characteristics of acommunity operate in relation to one another, rather than simply providing a list of community characteristics.
The characteristics in this indicator system include a variety of physical and socialfeatures that could create more livable communities and facilitate sustainableaging in place for older residents, as well as improve the quality of life forresidents of all ages. Each community should consider adapting the indicators to best meet the needs of their population. These indicators are a first steptowards understanding how community characteristics can help current andfuture generations of older adults stay in their homes and communities as longas possible. The indicators also point to characteristics that may need to bemodified. Strategies to achieve change include adopting incremental changes,focusing initially on low-cost policies and programs, and partnering with other stakeholders.
Key Findings
• Community characteristics that promote aging in place have the potential tolead to positive outcomes for the entire population. This includes improvingthe health and well-being of older adults, and benefiting other residents,businesses, organizations, and local governments by, for example, fosteringthe economic and environmental health of the community.
• The major challenge to developing an indicator system for livablecommunities is the lack of existing data at the local (e.g., city or town) level.While additional data may be available for the county, metropolitan area, orstate levels, these data may not provide an accurate assessment of what ishappening in the community.
> Livable Community Indicators for Sustainable Aging in Place
3
4
Executive Summary
• Every community is unique, and therefore local governments should thinkabout how to adapt these indicators to best meet the needs of their residents.One way in which communities differ is in terms of their population density,and the relevance of each indicator may vary depending on whether thecommunity is urban, suburban or rural.
• As an initial assessment, this indicator system primarily focuses on theexistence of goods, services, and infrastructure that the existing empiricalliterature and aging in place experts suggest may be particularly promisingstrategies for promoting sustainable aging in place. In many communities,understanding the ability of older adults to access these features and thedegree to which these features are used to actually meet their needs willrequire additional data collection.
• Thinking about all of the community characteristics that can create morelivable communities can be overwhelming, particularly at a time when localgovernments are struggling financially.
– One strategy is to implement these changes incrementally.
– A second strategy is to focus on changes that are relatively low cost.
– A third strategy is to enlist the participation of other stakeholders,including private businesses, non-profit organizations, and communityresidents.
– Finally, local governments can remove barriers to the efforts of othergroups to create more livable communities.
Introduction
Aging in place is the ability to remain in one’s own home or community in spite ofpotential changes in health and functioning in later life. Aging in place hasreceived an increasing amount of attention in recent years. This is due to anumber of factors, including the aging of the population, a potential increase inchronic disease and disability in future cohorts of older adults, and an inadequateU.S. long-term care system. Furthermore, a survey by AARP in 20031 and anothersurvey by the AdvantAge Initiative in 20042 demonstrated that an overwhelmingmajority of adults would like to remain in their own homes for as long as possible.
In response to this growing interest in aging in place, the public, nonprofit, and for-profit sectors have developed a number of policies and services to helpolder adults remain in their homes and communities. The Older Americans Actreauthorization of 2006, for example, included funding for the CommunityInnovations for Aging in Place Initiative, which awarded grants to communityorganizations to identify strategies that support aging in place. Nonprofitorganizations across the country are starting Village programs, NaturallyOccurring Retirement Community Supportive Service Programs (NORC-SSPs), and other innovative programs that aim to help older adults age in place.Homebuilders, designers, realtors, and reverse mortgage specialists, amongothers, have become Certified Aging-in-Place Specialists through a program ofthe National Association of Home Builders.
All of these policies and services are, to varying degrees, aiming to create morelivable communities. A livable community is one in which residents of all ages areable to maintain independence and enjoy a high quality of life.3 The concept oflivable communities calls attention to the ways in which the physical, social, andeconomic infrastructure of cities and towns can help or hinder older residents’ability to remain in their own homes and communities. Local governments havean important part to play, along with the nonprofit and private sectors andresidents themselves, in making existing communities more livable.
Aging in place can benefit older adults, their families, their communities, andtheir governments. The benefits of aging in place for older adults come from thesense of attachment, familiarity, and identity with the home and neighborhoodenvironment.4 Research shows that relocating to a nursing home can reducequality of life and increase mortality risk for older adults5 and lead to moremental distress for their family caregivers.6 Aging in place is also believed to beless expensive than institutional long-term care for older adults, their families,and governments.7 Efforts to help older adults age in place can also potentiallyimprove the community as a whole. For example, older adults can make valuablecontributions to community life as neighbors, caregivers, and volunteers.
5
> Livable Community Indicators for Sustainable Aging in Place
6
Executive Summary
Often, older adults who chose to relocate after retirement are younger,healthier and wealthier.8 Policies and programs to help older adults age in placemay encourage this segment of the older adult population to remain in theircurrent community rather than moving away. Finally, many of the communitychanges that could help older adults age in place will also benefit youngerresidents and promote the economic and environmental health of thecommunity. For example, walkable neighborhoods encourage physical activityand create safer neighborhoods for individuals of all ages.
This report presents an indicator system for livable community characteristics thatcould promote sustainable aging in place. Sustainable aging in place involveshelping older residents remain in their communities while also addressing thelong-term economic, social, and environmental health of both current and futuregenerations at every age. The indicators in this report are based on an extensivereview of the research literature and existing checklists, as well as interviews withaging in place experts across the country. The goal is to identify an initial list ofindicators that can be measured using information that is readily available tolocal governments, providing a low-cost way for cities and towns to begin toexamine the needs of their aging population.
Specific criteria for the indicators include:
• Strength of research evidence
• Strength of support by aging in place experts
• Ability to measure the indicator using existing data sources, including U.S.Census data, federal administrative data, and information at the local levelregarding the presence or absence of policies and programs
• Potential for multiple benefits, such as for the economic and environmentalhealth of the community or for residents of other age groups
• Degree of adaptability to different types of communities, such as urban,suburban, and rural communities
The hope is that these indicators will help local governments identify areas forpolicy and programmatic intervention, as well as offer guidance for additionaldata collection directly from older adults and other stakeholders to betterunderstand the particular community’s facilitators and barriers to aging in place.
7
Aging in place first requires that older adults have a place to live. Ideally, thecommunity should offer a wide array of housing options that are accessible tothose with disabilities and affordable to those with varying incomes and assetssuch as single family homes, apartments, senior housing, assisted living, andaccessory dwelling units (ADUs).
Second, older residents need to be able to access the supports and servicesavailable in the community, whether by leaving their homes and venturing outinto the community or by bringing these supports and services into their ownhomes. Offering a range of mobility options, including public transportation,senior transportation, and walkable neighborhoods, and ensuring that allresidents feel safe in their neighborhoods can improve the connections betweenthe older residents and their communities.
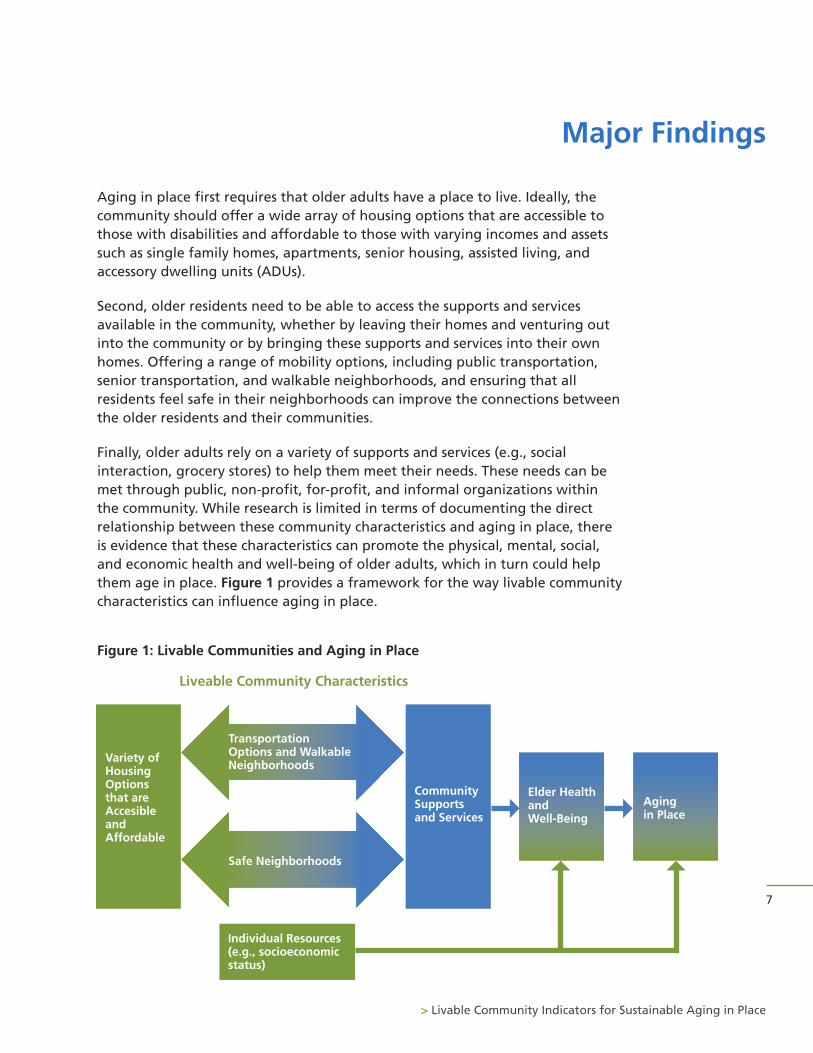
Finally, older adults rely on a variety of supports and services (e.g., socialinteraction, grocery stores) to help them meet their needs. These needs can bemet through public, non-profit, for-profit, and informal organizations withinthe community. While research is limited in terms of documenting the directrelationship between these community characteristics and aging in place, thereis evidence that these characteristics can promote the physical, mental, social,and economic health and well-being of older adults, which in turn could helpthem age in place. Figure 1 provides a framework for the way livable communitycharacteristics can influence aging in place.
Figure 1: Livable Communities and Aging in Place
Major Findings
Variety of Housing Options that are Accesible and Affordable
Liveable Community Characteristics
Community Supports and Services
Elder Healthand Well-Being
Agingin Place
Individual Resources(e.g., socioeconomicstatus)
Transportation Options and Walkable Neighborhoods
Safe Neighborhoods
> Livable Community Indicators for Sustainable Aging in Place
8
Major Findings
This livable community indicator system does not address all of the factors thatcontribute to older adults’ ability to age in place. First, the indicator systemfocuses on the physical and social features of the community, and not onindividual health, social, and financial resources. As shown in Figure 1, theseresources can directly affect elder health, well-being, and the ability to age inplace. For example, older adults with limited income and assets may be at amuch higher risk of not aging in place because they are unable to purchase thegoods and services that allow them to remain independent.
Alternatively, they may be more likely to age in place because they lack theresources necessary to move, and therefore are at risk of living under conditionsthat do not promote their health and well-being, including neighborhoodscharacterized by high crime and social disorder or with limited access to healthyfoods. Also, while these indicators measure the presence or absence of particularlivable community features, equally important is whether older adults haveaccess to these features and whether they are actually using them. For example,the presence of home modification services, which can be assessed using existingdata, is one potential indicator that older residents with disabilities will be ableto adapt their housing and therefore remain in their homes. Understanding ifolder residents have access to these services will require additional assessment ofthe costs of these services and whether older adults are even aware that theyexist. Additional assessment will also be necessary to ascertain whether olderadults with disabilities are using these services, or if many older residents havean unmet need for home modifications.
This report presents an indicator system of the livable communitycharacteristics that could facilitate aging in place. Each section includes arationale for the inclusion of each characteristic, a brief summary of theempirical evidence supporting its linkage to the health and well-being ofolder adults, and a description of the specific indicators. This indicatorsystem is an initial step towards understanding community-level influenceson aging in place, and providing recommendations for specific areas offuture assessment can be found in Appendix A.
9
Variety of Housing Options that are Accessible and Affordable
Housing that is accessible, affordable, and adaptable to changing needs over thelife span is a critical component of a livable community.
Accessible/Visitable Housing
The majority of housing in the U.S. does not include physical features (zero-stepentrance, wider doors and wider hallways, and at least a half bathroom on theground floor9) that improve accessibility or visitability for individuals withimpairments or disabilities. For example, nearly one-quarter of disabled olderadults report an unmet need for dwelling modifications.10 Design features thatsupport independent living include a driveway or parking space immediatelyoutside the home, a bedroom on the main level, an attached garage or covered
> Livable Community Indicators for Sustainable Aging in Place
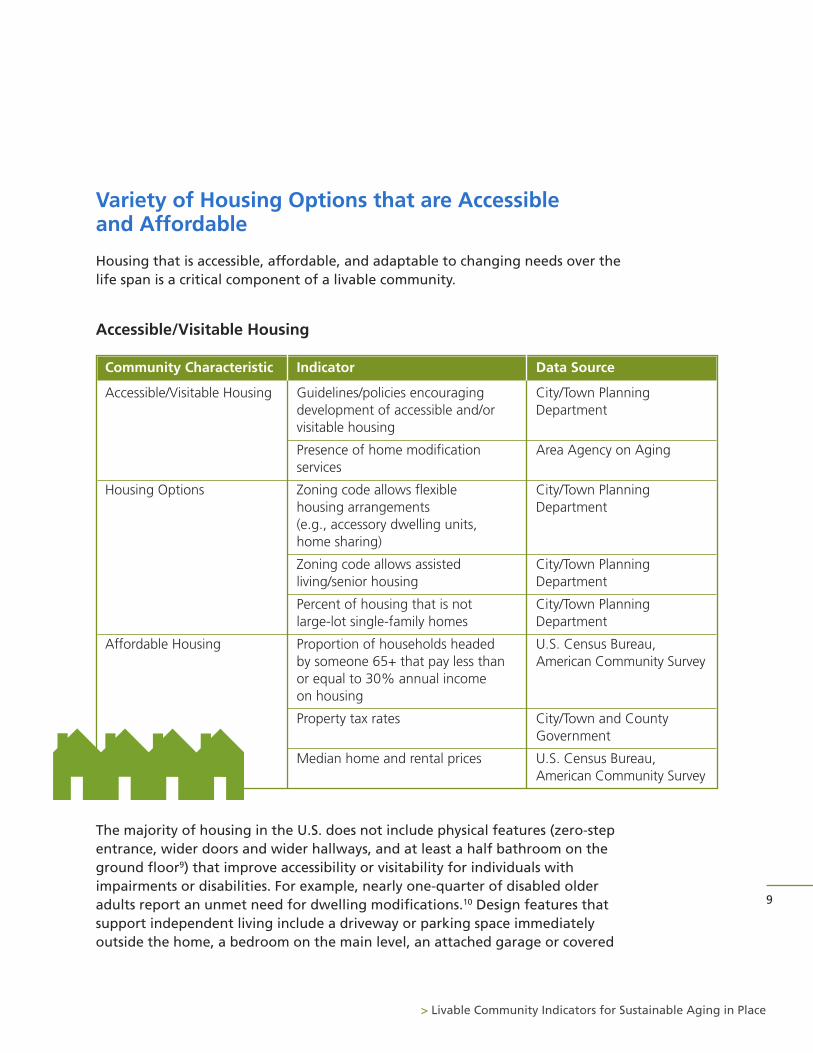
Community Characteristic Indicator Data Source
Accessible/Visitable Housing Guidelines/policies encouraging City/Town Planning development of accessible and/or Departmentvisitable housing
Presence of home modification Area Agency on Agingservices
Housing Options Zoning code allows flexible City/Town Planninghousing arrangements Department(e.g., accessory dwelling units, home sharing)
Zoning code allows assisted City/Town Planningliving/senior housing Department
Percent of housing that is not City/Town Planninglarge-lot single-family homes Department
Affordable Housing Proportion of households headed U.S. Census Bureau, by someone 65+ that pay less than American Community Surveyor equal to 30% annual income on housing
Property tax rates City/Town and CountyGovernment
Median home and rental prices U.S. Census Bureau, American Community Survey
10
Major Findings
parking, bathroom aids, and lever door handles.11 Housing that has not beenmodified could result in pain, depression and fear of accidents for disabledpeople, and back injuries, falls and stress for caregivers.12 In contrast, homemodifications to improve accessibility could decrease Medicare expenditures13
and prevent a decline in physical health.14
Currently, it is difficult to determine the percentageof a town or city’s housing that includes accessibilityand/or visitability features using available data.However, one indicator is whether the municipalplanning department has policies or guidelinesencouraging the incorporation of these features intonew housing. The city of Irvine in California, forexample, adopted a voluntary visitability policy in2000. The city provides new homebuyers with a formdetailing visitability features and their associated
costs, and also encourages builders to distribute a brochure on accessible homefeatures to prospective homebuyers. While this policy appears to have littleeffect on homebuyers, there is evidence that builders are now making manyvisitability features standard in newly constructed homes.15 A second indicator iswhether there are home modification services available in the community, whichcan be assessed by contacting the local Area Agency on Aging.
Housing Options
Zoning in many communities, particularly those in suburban areas, limits thehousing options available to older adults. Zoning protects single-family housingprimarily by restricting land use to single-family dwellings through two types of provisions:
• Occupancy restrictions limiting use to a single ‘family’ and the manner bywhich each particular ordinance defines ‘family’ and
• Regulations limiting land use to only one single-family home per lot.16
Housing policy experts have called for governments to promote alternativehousing models such as accessory dwelling units (ADUs, a self-contained livingunit built into or attached to an existing single family dwelling), shared housing(co-residence of unrelated individuals within one housing unit), and co-housingthat includes the elderly.17
The majority of housing in the U.S.
does not include physical features
that improve accessibility or
visitability for individuals with
impairments or disabilities.
Initial indicators of housing options rely on information from the localgovernment planning department, such as the existence of zoning ordinancesthat permit flexible housing arrangements. For example, Seattle, Washington,has permitted the creation of ADUs in new and existing housing since 1994. Thelaw requires that the owner of the property have permanent residence in atleast one of the units on the property, limits the addition of only one ADU to asingle-family home, and restricts the total number of residents to eight if thepeople occupying the two units are not related, among other stipulations. Anevaluation of the law between 1994 and 1998 showed that it increased the agediversity of many neighborhoods, since many of the new ADUs were occupied byeither younger or older adults.18 An additional indicator is the presence ofpolicies allowing for the development of senior housing and assisted livingfacilities. A third indicator is the percent of housing that is not single-familyhomes but instead multi-family rental or owner-occupied housing.
Affordable Housing
In a recent survey, slightly more than half of olderadults reported that they spend more than 30% oftheir income on housing, suggesting thataffordable housing could be a major barrier toaging in place.19 In the same survey, more thanone-third expressed that they are not confidenttheir current home will remain affordable as theyage. Those elders who are unable to cover theirhousing costs may be at an increased risk forunwanted relocation to other housingarrangements, including low-cost housing, grouphomes, co-residing with relatives, or for those withserious health conditions or disabilities, a nursinghome. It is possible that those who do not live in affordable housing are also lesslikely to be able to pay for home maintenance or modifications, and thereforemay be living in unsafe conditions. About 29% of U.S. homeowners age 65 andover live in homes built before 1950. These older buildings may require moremaintenance, and research suggests they are less likely to contain dwellingmodifications.20
Indicators of affordable housing include the percent of older households that payless than 30% of their income on housing, median home prices, and median rentalprices. The American Community Survey, collected by the U.S. Census Bureau,includes data on these indicators. Additionally, the property tax rates levied by thecity, town, and/or county governments are an indicator of housing affordability.
11
> Livable Community Indicators for Sustainable Aging in Place
Seattle, Washington, has permitted
the creation of ADUs in new and
existing housing since 1994. An
evaluation of the law between
1994 and 1998 showed that it
increased the age diversity of many
neighborhoods, since many of the
new ADUs were occupied by either
younger or older adults.18
12
Major Findings
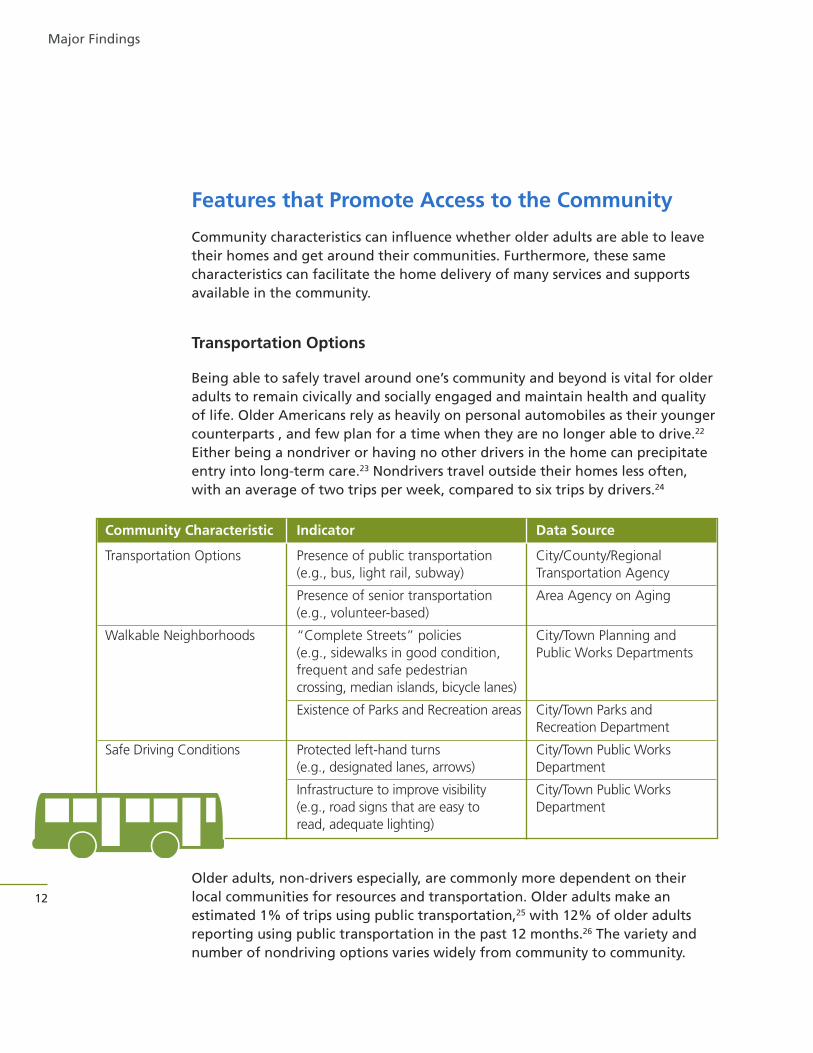
Features that Promote Access to the Community
Community characteristics can influence whether older adults are able to leavetheir homes and get around their communities. Furthermore, these samecharacteristics can facilitate the home delivery of many services and supportsavailable in the community.
Transportation Options
Being able to safely travel around one’s community and beyond is vital for olderadults to remain civically and socially engaged and maintain health and qualityof life. Older Americans rely as heavily on personal automobiles as their youngercounterparts , and few plan for a time when they are no longer able to drive.22
Either being a nondriver or having no other drivers in the home can precipitateentry into long-term care.23 Nondrivers travel outside their homes less often,with an average of two trips per week, compared to six trips by drivers.24
Older adults, non-drivers especially, are commonly more dependent on theirlocal communities for resources and transportation. Older adults make anestimated 1% of trips using public transportation,25 with 12% of older adultsreporting using public transportation in the past 12 months.26 The variety andnumber of nondriving options varies widely from community to community.
Community Characteristic Indicator Data Source
Transportation Options Presence of public transportation City/County/Regional(e.g., bus, light rail, subway) Transportation Agency
Presence of senior transportation Area Agency on Aging(e.g., volunteer-based)
Walkable Neighborhoods “Complete Streets” policies City/Town Planning and(e.g., sidewalks in good condition, Public Works Departmentsfrequent and safe pedestrian crossing, median islands, bicycle lanes)
Existence of Parks and Recreation areas City/Town Parks andRecreation Department
Safe Driving Conditions Protected left-hand turns City/Town Public Works(e.g., designated lanes, arrows) Department
Infrastructure to improve visibility City/Town Public Works(e.g., road signs that are easy to Departmentread, adequate lighting)
In addition, the Beverly Foundation points outthat it is not only the availability of such services that is crucial, but also theiraccessibility, acceptability, affordability, andadaptability to diverse needs of the riders.
These are known as the five A’s of senior-friendly transportation,27 and in manycommunities will need to be assessed throughadditional data collection. The failure toprovide these features may account for therelatively small number of trips by older adultsmade via public or alternative transportation.Furthermore, these improvements to publictransportation systems could increase safety,comfort, and ridership by residents of all ages.
Indicators for community transportation options are measured by examining thepresence of choices other than driving. Having access to public transportation(buses, trains, light rail, etc.) or alternative senior transportation options (usuallysmaller vehicles with more flexible schedules and routes) can offer ways for olderadults to meet their needs and wants outside of driving. Some communitiesalready use creative solutions to improve the transportation options for olderresidents. In New Hampshire, the Grafton County Senior Citizens Council, Inc. helpsseniors meet their medical, shopping, and socialneeds by providing on-demand transportationthroughout the 1,800 square miles of their ruralcommunity using paid and volunteer drivers.28 Thisservice is available to all older residents through theclosest senior center, and has no set fee, althoughcontributions are requested.
Walkable Neighborhoods
Walking is not only an important mode oftransportation for those who do not own or areunable to drive a car, but is also the preferred formof exercise for older adults. Regular walking canresult in a number of positive outcomes, including the prevention of healthproblems such as cognitive impairment and mobility limitations.29,30
13
> Livable Community Indicators for Sustainable Aging in Place
In New Hampshire, the Grafton
County Senior Citizens Council, Inc.
helps seniors meet their medical,
shopping, and social needs by
providing on-demand transportation
throughout the 1,800 square miles of
their rural community using paid and
volunteer drivers.28
The Five A’s of Age-FriendlyTransportation
• Availability
• Accessibility
• Acceptability
• Affordability
• Adaptability to diverse needs
These improvements to public
transportation systems could
increase safety, comfort, and
ridership for all ages.
14
Major Findings
Many neighborhoods, however, are not designed for the enjoyment and safety of pedestrians. Older adults who live in neighborhoods without properlymaintained sidewalks, parks, curb cuts, or places to sit and rest tend to have moredisabilities.31 Furthermore, sidewalks that are uneven, too narrow, or hard tomove through because of physical barriers, such as trash cans or overgrownweeds, are responsible for most outdoor falls among older adults.32
One indicator of walkability is whether the city or town planning and/or publicworks department has adopted Complete Streets policies and infrastructurechanges. Complete Streets policies are guided by three principles:
1) reducing vehicle travel speeds, particularly in areas used by both automobilesand pedestrians
2) improving the physical layout of streets to make it easier for drivers andpedestrians to navigate; and
3) enhancing visual cues and information for drivers and pedestrians.33
Specific infrastructure changes to improve walkability include sidewalk repair,widening existing sidewalks to improve accessibility for those who usewheelchairs, new pedestrian pathways or sidewalks, improved street lighting,
and traffic calming measures (e.g., narrowinglanes, raised crosswalks, and speed humps). Forexample, in 2009 the mayor of Philadelphiasigned a Complete Streets Executive Order, whichdirects all city agencies and departments to giveconsideration to the needs and safety of all usersof city streets when planning, designing,constructing, maintaining or operatingtransportation infrastructure.34 A secondindicator is whether the community has parks orrecreation areas where people of all ages canwalk and participate in physical activities.
Safe Driving Conditions
Currently, approximately four out of five Americans over the age of 65 aredrivers.35 By 2020, an estimated 80% of US population will be or will have beenlicensed drivers, with 60-90% of women and 100% of men driving as they enterretirement.36 Older drivers rely heavily on driving to get around their communities,and express little to no interest in giving up that piece of their independence.
In 2009, the mayor of Philadelphia
signed a Complete Streets Executive
Order, which directs all city agencies and
departments to give consideration to
the needs and safety of all users of city
streets when planning, designing,
constructing, maintaining or operating
transportation infrastructure.34
Given the range of negative physical, mental, and social outcomes associatedwith driving cessation,37,38,39 it is understandable why older Americans wish todrive as long as possible. However, certain physical and cognitive changes thatcan occur with age can make it more challenging to continue driving safely.These include worsening eyesight, which can make it difficult to read road signsor estimate the speed of oncoming traffic, as well as slower reaction time andphysical movements in response to the movements of other vehicles,pedestrians, and roadway impediments. Because of these changes, older driversare more likely than younger to be involved with crashes during the day, in goodweather, and at intersections (especially due to failure to yield).40
While much concern has been expressed about the dangers of older drivers, theFederal Highway Administration has set guidelines for roadway designs that canfacilitate automobile safety for drivers, passengers, and pedestrians.41,42 Indicatorsof safe driving environments include features such as designated left-hand turnlanes at stoplights with their own green arrow to protect the turning driversfrom having to cross through oncoming traffic, greater visibility and readabilityof road signs, and adequate lighting on the streets.
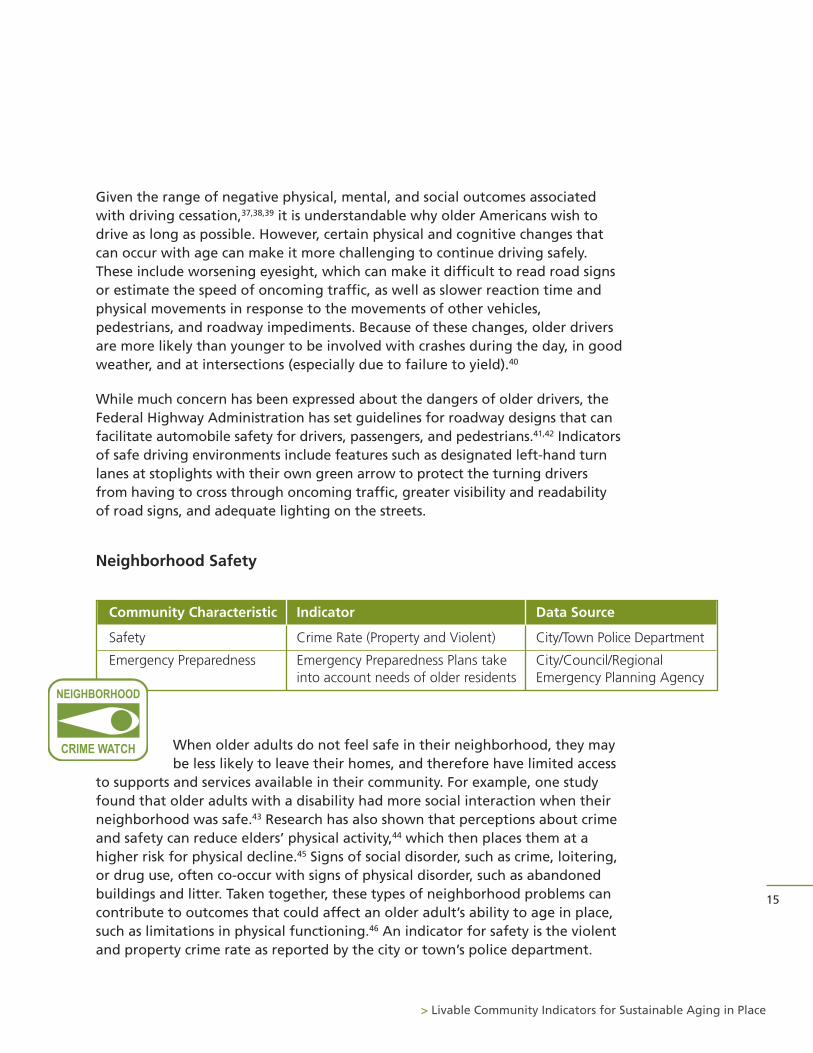
Neighborhood Safety
When older adults do not feel safe in their neighborhood, they maybe less likely to leave their homes, and therefore have limited access
to supports and services available in their community. For example, one studyfound that older adults with a disability had more social interaction when theirneighborhood was safe.43 Research has also shown that perceptions about crimeand safety can reduce elders’ physical activity,44 which then places them at ahigher risk for physical decline.45 Signs of social disorder, such as crime, loitering,or drug use, often co-occur with signs of physical disorder, such as abandonedbuildings and litter. Taken together, these types of neighborhood problems cancontribute to outcomes that could affect an older adult’s ability to age in place,such as limitations in physical functioning.46 An indicator for safety is the violentand property crime rate as reported by the city or town’s police department.
15
> Livable Community Indicators for Sustainable Aging in Place
Community Characteristic Indicator Data Source
Safety Crime Rate (Property and Violent) City/Town Police Department
Emergency Preparedness Emergency Preparedness Plans take City/Council/Regionalinto account needs of older residents Emergency Planning Agency
NEIGHBORHOOD
CRIME WATCH
16
Major Findings
Emergency Preparedness
Older adults are particularly vulnerable during community disasters because oftheir higher rates of limited mobility, chronic illness, and impaired sensoryabilities, as well as social and economic constraints.47 Furthermore, older adultsmay be less likely than their younger neighbors to respond to disaster warnings.
As a result, older adults fare worse than otherage groups following incidents such asearthquakes, floods, and tornadoes, with higherrates of injury and death and lower rates ofeconomic recovery.48
An indicator for emergency preparedness iswhether the local government’s plan takes intoaccount the needs of older adults. Experts havemade a number of recommendations for disasterpreparation, including developing identificationand tracking methods for older adults and theirhealth information, providing public information
on emergency preparedness in appropriate formats for older adults,49 usingmapping systems to identify areas with high concentrations of older adults, anddeveloping an emergency plan specifically for older adults and those withdisabilities that addresses the need to transport their medications and medicalequipment.50 For example, after Hurricane Katrina in 2005, the Trinity ChristianCommunity group and the Carrollton-Hollygrove Community DevelopmentCorporation in New Orleans developed a block captain program and emergencyplanning and response guide for residents.51 Part of the block captains’responsibility is to identify community residents who may need extra assistanceduring emergencies, and they also help residents keep track of importantdocuments and medications during disasters.
Community Supports and Services
A wide range of community supports and services affect older residents’ qualityof life by helping them to meet their physical and social needs. These include theavailability of health care, support services for older adults and their caregivers,retail and other services, social integration, and opportunities to participate incommunity life.
After Hurricane Katrina in 2005, the
Trinity Christian Community group and
the Carrollton-Hollygrove Community
Development Corporation in New
Orleans developed a block captain
program and emergency planning and
response guide for residents.51
17
Health Care
Livable communities provide access to health care to support the physical andmental health of the residents. This is particularly necessary for older adults,who are more likely to live with multiple chronic conditions, such as heartdisease, diabetes, and dementia. Around 80% of older Americans have a chronichealth condition, and 50% have two or more.52 It is important to not only havethe resources for older residents to be diagnosed with and manage their existinghealth conditions, but also to provide opportunities to avoid developing newillnesses or health problems.
The number and type of health care providers in a community, as well as accessto hospitals and preventative services, can indicate how well a community is ableto meet the medical needs of its residents. Communities where there are notenough primary medical, dental, or mental health care providers are calledHealth Professional Shortage Areas (HPSAs) by the U.S. Department of Healthand Human Services. However, cities or towns that are not HPSAs can still lackadequate health care providers to meet the needs of all residents. Hospitalsprovide the resources necessary to diagnose and treat chronic illnesses, as well asaccess to the appropriate health care specialists. Having more health conditionsoften requires the care of specialists, such as geriatricians, doctors who treatprimarily older adults and physical therapists to improve or maintain strengthand flexibility. In addition, the presence of programs that reduce the risks offurther health problems, such as immunizations and fall preventions, can helpolder residents stay healthy and safe within their homes and communities.
> Livable Community Indicators for Sustainable Aging in Place
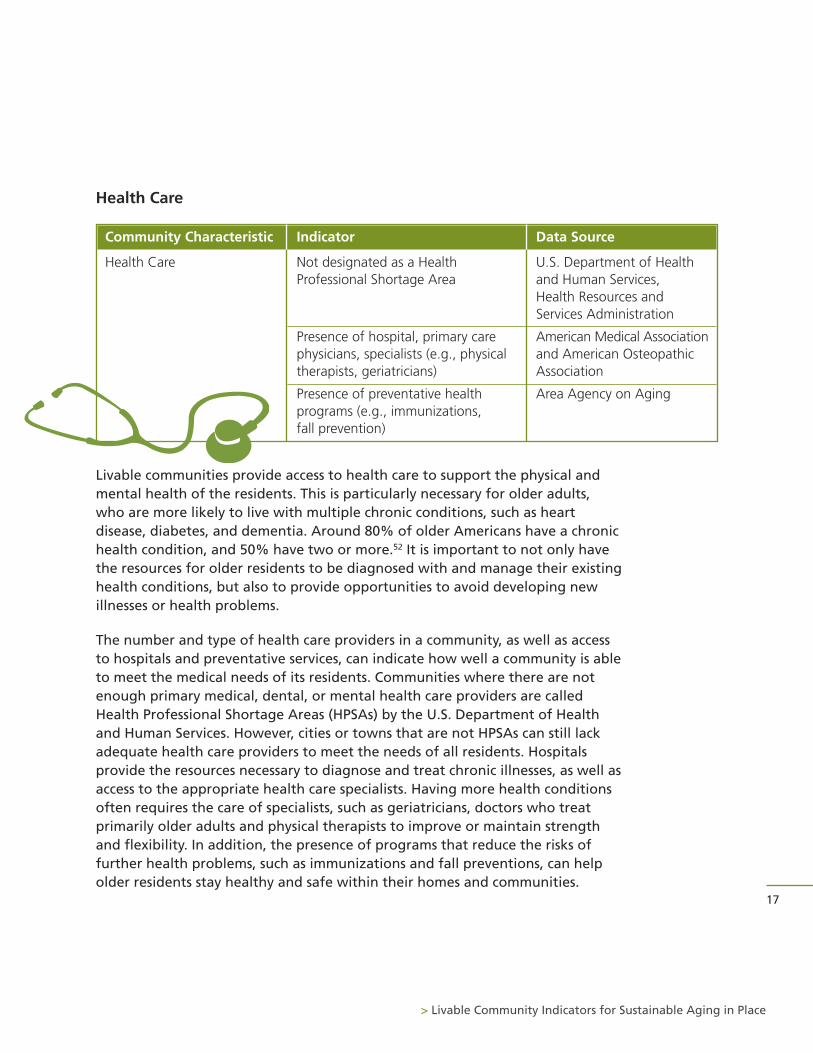
Community Characteristic Indicator Data Source
Health Care Not designated as a Health U.S. Department of HealthProfessional Shortage Area and Human Services,
Health Resources and Services Administration
Presence of hospital, primary care American Medical Associationphysicians, specialists (e.g., physical and American Osteopathic therapists, geriatricians) Association
Presence of preventative health Area Agency on Agingprograms (e.g., immunizations, fall prevention)
18
Major Findings
Many communities across the country offer A Matter of Balance. This program,developed by the Roybal Center for Enhancement of Late-Life Function atBoston University and the New England Research Institute, teaches practicalphysical and emotional coping skills to reduce fears of falling and improveactivity levels among older adults. These classes, which are facilitated byvolunteers, are effective in increasing seniors’ fall efficacy, management, andcontrol, suggesting that the program can be successful in a variety ofcommunity-based organizations without the need for professional staff.53
Supportive Services
Approximately 41% of adults age 65 and over have limitations in activities ofdaily living (e.g., eating, bathing, dressing) and instrumental activities of dailyliving (e.g., household chores, shopping, meal preparation).54 Those who reportan unmet need for assistance with daily activities experience a variety ofnegative consequences, including depression, poor health, and the need forcostly health services, such as hospitalizations and emergency room visits.55 Olderadults often require assistance from both formal and informal sources to meettheir needs. Evidence regarding the impact of home and community-basedservices (e.g., home health care, adult day health, homemaker) on aging in placeis somewhat mixed, though one study found that these services reduced the riskof nursing home placement for older adults with cognitive impairment.56
Additionally, older adults who have knowledge about the availability ofsupportive services are more likely to expect to age in place.57 The implicationsof support for informal caregivers is clearer, as research has shown that theburden of care, including hours of caregiving and the degree of difficulty ofcaregiving tasks, can lead to nursing home placement for care recipients.58
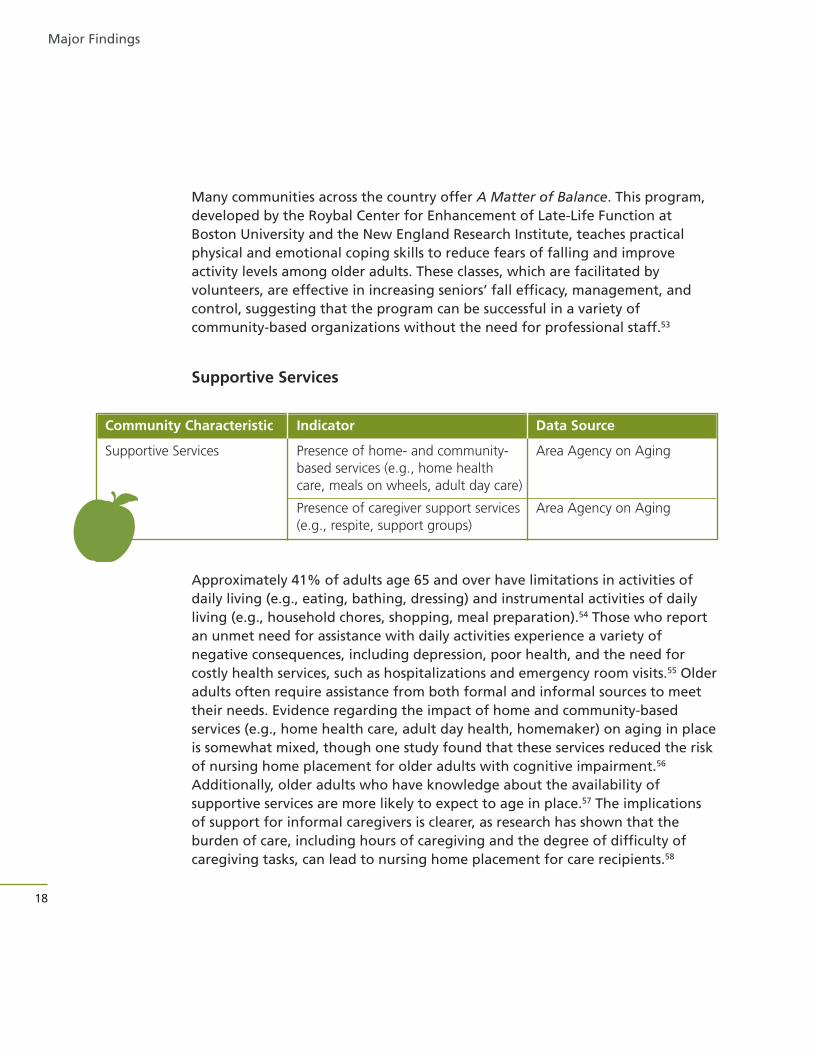
Community Characteristic Indicator Data Source
Supportive Services Presence of home- and community- Area Agency on Agingbased services (e.g., home health care, meals on wheels, adult day care)
Presence of caregiver support services Area Agency on Aging(e.g., respite, support groups)
The local Area Agency on Aging (AAA) can provide data for the two indicatorsof supportive services. The federal Older Americans Act designates AreaAgencies on Aging to develop plans and coordinate services for aging, includingthose offered through the National Family Caregiver Support Program. Themajority of Area Agencies on Aging provide information and referral assistance,and therefore have data on the location of a variety of supportive servicesoffered by public and non-profit providers in the community.
General Retail and Services
In order to age in place, older adults need accessto a variety of public and private providers ofgoods and amenities, including banks, post offices,restaurants, pharmacies, and beauty salons, amongothers. Many older adults, particularly those livingin rural or suburban areas, do not live close tobusinesses and public services. Recently there hasbeen a push for the creation of more mixed-useneighborhoods that allow businesses and homes inthe same area, as opposed to zoning policies thatrequire them to be separate. Mixed-usedevelopment allows high densities ofdevelopment, a mix of housing types, and easyaccess to a variety of destinations.
19
> Livable Community Indicators for Sustainable Aging in Place
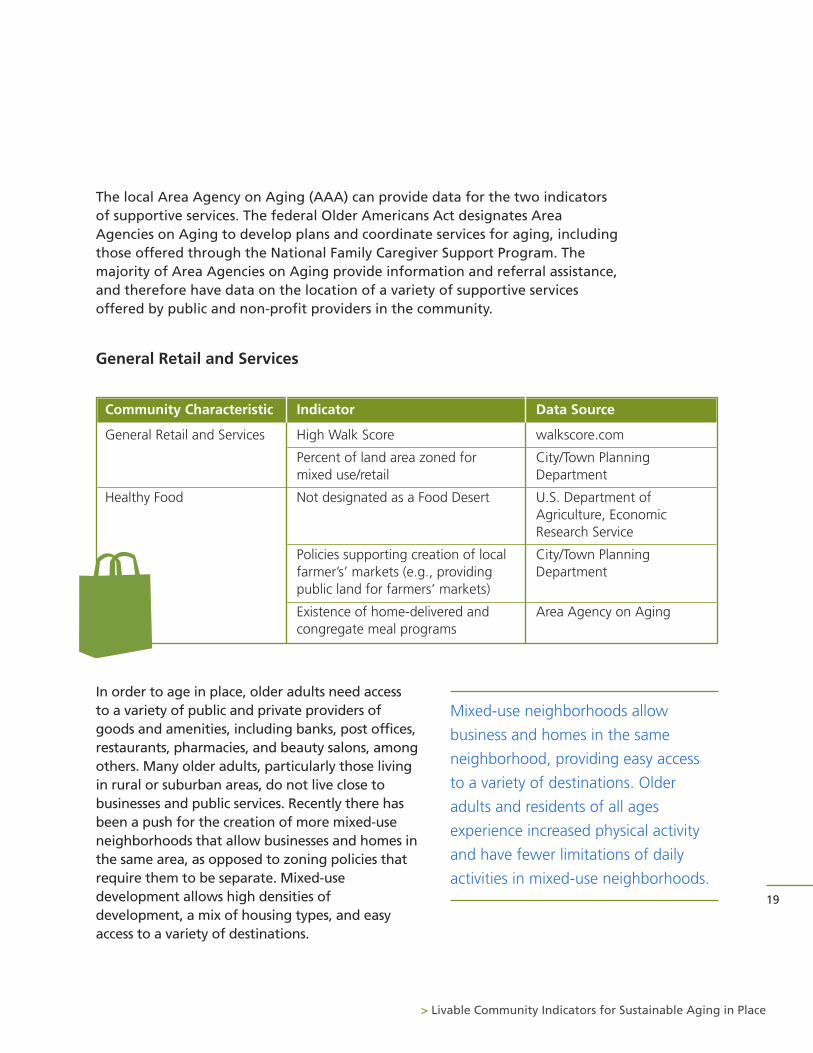
Community Characteristic Indicator Data Source
General Retail and Services High Walk Score walkscore.com
Percent of land area zoned for City/Town Planning mixed use/retail Department
Healthy Food Not designated as a Food Desert U.S. Department of Agriculture, Economic Research Service
Policies supporting creation of local City/Town Planningfarmer’s’ markets (e.g., providing Departmentpublic land for farmers’ markets)
Existence of home-delivered and Area Agency on Agingcongregate meal programs
Mixed-use neighborhoods allow
business and homes in the same
neighborhood, providing easy access
to a variety of destinations. Older
adults and residents of all ages
experience increased physical activity
and have fewer limitations of daily
activities in mixed-use neighborhoods.
Older adults who live in mixed-use neighborhoods engage in more physical activityand have fewer limitations in daily activities.59,60 Mixed use neighborhoods alsoincrease physical activity among residents of all ages,61 and therefore could promotethe health and well-being of current and future generations of older adults.
Healthy Food
Both the empirical literature and conversations with aging in place expertshighlight the particular importance of access to healthy food for aging in place.Research has demonstrated that residents of all ages who live in neighborhoodswith easy access to grocery stores, farmers markets, and other healthy foodpurveyors have healthier diets and lower rates of obesity.63
One indicator of healthy food is not being designated as a food desert by theU.S. Department of Agriculture’s Economic Research Services, which hasdeveloped an online food desert locator (www.ers.usda.gov/data-products/food-desert-locator.aspx). A food desert is defined as a low-income census tract (i.e.,has a poverty rate of at least 20% or median family income no more than 80%of the area's median family income) where a substantial number or share ofresidents has low access to a supermarket or large grocery store (i.e., at least 500people and/or at least 33% of the census tract’s population live more than onemile from a supermarket or large grocery store in urban areas or 10 miles from asupermarket in rural areas). A second indicator is whether the city or town haspolicies in place to encourage the development of farmers’ markets and grocerystores (e.g., relaxed parking requirements or increased density for grocerystores). New York City, for example, introduced the Food Retail Expansion toSupport Health (FRESH) Program in 2009. The FRESH program offers both zoningand tax incentives to grocery store developers and operators in underservedareas, with the goal of helping to create 15 new grocery stores and upgrade 10existing stores.64 A third indicator can be measured using data from the AreaAgency on Aging regarding the existence of home-delivered or group mealprograms for older adults in the community.
20
Major Findings
The first indicator of goods and amenities is the community’s scoreprovided by Walk Score (www.walkscore.com). Walk Score uses data fromGoogle, Education.com, Open Street Map, and Localeze to calculate a score (ranging from 0 to 100) based on the location of five categories ofamenities: educational, retail, food, recreational, and entertainment.62
The second indicator is the percent of the community that is zoned formixed-use development.
Social Integration
Research suggests that older adults often have smaller social networks and lesscontact with members of their networks than those at younger ages, and that theloss of social ties is predominantly with those who are not family members.65 Olderadults who are socially isolated are at risk for a number of negative outcomes,including depression,66 chronic illness,67 andmortality.68 Alternatively, being integrated intostrong social networks could protect older adultsfrom disability and functional decline.69 Having largesocial networks may increase an older adult’s abilityto receive social support or assistance with everydaytasks. Social networks also can provide opportunitiesto participate in enjoyable activities.
Social integration is a characteristic that isparticularly difficult to assess using existing datasources. One indicator is the percent of older adultswho live alone, which is available through theAmerican Community Survey. Those who live aloneare more likely to have an unmet need forassistance70 and a higher risk of moving into a nursing home.71 However, itshould be noted that those who live alone may still have large social networks.A second indicator is whether the city or town offers activities and events thatpromote intergenerational contact. The city of San Marcos in California, forexample, established the Intergenerational Community Garden Project in 2011.This initiative brings together middle school students in special education classeswith older adults who are experienced gardeners.
21
> Livable Community Indicators for Sustainable Aging in Place
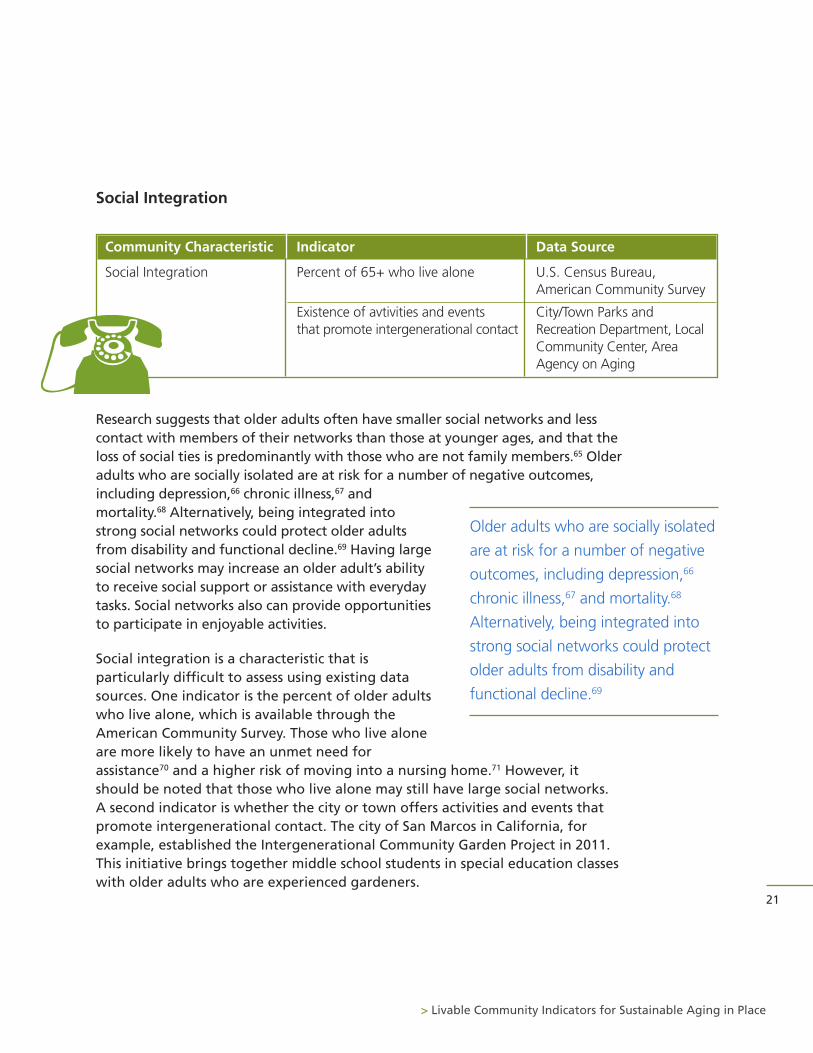
Community Characteristic Indicator Data Source
Social Integration Percent of 65+ who live alone U.S. Census Bureau, American Community Survey
Existence of avtivities and events City/Town Parks andthat promote intergenerational contact Recreation Department, Local
Community Center, Area Agency on Aging
Older adults who are socially isolated
are at risk for a number of negative
outcomes, including depression,66
chronic illness,67 and mortality.68
Alternatively, being integrated into
strong social networks could protect
older adults from disability and
functional decline.69
Participation in Community Life
The average age of retirement dropped over the late twentieth century, andtoday an individual can expect to live at least another 20 years after leaving the workforce.72 Older adults may therefore finally have the time to participate ina variety of activities in their community, including attending cultural events,taking adult education classes, and joining civic and social organizations. Older adults may also engage in volunteer work. Both social activities andvolunteering can improve the health and well-being of older adults. Social
activities in later life can lead to less disability, lowermortality risk, and better mental health.73,74,75 Researchhas found that volunteerism among older adults can reduce the risk of mortality and increase measuresof physical and mental health.76,77 In addition,volunteering may help older adults cope with the lossof important roles, such as employee or parent, whichin turn can improve their psychological well-being.78
Furthermore, elders’ participation in community life asvolunteers, neighbors, caregivers, and friends can helpthe community as a whole.
The first indicator of participation in community life is the presence of a varietyof organizations, such as community centers, universities, libraries, and museums,where older adults can participate in social activities. The second indicator is theavailability of volunteer opportunities. In some cities and towns, a municipaldepartment, such as a community services department, maintains a list ofvolunteer opportunities. In other cities and towns, the Corporation for Nationaland Community Service (www.nationalservice.gov) maintains a searchabledatabase of volunteer opportunities.
22
Major Findings
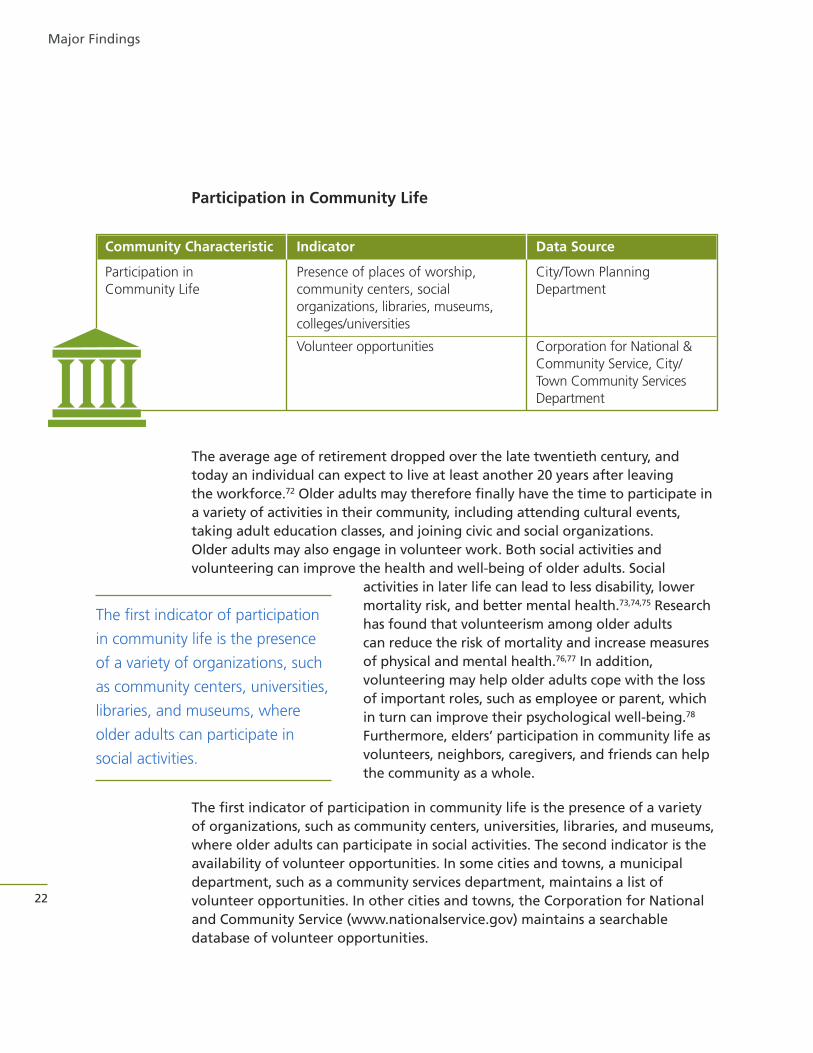
Community Characteristic Indicator Data Source
Participation in Presence of places of worship, City/Town Planning Community Life community centers, social Department
organizations, libraries, museums, colleges/universities
Volunteer opportunities Corporation for National &Community Service, City/Town Community Services Department
The first indicator of participation
in community life is the presence
of a variety of organizations, such
as community centers, universities,
libraries, and museums, where
older adults can participate in
social activities.
This report suggests three critical issues governments should consider when moving forwardusing this indicator system.
1) Every community is unique. Local governments, therefore, should think about how to adaptthese indicators to best meet the needs of their residents. One way in which communitiesdiffer is in terms of their population density, and the relevance of each indicator may varydepending on whether the community is urban, suburban or rural. Infrastructure that createssafe conditions for older drivers may be more important in rural and suburban areas, whilepublic transportation may be more important in urban areas. The goal is to ensure that olderresidents can remain mobile in their community for as long as possible, and there are multiplepathways to this mobility. Furthermore, the specific benchmarks used for each indicator maybe different between communities. In urban areas where older adults may need to walk ortake public transportation, a radius of ¼ or ½ mile may be appropriate when assessing theavailability of goods and services. In rural areas where older adults drive their own cars andcan cover greater distances in less time, a radius of 10 miles may be sufficient.
2) Gather more information, at the local level, around accessibility of features. As noted earlier,these indicators only provide information regarding the presence or absence of livablecommunity features. In many communities, understanding if older adults are able to accessthese features and the degree to which these features actually meet their needs will requireadditional data collection. Currently there is little publically-available data at the local levelthat could measure livable community characteristics. A list of additional indicators can befound in Appendix A.
3) Get started with a strategy of incremental changes. The purpose of this indicator system isto point to areas that may require intervention. However, thinking about all of thecommunity characteristics that can create more livable communities can be overwhelming,particularly at a time when local governments are struggling financially. One strategy is toimplement changes incrementally; examples include:
a) Infrastructure improvements to improve older driver safety can be made alongside regularmaintenance work, such as repairs to the roads, replacing street signs, and installing orupdating traffic lights.
b) Focusing on changes that are relatively low cost. For example, adopting a policy toencourage the incorporation of accessibility features into new housing requires littlemoney from the local government.
c) Enlisting the participation of other stakeholders, including private businesses, non-profitorganizations, and community residents.
23
> Livable Community Indicators for Sustainable Aging in Place
Implications and Next Steps
It is not the intention of this report to suggest that local governments bear thesole responsibility for creating more livable communities to facilitate aging inplace. In some cases, the local government can educate other stakeholders abouthow the physical and social environment affects residents and empower them todevise solutions. In other cases, the local government can partner with businessesand organizations to offer needed services. Finally, local governments can removebarriers to the efforts of other groups to create more livable communities.
These indicators address a variety of physical and social features that could createmore livable communities to potentially facilitate sustainable aging in place forolder residents. Community-level indicators for sustainable aging in place couldalso potentially reduce long-term care costs, facilitate the contributions of olderadults to their community, and improve the quality of life for residents of all agesby promoting community-wide economic and environmental health. The hope isthat local governments will decide to look further at how well the needs andwants of their older residents are being met.
24
Implications and Next Steps
This indicator system was developed using three sources of information.
1) A review of existing livable community and sustainability indicator systemsand checklists, including MetLife Foundation’s Blueprint for Action checklist toassess a community’s age-friendliness, the AdvantAge Initiative’s essentialelements of an elder-friendly community, Partners for Livable Community’selements of a livable community, and the Milken Institute’s indicators for thebest cities for successful aging.
2) An extensive review of the existing research literature on the communitycharacteristics that impact elder health, well-being, and the ability to age inplace. This involved the review of more than 100 published studies from suchdisciplines as social work, public health, urban planning, nursing, medicine,psychology, environmental science, and gerontology.
3) Interviews with 19 aging in place experts. These individuals represented avariety of backgrounds, including academia, city planning, advocacy, andnonprofit management, among others. For a list of interview participants, seeAppendix B.
After reviewing these three sources of information, a list of indicators wasdeveloped based on the following criteria:
• Strength of research evidence
• Strength of support by aging in place experts
• Ability to measure the indicator using existing data sources, including U.S.Census data, federal administrative data, and information at the local levelregarding the presence or absence of policies and programs
• The potential for multiple benefits, such as for the economic andenvironmental health of the community or for residents of other age groups
• The degree of adaptability to different types of communities, such as urban,suburban, and rural communities
25
> Livable Community Indicators for Sustainable Aging in Place
Methodology
26
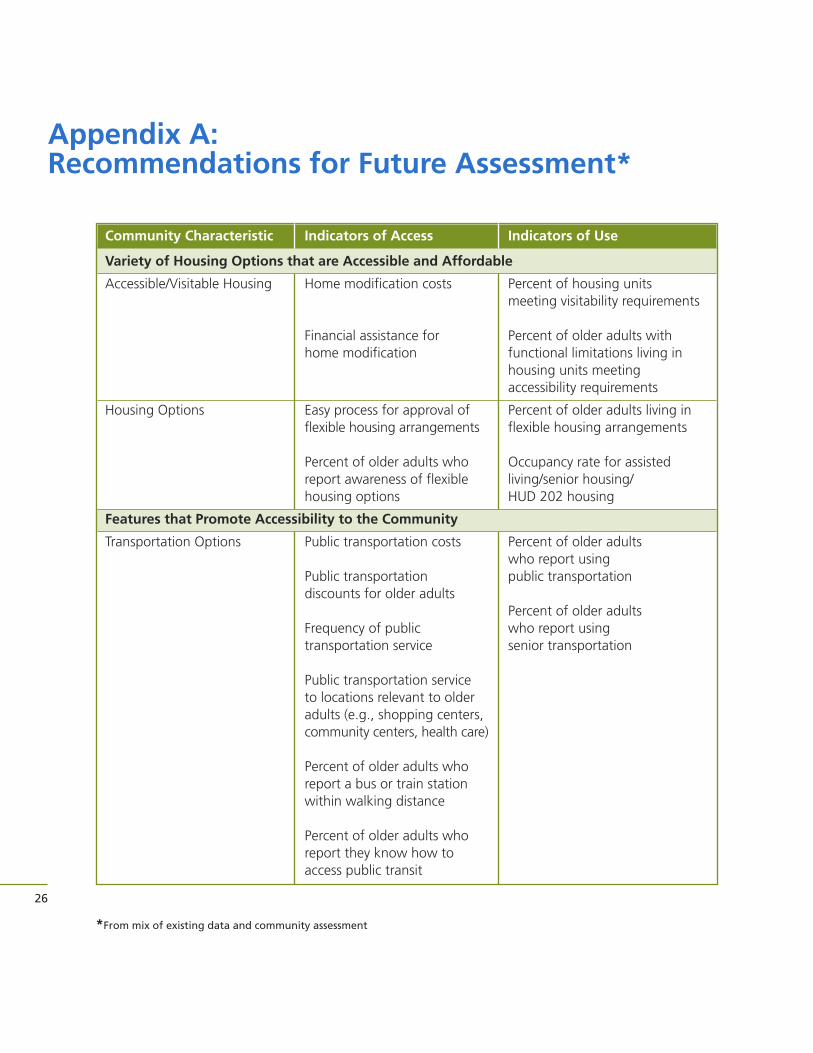
Appendix A: Recommendations for Future Assessment*
Community Characteristic Indicators of Access Indicators of Use
Variety of Housing Options that are Accessible and Affordable
Accessible/Visitable Housing Home modification costs Percent of housing units meeting visitability requirements
Financial assistance for Percent of older adults withhome modification functional limitations living in
housing units meeting accessibility requirements
Housing Options Easy process for approval of Percent of older adults living inflexible housing arrangements flexible housing arrangements
Percent of older adults who Occupancy rate for assistedreport awareness of flexible living/senior housing/housing options HUD 202 housing
Features that Promote Accessibility to the Community
Transportation Options Public transportation costs Percent of older adults who report using
Public transportation public transportationdiscounts for older adults
Percent of older adults Frequency of public who report using transportation service senior transportation
Public transportation service to locations relevant to older adults (e.g., shopping centers, community centers, health care)
Percent of older adults who report a bus or train station within walking distance
Percent of older adults who report they know how to access public transit
*From mix of existing data and community assessment
27
> Livable Community Indicators for Sustainable Aging in Place
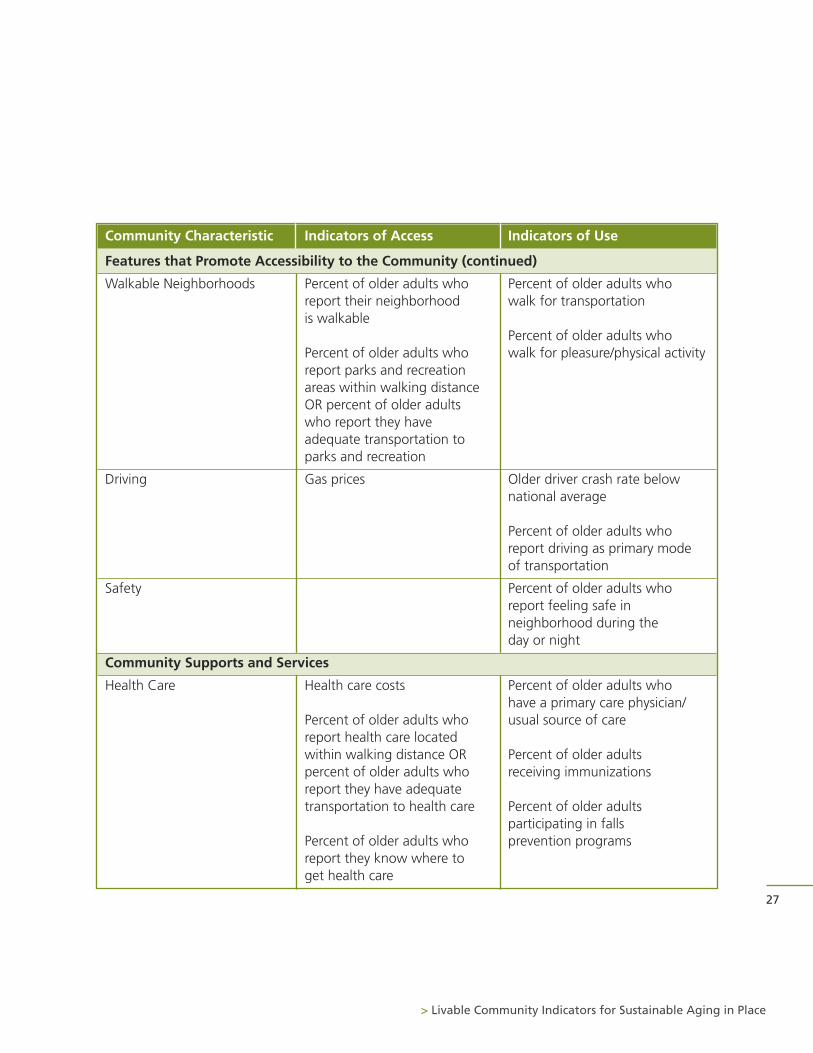
Community Characteristic Indicators of Access Indicators of Use
Features that Promote Accessibility to the Community (continued)
Walkable Neighborhoods Percent of older adults who Percent of older adults who report their neighborhood walk for transportationis walkable
Percent of older adults whoPercent of older adults who walk for pleasure/physical activityreport parks and recreation areas within walking distance OR percent of older adults who report they have adequate transportation to parks and recreation
Driving Gas prices Older driver crash rate below national average
Percent of older adults who report driving as primary mode of transportation
Safety Percent of older adults who report feeling safe in neighborhood during the day or night
Community Supports and Services
Health Care Health care costs Percent of older adults who have a primary care physician/
Percent of older adults who usual source of carereport health care located within walking distance OR Percent of older adults percent of older adults who receiving immunizationsreport they have adequate transportation to health care Percent of older adults
participating in falls Percent of older adults who prevention programsreport they know where to get health care
28
Appendix A: Recommendations for Future Assessment
Community Characteristic Indicators of Access Indicators of Use
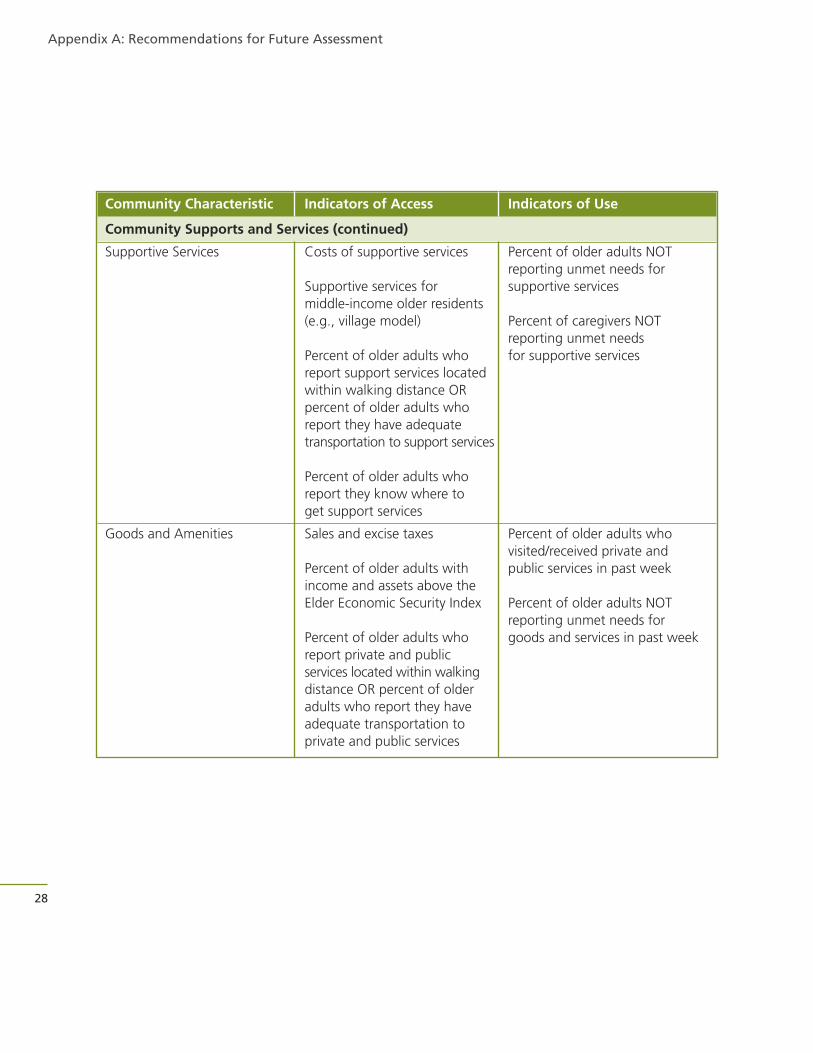
Community Supports and Services (continued)
Supportive Services Costs of supportive services Percent of older adults NOTreporting unmet needs for
Supportive services for supportive servicesmiddle-income older residents (e.g., village model) Percent of caregivers NOT
reporting unmet needsPercent of older adults who for supportive servicesreport support services locatedwithin walking distance ORpercent of older adults who report they have adequatetransportation to support services
Percent of older adults who report they know where to get support services
Goods and Amenities Sales and excise taxes Percent of older adults who visited/received private and
Percent of older adults with public services in past weekincome and assets above the Elder Economic Security Index Percent of older adults NOT
reporting unmet needs forPercent of older adults who goods and services in past weekreport private and public services located within walking distance OR percent of older adults who report they have adequate transportation to private and public services
29
> Livable Community Indicators for Sustainable Aging in Place
Community Characteristic Indicators of Access Indicators of Use
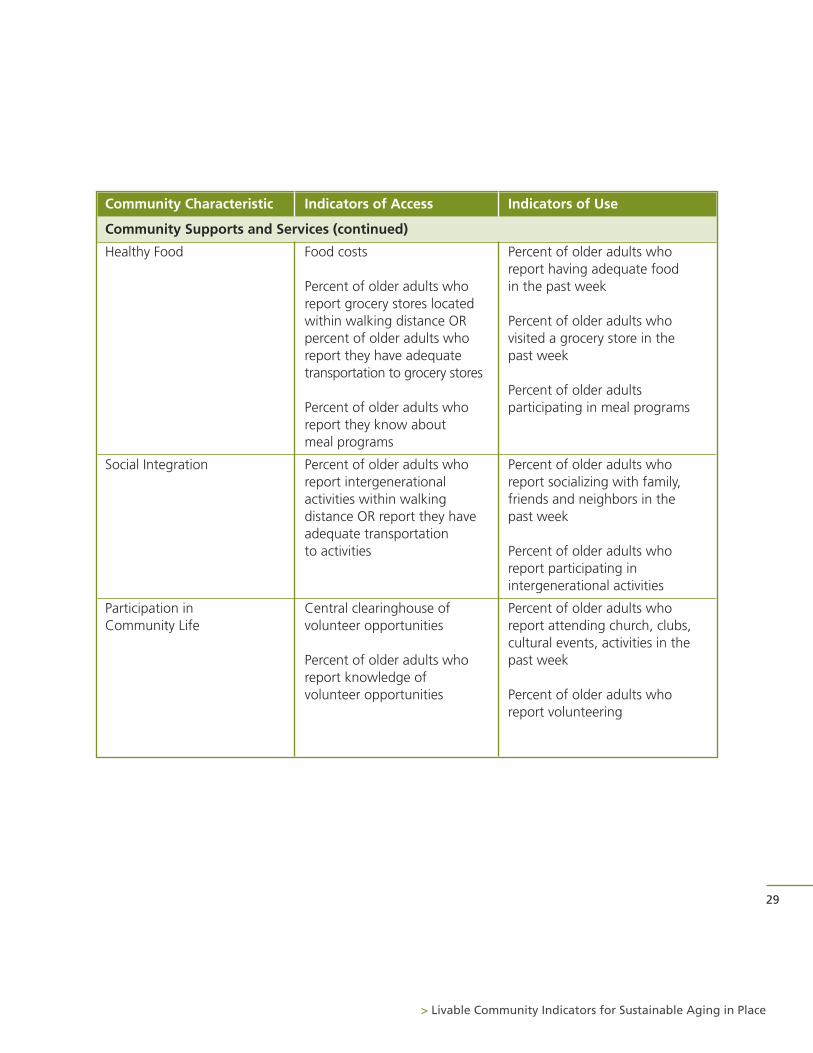
Community Supports and Services (continued)
Healthy Food Food costs Percent of older adults who report having adequate food
Percent of older adults who in the past weekreport grocery stores located within walking distance OR Percent of older adults who percent of older adults who visited a grocery store in the report they have adequate past weektransportation to grocery stores
Percent of older adults Percent of older adults who participating in meal programsreport they know about meal programs
Social Integration Percent of older adults who Percent of older adults who report intergenerational report socializing with family, activities within walking friends and neighbors in thedistance OR report they have past weekadequate transportation to activities Percent of older adults who
report participating in intergenerational activities
Participation in Central clearinghouse of Percent of older adults who Community Life volunteer opportunities report attending church, clubs,
cultural events, activities in thePercent of older adults who past weekreport knowledge of volunteer opportunities Percent of older adults who
report volunteering

The authors are extremely grateful to the following individuals who participatedin telephone interviews.
Candace Baldwin, Senior Policy Advisor, NCB Capital Impact/Village to Village Network
Kate Clark, MPA, Planner, Philadelphia Corporation for Aging
Eric Dishman, Intel Fellow and Director of Health Innovation in the IntelArchitecture Group, Intel
Allen Glicksman, PhD, Director of Research and Evaluation, PhiladelphiaCorporation for Aging
Deborah Howe, PhD, FAICP, Department Chair and Professor, Department ofCommunity and Regional Planning, Temple University, Ambler Campus
Helen Kerschner, PhD, President and CEO, The Beverly Foundation
Kathryn Lawler, External Affairs Manager, Atlanta Regional Commission
Robert McNulty, Founder and President, Partners for Livable Communities
Evelina Moulder, Director of Survey Research, International City/CountyManagement Association
Mia Oberlink, Senior Research Associate, Center for Home Care Policy andResearch, Visiting Nurse Service of New York
Susan Poor, Director of Innovation & Business Development, On Lok
Jon Pynoos, PhD, UPS Foundation Professor of Gerontology, Policy and Planningat the Andrus Gerontology Center; Director of the National Resource Center onSupportive Housing and Home Modification; Co-Director of the Fall PreventionCenter of Excellence, University of Southern California
Sheila Roher, Senior Policy Associate, New York Academy of Medicine
Andrew Scharlach, PhD, Eugene and Rose Kleiner Professor of Aging in Schoolof Social Welfare; Director of the Center for the Advanced Study of AgingServices, University of California, Berkeley
Philip Stafford, PhD, Director of Center on Aging and Community, IndianaUniversity
Barbara Stucki, PhD, Vice President, Home Equity, National Council on Aging
Kathy Sykes, MA, Senior Advisor for Aging and Sustainability, U.S.Environmental Protection Agency Office of Research and Development
Louis Tenenbaum, Consultant on Aging in Place
Fredda Vladek, Director of Aging in Place Initiative, United Hospital Fund
30
Appendix B: Aging in Place Experts
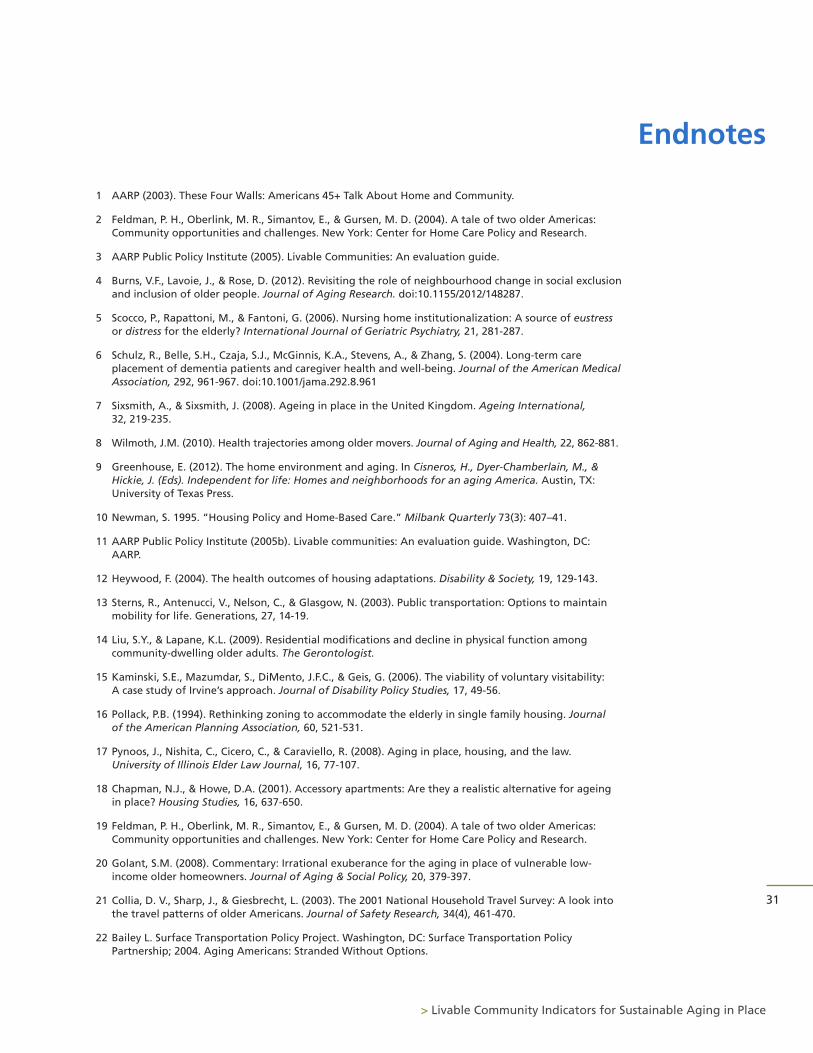
1 AARP (2003). These Four Walls: Americans 45+ Talk About Home and Community.
2 Feldman, P. H., Oberlink, M. R., Simantov, E., & Gursen, M. D. (2004). A tale of two older Americas:Community opportunities and challenges. New York: Center for Home Care Policy and Research.
3 AARP Public Policy Institute (2005). Livable Communities: An evaluation guide.
4 Burns, V.F., Lavoie, J., & Rose, D. (2012). Revisiting the role of neighbourhood change in social exclusionand inclusion of older people. Journal of Aging Research. doi:10.1155/2012/148287.
5 Scocco, P., Rapattoni, M., & Fantoni, G. (2006). Nursing home institutionalization: A source of eustressor distress for the elderly? International Journal of Geriatric Psychiatry, 21, 281-287.
6 Schulz, R., Belle, S.H., Czaja, S.J., McGinnis, K.A., Stevens, A., & Zhang, S. (2004). Long-term careplacement of dementia patients and caregiver health and well-being. Journal of the American MedicalAssociation, 292, 961-967. doi:10.1001/jama.292.8.961
7 Sixsmith, A., & Sixsmith, J. (2008). Ageing in place in the United Kingdom. Ageing International,32, 219-235.
8 Wilmoth, J.M. (2010). Health trajectories among older movers. Journal of Aging and Health, 22, 862-881.
9 Greenhouse, E. (2012). The home environment and aging. In Cisneros, H., Dyer-Chamberlain, M., &Hickie, J. (Eds). Independent for life: Homes and neighborhoods for an aging America. Austin, TX:University of Texas Press.
10 Newman, S. 1995. “Housing Policy and Home-Based Care.”Milbank Quarterly 73(3): 407–41.
11 AARP Public Policy Institute (2005b). Livable communities: An evaluation guide. Washington, DC:AARP.
12 Heywood, F. (2004). The health outcomes of housing adaptations. Disability & Society, 19, 129-143.
13 Sterns, R., Antenucci, V., Nelson, C., & Glasgow, N. (2003). Public transportation: Options to maintainmobility for life. Generations, 27, 14-19.
14 Liu, S.Y., & Lapane, K.L. (2009). Residential modifications and decline in physical function amongcommunity-dwelling older adults. The Gerontologist.
15 Kaminski, S.E., Mazumdar, S., DiMento, J.F.C., & Geis, G. (2006). The viability of voluntary visitability: A case study of Irvine’s approach. Journal of Disability Policy Studies, 17, 49-56.
16 Pollack, P.B. (1994). Rethinking zoning to accommodate the elderly in single family housing. Journal of the American Planning Association, 60, 521-531.
17 Pynoos, J., Nishita, C., Cicero, C., & Caraviello, R. (2008). Aging in place, housing, and the law.University of Illinois Elder Law Journal, 16, 77-107.
18 Chapman, N.J., & Howe, D.A. (2001). Accessory apartments: Are they a realistic alternative for ageingin place? Housing Studies, 16, 637-650.
19 Feldman, P. H., Oberlink, M. R., Simantov, E., & Gursen, M. D. (2004). A tale of two older Americas:Community opportunities and challenges. New York: Center for Home Care Policy and Research.
20 Golant, S.M. (2008). Commentary: Irrational exuberance for the aging in place of vulnerable low-income older homeowners. Journal of Aging & Social Policy, 20, 379-397.
21 Collia, D. V., Sharp, J., & Giesbrecht, L. (2003). The 2001 National Household Travel Survey: A look intothe travel patterns of older Americans. Journal of Safety Research, 34(4), 461-470.
22 Bailey L. Surface Transportation Policy Project. Washington, DC: Surface Transportation PolicyPartnership; 2004. Aging Americans: Stranded Without Options.
31
> Livable Community Indicators for Sustainable Aging in Place
Endnotes
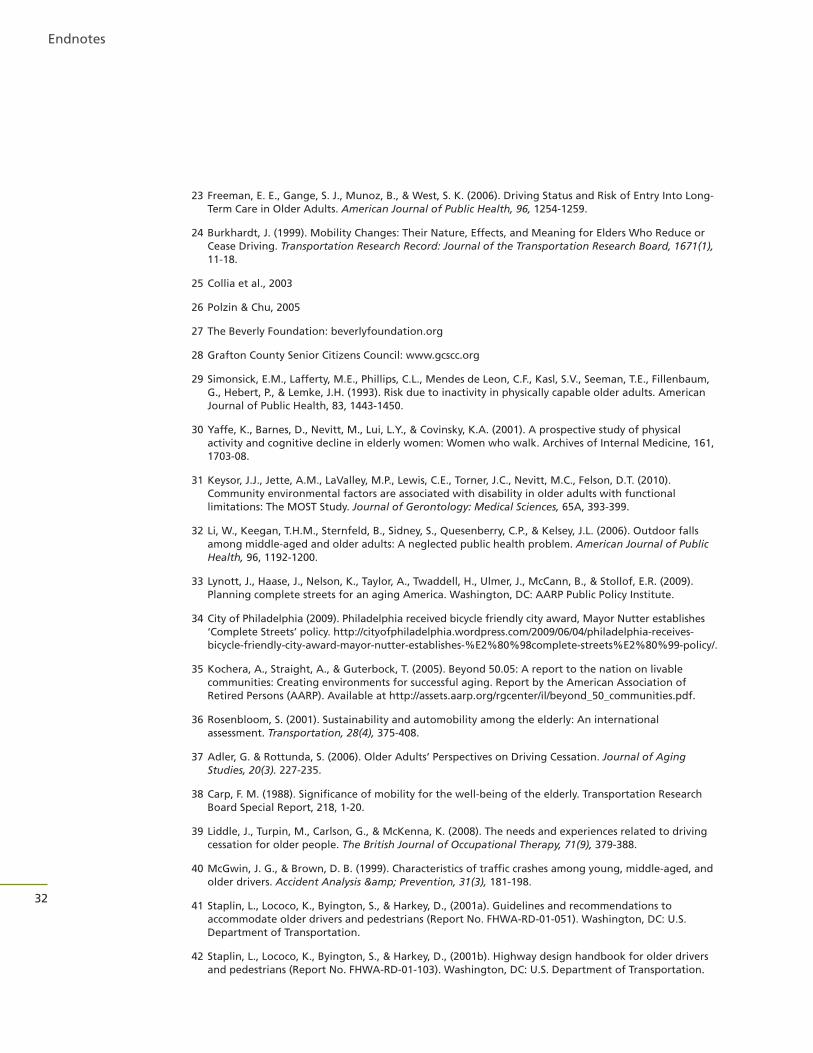
23 Freeman, E. E., Gange, S. J., Munoz, B., & West, S. K. (2006). Driving Status and Risk of Entry Into Long-Term Care in Older Adults. American Journal of Public Health, 96, 1254-1259.
24 Burkhardt, J. (1999). Mobility Changes: Their Nature, Effects, and Meaning for Elders Who Reduce orCease Driving. Transportation Research Record: Journal of the Transportation Research Board, 1671(1),11-18.
25 Collia et al., 2003
26 Polzin & Chu, 2005
27 The Beverly Foundation: beverlyfoundation.org
28 Grafton County Senior Citizens Council: www.gcscc.org
29 Simonsick, E.M., Lafferty, M.E., Phillips, C.L., Mendes de Leon, C.F., Kasl, S.V., Seeman, T.E., Fillenbaum,G., Hebert, P., & Lemke, J.H. (1993). Risk due to inactivity in physically capable older adults. AmericanJournal of Public Health, 83, 1443-1450.
30 Yaffe, K., Barnes, D., Nevitt, M., Lui, L.Y., & Covinsky, K.A. (2001). A prospective study of physicalactivity and cognitive decline in elderly women: Women who walk. Archives of Internal Medicine, 161,1703-08.
31 Keysor, J.J., Jette, A.M., LaValley, M.P., Lewis, C.E., Torner, J.C., Nevitt, M.C., Felson, D.T. (2010).Community environmental factors are associated with disability in older adults with functionallimitations: The MOST Study. Journal of Gerontology: Medical Sciences, 65A, 393-399.
32 Li, W., Keegan, T.H.M., Sternfeld, B., Sidney, S., Quesenberry, C.P., & Kelsey, J.L. (2006). Outdoor fallsamong middle-aged and older adults: A neglected public health problem. American Journal of PublicHealth, 96, 1192-1200.
33 Lynott, J., Haase, J., Nelson, K., Taylor, A., Twaddell, H., Ulmer, J., McCann, B., & Stollof, E.R. (2009).Planning complete streets for an aging America. Washington, DC: AARP Public Policy Institute.
34 City of Philadelphia (2009). Philadelphia received bicycle friendly city award, Mayor Nutter establishes‘Complete Streets’ policy. http://cityofphiladelphia.wordpress.com/2009/06/04/philadelphia-receives-bicycle-friendly-city-award-mayor-nutter-establishes-%E2%80%98complete-streets%E2%80%99-policy/.
35 Kochera, A., Straight, A., & Guterbock, T. (2005). Beyond 50.05: A report to the nation on livablecommunities: Creating environments for successful aging. Report by the American Association ofRetired Persons (AARP). Available at http://assets.aarp.org/rgcenter/il/beyond_50_communities.pdf.
36 Rosenbloom, S. (2001). Sustainability and automobility among the elderly: An internationalassessment. Transportation, 28(4), 375-408.
37 Adler, G. & Rottunda, S. (2006). Older Adults’ Perspectives on Driving Cessation. Journal of AgingStudies, 20(3). 227-235.
38 Carp, F. M. (1988). Significance of mobility for the well-being of the elderly. Transportation ResearchBoard Special Report, 218, 1-20.
39 Liddle, J., Turpin, M., Carlson, G., & McKenna, K. (2008). The needs and experiences related to drivingcessation for older people. The British Journal of Occupational Therapy, 71(9), 379-388.
40 McGwin, J. G., & Brown, D. B. (1999). Characteristics of traffic crashes among young, middle-aged, andolder drivers. Accident Analysis & Prevention, 31(3), 181-198.
41 Staplin, L., Lococo, K., Byington, S., & Harkey, D., (2001a). Guidelines and recommendations toaccommodate older drivers and pedestrians (Report No. FHWA-RD-01-051). Washington, DC: U.S.Department of Transportation.
42 Staplin, L., Lococo, K., Byington, S., & Harkey, D., (2001b). Highway design handbook for older driversand pedestrians (Report No. FHWA-RD-01-103). Washington, DC: U.S. Department of Transportation.
32
Endnotes
43 Clarke, P.J., Ailshire, J.A., Nieuwenhuijsen, E.R., de Kleijn- de Vrankrijker, M.W. (2011). Participationamong adults with disability: The role of the urban environment. Social Science & Medicine, 72, 1674-1684.
44 Ambrose Gallagher, N., Gretebeck, K.A., Robinson, J.C., Torres, E.R., Murphy, S.L., & Martyn, K.K. (2010).Neighborhood factors relevant for walking in older, urban, African American adults. Journal of Agingand Physical Activity, 18, 99-115.
45 Simonsick, E.M., Lafferty, M.E., Phillips, C.L., Mendes de Leon, C.F., Kasl, S.V., Seeman, T.E., Fillenbaum,G., Hebert, P., & Lemke, J.H. (1993). Risk due to inactivity in physically capable older adults. AmericanJournal of Public Health, 83, 1443-1450.
46 Balfour, J.L., & Kaplan, G.A. (2002). Neighborhood environment and loss of physical function in olderadults: Evidence from the Alameda County Study. American Journal of Epidemiology, 155, 507-515.
47 Fernandez, L.S., Byard, D., Lin, C., Benson, S., & Barbera, J.A. (2002). Frail elderly as disaster victims:Emergency management strategies. Prehospital and Disaster Medicine, 17, 67-74.
48 Bolin R, Klenow DJ: Response of the elderly to disaster: An age-stratified analysis. International Journalof Aging and Human Development, 1982–3;16(4):283–297.
49 Gibson MJ. We can do better: lessons learned for protecting older persons in disasters. Washington(DC): AARP; 2006.
50 O’Brien N. Issue brief: emergency preparedness for older people. New York (NY): InternationalLongevity Center–USA; 2003.
51 U.S. Department of Health and Human Services, Centers for Disease Control and Prevention (2012).Identifying older adults and legal options for increasing their protection during all-hazardsemergencies. http://www.cdc.gov/aging/emergency/pdf/guide.pdf.
52 http://www.cdc.gov/chronicdisease/resources/publications/AAG/aging.htm
53 Healy, Peng, Haynes, McMahon, Botler, and Gross, 2008
54 Federal Interagency Forum on Aging-Related Statistics (2012). Older Americans 2012: Key Indicators ofWell-Being. http://www.agingstats.gov/Main_Site/Data/2012_Documents/docs/EntireChartbook.pdf
55 Allen, S.M., & Mor, V. (1997). The prevalence and consequences of unmet need: Contrasts betweenolder and younger adults with disability. Medical Care, 35, 1132-1148.
56 Jette, A.M., Tennstedt, S., & Crawford, S. (1995). How does formal and informal community care affectnursing home use? Journals of Gerontology: Social Sciences, 50B, S4-S12.
57 Tang, F., & Lee, Y. (2011). Social support networks and expectations for aging in place and moving.Research on Aging, 33, 444-464.
58 McCallum, J., Simons, L.A., Simons, J., & Freidlander, Y. (2005). Patterns and predictors of nursing homeplacement over 14 years: Dubbo study of elderly Austrailians. Austalasian Journal on Ageing, 24, 169-173.
59 Berke, E.M., Koepsell, T.D., Moudon, A.V., Hoskins, R.E., & Larson, E.B. (2007). Association of the builtenvironment with physical activity and obesity in older persons. American Journal of Public Health, 97,486-492.
60 Freedman, V.A., Grafova, I.B., Schoeni, R.F., & Rogowski, J. (2008). Neighborhoods and disability in laterlife. Social Science & Medicine, 66, 2253-2267.
61 Aytur, S.A. (2007). Promoting active community environments through land use and transportationplanning. American Journal of Health Promotion, 21, 397-407.
62 Duncan, D.T., Alstadt, J., Whalen, J., Melly, S.J., & Gortmaker, S.L. (2011). Validation of Walk Score forestimating neighborhood walkability: An analysis of four US metropolitan areas. International Journalof Environmental Research and Public Health, 8, 4160-4179.
33
> Livable Community Indicators for Sustainable Aging in Place
63 Larson, N.I., Story, M.T., & Nelson, M.C. (2009). Neighborhood environments: Disparities in access tohealthy foods in the U.S. American Journal of Preventive Medicine, 36, 74-81.
64 Governor Paterson, Mayor Bloomberg, Speaker Quinn announce comprehensive strategies to expandgrocery stores in underserved neighborhoods.http://www.governor.ny.gov/archive/paterson/press/press_0516091.html
65 Shaw, B., Krause, N., Liang, J., & Bennett, J. (2007). Tracking changes in social relations throughout latelife. Journal of Gerontology; Social Sciences, 62B(2), S90-S99.
66 Golden, J., Conroy, R.M., Bruce, I., Denihan, A., Greene, E., Kirby, M., & Lawlor, B.A. (2009). Loneliness,social support networks, mood and wellbeing in community-dwelling elderly. International Journal ofGeriatric Psychiatry, 24, 694-700.
67 Tomaka, J., Thompson, S., & Palacios, R. (2006). The relation of social isolation, loneliness, and socialsupport to disease outcomes among the elderly. Journal of Aging & Health, 18, 359-384.
68 Patterson, A.C., & Veenstra, G. (2010). Loneliness and risk of mortality: A longitudinal investigation inAlameda County, California. Social Science & Medicine, 71, 181-186.
69 Avlund, K., Lund, R., Holstein, B., & Due, P. (2004). Social relations as determinants of onset of disabilityin ageing. Archives of Gerontology and Geriatrics, 38, 85-99.
70 LaPlante, M.P., Kaye, S., Kang, T., & Harrington, C. (2004). Unmet need for personal assistance services:Estimating the shortfall in hours of help and adverse consequences. Journals of Gerontology: SocialSciences, 59, S98-S108.
71 Bharucha, A.J., Pandav, R., Shen, C., Dodge, H.H., & Ganguli, M. (2004). Predictors of nursing facilityadmission: A 12-year epidemiological study in the United States. Journal of the American GeriatricsSociety, 52, 434-439.
72 National Center for Health Statistics (2006). Health, United States, 2006, with chartbook on trends inthe health of Americans. Retrieved on February 10, 2009 from:http://www.cdc.gov/nchs/data/hus/hus06.pdf#027.
73 Glass, T.A., Mendes de Leon, C.F., Bassuk, S.S., & Berkman, L.F. (2006). Social engagement anddepressive symptoms in late life: Longitudinal findings. Journal of Aging & Health, 18, 604-628.
74 Glass, T.A., Mendes de Leon, C., Marottoli, R.A., & Berkman, L.F. (1999). Population based study ofsocial and productive activities as predictors of survival among elderly Americans. British MedicalJournal, 319, 478-483.
75 Mendes de Leon, C.F., Glass, T.A., & Berkman, L.F. (2003). Social engagement and disability in acommunity population of older adults. The New Haven EPESE. American Journal of Epidemiology,157, 633-642.
76 Morrow-Howell, N., Hinterlong, J., Rozario, P.A., & Tang, F. (2003). Effects of volunteering on the well-being of older adults. Journal of Gerontology: Social Sciences, 58B, S137-S145.
77 Oman, D., Thoresen, C., & McMahon, K. (1999). Volunteerism and mortality among older adults:Findings from a national sample. Journal of Health Psychology, 4, 301-316.
78 Greenfield, E.A., & Marks, N.F. (2004). Formal volunteering as a protective factor for older adults’psychological well-being. Journals of Gerontology: Social Sciences, 59B, S258-S264.
34
Endnotes

35
> Livable Community Indicators for Sustainable Aging in Place

36

www.MatureMarketInstitute.com
200 Park Avenue, New York, NY 10166
MMI00327(0313) ©2013 Metropolitan Life Insurance Company L0213306943[exp0116 ]