Embed Size (px)
Citation preview

STT215: CHAPTER 3 PRODUCING DATA
Dr. Cuixian Chen
Chapter 3: Producing Data
STT215 1
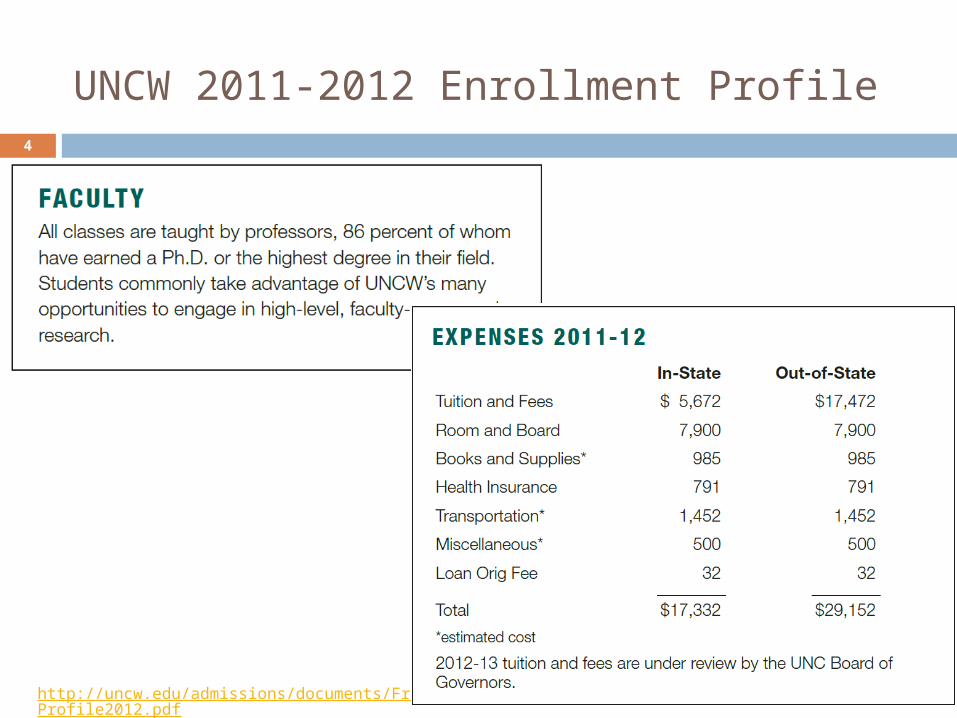
UNCW 2011-2012 Enrollment Profile How many students enroll at UNCW for 2011-
2012? How many undergraduates/graduates? How many % of female/male students? What is the expenses for In-state/out-state
students? How many % of UNCW faculties have PhD or the
highest degree in their fields? What about freshmen’s SAT/ACT scores? How many % of freshmen choose UNCW as their
first choice?
STT215
2
STT215
3
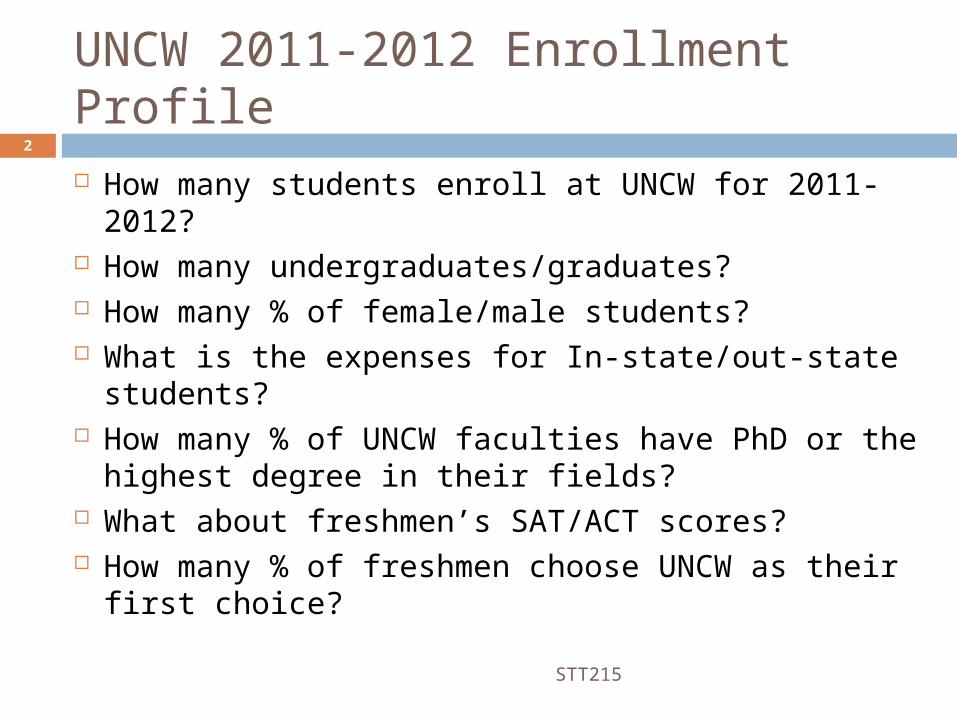
UNCW 2011-2012 Enrollment Profile
http://uncw.edu/admissions/documents/FreshmanProfile2012.pdf
STT215
4
UNCW 2011-2012 Enrollment Profile
http://uncw.edu/admissions/documents/FreshmanProfile2012.pdf
Some terminology
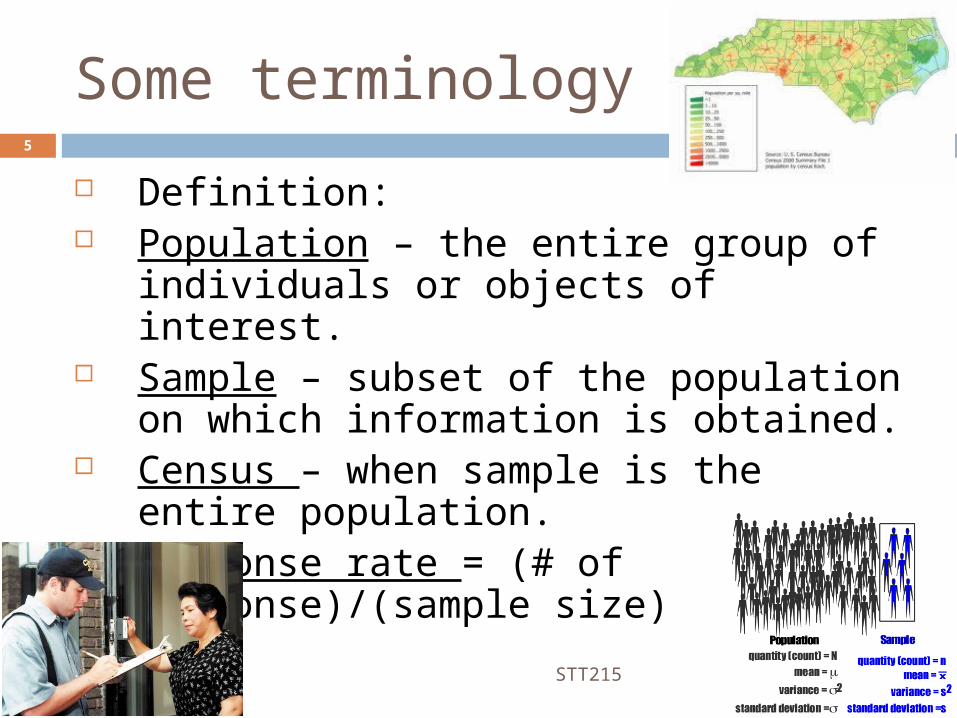
Definition: Population – the entire group of
individuals or objects of interest. Sample – subset of the population on
which information is obtained. Census – when sample is the entire
population. Response rate = (# of
response)/(sample size)
STT215
5
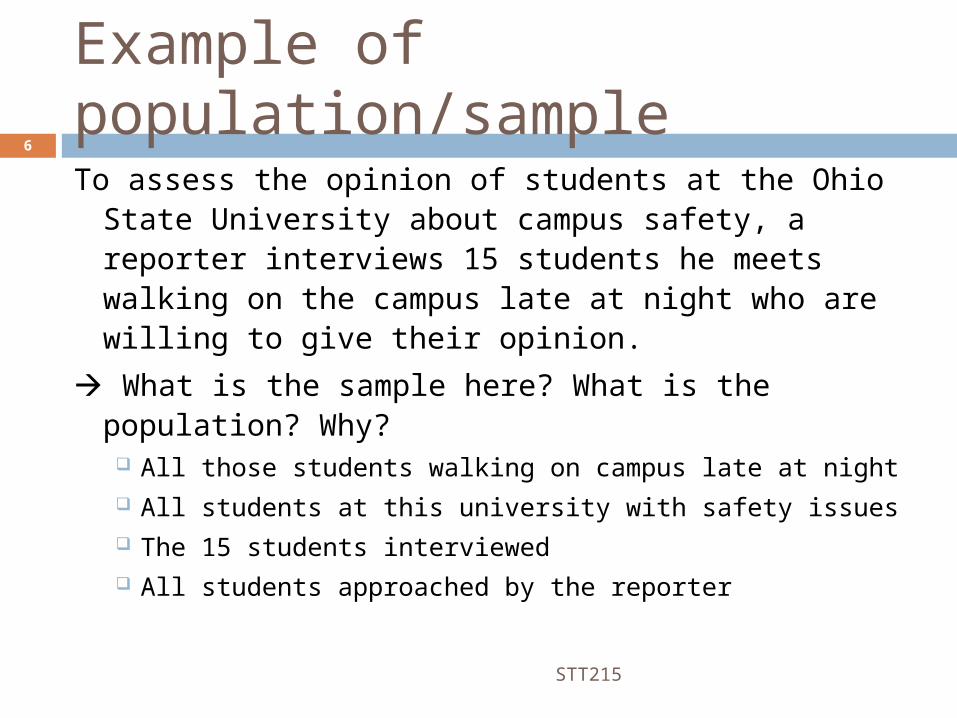
Example of population/sampleTo assess the opinion of students at the Ohio State
University about campus safety, a reporter interviews 15 students he meets walking on the campus late at night who are willing to give their opinion.
What is the sample here? What is the population? Why? All those students walking on campus late at night All students at this university with safety issues The 15 students interviewed All students approached by the reporter
STT215
6
7
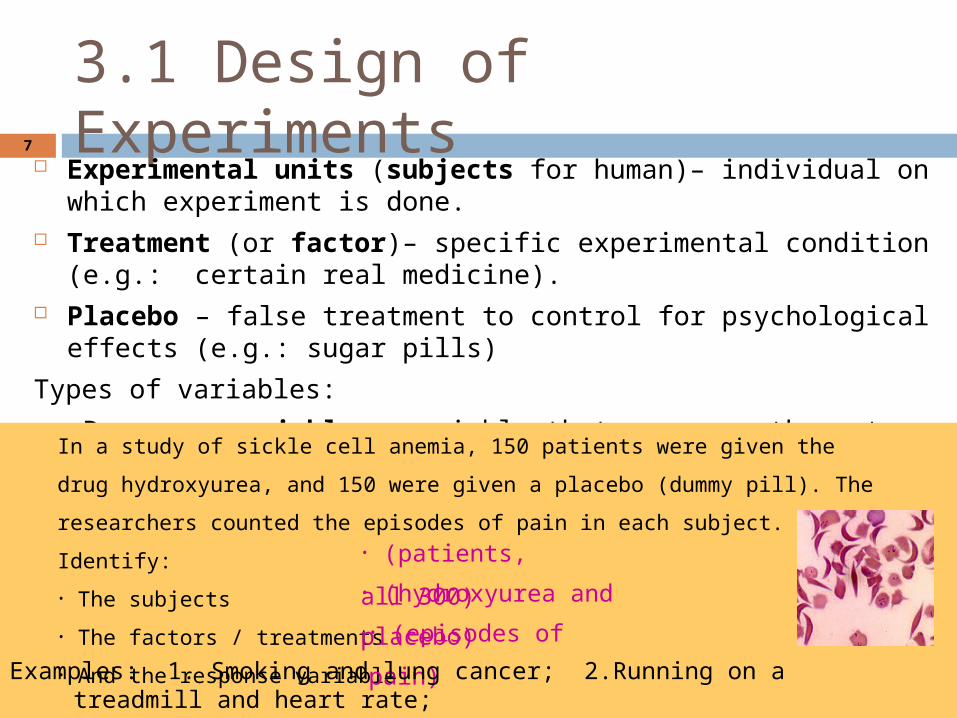
3.1 Design of Experiments Experimental units (subjects for human)– individual on which
experiment is done. Treatment (or factor)– specific experimental condition (e.g.:
certain real medicine). Placebo – false treatment to control for psychological effects
(e.g.: sugar pills)
Types of variables:
1. Response variable – variable that measures the outcome of the study.
2. Explanatory variable (Factors) – variable(s) that explains or causes changes in the response variable.
In a study of sickle cell anemia, 150 patients were given the drug hydroxyurea, and 150
were given a placebo (dummy pill). The researchers counted the episodes of pain in
each subject. Identify:
• The subjects
• The factors / treatments
• And the response variable
• (patients, all 300)
• (hydroxyurea and placebo)
• (episodes of pain)
Examples: 1. Smoking and lung cancer; 2.Running on a treadmill and heart rate;
php: 3.23(a) 3.27, 3.28,3.30(a).
8
Example: New Drug Experiment
A new drug is introduced. The drug is given by investigator to subjects (patients) in a treatment group, but other subjects are in control group – they aren’t treated or treated with traditional method (placebo).
Subjects should be assigned randomly. The experiment should be double-blind: neither the subjects nor the doctors (evaluators) should know who was in the control group.
Question: how can you make 3.10(P174) a double blind experiment?
php: 3.19,3.22(how you make it a double blind)
9
Observational study vs Experiment Observational study – the investigator observes
individuals and measures variables of interest but does not attempt to influence the response.
Example: Based on observations you make in nature, you suspect that female crickets choose their mates on the basis of their health. Observehealth of male crickets that mated.
Experiment (study) : the investigator observes how a response variable behaves when the researcher manipulates one or more factors.
•Example: Deliberately infect some males with intestinal parasites and see whether females tend to choose healthy rather than ill males.
Php: 3.121, 3.124
10
Example 3.4, page 168
Researchers had a study on a daycare which had enrollment 1,364 infants in 1991. In 2003, the researchers found out that “the more time children spent in child care from birth to age 4.5, the more adults tended to rate them, both at age of 4.5 and at kindergarten, as less likely to get along with others, as more assertive, as disobedient, and as aggressive”.
Q1: Is it an observational study or an experiment? Why?
Q2: Explanatory variable? Response variable? Q3: Does it prove that “spending more time in
daycare causes children to have more problems in behaviors”? How to improve it to be an experiment?
11
Drawbacks of Observational Study (example 3.4)
In Example 3.4, the effect of child care on behavior is confounded (mixed up) with the characteristics of families who use daycare (lurking variables: the variable(s) associated with the response, but are not of interest; effects cannot be separated from the effect of the explanatory variable on the response ).
Observational studies: Often, the effect of one
variable on another often fail because the explanatory variable is confounded with lurking variables.
Question: find the lurking variable of EX 3.18 (a)page 184HWQ: find the lurking variable of EX 3.17 page 184

12
Example 3.7, page 170Study: Do smaller classes in elementary school really benefit students in areas such as scores on standard tests, staying in school, and going to college?
The Tennessee STAR program: each students of 6,385 students who were beginning kindergarten was assigned to three types of classes:
(1) regular class with one teacher; (2) regular class with one teacher and a full-time aid; (3) small class.Four years later, they returned to regular classes. The only systematic difference was the type of class. In later years, the students from small classes had higher scores on standard tests.
Q1: What is the treatment? Q2: Is it an observational study or an experiment? Why?Q3: Explanatory variable? Response variable?Q4: What is the only systematic difference within the students?Q5: Can it prove that class size made the difference?

13
The Strength of Experiments (compared with observational studies)
Experiments provide good evidence for causation (able to control lurking variables)
Example 3.7, page 170
lurking variables – the variable(s) associated with the response, but are not of interest; effects cannot be separated from the effect of the explanatory variable on the response
Example 3.4, page 168
14
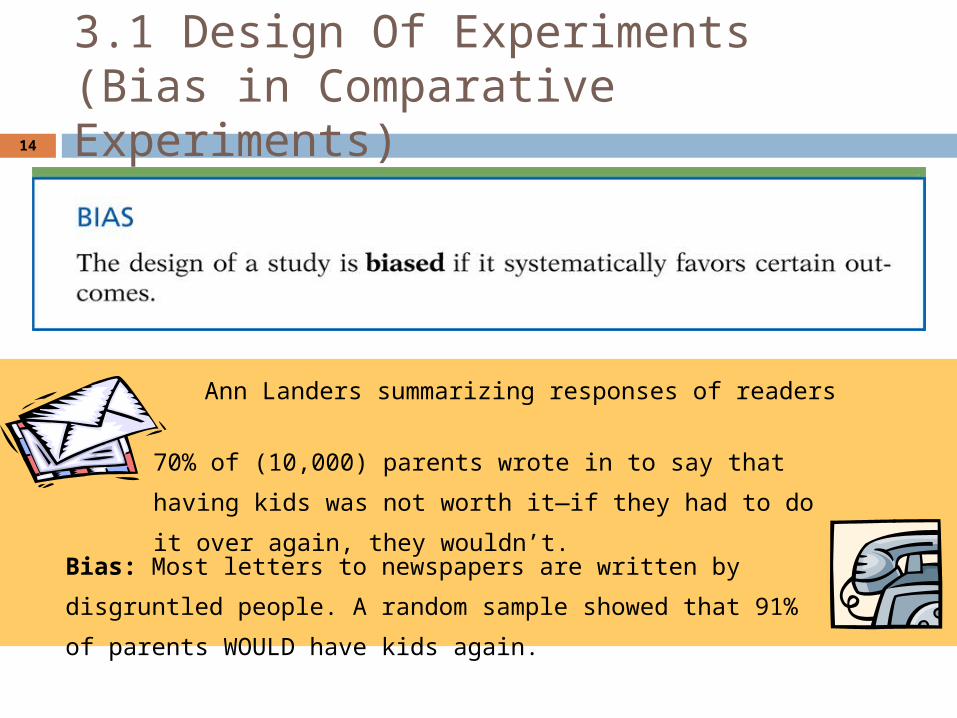
3.1 Design Of Experiments (Bias in Comparative Experiments)
Ann Landers summarizing responses of readers
70% of (10,000) parents wrote in to say that having kids was not
worth it—if they had to do it over again, they wouldn’t.
Bias: Most letters to newspapers are written by disgruntled people. A
random sample showed that 91% of parents WOULD have kids again.
15
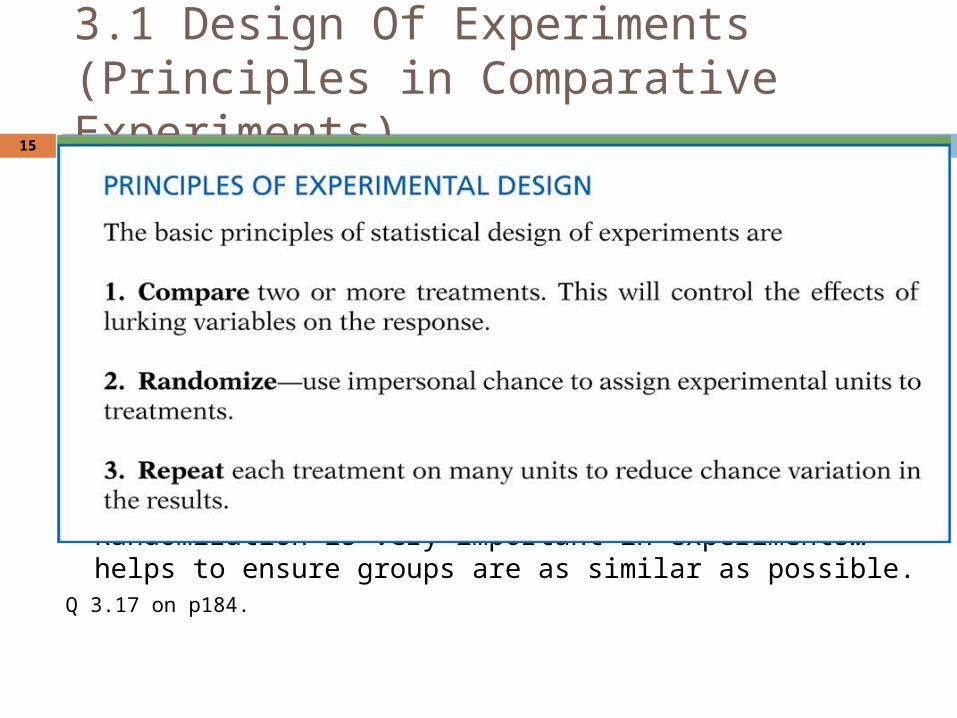
3.1 Design Of Experiments (Principles in Comparative Experiments)
4. Plus “Double Blind” if possible. Randomization is very important in experiments…
helps to ensure groups are as similar as possible.Q 3.17 on p184.
3.1 Design Of Experiments (How do we randomize by Calculator)
16
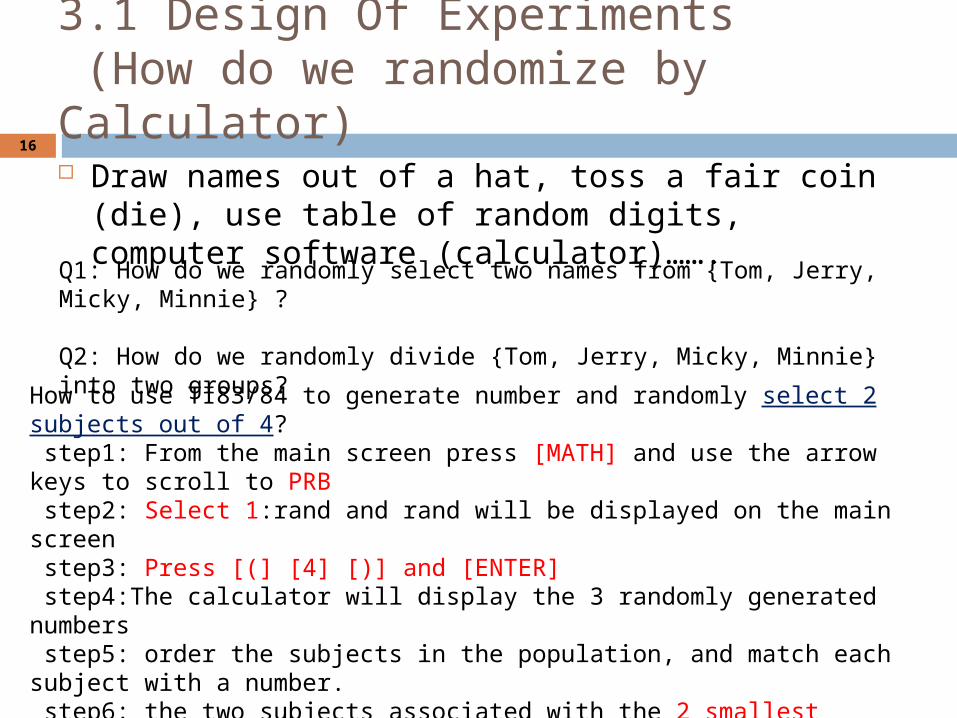
Draw names out of a hat, toss a fair coin (die), use table of random digits, computer software (calculator)…….
How to use TI83/84 to generate number and randomly select 2 subjects out of 4? step1: From the main screen press [MATH] and use the arrow keys to scroll to PRB step2: Select 1:rand and rand will be displayed on the main screen step3: Press [(] [4] [)] and [ENTER] step4:The calculator will display the 3 randomly generated numbers step5: order the subjects in the population, and match each subject with a number. step6: the two subjects associated with the 2 smallest numbers is our random choice.
Q1: How do we randomly select two names from {Tom, Jerry, Micky, Minnie} ?
Q2: How do we randomly divide {Tom, Jerry, Micky, Minnie} into two groups?
17
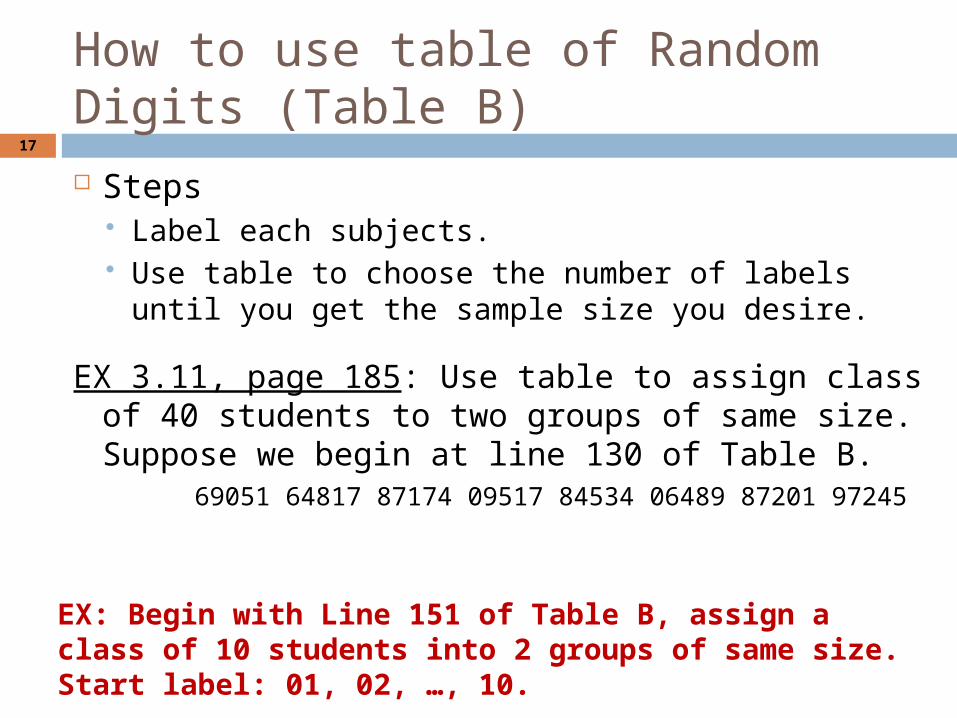
How to use table of Random Digits (Table B) Steps
Label each subjects. Use table to choose the number of labels until
you get the sample size you desire.
EX 3.11, page 185: Use table to assign class of 40 students to two groups of same size. Suppose we begin at line 130 of Table B.
69051 64817 87174 09517 84534 06489 87201 97245
EX: Begin with Line 151 of Table B, assign a class of 10 students into 2 groups of same size. Start label: 01, 02, …, 10.
18
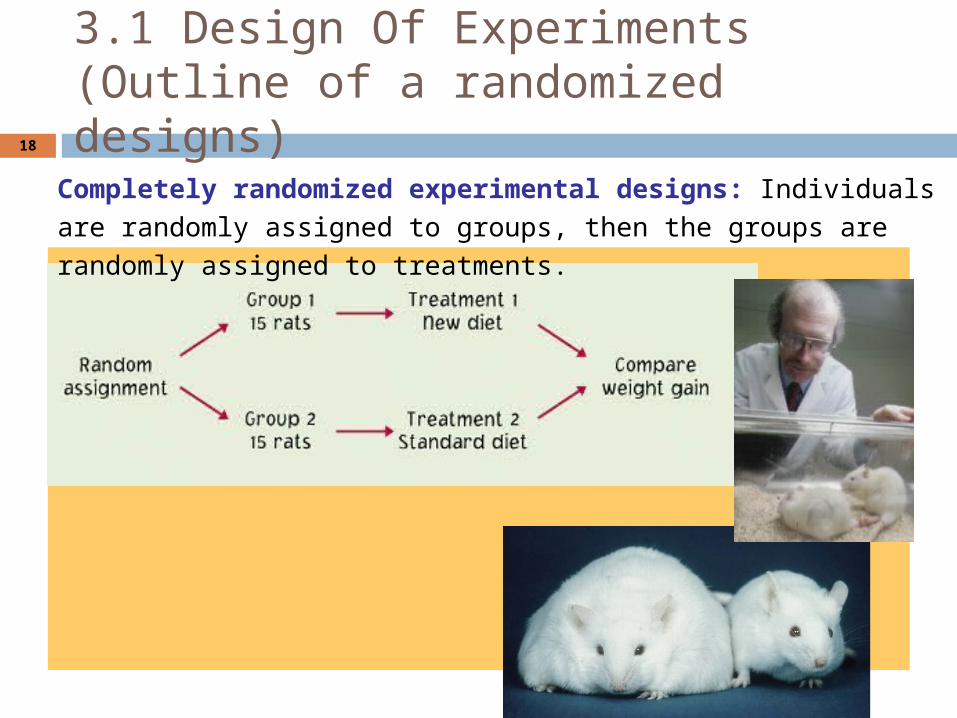
Completely randomized experimental designs: Individuals are randomly
assigned to groups, then the groups are randomly assigned to treatments.
3.1 Design Of Experiments(Outline of a randomized designs)
19
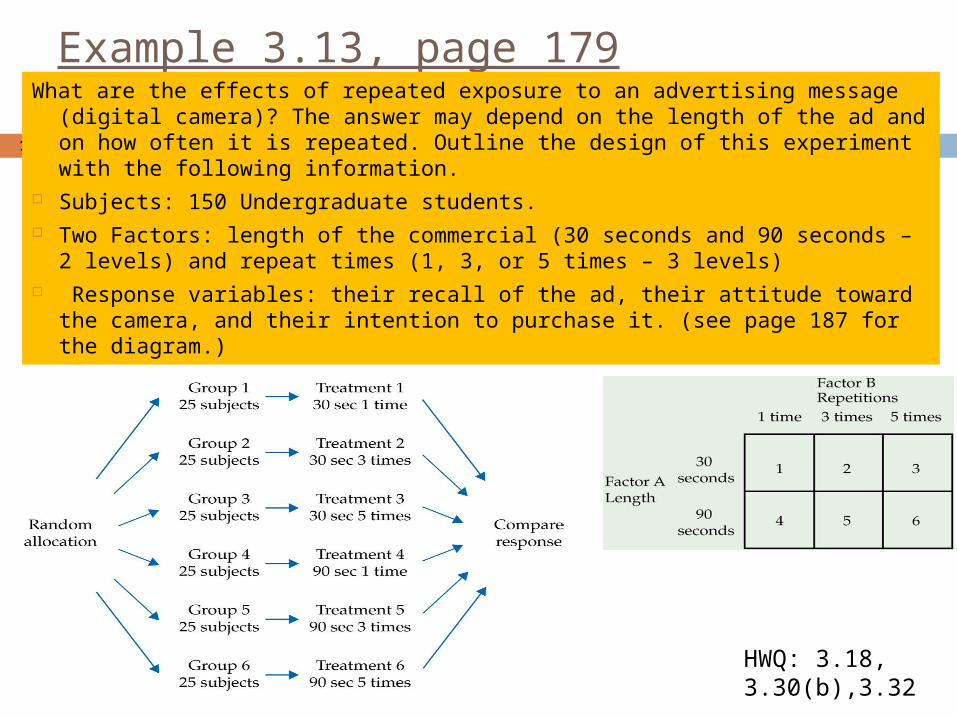
Example 3.13, page 179What are the effects of repeated exposure to an advertising message (digital
camera)? The answer may depend on the length of the ad and on how often it is repeated. Outline the design of this experiment with the following information.
Subjects: 150 Undergraduate students. Two Factors: length of the commercial (30 seconds and 90 seconds – 2
levels) and repeat times (1, 3, or 5 times – 3 levels) Response variables: their recall of the ad, their attitude toward the
camera, and their intention to purchase it. (see page 187 for the diagram.)
HWQ: 3.18, 3.30(b),3.32

20In a block, or stratified, design, subjects are divided into groups, or blocks,
prior to experiments to test hypotheses about differences between the groups.
The blocking, or stratification, here is by gender (blocking factor).
3.1 Design Of Experiments (Block designs)
EX3.19
Ex: 3.17 (p182), 3.18HWQ: 3.47(a,b), 3.126.
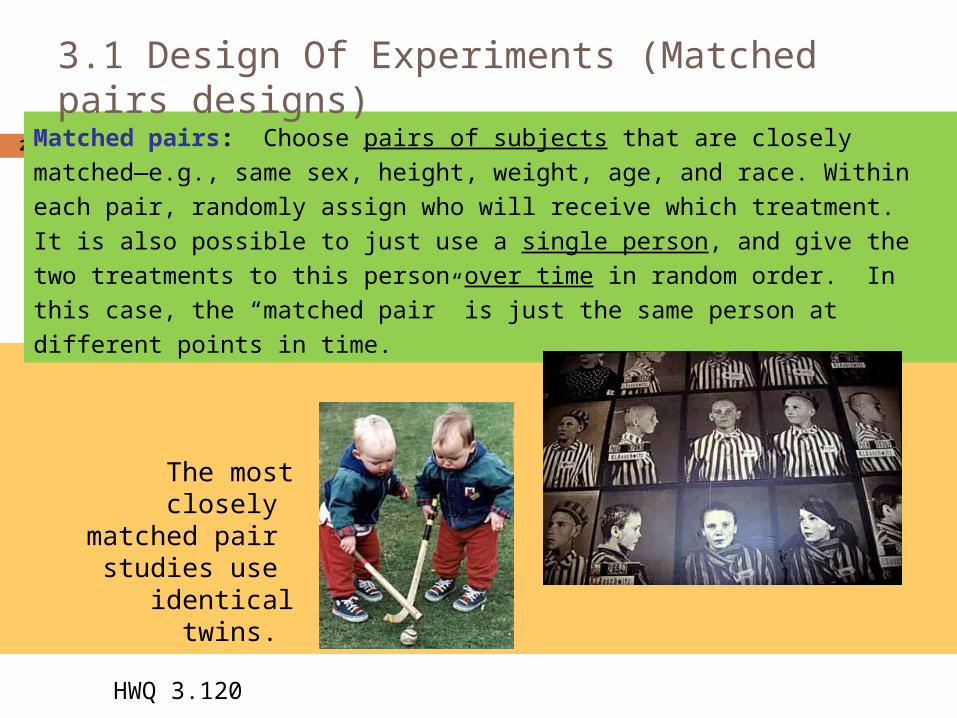
21Matched pairs: Choose pairs of subjects that are closely matched—e.g., same sex,
height, weight, age, and race. Within each pair, randomly assign who will receive
which treatment.
It is also possible to just use a single person, and give the two treatments to this
person over time in random order. In this case, the “matched pair” is just the same
person at different points in time.
The most closely matched pair
studies use identical twins.
3.1 Design Of Experiments (Matched pairs designs)
HWQ 3.120
22
3.2 Sampling Design (Stratified random sample)
Simple Random Sample (SRS) – every sample of size n has the same chance of being selected
Stratified random sample (strata) – first divide into groups, and then take a SRS from each stratum.
23
3.2 Sampling Design (simple random sample)
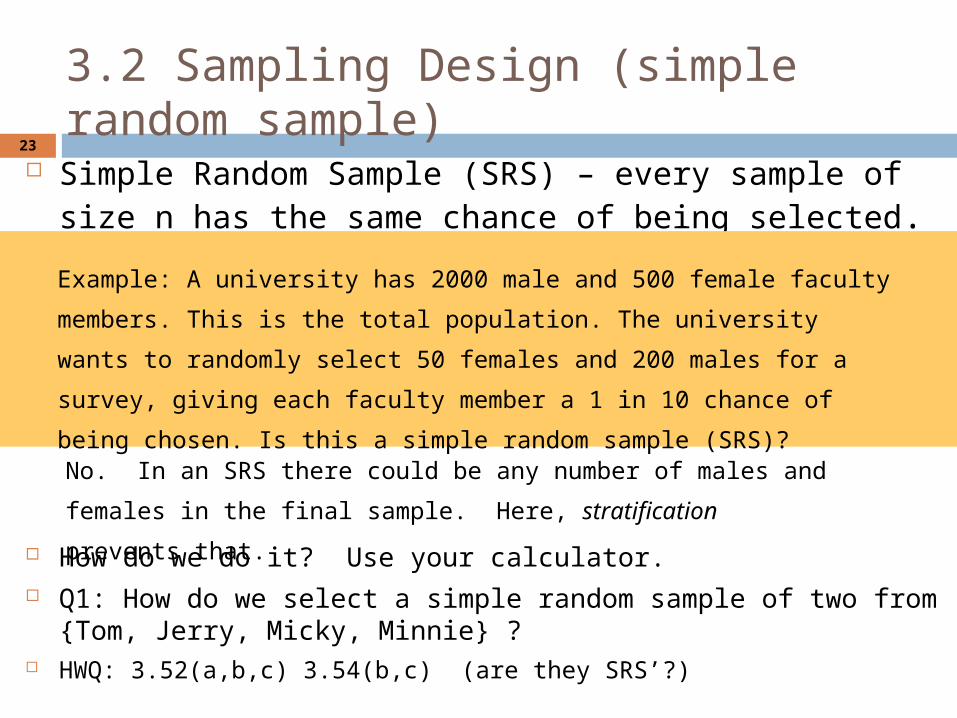
Simple Random Sample (SRS) – every sample of size n has the same chance of being selected.
How do we do it? Use your calculator. Q1: How do we select a simple random sample of two from
{Tom, Jerry, Micky, Minnie} ? HWQ: 3.52(a,b,c) 3.54(b,c) (are they SRS’?)
Example: A university has 2000 male and 500 female faculty members. This is
the total population. The university wants to randomly select 50 females and
200 males for a survey, giving each faculty member a 1 in 10 chance of being
chosen. Is this a simple random sample (SRS)?
No. In an SRS there could be any number of males and females in the
final sample. Here, stratification prevents that.
24
3.2 Sampling Design( Voluntary Response Sampling)
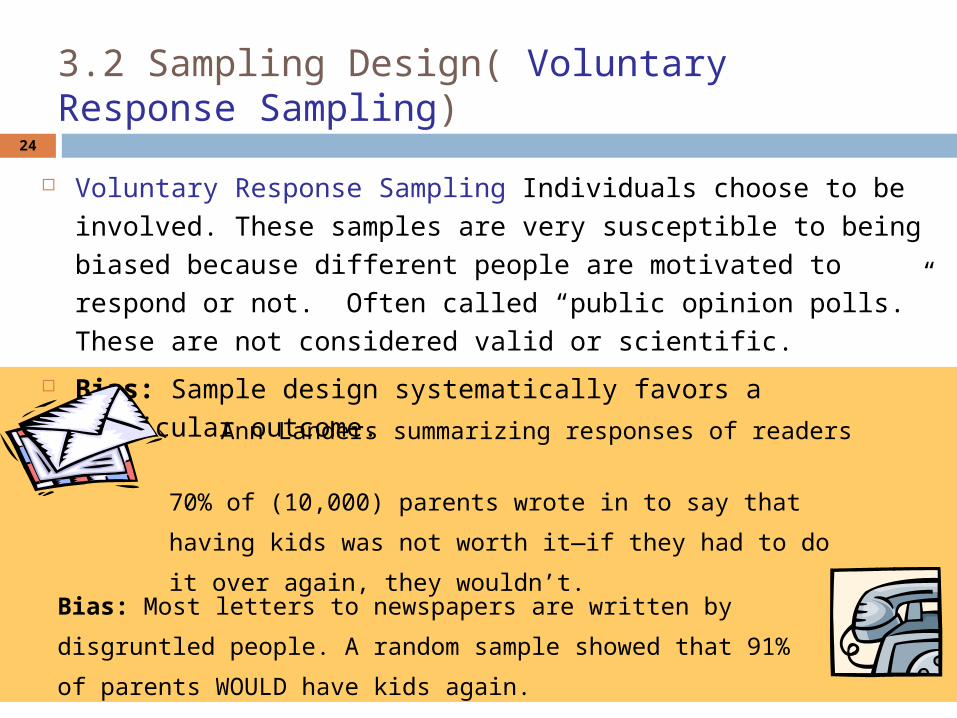
Voluntary Response Sampling Individuals choose to be involved. These samples are very susceptible to being biased because different people are motivated to respond or not. Often called “public opinion polls.” These are not considered valid or scientific.
Bias: Sample design systematically favors a particular outcome. Ann Landers summarizing responses of readers
70% of (10,000) parents wrote in to say that having kids was not
worth it—if they had to do it over again, they wouldn’t.
Bias: Most letters to newspapers are written by disgruntled people. A
random sample showed that 91% of parents WOULD have kids again.
25
3.3 Towards Statistical Inference Use information from sample (known
information) to infer about the population (unknown)
Statistics – information from a sample. Parameter – information from a
population. Sampling variability – information from a
sample will differ from one sample to the next.

26
Population versus sample Sample: The part of the
population we actually examine and for which we do have data.
How well the sample represents the population depends on the sample design.
A statistic is a number describing a characteristic of a sample.
• Population: The entire group of individuals in which we are interested but can’t usually assess directly.
Example: All humans, all working-age people in California, all crickets
• A parameter is a number describing a characteristic of the population.
Population
Sample

27
Sampling variability
Each time we take a random sample from a population, we are
likely to get a different set of individuals and a calculate a
different statistic. This is called sampling variability.
The good news is that, if we take lots of random samples of the
same size from a given population, the variation from sample to
sample—the sampling distribution—will follow a predictable
pattern. All of statistical inference is based on this knowledge.
Definition, pg 217–218Introduction to the Practice of Statistics, Sixth Edition
© 2009 W.H. Freeman and Company

Figure 3.14Introduction to the Practice of Statistics, Sixth Edition
© 2009 W.H. Freeman and Company
Bias and variability: Arrow shooting as an example

30
3.3 Towards Statistical Inference (cont.)
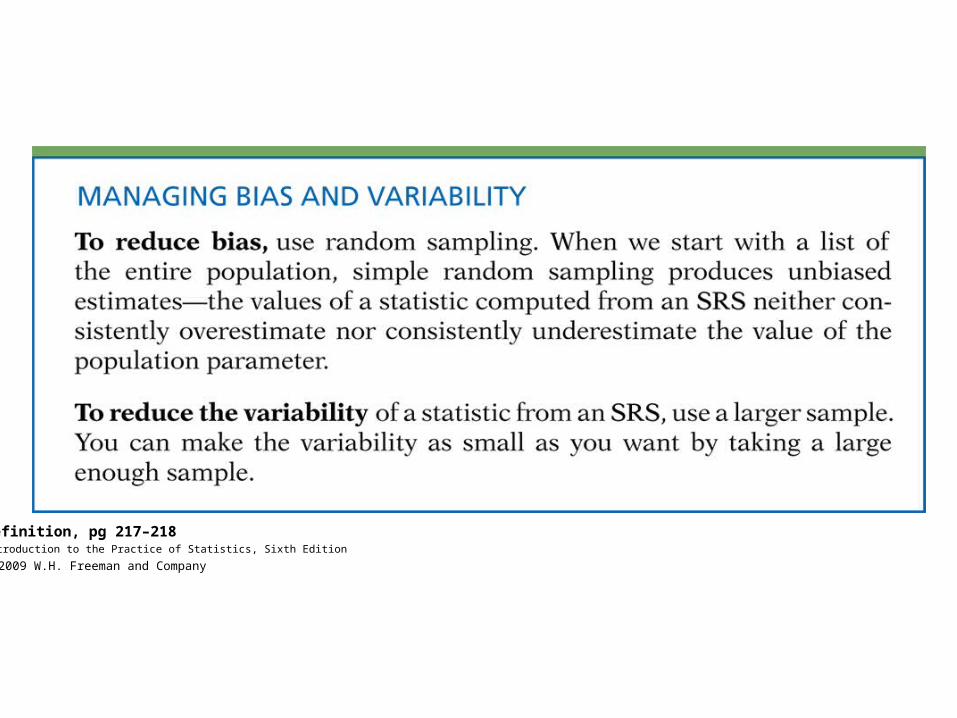
How to decrease bias? Random sample and better instruments
How to increase precision? Larger sample
Population size does not effect precision!!! Sample size does.