Embed Size (px)
Citation preview
1
Stryker Global Technology Center (SGTC) A subsidiary of Stryker Corporation, USA
Quality First Forum
SATEA 2016
March 10, 2017 2
What creates Quality?
2
March 10, 2017 3
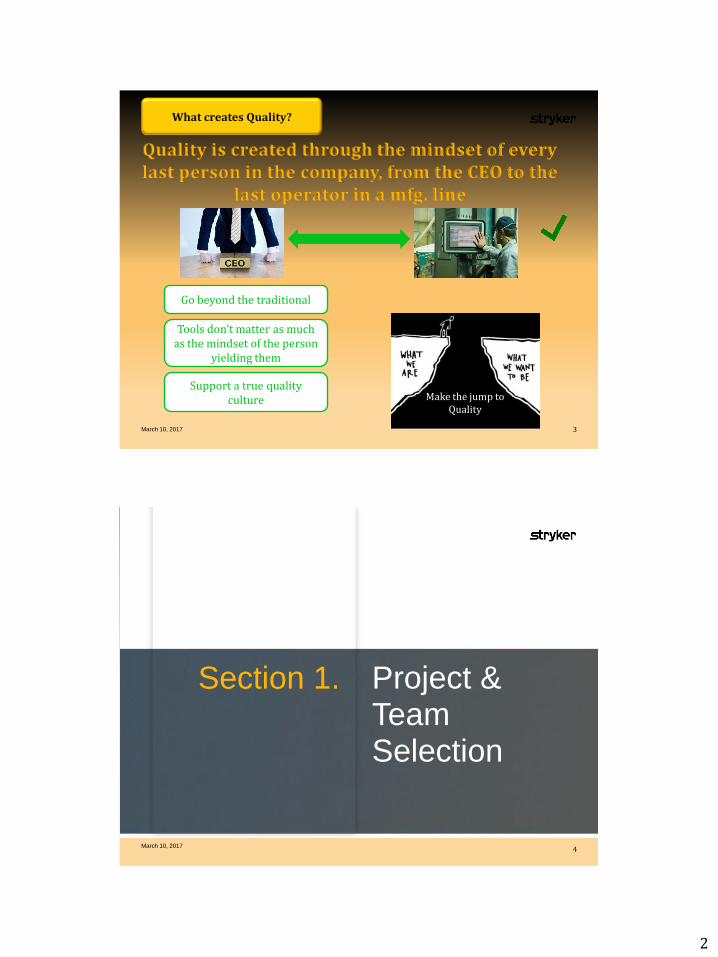
What creates Quality?
Quality is created through the mindset of every last person in the company, from the CEO to the
last operator in a mfg. line
Make the jump to Quality
Go beyond the traditional
Support a true quality culture
Tools don’t matter as much as the mindset of the person
yielding them
Section 1.
Project & Team Selection
March 10, 2017 4
3
March 10, 2017 5
1.1.1
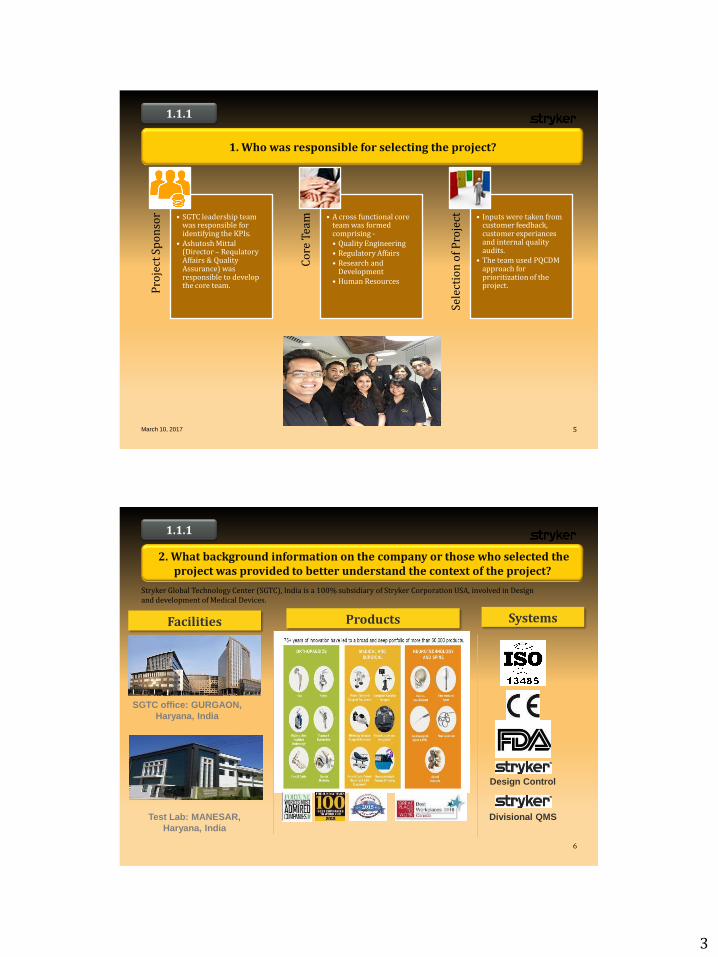
1. Who was responsible for selecting the project? P
roje
ct S
po
nso
r • SGTC leadership team was responsible for identifying the KPIs.
• Ashutosh Mittal (Director – Requlatory Affairs & Quality Assurance) was responsible to develop the core team.
Co
re T
eam
• A cross functional core team was formed comprising - • Quality Engineering • Regulatory Affairs • Research and
Development • Human Resources
Sele
ctio
n o
f P
roje
ct
• Inputs were taken from customer feedback, customer experiances and internal quality audits.
• The team used PQCDM approach for prioritization of the project.
6
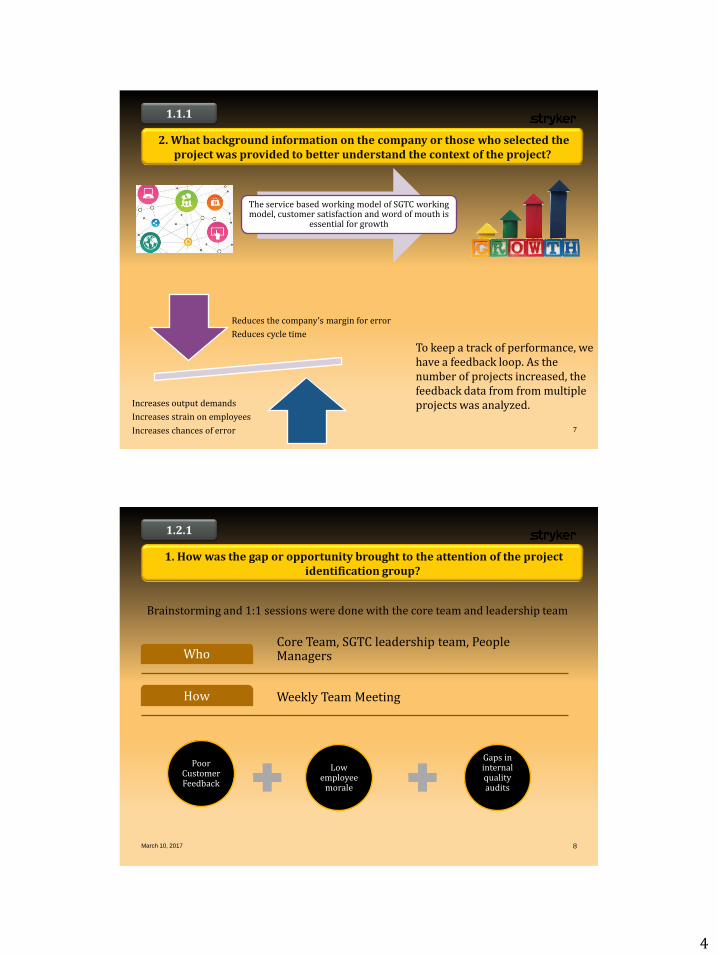
2. What background information on the company or those who selected the project was provided to better understand the context of the project?
1.1.1
Facilities Systems Products
Design Control
Divisional QMS
SGTC office: GURGAON,
Haryana, India
Test Lab: MANESAR,
Haryana, India
Stryker Global Technology Center (SGTC), India is a 100% subsidiary of Stryker Corporation USA, involved in Design and development of Medical Devices.
4
2. What background information on the company or those who selected the project was provided to better understand the context of the project?
1.1.1
The service based working model of SGTC working model, customer satisfaction and word of mouth is
essential for growth
To keep a track of performance, we have a feedback loop. As the number of projects increased, the feedback data from from multiple projects was analyzed.
Reduces the company’s margin for error
Reduces cycle time
Increases output demands
Increases strain on employees
Increases chances of error 7
March 10, 2017 8
1. How was the gap or opportunity brought to the attention of the project identification group?
1.2.1
Core Team, SGTC leadership team, People Managers Who
Weekly Team Meeting How
Brainstorming and 1:1 sessions were done with the core team and leadership team
Low employee
morale
Gaps in internal quality audits
Poor Customer Feedback
5
March 10, 2017 9
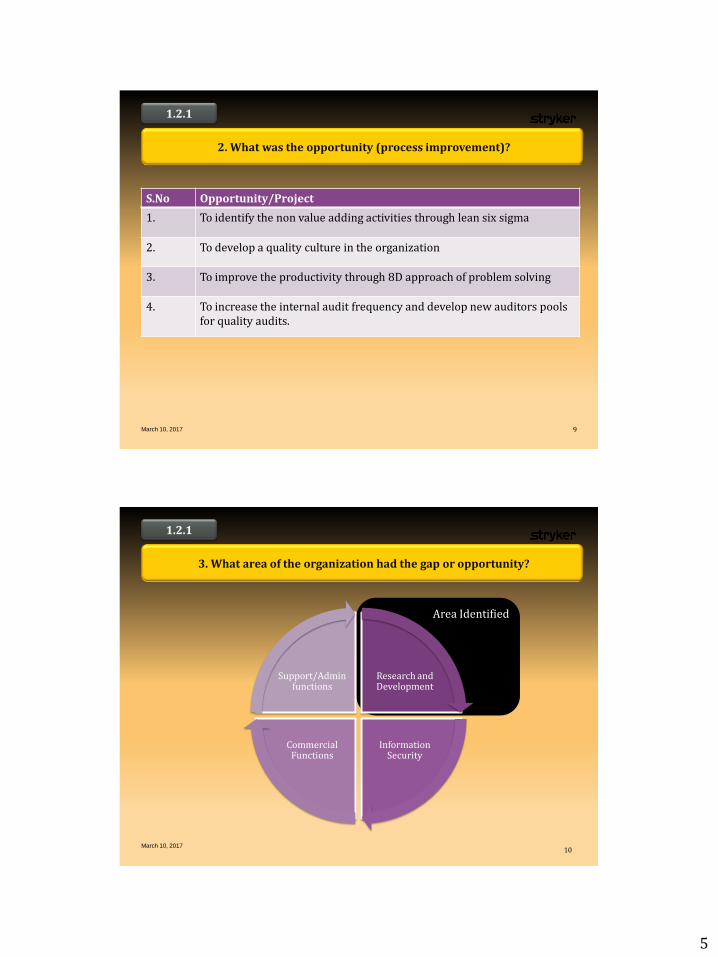
2. What was the opportunity (process improvement)?
1.2.1
S.No Opportunity/Project
1. To identify the non value adding activities through lean six sigma
2. To develop a quality culture in the organization
3. To improve the productivity through 8D approach of problem solving
4. To increase the internal audit frequency and develop new auditors pools for quality audits.
Area Identified
March 10, 2017 10
3. What area of the organization had the gap or opportunity?
1.2.1
Research and Development
Information Security
Commercial Functions
Support/Admin functions
6
March 10, 2017 11
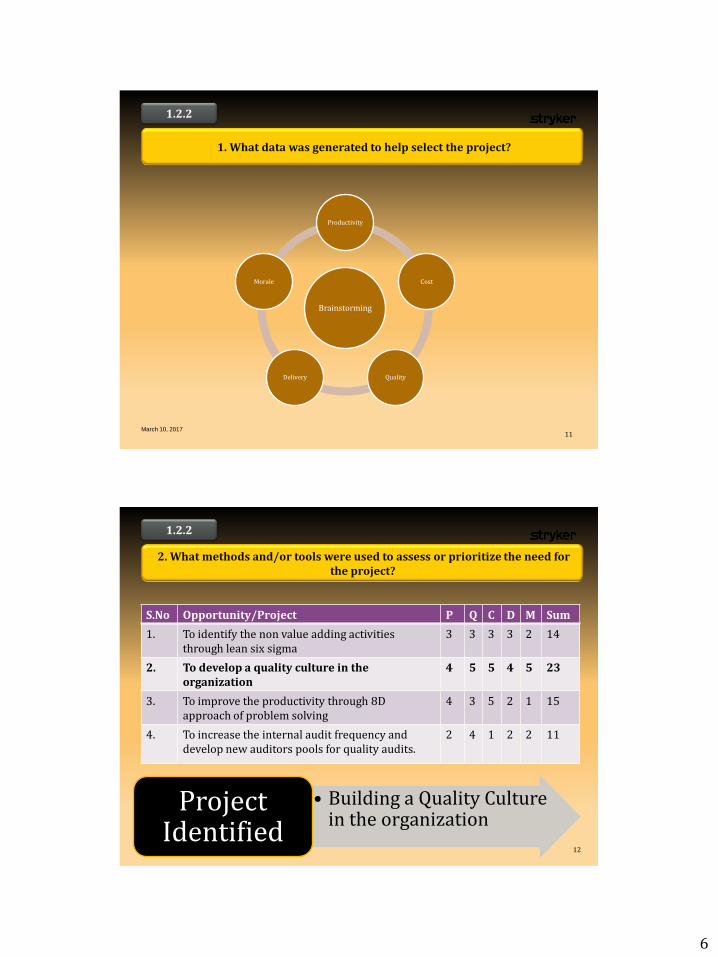
1. What data was generated to help select the project?
1.2.2
Brainstorming
Productivity
Cost
Quality Delivery
Morale
March 10, 2017 12
2. What methods and/or tools were used to assess or prioritize the need for the project?
1.2.2
S.No Opportunity/Project P Q C D M Sum
1. To identify the non value adding activities through lean six sigma
3 3 3 3 2 14
2. To develop a quality culture in the organization
4 5 5 4 5 23
3. To improve the productivity through 8D approach of problem solving
4 3 5 2 1 15
4. To increase the internal audit frequency and develop new auditors pools for quality audits.
2 4 1 2 2 11
• Building a Quality Culture in the organization
Project Identified
7
March 10, 2017 13
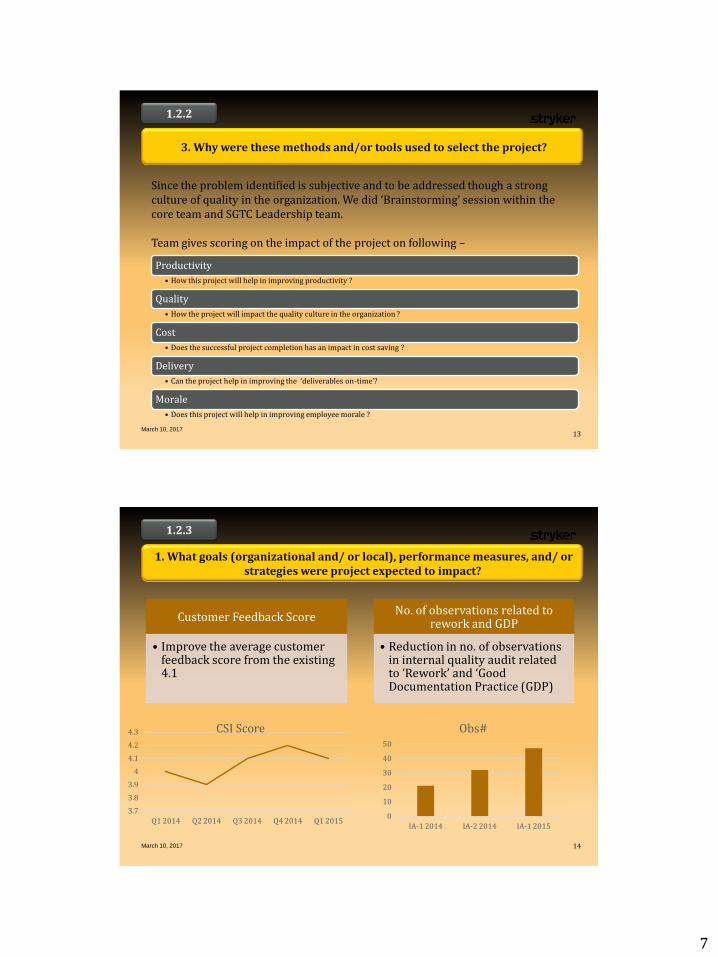
3. Why were these methods and/or tools used to select the project?
1.2.2
Since the problem identified is subjective and to be addressed though a strong culture of quality in the organization. We did ‘Brainstorming’ session within the core team and SGTC Leadership team. Team gives scoring on the impact of the project on following – Productivity
• How this project will help in improving productivity ?
Quality
• How the project will impact the quality culture in the organization ?
Cost
• Does the successful project completion has an impact in cost saving ?
Delivery
• Can the project help in improving the ‘deliverables on-time’?
Morale
• Does this project will help in improving employee morale ?
March 10, 2017 14
1. What goals (organizational and/ or local), performance measures, and/ or strategies were project expected to impact?
1.2.3
Customer Feedback Score
• Improve the average customer feedback score from the existing 4.1
No. of observations related to rework and GDP
• Reduction in no. of observations in internal quality audit related to ‘Rework’ and ‘Good Documentation Practice (GDP)
3.7
3.8
3.9
4
4.1
4.2
4.3
Q1 2014 Q2 2014 Q3 2014 Q4 2014 Q1 2015
CSI Score
0
10
20
30
40
50
IA-1 2014 IA-2 2014 IA-1 2015
Obs#
8
March 10, 2017 15
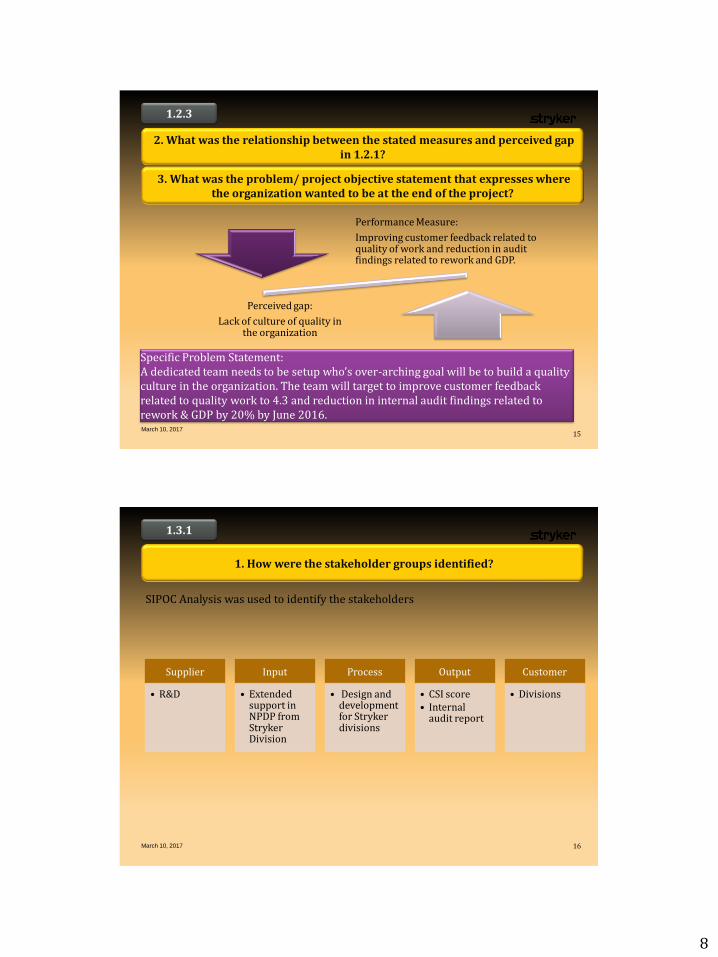
2. What was the relationship between the stated measures and perceived gap in 1.2.1?
1.2.3
3. What was the problem/ project objective statement that expresses where the organization wanted to be at the end of the project?
Performance Measure:
Improving customer feedback related to quality of work and reduction in audit findings related to rework and GDP.
Perceived gap:
Lack of culture of quality in the organization
Specific Problem Statement: A dedicated team needs to be setup who’s over-arching goal will be to build a quality culture in the organization. The team will target to improve customer feedback related to quality work to 4.3 and reduction in internal audit findings related to rework & GDP by 20% by June 2016.
March 10, 2017 16
1. How were the stakeholder groups identified?
1.3.1
Supplier
• R&D
Input
• Extended support in NPDP from Stryker Division
Process
• Design and development for Stryker divisions
Output
• CSI score • Internal
audit report
Customer
• Divisions
SIPOC Analysis was used to identify the stakeholders
9
March 10, 2017 17
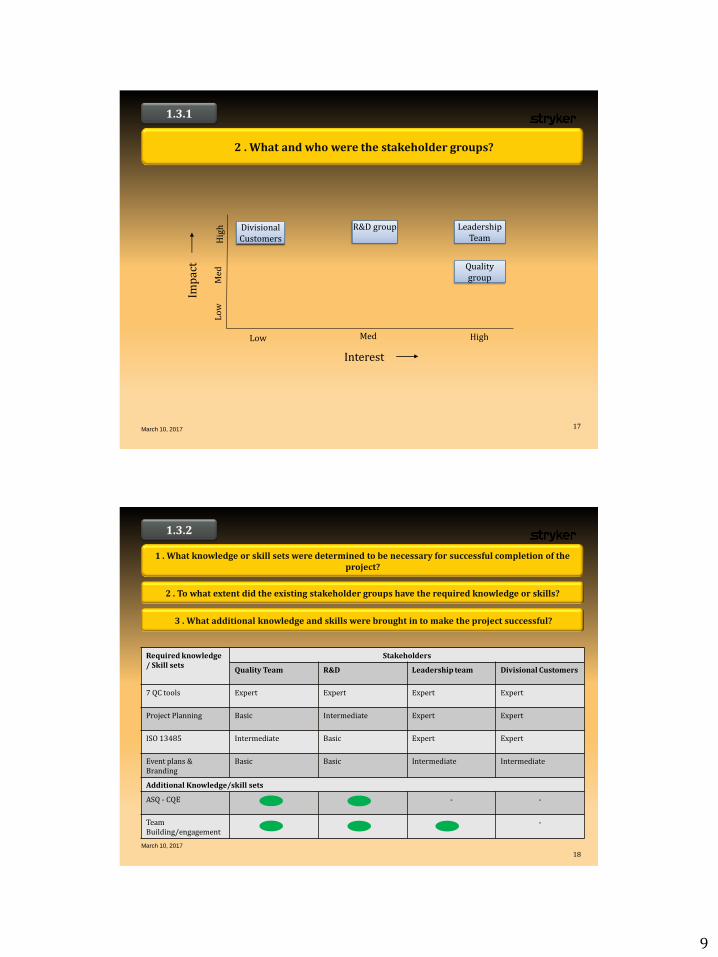
2 . What and who were the stakeholder groups?
1.3.1
Interest
Imp
act
Lo
w
Med
H
igh
Low Med High
Divisional Customers
Quality group
R&D group
Leadership Team
March 10, 2017
18
1 . What knowledge or skill sets were determined to be necessary for successful completion of the project?
1.3.2
2 . To what extent did the existing stakeholder groups have the required knowledge or skills?
3 . What additional knowledge and skills were brought in to make the project successful?
Required knowledge / Skill sets
Stakeholders
Quality Team R&D Leadership team Divisional Customers
7 QC tools Expert Expert Expert Expert
Project Planning Basic Intermediate Expert Expert
ISO 13485 Intermediate Basic Expert Expert
Event plans & Branding
Basic Basic Intermediate Intermediate
Additional Knowledge/skill sets
ASQ - CQE - -
Team Building/engagement
-
10
March 10, 2017 19
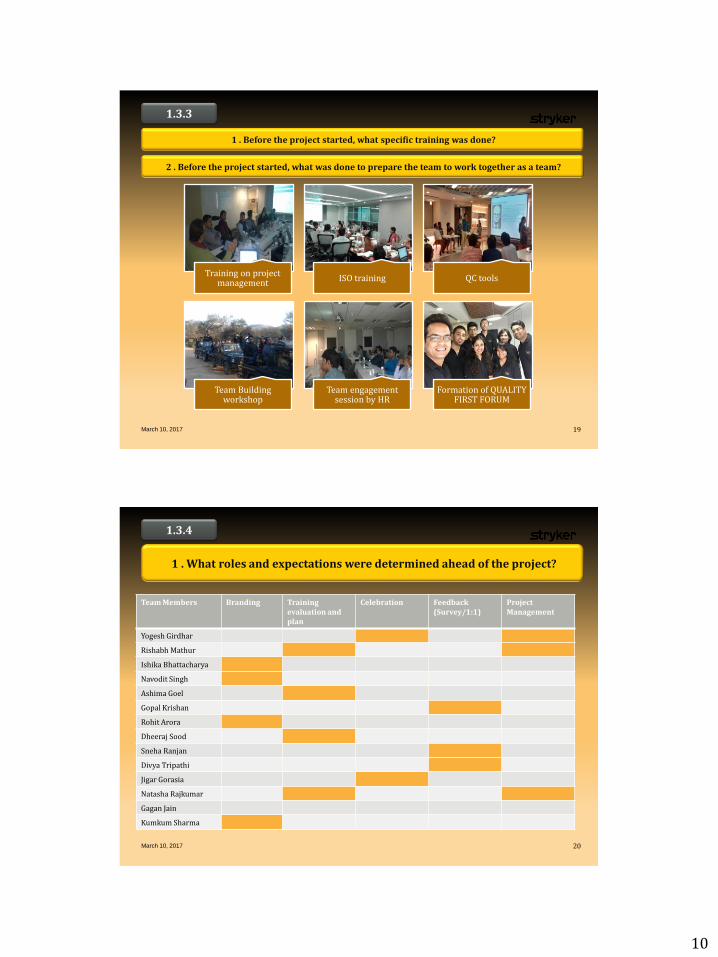
1 . Before the project started, what specific training was done?
1.3.3
2 . Before the project started, what was done to prepare the team to work together as a team?
Training on project management
ISO training QC tools
Team Building workshop
Team engagement session by HR
Formation of QUALITY FIRST FORUM
March 10, 2017 20
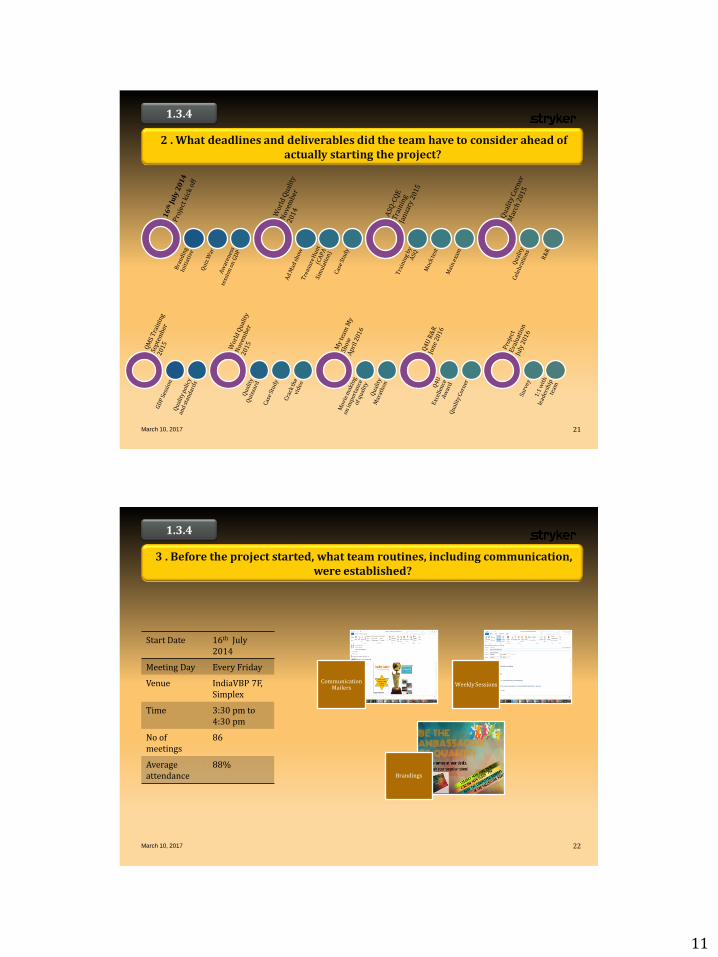
1 . What roles and expectations were determined ahead of the project?
1.3.4
Team Members Branding Training evaluation and plan
Celebration Feedback (Survey/1:1)
Project Management
Yogesh Girdhar
Rishabh Mathur
Ishika Bhattacharya
Navodit Singh
Ashima Goel
Gopal Krishan
Rohit Arora
Dheeraj Sood
Sneha Ranjan
Divya Tripathi
Jigar Gorasia
Natasha Rajkumar
Gagan Jain
Kumkum Sharma
11
March 10, 2017 21
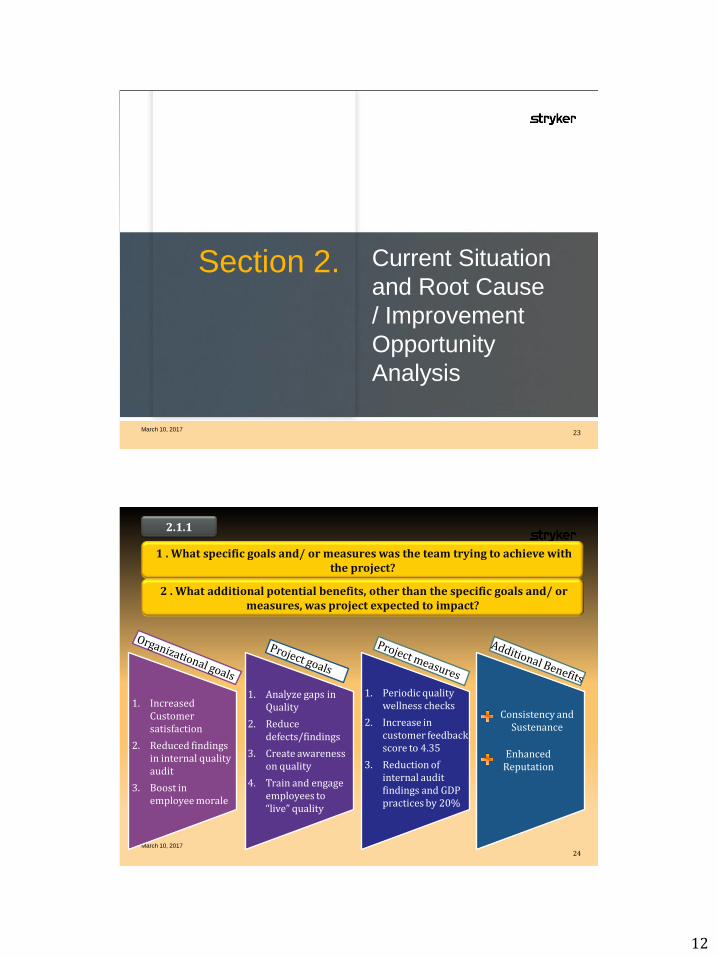
2 . What deadlines and deliverables did the team have to consider ahead of actually starting the project?
1.3.4
March 10, 2017 22
3 . Before the project started, what team routines, including communication, were established?
1.3.4
Start Date 16th July 2014
Meeting Day Every Friday
Venue IndiaVBP 7F, Simplex
Time 3:30 pm to 4:30 pm
No of meetings
86
Average attendance
88%
Communication Mailers
Weekly Sessions
Brandings
12
Section 2.
Current Situation
and Root Cause
/ Improvement
Opportunity
Analysis
March 10, 2017 23
March 10, 2017
24
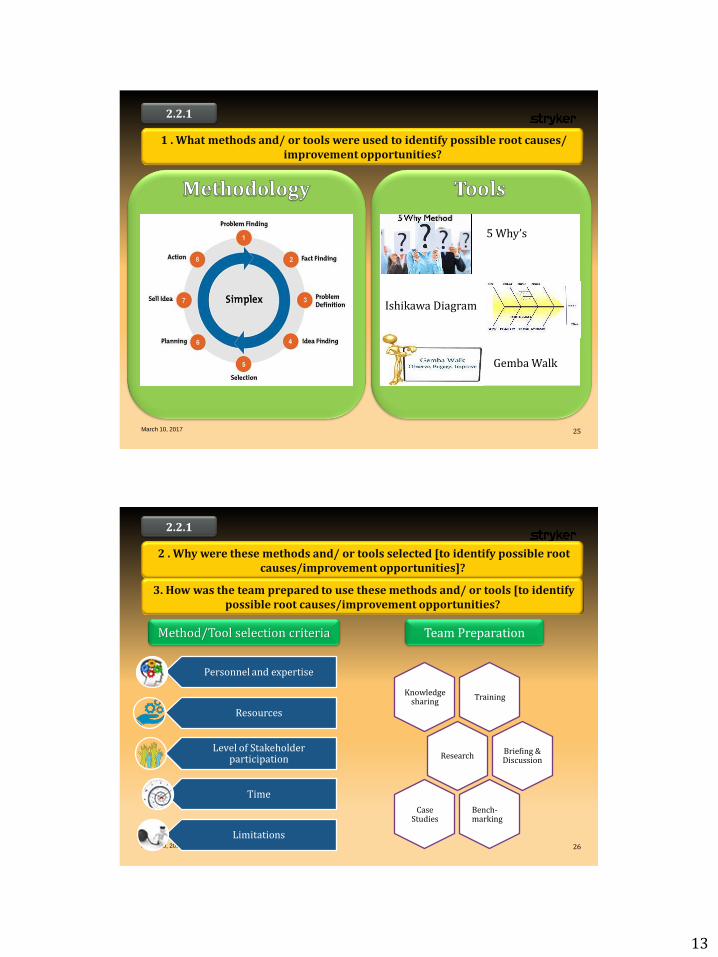
1 . What specific goals and/ or measures was the team trying to achieve with the project?
2.1.1
1. Increased Customer satisfaction
2. Reduced findings in internal quality audit
3. Boost in employee morale
1. Analyze gaps in Quality
2. Reduce defects/findings
3. Create awareness on quality
4. Train and engage employees to “live” quality
1. Periodic quality wellness checks
2. Increase in customer feedback score to 4.35
3. Reduction of internal audit findings and GDP practices by 20%
Consistency and Sustenance
Enhanced Reputation
2 . What additional potential benefits, other than the specific goals and/ or measures, was project expected to impact?
13
March 10, 2017 25
1 . What methods and/ or tools were used to identify possible root causes/ improvement opportunities?
2.2.1
5 Why’s
Ishikawa Diagram
Gemba Walk
March 10, 2017 26
2 . Why were these methods and/ or tools selected [to identify possible root causes/improvement opportunities]?
2.2.1
Personnel and expertise
Resources
Level of Stakeholder participation
Time
Limitations
3. How was the team prepared to use these methods and/ or tools [to identify possible root causes/improvement opportunities?
Team Preparation Method/Tool selection criteria
Training Knowledge
sharing
Research Briefing & Discussion
Bench-marking
Case Studies
14
March 10, 2017 27
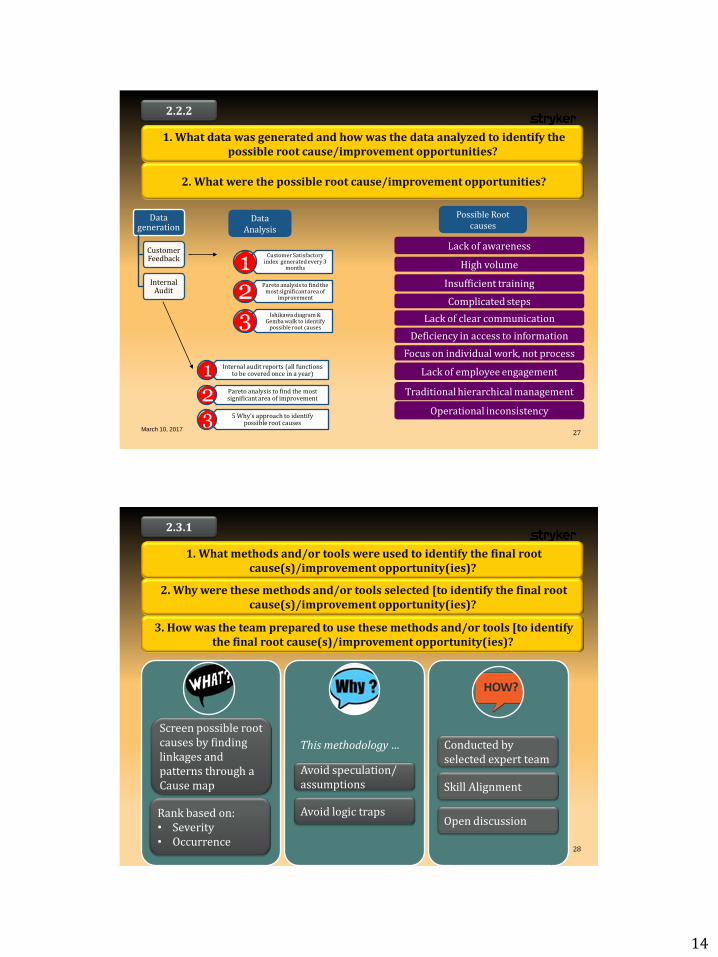
1. What data was generated and how was the data analyzed to identify the possible root cause/improvement opportunities?
2.2.2
Data generation
Customer Feedback
Internal Audit
Data Analysis
Customer Satisfactory index generated every 3
months
Pareto analysis to find the most significant area of
improvement
Ishikawa diagram & Gemba walk to identify
possible root causes
Internal audit reports (all functions to be covered once in a year)
Pareto analysis to find the most significant area of improvement
5 Why’s approach to identify possible root causes
2. What were the possible root cause/improvement opportunities?
Possible Root causes
Lack of awareness
High volume
Insufficient training
Complicated steps
Lack of clear communication
Lack of employee engagement
Traditional hierarchical management
Deficiency in access to information
Focus on individual work, not process
Operational inconsistency
March 10, 2017 28
1. What methods and/or tools were used to identify the final root cause(s)/improvement opportunity(ies)?
2.3.1
2. Why were these methods and/or tools selected [to identify the final root cause(s)/improvement opportunity(ies)?
3. How was the team prepared to use these methods and/or tools [to identify the final root cause(s)/improvement opportunity(ies)?
Avoid speculation/ assumptions
Avoid logic traps
Conducted by selected expert team
Skill Alignment
Open discussion
Screen possible root causes by finding linkages and patterns through a Cause map
Rank based on: • Severity • Occurrence
This methodology …
15
29
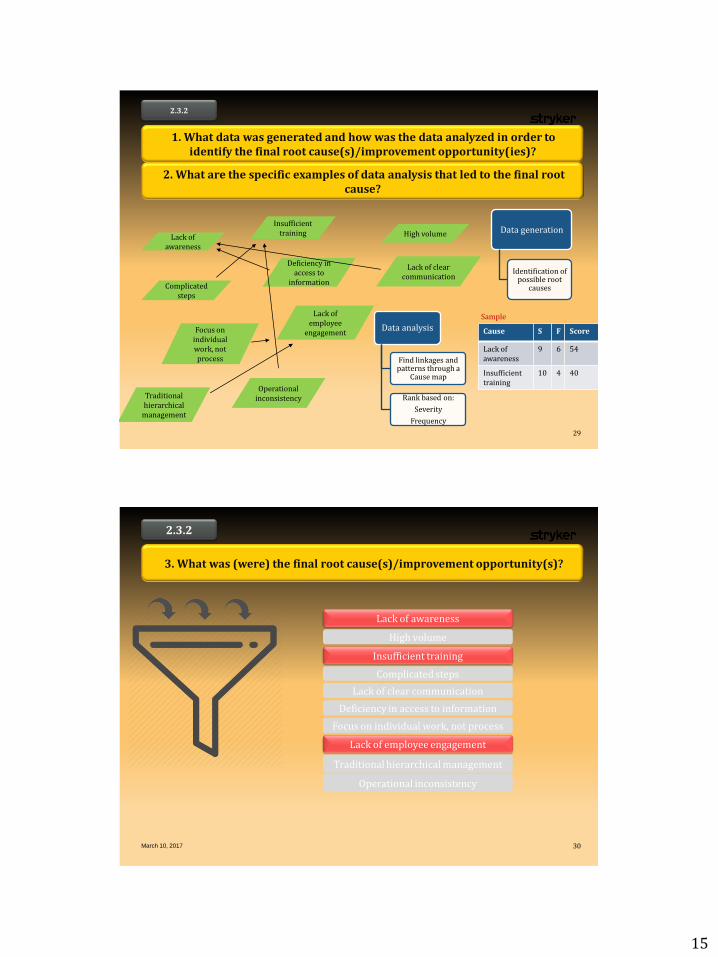
1. What data was generated and how was the data analyzed in order to identify the final root cause(s)/improvement opportunity(ies)?
2.3.2
Lack of employee
engagement
Lack of awareness
High volume
Insufficient training
Complicated steps
Lack of clear communication
Traditional hierarchical
management
Deficiency in access to
information
Focus on individual work, not process
Operational inconsistency
2. What are the specific examples of data analysis that led to the final root cause?
Data generation
Identification of possible root
causes
Data analysis
Find linkages and patterns through a
Cause map
Rank based on:
Severity
Frequency
Cause S F Score
Lack of awareness
9 6 54
Insufficient training
10 4 40
Sample
March 10, 2017 30
3. What was (were) the final root cause(s)/improvement opportunity(s)?
2.3.2
Lack of awareness
High volume
Insufficient training
Complicated steps
Lack of clear communication
Lack of employee engagement
Traditional hierarchical management
Deficiency in access to information
Focus on individual work, not process
Operational inconsistency
16
March 10, 2017 31
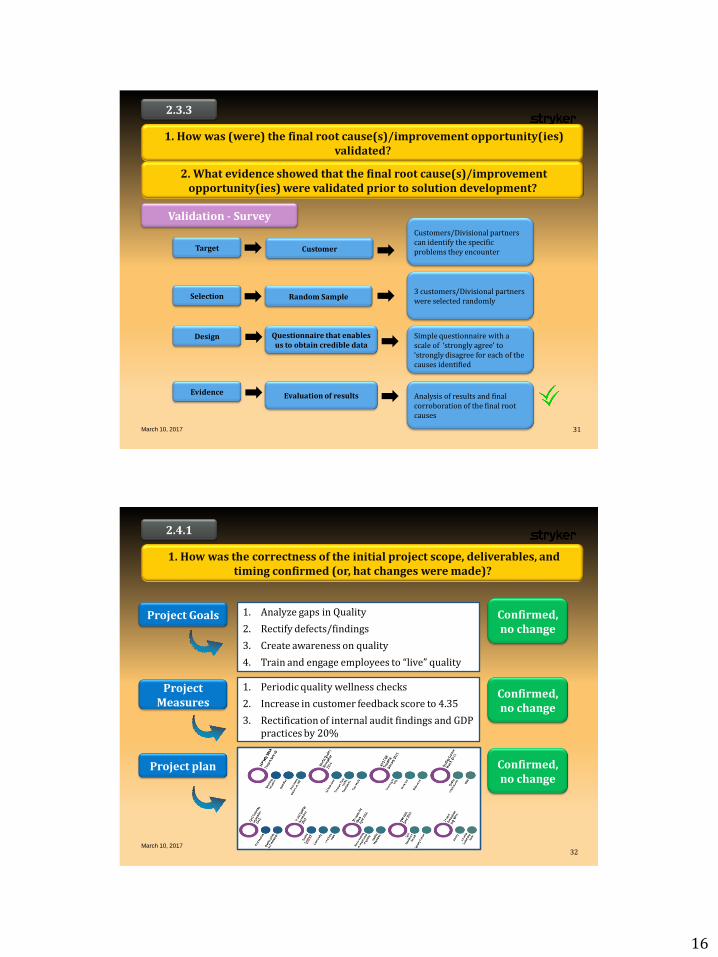
1. How was (were) the final root cause(s)/improvement opportunity(ies) validated?
2.3.3
2. What evidence showed that the final root cause(s)/improvement opportunity(ies) were validated prior to solution development?
Validation - Survey
Target
Selection
Design
Random Sample
Questionnaire that enables us to obtain credible data
Customers/Divisional partners can identify the specific problems they encounter
3 customers/Divisional partners were selected randomly
Simple questionnaire with a scale of ‘strongly agree’ to ‘strongly disagree for each of the causes identified
Evidence Evaluation of results Analysis of results and final corroboration of the final root causes
Customer
March 10, 2017 32
1. How was the correctness of the initial project scope, deliverables, and timing confirmed (or, hat changes were made)?
2.4.1
Project Goals
Project Measures
Project plan
1. Analyze gaps in Quality
2. Rectify defects/findings
3. Create awareness on quality
4. Train and engage employees to “live” quality
Confirmed, no change
1. Periodic quality wellness checks
2. Increase in customer feedback score to 4.35
3. Rectification of internal audit findings and GDP practices by 20%
Confirmed, no change
Confirmed, no change
17
March 10, 2017
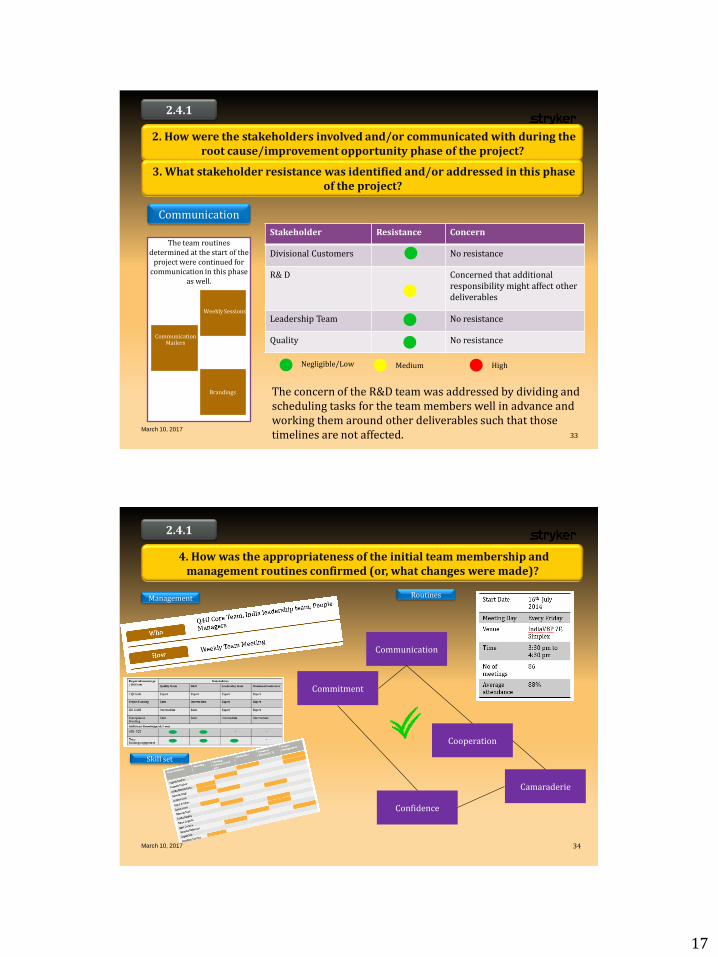
2. How were the stakeholders involved and/or communicated with during the root cause/improvement opportunity phase of the project?
2.4.1
3. What stakeholder resistance was identified and/or addressed in this phase of the project?
Communication
The team routines determined at the start of the
project were continued for communication in this phase
as well.
Communication Mailers
Weekly Sessions
Brandings
Stakeholder Resistance Concern
Divisional Customers No resistance
R& D Concerned that additional responsibility might affect other deliverables
Leadership Team No resistance
Quality No resistance
Negligible/Low High Medium
The concern of the R&D team was addressed by dividing and scheduling tasks for the team members well in advance and working them around other deliverables such that those timelines are not affected. 33
March 10, 2017 34
4. How was the appropriateness of the initial team membership and management routines confirmed (or, what changes were made)?
2.4.1
Management
Skill set
Routines
Communication
Commitment
Cooperation
Confidence
Camaraderie
18
Section 3.
Solution/
Improvement
Development
March 10, 2017 35
March 10, 2017 36
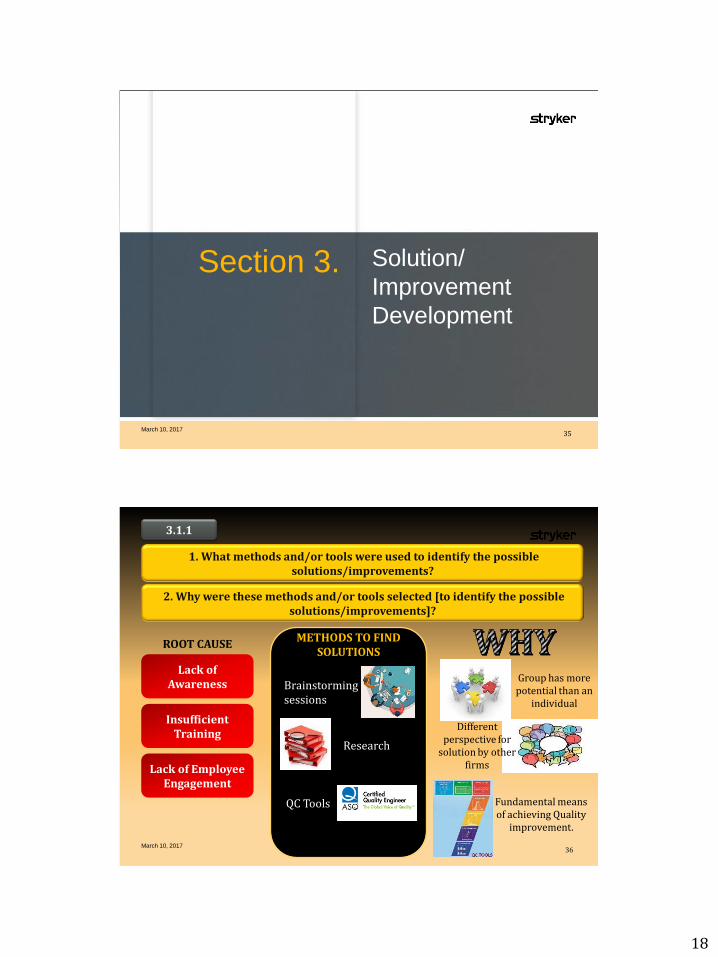
1. What methods and/or tools were used to identify the possible solutions/improvements?
3.1.1
Brainstorming sessions
2. Why were these methods and/or tools selected [to identify the possible solutions/improvements]?
METHODS TO FIND SOLUTIONS
Group has more potential than an
individual
Different perspective for
solution by other firms
Fundamental means of achieving Quality
improvement.
ROOT CAUSE
Lack of Awareness
Insufficient Training
Lack of Employee Engagement
Research
QC Tools
19
Brainstorming sessions
METHODS TO FIND SOLUTIONS
Research
QC Tools
March 10, 2017 37
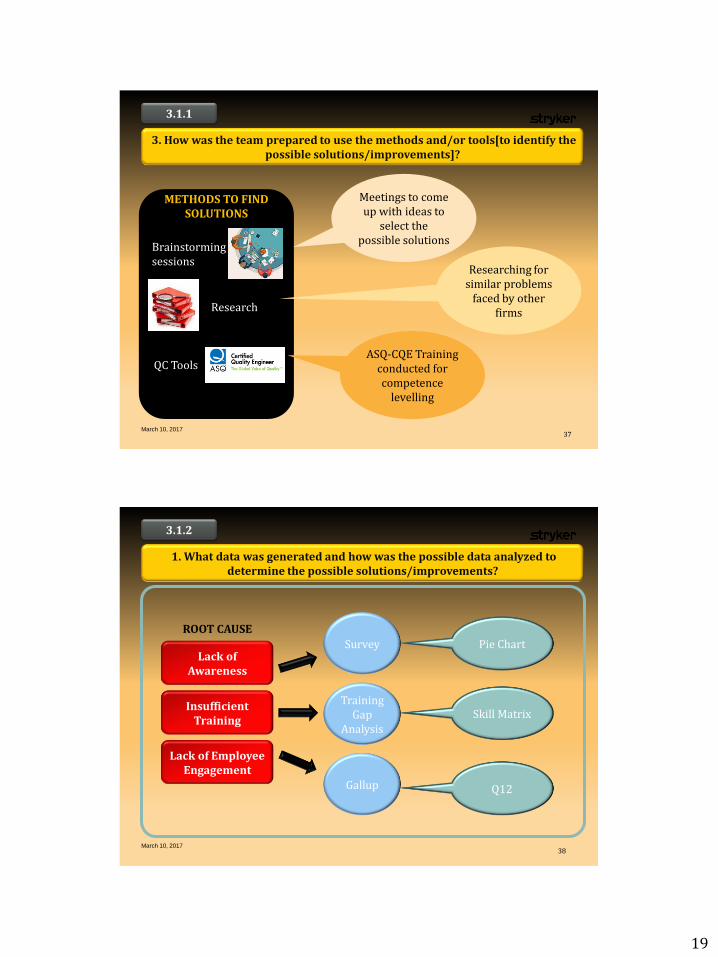
3. How was the team prepared to use the methods and/or tools[to identify the possible solutions/improvements]?
3.1.1
Meetings to come up with ideas to
select the possible solutions
Researching for similar problems
faced by other firms
ASQ-CQE Training conducted for competence
levelling
March 10, 2017 38
1. What data was generated and how was the possible data analyzed to determine the possible solutions/improvements?
3.1.2
ROOT CAUSE
Lack of Awareness
Insufficient Training
Lack of Employee Engagement
Survey
Training Gap
Analysis
Gallup
Pie Chart
Skill Matrix
Q12
20
March 10, 2017 39
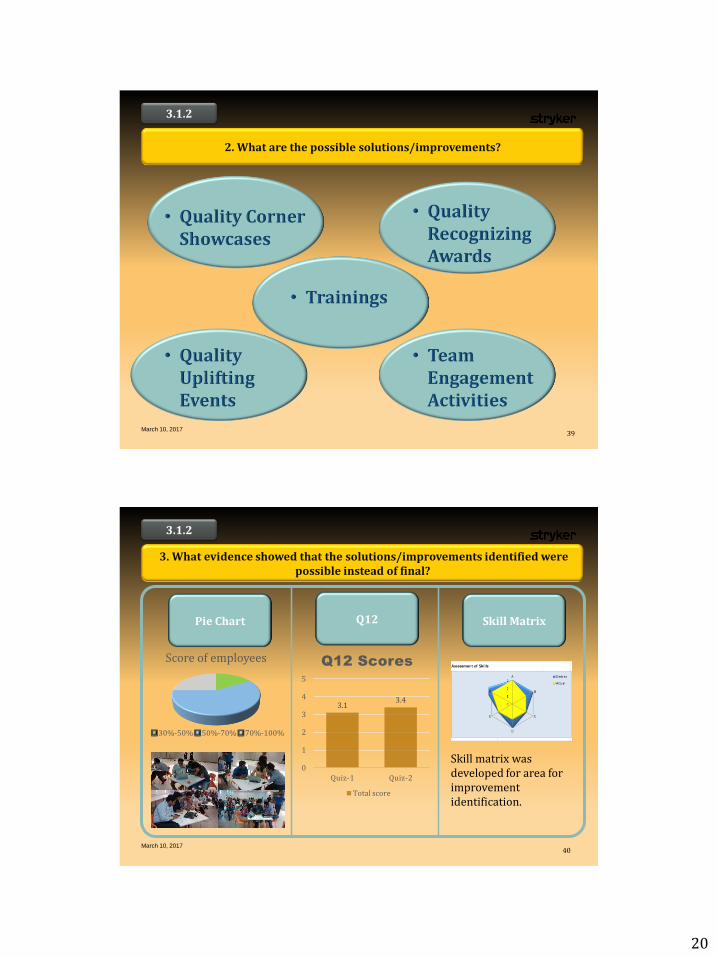
2. What are the possible solutions/improvements?
3.1.2
March 10, 2017 40
3. What evidence showed that the solutions/improvements identified were possible instead of final?
3.1.2
Pie Chart Skill Matrix Q12
Skill matrix was developed for area for improvement identification.
Score of employees
30%-50% 50%-70% 70%-100%
3.1 3.4
0
1
2
3
4
5
Quiz-1 Quiz-2
Q12 Scores
Total score
21
March 10, 2017 41
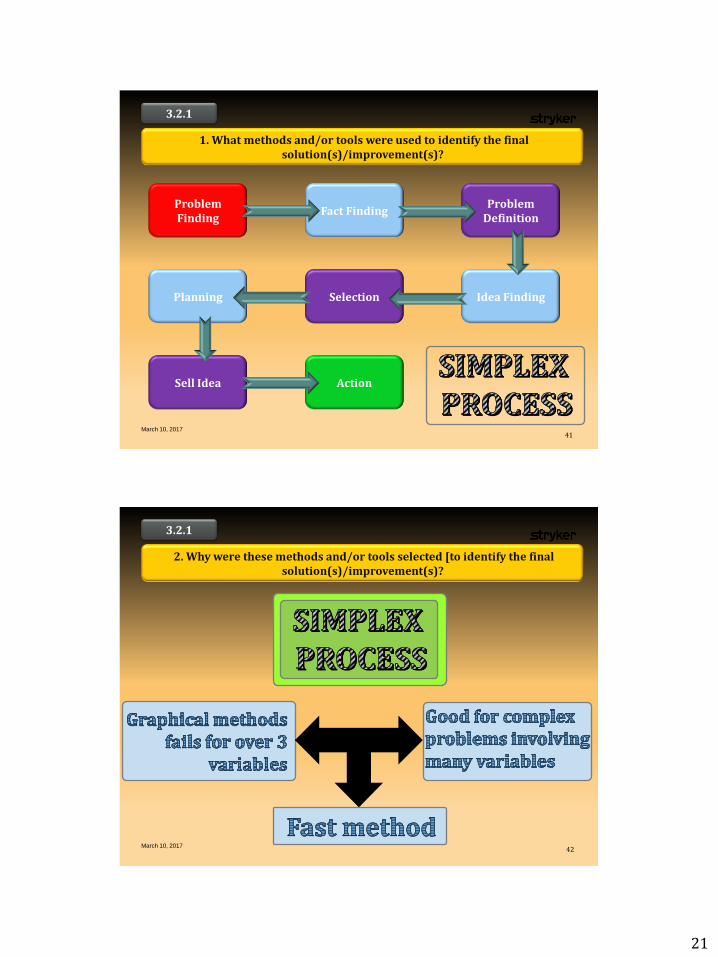
1. What methods and/or tools were used to identify the final solution(s)/improvement(s)?
3.2.1
Problem Finding
Fact Finding Problem
Definition
Idea Finding Selection Planning
Sell Idea Action
March 10, 2017 42
2. Why were these methods and/or tools selected [to identify the final solution(s)/improvement(s)?
3.2.1
22
March 10, 2017 43
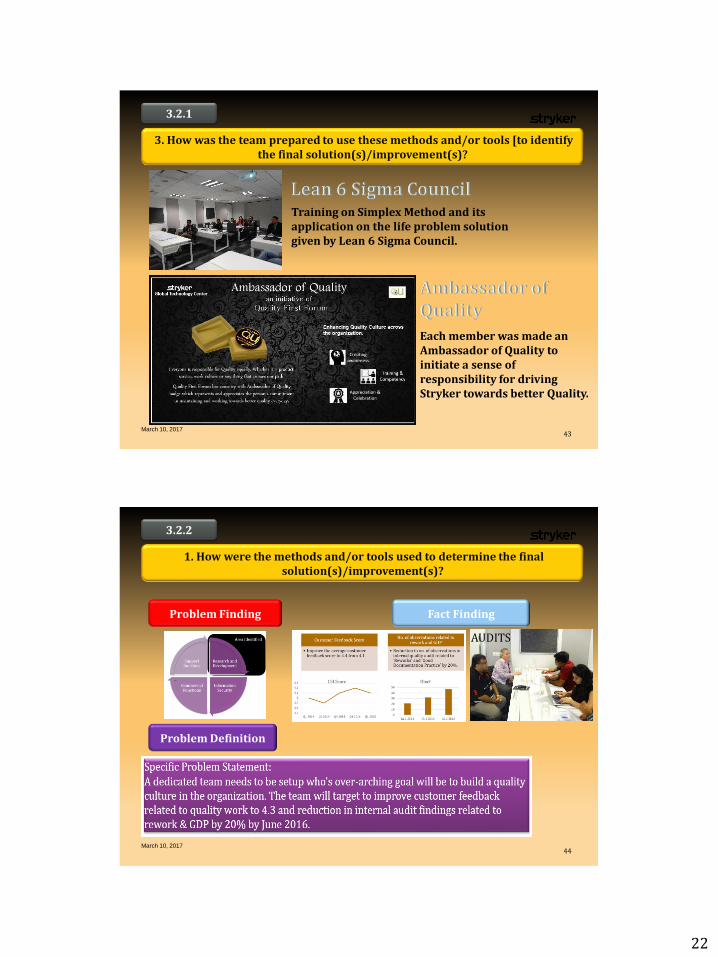
3. How was the team prepared to use these methods and/or tools [to identify the final solution(s)/improvement(s)?
3.2.1
Training on Simplex Method and its application on the life problem solution given by Lean 6 Sigma Council.
Each member was made an Ambassador of Quality to initiate a sense of responsibility for driving Stryker towards better Quality.
March 10, 2017 44
1. How were the methods and/or tools used to determine the final solution(s)/improvement(s)?
3.2.2
Problem Finding Fact Finding
Problem Definition
AUDITS
23
March 10, 2017 45
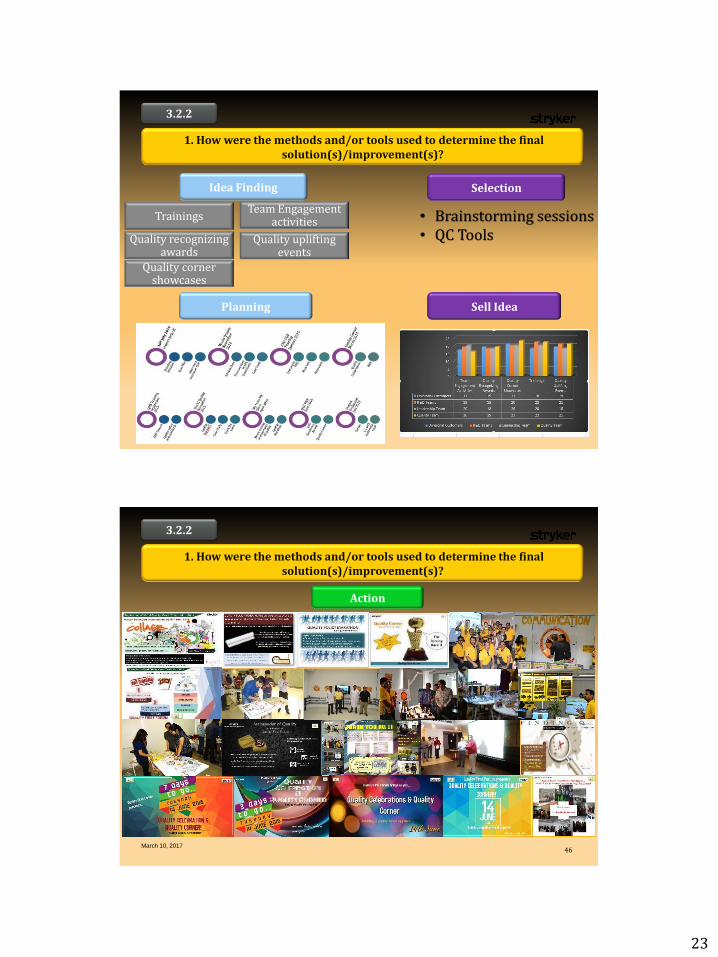
1. How were the methods and/or tools used to determine the final solution(s)/improvement(s)?
3.2.2
Idea Finding
Team Engagement activities
Quality recognizing awards
Trainings
Quality uplifting events
Quality corner showcases
Selection
• Brainstorming sessions • QC Tools
Planning Sell Idea
March 10, 2017 46
1. How were the methods and/or tools used to determine the final solution(s)/improvement(s)?
3.2.2
Action
24
March 10, 2017 47
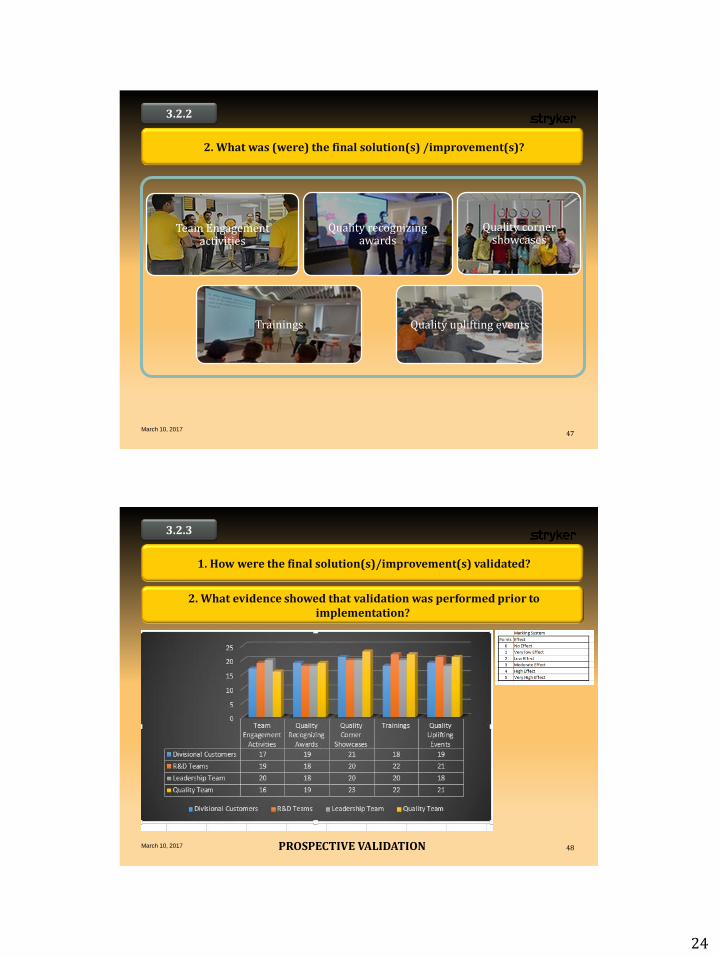
2. What was (were) the final solution(s) /improvement(s)?
3.2.2
Team Engagement activities
Quality recognizing awards
Trainings Quality uplifting events
Quality corner showcases
March 10, 2017 48
1. How were the final solution(s)/improvement(s) validated?
3.2.3
2. What evidence showed that validation was performed prior to implementation?
PROSPECTIVE VALIDATION
25
March 10, 2017 49
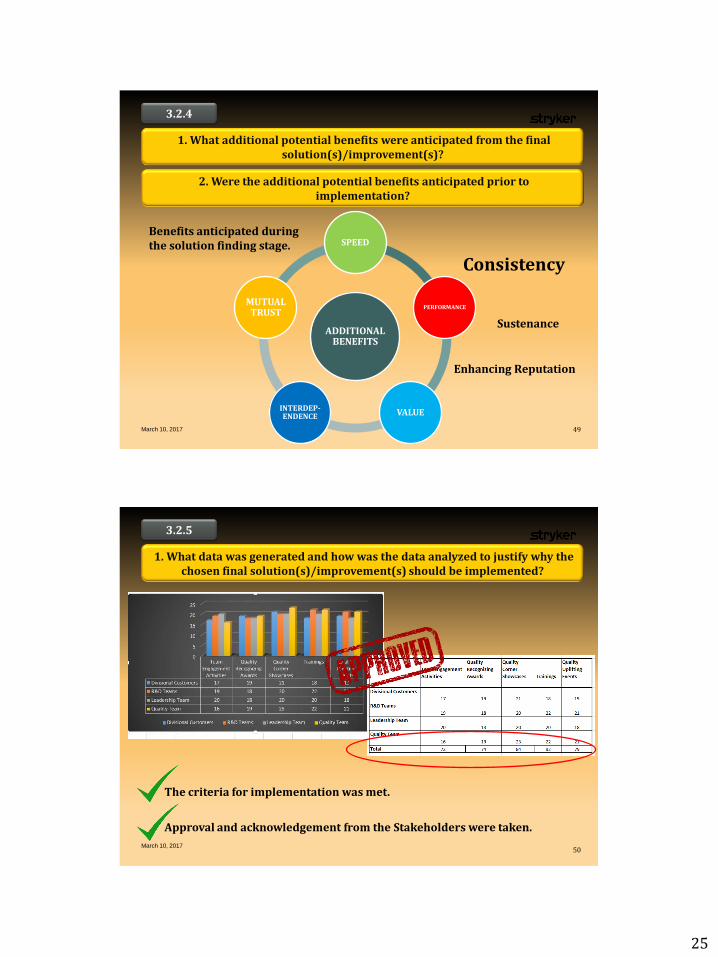
1. What additional potential benefits were anticipated from the final solution(s)/improvement(s)?
3.2.4
ADDITIONAL BENEFITS
SPEED
PERFORMANCE
VALUE INTERDEP-ENDENCE
MUTUAL TRUST
2. Were the additional potential benefits anticipated prior to implementation?
Consistency
Enhancing Reputation
Sustenance
Benefits anticipated during the solution finding stage.
March 10, 2017 50
1. What data was generated and how was the data analyzed to justify why the chosen final solution(s)/improvement(s) should be implemented?
3.2.5
The criteria for implementation was met.
Approval and acknowledgement from the Stakeholders were taken.
26
March 10, 2017 51
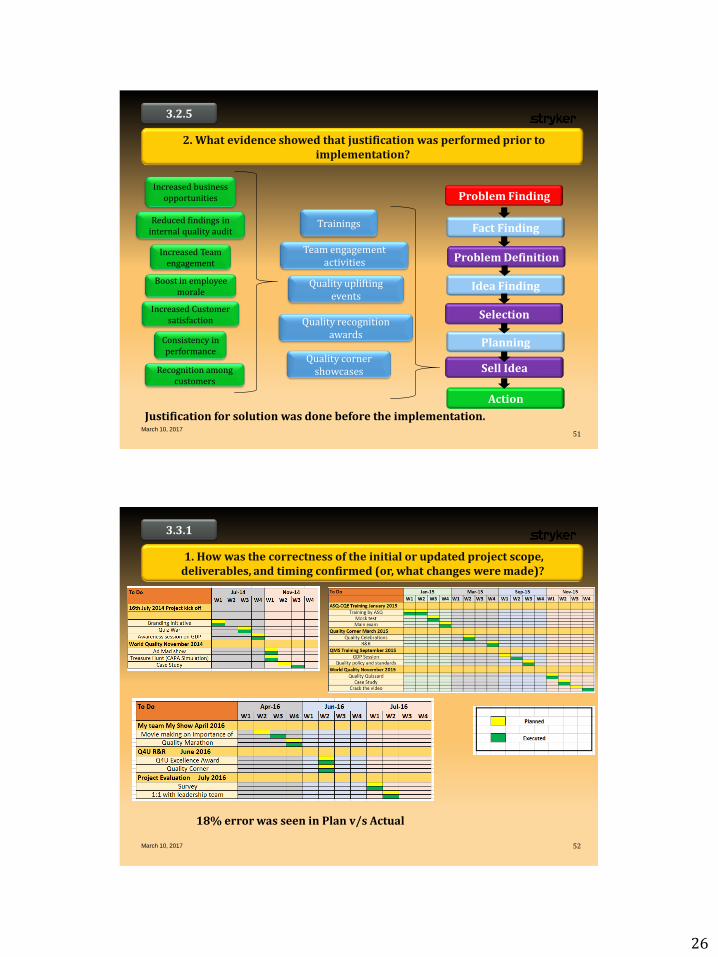
2. What evidence showed that justification was performed prior to implementation?
3.2.5
Team engagement activities
Trainings
Quality corner showcases
Quality uplifting events
Quality recognition awards
Increased Customer satisfaction
Reduced findings in internal quality audit
Boost in employee morale
Consistency in performance
Recognition among customers
Increased Team engagement
Increased business opportunities Problem Finding
Fact Finding
Problem Definition
Idea Finding
Selection
Planning
Sell Idea
Action
Justification for solution was done before the implementation.
March 10, 2017 52
1. How was the correctness of the initial or updated project scope, deliverables, and timing confirmed (or, what changes were made)?
3.3.1
18% error was seen in Plan v/s Actual
27
March 10, 2017 53
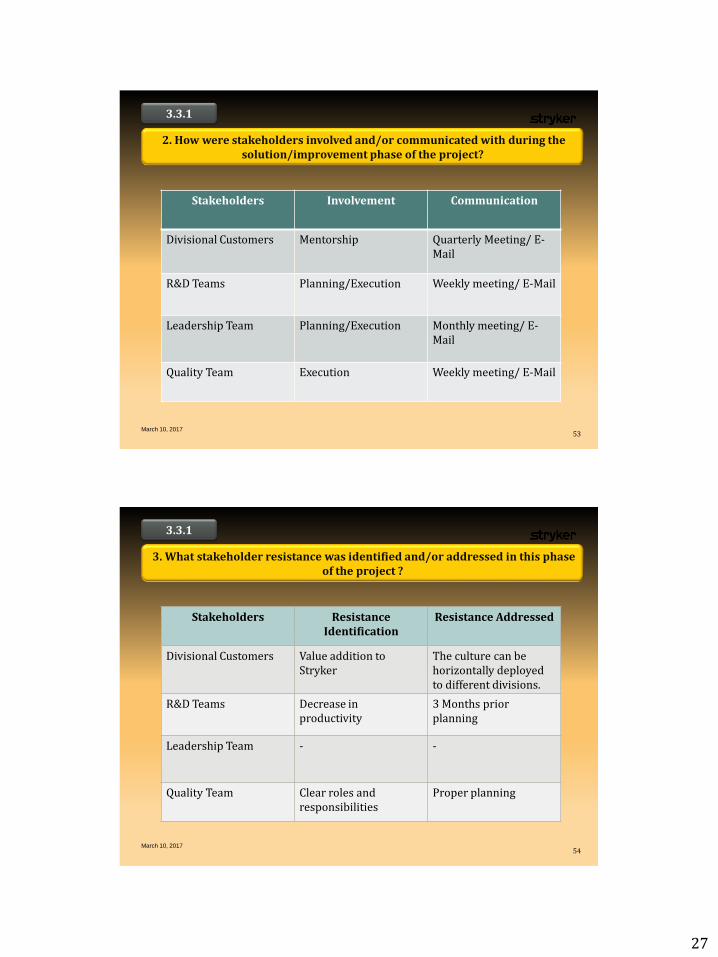
2. How were stakeholders involved and/or communicated with during the solution/improvement phase of the project?
3.3.1
Stakeholders Involvement Communication
Divisional Customers Mentorship Quarterly Meeting/ E-Mail
R&D Teams Planning/Execution Weekly meeting/ E-Mail
Leadership Team Planning/Execution Monthly meeting/ E-Mail
Quality Team Execution Weekly meeting/ E-Mail
March 10, 2017 54
3. What stakeholder resistance was identified and/or addressed in this phase of the project ?
3.3.1
Stakeholders Resistance Identification
Resistance Addressed
Divisional Customers Value addition to Stryker
The culture can be horizontally deployed to different divisions.
R&D Teams Decrease in productivity
3 Months prior planning
Leadership Team - -
Quality Team Clear roles and responsibilities
Proper planning
28
March 10, 2017 55
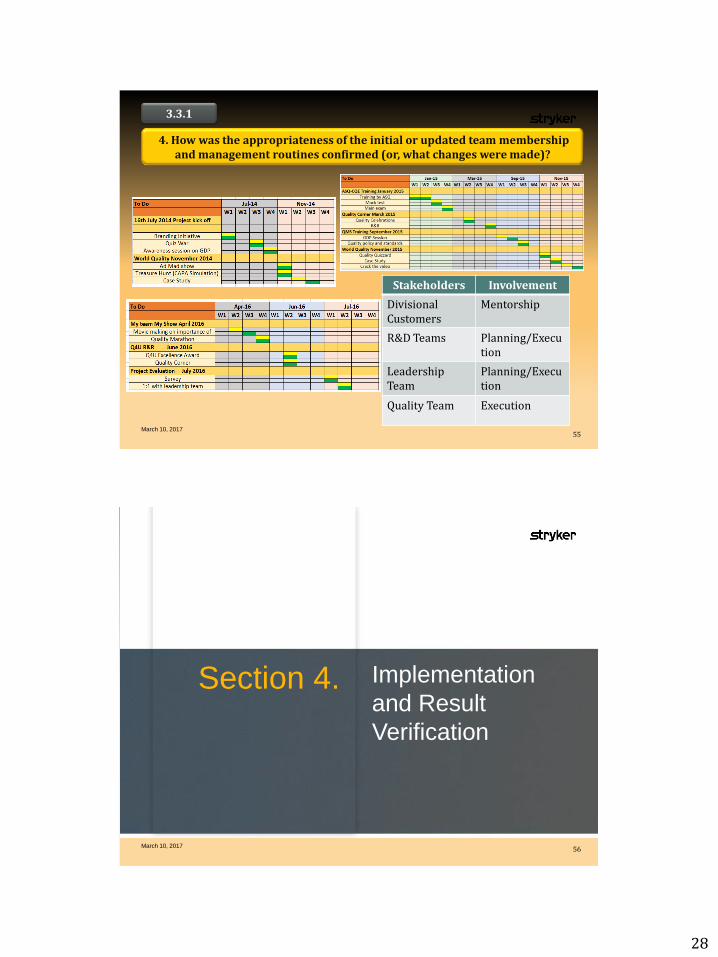
4. How was the appropriateness of the initial or updated team membership and management routines confirmed (or, what changes were made)?
3.3.1
Stakeholders Involvement
Divisional Customers
Mentorship
R&D Teams Planning/Execution
Leadership Team
Planning/Execution
Quality Team Execution
Section 4.
Implementation
and Result
Verification
March 10, 2017 56
29
March 10, 2017 57
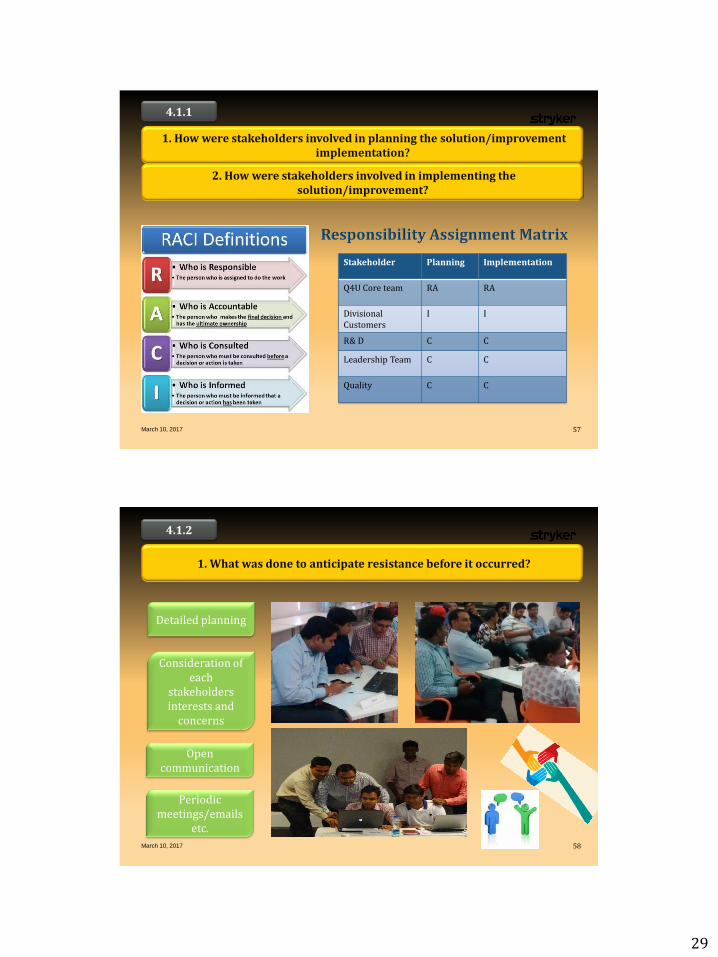
1. How were stakeholders involved in planning the solution/improvement implementation?
4.1.1
Stakeholder Planning Implementation
Q4U Core team RA RA
Divisional Customers
I I
R& D C C
Leadership Team C C
Quality C C
2. How were stakeholders involved in implementing the solution/improvement?
March 10, 2017 58
1. What was done to anticipate resistance before it occurred?
4.1.2
Detailed planning
Consideration of each
stakeholders interests and
concerns
Open communication
Periodic meetings/emails
etc.
30
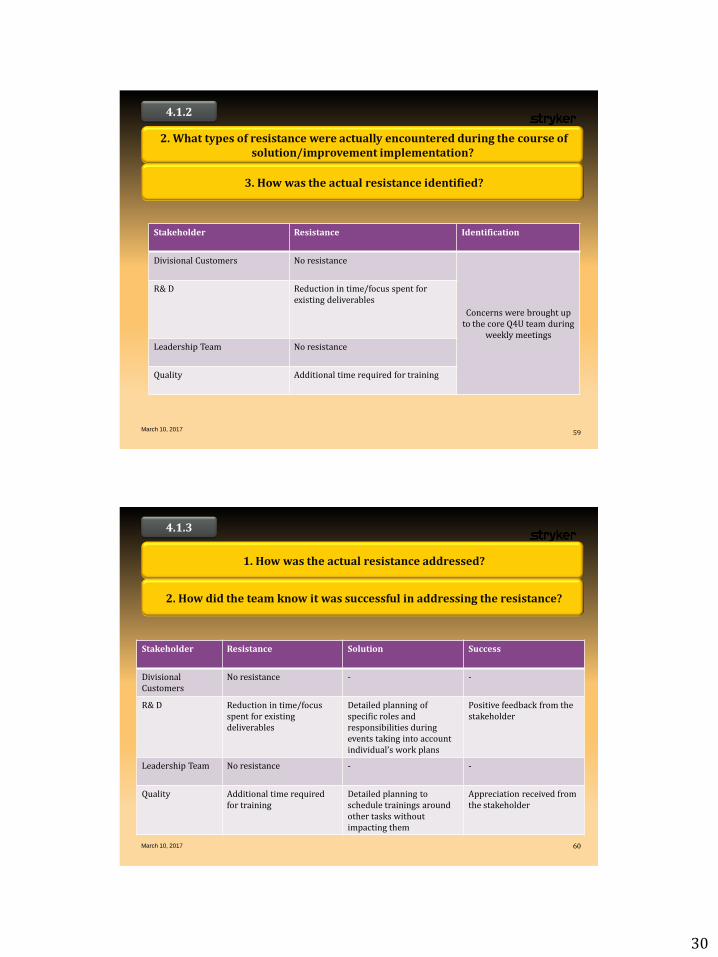
March 10, 2017 59
2. What types of resistance were actually encountered during the course of solution/improvement implementation?
4.1.2
Stakeholder Resistance Identification
Divisional Customers No resistance
Concerns were brought up to the core Q4U team during
weekly meetings
R& D Reduction in time/focus spent for existing deliverables
Leadership Team No resistance
Quality Additional time required for training
3. How was the actual resistance identified?
March 10, 2017 60
1. How was the actual resistance addressed?
4.1.3
2. How did the team know it was successful in addressing the resistance?
Stakeholder Resistance Solution Success
Divisional Customers
No resistance - -
R& D Reduction in time/focus spent for existing deliverables
Detailed planning of specific roles and responsibilities during events taking into account individual’s work plans
Positive feedback from the stakeholder
Leadership Team No resistance - -
Quality Additional time required for training
Detailed planning to schedule trainings around other tasks without impacting them
Appreciation received from the stakeholder
31
March 10, 2017 61
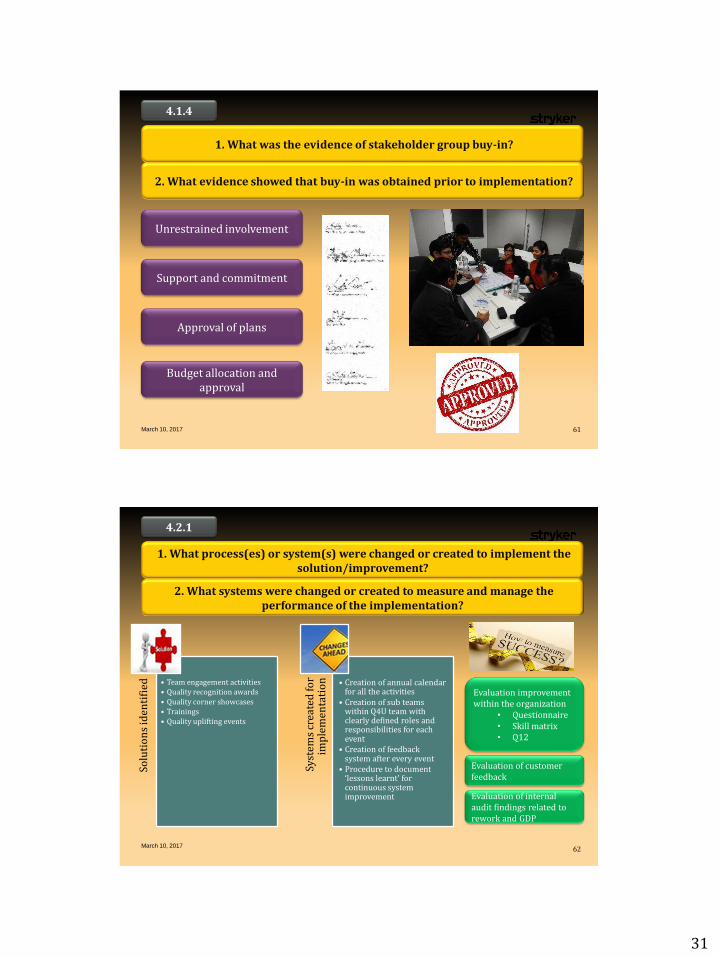
1. What was the evidence of stakeholder group buy-in?
4.1.4
2. What evidence showed that buy-in was obtained prior to implementation?
Unrestrained involvement
Support and commitment
Approval of plans
Budget allocation and approval
March 10, 2017 62
1. What process(es) or system(s) were changed or created to implement the solution/improvement?
4.2.1
Solu
tio
ns
iden
tifi
ed
• Team engagement activities • Quality recognition awards • Quality corner showcases • Trainings • Quality uplifting events
Syst
ems
crea
ted
fo
r im
ple
men
tati
on
• Creation of annual calendar for all the activities
• Creation of sub teams within Q4U team with clearly defined roles and responsibilities for each event
• Creation of feedback system after every event
• Procedure to document ‘lessons learnt’ for continuous system improvement
2. What systems were changed or created to measure and manage the performance of the implementation?
Evaluation improvement within the organization
• Questionnaire • Skill matrix • Q12
Evaluation of customer feedback
Evaluation of internal audit findings related to rework and GDP
32
March 10, 2017 63
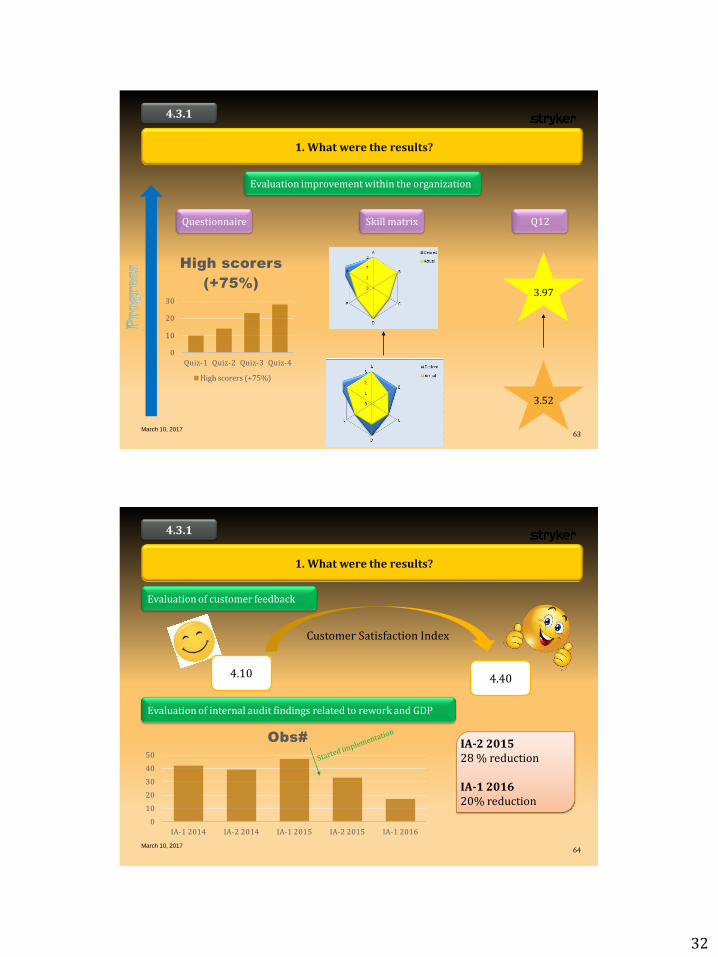
1. What were the results?
4.3.1
Evaluation improvement within the organization
Questionnaire Skill matrix Q12
3.97
3.52
0
10
20
30
Quiz-1 Quiz-2 Quiz-3 Quiz-4
High scorers
(+75%)
High scorers (+75%)
March 10, 2017 64
1. What were the results?
4.3.1
Evaluation of customer feedback
Evaluation of internal audit findings related to rework and GDP
Customer Satisfaction Index
4.10 4.40
0
10
20
30
40
50
IA-1 2014 IA-2 2014 IA-1 2015 IA-2 2015 IA-1 2016
Obs# IA-2 2015 28 % reduction IA-1 2016 20% reduction
33
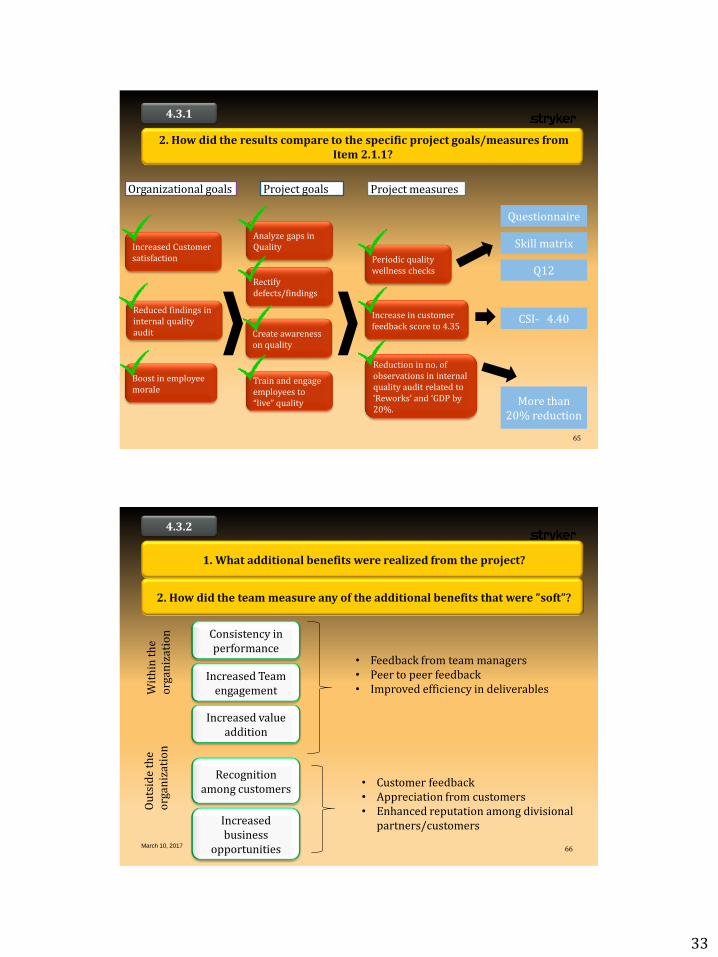
2. How did the results compare to the specific project goals/measures from Item 2.1.1?
4.3.1
Periodic quality wellness checks
Increase in customer feedback score to 4.35
Reduction in no. of observations in internal quality audit related to ‘Reworks’ and ‘GDP by 20%.
Questionnaire
Skill matrix
Q12
CSI- 4.40
More than 20% reduction
Analyze gaps in Quality
Rectify defects/findings
Create awareness on quality
Train and engage employees to “live” quality
Increased Customer satisfaction
Reduced findings in internal quality audit
Boost in employee morale
Organizational goals Project goals Project measures
65
March 10, 2017 66
1. What additional benefits were realized from the project?
4.3.2
2. How did the team measure any of the additional benefits that were ”soft”?
Consistency in performance
Recognition among customers
Increased value addition
Increased Team engagement
• Feedback from team managers • Peer to peer feedback • Improved efficiency in deliverables
• Customer feedback • Appreciation from customers • Enhanced reputation among divisional
partners/customers Increased business
opportunities
Wit
hin
th
e o
rgan
izat
ion
Ou
tsid
e th
e o
rgan
izat
ion
34
March 10, 2017 67
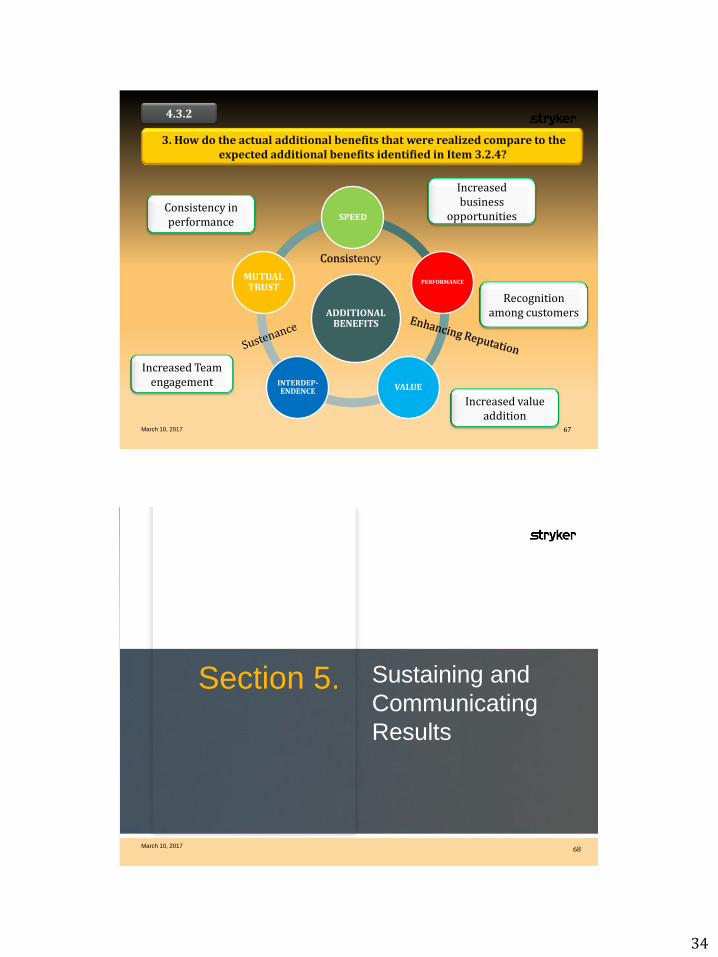
3. How do the actual additional benefits that were realized compare to the expected additional benefits identified in Item 3.2.4?
4.3.2
Consistency in performance
Recognition among customers
Increased value addition
Increased Team engagement
ADDITIONAL BENEFITS
SPEED
PERFORMANCE
VALUE INTERDEP-ENDENCE
MUTUAL TRUST
Consistency
Increased business
opportunities
Section 5.
Sustaining and
Communicating
Results
March 10, 2017 68
35
March 10, 2017 69
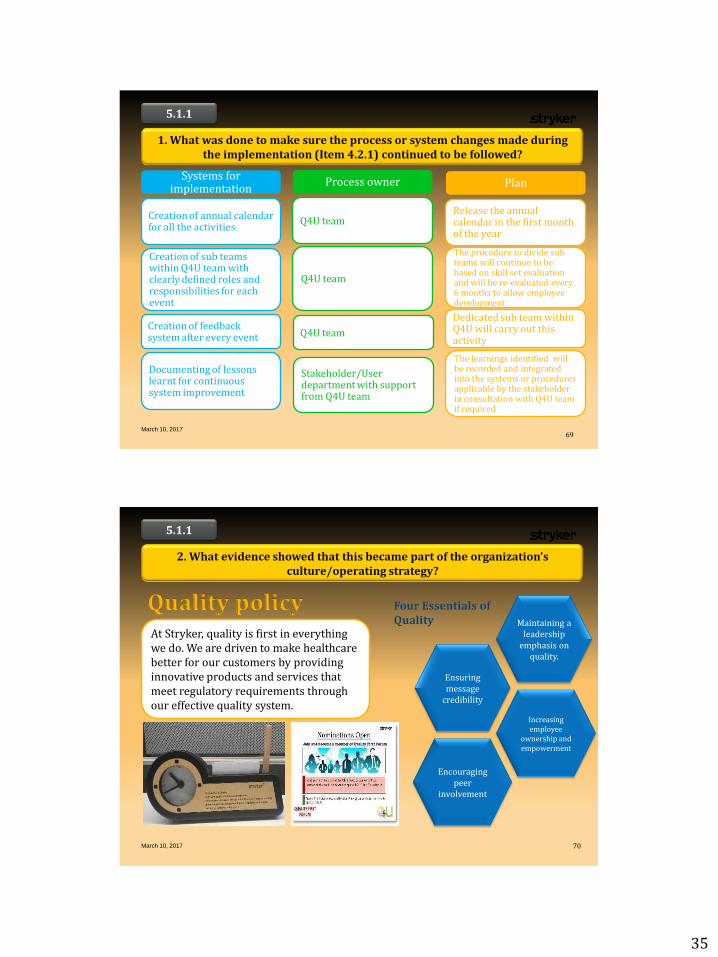
1. What was done to make sure the process or system changes made during the implementation (Item 4.2.1) continued to be followed?
5.1.1
Systems for implementation
Documenting of lessons learnt for continuous system improvement
Creation of annual calendar for all the activities
Creation of sub teams within Q4U team with clearly defined roles and responsibilities for each event
Creation of feedback system after every event
Process owner
Stakeholder/User department with support from Q4U team
Q4U team
Q4U team
Q4U team
Plan
The learnings identified will be recorded and integrated into the systems or procedures applicable by the stakeholder in consultation with Q4U team if required
Release the annual calendar in the first month of the year
The procedure to divide sub teams will continue to be based on skill set evaluation and will be re-evaluated every 6 months to allow employee development
Dedicated sub team within Q4U will carry out this activity
At Stryker, quality is first in everything we do. We are driven to make healthcare better for our customers by providing innovative products and services that meet regulatory requirements through our effective quality system.
March 10, 2017 70
2. What evidence showed that this became part of the organization’s culture/operating strategy?
5.1.1
Quality policy
Encouraging peer
involvement
Maintaining a leadership
emphasis on quality.
Ensuring message
credibility
Increasing employee
ownership and empowerment
36
March 10, 2017 71
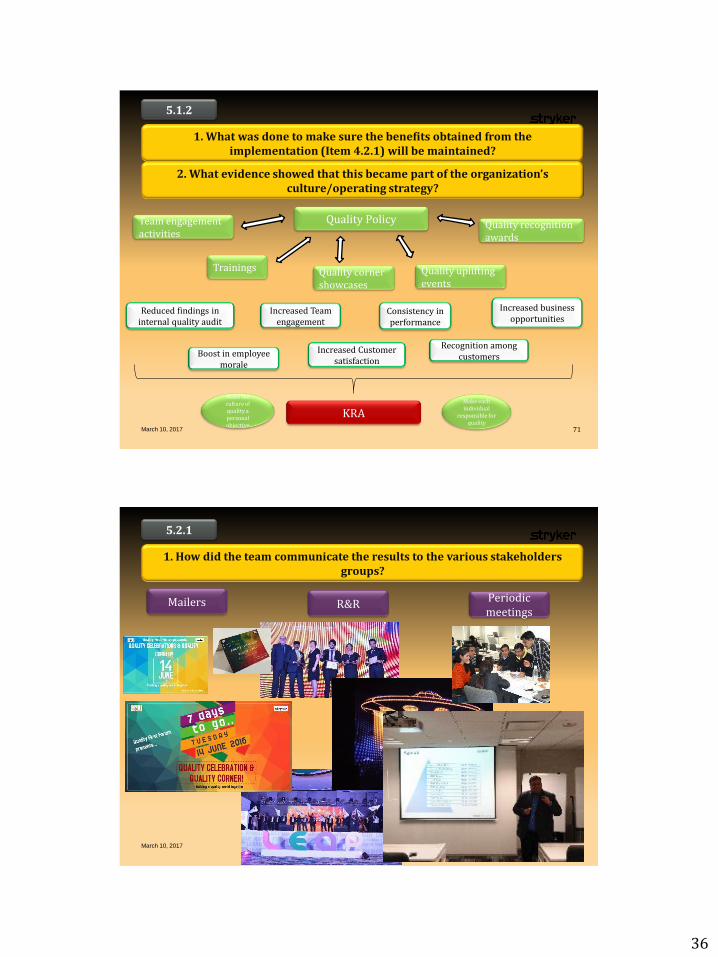
1. What was done to make sure the benefits obtained from the implementation (Item 4.2.1) will be maintained?
5.1.2
2. What evidence showed that this became part of the organization’s culture/operating strategy?
Quality Policy Team engagement activities
Trainings Quality corner showcases
Quality uplifting events
Quality recognition awards
Increased Customer satisfaction
Reduced findings in internal quality audit
Boost in employee morale
Consistency in performance
Recognition among customers
Increased Team engagement
Increased business opportunities
KRA Make each individual
responsible for quality
Make the culture of quality a personal objective
March 10, 2017 72
1. How did the team communicate the results to the various stakeholders groups?
5.2.1
Mailers R&R Periodic meetings
37
March 10, 2017
Thank you
73