Embed Size (px)
Citation preview

Struvite Recovery from Source-Separated Urine Utilizing a Fluidized Bed Reactor
Alexandria Augusta Gagnon
Thesis submitted to the faculty of the Virginia Polytechnic Institute and State University
in partial fulfillment of the requirements for the degree of
Master of Science
In
Environmental Engineering
Gregory D. Boardman
Charles B. Bott
John T. Novak
July 28th
, 2016
Blacksburg, VA
Keywords: Urine diversion, struvite precipitation, nutrient recovery, pharmaceutical
inclusion, pathogen inclusion,
Copyright 2016 Alexandria Gagnon

Struvite Recovery from Source-Separated Urine Utilizing a Fluidized Bed Reactor
Alexandria Augusta Gagnon
Abstract
Source-separating urine for nutrient recovery may provide multiple benefits with regards to
wastewater management, water conservation, and an impending phosphorus fertilizer shortage.
Municipal wastewater systems are designed to treat the combination of urine, feces and
graywater produced in household applications. Urine accounts for 1% of wastewater by volume,
but provides 70-90% of nitrogen, 35-70% of phosphorus and 50% of the contaminants of
emerging concern entering municipal wastewater treatment (Larsen and Gujer 1996). Research
has shown managing source-separated urine for nutrient recovery is a more cost effective and
less treatment intensive method than using traditional systems found in municipal wastewater
plants.
Phosphorus fertilizer shortages are projected as current sources diminish and become
increasingly difficult to extract and refine. Phosphorus based-fertilizer recovery, in the form of
99.9% pure struvite also known as magnesium ammonium phosphate (MgNH4PO4•6H2O), has
been demonstrated successfully in full-scale sidestream treatment using dewatering liquor from
anaerobically digested solids (centrate) processed through upflow fluidized bed reactor
technologies (Britton et al. 2005). Prior research determined the influence of pH, magnesium to
phosphorus (Mg:P) molar ratio, and age of urine on purity, pharmaceutical content and pathogen
inclusion in struvite precipitated from source-separated urine. This is the first known example of
an attempt to produce a commercially viable struvite product from source-separated urine in a
fluidized bed reactor of a design that has been used successfully for struvite recovery in
conventional wastewater applications.
In order to assess the feasibility of nutrient recovery of phosphorus-based fertilizer recovery
from source-separated urine, the first office-based urine separation and collection building was
implemented in the U.S. Urine was collected, in a 400 gallon capacity underground sealed
manhole, from HRSD’s Main office building beginning in March 2015 from five men’s
waterless urinals and one women’s separating toilet. Urine was collected from the manhole on a
monthly basis in 275 and 330 gallon plastic totes stored at the HRSD Nansemond WWTP in
Suffolk, VA. Collected urine was allowed to age while in storage to encourage the precipitation
of excess multivalent cations that may interfere with struvite precipitation and inactivation of
pathogens that may be present.
An upflow fluidized bed reactor (UFBR) was used to precipitate and recover struvite as slow-
release phosphorus based fertilizer (prill); the reactor was loaned to Hampton Roads Sanitation

iii
District by the University of British Columbia. A magnesium solution was injected at the bottom
of the reactor to facilitate precipitation along with the recycle urine stream and feed urine. Prill
production design for the reactor was 0.5 kilograms per day, but while using centrate to
determine best operations practices, under loading the reactor to 0.25 kilograms per day
maximized struvite recovery while minimizing particulate phosphorus loss. Urine was fed into
the reactor for struvite removal based on phosphorus loading with recovery determined through
removal of orthophosphate and harvesting of the struvite product. Consistency, size and quality
of product including compactness, crystal structure, purity and presence of pharmaceuticals and
pathogens were assessed.
The UFBR was run for 50 days total; 10 days for a short term run to compare to operation of the
reactor under the same conditions with centrate from anaerobically digested solids as a feed
source, 30 days to assess consistency of operations over long term with respect to urine-derived
struvite recovery, and a 10 day test with urine spiked with pharmaceuticals and bacteriophage to
evaluate inclusion of trace organics and viruses in recovered struvite. In total 2,040 gallons of
urine were fed to the reactor targeting 12.45 kilograms of struvite recovery, a mass of 7.54
kilograms of prills were harvested from the reactor with 1.90 kilograms of phosphorus lost as
particulate struvite (representing an recovery efficiency of 60.5%). Overall reactor operation
using urine as a feed solution behaved similar to centrate, with slightly less removal of
phosphorus and therefore recovery of struvite most likely due to inhibition from other major ions
present. Urine-derived prills were lower in quality due to the lack of compact density seen in
struvite recovered during full scale operation but had a visible orthombic pattern seen in
precipitated struvite.
Pharmaceuticals that were present in urine feed solution were found in struvite but at less than
1% of the feed mass. Some of this inclusion may have occurred due to porous characteristics of
the small-scale UFBR recovered struvite rather than through actual inclusion in the mineral
crystal itself. Spiking of caffeine and ibuprofen to high concentrations in the urine yielded no
statistical difference from the non-spiked tote. Urine was non-detect for bacteriophage pathogen
indicators leading to the assumption that no pathogens were present in urine-derived struvite.
Spiking the urine with double-stranded DNA (T3) and single-stranded RNA (MS2)
bacteriophage capable of infecting bacterial cells such as Escherichia coli yielded 10^6 plaque
forming units per milliliter in source separated urine.
Creating urine-derived struvite prills with minimal inclusion of pharmaceuticals using upflow
fluidized bed technology is feasible on a small scale. Large-scale application, recovering 500
kilograms per day of struvite or more, will most likely create a higher quality prill with regards
to compactness and diminished presence of pharmaceuticals and virus inclusion. Pretreatment of
urine and post-treatment of prills with heat will aid in inactivation of virus that may be present.

iv
Contents Abstract ........................................................................................................................................... ii
List of Tables ................................................................................................................................. vi
List of Figures ............................................................................................................................... vii
1. Introduction .......................................................................................................................... 1
1.1. Project Motivation ............................................................................................................ 2
1.2 Research Objectives ......................................................................................................... 6
2. Literature Review................................................................................................................. 7
2.1. Wastewater Treatment ...................................................................................................... 7
2.2. Urine ................................................................................................................................. 8
2.2.1. Constituents .................................................................................................................. 8
2.2.2. Contaminants .............................................................................................................. 11
2.2.3. Treatment of Urine ..................................................................................................... 12
2.2.4. Separation & Collection Technologies ....................................................................... 15
2.2.5. Struvite........................................................................................................................ 17
2.2.6. Struvite Precipitation .................................................................................................. 19
2.2.7. Upflow Fluidized Bed Reactor Technologies ............................................................ 22
3. Manuscript ......................................................................................................................... 25
3.1. Introduction .................................................................................................................... 25
3.2. Methodology .................................................................................................................. 27
3.2.1. Urine Collection and Storage ..................................................................................... 27
3.2.2. Pearl 0.5 Reactor and Operation ................................................................................. 30
3.2.3. Reactor Operation ....................................................................................................... 33
3.2.4. Micropollutant Spike Test .......................................................................................... 35
3.3. Results and Discussion ...................................................................................................... 37
3.3.1. Urine Collection & Characterization .......................................................................... 37
3.3.2. Pearl 0.5 Operation ..................................................................................................... 38
3.3.2.1. Centrate v. Urine Operation .................................................................................... 39
3.3.2.2. Long Term Operation ............................................................................................. 47
3.3.3. Urine-Derived Struvite Prills Quality ......................................................................... 49
3.3.4. Composition of Urine-Derived Struvite ..................................................................... 54
3.3.4.1. Analysis for Metals ................................................................................................. 54
3.3.4.2. Struvite Purity ......................................................................................................... 55
3.3.4.3. Pharmaceuticals & Pathogen Inclusion .................................................................. 57

v
3.3.5. Micropollutant Spike Test .......................................................................................... 59
3.4. Impact of Struvite Recovery on Source-Separated Urine .............................................. 61
3.5. Conclusions ........................................................................................................................ 63
4. Engineering Significance ................................................................................................... 65
5. Additional Experiments ..................................................................................................... 66
5.1. Urine Jar Testing ................................................................................................................ 66
6. References .......................................................................................................................... 69
7. Appendix ............................................................................................................................ 74

vi
List of Tables
Table 1 - Approximate Mass of Solutes in Fresh Urine Excreted over a 24-hr period in Healthy
Individuals (Brunzel, 2004) ............................................................................................................ 8
Table 2- Composition of Urine from Various Source-Separation Systems .................................... 9
Table 3 - Elimination of Spiked Pharmaceuticals in urine after 6 months of storage (Schurmann
et al. 2012) .................................................................................................................................... 12
Table 4 - Pharmaceuticals Retained in Urine after Struvite Precipitation (Schurmann et al. 2012)
....................................................................................................................................................... 14
Table 5 - Methods for Daily Analysis of Feed and Effluent Samples .......................................... 33
Table 6 - Target Operating Parameter .......................................................................................... 34
Table 7 - Urine Collection Dates and Volumes ............................................................................ 37
Table 8 - Constituents of Source-Separated Urine after Collection ............................................. 38
Table 9 - Characteristics of Urine and Centrate ............................................................................ 39
Table 10- Metals Content of Full-Scale Centrate-Derived Struvite and Urine-Derived Struvite
Compared to Part 503 Regulations(EPA) ..................................................................................... 55
Table 11 - Nutrient Analysis of Urine Derived Struvite Compared to Pure- Struvite .................. 56
Table 12 - Pharmaceutical Presence in Urine Feed, Effluent, & Precipitated Struvite ................ 58
Table 13 - Percent Mass Inclusion of Pharmaceuticals in Struvite .............................................. 58
Table 14 - Pharmaceutical Results for Spike Tote ........................................................................ 60
Table 15 - Percent Mass Inclusion of Pharmaceuticals in Struvite for Spike Test ....................... 60
Table 16 - Influence of Struvite Precipitation on Urine Constituents .......................................... 61
Table 17 - Methods for Analysis of Jar Testing Samples ............................................................. 66

vii
List of Figures
Figure 1 - Plan View of HRSD Main Office Urine Separation Setup ............................................ 4
Figure 2 – Ostara Nutrient Recovery Technologies Inc. Struvite Recovery Facility at HRSD's
Nansemond WWTP in Suffolk, VA ............................................................................................... 5
Figure 3 - Fresh Source-Separated Urine...................................................................................... 10
Figure 4 - Aged Source-Separated Urine ...................................................................................... 10
Figure 5 - Eco Trap Cartridge Used in Waterless Urinals (NWS Europa, 2015) ......................... 16
Figure 6 - Cross-Section from Wostman Eco-Flush Urine Separating Toilet
(wostman.se/ecoflush) .................................................................................................................. 17
Figure 7 - Post Digestion Orthombic Struvite Crystal (Doyle and Parsons 2002) ....................... 18
Figure 8 - Struvite Buildup at HRSD's Nansemond WTTP in Suffolk, VA ................................ 18
Figure 9- Nucleation of Crystals(Le Corre et al. 2009) ................................................................ 20
Figure 10 - Diagram of Upflow Fluidized Bed Reactor ............................................................... 24
Figure 11 - Plan View of HRSD Main Office Urine Separation Setup ........................................ 27
Figure 12 - Urine-Separating Toilet & Waterless Urinal at HRSD's Main Office in Virginia
Beach, VA ..................................................................................................................................... 28
Figure 13 -HRSD's Urine Collection Manhole ............................................................................. 29
Figure 14 - Pearl 0.5 Reactor Setup .............................................................................................. 31
Figure 15 - Pearl 0.5 & Chemical Dosing Equipment .................................................................. 32
Figure 16 - Centrate Feed - 10 Day Operation ............................................................................. 40
Figure 17 - Urine Feed - 10 Day Operation .................................................................................. 41
Figure 18 - Difference in Centrate and Urine Characteristics ...................................................... 42
Figure 19 - Comparison of PO43- -P as Struvite Behavior between Centrate (left) and Urine
(right) feed solutions ..................................................................................................................... 43
Figure 20 - Centrate Removal of PO4-P as Struvite Compared to Recycle and Effluent Imhoff
Fines .............................................................................................................................................. 44
Figure 21 - Urine Removal of PO4-P as Struvite Compared to Recycle and Effluent Imhoff Fines
....................................................................................................................................................... 44
Figure 22 - Comparison of PO4-P Loading and Removal Rates .................................................. 45
Figure 23 - Comparison of Fines Production between Feed Sources ........................................... 46
Figure 24 - % PO43-
-P Removal v. Effluent Magnesium Concentrations ..................................... 47
Figure 25 - Cumulative PO4-P Behavior during Long Term Operation using Urine as a Feed
Source ........................................................................................................................................... 48
Figure 26 - Urine Removal of PO4-P as Struvite Compared to Recycle and Effluent Imhoff Fines
During Long Term Operation ....................................................................................................... 48
Figure 27 - Comparison of PO43-
-P as struvite behavior during long term operation using urine
as a feed source ............................................................................................................................. 49
Figure 28 - Full-Scale Centrate-Derived Struvite ......................................................................... 50
Figure 29 - Centrate-Derived Struvite (Harvested: 03/02/2016 ................................................... 51
Figure 30 - Urine- Derived Struvite (Harvested: 04/16/2016) ...................................................... 51
Figure 31 - Urine-Derived Struvite (Harvested: 05/31/2016) ....................................................... 52
Figure 32 - Urine- Derived Struvite (Harvested: 05/19/2016) ...................................................... 52
Figure 33 - Centrate Derived Struvite from Pearl 0.5 (Harvested 03/30/2016) ............................ 53
Figure 34 - Urine-Derived Struvite from Pearl 0.5 (Harvested:04/28/2016) ................................ 54
Figure 35 - Excerpt from XRD Analysis of Urine-Derived Struvite ............................................ 56

viii
Figure 36 - X-Ray Diffraction Plot of Urine Derived Struvite compared to Struvite peaks from
PDF. .............................................................................................................................................. 57
Figure 37 - Influence of pH on PO4-P Removal from Urine ....................................................... 67
Figure 38 - Struvite from Jar Testing (Mg:P Dosing 1:1) ............................................................ 68

1
1. Introduction
Urine, a sterile liquid waste product produced by the kidneys, removes inorganic chemicals such
as phosphorus and urea from the human body. Urine can also contain pharmaceutical and
pharmaceutical by-products. In individuals with compromised immune systems, pathogens can
be present. The elimination of urine is a necessary bodily function that in turn requires
appropriate handling, treatment, and disposal. The development of modern toilets and
wastewater infrastructure has allowed the major population of industrialized societies to adopt a
“flush-and-forget-it” attitude in regards to elimination of urine and fecal waste. This attitude has
been shifting as the public sector has become more environmentally conscious and regulations
were introduced limiting effluent nutrients for wastewater treatment plants (WWTP).
Increasingly stringent effluent nutrient standards on wastewater plants, water conservation, and
predicted phosphorus-based fertilizer shortages have stimulated research in urine separation and
nutrient recovery in recent years.
Urine, which contributes 80% of nitrogen, 50% of phosphorus, and half of contaminants of
emerging concern (CECs) to municipal WWTP, only contributes about 1% of flow by volume
(Larsen et al. 2013). Therefore meeting effluent nutrient limits determined by the Environmental
Protection Agency’s (EPA) National Pollutant Discharge Elimination System can be aided by
source-separation and alternative treatment of urine. Increasingly stringent limits have led to the
research and development in biological nutrient removal activated sludge systems (BNRAS)
advancing treatment capabilities of plants. This includes nitrogen removal using nitrification-
denitrification (ND) and the investigation of phosphorus accumulating organisms (PAOs)
utilizing an arrangement of anaerobic, anoxic, and aerobic tanks with various recycle streams.
These systems allow for economical removal of solids, COD, nitrogen and phosphorus from
wastewater before discharge into receiving streams when compared to the cost of chemical
addition. Removal of urine from wastewater discharged from municipal communities could
decrease nutrient loads in existing WWTP, therefore, increasing treatment capabilities and
reducing costs (Jimenez et al. 2015).
Increased demand of potable water from to population growth combined with decreased security
of freshwater sources from drought, aquifer depletion and climate change has increased focus on
decreasing excessive water usage in the home. Modern flush toilets, used in virtually every home
in the U.S., use potable water to ferry waste and toilet paper through aging sewer lines to
WWTP. Urinals, often found in public spaces such as offices and stadiums instead of the home,
also flush potable water to rinse the bowl, diminish odor and aid in the transportation of urine
through the system. According to the EPA, toilets account for 30 percent of water usage in the
home with most efficient toilets using 1.28 gallons of potable water per flush (EPA 2016).
Conservatively, the U.S. uses 9.5 billion gallons of water for flushing each year aiding in the
delivery of the raw wastewater to the plant but diluting the influent supply, increasing the
difficulty to treat nutrients and the associated cost.

2
Waterless urinals, which use oil or pressure-sensitive rubber seals to transfer urine to the sewer
while minimizing odor, have increased in popularity because of environmental, sanitary and
economic reasons. They are used in office and academic buildings, stadiums and public
restrooms in the U.S. and abroad (Davis 2010). Each waterless urinal can save up to a half gallon
of water per use and the large selection, ease of use and installation make it an attractive option
compared to the urine-diverting toilets. These toilets utilize the front of the bowl with a separate
drain line to divert urine, while the back of the bowl remains unchanged for traditional solid
waste disposal. The toilets use membranes seals, pressure valves, or water traps to separate urine
and prevent odor issues. None are designed specifically with American plumbing code standards
in mind but there are a few in use in the U.S., mostly for research purposes or in private
residences looking to decrease their impact on local waterways and save money (Fewless et al.
2011).
Phosphorus fertilizer is an essential part of current global food production. A majority of the
fertilizer sourced is from phosphorus-based gypsum rock that must be mined, treated to remove
heavy metal contaminants, and shipped around the world for application. Phosphorus rock
mining rates have steadily increased as the global demand for food has grown with fertilizer
application modernized with automated technologies and advancement in chemical production.
These processes, along with the modern flush toilet, have rendered traditional methods of
manure application inconvenient and unappealing economically. Peak-phosphorus mining is
expected to occur around 2050 with supplies exhausted by the early 2100s and as traditionally
inexpensive forms of phosphorus become less cost-effective, the aim has turned to new
sustainable sources (Steen 1998). Where an excess of phosphorus was once a problem in
WWTP, it has now turned in to an opportunity of which facilities are taking advantage by
recovering the phosphorus in a slow-release struvite fertilizer and sold for use in the agricultural
market. Recovering struvite from wastewater is a sustainable process that allows wastewater
facilities to remove phosphorus without the associated disposal. Direct recovery of struvite from
source-separated urine could provide a more direct source of phosphorus fertilizer, removing the
cost associated with treatment in a wastewater facility.
1.1. Project Motivation
In the wastewater community, nutrients, such as phosphorus and nitrogen, are considered wastes
that must be properly removed to prevent damage to receiving waterways instead of resources to
be recovered and utilized. Conversely these nutrients, to the average farmer are a product that is
necessary for the healthy abundant growth of crops. While there are some products created at
WWTP that are used for agricultural applications such as biosolids or struvite fertilizer, the
processes still requires treatment of raw influent through a plant increasing time and associated
cost. Source-separation and treatment of urine through struvite recovery could provide a
sustainable, cost saving source of phosphorus-based fertilizer struvite. Currently in the U.S.,

3
there are no recommendations or guidelines for using urine or urine-based products as an
agricultural fertilizer requiring assessment of the safety of urine-derived struvite for use as
fertilizer. Regulatory standards in the U.S. are created from research and investigation into the
unregulated field. In 2012, the Water Environment Research Foundation (WERF) was awarded a
$2.2 million dollar grant to establish the National Research Center for Resource Recovery &
Nutrient Management under the Environmental Protection Agency’s (EPA) Science to Achieve
Results (STAR) program (Capuco 2014). The long term goal of the center is to decrease the
amount of nutrients entering waterways through economical and environmentally sustainable
methods provided to communities. Research was aimed toward nutrient removal from urban
runoff and recovery from WWT and urine separation. Technological advances in nitrogen
reduction at WWTP, generation of energy and higher quality fertilizers, and evaluation of multi-
faceted impacts (social, engineering, cost and environmental) of nutrient recovery technologies
at WWTP. This research is especially important in the U.S. for WWT as the aging infrastructure
requires costly renovations and repair. Universities, non-profit organizations, and wastewater
utilities conducted the research in collaboration with WERF to meet these target goals.
A portion of this grant was awarded for research specifically focusing on nutrient recovery
through urine separation. Along with Hampton Roads Sanitation District in the Hampton Roads
region of Virginia where the research performed in this thesis was conducted, the grant also
included the University of Michigan, University of Buffalo, Rich Earth Institute, and Brown and
Caldwell. The goal of the grant was to answer the hypothesis that with proper treatment, source-
separated urine and urine-based struvite can be a safe, effective, and sustainable source of
nutrients for agricultural applications in the United States.
The hypothesis was tested with four research objectives: (i) provide design and permitting
guidelines to address practical issues (i.e. scaling and odor control) related to the implementation
of urine separation and collection systems in a high occupancy buildings; (ii) understand how
urine pretreatments impact pharmaceutical and biological contaminant concentrations; (iii)
compare the efficacy of using natural urine and urine derived struvite product (e.g. struvite ) as
agricultural fertilizers; (iv) evaluate the fate of nutrients, pharmaceuticals and biological
contaminants after urine products were land applied. The research discussed in this thesis targets
objectives (i) and (iii).
The first office-based urine-separation and collection system in the United States was
implemented at HRSD’s main office building in Virginia Beach, VA to collect urine for nutrient
recovery research and determine practical guidelines for urine separation. Supplementary piping
was installed alongside traditional blackwater lines that directed the flow of separated urine from
the building to a sealed manhole (Figure 1). Until urine collection began in Spring 2015 a
temporary bypass was put into place directing the urine to a sanitary sewer, this bypass also
served as an overflow outlet in the event of the manhole reaching capacity. Five men’s waterless

4
urinals were installed during construction for urine collection on both floors of the office
building. In May 2015, a urine-separating toilet was installed on the second floor women’s
restroom to diversify the collected urine. Urine was collected monthly from the sealed manhole
and stored at the HRSD Nansemond WWTP in Suffolk, VA until use.
Before removal of the bypass to allow for collection of urine and installation of the women’s
urine separating toilet, open attendance seminars were held to increase awareness, educate and
encourage participation and contribution to urine-collection project throughout the office
building. HRSD’s main office building has two floors, with the urine separating toilet being
installed on the second floor and waterless urinals on both floors.
Figure 1 - Plan View of HRSD Main Office Urine Separation Setup
At the HRSD Nansemond WWTP, phosphorus-based fertilizer struvite is currently recovered
from phosphate and ammonia rich dewatering liquor centrifuged from anaerobically digested
sludge using the Ostara Pearl™ process at the Struvite Recovery Facility (SRF). Removing the
nutrients from the recycle stream decreases maintenance associated with struvite precipitation in
plant equipment and piping along with increasing the treatability of the mainstream plant. Prior
to the construction of the SRF, ferric chloride was added to the plant’s side stream to precipitate
excess phosphate. HRSD’s Nansemond WWTP is under the influence of the meat packing
industry leading to higher influent phosphorus loads that, through the way of activated sludge,
end up in the dewatering liquor from anaerobically digested sludge also referred to as centrate.
Successful removal of the struvite product, or Crystal Green®, allows for removal of nitrogen
and phosphorus from the plant recycle stream while creating a marketable product for use in
agriculture. Crystal Green® prills are created using upflow fluidized bed technology that
precipitates out the struvite in a slow release form that reduces leaching and runoff when
compared to traditional fertilizer (Ostara Nutrient Recovery Technologies 2010).Currently the

5
Nansemond WWTP uses three Pearl™ 500s in the struvite recovery process, that when operating
at capacity will each produce 500 kilograms of struvite per day.
Figure 2 – Ostara Nutrient Recovery Technologies Inc. Struvite Recovery Facility at
HRSD's Nansemond WWTP in Suffolk, VA

6
1.2 Research Objectives
The application of urine as a direct feed source for struvite fertilizer production needs to be
investigated thoroughly due to the potential inclusion of pharmaceuticals and pathogens. High
phosphorus and nitrogen concentrations in urine that has undergone urea hydrolysis create an
ample environment for the formation of struvite (Tilley et al. 2008b). Struvite has been
successfully recovered from source-separated urine at an office building in Germany utilizing a
batch reactor system to create a fine powder (Winker 2011).
Pilot scale versions of the Pearl™ process developed and marketed by Ostara Nutrient Recovery
Technologies are used for demonstration of the process, determination of practical recovery of a
slow-release struvite fertilizer in prill form at prospective wastewater facilities, and in a research
capacity. These pilots range in size from a Pearl™ 0.5 to a 20 and have similar construction to
the full-scale reactors. A Pearl™ 0.5 was provided to HRSD through Ostara by the University of
British of Columbia and with a design capacity 0.5 kilogram per day of struvite prills. Struvite
has been recovered from urine and its purity assessed, but it has never been used as a feed
solution in an upflow fluidized bed reactor to recover slow-release phosphorus based fertilizer
product.
During the time of the research conducted, there were no regulations and very little U.S.-based
research on the use of urine or urine-based fertilizers for agriculture. This research will
contribute to the establishment of regulation on nutrient-recovery from urine for use in an
agrarian setting, especially as the need for a sustainable source of phosphorus fertilizer becomes
imminent. The main objective of this research was to determine the feasibility of sourcing a
struvite fertilizer from urine. WWTP’s will also benefit from a decreased load and therefore
increased capacity and capability to meet strict effluent limits. The following objectives will
augment foundational information for development of these regulations:
Compare Pearl™ 0.5 operation between centrate and urine as feed solutions.
Assess prill quality source from aged source-separated urine.
Determine inclusion of pharmaceuticals and pathogen indicators into struvite prills
recovered from aged source-separated urine using the Pearl™ 0.5.
Assess inclusion of contaminants included in struvite prills after spiking the aged-source
separated urine with the following:
o Pharmaceuticals
Polar: Caffeine
Non-Polar: Ibuprofen
o Pathogens Indicators
Double-Strand DNA: Bacteriophage T3
Single-Strand RNA: Bacteriophage M

7
2. Literature Review
2.1. Wastewater Treatment
Wastewater, to the average consumer, is most commonly associated with human waste (urine
and fecal matter) which by volume it contains very little of, rather than its majority component,
potable water sent through to WWTP. Since the inception modern of wastewater treatment,
combining the household greywater flow with human waste has been conducted without a
second-thought. Increasing effluent limits, cost of treatment, impending phosphorus fertilizer
shortage and concerns associated with pharmaceuticals and hormones entering the waterways
have spurned a reassessment of the common wastewater treatment methods and research into
separating urine from wastewater (Fewless et al. 2011).
After the ratification of the CWA of 1972, modern regulatory effluent quality limits for U.S.
WWTP were determined and enforced by the EPA and State Departments of Environmental
Quality (Introduction to Clean Water Act, 2006). In the Chesapeake Bay Area, the nitrogen and
phosphorus discharge limits for HRSD’s WWTP have become more strict requiring costly
upgrades. Modeling has shown that WWTP could benefit from partial separation of urine from
influent. The decrease of nitrogen and phosphorus loading has the potential to lower cost
associated with treatment, including energy and chemical costs. Reducing the influent urine to
municipal WWTP by 70% and 90% can eliminate the need for biological phosphorus and
nitrogen removal (BPNR), respectively (Jimenez et al. 2015). In addition to those benefits
previously stated, WWTP could also experience lower required solids retention time (SRT) with
most of the influent nitrogen and phosphorus eliminated due to heterotrophic growth. Small
benefits could be observed at even 10% urine separation as a result from reduced loading.
Carrying out source-separation of urine on that scale would require major infrastructure
alterations and is not feasible in the foreseeable future. Currently, urine-separating technology is
limited to 70-75% efficiency in collection (Rossi et al. 2009).
Investigation into nitrogen mitigation in domestic residences has revealed the least cost-effective
method to be traditional centralized wastewater treatment with combination of urine separation
and solid waste treatment being the most cost efficient(Wood et al. 2015). Full-scale or even
partial application of urine-separation and treatment is limited by the current infrastructure and
cost associated with construction. Retrofitting current lavatories at home and in public spaces is
also impractical requiring additional piping and new fixtures. Newer urine-separating toilets have
a higher overhead cost with water and treatment savings seen in the backend (Fewless et al.
2011). Newly constructed apartment and office buildings are the most practical units for urine-
separation implementation, with incorporation of urine separation and treatment processes into
the design plans.
8
2.2. Urine
Food and liquids consumed by humans contain complex molecules such as carbohydrates, fats,
and proteins utilized by the body for metabolic processes with derivatives excreted in urine and
fecal waste. A byproduct of the human metabolism and regulatory system, urine is a necessary
function which removes metabolic waste products, regulates water and electrolyte
concentrations, and maintains the acid-base equilibrium. As the primary excretory function of the
kidneys, which filter out substances that are present in excess and retain those necessary for
human metabolic homeostasis, urination is an essential bodily function. Healthy individuals
eliminate sterile urine on average five to six times a day, depositing 600 to 1800 mL of liquid,
with the largest volume and most nutrient dense deposited soon after waking (Brunzel 2004).
Urine will continue to be excreted by humans and as cost associated with wastewater treatment
continues to rise, necessitating investigation into source-separation and alternative treatment with
the possible use as a sustainably sourced fertilizer.
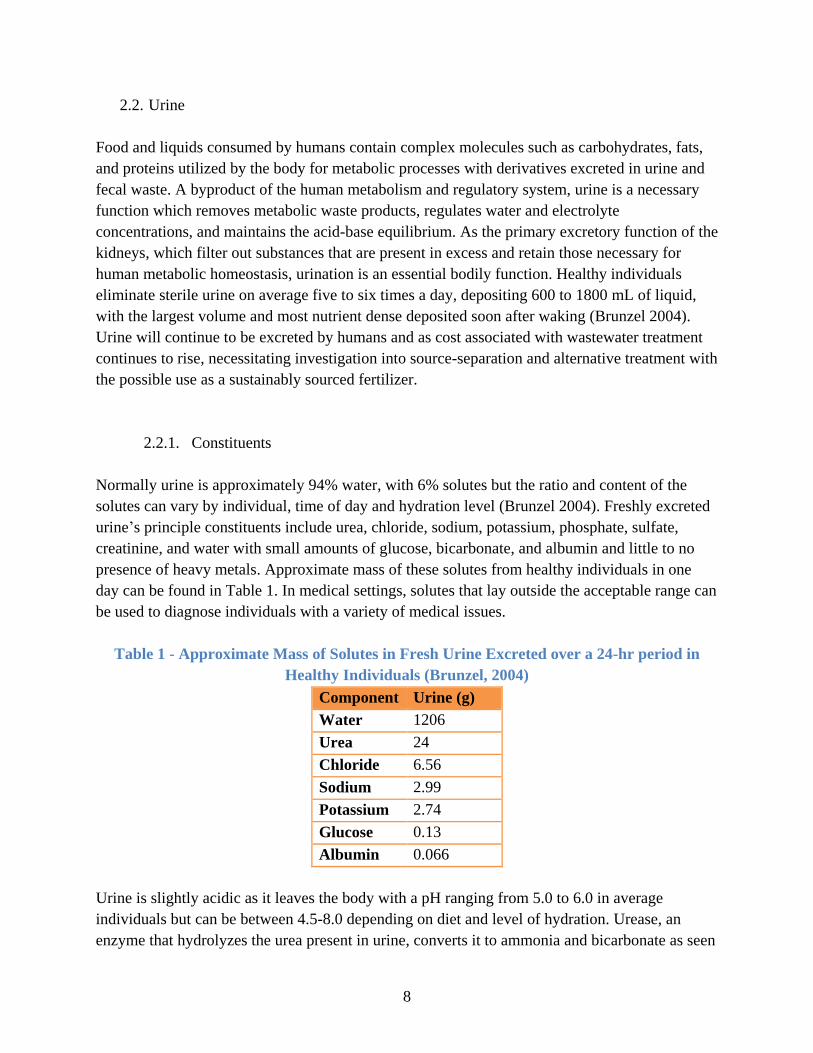
2.2.1. Constituents
Normally urine is approximately 94% water, with 6% solutes but the ratio and content of the
solutes can vary by individual, time of day and hydration level (Brunzel 2004). Freshly excreted
urine’s principle constituents include urea, chloride, sodium, potassium, phosphate, sulfate,
creatinine, and water with small amounts of glucose, bicarbonate, and albumin and little to no
presence of heavy metals. Approximate mass of these solutes from healthy individuals in one
day can be found in Table 1. In medical settings, solutes that lay outside the acceptable range can
be used to diagnose individuals with a variety of medical issues.
Table 1 - Approximate Mass of Solutes in Fresh Urine Excreted over a 24-hr period in
Healthy Individuals (Brunzel, 2004)
Component Urine (g)
Water 1206
Urea 24
Chloride 6.56
Sodium 2.99
Potassium 2.74
Glucose 0.13
Albumin 0.066
Urine is slightly acidic as it leaves the body with a pH ranging from 5.0 to 6.0 in average
individuals but can be between 4.5-8.0 depending on diet and level of hydration. Urease, an
enzyme that hydrolyzes the urea present in urine, converts it to ammonia and bicarbonate as seen
9
in equation 1(Brunzel 2004). Urea hydrolysis rapidly changes the chemical equilibrium of the
urine, as the increase in ammonia and bicarbonate concentrations raises the pH of the urine from
slightly acidic to an alkaline state with a pH around 9.
𝐶𝑂(𝑁𝐻2)2 + 2𝐻2𝑂 → 𝑁𝐻3 + 𝑁𝐻4+ + 𝐻𝐶𝑂3
− (1)
This reaction stimulates the precipitation of excess calcium and magnesium ions in the form of
the struvite (MgNH4PO4•6H2O), calcite (CaCO3), calcium phosphate (Ca3(PO4)2) and
hydroxyapatite (Ca5(PO4)3OH). After the urine undergoes urea hydrolysis, it is chemically stable
in a sealed, temperature-steady environment. Ammonia volatilization (KH = 62 mol/L*atm at
25C) will occur due to the high concentration and pH present in hydrolyzed undiluted urine
especially with storage open to the atmosphere. Urease will break down urea at a rate dependent
on storage conditions such as temperature, exposure to previously hydrolyzed urine, agitation,
and fecal contamination (Brunzel 2004). Preventing urea-hydrolysis in current urine collection
systems with a large storage volume is impractical due storage time and high likelihood of
hydrolysis occurring in the collection pipes. Post urea-hydrolyzed urine, or aged-urine, has high
concentrations of ammonia, phosphate, potassium and other constituents found in Table 2. The
high concentrations of nutrients make source-separated urine a feasible source for nutrient
recovery.
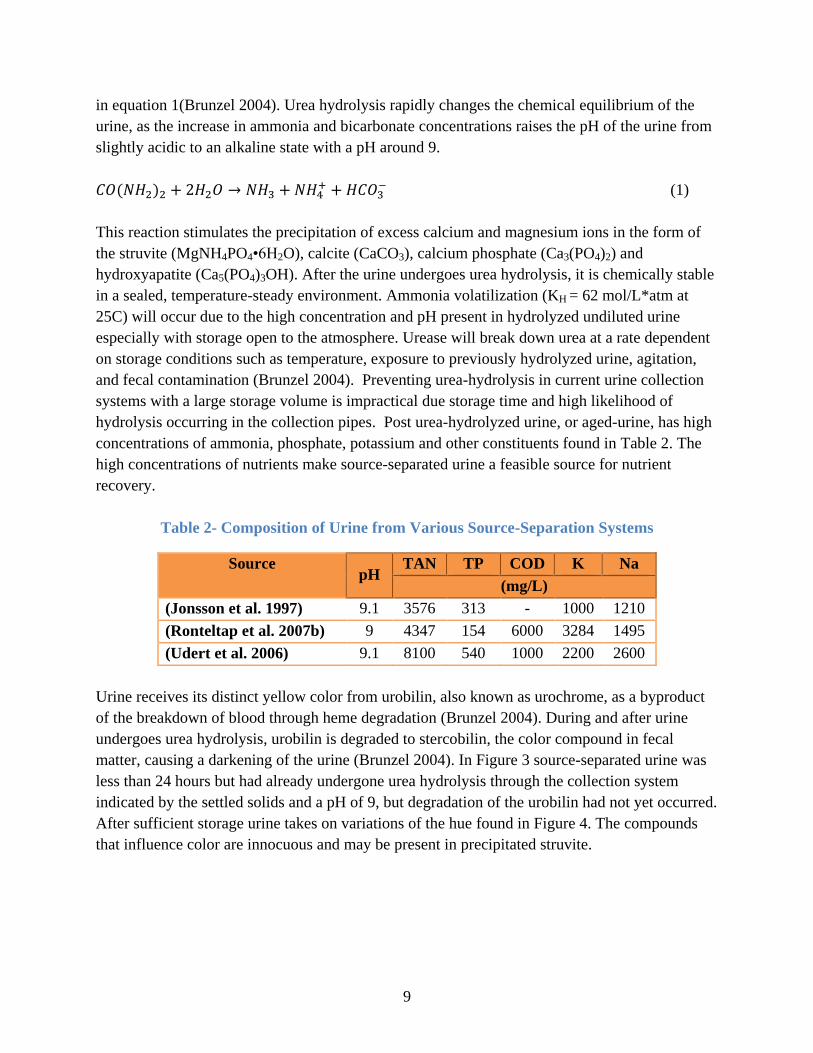
Table 2- Composition of Urine from Various Source-Separation Systems
Source pH
TAN TP COD K Na
(mg/L)
(Jonsson et al. 1997) 9.1 3576 313 - 1000 1210
(Ronteltap et al. 2007b) 9 4347 154 6000 3284 1495
(Udert et al. 2006) 9.1 8100 540 1000 2200 2600
Urine receives its distinct yellow color from urobilin, also known as urochrome, as a byproduct
of the breakdown of blood through heme degradation (Brunzel 2004). During and after urine
undergoes urea hydrolysis, urobilin is degraded to stercobilin, the color compound in fecal
matter, causing a darkening of the urine (Brunzel 2004). In Figure 3 source-separated urine was
less than 24 hours but had already undergone urea hydrolysis through the collection system
indicated by the settled solids and a pH of 9, but degradation of the urobilin had not yet occurred.
After sufficient storage urine takes on variations of the hue found in Figure 4. The compounds
that influence color are innocuous and may be present in precipitated struvite.

10
Figure 3 - Fresh Source-Separated Urine
Figure 4 - Aged Source-Separated Urine

11
2.2.2. Contaminants
Urine in the bladder is sterile in healthy individuals, but may be exposed to normal bacterial flora
before fully exiting the body through the distal urethra. Exposure to fecal matter can occur
during or directly after excretion possibly introducing pathogenic protozoa, bacteria, and viruses
to urine, rendering the need for sterilization or inactivation and accelerating urea hydrolysis.
Individuals with compromised immune systems may contribute bacteria or pathogenic viruses to
urine directly for example, urinary tract infections or indirectly through migration through
bladder wall mucosa. Two of the commonly observed microorganisms in urine are trichomonads
and yeast (Brunzel 2004).
Storage of urine to inactivate pathogens before use as an agricultural fertilizer has been
investigated to determine and diminish risks associated with transportation, handling, and
application. In general the risk of exposure to fecal pathogens was been found to be low in urine
after less than one month of storage at low (4˚C) and high (20˚C) temperatures with inactivation
occurring after one month (Hoglund et al. 2002). Hoglund also found with rotavirus, a double
stranded RNA virus, inactivation occurred during specific conditions, greater than 20˚C and
longer than one month storage, increasing the necessity for storage or sterilization before use.
Recovery of struvite from source-separated urine has revealed accumulation of pathogens can
occur, with partial inactivation occurring with application of product heat and drying (Decrey et
al. 2011).
High concentrations of ammonia, a known biocide, combined with the increased pH are the main
contributors to inactivation of pathogens in source-separated urine (Udert et al. 2003b) Single-
stranded RNA organisms, specifically E. coli and indicator coliphage MS2, are readily
inactivated in hydrolyzed urine to 90% removal after 5 days (Decrey et al. 2015). Double-
stranded RNA and both single- and double- stranded DNA have a higher resistance to
inactivation from exposure to high concentrations of ammonia with respect to single-stranded
RNA, most likely because of higher stability with respect to its genomes (Decrey et al. 2016,
Decrey et al. 2015).
Urine is the manner in which the body excretes the majority of micropollutants, mainly
hormones and pharmaceuticals. Prior research has indicated that roughly 65% of pharmaceuticals
key components, 42% as metabolites, are excreted through urine (Lienert et al. 2007). Hormones
are also excreted in urine, with women contributing more estrogens and males contributing more
androgens. Pharmaceutical concentrations in urine are highly dependent on the contributors and
can vary drastically by population; therefore assessing pharmaceutical content is less imperative
than determining inclusion in struvite and if necessary treatment and elimination methods.
Source-separated urine spiked with 10 different pharmaceuticals and stored at 20˚C for 6 months

12
indicated some degradation of pharmaceuticals ranging from 10% to 97% (Schurmann et al.
2012). Percentage of pharmaceutical degradation can be seen in Table 3.
Table 3 - Elimination of Spiked Pharmaceuticals in urine after 6 months of storage
(Schurmann et al. 2012)
Pharmaceuticals Elimination Rates (%)
Min. Max.
Ibuprofen -3.9 66.7
Tramadol 20.9 57.7
Diclofenac 22.1 97.3
Sulfadimidine 59.1 94.3
Chloroquine 14.3 71.6
Carbamazepine 24.4 79.8
Metroprolol 27.3 77.5
Bisprolol 19.3 38.3
2.2.3. Treatment of Urine
Treatment of source-separated urine is being conducted in Germany, Australia, Austria, and
Switzerland, Sweden and in third world countries on a small-scale basis (Blume and Winker
2011, Fewless et al. 2011). Source-separated urine can undergo various methods of treatment
depending on the intended end product. These methods could include something as simple as
storage in specific conditions to render pathogens inactive and partial elimination of
pharmaceuticals before land application to agriculture (mentioned in 2.2.2.).This treatment
method is particularly advantageous in developing countries, with growing populations and
developing infrastructure. Currently, it is unattractive for implementation in developed countries
as transportation of urine to storage facilities is necessary due to impracticality associated with
modifying current infrastructure.
Volume reduction is a viable method for nutrient concentration of urine for agricultural
application to reduce transportation costs (Maurer et al. 2006). Proposed treatment technologies
include evaporation, reverse osmosis, freeze-thaw, electrodialysis, and distillation (Ek et al.
2006, Ganrot et al. 2007). These methods concentrate nutrients through extraction of water by
extension reducing transportation and storage costs before land application. They are often
energy intensive and ammonia losses will occur without stabilization. Stabilization of urine,
through acid addition or introduction of urease inhibitors, prior to application of volume
reduction methods have been shown to minimize ammonia present therefore decreasing nitrogen
losses through ammonia volatilization (Ek et al. 2006). They also do not provide pretreatment of

13
micropollutants such as pharmaceuticals that may be present. The NASA International Space
Station treats urine with evaporation in its Environmental Control and Life Support System in
order to recover water and concentrate urine for increased waste storage utilization (Wieland et
al. 1994).
Urine can also be treated utilizing nitrogen recovery methods. Currently, most nitrogen fertilizer
is produced using the Haber-Bosch method, which fixes nitrogen from the atmosphere and is an
energy intensive process with a large carbon footprint. Regardless, urine is rich in nitrogen in the
form of ammonia and could be a valuable resource if costs for recovery were economically
competitive with the Haber-Bosch method. Ion exchange, ammonia stripping, and selective
adsorption are proposed methods for nitrogen recovery (Ganrot et al. 2007, Maurer et al. 2006).
One lab scale process has recovered ammonium utilizing ammonia stripping and energy using a
microbial fuel cell in a combined process from source-separated urine (Kuntke et al. 2012). If the
goal is not to recover nitrogen for agricultural application, biological nitrogen removal is another
viable method for urine treatment. Using anaerobic ammonia oxidizing bacteria (anammox), is
one of the proposed treatment methods that allows for nitrogen removal through partial
conversion off ammonia to nitrite, and then nitrite and ammonia to nitrogen gas (Strous et al.
1999). Lab scale research has found that anammox has ability remove 75-85% of nitrogen from
urine (Udert et al. 2003a).
Treatment of urine through phosphorus recovery in the form of struvite is the most attractive and
economically feasible method. Spontaneous precipitation caused by the initial pH spike from
urea hydrolysis reduces the phosphorus content of urine anywhere from 17-24%
(Kemacheevakul et al. 2014). Urine’s feasibility as sustainable source of phosphorus fertilizer
has directed a multitude of research into struvite precipitation from source-separated urine
(Maurer et al. 2006). Struvite precipitation chemistry is investigated in section 2.2.6 of this
thesis. Dilution of urine from wastewater or water has a negative influence on the phosphorus
recovery potential as struvite (Liu et al. 2014, Tilley et al. 2008b). This is most likely due to the
dilution of the urine in turn decreasing the supersaturation of phosphorus and introduction of ions
such as a calcium and magnesium precipitating out available phosphate. Mass and particle size
of struvite recovery from urine is dependent on pH, magnesium to phosphorus (Mg:P) dosing
ratio, storage conditions, and strength of feed solution (Ronteltap et al. 2007b, Ronteltap et al.
2010, Tilley et al. 2008a) A high enough Mg:P dosing ratio (greater than 1.2:1) will allow for
99% recovery of phosphorus as a struvite precipitate.
Investigation into struvite precipitated from source-separated urine dosed with bacteriophage
PhiX174 and Ascaris suum eggs indicated an inclusion of both (Decrey et al. 2011). Decrey also
observed that drying struvite using heat can increase the inactivation of pathogens, decreasing
associated concern of inclusion. Research of pathogen presence in precipitated struvite from
source-separated urine requires continued investigation before recommendations can be put in

14
place for use as a fertilize to confirm associated risk. The overall risk of pathogens presence in
struvite is fairly low as mentioned in 2.2.2, due to the general sterility of urine and biocide nature
of the ammonia present but exposure from compromised individuals can increase risk of
inclusion.
Due to the presence of pharmaceuticals and hormones in urine, the possibility of inclusion in
struvite precipitated from urine is a concern. Struvite precipitated from urine spiked with ionic,
acidic and basic pharmaceuticals and hormones is the simplest way to investigate
pharmaceutical-struvite interactions. In both batch and continuously-stirred tank reactor (CSTR)
precipitation experiments a statistically significant amount of hormones and pharmaceuticals
were retained in urine (Table 4) after struvite precipitation (Ronteltap et al. 2007a, Schurmann et
al. 2012). Further decrease of pharmaceuticals and hormones present in struvite was found after
washing the struvite, leading to the assumption that the contaminants may be present due to
contact rather than inclusion into the crystalline structure. Antibiotics such as tetracycline and
erythromycin were included in struvite precipitated from urine spiked with concentrations
characteristic of those excreted by the human body (Kemacheevakul et al. 2012). Ozonation,
eletrodialysis, and nanofiltration are three proven methods for separation micropollutants from
urine but they are cost, energy, and maintenance intensive and often some nutrient loss will
occur during treatment (Fewless et al. 2011). Removing or reducing micropollutants before
precipitation of struvite is a way to diminish concerns associated pharmaceutical or hormone
inclusion, although observed overall inclusion is quite small and pretreatment may not be
necessary.
Table 4 - Pharmaceuticals Retained in Urine after Struvite Precipitation (Schurmann et al.
2012)
Constituent Function % Retained in Urine
Carbamazepine Anti-Seizure 96.4
Diclofenac Anti-inflammatory 99.96
Ibuprofen Anti-inflammatory 99.6
Propranolol Beta-blocker 94.7
Ethinylestradiol Oral Contraceptive 100
Estradiol Natural Hormone 95
Estron Natural Hormone 97
Magnesium to phosphorus (Mg:P) dosing ratio is shown to have an inversely-correlated
relationship on inclusion of antibiotics, with struvite produced with higher Mg:P ratios at a pH of
9.6 leading to lower pharmaceutical content (Kemacheevakul et al. 2015). This is most likely due
to magnesium forming metallic complexations with carboxylate groups found in quinolone
pharmaceutical compounds (Turel 2002). Some common quinolone compounds are antibiotics

15
prescribed today such as ciproflaxcin, enoxacin, or cinoxacin. Increasing the Mg:P dosage ratio
during struvite precipitation increases the chance of magnesium-quinolone complexes forming
decreasing their ability to agglomerate to struvite precipitates.
Other heavy metals are a concern in regulated phosphorus fertilizers due to their presence source
materials, but the risk in urine-derived struvite is low because of the low heavy metals content in
urine. Regardless investigation into heavy metals adsorption showed that metals such as lead,
cadmium, and copper will precipitate into urine-derived struvite (Ronteltap et al. 2007a).
Recovery of struvite from source-separated urine has not been conducted utilizing upflow-
fluidized bed technology, which has been proven to create a high quality struvite product using
dewatering liquor from anaerobically digested sludge as a feed source (Bhuiyan et al. 2008b,
Ueno and Fujii 2001). Precipitation kinetics involved in the production of the slow-release
struvite from complex solutions necessitates investigation of pathogens and pharmaceutical
inclusion from urine.
2.2.4. Separation & Collection Technologies
Source-separated urine is typically collected using waterless urinals and urine-diverting toilets
that utilize a separate drain valve to collect urine. These systems were fairly new during the
period this thesis was written, less than 20 years old when considering the history of combined
waste disposal and even centralized wastewater treatment. Lessons learned from the first urine
separation and collection systems have provided guidance and evolution to newer systems. High
drainage slopes, increased pipe diameter and configuration of piping systems to include a u-bend
are important with respect to maintenance associated with descaling formed precipitates that
create blockages and decreasing odor issues (Jonsson et al. 1997). In smaller research
applications, urine has been collected in small containers and consolidated due to lack of urine-
diverting toilets (Tilley et al. 2008b).
In modern toilets urine and solid waste is diluted with 0.5 to 3.2 gallons of water, depending on
the type and age of toilet or urinal used, before entering the sewer system where it is further
diluted by greywater and possible infiltration and inflow from storm and tidal water on its way to
WWTP (EPA 2016). This dilution increases the volume of raw wastewater flowing into WWTP
in turn increasing cost associated with daily wastewater treatment. Waterless urinals are the most
evolved technology associated with urine separation and collection. In the U.S. there are multiple
distributors of waterless urinals with installation occurring in offices, gyms, schools, and prison
buildings with mixed experiences (Industrial Economics 2008). A majority of waterless urinals
use a u-bend trap system (Figure 5) containing a solution similar to vegetable oil to create an
odor barrier between the urine tank while some utilize microbiological systems or valve
barriers(Gentworks-Ltd. 2008). All of these systems require maintenance and regular upkeep to

16
ensure proper functioning with frequency and intensity depending on usage. As the most
common urine-separating toilet technology, it is mainly used to save money and water rather
than separating and collecting urine for treatment with a wide selection available in the U.S.
Waterless urinals require little to no behavior change for users and interaction is often easier as
they require no flushing.
Figure 5 - Eco Trap Cartridge Used in Waterless Urinals (NWS Europa, 2015)
Urine-diverting toilets are less commonly found due to both the limited selection and behavioral
change associated with usage. Urine-diverting toilets have a separate drain in the front of the
toilet that utilizes a membrane seal in the Dubbletten, a water trap Wostman Eco-Flush (Figure
6), or pressure-valve (requiring a vacuum system ) in the Roediger NoMix to diminish odor and
collect urine(Wafler 2014). These toilets are costly and only recently became available in U.S.
with distributors located in the northeast region at the time of writing this thesis (EcoVita 2015,
Rosie's-Natural-Way 2015). As these toilets were designed in European countries, they have
standard European fixtures and require additional fittings in order to function in the U.S. These
toilets have dual flush capabilities with the low flow flush using 0.03-0.05 gallons of water to
rinse the toilet bowl and remove urine odors. This flow also slightly dilutes urine and can
contribute to phosphorus losses. Maintenance issues include blocking of the urine port from
scaling of the membrane or the pressure valves, or blockages from toilet paper or solid
waste(Lienert 2007). Due to their small size children also have issues using urine-diverting
toilets. Urine-diverting toilets require evolution in design in order diminish issues with blockages
and easing installation and usage in the U.S.

17
Figure 6 - Cross-Section from Wostman Eco-Flush Urine Separating Toilet
(wostman.se/ecoflush)
Attitudes, knowledge and investment in the urine collection systems all play a key part toward
success of implementing urine-diversion and collection systems. Establishing a stakeholder
attitude for the project with users has a strong influence on the attitude of users increases support
(Lienert 2007). Installation of toilets is difficult in older buildings and is recommended for new
construction rather than retrofitting due to associated costs (Jimenez et al. 2015). After
installation separated urine requires treatment and is often is just sent to WWTP causing
intensification of influent stream due to the lack of urine diversion treatment options available in
the U.S.
2.2.5. Struvite
Struvite is an orthophosphate compound with equimolar concentrations of magnesium,
ammonium, and phosphate with six waters of hydration (MgNH4PO4•6H2O). As a precipitate, it
has an orthorhombic crystalline structure of straight prisms and a rectangular base with a
glowing white crystal appearance (Figure 7). Struvite has a molecular weight of 245.43 grams
per mole, a specific gravity of 1.711 and a solubility product of -10.326 (Le Corre et al. 2009,
Ohlinger 1998). Its low solubility product and specific gravity make it difficult to treat with acid
and remove when it appears as a nuisance. Struvite precipitates in a 1:1:1 molar ratio decreasing
solutions pH due to the release of hydrogen ions as seen in Equation 2:
𝑴𝒈𝟐+ + 𝑵𝑯𝟒+ + 𝑯𝒏𝑷𝑶𝟒
𝟑−𝒏 + 𝟔𝑯𝟐𝑶 → 𝑴𝒈𝑵𝑯𝟒𝑷𝑶𝟒 ∙ 𝟔𝑯𝟐𝑶 + 𝒏𝑯+ (2)

18
Figure 7 - Post Digestion Orthombic Struvite Crystal (Doyle and Parsons 2002)
Until recently struvite was commonly considered a nuisance in WWTP rather than a recoverable
product for use as a fertilizer. At wastewater treatment facilities, struvite will create major
maintenance issues by blocking piping preventing flow and treatment and was first observed in
1937 (Le Corre et al. 2009). It generally occurs in the side stream for plants that utilize BPNR
and anaerobic digesters. High concentrations of phosphorus and nitrogen combined with
turbulence of flow in WWTP encourage the spontaneous precipitation of struvite in pipes and
pumps along with digesters decreasing the treatment capacity (Figure 8).
Figure 8 - Struvite Buildup at HRSD's Nansemond WTTP in Suffolk, VA

19
At WWTP, in order to prevent or treat the maintenance issues, acid can be added to the
sidestream flow, where the concentration of phosphorus is highest in the plant, to prevent
precipitation and ferric salts can be added to bind the phosphate. Due its status as a nuisance,
until recently struvite was mostly studied as a scale agent for removal or prevention rather than a
possible economically beneficial product. As mentioned in section 1.1 increasing effluent limits
and intensification of waste have driven the cost of treatment up, making the phosphorus
recovery as struvite process more attractive to utilities. Chemical costs associated with treatment
and removal of phosphorus can be offset by income provided by selling precipitated struvite as a
fertilizer which first happened in 1998 in Japan (Ueno and Fujii 2001). As nitrogen and
phosphorus are nutrients necessary for abundant and healthy crops, struvite is a practical and
highly effective choice for use as a fertilizer (Li and Zhao 2003). Currently there are multiple
struvite recovery processes being sold across the world, and one example is the Ostara PearlTM
process (Ostara 2016).
2.2.6. Struvite Precipitation
Several physical-chemical factors also have an impact on the precipitation of struvite such as pH
of the solution, supersaturation, mixing energy, and presence of foreign ions. Supersaturation is
the driving force in precipitating struvite from a solution (Bouropoulos and Koutsoukos 2000).
Saturation conditions of struvite in a solution can either be undersaturated, metastable, or
supersaturated representing the potential for struvite crystal formation in a solution. Struvite
precipitation will not occur at all in an undersaturated solution and will usually solubilize.
Precipitation that occurs in the metastable zone usually occurs as secondary nucleation or crystal
growth on to a seed material (usually struvite crystals that have previously precipitated). In
supersaturated conditions spontaneous precipitation will occur forming small struvite particulates
also known as fines. Calculating relative saturation (Ω) (Equation 3) in relation to the solubility
product can allow for predicting conditions in which struvite may precipitate.
𝛺 = (𝑎
𝑀𝑔2++𝑎𝑁𝐻4
++𝑎𝑃𝑂4
3−
𝐾𝑠𝑜) (3)
The activity of the ionic species relative to Mg2+
, NH4+ and PO4
3- is denoted as a and KSO is the
solubility product. Supersaturation ratio can then be used to calculate the relative supersaturation
ratio (σ) (Equation 4) allowing for manipulation of metastable zone characteristics to help create
the optimum mode for secondary nucleation of struvite. (Bouropoulos and Koutsoukos 2000)
𝜎 = 𝛺1/3 − 1 (4)
Computer modeling has been created using these equations to predict struvite precipitation and
determine best conditions for control (Doyle and Parsons 2002, Ohlinger and Mahmood 2003).

20
These models are limited in their accuracy when applied to complex solutions, such as
wastewater and even more so urine, due to the complex systems of ions in these solutions.
Figure 9- Nucleation of Crystals(Le Corre et al. 2009)
Nucleation is the crystal births of ions that bond together to form crystals embryos in a gas or
liquid media. There are two different forms of crystal nucleation as seen in
Figure 9. Nucleation can either occur in as the formation of a new crystal in either primary
nucleation or secondary nucleation induced by the crystal precipitates. Primary nucleation can
also occur when foreign particles are present to provide bonding sites, for instance the initial
bonding associated with struvite blockages in WWTP. Nucleation type is governed by
supersaturation and diffusion mechanisms and can influence the precipitation kinetics and
growth rate influencing the final size of the crystal (Bouropoulos and Koutsoukos 2000).
Nucleation rate, J, measures the number of struvite nuclei formed per unit of time and volume
can be calculated with the following general equation:
𝐽 = 𝐴 exp [−16𝜋𝑦3𝑣2
3𝑘3𝑇3(𝑙𝑛𝛺)2] (5)
Where A is defined as the kinetic factor (1017
nuclei.cm-3
), k is the Boltzmann constant (1.38
J*K-1
), Ω is the supersaturation ratio, γ is the interfacial tension between a crystal and the
solution usually (50 mJ*m-2
), v is the molecular volume (cm3), T the absolute temperature (K)
(Abbona and Boistelle 1985, Bouropoulos and Koutsoukos 2000). Higher nucleation rates
indicate spontaneous precipitation rather than controlled growth through secondary nucleation.

21
Supersaturation is the triggering factor for struvite nucleation but induction time plays an
important role in structure of the crystal after precipitation (Ohlinger and Young 1999).
Induction time is the time period between blending of solutions containing precipitant
constituents and the first measurable indication of indication of the precipitation.
𝑡𝑖𝑛𝑑 = 𝑡𝑁 + 𝑡𝐺 (6)
Nucleation time (tN) and growth time (tG) cumulate as the induction time (tind) required to make a
detectable crystal (Jones 2002). Induction time can be determined using many different methods
including light scintillation, turbidimetry, and conductimetry, absorbance measurements, or pH
measurements (Le Corre et al. 2009) and is dependent on the degree of saturation, temperature,
and the presence of impurities in the solution. It has been determined that induction time is
inversely proportional and mostly influenced by the supersaturation level (Bouropoulos and
Koutsoukos 2000). Mixing speeds influence on nucleation only decreases the induction time by a
fraction, while physic-chemical properties having a more important influence on precipitation
(Ohlinger and Young 1999). Mixing speed influences surface diffusion mechanisms and can
control secondary nucleation and induction time at certain saturation levels can be decreased
moderately with enough agitation.
Following nucleation, crystal growth rate occurs through two mechanisms. Mass transfer from a
solute in the solution to the crystal surface by diffusion, convection, or both and surface reaction
bonding the precipitate to the crystal lattice using surface integration(Jones 2002). Crystal
growth rate can be expressed as an increasing size (L) versus time (t):
𝐺 =𝑑𝐿 (𝑖.𝑒.𝑠𝑖𝑧𝑒 𝑣𝑎𝑟𝑖𝑎𝑡𝑖𝑜𝑛)
𝑑𝑡 (𝑖.𝑒.,𝑡𝑖𝑚𝑒 𝑣𝑎𝑟𝑖𝑎𝑡𝑖𝑜𝑛)= 𝑘𝑔𝜎𝑔 (7)
Growth rate (G) is related to the growth constant (kg) proportional to the relative supersaturation
(σg) with g equal 1 for mass transfer controlled growth and g greater than 1 for surface
integration-controlled growth. Mechanisms involved in crystal growth cannot be neglected, as
they are responsible for final size and structure of crystals. For high growth kinetics, crystals will
adopt a flat configuration, while for low-growth kinetics “stick-like” crystals will form (Abbona
and Boistelle 1979). Determining the occurrence of nucleation and controlling it along with the
growth of crystals is difficult. The process depends on a combination of factors many of which
were mentioned earlier. In most methods to encourage precipitation of crystals from saturated
solutions temperature manipulation is utilized, either by decreasing the solvent the struvite is
suspended in or cooling the solvent. In contrast with struvite precipitation adjusting the pH of the
solution containing the struvite has the highest influence on the crystallization process, due to its

22
direct correlation with solubility and supersaturation acceleration or retarding induction
time(Abbona and Boistelle 1985).
Studies have shown that struvite is insoluble at a pH of 9 or higher and as the pH goes from 5 to
7.5 struvite solubility decreases from 3000 mg/L to 100 mg/L(Borgerding 1972, Buchanan et al.
1994). As the pH lowers the rate at which struvite precipitates out of the solution decreases, and
also affects the quality of the crystals produced. There is a directly proportional relationship
between the pH of the solution and growth rate (Bouropoulos and Koutsoukos 2000). As the
water does not mix in the stagnant zones the pH of the solution drops decreasing growth rates.
Studies have shown that an increase of pH from 8 to 11 could decrease the mean crystal size of
struvite in synthetic solutions, but a pH above 9 will not form struvite and instead
Mg3PO4*22H2O (Le Corre et al. 2007).
Temperature has a lower impact on struvite crystallization than pH or saturation state however it
does affect struvite solubility and crystal morphology (Le Corre et al. 2009). There is a positively
correlated relationship between the temperature of a solution and solubility of the struvite,
making it harder to achieve precipitation at higher temperatures (Aage et al. 1997). Optimal
temperature for struvite precipitation is in a range of 25-35 degrees Celsius in both synthetic
liquids and digesters. High temperatures in a solution create diffusion controlled growth at which
the reactants interact is almost instantaneously causing spontaneous precipitation. High
temperatures along with higher magnesium concentrations cause newberyite (MgHPO4*3H2O)
to precipitate rather than struvite (Babic-Ivancic et al. 2006).
In complex solutions foreign ions can decrease the crystal growth rate and nucleation of struvite
in solutions influencing induction time and overall removal of phosphorus. The presence of
calcium, sodium and carbonate ions during struvite precipitation can negatively affect growth
rates and lengthen induction time superseding supersaturation influence on precipitation
(Kabdasli 2005). Sodium ions have been shown to retard growth of struvite at concentrations
over 1150 mg/L Na+. Sludge liquors or centrate can have a high presence of calcium that
interacts with phosphate to create calcium phosphate reducing recoverable struvite mass. At any
time when the molar ratios of calcium and magnesium were 1:1 struvite formation was limited or
inhibited by the formation of calcium phosphate (Kofina and Koutsoukos 2005).
2.2.7. Upflow Fluidized Bed Reactor Technologies
Current methods for phosphorus removal from wastewater treatment plants (biological or
chemical) lead to a higher amount of phosphorus and nitrogen in sludge and spontaneous buildup
of struvite in WWTP pipes. Crystallization of struvite and calcium phosphate has become a more
popular and feasible option for lowering phosphorus concentrations within the plant while

23
simultaneously selling the products as a fertilizer to offset cost of treatment costs. Fluidized bed
reactors are the most commonly used method for removal of phosphorus as a usable by-product
and has been implemented worldwide (Bhuiyan et al. 2008b, Britton et al. 2005, Ueno and Fujii
2001). Struvite precipitation utilizing the fluidized bed reactor can create a dense product up to
3.5 millimeters in size that solubilizes slowly when applied on agricultural land. This maximizes
a crop’s fertilizer utilization while decreasing waste and runoff associated with fertilizer
application. Development of the fluidized bed approach used in this thesis occurred at University
of British Columbia Environmental Engineering Pilot Plant in Vancouver, B.C., Canada
(Mavinic et al. 2003).
Struvite recovered in this process is 99% pure (Britton et al. 2005). A simplified process flow
diagram can be found in Figure 10. High strength phosphorus and nitrogen solution is fed
through the bottom of the reactor where magnesium and pH controlling solutions (such as caustic
are added). At this point influent flow is also combined with effluent recycle to ensure the bed is
fluidized through a maintained upflow velocity due to fluctuations in feed solution
concentrations and increasing hydraulic retention time. The reactor had an increasing diameter
with height to induce a fluidized bed with various mixings zones. This encouraged mobility of
precipitates and allowed for nucleation to occur towards the upper section and crystal growth
occurring towards the bottom the reactor taking advantage of mixing that controls diffusion
mechanisms and supersaturation ratios and therefore nucleation type and growth rate. As they
grow in size to above 0.5 millimeter the precipitates become referred to as prills. Fines that
accumulate from struvite precipitation are often mud-like in consistency and are inhibitory to
growth of the struvite prills and lead to further accumulation of fines. Loss of struvite as fines
also decreases the overall recovery of marketable struvite product from of the reactor. A large
accumulation of fines within the reactor can cause the loss of stable growth of prills and require
the reactor to be reseeded with product.

24
Figure 10 - Diagram of Upflow Fluidized Bed Reactor for Struvite Recovery
As mentioned in Section 2.2.6 struvite solubility is higher at a lower pH and crystal growth rate
is more controlled at lower pH causing a conflict in reactor target operations. The pilot reactor
was able obtain 90% phosphorus removal at pH of 7.3, lower than typically seen for struvite
precipitation through controlling supersaturation and return stream recycle rates (Adnan et al.
2003). The recycle ratio of the feed to return liquor with influenced the turbulence in the reactor
in turn affecting crystal growth rate (Bhuiyan et al. 2008a). Production of struvite at a lower pH
required additional magnesium to increase the supersaturation of the solution. Retention of the
struvite product can influence the ability of the product resist damage during harvest and drying
processes along with determining the final size of the product with a longer retention time
increasing compactness and size of the prill (Mavinic et al. 2003).
Recovering struvite from source-separated urine utilizing an upflow fluidized bed reactor has not
been conducted. Successful application of this process could allow for a sustainable source for
phosphorus-based fertilizer with the possibility to decrease loads to WWTP.

25
3. Manuscript
3.1. Introduction
Urine, a sterile liquid waste product produced by the kidneys, removes inorganic chemicals such
as phosphorus and urea from the human body (Brunzel 2004). It can also contain pharmaceutical
and pharmaceutical by-products and in individuals with compromised immune systems,
pathogens can be present. Urine contributes 80% of nitrogen, 50% of phosphorus, and half of
contaminants of emerging concern (CECs) to municipal wastewater treatment plants (WWTP),
but only contributes about 1% of flow by volume (Larsen et al. 2013). Reducing the influent
urine to municipal WWTP by 70% and 90% can eliminate the need biological phosphorus and
nitrogen removal (BPNR), respectively and even small decreases can benefit WWTP (Jimenez et
al. 2015)
Urine in the bladder is sterile in healthy individuals, but may be exposed to normal bacterial flora
before fully exiting the body through the distal urethra. Storage of urine to inactivate pathogens
before use as an agricultural fertilizer has been investigated to determine risks associated with
transportation, handling, and application. High concentrations of ammonia, a known biocide,
combined with the increased pH are the main contributors to inactivation of pathogens in source-
separated urine (Udert et al. 2003b). Single-stranded RNA viruses, coliphage MS2, are readily
inactivated in hydrolyzed urine to 90% removal after 5 days (Decrey et al. 2015). Urine is the
manner in which the body excretes the majority of micropollutants, mainly hormones and
pharmaceuticals. Prior research has indicated that roughly 65% of pharmaceuticals key
components, 42% as metabolites, are excreted through urine (Lienert et al. 2007).
Phosphorus fertilizer is an integral part of the current global food production. A majority of the
fertilizer sourced is from phosphorus-based gypsum rock that must be mined, treated to remove
heavy metal contaminants, and shipped around the world for application. Phosphorus rock
mining rates have steadily increased as the global demand for food has grown and agricultural
practices. Peak-phosphorus mining is expected to occur around 2050 with supplies exhausted by
the early 2100s(Steen 1998). As traditionally inexpensive forms of phosphorus have become less
economical the aim has turned to cost-effective sustainable sources. One form of phosphorus-
based fertilized produced today is struvite, a slow-dissolving orthophosphate compound with
equimolar concentrations of magnesium, ammonium, phosphate, and six waters of hydration
(MgNH4PO4•6H2O).
Fluidized bed reactors is a technology currently utilized to recover phosphorus as struvite at
WWTP from dewatering liquor from anaerobically digested sludge (centrate) (Bhuiyan et al.
2008b, Britton et al. 2005, Ueno and Fujii 2001). Struvite precipitation utilizing the fluidized bed
reactor can remove up to 90% of phosphorus as a dense product, referred to as prills, up to 3.5

26
millimeters in size that solubilizes slowly when applied on agriculture (Adnan et al. 2003). High
strength phosphorus and nitrogen solution is fed through the bottom of the reactor where
magnesium and pH controlling solutions are added to facilitate struvite precipitation through
crystal growth.
Struvite recovery from source separated urine can be an economically feasible method due to the
low energy costs associated with struvite precipitation and economic savings associated with
diverting phosphorus from WWTP influent streams. High phosphorus and nitrogen
concentrations in aged source separated urine create an ample environment for the formation of
struvite (Tilley et al. 2008b). Mass and particle size of struvite recovery from urine is dependent
on pH, magnesium to phosphorus (Mg:P) dosing ratio, storage conditions, and strength of feed
solution (Ronteltap et al. 2007b, Ronteltap et al. 2010, Tilley et al. 2008a). Recovering struvite
from source-separated urine utilizing an upflow fluidized bed reactor has not been conducted.
Successful application of this process could allow for a sustainable source for phosphorus-based
fertilizer with the possibility to decrease loads to WWTP.
In order to investigate the feasibility of struvite recovery as prills from urine using upflow fluid
bed reactors (UFBR), aged source-separated urine was fed to a pilot-scale UFBR with
magnesium to facilitate struvite precipitation. Reactor operation was compared between urine
and centrate as a feed source an long-term operation (>30 days) using urine as a feed source.
Urine-derive struvite crystal morphology, prill size, purity and quality were assessed with respect
to pilot-scale operation in order to determine feasibility of prill production from urine. Urine and
urine-derived struvite were assessed for pharmaceuticals and pathogens to determine inclusion, if
any.

27
3.2. Methodology
3.2.1. Urine Collection and Storage
The first office-based urine-separation and collection system in the United States was
implemented at HRSD’s main office building in Virginia Beach, VA. Supplementary piping was
installed alongside traditional blackwater lines during construction that directed the flow of
separated urine from the building to the sanitary sewer until collection began by way of a bypass.
This bypass flowed through the collection tank as seen in Figure 11 also providing an overflow
outlet when collection began. Installation of the urine-diversion piping allowed for collection of
urine from men’s urinals on both floors, but due to plumbing requirements urine separation in the
women’s restroom was only possible on the second floor.
Figure 11 - Plan View of HRSD Main Office Urine Separation Setup
The urinals in the men’s restroom were American Standard Flowise 6154.100 model that use
drain inserts and odor barrier liquid to create a u-trap (Figure 5). Two men’s urinals were in
place on the first floor of the building, with three on the second floor. In the second floor
women’s restroom, a Wostman Eco-Flush toilet was installed to collect urine from female
employees. Modifications were made to the toilet flush mechanism to eliminate the dual flush
system easing use by removing the necessity to throw away toilet paper. The urine-separating
toilet was placed in service on June of 2015 after a voluntary presentation on use and
introduction of the toilet was conducted in the office. Until the installation and full-time use of
the women’s urine-separating toilet contributions from urine collection was all male.
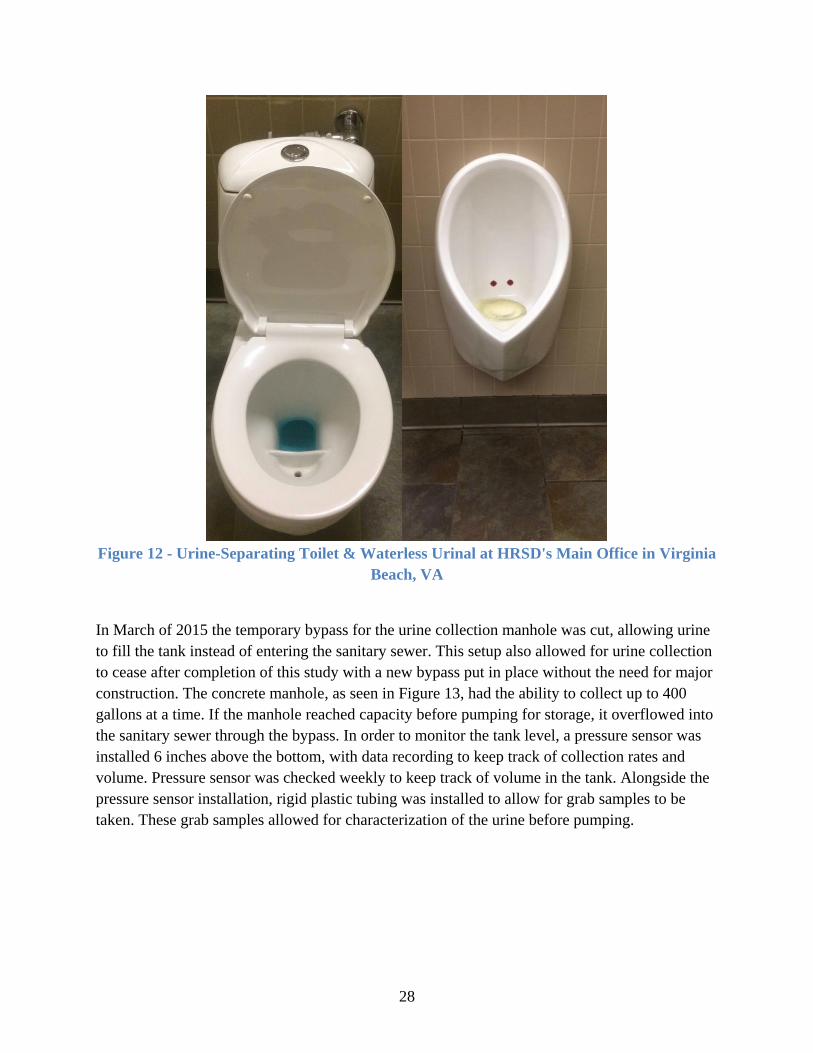
28
Figure 12 - Urine-Separating Toilet & Waterless Urinal at HRSD's Main Office in Virginia
Beach, VA
In March of 2015 the temporary bypass for the urine collection manhole was cut, allowing urine
to fill the tank instead of entering the sanitary sewer. This setup also allowed for urine collection
to cease after completion of this study with a new bypass put in place without the need for major
construction. The concrete manhole, as seen in Figure 13, had the ability to collect up to 400
gallons at a time. If the manhole reached capacity before pumping for storage, it overflowed into
the sanitary sewer through the bypass. In order to monitor the tank level, a pressure sensor was
installed 6 inches above the bottom, with data recording to keep track of collection rates and
volume. Pressure sensor was checked weekly to keep track of volume in the tank. Alongside the
pressure sensor installation, rigid plastic tubing was installed to allow for grab samples to be
taken. These grab samples allowed for characterization of the urine before pumping.

29
Figure 13 -HRSD's Urine Collection Manhole
Urine tank pumping was conducted monthly after the tank had collected sufficient volume to fill
275 or 330-gallon plastic totes. Urine collection totes, referred to as totes for the rest of this
thesis, were acquired from HRSD’s wastewater plants and thoroughly cleaned before filling with
urine. After collection urine totes were transported from the HRSD Main Office Building in
Virginia Beach, VA to HRSD’s Nansemond WWTP in Suffolk, VA and stored for 3-9 months at
temperatures . This storage period allowed the urine to reach equilibrium to encourage
precipitation of excess ions that may influence precipitation and maximize pathogen inactivation
and possible pharmaceutical decay.
Directly after urine collection, samples from each tote were submitted to the HRSD’s National
Environmental Laboratory Accreditation Program accredited Central Environmental Laboratory
for analysis for TP, PO43--P, NH3-N, TKN, COD, Alkalinity, Conductivity, and Metals. The
reference methods for samples analysis of each constituent can be found in the appendix.

30
3.2.2. Pearl 0.5 Reactor
An Pearl™ 0.5 reactor (Ostara NRT, Inc.) (Figure 14, Figure 15) was loaned to HRSD by the
University of British Columbia to evaluate the feasibility of struvite precipitation from urine.
Design capacity for the Pearl™ 0.5 rated for the production of 0.5 kilograms of struvite per day
under optimal conditions. The Pearl™ 0.5 was constructed of acrylic with PVC fittings and 1
inch flexible tubing for the recycle and effluent hoses. This allowed for the observation of the
flow dynamics and prill growth in the reactor. The recycle stream was controlled using a Moyno
500 332 Series Progressive Cavity Pump, with a flow rate monitored using a Rosemount
magnetic flow meter and accuracy checked weekly using a calibration column. Modifications
were made to the original Pearl™ 0.5 reactor pilot during shakeout testing. This testing was
conducted to optimize reactor efficiency and gather baseline operation and optimal prill quality
from the reactor using centrate. Results from this testing are not included in this thesis with the
exception of operational data and prill analysis, to provide comparison.

31
Figure 14 - Pearl 0.5 Reactor Setup

32
Figure 15 - Pearl 0.5 & Chemical Dosing Equipment
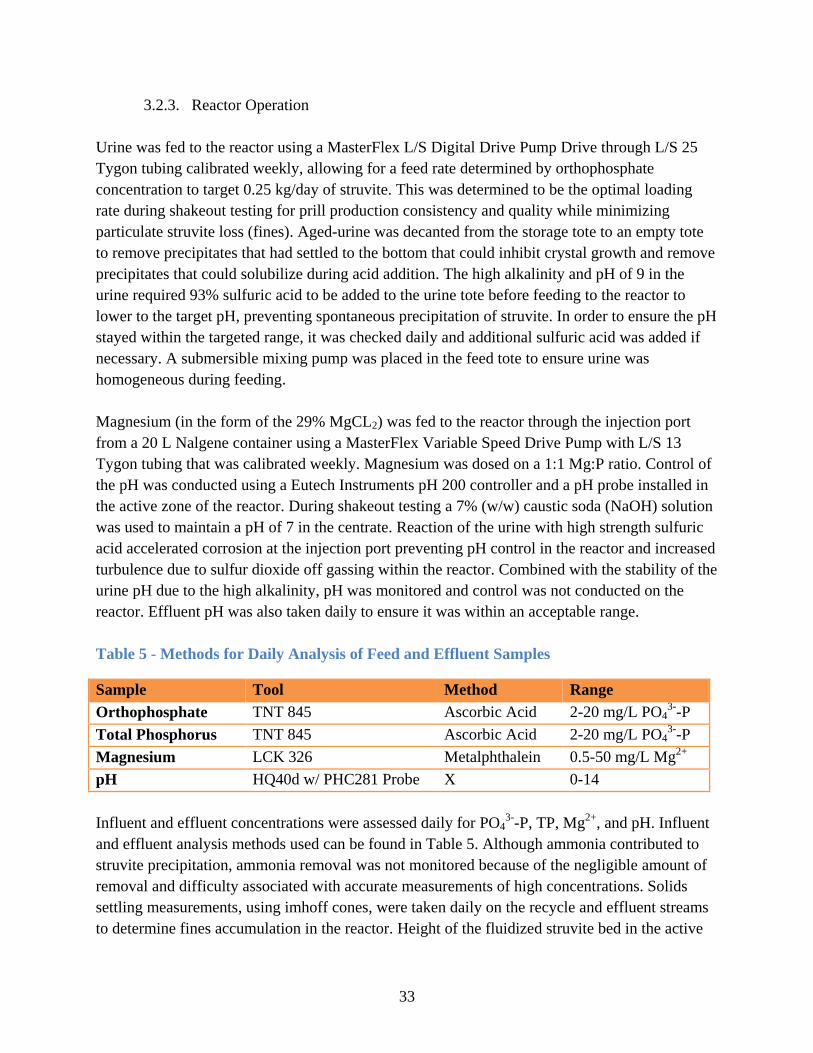
33
3.2.3. Reactor Operation
Urine was fed to the reactor using a MasterFlex L/S Digital Drive Pump Drive through L/S 25
Tygon tubing calibrated weekly, allowing for a feed rate determined by orthophosphate
concentration to target 0.25 kg/day of struvite. This was determined to be the optimal loading
rate during shakeout testing for prill production consistency and quality while minimizing
particulate struvite loss (fines). Aged-urine was decanted from the storage tote to an empty tote
to remove precipitates that had settled to the bottom that could inhibit crystal growth and remove
precipitates that could solubilize during acid addition. The high alkalinity and pH of 9 in the
urine required 93% sulfuric acid to be added to the urine tote before feeding to the reactor to
lower to the target pH, preventing spontaneous precipitation of struvite. In order to ensure the pH
stayed within the targeted range, it was checked daily and additional sulfuric acid was added if
necessary. A submersible mixing pump was placed in the feed tote to ensure urine was
homogeneous during feeding.
Magnesium (in the form of the 29% MgCL2) was fed to the reactor through the injection port
from a 20 L Nalgene container using a MasterFlex Variable Speed Drive Pump with L/S 13
Tygon tubing that was calibrated weekly. Magnesium was dosed on a 1:1 Mg:P ratio. Control of
the pH was conducted using a Eutech Instruments pH 200 controller and a pH probe installed in
the active zone of the reactor. During shakeout testing a 7% (w/w) caustic soda (NaOH) solution
was used to maintain a pH of 7 in the centrate. Reaction of the urine with high strength sulfuric
acid accelerated corrosion at the injection port preventing pH control in the reactor and increased
turbulence due to sulfur dioxide off gassing within the reactor. Combined with the stability of the
urine pH due to the high alkalinity, pH was monitored and control was not conducted on the
reactor. Effluent pH was also taken daily to ensure it was within an acceptable range.
Table 5 - Methods for Daily Analysis of Feed and Effluent Samples
Sample Tool Method Range
Orthophosphate TNT 845 Ascorbic Acid 2-20 mg/L PO43-
-P
Total Phosphorus TNT 845 Ascorbic Acid 2-20 mg/L PO43-
-P
Magnesium LCK 326 Metalphthalein 0.5-50 mg/L Mg2+
pH HQ40d w/ PHC281 Probe X 0-14
Influent and effluent concentrations were assessed daily for PO43-
-P, TP, Mg2+
, and pH. Influent
and effluent analysis methods used can be found in Table 5. Although ammonia contributed to
struvite precipitation, ammonia removal was not monitored because of the negligible amount of
removal and difficulty associated with accurate measurements of high concentrations. Solids
settling measurements, using imhoff cones, were taken daily on the recycle and effluent streams
to determine fines accumulation in the reactor. Height of the fluidized struvite bed in the active
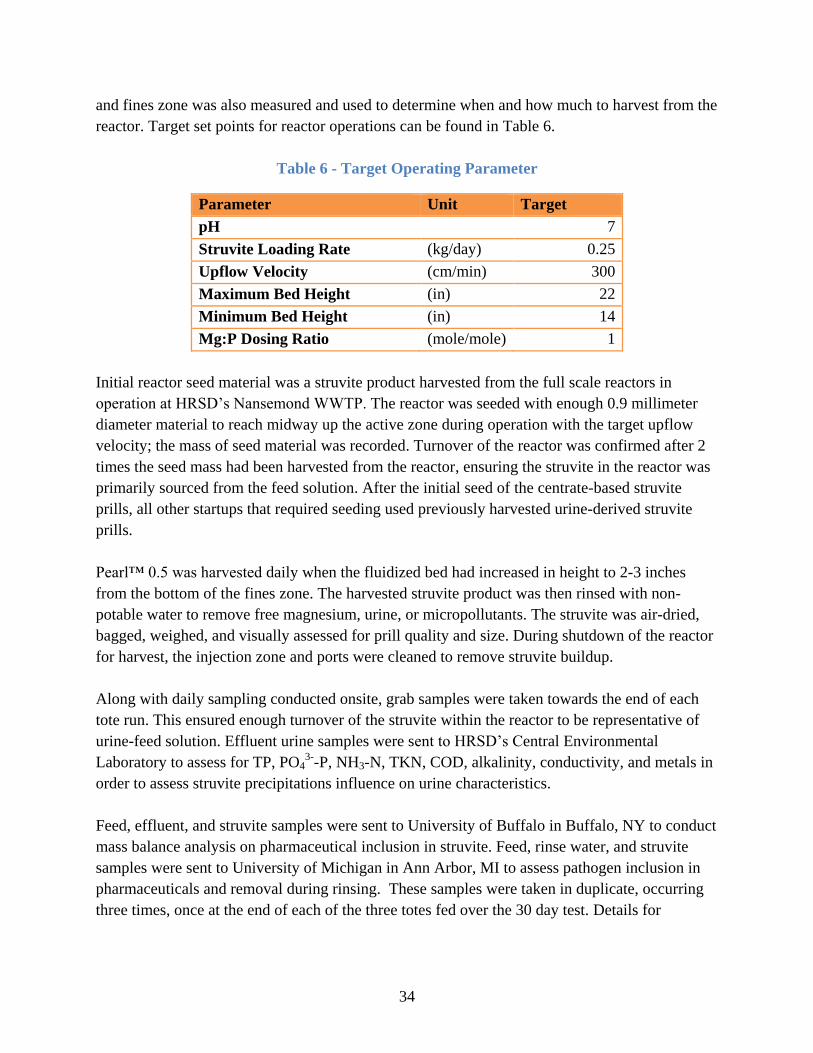
34
and fines zone was also measured and used to determine when and how much to harvest from the
reactor. Target set points for reactor operations can be found in Table 6.
Table 6 - Target Operating Parameter
Parameter Unit Target
pH 7
Struvite Loading Rate (kg/day) 0.25
Upflow Velocity (cm/min) 300
Maximum Bed Height (in) 22
Minimum Bed Height (in) 14
Mg:P Dosing Ratio (mole/mole) 1
Initial reactor seed material was a struvite product harvested from the full scale reactors in
operation at HRSD’s Nansemond WWTP. The reactor was seeded with enough 0.9 millimeter
diameter material to reach midway up the active zone during operation with the target upflow
velocity; the mass of seed material was recorded. Turnover of the reactor was confirmed after 2
times the seed mass had been harvested from the reactor, ensuring the struvite in the reactor was
primarily sourced from the feed solution. After the initial seed of the centrate-based struvite
prills, all other startups that required seeding used previously harvested urine-derived struvite
prills.
Pearl™ 0.5 was harvested daily when the fluidized bed had increased in height to 2-3 inches
from the bottom of the fines zone. The harvested struvite product was then rinsed with non-
potable water to remove free magnesium, urine, or micropollutants. The struvite was air-dried,
bagged, weighed, and visually assessed for prill quality and size. During shutdown of the reactor
for harvest, the injection zone and ports were cleaned to remove struvite buildup.
Along with daily sampling conducted onsite, grab samples were taken towards the end of each
tote run. This ensured enough turnover of the struvite within the reactor to be representative of
urine-feed solution. Effluent urine samples were sent to HRSD’s Central Environmental
Laboratory to assess for TP, PO43-
-P, NH3-N, TKN, COD, alkalinity, conductivity, and metals in
order to assess struvite precipitations influence on urine characteristics.
Feed, effluent, and struvite samples were sent to University of Buffalo in Buffalo, NY to conduct
mass balance analysis on pharmaceutical inclusion in struvite. Feed, rinse water, and struvite
samples were sent to University of Michigan in Ann Arbor, MI to assess pathogen inclusion in
pharmaceuticals and removal during rinsing. These samples were taken in duplicate, occurring
three times, once at the end of each of the three totes fed over the 30 day test. Details for

35
methods used in quantification of pharmaceutical content and pathogen inclusion can be found in
Section 3.2.4.
Samples of full-scale centrate-derived struvite, Pearl™ 0.5 centrate-derived struvite, and Pearl™
0.5 urine-derived struvite underwent x-ray diffraction analysis (XRD) using a Panalytical X’Pert
Pro Diffractometer and Panalytical software to measure and record. In order to interpret XRD,
Match!, a program from Crystal Impact was used to interpret XRD files and compare to known
standards from the Powder Diffraction Database (PDF). Struvite samples were also sent for
nutrient and metals analysis to determine struvite purity. Purity was determined by nutrient
analysis using the following methods EPA 350.1 for ammonia and EPA Method 3050B to
prepare the sample for EPA Method 6010B analysis for phosphorus pentoxide (P2O5),
magnesium oxide, and metals analysis. Fecal coliform analysis of samples was conducted using
SM 9221 E-(2006) and salmonella analysis was conducted using RapidChek/AOAC RI 030301.
3.2.4. Micropollutant Spike Test
A pharmaceutical spike test was conducted to assess pharmaceutical and pathogen inclusion in
urine-derived struvite precipitated in the reactor. Spiking with 10 mg/L of two dissimilar
pharmaceuticals products allowed for an accurate picture of micropollutant inclusion in struvite.
Caffeine, a polar pharmaceutical, and ibuprofen, a non-polar pharmaceutical, were each used to
assess how their interactions with solution could influence pharmaceutical inclusion. In order to
target 10 mg/L of caffeine in a feed tote, a 10,000 mg/L caffeine solution was made with 10
grams of Sigma Aldrich 58-08-2 Caffeine and 1 liter of high purity water. A 10,000 mg/L
ibuprofen solution was created by first solubilizing 10 grams of Sigma Aldrich 15687-27-1
Ibuprofen with 400 milliliters of waste methanol (60-75% methanol, 10-20% ethanol, water and
glycol products), due to its non-polar structure, and diluting to 1 liter with high purity water.
Some ibuprofen re-precipitated after addition of the water, most likely because of its non-polar
nature.
Analyses of feed, effluent and struvite samples were conducted using liquid chromatography
tandem triple quadrupole spectrometry. Separation was performed using reverse phase
conditions and a C18 column (2.1x100 mm, 3 um particle size) using 0.3% formic acid and
acetonitrile on a gradient for mobile phases. Two transitions were monitored for each analyte.
Urine was prepared for analysis by taking 25 mL of sample brought to pH 5 with acetic acid, and
25 mL of methanol added for protein precipitation, then brought to 500 mL with nanopure water,
and concentrated matrix clean-up by SPE using 500 mg HLB cartridges that were conditioned
with 6 mL of methanol followed by 6 mL of nanopure water. Cartridges were eluted with 8 mL
of acetonitrile and evaporated to dryness under N2. Samples were reconstituted in 500 uL of
90:10 water:acetonitrile solution and ran on the instrument. Struvite was prepared by solubilizing
0.5 mg of struvite in 300 mL of nanopure water and adding acetic acid to achieve a pH of 2.85.

36
The same SPE outlined for the urine method was used from here. Quantification was done by
isotope dilution.
Urine was also assumed to be contributed by a healthy population, diminishing the possibility of
pathogen presence especially when combined with the possible inactivation that occurred from
the high levels of ammonia. In order to determine if there is any risk of urine-derived struvite to
inclusion pathogens, bacteriophages behaving as pathogen indicator organisms were spiked in a
tote during the final 10 day test. 10 milliliters of 10^11 pfu/mL of MS2, a single stranded RNA
virus, and T3, a double stranded DNA virus, were spiked targeting concentrations 1.11*10^6
pfu/mL in feed solution. Samples of feed, struvite rinse water, and struvite were sent to
University of Michigan. Double layer plaque assays were used to determine infectivity of
bacteriophage T3 and MS2. Plaque forming units (pfu) are determined by serial dilution of the
source and infecting E.coli host cells.

37
3.3. Results and Discussion
3.3.1. Urine Collection & Characterization
Over a 9-month period, approximately 2400 gallons of urine were collected; collection periods
and volumes can be found in Table 7. Urine totes fed through the reactor after were aged from 5
to 9 months decreasing the possibility of micropollutant uptake in struvite. Urine tote 4 and 5
were not used to create urine-derived struvite due to a toilet leakage issue that filled that storage
tank partially with water. This caused a dilution of the urine and introduced cations that could
precipitate phosphate and reduce overall recoverable struvite mass.
Table 7 - Urine Collection Dates and Volumes
Tote # Collection
Date
Volume
(gal)
1 4/24/2015 210
2 5/18/2015 325
3 7/3/2015 260
4* 7/29/2015 280
5* 7/29/2015 100
6 8/31/2015 265
7 10/7/2015 242
8 11/4/2015 252
9 12/3/2015 243
10 1/29/2016 245
Total 2422
*Totes not used to due to dilution.
Averages and standard deviations from the eight totes used to recover struvite in the UFBR can
be found in Table 8. As seen in Table 8, urine is a complex ionic solution
which can influence precipitation kinetics, notably the concentration of sodium is comparable to
what has been found to retard induction time of struvite (Kabdasli 2005). The small difference
between the TP and PO43--P indicate that particulate phosphate that may have formed during
urea hydrolysis has been removed via settling. Concentrations from the 8 totes were found to
have high standard deviations most likely due to the variability of urine constituents from
individual to individual.
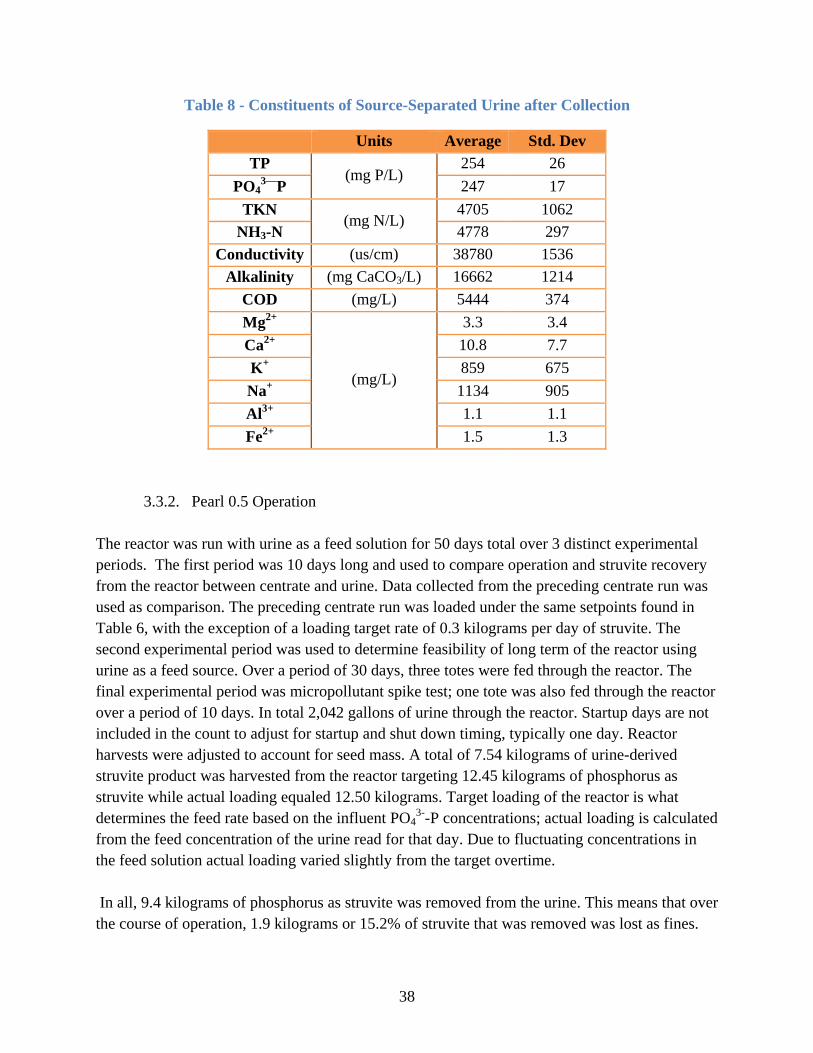
38
Table 8 - Constituents of Source-Separated Urine after Collection
Units Average Std. Dev
TP (mg P/L)
254 26
PO43—
P 247 17
TKN (mg N/L)
4705 1062
NH3-N 4778 297
Conductivity (us/cm) 38780 1536
Alkalinity (mg CaCO3/L) 16662 1214
COD (mg/L) 5444 374
Mg2+
(mg/L)
3.3 3.4
Ca2+
10.8 7.7
K+ 859 675
Na+ 1134 905
Al3+ 1.1 1.1
Fe2+
1.5 1.3
3.3.2. Pearl 0.5 Operation
The reactor was run with urine as a feed solution for 50 days total over 3 distinct experimental
periods. The first period was 10 days long and used to compare operation and struvite recovery
from the reactor between centrate and urine. Data collected from the preceding centrate run was
used as comparison. The preceding centrate run was loaded under the same setpoints found in
Table 6, with the exception of a loading target rate of 0.3 kilograms per day of struvite. The
second experimental period was used to determine feasibility of long term of the reactor using
urine as a feed source. Over a period of 30 days, three totes were fed through the reactor. The
final experimental period was micropollutant spike test; one tote was also fed through the reactor
over a period of 10 days. In total 2,042 gallons of urine through the reactor. Startup days are not
included in the count to adjust for startup and shut down timing, typically one day. Reactor
harvests were adjusted to account for seed mass. A total of 7.54 kilograms of urine-derived
struvite product was harvested from the reactor targeting 12.45 kilograms of phosphorus as
struvite while actual loading equaled 12.50 kilograms. Target loading of the reactor is what
determines the feed rate based on the influent PO43-
-P concentrations; actual loading is calculated
from the feed concentration of the urine read for that day. Due to fluctuating concentrations in
the feed solution actual loading varied slightly from the target overtime.
In all, 9.4 kilograms of phosphorus as struvite was removed from the urine. This means that over
the course of operation, 1.9 kilograms or 15.2% of struvite that was removed was lost as fines.

39
The reactor had a 60.3% recovery rate of struvite product which is considered low when
compared to upflow fluidized bed reactors.
3.3.2.1. Centrate v. Urine Operation
Centrate and urine fed through the reactor behaved in a similar manner overall with regard to
struvite recovery. Influent concentrations and characteristics influencing behavior in the reactor
between the two feed solutions can be found in Table 9. The only difference between operation
using urine and centrate was pH control methods. During centrate operation NaOH was fed to
the reactor to control pH. Other than the addition of sulfuric acid to lower pH of feed solution
during the urine run; pH was not controlled in the reactor. Off gassing of CO2 to the atmosphere
would cause the pH in the urine to drift up over time, requiring additional acid addition to the
tote over the operation period. Table 9 includes important characteristics of urine and centrate
with respect to reactor operation. Also for the first three days of operation using urine as a feed
source, the reactor was loaded at 0.3 kilograms per day instead of 0.25 kilograms per day. The
load rate was decreased in order to ensure there was enough urine was for a 10 day test period.
Table 9 - Characteristics of Urine and Centrate
Analyses Units Urine* Centrate
Average St. Dev. Average St. Dev
PO43—
P
(mg/L)
247 17 459 63
NH3-N 4778 297 629 112
Mg2+
3.3 3.4 15 3
Ca2+
10.8 7.7 - -
Alkalinity (as CaCO3) 16663 1214 <1000 -
pH ~9 - 6.9-7 -
*Values were calculated samples collected from 8 totes totaling ~2,000 gal of urine.
**Alkalinity was assumed to be less than 1000 due to acid addition before centrate
sample point.
Cumulative struvite production graphs for centrate (Figure 16) and urine (Figure 17) appear
similar in slope. Urine feed was lost during day two of operation, decreasing the overall yield
and accounting for the decrease in slope of all three parameters on Figure 17.The graphs display
the target loading rate for struvite recovery (target), theoretical yield based on PO43-
-P removal
(theoretical), and actual struvite recovery as prills from harvest (yield). The difference between
the target and theoretical is PO43-
-P that remains in solution, while the difference between
theoretical and yield is assumed to be loss of fines.

40
The fines that are lost are struvite precipitated by spontaneous nucleation rather than secondary
nucleation. Particulate fines are typically 0.5 µm and can be detrimental to reactor operations if
present in large amounts. The increased surface area from a surplus of fines in the reactor
prevented crystal growth from occurring on prills and perpetuated the precipitation of more fines.
Small amounts of fines were normal in stable operation of a reactor. The fines eventually
underwent crystal growth and became prills in the fluidized bed. If the reactor operated under
steady conditions excess fines that occurred exited through the effluent, while under unsteady
conditions, for example a rapidly fluctuating pH, a rapid accumulation of fines prevented reactor
recovery.
Days
2 4 6 8 10
Str
uvite
Pro
ductio
n (
kg/d
ay)
0.0
0.5
1.0
1.5
2.0
2.5
3.0
3.5
Target
Theoretical
Yield
Figure 16 - Centrate Feed - 10 Day Operation

41
Days
2 4 6 8 10
Str
uvite P
roduction (
kg/d
ay)
0.0
0.5
1.0
1.5
2.0
2.5
3.0
3.5
Target
Theoretical
Yield
Figure 17 - Urine Feed - 10 Day Operation
During centrate operation more PO43-
-P was theoretically removed as struvite, but more of the
removal was attributed to fines loss rather than yielded as prill growth when compared to
operation using urine as a feed source. This is likely caused by to two separate factors; the first is
the alkalinity difference, and the second is the difference between the concentrations of PO43-
-
and cations in urine and centrate. Due to the required caustic addition at the injection port, the
pH fluctuated in the reactor between 6.9 and 8, changing the precipitation characteristics of the
struvite. The fluctuations in pH decreased the solutions ability to remain in the metastable zone
where secondary nucleation occurs. As the pH rose rapidly, struvite became less soluble and
spontaneous precipitation overtook crystal growth as the control precipitation form causing rapid
fines production. Differences in the PO43-
-P, TP, and Mg2+
concentrations between centrate and
urine can be seen in Figure 18. Higher strength feed solution in the centrate also created a high
supersaturation ratio at the injection port increasing spontaneous precipitation. The sodium
concentration in the urine most likely slowed the crystal growth rate allowing the struvite to
grow in a more controlled manner.

42
Centrate Urine
Ave
rage C
oncentr
ations (
mgl/L)
0
200
400
600
800
Feed TP
Feed PO4-P
Effluent TP
Effluent PO4-P
Feed Mg
Effluent Mg
Figure 18 - Difference in Centrate and Urine Characteristics
In order to compare the behavior of phosphorus between using urine or centrate as a feed
solution, the average daily harvest (Yield), average daily fines loss (Theoretical) , and average
daily mass of PO43-
-P that remained in solution (Effluent) are displayed on pie charts in Figure
19. Operating the reactor on centrate incurred about a 15% more fines loss and about 5% more
overall phosphorus removal than when urine was used as a feed solution. Due to the low
alkalinity and plug flow characteristics, the pH of the centrate was more apt to behave in a
sinusoidal pattern, causing fines loss to occur consistently. Conversely, in the urine the high
alkalinity allowed the pH to remain fairly stable, allowing for a larger portion of phosphorus
removal to occur as crystal growth rather than fines loss. The fines and yield of the reactor while
using urine as a feed source had a large standard deviation this is most likely due to the loss of
feed for one day causing a large spike of fines during operation and the change of loading rate
during operation.

43
Figure 19 - Comparison of PO43- -P as Struvite Behavior between Centrate (left) and Urine
(right) feed solutions
Along with stable pH and lower supersaturation ratio of struvite, decreased fines loss could also
have occurred in the urine feed solution for the same reason less removal overall occurred. The
presence of carbonate and sodium ions could be increasing induction time overall, while
simultaneously decreasing the nucleation time and increasing growth time when compared to
centrate. This allowed for more overall growth of the struvite crystals through diffusion, rather
than loss to fines.
The high variability of centrate fines and phosphorus removal and relatively constant urine
operations with regards to overall removal and fines loss can be observed in Figure 20 for
centrate and Figure 21 for urine. It can be seen in Figure 20 that PO43-
-P removal rates
fluctuated between 0.20 and 0.35 kilograms per day of struvite production, with a reactor
targeting 0.30 kilograms per day using centrate as a feed solution. As the reactor hydraulics most
likely behaved more like plug flow rather than a completely-stirred tank reactor, the effluent
samples may not have been uniform.
52.4%±12.8
26.1%±19.4
21.4%±11.4
62.3%±28.8 9.1%±29.
3
28.5%±6.4

44
Days
0 2 4 6 8 10
Imhoff
Fin
es (
mL/L
)
0
5
10
15
20
25
30
PO
4-P
Rem
ova
l A
s S
truvi
te (
kg/d
ay)
0.00
0.05
0.10
0.15
0.20
0.25
0.30
0.35
0.40
0.45
0.50
Recylcle Fines
Effleunt Fines
PO4-P Removal as Struvite
Figure 20 - Centrate Removal of PO4-P as Struvite Compared to Recycle and Effluent
Imhoff Fines
Days
0 2 4 6 8 10
Imhoff
FIn
es (
mL/L
)
0
5
10
15
20
25
30
PO
4-P
Rem
ova
l as S
truvi
te (
kg/d
ay)
0.00
0.05
0.10
0.15
0.20
0.25
0.30
0.35
0.40
0.45
0.50
Recycle Fines
Effluent Fines
PO4-P Removal as Struvite
Figure 21 - Urine Removal of PO4-P as Struvite Compared to Recycle and Effluent Imhoff
Fines

45
Fines measurements from the Imhoff cones can also be seen in Figure 20 and Figure 21 for urine
and centrate, respectively. Regardless, when compared to the urine PO43-
-P removal rates, the
standard deviation is much more drastic as can be seen in Figure 22 in both the loading and
removal rates and in fines (Figure 22, Figure 23). With the exception of one data point causing a
higher standard deviation, fines measurements using urine as a feed source were much lower in
general. This further proves using urine as a feed source provides more stable operations when
compared to using centrate. Dependent variables of struvite precipitation from urine include the
complexity of the solution and pH stability in which case more is better leading to beneficial
precipitation of struvite from urine at a controlled rate. Independent variables include the pH,
Mg:P dosing, and turbulence within the reactor.
Centrate Urine
PO
4-P
as S
tru
vite
(kg
/da
y)
0.0
0.1
0.2
0.3
0.4
0.5
PO4-P Removal
PO4-P Loading
Figure 22 - Comparison of PO4-P Loading and Removal Rates

46
Centrate Urine
Imh
off F
ine
s (
mL
/L)
0
2
4
6
8
10
12
14Recycle Fines
Effluent Fines
Figure 23 - Comparison of Fines Production between Feed Sources
Due to the high ionic strength of urine specifically the concentrations of Na+ and HCO
3-, there
was a concern of overall removal inhibition of PO43-
- P when compared to centrate as a feed
source. The increased induction time produced by the presence of major ions combined with
plug flow hydraulics of the reactor caused an overall decrease in removal. Figure 24 shows that
when comparing effluent magnesium concentrations to the percentage of PO43-
- P removal in
both centrate and urine, they behave similarly with few outliers. The data in Figure 24 includes
all 50 days using urine as a feed solution show a more robust data trend with respect to removal.
The form in which removal occurs as seen in Figure 19 seems to be the most important
difference between the two feed sources, which as stated earlier is most likely due to pH stability
and the presence of the major ions.

47
Effluent Mg (mg/L)
0 100 200 300
PO
4-P
Rem
ova
l (%
)
30
40
50
60
70
80
90
100
Centrate
Urine
Figure 24 - % PO4
3--P Removal v. Effluent Magnesium Concentrations
3.3.2.2. Long Term Operation
Long term operation (greater than 30 days) using urine as feed source yielded similar results to
short term operation using centrate as feed source. Struvite production in prill form was
consistent (Figure 25) with recycle fines remaining low (Figure 26). Due to intermittent scaling
at the injection ports causing magnesium feed loss, some sampling showed less theoretical
removal in the effluent (Figure 26) but it was not reflected in the harvest mass. Long term
operation did remove more PO43-
-P and experience more fines loss with respect to PO43-
-P
removal when compared to the short term urine run (Figure 27). This is could be attributed to
multiple factors; rising pH in a feed tank that was almost empty allowing for CO2 to off gas more
rapidly due to increased mixing or blockages in the harvest zone induced by larger prills causing
loss of fluidization in the bed reducing crystal growth and creating fines. These issues occurred
randomly during operation, but the reactor recovered rapidly and returned to steady state without
requiring flushing to remove fines or reseeding. Reactor recovery can be observed in Figure 25
and Figure 26. Continued struvite production as prills and the decrease of fines in the recycle
after an increase show the reactors ability to return to steady state after incident. Overall it can be
concluded that source-separated urine is a feasible feed source for long term operation of struvite
recovery using UFBR.

48
Days
5 10 15 20 25 30
Str
uvi
te P
roduction (
kg/d
ay
0
2
4
6
8
Target
Theoretical
Yield
Figure 25 - Cumulative PO4-P Behavior during Long Term Operation using Urine as a
Feed Source
Days
0 5 10 15 20 25 30
Imhoff
Fin
es (
mL/L
)
0
5
10
15
20
25
30
PO
4-P
Rem
ova
l as S
truvi
te (
kg/d
ay)
0.00
0.05
0.10
0.15
0.20
0.25
0.30
0.35
0.40
0.45
0.50
Recycle Fines
Effluent Fines
PO4-P Removal as Struvite
Figure 26 - Urine Removal of PO4-P as Struvite Compared to Recycle and Effluent Imhoff
Fines During Long Term Operation

49
Figure 27 - Comparison of PO4
3- -P as struvite behavior during long term operation using
urine as a feed source
3.3.3. Urine-Derived Struvite Prills Quality
Full scale centrate-derived struvite created in UFBRs are white compact round struvite product
seen in Figure 28. This was also the product that was used as seed material in the reactor during
startup of the reactor. Due to hydraulic flow conditons in the small scale reactors, the prills
created are not compact. Instead a round product that is slightly brittle and porous was obtained
(Figure 29, Figure 30). Centrate-derived struvite from the pilot reactor was fragmented and
inconsistent in structure, taking on a fuzzy look with a yellowish color as seen in Figure 29. In
contrast, urine-derived struvite has a tan-brown color caused by the darkened color of the feed
solution. The structure of the urine-derived struvite is similar to centrate-derived struvite but
takes on a cleaner look. There appears to be less particulate struvite and more crystal growth
occurring during precipitation of urine derived struvite. Growth from sustained time in the
metastable zone by controlling setpoints, mainly pH, caused the urine-derived struvite to be more
uniform and less likely to have fragmented precipitates.
Urine-derived struvite created in the reactor grew in a range of sizes from 1-4 millimeters
(Figure 30, Figure 31, Figure 32). Soon after startup of a run with the reactor seeded with urine-
derived struvite, prill growth occurred rapidly reaching the size seen in Figure 31. This is due to
the solid retention time of struvite in the reactor, as the seeded struvite then spends roughly
double the amount of time new material does in the reactor before harvesting. After harvesting
out all of the seed material, struvite prills fluctuated in size between 1-4 millimeters as depicted
in Figure 30 and Figure 32. The size difference depended on operation of the reactor and
55.8%±3
5.0 18.9%±3
2.6
25.3%±1
4.0

50
harvesting characteristics such as time between harvest and volume of harvest. Analysis of the
struvite using a Size Guide Number sieves, an agricultural fertilizer standard, was not conducted
due to the brittle nature of the product. Urine-derived struvite prills from the pilot reactor did not
achieve the same quality of the centrate-derived seed material. This is most likely due to scale
and hydraulics within the reactor decreasing the overall growth period of prills. Steady-state
operations allowed for consistent prill creation with more growth occurring during crystal growth
during urine-derived struvite precipitation rather than spontaneous precipitation and
accumulation as mostly likely caused the fuzzy appearance with centrate-derived struvite.
Figure 28 - Full-Scale Centrate-Derived Struvite

51
Figure 29 - Centrate-Derived Struvite (Harvested: 03/02/2016)
Figure 30 - Urine- Derived Struvite (Harvested: 04/16/2016)

52
Figure 31 - Urine-Derived Struvite (Harvested: 05/31/2016)
Figure 32 - Urine- Derived Struvite (Harvested: 05/19/2016)

53
Examination of centrate-derived struvite (Figure 33) and urine-derived struvite (Figure 34) from
the reactor under a compound microscope revealed an orthombic crystal structure for both
samples. The urine-derived sample provided a more distinct uniform shape with little particulate
precipitates appearing on the slide. Most likely the non-uniformly shaped precipitates seen
Figure 33 are particulate struvite that agglomerated to the struvite prills formed in the reactor, but
did not enmesh with the crystal structure through crystal growth. Urine-derived struvite
precipitated from the reactor had minimal formation of particulate struvite most likely due to the
controlled growth that occurred. Lack of particulate phosphate accumulating to urine derived
struvite may also because by the complexity of the urine solution.
Figure 33 - Centrate Derived Struvite from Pearl 0.5 at 100x (Harvested 03/30/2016)

54
Figure 34 - Urine-Derived Struvite from Pearl 0.5 at 100x (Harvested:04/28/2016)
3.3.4. Composition of Urine-Derived Struvite
3.3.4.1. Analysis for Metals
Although the risk for metals is low in urine-derived struvite because of the low presence of
metals in urine, analysis of urine-derived struvite was conducted for metals as part of QA/QC
analysis used in full-scale struvite recovery operations. These tests were conducted in accordance
with biosolids management requirements as part of 40 CFR Part 503 limits. Table 10 shows the
results from sampling conducted on full-scale produced centrate-derived product currently on the
market, struvite produced in the reactor, and land application limits for exceptional quality (EQ)
and pollutant concentrations (PC) biosolids. If urine-derived struvite was eventually used as
fertilizer, it would have to comply with these limits. Results show very little metals in the urine-
derived struvite (Table 10) and concentrations appear similar to those found in full-scale centrate
derived struvite.
Not all metals analyzed for were regulated for biosolids, but analysis allowed for assessment of
purity with respect to other precipitates, for example hydroxyapatite or K-struvite.
Concentrations of calcium, zinc and sodium appear in significantly higher concentrations of
urine-derived struvite, but these values were still well below regulated values (if they apply).

55
Urine-derived struvite had lower concentrations of iron, most likely due to the higher
concentrations of iron found in centrate due to its use as a phosphorus binding agent and lower
concentrations of potassium due to the higher concentrations of ammonia dominating struvite
speciation and not allowing K-struvite to precipitate. Overall metal concentrations in urine-
derived struvite were well below regulated values for phosphorus fertilizer application from
biosolids.
Table 10- Metals Content of Full-Scale Centrate-Derived Struvite and Urine-Derived
Struvite Compared to Part 503 Regulations(EPA)
Metal Units
Full-Scale
Centrate-Sourced
Struvite
Urine-
Sourced
Struvite
Part 503 Pollutant
Concentration Limits for
EQ and PC Biosolids
Arsenic
mg/kg
Struvite
0.19 0.19 56
Cadmium 0.07 0.14 88
Cobalt 0.230 0.105 665
Lead 0.160 0.16 560
Mercury 0.004 0.005 20
Molybdenum 0.21 0.21 88
Nickel 0.18 0.18 799
Selenium 0.62 0.8 62
Zinc 0.87 10.6 8208
Aluminum 8.6 10.0 -
Calcium 186 498 -
Copper 0.25 16 -
Iron 1042 75 -
Potassium 1565 756 -
Manganese 32 7.8 -
Sodium 398 642 -
Barium 0.44 0.27 -
Chromium 0.24 0.52 -
Silver 0.06 0.06 -
3.3.4.2. Struvite Purity
Nutrient analysis (Table 11) was conducted on the three components of struvite; magnesium,
ammonia, and phosphorus as phosphorus pentoxide. Phosphorus pentoxide is used as a measure
in the agricultural industry to quantify the phosphorus content in fertilizer. The nutrient content
of pure struvite is also included in the table to be used as a comparison. Only two samples were
sent for analysis and instead of using standard deviation to quantify statistical difference, percent
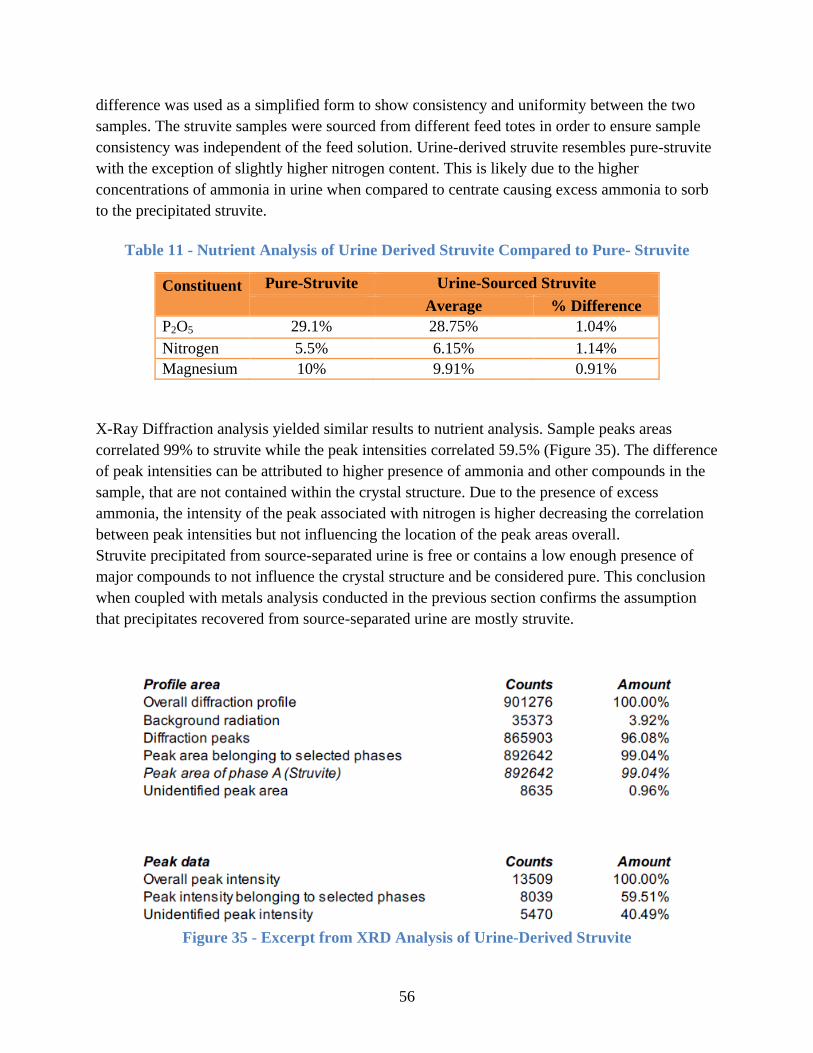
56
difference was used as a simplified form to show consistency and uniformity between the two
samples. The struvite samples were sourced from different feed totes in order to ensure sample
consistency was independent of the feed solution. Urine-derived struvite resembles pure-struvite
with the exception of slightly higher nitrogen content. This is likely due to the higher
concentrations of ammonia in urine when compared to centrate causing excess ammonia to sorb
to the precipitated struvite.
Table 11 - Nutrient Analysis of Urine Derived Struvite Compared to Pure- Struvite
Constituent
Pure-Struvite Urine-Sourced Struvite
Average % Difference
P2O5 29.1% 28.75% 1.04%
Nitrogen 5.5% 6.15% 1.14%
Magnesium 10% 9.91% 0.91%
X-Ray Diffraction analysis yielded similar results to nutrient analysis. Sample peaks areas
correlated 99% to struvite while the peak intensities correlated 59.5% (Figure 35). The difference
of peak intensities can be attributed to higher presence of ammonia and other compounds in the
sample, that are not contained within the crystal structure. Due to the presence of excess
ammonia, the intensity of the peak associated with nitrogen is higher decreasing the correlation
between peak intensities but not influencing the location of the peak areas overall.
Struvite precipitated from source-separated urine is free or contains a low enough presence of
major compounds to not influence the crystal structure and be considered pure. This conclusion
when coupled with metals analysis conducted in the previous section confirms the assumption
that precipitates recovered from source-separated urine are mostly struvite.
Figure 35 - Excerpt from XRD Analysis of Urine-Derived Struvite

57
Figure 36 - X-Ray Diffraction Plot of Urine Derived Struvite compared to Struvite peaks
from PDF.
3.3.4.3. Pharmaceuticals & Pathogen Inclusion
Aged source-separated urine collected from the main office building was found to contain
pharmaceuticals as presented in Table 12. It is unknown if aging the urine had any influence of
the pharmaceutical content of the urine though it is highly unlikely. Concentrations of over the
counter drugs like ibuprofen, caffeine, acetaminophen, and naproxen showed up in higher
concentrations than others. The relatively high standard deviation of pharmaceutical
concentrations was not unexpected because of the variations between individuals of
pharmaceutical intake. Pharmaceuticals that are less commonly taken by individuals but are
resistant to degradation by the body such as sulfamethoxazole, an antibiotic, were also found in
higher concentrations. Concentrations of sulfamethoxazole appeared higher in the effluent and it
is unknown why this may have occurred. One hypothesis is due to the possible formation of
magnesium chelation complexes, though more likely it was present in fines that may have ended
up in the effluent.

58
Table 12 - Pharmaceutical Presence in Urine Feed, Effluent, & Precipitated Struvite
Pharmaceutical
Feed Effluent Struvite
Avg. StDev. Avg. StDev. Avg. StDev.
ug/L ug/L ug/L ug/L ug/g ug/g
Acetaminophen 16.9 8.4 9.1 9.2 0.02 0.006
Caffeine 1721 1440 816 21.5 0.10 0.07
Ciprofloxacin ND ND ND ND ND ND
Trimethoprim ND ND ND ND ND ND
Acetyl-
Sulfamethoxazole
ND ND ND ND ND ND
Sulfamethoxazole 4163 2806 7377 1848 1.78 1.55
Erythromycin ND ND ND ND ND ND
Carbamazepine ND ND ND ND ND ND
Dilantin ND ND ND ND 0.004 0.004
Naproxen 478 94 484 135 2.77 1.3
Diclofenac ND ND ND ND ND ND
Ibuprofen 2149 2205 1026 182 0.88 0.46
Struvite recovered from source-separated urine was shown to contain pharmaceuticals, although
the pharmaceuticals are present in far less concentrations than in feed urine (Table 12). The
exception to this is Dilantin, which is not detected in the urine, but is found in precipitated
struvite, lending to the belief that Dilantin may be favorably included in struvite. The percent of
pharmaceuticals (Table 13) accumulating in harvested struvite relative to the pharmaceutical
mass present in the volume of fed urine indicate pharmaceuticals are not preferentially included
in struvite and may have been present because of the porous of the prills. If urine-derived struvite
was created in a full-scale reactor, it is expected to decrease the content of pharmaceuticals due
to the lack of surface area for accumulation of pharmaceuticals from the compact nature of full-
scale produced struvite. Overall a very small amount of pharmaceuticals, often less than 1%, end
up in precipitated struvite from a fluidized bed reactor using urine as a feed source. Investigation
of accumulation with respect to the pharmaceuticals that were not detected in urine still needs to
be conducted.
Table 13 - Percent Mass Inclusion of Pharmaceuticals in Struvite
Pharmaceutical
% Mass Inclusion of
Pharmaceuticals
(ug/ug)
Acetaminophen 0.22%
Caffeine 0.01%
Ciprofloxacin N/A

59
Trimethoprim N/A
Acetyl-
Sulfamethoxazole
N/A
Sulfamethoxazole 0.08%
Erythryomycin N/A
Carbamazepine N/A
Dilantin N/A
Naproxen 1.11%
Diclofenac N/A
Ibuprofen 0.08%
Pathogen indicators for bacteriophage (T3 and MS2) in source-separated urine were non-detect
for all samples. The urine that was collected may not have been exposed to pathogens during or
after collection explaining the lack of pathogen indicators but it is more likely that any pathogens
that may have been present during urine collection became inactivated over the storage period.
Urine-derived struvite was also non-detect for salmonella and fecal coliform.
3.3.5. Micropollutant Spike Test
Addition of pharmaceuticals yielded no noticeable difference from the pharmaceutical content of
non-spiked urine totes with respect to caffeine and ibuprofen (Table 14). It is unknown why the
caffeine and ibuprofen concentrations were lower than the amount spiked. One theory is the
insolubility caused by the ionic strength of urine precipitated the pharmaceuticals. Effluent
concentrations of caffeine and acetaminophen both appeared in higher concentrations than the
feed, which perhaps is caused by some accumulation of pharmaceuticals in the reactor itself, but
not allowing for inclusion with in the struvite. Struvite samples recovered from source separated
urine during the spike test also showed pharmaceutical content in similar concentrations to those
found in the non-spike test. The percent of pharmaceutical inclusion in struvite (Table 15) for the
spike test relative to the mass of pharmaceuticals in urine fed to the reactor are similar to what
was found in the non-spike test. Accumulation of over the counter medicine such as naproxen
and ibuprofen in the struvite mostly likely tied to the large amount of concentration in feed
solution and the porous nature of the struvite. Acetaminophen probably shows a higher up take
rate due to the low concentration found in the feed solution skewing the uptake rate. Before
repeating this test, it is probably best to determine the cause for lack of spiked pharmaceuticals
appearing in the feed data, if it is related to solubility dynamics with urine or experimental error.

60
Table 14 - Pharmaceutical Results for Spike Tote
Pharmaceutical Feed Effluent Struvite
ug/L ug/L ug/g
Acetaminophen 21.1 2406 0.04
Caffeine 806 3226 0.15
Ciprofloxacin ND ND ND
Trimethoprim ND ND ND
Acetyl-
Sulfamethoxazole
ND ND ND
Sulfamethoxazole 6483 1626 1.63
Erythromycin ND ND ND
Carbamazepine ND ND ND
Dilantin ND 6.2 0.004
Naproxen 555 232 5.16
Diclofenac ND ND ND
Ibuprofen 920 464 4.59
Table 15 - Percent Mass Inclusion of Pharmaceuticals in Struvite for Spike Test
Pharmaceutical % Mass Inclusion
(ug/ug)
Acetaminophen 0.43%
Caffeine 0.04%
Ciprofloxacin N/A
Trimethoprim N/A
Acetyl-
Sulfamethoxazole
N/A
Sulfamethoxazole 0.06%
Erythryomycin N/A
Carbamazepine N/A
Dilantin N/A
Naproxen 2.05%
Diclofenac N/A
Ibuprofen 1.10%
Pathogen bacteriophage indicators spiked in aged-source separated urine showed a concentration
of 2.4*10^6 pfu/mL of T3 and 2.3* 10^6 pfu/mL of MS2. Rinse water from removing excess

61
magnesium and maximizing pathogen removal had 5*10^3 pfu/mL of T3 and 6.2*10^3 pfu/mL,
indicating some presence of pathogens on the struvite. Rinsing of struvite may allow for removal
of pathogen loosely present on the struvite. Sterilization of pathogens, if any are present, can be
conducted in a similar manner used in full-scale applications through heat application.
3.4. Impact of Struvite Recovery on Source-Separated Urine
Source-separated urine can undergo some changes during struvite precipitation, most likely
removal of PO43-
-P, NH3-N, Mg, and consumption of alkalinity during precipitation. Effluent
sampling (Table 16) revealed an overall removal of 200 mg/L of PO43-
-P and the standard
deviation is relatively high and can be attributed to variations among feed totes and reactor
operation. A large amount of alkalinity was consumed relative to the amount that should have
been removed through struvite formation due to the acid addition in order to lower the pH to
control precipitation kinetics. Larger amounts of magnesium in the effluent are due to the dosing
to induce struvite precipitation and can also explain the higher conductivity in solution.
Potassium and sodium could be removed through inclusion into the struvite, increasing the
salinity of struvite and possibly introducing potassium for use as a beneficial fertilizer, instead
concentrations were higher in the effluent.
Table 16 - Influence of Struvite Precipitation on Urine Constituents
Feed Effluent Difference
Units Avg. StDev. Avg. StDev. Avg. StDev.
TP (mg P/L)
254 26 71 46 178 65
PO43-
-P 247 17 44 52 197 59
TKN (mg N/L)
4705 1062 4751 209 -174.2 941
NH3-N 4778 297 4691 575 27.14 624
Conductivity (us/cm) 38780 1536 54914 1664 -17050 3055
Alkalinity (mg CaCO3/L) 16662 1214 7862 1961 8751 1967
COD (mg/L) 5444 374 4934 993 1001 510
Ca2+
(mg/L)
3.3 3.4 8.7 3.6 1.1 9.1
Mg2+
10.8 7.7 40.5 28.3 -37.1 28.4
K+ 859 675 1195 463 -426 982
Na+ 1134 905 1522 583 -517 1291
Al3+
1.1 1.0 0.7 0.4 0.07 1.3
Fe2+
1.5 1.3 0.7 0.2 0.75 1.3
Source separated urine does not undergo many chemical changes due to struvite recovery and
requires additional treatment. Further treatment of urine including nitrogen removal possibly by

62
recovery, micropollutant removal and decreasing the relative content of ions is necessary before
disposal. Superseding struvite recovery with nitrogen recovery could shift the preferential
precipitation from struvite to K-struvite (KMgPO4-6H2O). This could guarantee recovery for 3
essential fertilizers (nitrogen, phosphorus and potassium) instead of 2 (phosphorus and a small
amount of nitrogen), but may change the required pH and magnesium dosage due to K-struvite
having a higher solubility product.

63
3.5. Conclusions
The purpose of this project was to assess feasibility of struvite recovery from source-separated
urine using an upflow fluidized bed reactor technology. Urine-derived struvite was successfully
recovered in prill form. Over 50 days of loading the reactor a total of 7.54 kilograms of urine-
derived struvite prills were harvested from the reactor. The reactor had a recovery efficiency of
approximately 60% with about 15% fines loss occurring. The 25% PO43-
-P that remained in
urine solution was a combination of delayed precipitation kinetics caused by the presence of
major ions and limitations of struvite precipitation from lower pH and Mg:P dosing in order to
control struvite precipitation as crystal growth. Precipitation kinetics of struvite is highly
dependent on multiple variables including pH, magnesium and upflow velocity. During each
instance where reactor setpoints skewed from the target a struvite recovery as prills diminished.
For example, at high pHs and overdosing magnesium, struvite precipitation did not occur as
crystal growth on prills but as fines. Too low of a pH or underdosing magnesium prevented
struvite precipitation and resulted in low OP removal form the urine.
Urine-fed reactor characteristics were similar to centrate-fed reactor characteristics, but
proportionally more struvite recovery and fines loss occurred during centrate-feeding. Long term
operation of the reactor proved capable of creating new seed material by primary nucleation and
ensuring crystal growth of the prills by secondary nucleation rather than struvite precipitation by
fines loss. This indicated long term operation of urine-derived struvite is possible and diminished
concerns associated prill formation and growth inhibition by the presence of other major ions.
When comparing operation of the reactor using urine as a feed solution to centrate operation
struvite crystallization occurred in a more controlled manner. This is with respect to fines loss,
pH stability and crystal structure.
Prill formation with respect to size distribution was similar between urine and centrate derived
struvite. Prill size is dependent on retention time in the reactor and precipitation kinetics. Full-
scale reactors create a denser prill product compared to the brittle struvite prills created in the
pilot reactor, but this is most likely due to reactor hydraulics being drastically different when
compared to the pilot scale reactors, mainly the mixing capabilities in the active and harvest
zones. In the full scale reactor fluidization characteristics behave similar to a CSTR, while in the
pilot reactor it behaves more like a plug-flow reactor. Urine-derived struvite had a distinct
orthombic structure with crystal morphology that was visible to the naked eye while centrate-
derived struvite lacked a clear pattern to the naked eye with fuzzy characteristics were due to the
uncontrolled characteristics under which struvite precipitated cause by pH. Urine-derived
struvite most likely precipitated in a controlled manner due to both competing ions increasing
growth time of precipitate and pH stability.
Pharmaceuticals were present in varying concentrations in urine, with the spike test having little
influence on the concentrations of ibuprofen and urine. The most common over the counter drugs

64
were present in higher concentrations such as caffeine, ibuprofen and acetaminophen.
Sulfamethoxazole, an antibiotic, was also present in high concentrations in urine. Inclusion of
detected pharmaceuticals by mass in feed urine to struvite occurred at less than 1% on average.
Dilantin, an anticonvulsant, was not present in feed urine but was found in urine-derived struvite
showing preferential inclusion to struvite. Less common pharmaceuticals, such as ciprofloxacin
or carbamazepine, were not present in source separated-urine and could not be assessed for
inclusion characteristics.
Urine’s rapid chemical changes after exiting the body most likely aided in the inactivation of
pathogens that may have been present, explaining the non-detection of pathogen indicators after
aging of urine. The presence of pathogen indicators on the rinse water of urine-derived struvite
from the spike test indicates pathogen inclusion. Due to the porous nature of the urine-derived
presence may not be contained tightly within the struvite and removal may be aided by adequate
rinsing. Urine can also be sanitized through heat application to inactivate pathogens before or
after recovery of struvite, alleviating concerns.
In conclusion, recovery of high quality urine-derived struvite containing very little
pharmaceuticals, pathogens or metals using an upflow fluidized bed reactor is feasible. As
multiple factors influence struvite precipitation kinetics, setpoints on the reactor must be
controlled to allow for struvite precipitation through secondary nucleation in order to create a
marketable product for sale. Urine or urine-derived fertilizers are currently not regulated or
controlled due to lack of research. Urine-derived struvite precipitated from upflow fluidized bed
reactor should be applied in field-scale testing to assess its influence on plant growth and
possible inclusion.

65
4. Engineering Significance
Full-scale urine diversion could decrease loading to wastewater plants that could potentially
result in an increased treatment capacity and cost savings associated with treatment while
simultaneously decreasing water usage. This could benefit wastewater treatment plants by easing
stress and cost associated with meeting increasing effluent limits. Also as urine contains most of
the pharmaceuticals excreted by the body, it could provide a means for pretreating
pharmaceuticals in a more concentrated way due of the possibility of impending effluent
pharmaceutical limits. This is similar to the cost effectiveness of treating concentrated nitrogen
and phosphorus before it undergoes dilution from flush or graywater (i.e. struvite recovery).
Infrastructure and technology limitations along public acceptance do not make urine-diversion
feasible in the near future, but in the short term urine diversion could be feasible on a smaller
scale utilizing newly constructed apartment building and pilot scale, low maintenance treatment
units.
Recovery of struvite on a large scale from source-separated urine could provide a sustainable
source of slow release phosphorus based fertilizer. This slow-release fertilizer already applied to
agriculture and sourced from the anaerobically digested dewatering liquor of wastewater
treatment plants closing the loop slightly. The loop could be tightened even more if struvite was
source directly from urine, reducing treatment and energy costs of recovering phosphorus
through an entire WWTP. Another benefit of utilizing struvite as a fertilizer other than closing
the loop on an open system is the lower solubility. Struvite solubilizes slowly compared to other
agricultural fertilizers, decreasing runoff and the frequency in which the fertilizer must be
applied, a benefit to polluted ecosystems and farmers.
Creating urine-derived struvite from fluidized bed reactor on a larger scale is limited by urine-
diversion capabilities. Small scale application can be conducted but would still require large
amounts of urine in order to operate continuously. Urine is an ideal feed source for struvite
precipitation with regards to its relative pH, high alkalinity, ammonia and phosphorus
concentrations, and possibly the presence of major ions. A large volume of acid would be needed
to lower and maintain the pH within the required range and urine would need to undergo urea
hydrolysis to remove excess precipitates that may diminish prill quality or growth.
Another issue with large scale urine-diversion and recovery of nutrients for agricultural
application is the “yuck” factor associated with human waste. A similar issue is being faced in
the direct-reuse community; how to explain that the products we are creating although at one
point contained human waste, no longer resembles it?
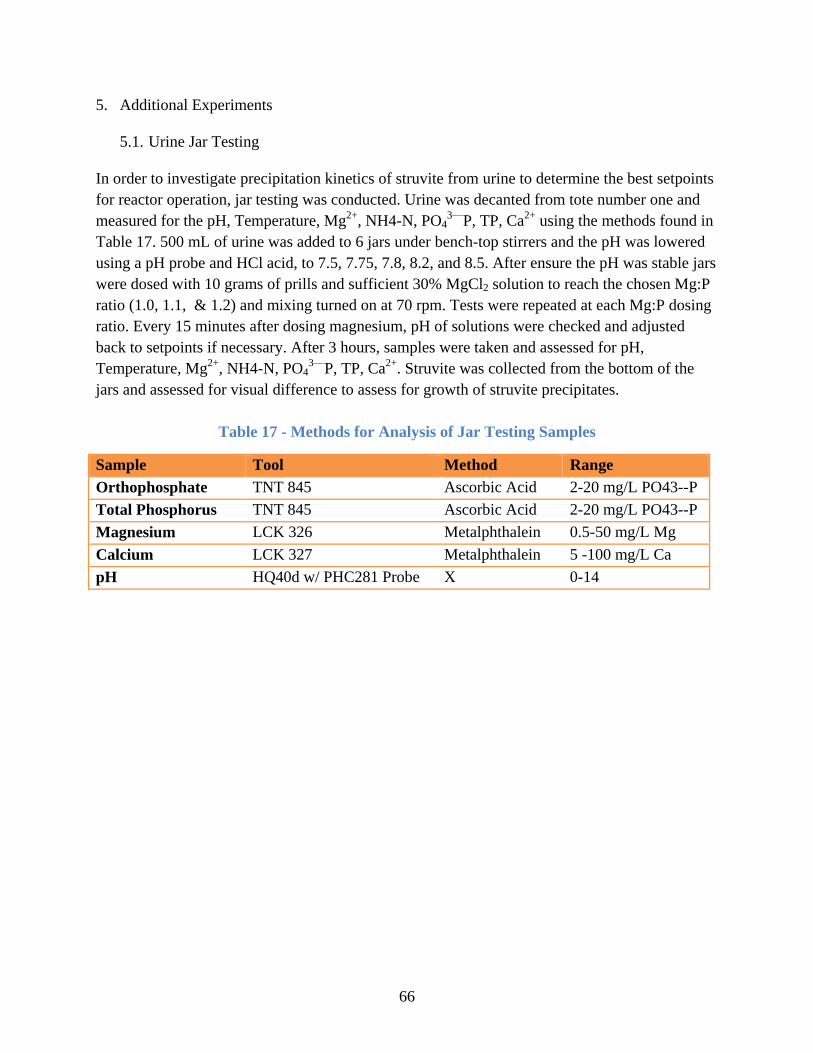
66
5. Additional Experiments
5.1. Urine Jar Testing
In order to investigate precipitation kinetics of struvite from urine to determine the best setpoints
for reactor operation, jar testing was conducted. Urine was decanted from tote number one and
measured for the pH, Temperature, Mg2+
, NH4-N, PO43—
P, TP, Ca2+
using the methods found in
Table 17. 500 mL of urine was added to 6 jars under bench-top stirrers and the pH was lowered
using a pH probe and HCl acid, to 7.5, 7.75, 7.8, 8.2, and 8.5. After ensure the pH was stable jars
were dosed with 10 grams of prills and sufficient 30% MgCl2 solution to reach the chosen Mg:P
ratio (1.0, 1.1, & 1.2) and mixing turned on at 70 rpm. Tests were repeated at each Mg:P dosing
ratio. Every 15 minutes after dosing magnesium, pH of solutions were checked and adjusted
back to setpoints if necessary. After 3 hours, samples were taken and assessed for pH,
Temperature, Mg2+
, NH4-N, PO43—
P, TP, Ca2+
. Struvite was collected from the bottom of the
jars and assessed for visual difference to assess for growth of struvite precipitates.
Table 17 - Methods for Analysis of Jar Testing Samples
Sample Tool Method Range
Orthophosphate TNT 845 Ascorbic Acid 2-20 mg/L PO43--P
Total Phosphorus TNT 845 Ascorbic Acid 2-20 mg/L PO43--P
Magnesium LCK 326 Metalphthalein 0.5-50 mg/L Mg
Calcium LCK 327 Metalphthalein 5 -100 mg/L Ca
pH HQ40d w/ PHC281 Probe X 0-14

67
Figure 37 - Influence of pH on PO4-P Removal from Urine
Overall there is very little difference of PO43-P removal between the Mg:P and pH controlling,
most likely due to the duration of the test. After some examination results from the sample
indicate that pH has a stronger influence on PO43- -P removal. Higher pHs remove more PO43-
-P, but as seen in Figure 38 the slight color difference indicates struvite agglomeration to the
seed mass versus spontaneous precipitation. The control pH, which was at 9, did not undergo any
noticeable color changes, and as the pH decreased the struvite took on a more brown hue, most
likely from struvite precipitation. These results in combination with shakeout testing created the
setpoints for the reactors while feeding urine.
80%
81%
82%
83%
84%
85%
86%
87%
88%
89%
90%
7.6 7.8 8 8.2 8.4 8.6 8.8
PO
4-P
Rem
oval
(%)
pH
Mg:P Dosage 1.0
Mg:P Dosage 1.1
Mg:P Dosage 1.2

68
Figure 38 - Struvite from Jar Testing (Mg:P Dosing 1:1)

69
6. References
(2006) Introduction to Clean Water Act, US EPA.
(2016) Ostara Nutrient Recovery Technologies Inc.
Aage, H.K., Andersen, B.L., Blom, A. and Jensen, I. (1997) The solubility of struvite. Journal of
Radioanalytical and Nuclear Chemistry 223(1-2), 213-213.
Abbona, F. and Boistelle, R. (1979) Growth morphology and crystal habit of struvite crystals
(MgNH4PO4.6H2O). Journal of Crystal Growth 46(3), 339-354.
Abbona, F. and Boistelle, R. (1985) Nucleation of struvite (MgNH4PO4.6H2O) single crystals.
Crystal Research and Technology 20(2), 133-140.
Adnan, A., Koch, F.A. and Mavinic, D.S. (2003) Pilot-scale study of phosphorus recovery
through struvite crystallization - II: Applying in-reactor supersaturation ratio as a process control
parameter. Journal of Environmental Engineering and Science 2(6), 473-483.
Babic-Ivancic, V., Kontrec, J., Brecevic, L. and Kralj, D. (2006) Kinetics of struvite to
newberyite transformation in the precipitation system MgCl2-NH4H2PO4-NaOH-H2O. Water
Research 40(18), 3447-3455.
Bhuiyan, M.I.H., Mavinic, D.S. and Beckie, R.D. (2008a) Nucleation and growth kinetics of
struvite in a fluidized bed reactor. Journal of Crystal Growth 310(6), 1187-1194.
Bhuiyan, M.I.H., Mavinic, D.S. and Koch, F.A. (2008b) Phosphorus recovery from wastewater
through struvite formation in fluidized bed reactors: a sustainable approach. Water Science &
Technology 57(2), 175-181.
Blume, S. and Winker, M. (2011) Three years of operation of the urine diversion system at GTZ
headquarters in Germany: user opinions and maintenance challenges. Water Science and
Technology 64(3), 579-586.
Borgerding, J. (1972) PHOSPHATE DEPOSITS IN DIGESTION SYSTEMS. Journal of the
Water Pollution Control Federation 44(5), 813-819.
Bouropoulos, N.C. and Koutsoukos, P.G. (2000) Spontaneous precipitation of struvite from
aqueous solutions. Journal of Crystal Growth 213(3-4), 381-388.
Britton, A., Koch, F.A., Mavinic, D.S., Adnan, A., Oldham, W.K. and Udala, B. (2005) Pilot-
scale struvite recovery from anaerobic digester supernatant at an enhanced biological phosphorus
removal wastewater treatment plant. Journal of Environmental Engineering and Science 4(4),
265-277.
Brunzel, N.A. (2004) Fundamentals of Urine & Body Fluid Analysis, Saunders, Philadelphia,
PA.

70
Buchanan, J.R., Mote, C.R. and Robinson, R.B. (1994) Thermodynamics of struvite formation.
Transactions of the ASAE 37(2), 617-621.
Capuco, C.W. (2014) WATER ENVIRONMENT RESEARCH FOUNDATION GRANTS
SUBAWARD TO EXPLORE NUTRIENT RECOVERY
THROUGH URINE SEPARATION.
Davis, J. (2010) Pissing Match: Is the World Ready for the Waterless Urinal?
Decrey, L., Kazama, S. and Kohn, T. (2016) Ammonia as an in-situ sanitizer: influence of virus
genome type on inactivation. Appl Environ Microbiol.
Decrey, L., Kazama, S., Udert, K.M. and Kohn, T. (2015) Ammonia as an in situ sanitizer:
inactivation kinetics and mechanisms of the ssRNA virus MS2 by NH3. Environmental Science
& Technology 49(2), 1060-1067.
Decrey, L., Udert, K.M., Tilley, E., Pecson, B.M. and Kohn, T. (2011) Fate of the pathogen
indicators phage PhiX174 and Ascaris suum eggs during the production of struvite fertilizer from
source-separated urine. Water Research 45(16), 4960-4972.
Doyle, J.D. and Parsons, S.A. (2002) Struvite formation, control and recovery. Water Research
36(16), 3925-3940.
EcoVita (2015) EcoDry and EcoFlush Urine-Diverting Toilets.
Ek, M., Bergstrom, R., Bjurhem, J.E., Bjorlenius, B. and Hellstrom, D. (2006) Concentration of
nutrients from urine and reject water from anaerobically digested sludge. Water Science and
Technology 54(11-12), 437-444.
EPA Biosolids Management Handbook.
EPA (2016) WaterSense Labeled Toilets Environmental Protection Agency.
Europa, N. (2015) Eco-Trap Cartridge.
Fewless, K.L., Sharvelle, S. and Roesner, L.A. (2011) Source Separation and Treatment of
Anthropogenic Urine, WERF, WERF.
Ganrot, Z., Dave, G. and Nilsson, E. (2007) Recovery of N and P from human urine by freezing,
struvite precipitation and adsorption to zeolite and active carbon. Bioresour Technol 98(16),
3112-3121.
Gentworks-Ltd. (2008) Waterless Urinals by Gentworks: About Waterless Urinals.
Hoglund, C., Stenstrom, T.A. and Ashbolt, N. (2002) Microbial risk assessment of source-
separated urine used in agriculture. Waste Manag Res 20(2), 150-161.
Industrial Economics, I.A.A. (2008) Waterless Urinals Report and Evaluation.

71
Jimenez, J., Bott, C., Love, N. and Bratby, J. (2015) Source Separation of Urine as an Alternative
Solution to Nutrient Management in Biological Nutrient Removal Treatment Plants. Water
Environ Res 87(12), 2120-2129.
Jones, A.G. (2002) Crystallization process systems, Butterworth-Heinemann, Oxford.
Jonsson, H., Stenstrom, T.A., Svensson, J. and Sundin, A. (1997) Source separated urine-nutrient
and heavy metal content, water saving and faecal contamination. Water Science and Technology
35(9), 145-152.
Kabdasli, I.P., S; Tunay, Olcay (2005) Effects of Major Ions on Induction Time of Struvite.
Croatica Chemica Acta 79(2), 243-251.
Kemacheevakul, P., Chuangchote, S., Otani, S., Matsuda, T. and Shimizu, Y. (2014) Phosphorus
recovery: minimization of amount of pharmaceuticals and improvement of purity in struvite
recovered from hydrolysed urine. Environmental Technology 35(21-24), 3011-3019.
Kemacheevakul, P., Chuangchote, S., Otani, S., Matsuda, T. and Shimizu, Y. (2015) Effect of
magnesium dose on amount of pharmaceuticals in struvite recovered from urine. Water Science
and Technology 72(7), 1102-1110.
Kemacheevakul, P., Otani, S., Matsuda, T. and Shimizu, Y. (2012) Occurrence of micro-organic
pollutants on phosphorus recovery from urine. Water Science and Technology 66(10), 2194-
2201.
Kofina, A.N. and Koutsoukos, P.G. (2005) The crystallization of struvite from municipal
wastewater: Investigation of crystal growth competition between different crystalline materials,
pp. 499-504, VDI Verlag GMBH.
Kuntke, P., Smiech, K.M., Bruning, H., Zeeman, G., Saakes, M., Sleutels, T.H., Hamelers, H.V.
and Buisman, C.J. (2012) Ammonium recovery and energy production from urine by a microbial
fuel cell. Water Research 46(8), 2627-2636.
Larsen, T.A. and Gujer, W. (1996) Separate management of anthropogenic nutrient solutions
(human urine), pp. 87-94, Pergamon Press Inc, Singapore, Singapore.
Larsen, T.A., Udert, K.M. and Lienert, J. (2013) Source separation and decentralization for
wastewater management.
Le Corre, K.S., Valsami-Jones, E., Hobbs, P., Jefferson, B. and Parsons, S.A. (2007)
Agglomeration of struvite crystals. Water Research 41(2), 419-425.
Le Corre, K.S., Valsami-Jones, E., Hobbs, P. and Parsons, S.A. (2009) Phosphorus Recovery
from Wastewater by Struvite Crystallization: A Review. Critical Reviews in Environmental
Science and Technology 39(6), 433-477.
Li, X.Z. and Zhao, Q.L. (2003) Recovery of ammonium-nitrogen from landfill leachate as a
multi-nutrient fertilizer. Ecological Engineering 20(2), 171-181.

72
Lienert, J., Burki, T. and Escher, B.I. (2007) Reducing micropollutants with source control:
substance flow analysis of 212 pharmaceuticals in faeces and urine. Water Science and
Technology 56(5), 87-96.
Lienert, J.L., T.A. (2007) Pilot Projects in Bathrooms: A new challenge for wastewater
professionals. Water Practice & Technology 2.
Liu, X., Wen, G., Wang, H., Zhu, X. and Hu, Z. (2014) Fate of phosphorus in diluted urine with
tap water. Chemosphere 113, 146-150.
Maurer, M., Pronk, W. and Larsen, T.A. (2006) Treatment processes for source-separated urine.
Water Research 40(17), 3151-3166.
Mavinic, D.S., Adnan, A. and Koch, F.A. (2003) Pilot-scale study of phosphorus recovery
through struvite crystallization – examining the process feasibility. Journal of Environmental
Engineering & Science 2(5), 315-324.
Ohlinger, K.N. and Mahmood, R.J. (2003) Struvite Scale Potential Determination Using a
Computer Model, pp. 323-331, American Society of Civil Engineers, Philadelphia, PA, United
states.
Ohlinger, K.N. and Young, T.M. (1999) Kinetics Effects of Preferential Struvite Accumulation
in Wastewater. Journal of Environmental Engineering 125(8), 730.
Ohlinger, K.N.Y., T.M.; Schroeder, E.D. (1998) Predicting stuvite formation in Digestion. Water
Research 32(12), 3607-3614.
Ostara Nutrient Recovery Technologies, I. (2010) Hampton Roads Sanitation District and Ostara
Win National Council of Public-Private Partnerships Award.
Ronteltap, M., Maurer, M. and Gujer, W. (2007a) The behaviour of pharmaceuticals and heavy
metals during struvite precipitation in urine. Water Research 41(9), 1859-1868.
Ronteltap, M., Maurer, M. and Gujer, W. (2007b) Struvite precipitation thermodynamics in
source-separated urine. Water Research 41(5), 977-984.
Ronteltap, M., Maurer, M., Hausherr, R. and Gujer, W. (2010) Struvite precipitation from urine -
Influencing factors on particle size. Water Research 44(6), 2038-2046.
Rosie's-Natural-Way (2015) Dubletten - Urine Diverting Toilet.
Rossi, L., Lienert, J. and Larsen, T.A. (2009) Real-life efficiency of urine source separation.
Journal of Environmental Management 90(5), 1909-1917.
Schurmann, B., Everding, W., Montag, D. and Pinnekamp, J. (2012) Fate of pharmaceuticals and
bacteria in stored urine during precipitation and drying of struvite. Water Science and
Technology 65(10), 1774-1780.

73
Steen, I. (1998) Phosphate Recovery - Phosphorus Availability in the 21st Century -
Management of a non-renewable resource. Phosphorus and Potassium (217), 6.
Strous, M., Kuenen, J.G. and Jetten, M.S. (1999) Key physiology of anaerobic ammonium
oxidation. Appl Environ Microbiol 65(7), 3248-3250.
Tilley, E., Atwater, J. and Mavinic, D. (2008a) Effects of storage on phosphorus recovery from
urine. Environmental Technolo*gy 29(7), 807-816.
Tilley, E., Atwater, J. and Mavinic, D. (2008b) Recovery of struvite from stored human urine.
Environmental Technology 29(7), 797-806.
Turel, I. (2002) The interactions of metal ions with quinolone antibacterial agents. Coordination
Chemistry Reviews 232(1/2), 27.
Udert, K.M., Fux, C., Munster, M., Larsen, T.A., Siegrist, H. and Gujer, W. (2003a) Nitrification
and autotrophic denitrification of source-separated urine. Water Science and Technology 48(1),
119-130.
Udert, K.M., Larsen, T.A., Biebow, M. and Gujer, W. (2003b) Urea hydrolysis and precipitation
dynamics in a urine-collecting system. Water Research 37(11), 2571-2582.
Udert, K.M., Larsen, T.A. and Gujer, W. (2006) Fate of major compounds in source-separated
urine. Water Science and Technology 54(11-12), 413-420.
Ueno, Y. and Fujii, M. (2001) Three years experience of operating and selling recovered struvite
from full-scale plant. Environmental Technology 22(11), 1373-1381.
Wafler, M.S., Dorothee (2014) Urine Diversion Flush Toilet. EAWAG (ed), Sustainable
Sanitation and Water Management.
Wieland, P.O., United States. National Aeronautics and Space Administration. and George C.
Marshall Space Flight Center. (1994) Designing for human presence in space : an introduction to
environmental control and life support systems, National Aeronautics and Space Administration,
Office of Management, Scientific and Technical Information Program, Washington, D.C.
Winker, M.S., Amel (2011) Urine and Brownwater Separation at GIZ Main Office Building,
Eschborn, Germany.
Wood, A., Blackhurst, M., Hawkins, T., Xue, X., Ashbolt, N. and Garland, J. (2015) Cost-
effectiveness of nitrogen mitigation by alternative household wastewater management
technologies. Journal of Environmental Management 150, 344-354.

74
7. Appendix
A. 1 Methods Used for Analysis of Tote Samples
Parameter CAS Reference Method
Ammonia-N 8013-59-0 Lachat 10-107-06-1-C
Total Phosphorus 7723-14-0 Lachat 10-115-01-1-E
TKN 7783-54-2 Lachat 10-107-06-2-I
Orthophosphate-P 98059-61-1 Lachat 10-115-01-1-A
Alkalinity 471-34-1 Lachat 10-303-31-1-A
COD - Hach 8000
Calcium, Total 7440-70-2 EPA 200.7, Rev. 4.4
Magnesium, Total 7439-95-2 EPA 200.7, Rev. 4.4
Potassium, Total 7440-09-7 EPA 200.7, Rev. 4.4
Sodium, Total 7440-23-5 EPA 200.7, Rev. 4.4
Iron, Total 7439-89-6 EPA 200.7, Rev. 4.4
Aluminum, Total 7429-90-5 EPA 200.7, Rev. 4.4
Feed Rate
In order to determine to target the specific feed rate for urine or centrate to the reactor the
following equation was used.
𝑄𝐹 =𝐿𝑅 ∗
𝑑𝑎𝑦24 ℎ𝑟
∗ℎ𝑟
𝑚𝑖𝑛
𝐶𝐹 ∗𝑚𝑜𝑙 𝑃
30.97 𝑔𝑚 𝑃∗
245.41 𝑔𝑚 𝑆∗
𝑚𝑜𝑙 𝑆∗𝑔
1000 𝑚𝑔∗
𝑘𝑔1000 𝑔
∗1000 𝑚𝐿
𝐿
*S is Struvite
Where:
𝑄𝐹 = Solution Feed Rate to the Reactor, mL/min
𝐶𝐹 =Concentration of Feed, mg PO43-
-P/L
𝐿𝑅 = Target Production Rate, kg Struvite/day

75
Magnesium Chloride Feed Rate
In order to determine the magnesium feed rate the following equations were used:
Target Magnesium Concentration:
𝐶𝑀𝑔 =𝐿𝑅 ∗
𝑑𝑎𝑦24 ℎ𝑟
∗ℎ𝑟
𝑚𝑖𝑛∗
𝑚𝑜𝑙 𝑆∗
245.41 𝑔𝑚 𝑆∗ ∗24.3 𝑔𝑚 𝑀𝑔2+
𝑚𝑜𝑙 𝑀𝑔2+ ∗ (𝑀𝑔: 𝑃)
𝑄𝐹𝑔
1000 𝑚𝑔∗
𝑘𝑔1000 𝑔
Where:
𝐿𝑅 = Target Production Rate, kg Struvite/day
𝑄𝐹 = Solution Feed Rate to the Reactor, mL/min
𝐶𝑀𝑔 = Target Concentration of Magnesium, mg Mg-2+
/L
𝑀𝑔: 𝑃 = Magnesium to Phosphorus Dosing Ratio (mole:mole)
Target Magnesium Feed Rate:
𝑄𝑀𝑔 =(𝐶𝑀𝑔 − 𝐶𝐹−𝑀𝑔) ∗ 𝑄𝐹
𝐶𝑆 ∗1000 𝑚𝐿
𝐿
Where:
𝑄𝐹 = Solution Feed Rate to the Reactor, mL/min
𝑄𝑀𝑔 = Magnesium Solution Feed Rate to the Reactor, mL/min
𝐶𝑀𝑔 = Target Concentration of Magnesium, mg Mg-2+
/L
𝐶𝐹−𝑀𝑔 = Concentration of Magnesium in Feed Solution, mg Mg-2+
/L
𝐶𝑆 = Concentration of Magnesium Standard Solution, mg Mg-2+
/L
𝑀𝑔: 𝑃 = Magnesium to Phosphorus Dosing Ratio (mole:mole)

76
Recycle Rate
In order to determine the recycle rate the following equation was used:
𝑄𝑅 = (𝑉𝑈𝐴𝐻 ∗𝐿
1000 𝑚𝐿) − 𝑄𝐹 ∗
𝐿
1000 𝑚𝐿
Where:
𝑄𝐹 = Solution Feed Rate to the Reactor, mL/min
𝑄𝑅 = Recycle Rate in th Reactor, L/min
𝑉𝑈 = Target Upflow Velocity in Harvest Zone, cm/min
𝐴𝐻 = Area of Harvest Zone, cm2

![The Utilization of Struvite Produced from Human Urine in … · ing valuable materials in human urine and faeces [7]. There are different methods for using human waste . directly](https://img.pdfslide.us/doc/110x75/60a5cdb53a0d8a03d43efab8/the-utilization-of-struvite-produced-from-human-urine-in-ing-valuable-materials.jpg)