Embed Size (px)
Citation preview
STRUCTURE OF MBSDMP DELIVERABLES
Inception Report
Situation Analysis Report
Strategy Building Report
Final Report
Action Plan /
Investment Report
Updated
Final Master Plan
Final Action Plan /
Investment Report
Final Draft Master Plan
Institutional Set-Up Report
Capacity Building Report
Submitted
This Report
Not yet due
Legend:
i
FINAL
REPORT A STRATEGIC MASTER PLAN
Manila Bay Sustainable Development Master Plan
October 2019
i i
i i i
Manila Bay Sustainable Development Master
Plan (MBSDMP) will contribute to the general
goal of improving the socio-economic
conditions of the communities around the
Manila Bay area. Its ultimate vision is that in the
near future Manila Bay will be clean,
rehabilitated, and conserved, and waters are
restored and maintained – making them fit for
swimming, skin-diving and other forms of
contact recreation; allowing for growth of fish
populations and effective protection both fish
populations and wildlife. The improved water
quality and ecological status will enable Manila
Bay to provide environmental goods and
services to the people. At the same time the
coastal communities will be spared from tidal
and riverine flooding and protected from
storm surges.
The MBSDMP vision is underpinned by
management objectives that include:
▪ Improved and sustainable Manila Bay
water quality suitable for its intended
beneficial use
▪ A protection of Manila Bay ecosystem that
sustainably delivers a variety of services
▪ Safe, resilient and adaptive Manila Bay
ecosystems and communities
▪ Manila Bay communities with access to
safe, affordable and formal housing with
access to basic services and economic
opportunities
▪ An equitable improvement in the quality
of life in the Manila Bay area
The formulation of the Manila Bay Sustainable
Development Master Plan (MBSDMP) consist
of two (2) stages—the Master Planning Stage
and the Operational Planning Stage. Under the
Master Planning Stage, is the Situational
Analysis and the Strategy Building Phase
leading to the Final Master Plan report.
During the Situational Analysis, the MBSDMP
The Manila Bay Area (MBA) covers the Manila
Bay and its immediate coastal zone together
with the larger catchment, as the influence
sphere. The Manila Bay (MB) with a coastline of
190 km (118.1 mi), situated in the western part
of Luzon, is bounded by the Coastal Local
Government Units of Cavite and Metro Manila
on the east, Bulacan and Pampanga on the
north, and Bataan on the west and northwest.
The influence sphere is the area bounded by
the Caraballo mountains to the north, the
Zambales mountains to the northwest, the
Bataan mountains to the west, and the Sierra
Madre Mountain Range to the east; as well as
river systems contributing to discharge in
Manila Bay from Nueva Ecija, Bataan,
Pampanga, Bulacan, Cavite, Rizal, National
Capital Region and Laguna.
Manila Bay is amongst the country’s most
significant areas in terms of impact to
economy and governance, becoming the
gateway for socio-economic development in
the Country. However, the immense
ecological, economic, cultural, historical and
aesthetic values of Manila Bay is seriously
being challenged by interconnected
environmental, social, and economic pressures
that includes: Declining Natural Habitat,
Decreasing Fish Stock Biomass, Continuous
deterioaration of Water Quality, Coastal
flooding, Irresponsible Land Conversion and
Reclamation, compounded by Changing
Climate Conditions, Extreme Climate events,
and Climate Variability.
In response to the continuing debilitation of
the Manila Bay Ecosystem, the National
Economic and Development Authority (NEDA)
through the 2017 General Appropriations Act
(GAA) allocate funds for the development of
the Manila Bay Sustainable Development
Master Plan (MBSDMP) aiming to provide the
needed guidance and framework for the
holistic developmental activities in the Manila
Bay.
EXECUTIVE SUMMARY
Final Report: A Strategic Master Plan
followed a systematic comprehensive
approach in recognition of the
interconnectivities of human and natural
systems across the MBA landscape by using
the Integrated Water Resource Management
Plan (IWRMP) that presents Manila bay as one
unified body consisting of three interlinked
systems namely: Natural Resources System
(NRS) – consists of the climate and physical
conditions; Socio-Economic System (SES) –
consists of the demographic, social and
economic conditions; Administrative and
Institutional Systems (AIS) – consists of the
Political systems, Policies , Management and
Laws prevailing in the MBA.
The Strategy Building procedure of the MBSDP
builds from the Management objectives of the
Master Plan grounded to the Situation Analysis
of the MBA. These MBSDMP management
objectives are operationalized in Performance
Indicators for which targets are set namely:
Pollution load of BOD entering Manila Bay;
Pollution load of PO4 entering in Manila Bay;
Percentage of Manila Bay monitoring stations
that meets fecal coliform guideline; Solid waste
diversion rate; Number of open dump sites;
Area of conserved and restored habitats; Fish
stock biomass; and Number of people exposed
to flooding.
The result of the strategy building phase of
MBSDMP resulted to the list of Projects,
Activities, and Programs clustered to Six
Thematic Packages oriented to the specific
management objectives of MBSDMP namely:
(1) Improve Management of Critical Habitats;
(2) Improve Solid Waste Management; (3)
Reduce Pollution Load; (4) Implement disaster
risk reduction and management programs/
projects; (5) Address concerns of informal
settlements in easements and high-risk areas
and (6) Enforce sustainable fisheries aiming to
improve the performance of some or several
indicators.
The formulation of the Manila Bay Sustainable
Development Master Plan (MBSDMP) further
develops an Integrated Coastal Zone
Management (ICZM) Planning Framework that
specifies the areas where specific activities are
allowed. The key-principles governing this
ICZM Planning Framework are: Sustainability,
Precautionary, Optimization of multiple uses,
Participatory, and Multi-disciplinary. The ICZM
framework has adopted a holistic and
integrative approach in addressing the
complex social and ecological issues in the
Manila Bay Coastal Area. Further it stimulates
the engagement, the participation and
cooperation of all stakeholders to realize the
overall goal of having a “Sustainable and
Resilient Manila Bay” by balancing and
harmonizing the sectoral objectives
(environment, economic, social, cultural and
recreational). The Planning Framework will be
one of the key bases of implementing the
Thematic Packages under MBSDMP.
MBSDMP, aside from prescribing key initiatives
to rehabilitate the Manila Bay based on
stakeholder engagements and scientific
findings, will also present option for
institutional set-up that is the best-fit to the
requirements – that is to govern and manage
the implementation of the Master Plan. The
Institutional Set-Up & Capacity Development
of MBSDMP provides the institutional support
for the implementation of the Master Plan
through defining (1) the recommended
organizational design for the Manila Bay
governing body, (2) the relationships of the
different institutional stakeholders, and (3) the
capacity requirements of the governing body
and the networks of stakeholders at the
national and local levels. Capacity
requirements are defined by the organization’s
ability to maximize current and potential
opportunities in the external environment in
order to deliver results.
After the Master Planning Stage, the
Operational Planning of MBSDMP will
incorporate recommendations to best achieve
results intended by the master plan including
at minimum a presentation on a suitable
financing/funding plan to address the
budgetary requirements corresponding to the
development interventions necessary to be
implemented; include technical optimization of
measures, cost-benefit analysis, socio-
economic and environmental assessments at
pre-feasibility.
iv
v
Final Report: A Strategic Master Plan
The National Economic and Development
Authority (NEDA) engaged the Joint Venture of
Orient Integrated Development Consultants,
Inc. (OIDCI) - Lead Firm; Tractebel, Inc. ; and
University of the Philippines Los Baños
Foundation, Incorporated (UPLBFI) as the Local
Consulting Firm (LCF) to work with the Dutch
Expert Team (DET) in the formulation of the
Manila Bay Sustainable Development Master
Plan (MBSDMP). The MBSDMP started in
January 2018 and will be completed in July
2020; the project has two phases: The Strategy
Planning phase and the Operational Planning
phase. This document is the result of the first
phase.
The MBSDMP will define the strategy that has
to be followed to achieve a Sustainable and
Ecological Healthy Manila Bay. It will be aligned
with the President’s Cleanup Action Program
for Manila Bay as formulated in Administrative
Order 16, creating the Manila Bay Task Force.
This Cleanup program addresses the needed
short-term actions and is the ideal start of the
full MBSDMP implementation. The MBSDMP
provides the umbrella for the Key Result Areas
(KRAs) of the Cleanup Program and adds the
mid- and long-term perspective. MBSDMP is
included itself in the Cleanup Program as KRA
7 with NEDA as Lead Agency.
This version of MBSDMP provides the strategic
directions of on-going and newly proposed
interventions, labeled as PAPs (Programs,
Activities, and Projects). The PAPs are grouped
into Thematic Packages (TPs), addressing
specific components of the defined strategic
goals for Manila Bay (MB). The PAPs included
in this version is described generally and will
be further detailed on the second phase of the
project. These PAPs need to be worked out in
more detailed before actual decision making
can be done on implementation and financing.
Moreover, before including these PAPs in the
final MBSDMP a reality check is needed with
the stakeholders, and the ownership of the
PAPs by the implementing agencies should be
ensured. In carrying out the design and
feasibility studies and by interacting with the
stakeholders, new information is anticipated to
become available leading to adjustments of
the PAPs or the development of new PAPs.
This is an on-going process in the project and
is part of the Operational Planning Phase.
Based on the results of the Operational
Planning Phase the final MBSDMP will be
made in May 2020. The Final MBSDMP will
include an Investment Plan that describes who
will implement the various PAPs and how this
will be financed.
vi
PREFACE
As previously acknowledge, the MBSDMP
documents is a dynamic plan that
continuously undergoes development and
enhancement. New information will
become available leading to improvements
of the plan. In this document, Grey colored
text boxes indicate sections that either
needs to be worked out in more detail or
activities that are carried out that will lead
to new information. These text boxes
indicate the status, the need for extension
or enhancement and/or outstanding and
remaining questions or issues from the
viewpoint of the consultant team.
1 INTRODUCTION, 1
2 MANILA BAY
SITUATION ANALYSIS, 11
3 OBJECTIVES AND
MODEL FRAMEWORK, 45
4 STRATEGY BUILDING
FRAMEWORK, 57
5 GAPS ANALYSIS, 61
6 STRATEGY BUILDING, 81
7 STRATEGIC MASTER PLAN, 89
Preferred Strategy
Preferred Strategy Validated
Measures under Preferred Strategy
Priority Thematic Packages
Supplementary Thematic Packages
Enabling Environment Measures
Assessment of Implication of the Master
Plan
ANNEXES
Annex 1: Strategy Building Report
Annex 2: IZCM Planning Framework
for Manila Bay
Annex 3: Institutional Set-Up Report
Annex 4: Capacity Building Report
Annex 5: Indicative (working) List of PAPs
Annex 6: Level-1 PAPs Profiles
(working draft)
vii
CONTENTS
Final Report: A Strategic Master Plan
viii
ADB Asian Development Bank
AHLP Affordable Housing Loan Program
AQI Air Quality Index
ASEAN Association of Southeast Nations
BSWM Bureau of Soils and Water Management
BWSA Barangay Waterworks and Sanitation
Associations
CADT Certificate of Ancestral Domain Title
CALAX Cavite- Laguna Expressway
CAVITEX Manila-Cavite Expressway
CBFM Community-Based Forest Management
CBOs Community-based organizations
CCs Contestable Customers
CDA Cooperative Development Authority
CDP Comprehensive Development Plan
COC Certificate of Conformity
CPF Common Purpose Facilities
DA Department of Agriculture
DAR Department of Agrarian Reform
DBM Department of Budget and Management
DENR Department of Environment and Natural
Resources
DepEd Department of Education
DILG Department of the Interior and Local
Government
DOE Department of Energy
DOH Department of Health
DOT Department of Tourism
DOTr Department of Transportation
DPWH Department of Public Works and Highways
DTI Department of Trade and Industry
EMB Environmental Management Bureau
FAO Food and Agricultural Organization
FEC Final Energy Consumption
FIES Family Income and Expenditures Survey
GDP Gross Domestic Product
GHG Greenhouse Gas
GOCC Government owned and controlled
corporations
HDMF Home Development Mutual Fund
HLURB Housing and Land Use Regulatory Board
HUDCC Housing & Urban Development
Coordinating Council
IAEA International Atomic Energy Agency
IEC Information, Education, Campaign
ISF Informal Settlers
IUCN International Union for Conservation of
Nature
JICA Japan International Cooperation Agency
KWFR Kaliwa Watershed Forest Reserve
LGU Local Government Unit
LLDA Laguna Lake Development Authority
LNG Liquefied Natural Gas
LRT Light Rail Transit
LWUA Local Water Utilities Administration
MARINA Maritime Industry Authority
MBA Manila Bay Area
MBA Manila Bay Area
MBSDMP Manila Bay Sustainable Development Plan
MGB Mines and Geosciences Bureau
MMDA Metropolitan Manila Development Author-
ity
MPIC Metro Pacific Investments Corporation
MTSP Manila Third Sewerage Project
MVFS Marikina Valley Fault System
MWA Municipal water areas
MWCI Manila Water Company, Inc
MWSI Maynilad Water Services, Inc.
MWSS Metropolitan Waterworks and Sewerage
System
NAMRIA National Mapping Resource and Infor-
mation Agency
NCCAP National Climate Change Action Plan
NCIP National Commission on Indigenous
Peoples
NCR National Capital Region
NDRRMF National Disaster Risk Reduction and
Management Framework
NEDA National Economic and Development
Authority
ACRONYM
ix
PRRC Pasig River Rehabilitation Commission
PRUMS Pasig River Unified Monitoring Stations
PSA Philippine Statistics Authority
RE Renewable Energy
RH Reproductive Health
RWSA Rural Waterworks and Sanitation
Associations
SCTEX Subic-Clark-Tarlac Expressway
SDGs United Nations Sustainable Development
Goals
SLEX South-Luzon Expressway
STAR Southern Tagalog Arterial Road
STPs Sewage treatment plants
TIEZA Tourism Infrastructure and Enterprise Zone
Authority
TDGVA Tourism direct gross value added
TFEC Total Final Energy Consumption
TPLEX Tarlac–Pangasinan–La Union Expressway
TRACT Tractebel, Inc.
TSS Total suspended solids
UP NIGS UP National Institute of Geological
Sciences
UPLB University of the Philippines Los Baños
UPLBFI University of the Philippines Los Baños
Foundation, Incorporated
UPPI University of the Philippines Population
Institute
NESC National Ecotourism Steering Committee
NFTs Nitrogen fixing trees
NHA National Housing Authority
NHCP National Historical Com-mission
of the Philippines
NIPAS National Integrated Protected Areas
System
NISUS National Informal Settlements Upgrading
Strategy
NLEX North Luzon Expressway
NMS National Migration Survey
NPAAD Network of Protected Areas and
Agro-Industrial Development
NPP Nuclear power program
NSFCC National Strategic Framework for Climate
Change
NSO National Statistics Office
NSSMP National Sewerage and Septage
Management Program
NSWMC National Solid Waste Management
Commission
OCL Omnibus Commitment Line
OECD Organization for Economic Cooperation
and Development
OIDCI Orient Integrated Development
Consultants, Inc.
PAGASA Philippine Atmospheric, Geo-physical and
Astronomical Services Administration
PCIC Philippine Crop Insurance Corporation
PCG Philippine Coast Guard
PDP Philippine Development Plan
PEP Philippine Energy Plan
PFZ Philippine Fault Zone
PhiVolcs Philippine Volcanology and Seismology
PHUMP Pinatubo Hazard Urgent Mitigation Project
PIEP Philippine Institute of Environmental
Planner
PNP-MG Philippine National Police- Maritime Group
Pop
Comm Commission on Population
PPA Philippine Ports Authority
PPP Public-Private Partnership
Final Report: A Strategic Master Plan
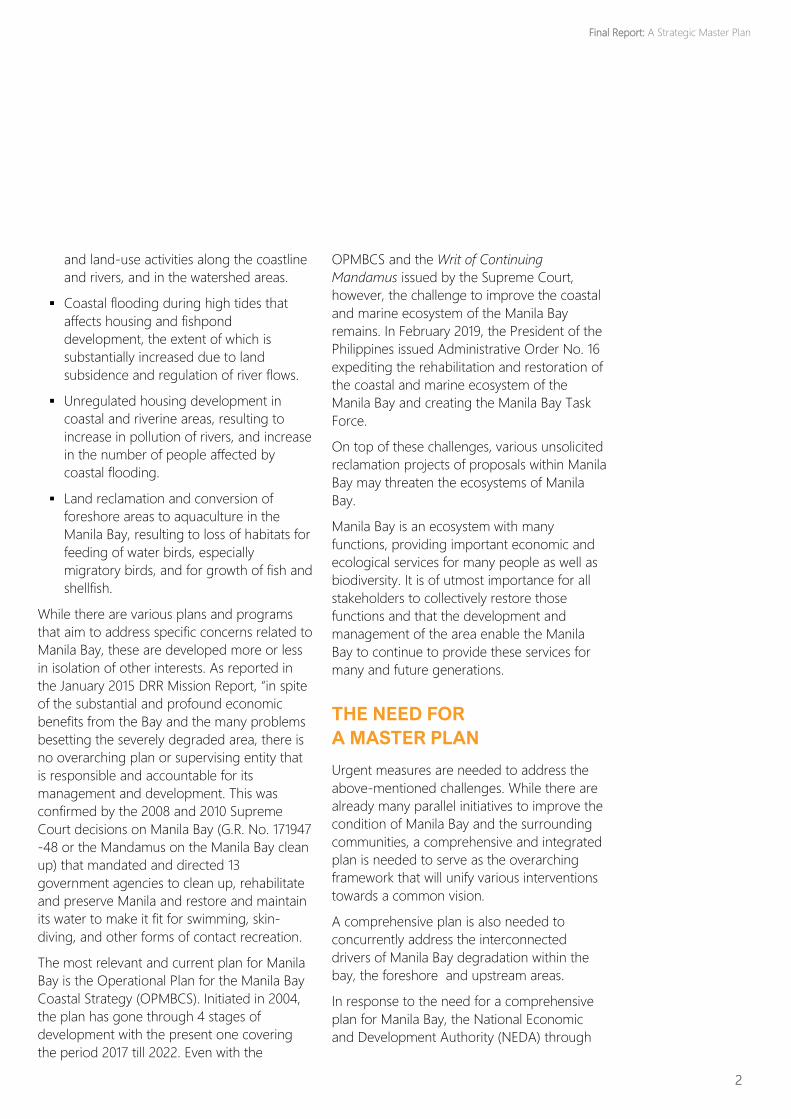
IMPORTANCE AND CHALLENGES
OF MANILA BAY
The Manila Bay (MB) with a coastline of 190 km is situated in the western
part of Luzon and bounded by Cavite and Metro Manila on the east,
Bulacan and Pampanga on the north, and Bataan on the west and
northwest. It is a natural harbor serving the Port of Manila and located
strategically around the City of Manila, the Capital City of the
Philippines. It is amongst the country’s most significant areas – in terms
of impact to economy and governance becoming the gateway for socio
-economic development in the Country.
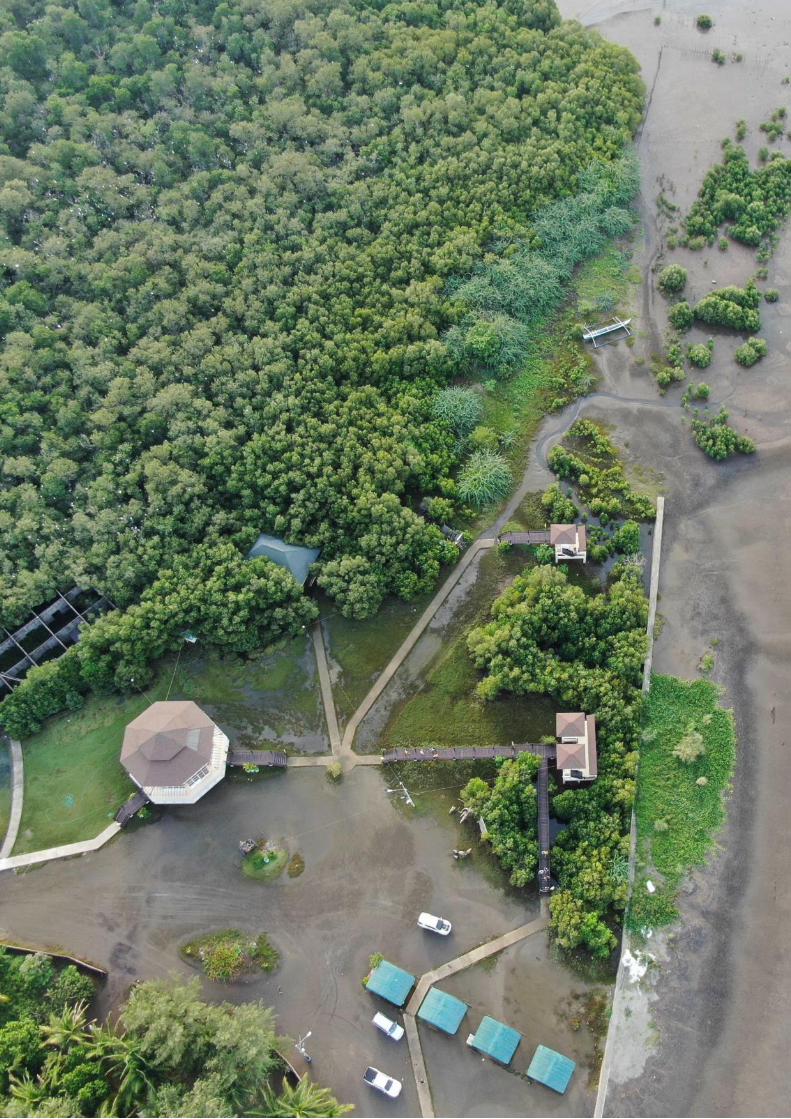
The beauty of Manila Bay is sustained by its ecology and environment.
Mangroves are among the most productive ecosystems that provide a
nursery function to various species of fish and other marine life.
Mangroves provide shoreline defense against floods and erosion.
Mangroves are also carbon sinks; it absorbs CO2 and converts it to O2
through photosynthesis. Wetlands of Manila Bay cover 81,675 hectares
within the 2-meter water column (Wetlands International and IUCN
Netherlands 2018) that provide food and habitat of fish, water birds and
other wildlife; maintaining and improving water quality of rivers, lakes
and estuaries, acting as reservoir for watersheds, and protecting
adjacent and downstream properties of the area from potential flood
damage. While there has been significant decline over time, tidal flats
and coral reefs remain important habitats for fish and benthic lifeforms,
and in the functioning of the Manila Bay ecosystem. Seagrass beds are
particularly found in the mouth of the Bay, e.g., in Orion and Mariveles,
Bataan, and around Corregidor Island.
The immense ecological, economic, cultural, historical and aesthetic
values of Manila Bay notwithstanding, its sustainability is seriously being
challenged by interconnected environmental, social, and economic
pressures which include:
▪ Degradation of water quality, ecology and the environment in
Manila Bay due to increasing discharges from domestic, industrial
and agricultural sources. This has resulted in degradation of
habitats, loss of biodiversity and loss of contact recreation value.
▪ Decline of fishery resources, due to the deteriorated water quality,
loss of habitats, use of bad fishing practices, and overfishing.
Despite this, fisheries remain as a major economic activity in Manila
Bay with fishing activities remaining generally high and
unsustainable.
▪ Coastal erosion, siltation and sedimentation, partly caused by
natural processes but aggravated by inappropriate development
1
INTRODUCTION
1
2
and land-use activities along the coastline
and rivers, and in the watershed areas.
▪ Coastal flooding during high tides that
affects housing and fishpond
development, the extent of which is
substantially increased due to land
subsidence and regulation of river flows.
▪ Unregulated housing development in
coastal and riverine areas, resulting to
increase in pollution of rivers, and increase
in the number of people affected by
coastal flooding.
▪ Land reclamation and conversion of
foreshore areas to aquaculture in the
Manila Bay, resulting to loss of habitats for
feeding of water birds, especially
migratory birds, and for growth of fish and
shellfish.
While there are various plans and programs
that aim to address specific concerns related to
Manila Bay, these are developed more or less
in isolation of other interests. As reported in
the January 2015 DRR Mission Report, “in spite
of the substantial and profound economic
benefits from the Bay and the many problems
besetting the severely degraded area, there is
no overarching plan or supervising entity that
is responsible and accountable for its
management and development. This was
confirmed by the 2008 and 2010 Supreme
Court decisions on Manila Bay (G.R. No. 171947
-48 or the Mandamus on the Manila Bay clean
up) that mandated and directed 13
government agencies to clean up, rehabilitate
and preserve Manila and restore and maintain
its water to make it fit for swimming, skin-
diving, and other forms of contact recreation.
The most relevant and current plan for Manila
Bay is the Operational Plan for the Manila Bay
Coastal Strategy (OPMBCS). Initiated in 2004,
the plan has gone through 4 stages of
development with the present one covering
the period 2017 till 2022. Even with the
OPMBCS and the Writ of Continuing
Mandamus issued by the Supreme Court,
however, the challenge to improve the coastal
and marine ecosystem of the Manila Bay
remains. In February 2019, the President of the
Philippines issued Administrative Order No. 16
expediting the rehabilitation and restoration of
the coastal and marine ecosystem of the
Manila Bay and creating the Manila Bay Task
Force.
On top of these challenges, various unsolicited
reclamation projects of proposals within Manila
Bay may threaten the ecosystems of Manila
Bay.
Manila Bay is an ecosystem with many
functions, providing important economic and
ecological services for many people as well as
biodiversity. It is of utmost importance for all
stakeholders to collectively restore those
functions and that the development and
management of the area enable the Manila
Bay to continue to provide these services for
many and future generations.
THE NEED FOR
A MASTER PLAN
Urgent measures are needed to address the
above-mentioned challenges. While there are
already many parallel initiatives to improve the
condition of Manila Bay and the surrounding
communities, a comprehensive and integrated
plan is needed to serve as the overarching
framework that will unify various interventions
towards a common vision.
A comprehensive plan is also needed to
concurrently address the interconnected
drivers of Manila Bay degradation within the
bay, the foreshore and upstream areas.
In response to the need for a comprehensive
plan for Manila Bay, the National Economic
and Development Authority (NEDA) through
Final Report: A Strategic Master Plan
its administered Infrastructure Development
Preparation (IDP) Fund under the 2017 General
Appropriations Act (GAA), initiated the
development of Manila Bay Sustainable
Development Master Plan (MBSDMP).
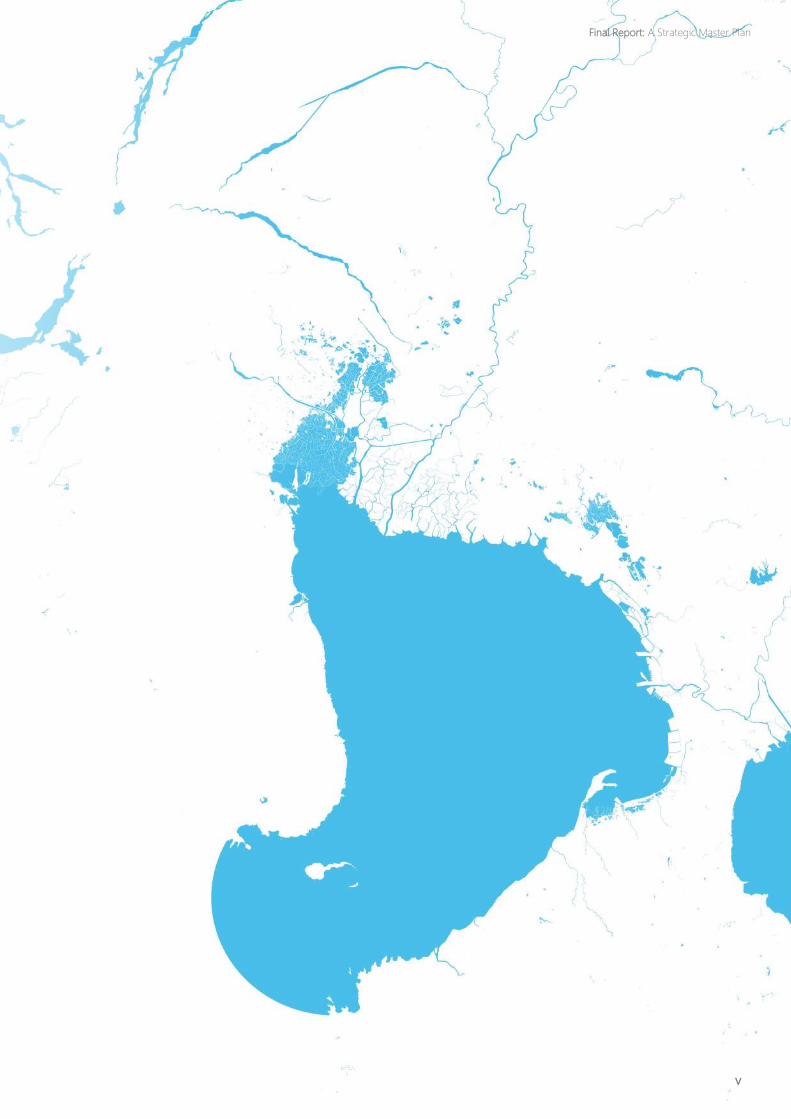
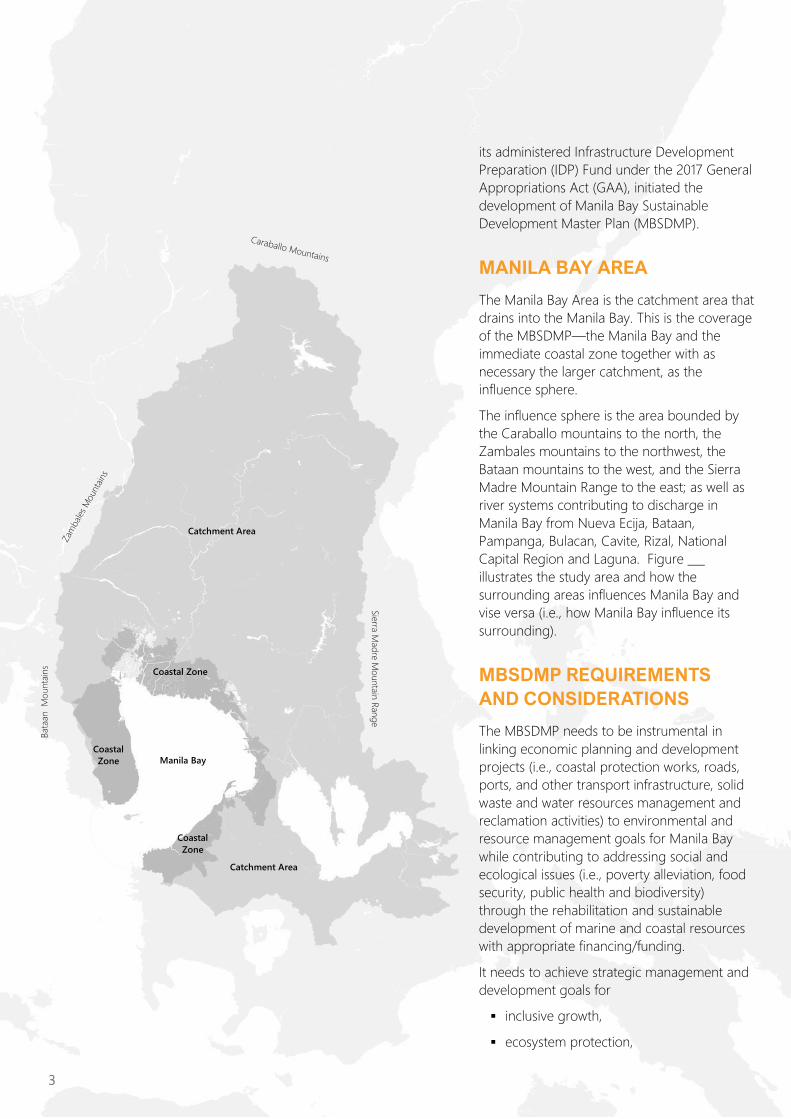
MANILA BAY AREA
The Manila Bay Area is the catchment area that
drains into the Manila Bay. This is the coverage
of the MBSDMP—the Manila Bay and the
immediate coastal zone together with as
necessary the larger catchment, as the
influence sphere.
The influence sphere is the area bounded by
the Caraballo mountains to the north, the
Zambales mountains to the northwest, the
Bataan mountains to the west, and the Sierra
Madre Mountain Range to the east; as well as
river systems contributing to discharge in
Manila Bay from Nueva Ecija, Bataan,
Pampanga, Bulacan, Cavite, Rizal, National
Capital Region and Laguna. Figure ___
illustrates the study area and how the
surrounding areas influences Manila Bay and
vise versa (i.e., how Manila Bay influence its
surrounding).
MBSDMP REQUIREMENTS
AND CONSIDERATIONS
The MBSDMP needs to be instrumental in
linking economic planning and development
projects (i.e., coastal protection works, roads,
ports, and other transport infrastructure, solid
waste and water resources management and
reclamation activities) to environmental and
resource management goals for Manila Bay
while contributing to addressing social and
ecological issues (i.e., poverty alleviation, food
security, public health and biodiversity)
through the rehabilitation and sustainable
development of marine and coastal resources
with appropriate financing/funding.
It needs to achieve strategic management and
development goals for
▪ inclusive growth,
▪ ecosystem protection,
3
Manila Bay
Coastal Zone
Catchment Area
Catchment Area
Coastal
Zone
Coastal
Zone
Sie
rra M
ad
re M
oun
tain
Ran
ge
Bata
an
Mo
unta
ins
▪ climate change adaptation and disaster
risk reduction,
▪ water quality improvement, and
▪ upgrading informal settlements.
The MBSDMP should be designed to provide
the needed guidance and framework for
developmental activities in the Manila Bay
through innovative approach. Instead of
assuming public financing (typically used in
traditional plans for coastal development and
management), the MBSDMP approach aims to
make use of appropriate, unsolicited private
sector investments to achieve strategic
management and development goals for
inclusive growth, ecosystem protection, climate
change adaptation and disaster risk reduction,
water quality improvement, and upgrading
informal settlements.
At the same time, the MBSDMP should serve
as a long-term framework for the sustainable
development of the Manila Bay Area. Thus, it
needs to be developed consistent with the
plans of the Local Government Units (LGUs) in
the MBA and those of the line agencies as well
as with the Philippine Development Plan (PDP)
2017-2022 and the AmBisyon Natin 2040.
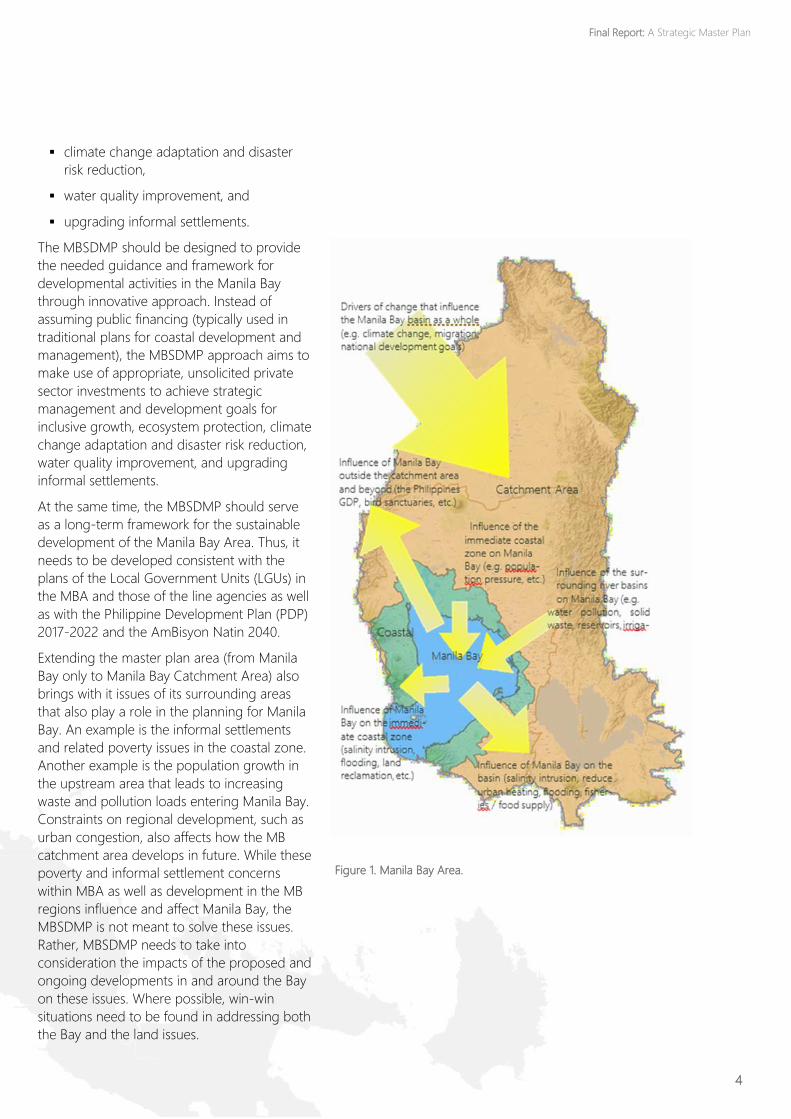
Extending the master plan area (from Manila
Bay only to Manila Bay Catchment Area) also
brings with it issues of its surrounding areas
that also play a role in the planning for Manila
Bay. An example is the informal settlements
and related poverty issues in the coastal zone.
Another example is the population growth in
the upstream area that leads to increasing
waste and pollution loads entering Manila Bay.
Constraints on regional development, such as
urban congestion, also affects how the MB
catchment area develops in future. While these
poverty and informal settlement concerns
within MBA as well as development in the MB
regions influence and affect Manila Bay, the
MBSDMP is not meant to solve these issues.
Rather, MBSDMP needs to take into
consideration the impacts of the proposed and
ongoing developments in and around the Bay
on these issues. Where possible, win-win
situations need to be found in addressing both
the Bay and the land issues.
4
Figure 1. Manila Bay Area.
Final Report: A Strategic Master Plan
MBSDMP OBJECTIVES
The overall objective of the MBSDMP is
captured in the vision statement
“A Sustainable and Resilient Manila Bay”
—a comprehensive yet simple phrase that
exemplifies the long-term vision of the Filipinos
of having a “Matatag, Maginhawa at Panatag
na Buhay” (strongly rooted, comfortable, and
secure life) in terms of what Manila Bay would
look like and be in the context of the AmBisyon
Natin 2040.
This is also consistent with the Writ of
Mandamus where the Supreme Court ordered:
“...defendant-government agencies to clean up,
rehabilitate, and preserve Manila Bay, and
restore and maintain its waters to SB level
(Class B sea waters per Water Classification
Tables under DENR Administrative Order No.
34 [1990]) to make them fit for swimming, skin-
diving, and other forms of contact recreation”
which would lead to a sustainable and resilient
Manila Bay.
The implementation of the master plan is to be
designed until 2040—again consistent to the
AmBisyon Natin 2040.
Expounding the overall objective of the
MBSDMP, NEDA stipulated in the TOR that the
master plan is to achieve strategic
management and development goals for
▪ inclusive growth,
▪ ecosystem protection,
▪ climate change adaptation and disaster
risk reduction,
▪ water quality improvement, and
▪ upgrading informal settlements.
This is to be achieved through strong
stakeholder participation in the planning and
implementation process and were financing
and funding is done through a combination of
public financing and solicited private sector
investment.
Translating Manila Bay’s need for a Master
Plan, the coverage area and its implication to
the master plan, the requirements and
conditions as set forth in the TOR, and in
consultation with various stakeholders and
experts, the objective statement of the
MBSDMP is refined as follows:
The ultimate goal of the MBSDMP is
An equitable improvement in the
quality of life in the Manila Bay area
and where
Manila Bay communities have with access
to safe, affordable and formal housing
as well as access to basic services and
economic opportunities.
This is to be achieved though
An improved and sustainable water quality
of Manila Bay that is suitable for
its intended beneficial use,
A protected Manila Bay ecosystem that
sustainably delivers variety of services,
and
A safe, resilient, and adaptive
Manila Bay ecosystems and communities.
Specifically, the MBSDMP aims to
▪ Improve water quality in Manila Bay—
making them fit for swimming, skin-diving,
and other forms of contact recreation,
▪ Protect the Manila Bay ecosystems—by
restoring and maintaining the current and
a portion of the then critical habitats, and
▪ Reduce the exposure of coastal
communities against the risk of flooding,
while
▪ Fostering inclusive development in the
Manila Bay Area, and
▪ Improving the living conditions of informal
settler families, particularly those living in
the flood-prone areas.
These objectives will be evaluated based on
the attainments of targets per key indicators
that best represent the whole of Manila Bay
Area. The key indicators are discussed in detail
in Chapter 3.
5
PLANNING AND TAKING
ACTION ON MANILA BAY –
ADDED VALUE OF MBDSMP
The MBSDMP is not the first and only plan for
taking action on the Manila Bay. As mentioned
earlier, there is the Operational Plan for the
Manila Bay Coastal Strategy (OPMBCS). Initially
published in 2015, the latest version covers the
period of 2017-2022. It outlines the specific
PAPs (Programs, Activities, Projects) that will
help to attain the defined goals and ultimately
the shared vision of the stakeholders for MB.
The OPMBCS includes Mandamus on Manila
Bay that mandated and directed 13
government agencies to clean up, rehabilitate
and preserve Manila and restore and maintain
its water to make it fit for swimming, skin-
diving, and other forms of contact recreation.
The Department of Environment and Natural
Resources (DENR) is the lead agency with the
Manila Bay Coordinating Office (MBCO) as the
Secretariat for the 13 Mandamus agencies. The
OPMBCS 2017-2022 includes 5 thematic
clusters: (i) Habitat and Resources
Management, (ii) Informal Settler Families and
Illegal Structures, (iii) Solid Waste
Management, (iv) Liquid Waste Management,
and (v) Institutional Arrangement / Partnership
& Governance.
With the delays in complying with the
mandamus, on 19 February 2019 the President
of the Philippines issued Administrative Order
No. 16 expediting the Rehabilitation and
Restoration of the Coastal and Marine
Ecosystem of the Manila Bay and Creating the
Manila Bay Task Force.
The Manila Bay Task Force (MBTF) is chaired
by the Secretary of the Department of
Environment and Natural Resources.
By middle of 2019, the Manila Bay
Rehabilitation Plan (MBRP) was developed—
identifying seven (7) Key Result Areas (KRAs)
with a lead agency and member institutions
per KRA.
The 7th KRA (with NEDA as its lead agency) is
the MBRP’s long-term plan which is the
‘Crafting of the MB Coastal and Marine
Rehabilitation and Restoration Sustainability
Plan’—the Manila Bay Sustainable
Development Master Plan (MBSDMP).
MBSDMP aligns and complements with MBRP,
as the latter forms the quick action start of the
implementation of MBSDMP while the former
provides the mid-term and long-term plan for
the MBRP. Besides the timeframe of the two
plans, the current version of the MBSDMP
(currently a Strategic Master Plan still) includes
the following:
▪ Disaster Risk Reduction (DRR) objectives to
the program, including climate change
adaptation, paying attention to increased
flooding risk from storm surges, sea level
rise and soil subsidence.
▪ Consider the option to engage both
solicited and unsolicited private sector
investment in the development of the
coastal zone (e.g., land reclamation) to
achieve the development goals for MB.
Another feature (and added value) of the
MBSDMP is the extensive stakeholder
involvement in the development of its strategy
in compliance with the general requirements
as provided for in Strategic Environmental
Assessment (SEA).
Besides OPMBCS and MBRP, there are other
plans that directly or indirectly contribute in
addressing the Manila Bay concerns. These
include, but not limited to, the following:
▪ National Sewage and Septage
Management Plan
▪ Philippine Master Plan for Water Supply
and Sanitation
▪ Pasig River Rehabilitation Commission
Master Plan/ Strategic Plan
▪ Laguna de Bay Master Plan
▪ Pampanga Master Plan
▪ Transportation Master Plan
▪ Plans and Programs of the Philippine
Reclamation Authority (PRA)
▪ Integrated Coastal Management
▪ Various plans of Regional, Provincial, and
Local LGUs (i.e., Regional Plans, Provincial
Development and Physical Framework
Plan (PDPFP), Comprehensive Land Use
Plan (CLUP), Annual Investment Plan
(AIP)).
6
Final Report: A Strategic Master Plan
WHAT WILL BE AND WILL NOT
BE ADDRESSED BY MBSDMP?
MBSDMP is about the Manila Bay and how to
promote its sustainability and resiliency.
However, the interventions will not be limited
to those that will be implemented in the Bay
but also include those that will be
implemented inland, such as those intervention
needed to reduce the amount of pollution
discharged to the Bay. This means that
improving solid waste management and
sewage treatment will be important issues to
be included in MBSDMP. Another important
issue is the need to address the concerns of
the informal settlements around the Bay. The
MBSDMP will include measures that will
directly address the need of ISFs at risk to
coastal flooding for safe and affordable
housing units with full access to basic services.
The MBSDMP, however, will not address the
concerns of all ISFs although some measures
may directly help by promoting inclusive
development and alleviating poverty as one of
the indicators in the analysis but MBSDMP is
not a poverty alleviation project.
Further, MBSDMP is not an urban planning
project for Metro-Manila or a basin-planning
project for the inflowing rivers. Hence, should
not expected to fully address the issues related
to drinking water supply and sanitation of the
urban and rural areas around Manila Bay. The
distinction between what MBSDMP will address
and what it will not address is fluid but it is
important to keep in mind that MBSDMP is
ultimately about improving the status of Manila
Bay.
The same applies to the attention that will be
given to land reclamation. As mentioned,
MBSDMP will ensure that private sector
investments contribute financially, technically,
and structurally to agreed development goals,
including improved living conditions in
informal settlements. It will provide the robust
mechanisms for issuing, granting and
monitoring concessions for private investments
in and around Manila Bay but MBSDMP will
not plan these private sector investments.
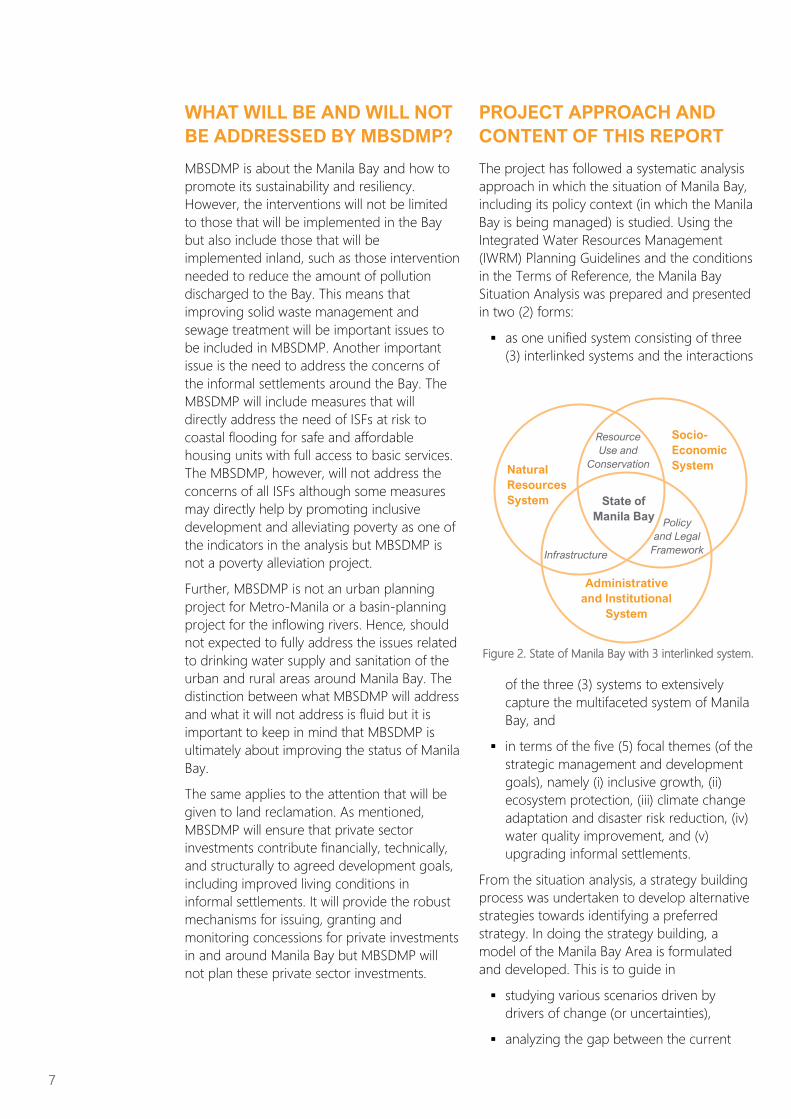
PROJECT APPROACH AND
CONTENT OF THIS REPORT
The project has followed a systematic analysis
approach in which the situation of Manila Bay,
including its policy context (in which the Manila
Bay is being managed) is studied. Using the
Integrated Water Resources Management
(IWRM) Planning Guidelines and the conditions
in the Terms of Reference, the Manila Bay
Situation Analysis was prepared and presented
in two (2) forms:
▪ as one unified system consisting of three
(3) interlinked systems and the interactions
of the three (3) systems to extensively
capture the multifaceted system of Manila
Bay, and
▪ in terms of the five (5) focal themes (of the
strategic management and development
goals), namely (i) inclusive growth, (ii)
ecosystem protection, (iii) climate change
adaptation and disaster risk reduction, (iv)
water quality improvement, and (v)
upgrading informal settlements.
From the situation analysis, a strategy building
process was undertaken to develop alternative
strategies towards identifying a preferred
strategy. In doing the strategy building, a
model of the Manila Bay Area is formulated
and developed. This is to guide in
▪ studying various scenarios driven by
drivers of change (or uncertainties),
▪ analyzing the gap between the current
7
Natural
Resources
System
Socio-
Economic
System
Infrastructure
Administrative
and Institutional
System
Policy
and Legal
Framework
Resource
Use and
Conservation
State of
Manila Bay
Figure 2. State of Manila Bay with 3 interlinked system.
situation and the future projection based
on the scenarios considered against the
government’s commitments (targets), and
▪ the efficacy of the combination of
potential measures in achieving the
project objectives.
Given the complexity of the Manila Bay Area
and the requirements of the master plan,
combined with the limited available data and
project time constraint, an iterative process in
establishing the preferred strategy was
undertaken. The iterative process enabled the
team developed a strategic master plan (as
early as stated in the TOR) while allow the
project to review, validate, and fine-tune the
measures (and its PAPs) of the preferred
strategy during the operational planning
phase. This approach also enabled the team
collect model-specific data from the
stakeholders during the series of operational
planning phase stakeholder consultation.
The milestone output of the strategy building
phase is its Final Report or the first version high
-level master plan—the Strategic Master Plan.
The milestone of the operational planning
phase, on the other hand, are the Action Plan/
Investment Report and the Updated Master
Plan which incorporates the Action Plan/
Investment Report.
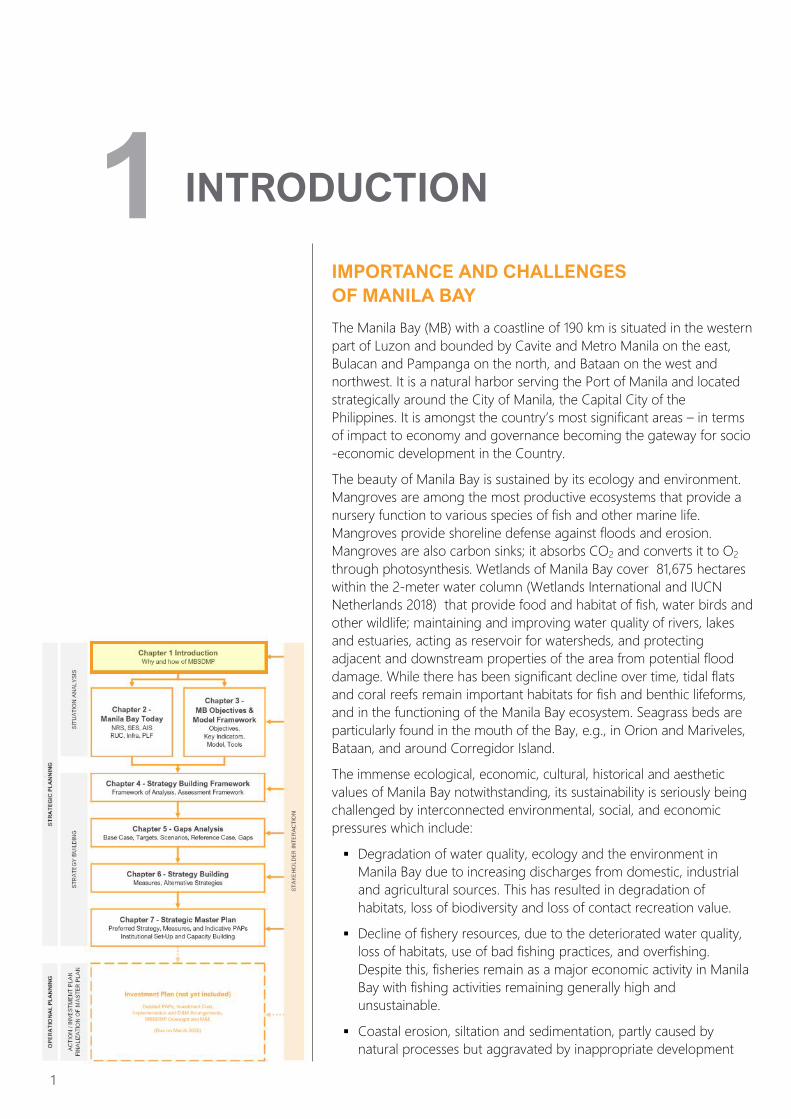
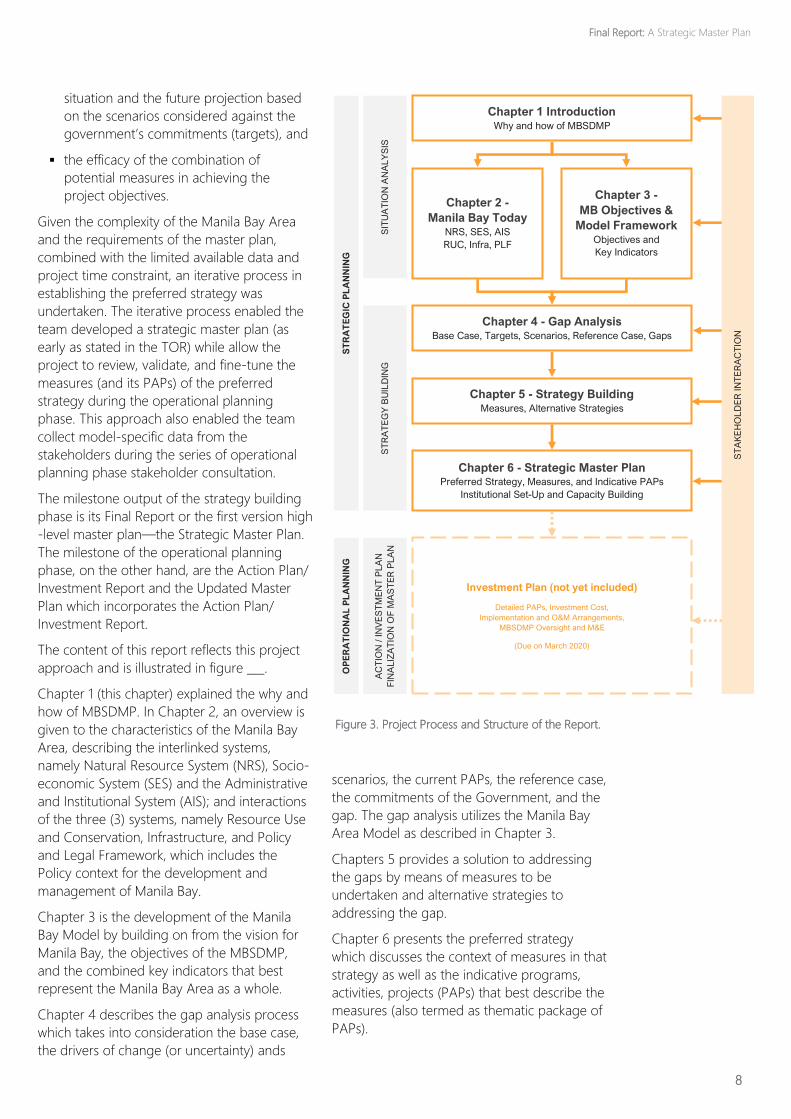
The content of this report reflects this project
approach and is illustrated in figure ___.
Chapter 1 (this chapter) explained the why and
how of MBSDMP. In Chapter 2, an overview is
given to the characteristics of the Manila Bay
Area, describing the interlinked systems,
namely Natural Resource System (NRS), Socio-
economic System (SES) and the Administrative
and Institutional System (AIS); and interactions
of the three (3) systems, namely Resource Use
and Conservation, Infrastructure, and Policy
and Legal Framework, which includes the
Policy context for the development and
management of Manila Bay.
Chapter 3 is the development of the Manila
Bay Model by building on from the vision for
Manila Bay, the objectives of the MBSDMP,
and the combined key indicators that best
represent the Manila Bay Area as a whole.
Chapter 4 describes the gap analysis process
which takes into consideration the base case,
the drivers of change (or uncertainty) ands
scenarios, the current PAPs, the reference case,
the commitments of the Government, and the
gap. The gap analysis utilizes the Manila Bay
Area Model as described in Chapter 3.
Chapters 5 provides a solution to addressing
the gaps by means of measures to be
undertaken and alternative strategies to
addressing the gap.
Chapter 6 presents the preferred strategy
which discusses the context of measures in that
strategy as well as the indicative programs,
activities, projects (PAPs) that best describe the
measures (also termed as thematic package of
PAPs).
8
Chapter 1 Introduction Why and how of MBSDMP
Chapter 2 -
Manila Bay Today NRS, SES, AIS
RUC, Infra, PLF
Chapter 3 -
MB Objectives &
Model Framework Objectives and
Key Indicators
Chapter 4 - Gap Analysis Base Case, Targets, Scenarios, Reference Case, Gaps
Chapter 5 - Strategy Building Measures, Alternative Strategies
Chapter 6 - Strategic Master Plan Preferred Strategy, Measures, and Indicative PAPs
Institutional Set-Up and Capacity Building
SIT
UA
TIO
N A
NA
LY
SIS
S
TR
AT
EG
Y B
UIL
DIN
G
ST
RA
TE
GIC
PL
AN
NIN
G
OP
ER
AT
ION
AL
PL
AN
NIN
G
AC
TIO
N /
IN
VE
ST
ME
NT
PL
AN
FIN
AL
IZA
TIO
N O
F M
AS
TE
R P
LA
N
Investment Plan (not yet included)
Detailed PAPs, Investment Cost,
Implementation and O&M Arrangements,
MBSDMP Oversight and M&E
(Due on March 2020)
ST
AK
EH
OL
DE
R IN
TE
RA
CT
ION
Figure 3. Project Process and Structure of the Report.
Final Report: A Strategic Master Plan
STAKEHOLDER INVOLVEMENT
The study team engaged in discussion of the
master plan with specific interest groups or
stakeholders through consultation-workshops,
consultation-meetings, small group meetings,
community meetings including field visits. With
the growing interest in the master plan,
invitations have been received by the project
team to present the contents and updates on
the master plan. The study team took these
opportunities to further expand its reach
among the many stakeholders of Manila Bay.
From March 2018 to September 2019, various
activities were conducted by the Study Team
to engage and solicit from various stakeholder
groups inputs, comments, and suggestions on
the processes, outputs and reports of various
stages of the planning process. The
stakeholder involvement activities undertaken
by the Study Team are briefly described below.
CONSULTATION-WORKSHOPS
A series of consultation-workshops were
conducted among the local government units
(LGUs) of the coastal municipalities/cities in the
provinces of Bulacan and Pampanga, Bataan,
Cavite, and in the National Capital Region. The
activity provided an avenue for the LGUs to
discuss and analyse among themselves, with
guidance from the study team, their common
problems related to the different measures
proposed in the draft master plan. In the
process of analyzing the problems, the LGUs
saw the need to work together, for example, in
clusters to address the problems associated
with solid waste management; to harmonize
local ordinances of LGUs in Manila Bay related
to municipal fisheries; and to collaborate in
addressing flooding and land subsidence. A
positive result of the activity particularly in
Bulacan and Pampanga is the increase in LGU
membership of the Alyansa ng mga Baybayin
Bayan sa Bulacan at Pampanga (ABB-BP). The
new LGU members realized that it is in their
best interest to work with the other LGUs in
resolving environmental issues as a collective.
The consultation workshop with
representatives of national government
agencies (NGAs) provided the forum for
clarification of specific roles and responsibilities
as well as accountabilities an example of which
were those related to the waste management
system involving incoming cargo and
passenger ships. Policy gaps and
implementation issues have been identified
and discussed including corresponding policy
recommendations and other possible
solutions.
SMALL GROUP MEETINGS
These meetings targeted specific stakeholders
of a particular measure. Small group meetings
were conducted separately with, among
others, the Recyclers Association of the
Philippines; Sanitary Landfill Operators;
concerned agencies on Biodegradables for
composting; concerned national agencies/
organizations on reducing pollution load;
MWSS and concessionaires; concerned
agencies on offshore pollution; Macabebe LGU
on housing solutions; consultation on the
programs and projects in the master plan with
Urban Poor Associates (UPA); institutional set-
up and capacity building consultation with
representatives of the Metropolitan Manila
Development Authority (MMDA), Pasig River
Rehabilitation Commission (PRRC), and the
Laguna Lake Development Authority (LLDA);
and meeting with NEDA CO staff
representatives on institutional set-up and
capacity building as well. Separate small group
meetings on the zoning framework were
likewise undertaken with NEDA; University of
the Philippines (UP)-Marine Science Institute
(MSI); UP-Institute of Environmental Science
and Meteorology (IESM); DENR Executive
Committee; and the DENR Ecosystem Research
and Development Bureau (ERDB). A meeting
with representatives of the Bureau of Fisheries
and Aquatic Resources (BFAR) – National
Fisheries Research and Development Institute
(NFRDI) was conducted to discuss data gaps
and proposed programs and projects for the
sector.
CONSULTATION MEETINGS
Two consultation meetings were conducted
among the representatives of water districts in
Region 3, and those in Region IV-A. Issues
associated with liquid waste management in
9
their respective coverage areas were
discussed, as well as possible strategies,
programs and projects intended to address
said issues.
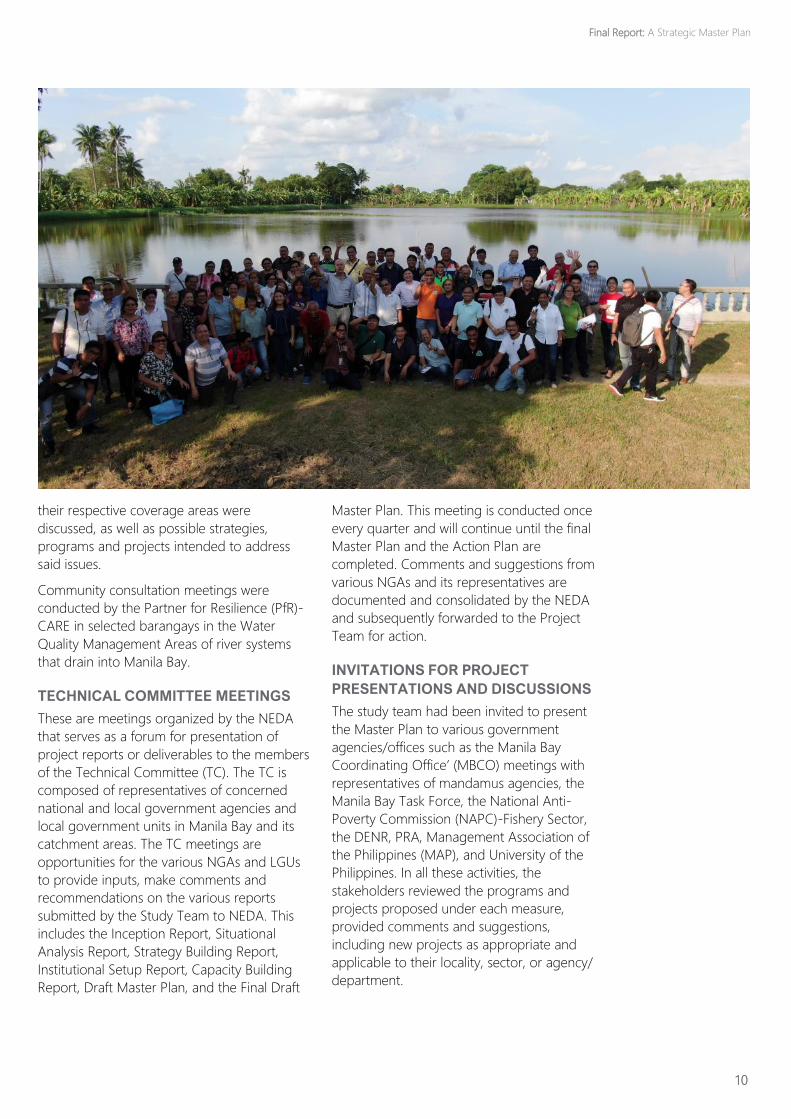
Community consultation meetings were
conducted by the Partner for Resilience (PfR)-
CARE in selected barangays in the Water
Quality Management Areas of river systems
that drain into Manila Bay.
TECHNICAL COMMITTEE MEETINGS
These are meetings organized by the NEDA
that serves as a forum for presentation of
project reports or deliverables to the members
of the Technical Committee (TC). The TC is
composed of representatives of concerned
national and local government agencies and
local government units in Manila Bay and its
catchment areas. The TC meetings are
opportunities for the various NGAs and LGUs
to provide inputs, make comments and
recommendations on the various reports
submitted by the Study Team to NEDA. This
includes the Inception Report, Situational
Analysis Report, Strategy Building Report,
Institutional Setup Report, Capacity Building
Report, Draft Master Plan, and the Final Draft
Master Plan. This meeting is conducted once
every quarter and will continue until the final
Master Plan and the Action Plan are
completed. Comments and suggestions from
various NGAs and its representatives are
documented and consolidated by the NEDA
and subsequently forwarded to the Project
Team for action.
INVITATIONS FOR PROJECT
PRESENTATIONS AND DISCUSSIONS
The study team had been invited to present
the Master Plan to various government
agencies/offices such as the Manila Bay
Coordinating Office’ (MBCO) meetings with
representatives of mandamus agencies, the
Manila Bay Task Force, the National Anti-
Poverty Commission (NAPC)-Fishery Sector,
the DENR, PRA, Management Association of
the Philippines (MAP), and University of the
Philippines. In all these activities, the
stakeholders reviewed the programs and
projects proposed under each measure,
provided comments and suggestions,
including new projects as appropriate and
applicable to their locality, sector, or agency/
department.
10
Final Report: A Strategic Master Plan
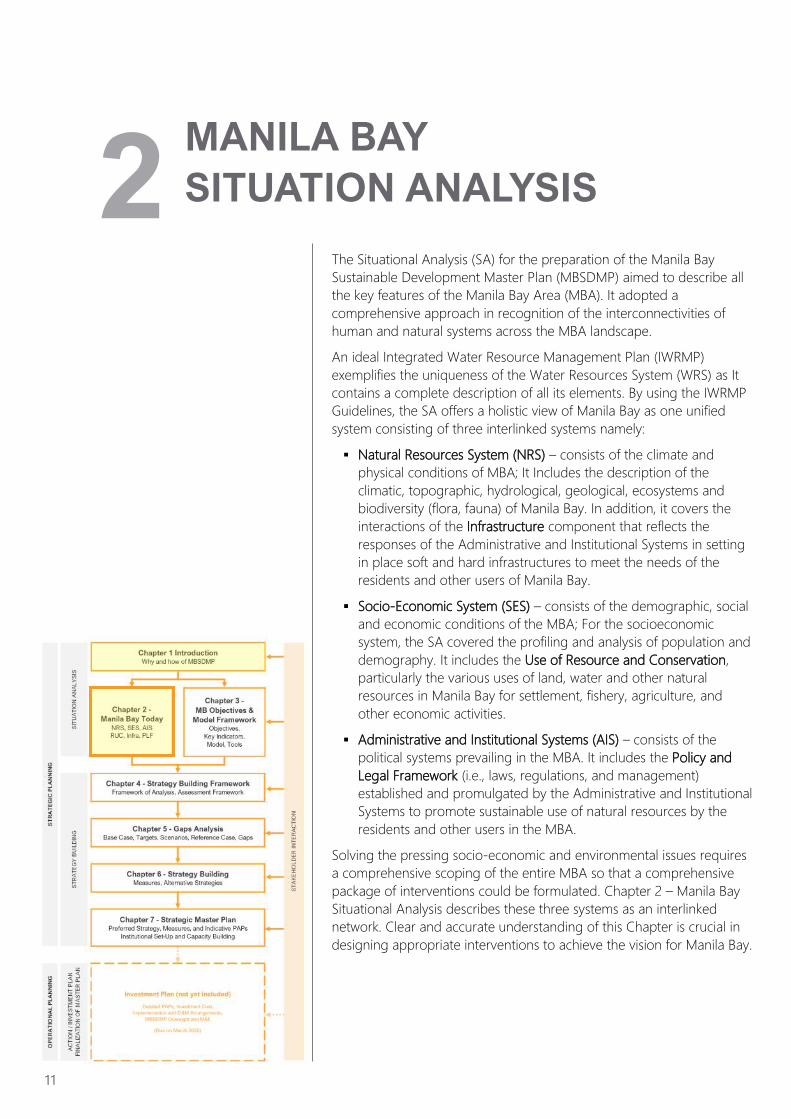
The Situational Analysis (SA) for the preparation of the Manila Bay
Sustainable Development Master Plan (MBSDMP) aimed to describe all
the key features of the Manila Bay Area (MBA). It adopted a
comprehensive approach in recognition of the interconnectivities of
human and natural systems across the MBA landscape.
An ideal Integrated Water Resource Management Plan (IWRMP)
exemplifies the uniqueness of the Water Resources System (WRS) as It
contains a complete description of all its elements. By using the IWRMP
Guidelines, the SA offers a holistic view of Manila Bay as one unified
system consisting of three interlinked systems namely:
▪ Natural Resources System (NRS) – consists of the climate and
physical conditions of MBA; It Includes the description of the
climatic, topographic, hydrological, geological, ecosystems and
biodiversity (flora, fauna) of Manila Bay. In addition, it covers the
interactions of the Infrastructure component that reflects the
responses of the Administrative and Institutional Systems in setting
in place soft and hard infrastructures to meet the needs of the
residents and other users of Manila Bay.
▪ Socio-Economic System (SES) – consists of the demographic, social
and economic conditions of the MBA; For the socioeconomic
system, the SA covered the profiling and analysis of population and
demography. It includes the Use of Resource and Conservation,
particularly the various uses of land, water and other natural
resources in Manila Bay for settlement, fishery, agriculture, and
other economic activities.
▪ Administrative and Institutional Systems (AIS) – consists of the
political systems prevailing in the MBA. It includes the Policy and
Legal Framework (i.e., laws, regulations, and management)
established and promulgated by the Administrative and Institutional
Systems to promote sustainable use of natural resources by the
residents and other users in the MBA.
Solving the pressing socio-economic and environmental issues requires
a comprehensive scoping of the entire MBA so that a comprehensive
package of interventions could be formulated. Chapter 2 – Manila Bay
Situational Analysis describes these three systems as an interlinked
network. Clear and accurate understanding of this Chapter is crucial in
designing appropriate interventions to achieve the vision for Manila Bay.
11
MANILA BAY
SITUATION ANALYSIS
2
NATURAL RESOURCE
SYSTEM
The Manila Bay Area (MBA) covers the Manila
Bay and its immediate coastal zone together
with as necessary the larger catchment, as the
influence sphere. The influence sphere is the
area bounded by the Caraballo mountains to
the north, the Zambales mountains to the
northwest, the Bataan mountains to the west,
and the Sierra Madre Mountain Range to the
east; as well as river systems contributing to
discharge in Manila Bay from Nueva Ecija,
Bataan, Pampanga, Bulacan, Cavite, Rizal,
National Capital Region and Laguna.
The Manila Bay Catchment Area extends
across three (3) regions and the NCR. It
encompasses a sizable portion of both Central
and Southern Luzon (Region III and IV-A), a
few cities and municipalities in Region II, and
the whole of Metropolitan Manila. The whole
area of more than 17,000 square kilometers is
composed of 26 catchments areas, of which
four (4) are considered as major river basins.
TOPOGRAPHY AND LAND COVER
The topography of the whole Manila Bay Basin
encompasses all standard categories for slope
and elevation, from generally flat and level
land, to extremely high and steep terrains. Flat
terrains correspond to grasslands, open
spaces, and cleared areas (including built ups),
among others. High elevations and extremely
steep slopes largely correspond to the
geomorphic features that define the whole
basin namely: the Zambales Mountain Range,
the Macolod Corridor, and the southern
portion of Sierra Madre Mountain Range. The
flat geomorphology of the basin known as the
Central Valley Basin, lies between the mountain
ranges of Zambales and Sierra Madre. Its
fertile lands are the rice bowl of the country.
Land cover in Manila Bay area is classified into
natural and cultivated vegetation, built-up
areas, and marine and aquatic features and
resources. A vast portion of the Manila Bay
Basin’s overall area is covered by annual crops.
SLOPE AND ELEVATION
Most of the basin (829,082 ha) is relatively flat,
with less than 3% slope and 861,227 ha with
slopes 3% to 8%, 131,966 ha with extremely
steep slopes of more than 50%. Slopes
between 3% to 8% dominate the coastal LGUs,
covering 72,566 ha. About 50,935 ha of coastal
LGUs is level to nearly level while 4,916 ha have
slopes above 50%.
Areas with elevation less than 100 meters
above sea level (asl) constitute a large portion
of the basin at 953,909 ha. Majority of these
areas are situated in the Central Valley and
2,200 masl, corresponding to the peaks in the
Sierra Madre Mountain Range, located in the
province of Quezon. About 135,531 ha of the
area constituting the coastal LGUs are lower
than 100 meters.
SOIL TAXONOMY AND LITHOLOGIC
FORMATION
The soil taxonomy existing in Manila Bay Area
shows that a large portion of the basin is
comprised of cambisols. According to the FAO
World Reference Base for Soil Resources,
cambisols are medium to fine-textured
materials generally derived from deposits of
alluvial, colluvial, and aeolian in nature. As
such, this soil type is commonly found in
intensively utilized and good farming lands,
such as the Central Valley Basin, which is the
rice bowl of the country. Fluvisols and gleysols
are generally occurrent in frequently inundated
and therefore saturated lands. The areas lining
the coast of the bay, in particular the fishponds
in Pampanga and Bulacan, are made up of the
said soils. The acrisols characterizing older
landscapes are mostly existent in the natural
parks of the basin, such as General Nakar in
Quezon and Aurora, and Minalungao in Nueva
Ecija. Luvisols and andosols are found in the
peaks or mountains.
There are eleven (11) lithologic formations
identified within the circumferential influence
of Manila Bay area: Quaternary, Pliocene to
Pleistocene, Upper Miocene to Pliocene,
Undifferentiated (KPg Sedimentaries /
Metamorphics Rocks), Undifferentiated (UV
Volcanic Rocks), Cretaceous, Permian to
Jurassic, Paleogene, Oligocene, Pliocene to
Quaternary.
KEY PROTECTED AREAS
Manila Bay Basin has several areas declared as
protection zones under Republic Act 7586,
otherwise known as the National Integrated
Protected Areas System (NIPAS) of 1992. This
law controls destruction of protects national
parks and reserves that contain natural and
unique bio-logical or physical diversities
attributes of the environment, notably those
12
Final Report: A Strategic Master Plan
with rare and astonishing biological features to
ensure that the use of these protected areas
is consistent with the principles of sustainable
development. These protected areas are:
Pantabangan-Carranglan Watershed
Reservation, Roosevelt Protected Landscape,
Bataan National Park, Mt. Arayat National park,
Hinulugan Taktak Protected Landscape,
Pamitinan Protected Landscape, Ninoy Aquino
Parks and Wildlife Center, Mts. Palay-Palay-
Mataas-na-Gulod National Park, and Mt
Banahaw-Cristobal Protected Landscape
CLIMATE AND RAINFALL
The climate in Manila Bay (MB) Area is
dominated by climate Type I specifically in the
large bulk of its center and western portion.
The climate of the eastern portion is
categorized under Types III and IV. Rainfall The
average annual rainfall in the Manila Bay Basin
ranges from 1500-5500mm. An annual rainfall
ranging from 1300 to 3500mm is recorded
from 1987 to 2017 by the Port Area station in
Manila, which faces the coast.
MANILA BAY COASTAL WATERS
Bathymetry and Bottom Topography
According to the Manila Bay Refined Risk
Assessment, a 2004 study by Partnerships in
Environmental Management for the Seas of
East Asia (PEMSEA), the changes in bottom
topography of Manila Bay is just a continuous
interplay of wind movement, influx of
freshwater outfall from tributaries draining to
the bay, and the natural tide and current of the
whole bay. This shows that no real deepening
occurs, but rather just a dispersal and
redistribution of sediment deposits at the
bottom. However, shallowing in almost every
part of the Manila Bay indeed happens and is
expected to persist. Shallow portions of the
bay in the provinces of Pampanga and Bulacan
are characterized by estuarines, which are
usually utilized for aquaculture purposes. In
Metro Manila, specifically in Navotas and City
of Manila, the bottom of Manila Bay near the
shoreline is made up of silt and mud. Garbage
and organic solid wastes are also observed in
this area.. The deeper parts of the Manila Bay
on the other hand extend to the open sea.
Manila Bay Ecosystems
For the ecosystem description and trend
analysis, the report focused on two ecosystem
features for which sufficient data and
information are available and that together
provide insights on the state of the ecosystem
and the effectiveness of interventions
implemented through the years. These
ecosystem features are:
▪ Habitats
▪ Indicator taxa, (i) Birds, (ii) Fish
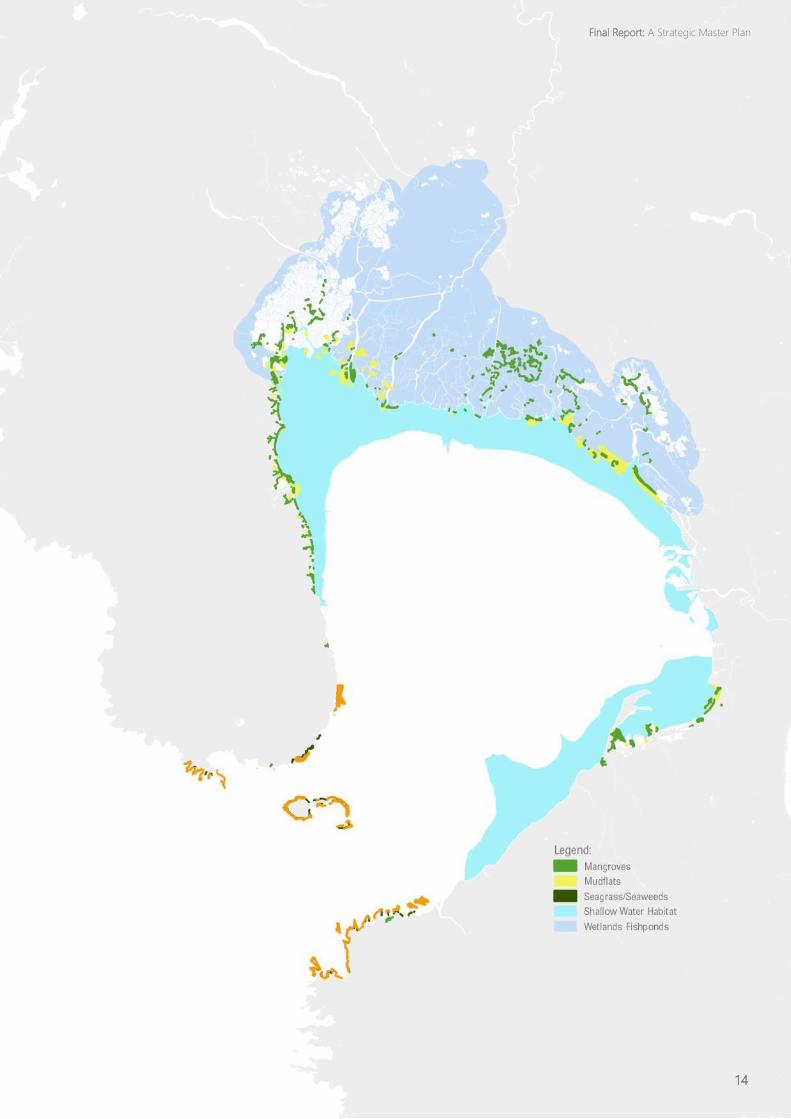
The Manila Bay ecosystem consists of multiple
habitats that are interconnected by material
and energy exchange, facilitated by the
biological components of the system. The
habitat generally covers the central part of the
Bay, from depths, greater than 10m. It is a
predominantly muddy and the substrate is
compact. The habitat has low structural
complexity with an almost uniform substrate
relief.
Deep water sand. The habitat type covers the
more exposed section of Manila Bay near the
mouth, at depths greater than 10m. Similar to
Deep Water Mud, this habitat type is
characterized by low structural complexity,
strongly predominated by a loose, sandy
substrate.
Shallow mud. This habitat type is relatively
narrow, following the contour of the bay.
Sections of this habitat (near river outfalls) are
characterized by highly variable salinity This
substrate in this shallow corridor is compact
and muddy with low structural complexity.
Mudflats. These areas are mostly intertidal and
thus are subjected to daily water inundation
and exposure. Mudflats are located in
sheltered sections of the bay, close to major
river outfalls. Mudflats are also characterized
by low structural complexity.
Mangrove forest. Mangrove forests at present
are present in patches of less than a hectare to
tens of hectares. The root system of
mangroves increases the topographic
complexity of this habitat types. The substrate
type is muddy and compact.
Seagrass beds. No data is available on the
distribution and extent of seagrass beds in
Manila Bay. However, anecdotal accounts
13
There are 1,343 hectares of mud flats
(UNEP-TEEB 2017), 1,092 hectares of
mangrove forests (NAMRIA 2019), 625
hectares of coral reefs (NAMRIA 2019) and
85 hectares of seagrass (NAMRIA 2019)
identified in the coastal area of Manila Bay.
14
Final Report: A Strategic Master Plan
point to the abundance of these habitats in
shallow, sheltered sections of the bay. The
substrate of these habitats range from sandy-
silt to sand. Complexity is moderate to high
depending on the species of seagrass present
and their density.
Coral reef. Coral reefs in Manila Bay are
narrow and fringing, found mostly on the more
exposed part of the bay. Most of the reefs in
Mariveles and Corregidor Island grew from an
igneous rock base and is structurally complex.
In terms of indicator animal taxa, birds and fish
represent species that because of their position
at higher trophic levels – i.e. higher in the food
web – are generally considered good
indicators of ecosystem quality. Furthermore,
both taxa are strongly dependent on the
condition and extent of habitat coverage for
refuge, sustenance and reproduction. Birds are
positioned at the higher trophic level and thus,
significant positive or negative changes lower
in the food web should be reflected in the
species composition and abundance of this
group. The same is true for carnivorous fish.
However for this taxa, the exploitation level
could be directly accounted for since fishery is
historically, the main source of livelihood for
local communities. Therefore, in spite of the
incomplete available data on all levels of the
food web,, information on birds and fish
provide significant insights on the condition of
the Manila Bay ecosystem.
WATER QUALITY
There are several stations along the rivers and
tributaries that are being monitored within the
Manila Bay Area including Pasig River and
Laguna Lake. Biological Oxygen Demand
(BOD), nutrients and other physical parameters
of major river basins have been established
with most historical data collected since the
Mandamus was issued in 2009. However, there
is limited information on the water quality
particularly on the organic and nutrient
loadings of the coastal waters of the bay itself.
Even if the pollution from agricultural run-offs
and discharges from livestock are part of the
Mandamus Order, baseline surveys on these
are yet to be done and are part of the
Operational Plan for the Manila Bay Coastal
Strategy (OPMBCS) 2017-2022. Except for the
regular monitoring of bathing beaches along
the coast of Bataan and Cavite, there is limited
information on how the Bay is assimilating the
increasing organic and nutrient discharges
coming from the different sub-basins of the
Manila Bay Area.
INFRASTRUCTURES
WATER SUPPLY
Within the Manila Bay area, the areas served
by the two concessionaires of Metropolitan
Waterworks and Sewerage System (MWSS)
have increased access to water from 40% to
90% of about 15 Million people in Metro
Manila including parts of Rizal and Cavite
provinces. Service provision outside the areas
covered by the 2 concessionaires are served
by any of the following: Water Districts, Local
Government Unit (LGU) run water systems,
Rural and Barangay Waterworks and Sanitation
Associations (RWSA and BWSA) and Water
Cooperatives.
SEWERAGE SYSTEM
In Metro Manila, there are established
sewerage areas operated by the two water
concessionaires of MWSS: (1) Maynilad Water
Services Inc. provides sewerage services to
West Manila while (2) Manila Water Company
Inc. provides the services for East Manila. At
present, only 7.1 % of the population in the
Manila Bay Region have sewer connections.
These areas are in Metro Manila and some
municipalities in Cavite and Rizal. Maynilad has
19 Sewage Treatment Plants (STPs), two (2)
Sewage and Septage Treatment Plants and
one (1) septage with combined sewage
treatment capacity of 663 million liters per day
(MLD) and septage treatment capacity of 1,190
CMD (at 16 hours operation), while Manila
Water has 41 Sewage and Septage Treatment
Plants with a total capacity of 410 MLD. With
the existing facilities of Maynilad and Manila
Water, about 27% of the wastewater
generated within the Manila Bay Region is
being treated in Septic tanks. Other than the
sewerage services, Maynilad and Manila Water
also offers sanitation services, such as
desludging of septic tanks and treatment of
collected septage, to its customers who are not
connected to the sewer system. Outside Metro
Manila, there are also some water districts that
provide septic tank desludging services to its
customers. Other provinces that have septage
management are Nueva Ecija, Bulacan and
Laguna. The collected septage are transported
to their Septage Treatment Plants (STP) for
proper treatment prior to disposal.
15
SOLID WASTE MANAGEMENT
As presented, about half (52.31%) of MSW
generated in the country is considered
biodegradable – with kitchen/food waste
comprising the 86% and yard/garden waste,
14%. Additionally, more than a quarter
(27.78%) of Municipal solid waste (MSW) is
recyclable – with plastic packaging accounting
for 38%; paper and cardboard for 31%; and
metals, glass, textile, leather, and rubber
account for the remaining 31%.
As of 2018, there are 52 open dumpsites and
16 controlled disposal facilities still operating
within the MBA alone. Majority (37) of the
existing open dumpsites are located in Region
3, largely in the provinces of Nueva Ecija and
Pampanga, while the remaining 15 are found in
Region 4A, mostly in the provinces of Laguna
and Cavite, where most of the controlled
disposal facilities also operate. Conversely,
there are no recorded open dumpsites and
controlled disposal facilities currently in
operation in National Capital Region (NCR)
Metro Manila.
There are 15 Sanitary Land Fills (SLFs) currently
in operation within the MBA, with nine located
in Region 4A, five in Region 3, and the
remaining one in National Capital Region
(NCR); and a total of 1,663 Material Recovery
Facilities (MRFs), serving a total of 948
barangays, currently operate within the Manila
Bay Area as of 2018.
RECLAMATION ACTIVITIES IN THE BAY
Pursuant to Presidential Decree (PD) No. 3-A
of January 11, 1973, the reclamation of areas
under water, whether foreshore or inland, shall
be limited to the National Government or any
person authorized by it under a proper
contract, notwithstanding the provisions of any
law to the contrary. Philippine Reclamation
Authority (PRA) is mandated to support these
activities by providing a window of opportunity
for a long lasting security of investment and
ownership of the reclaimed land as component
of a bigger project by ensuring that titles of
these properties will be properly secured to
the clear advantage of the government and
pursuant to existing laws, rules and regulations
As of 2018, land reclamation sites in Manila
Bay, include the 1,500 ha Boulevard 2000
Project in the 1990s and of much earlier post-
World War II land reclamation efforts (totaling
almost 1,000 ha in surface area and all located
16
west of Roxas Boulevard) are existing (with
most of the same already built-up and in active
use):
▪ Manila North Harbor Centre (MNHC) at
the City of Manila municipal waters area
(MWA) - 79.0 ha.;
▪ Port of Manila (Domestic or North
Harbor), including the Manila International
Container Terminal (MICT) at the City of
Manila MWA at Manila Bay/ mouth of the
Pasig River - approx. 130 ha;
▪ Cultural Center of the Philippines (CCP)
Island in Pasay City MWA at Manila Bay -
88 ha
▪ Central Business Park Island A [CBP-I(A)] in
Pasay City MWA - 200.0 hectares
▪ CBP-I(B & C) in Parañaque City MWA -
210 ha
▪ Central Business Park II in Parañaque City
MWA - 43 ha
▪ Asia World in Parañaque City MWARizal -
173 ha
Final Report: A Strategic Master Plan
▪ Las Piñas - Parañaque Critical Habitat and
Ecotourism Area (LPPCHEA) Island i.e.
Freedom and Long Islands - in Parañaque
City MWA - 175 ha
ISSUES AND CHALLENGES
Adverse effects of Physical Infrastructures
within Manila Bay Area (MBA)
Major environmental impacts of infrastructures
are the spatial effects of land use conversion.
Aside from the footprint of road and
infrastructure projects, biodiversity, roadkill,
habitat fragmentation, livelihoods of
communities dependent on agriculture or
fishing may be compromised.
Among the planned projects, the New Manila
International Airport which will have a footprint
of about 1,600 ha, will encroach on vast areas
of fishponds, the Clark Green City (CGC) which
will have a footprint of over 2,300 ha, will
encroach on some grasslands, and if approved
the Sangley International Airport would likely
encroach on some grasslands. Both the New
Manila International Airport and the Philippine
Sangley Airports plan to partially reclaim land
from Manila Bay for additional area. Both are
also at the seafront and are highly exposed to
storm surge and tsunami.
The impacts of infrastructure on freshwater
ecosystems can be profound, including
inundation of habitats, changes to flow and
sediment regimes, water quality impacts in
down-stream reaches, and interruption of fish
migration and connectivity in the river system.
The maintenance of freshwater ecosystem
quality and functioning may be compromised
during or may constrain the construction and
operation of infrastructure within the bay area.
Habitat Degradation and Biodiversity Loss
The Manila Bay ecosystem consists of multiple
habitats that are interconnected by material
and energy exchange, facilitated by the
biological components of the system and the
continuous water medium. Human activities
impact the ecosystem. Ecosystems are resilient
and can thus cope with human pressures to a
certain extent. If pressures are excessive,
ecosystems can be altered for the worse with
impact to the inherent value of organisms, e.g.
loss of biodiversity or endangered species,
and/or impact to human benefits, e.g. reduced
fish stocks or unhealthy bathing water.
Mangrove Ecosystem. Mangrove forests along
the Manila Bay are getting scarce and
fragmented that may be attributable to
overexploitation by coastal dwellers,
aquaculture, and conversion to agriculture, salt
ponds, industry and settlements. Reports state
that mangrove area in the beginning of the
20th century was as much as 54,000 ha. At
present, only about 1-4% of the original area
remains.
Coral Reefs. Sedimentation, overfishing, and
destructive fishing are the most common
factors significantly affecting coral reefs. Manila
Bay has experienced extreme pressure from
various agents of coral reef destruction, such
as overfishing, illegal fishing, and destructive
fishing, coupled with population expansion and
industrial/agricultural spin-offs.
Seagrass community. Almost 30 to 50% of
seagrass habitat has been lost. Although no
data on seagrass loss is available for Manila
Bay, it is expected that a significant percentage
of this habitat has been lost due to sediment
deposition and reclamation activities.
Mud Flats. The historic area of mud flats is not
known but must have been substantial in the
Pampanga flood plain and other river mouths.
However, consistent with mangroves, only a
small percentage of the original mud flats
remain at present. The loss of these mud flats
has significant ramifications to fish,
invertebrates and birds, both resident and
migratory.
Water Pollution Caused by Increasing
Population and Human Activities
The growth in population and industrialization
within the MBA has contributed to the
degradation of its water quality. Pollution from
households along the coastal zones and
waterways and urban areas are common
sources of organic as well as inorganic
pollutants in Manila Bay due to the absence of
sufficient solid waste management and sewage
management facilities. Pollution also comes
from other sources including surface runoff
from agricultural areas that carries nutrients,
and residues of chemical pesticides and
fertilizers. Sediments from soil erosion in
upstream areas where improper farming
practices and other erosive land use practices
also contributes to the pollution of waters in
Manila Bay and rivers feeding to the bay.
Frequency of oil spills and discharges from
ships and maritime activities at the Manila
Harbors is also a major pollution concern.
17
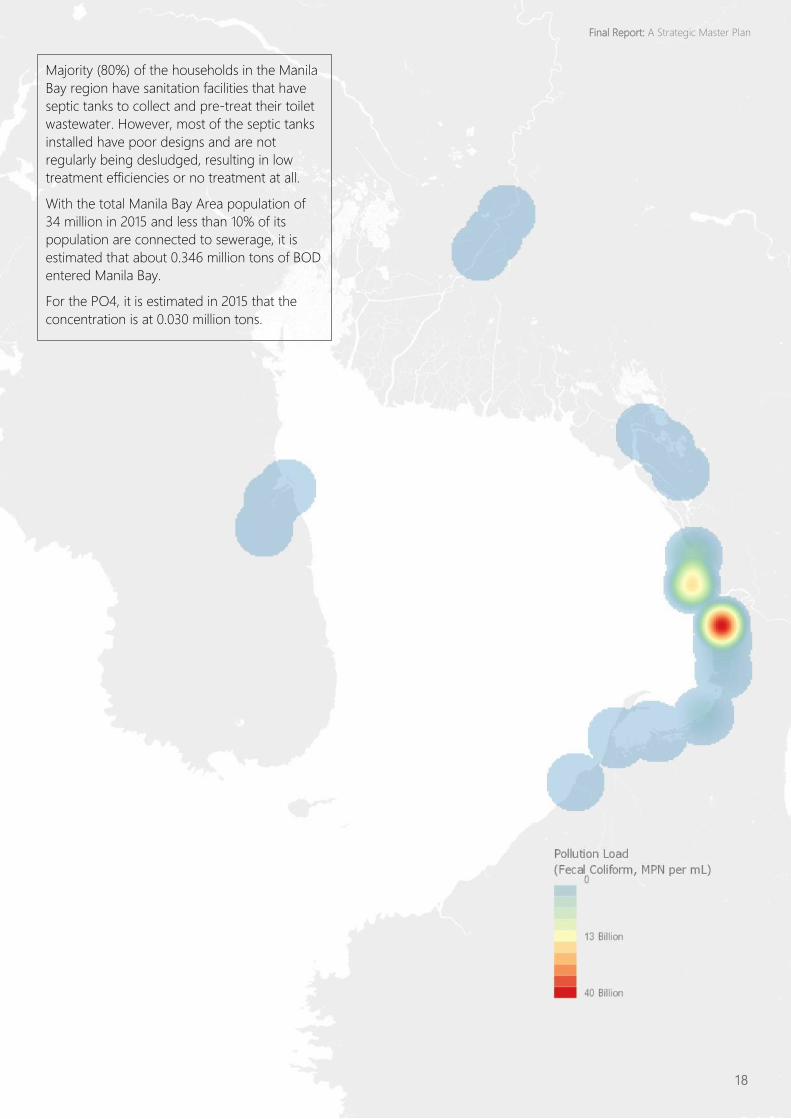
18
Majority (80%) of the households in the Manila
Bay region have sanitation facilities that have
septic tanks to collect and pre-treat their toilet
wastewater. However, most of the septic tanks
installed have poor designs and are not
regularly being desludged, resulting in low
treatment efficiencies or no treatment at all.
With the total Manila Bay Area population of
34 million in 2015 and less than 10% of its
population are connected to sewerage, it is
estimated that about 0.346 million tons of BOD
entered Manila Bay.
For the PO4, it is estimated in 2015 that the
concentration is at 0.030 million tons.
Final Report: A Strategic Master Plan
Increasing Sewage Generation
It is estimated that on the average 80% of total
domestic water consumption end up as
sewage. In the absence of sufficient
management facilities, significant proportion of
the sewage generated from the MBA is likely
to end up in Manila Bay.
Commercial and Industrial Wastewater
Wastewater from institutional, commercial and
industrial establishments is similar to domestic
wastewater. Unfortunately, at present, data on
the wastewater generated and discharged (in
terms of quality and volume) by these point
sources remain with the regional offices of the
Environmental Management Bureau (EMB) and
are not collated and analyzed in the central
office. It is thus difficult to have an overview of
the extent of the pollution load coming from
all these point sources within the Manila Bay
area. This is a gap that should be addressed.
Solid Wastes
It was estimated that in 2018 about 20,586 tons
per day of solid wastes are being generated
within MB Area and a projected increase to
32,558 tons per day (11.89 million tons per
year) by 2050. Pollution brought about by
inadequate solid waste management (SWM) is
a major contributor to the water quality of the
creeks, estero, rivers and the Manila Bay.
Domestic, commercial, and industrial activities
generate solid wastes (i.e., garbage) that enter
the Bay directly or via river and drainage
systems. Solid wastes can impair ecosystems
and habitats, deteriorate aesthetics, and pose
public health risks. They also aggravate the
flooding problem since they clog the
waterways and pumping stations rendering
them inoperable.
Flooding within the Manila Bay Area
The Manila Bay Area including water,
biodiversity, ecosystems, communities,
infrastructure, agriculture and fishery are
susceptible to climate change and several
other natural hazards.
Various hazards have been mapped that
include: flooding, landslide, storm surge, sea
level rise, tsunami, and earthquakes along with
risks associated with extreme rains and
temperature.
Coastal flooding in Manila Bay is due to the
combined effects of sea level rise, land
subsidence, tidal movements and discharge of
water from major river basins. It periodically
affects the coastal LGUs within Manila Bay.
Approximately 29,000 ha of built up areas in
coastal LGUs are low to very highly frequently
affected by floods of which 6,027 ha are highly
to very highly frequently affected by floods.
Continuing land subsidence of the coastal land
bordering the bay is worsening both flood and
high-tide inundation. Metro Manila’s coastal
areas are sinking as fast as 9 cm (3 ½ inches)
every year (Siringan 2006). The land is
subsiding, mainly because of excessive
groundwater withdrawal. Reclamation could
speed up the sinking of the land, from
withdrawal of groundwater, or from the added
weight of new buildings, or both (reference).
Other factors contributing to flooding in MBA
are: obstruction of stormflow in waterways and
drainage systems; poor solid waste
management causing of obstruction of
streamflow; unregulated expansion of built up
areas especially along the coastal and riverine
areas; reduced capacity of rivers to safely
conduct storm flows during heavy rains; loss of
or absence of forest cover and natural
vegetation.
19
Approximately 5 million people within the 31
coastal LGUs are exposed to floods based
on the 2015 population map from PSA and
flood hazard map of MGB.
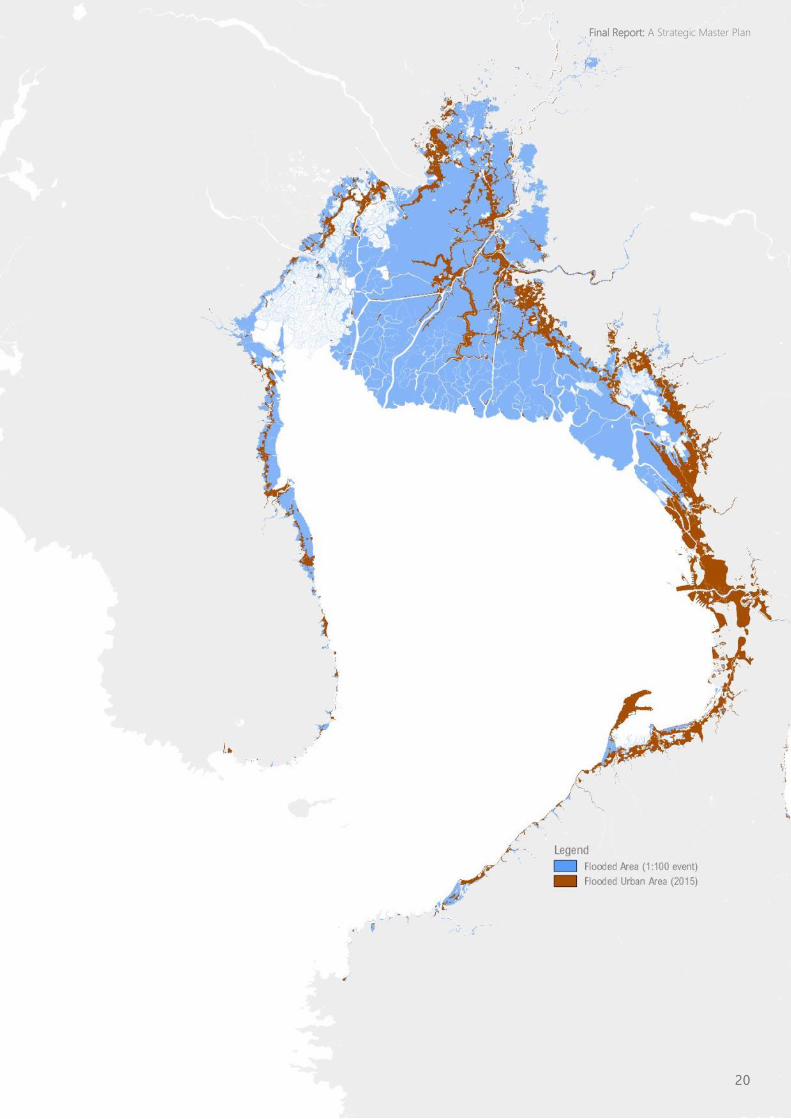
20
Final Report: A Strategic Master Plan
SOCIO-ECONOMIC SYSTEM
AND RESOURCES USE AND
CONSERVATION
DEMOGRAPHY
It is estimated that 23% or 23.21 million of the
100.98 million Philippine population are
crowding in Manila Bay Area (MBA) as of 2015.
Population density within the Manila Bay Area
ranges from the least dense of 23 persons per
square kilometer to the densest of 42
thousand per square kilometer. Within MBA
are cities and municipalities that are amongst
the most crowded in the world.
Age and Sex. MBA Population5 indicates a
relatively young population with 31%
belonging to the 0 to 14 years of age, or the
young dependents. The youth group,
belonging to age group 15 to 30 years old
make up 59%. The working age group (15-64
years old) comprise 65%. While 46% Filipinos
are at the prime working age of 25 to 64 years.
Senior citizens make up 6% of the total
population. The overall dependency ratio in
the Manila Bay Area (MBA) , which is the
number of persons below 15 years old (young
dependents), and those over 65 years old (old
dependents) with respect to the working age
group is 54%. The male population comprise
49.7% while females make up 50.3% of the
total population. Life expectancy at birth for
females is 71.64 years which is 5.53 years
longer than males whose life expectancy at
birth is estimated at 66.11 years
Ethnicity. Majority of the residents in the MBA
are Tagalog which is the largest cultural-
linguistic group in the country. It forms the
dominant population of NCR, and all provinces
bordering Manila Bay, except Pampanga. The
other ethnicities are Kapampangan (7.94%),
that are mostly in Region 3, Bisaya/Binisaya
(7.42%), Ilocano (6.25%), Bikolano (5.42%),
Waray (2.45%), Caviteno (2.17%), Hiligaynon/
Ilonggo (2.03%), and other smaller ethnic
groups comprising a total of 6.43%. About
0.13% are of foreign ethnicity.
Certificate of Ancestral Domain Title (CADT)
refers to a title formally recognizing the rights
of possession and ownership of Indigenous
Cultural Communities (ICCs) / Indigenous
Peoples (IPs) over their ancestral domains
identified and delineated in accordance with
this law. Major Ancestral Lands identified and
listed by the National Commission on
Indigenous Peoples (NCIP), as of March 2018 in
MBA are located in: Floridablance and Porac in
Pampanga; Bamban, Tarlac; Trinidad and San
Jose Del Monte in Bulacan; Tanay, Rizal;
General Nakar, Quezon Province; General
Tinio, Nueva Ecija; Botolan, Zambales.
Settlements. The number of occupied housing
units in the NCR had been consistently more
than those in Regions III and IV-A from 1990 to
2015. In 2015, occupied housing units in the
NCR accounted for about 39% of the total in
the MBA. It is notable that the NCR’s
proportionate share of occupied housing units
in the MBA had been reduced from more than
48% in 1990. This implies a dispersal of growth
to Regions III and IV-A contributing to the
NCR’s urban sprawl. The number of occupied
housing units in the MBA had been increasing
at a rate of about 3.8% per annum from 1990
to 2015. Region IV-A had the fastest growth
rate at about 6.1% while that of Region III was
estimated at 3.3%. These two regions grew
faster than NCR’s 2.9% in the same period
which accounted for the reduced share of the
latter in terms of total occupied housing units
in the MBA.
ECONOMY
Manila Bay Area (MBA) posted consistent
growth from 2015 to 2017, with NCR leading at
Php2.77 trillion in 2015 to Php3.16 trillion in
2017. Region 4A comes in second with Php1.30
trillion in 2015 to Php1.456 trillion in 2017.
Region 3, also known as the country’s rice
granary, contributed Php704 billion in 2015
which grew to Php844 billion in 2017. Among
the three regions, Region 3 has the fastest
economic growth rate at 9.3% in 2017.
Income Class and Internal Revenue Allotment
(IRA) Dependence. The MBA area comprises of
192 city and municipal LGUs, and 11 provinces
from NCR, Region 3 and Region 4A. Of these,
51% have an income classification of 1st class
(over Php30 million average annual income for
cities and provinces, over Php15million pesos
for municipalities).
There are 5% with the 5th income classification
(Php5million to 10million annual income for
cities and provinces, Php1 million to Php3
million annual income for municipalities). There
are no LGUs with the a 6th income
classification. The Cities of Manila and Quezon
21
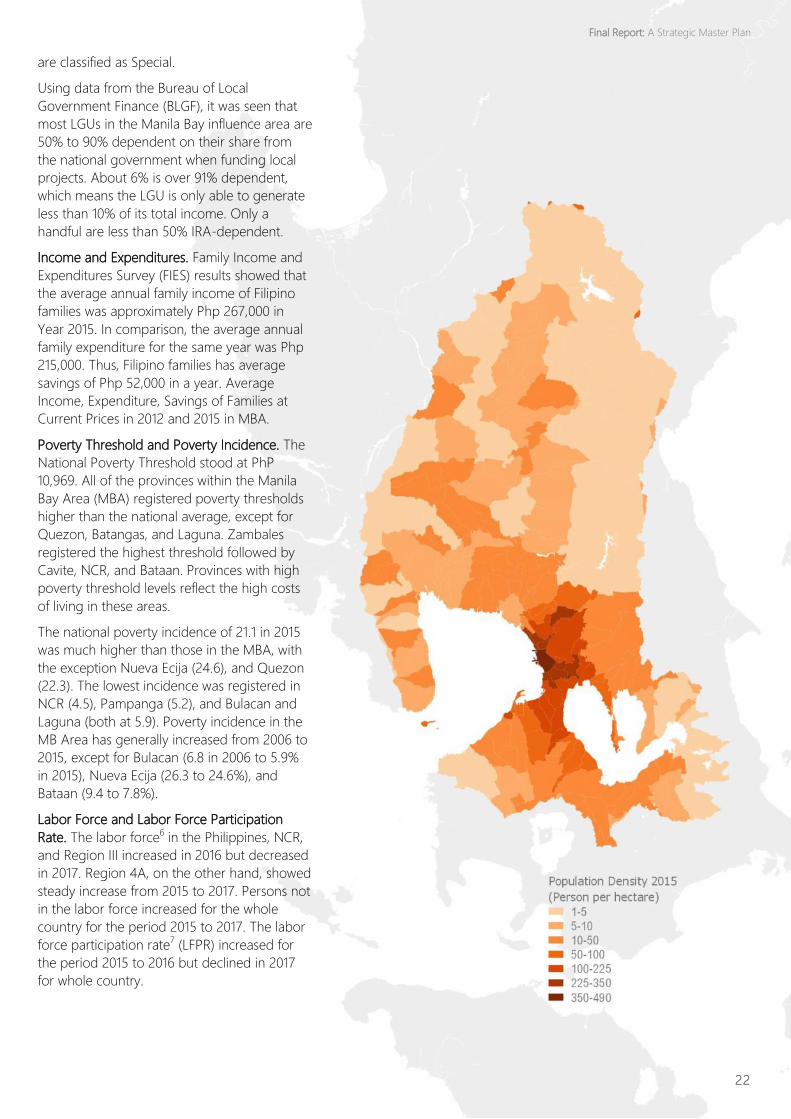
are classified as Special.
Using data from the Bureau of Local
Government Finance (BLGF), it was seen that
most LGUs in the Manila Bay influence area are
50% to 90% dependent on their share from
the national government when funding local
projects. About 6% is over 91% dependent,
which means the LGU is only able to generate
less than 10% of its total income. Only a
handful are less than 50% IRA-dependent.
Income and Expenditures. Family Income and
Expenditures Survey (FIES) results showed that
the average annual family income of Filipino
families was approximately Php 267,000 in
Year 2015. In comparison, the average annual
family expenditure for the same year was Php
215,000. Thus, Filipino families has average
savings of Php 52,000 in a year. Average
Income, Expenditure, Savings of Families at
Current Prices in 2012 and 2015 in MBA.
Poverty Threshold and Poverty Incidence. The
National Poverty Threshold stood at PhP
10,969. All of the provinces within the Manila
Bay Area (MBA) registered poverty thresholds
higher than the national average, except for
Quezon, Batangas, and Laguna. Zambales
registered the highest threshold followed by
Cavite, NCR, and Bataan. Provinces with high
poverty threshold levels reflect the high costs
of living in these areas.
The national poverty incidence of 21.1 in 2015
was much higher than those in the MBA, with
the exception Nueva Ecija (24.6), and Quezon
(22.3). The lowest incidence was registered in
NCR (4.5), Pampanga (5.2), and Bulacan and
Laguna (both at 5.9). Poverty incidence in the
MB Area has generally increased from 2006 to
2015, except for Bulacan (6.8 in 2006 to 5.9%
in 2015), Nueva Ecija (26.3 to 24.6%), and
Bataan (9.4 to 7.8%).
Labor Force and Labor Force Participation
Rate. The labor force6 in the Philippines, NCR,
and Region III increased in 2016 but decreased
in 2017. Region 4A, on the other hand, showed
steady increase from 2015 to 2017. Persons not
in the labor force increased for the whole
country for the period 2015 to 2017. The labor
force participation rate7 (LFPR) increased for
the period 2015 to 2016 but declined in 2017
for whole country.
22
Final Report: A Strategic Master Plan
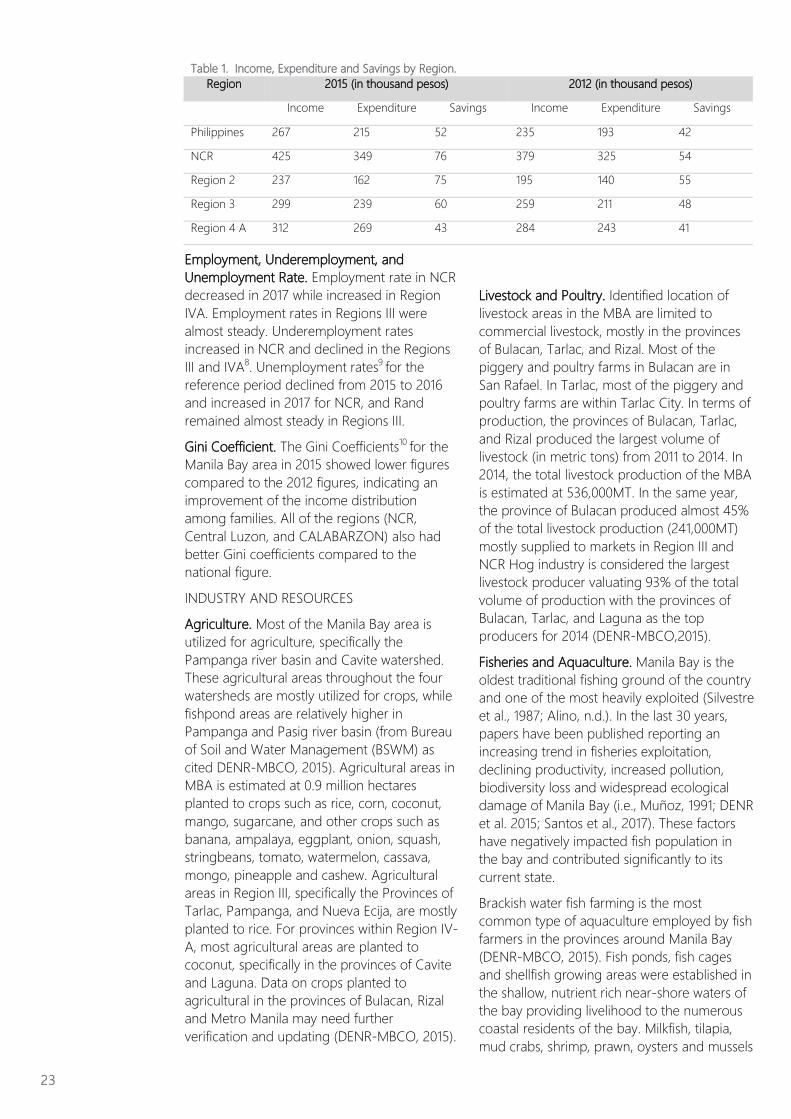
Employment, Underemployment, and
Unemployment Rate. Employment rate in NCR
decreased in 2017 while increased in Region
IVA. Employment rates in Regions III were
almost steady. Underemployment rates
increased in NCR and declined in the Regions
III and IVA8. Unemployment rates9 for the
reference period declined from 2015 to 2016
and increased in 2017 for NCR, and Rand
remained almost steady in Regions III.
Gini Coefficient. The Gini Coefficients10 for the
Manila Bay area in 2015 showed lower figures
compared to the 2012 figures, indicating an
improvement of the income distribution
among families. All of the regions (NCR,
Central Luzon, and CALABARZON) also had
better Gini coefficients compared to the
national figure.
INDUSTRY AND RESOURCES
Agriculture. Most of the Manila Bay area is
utilized for agriculture, specifically the
Pampanga river basin and Cavite watershed.
These agricultural areas throughout the four
watersheds are mostly utilized for crops, while
fishpond areas are relatively higher in
Pampanga and Pasig river basin (from Bureau
of Soil and Water Management (BSWM) as
cited DENR-MBCO, 2015). Agricultural areas in
MBA is estimated at 0.9 million hectares
planted to crops such as rice, corn, coconut,
mango, sugarcane, and other crops such as
banana, ampalaya, eggplant, onion, squash,
stringbeans, tomato, watermelon, cassava,
mongo, pineapple and cashew. Agricultural
areas in Region III, specifically the Provinces of
Tarlac, Pampanga, and Nueva Ecija, are mostly
planted to rice. For provinces within Region IV-
A, most agricultural areas are planted to
coconut, specifically in the provinces of Cavite
and Laguna. Data on crops planted to
agricultural in the provinces of Bulacan, Rizal
and Metro Manila may need further
verification and updating (DENR-MBCO, 2015).
Livestock and Poultry. Identified location of
livestock areas in the MBA are limited to
commercial livestock, mostly in the provinces
of Bulacan, Tarlac, and Rizal. Most of the
piggery and poultry farms in Bulacan are in
San Rafael. In Tarlac, most of the piggery and
poultry farms are within Tarlac City. In terms of
production, the provinces of Bulacan, Tarlac,
and Rizal produced the largest volume of
livestock (in metric tons) from 2011 to 2014. In
2014, the total livestock production of the MBA
is estimated at 536,000MT. In the same year,
the province of Bulacan produced almost 45%
of the total livestock production (241,000MT)
mostly supplied to markets in Region III and
NCR Hog industry is considered the largest
livestock producer valuating 93% of the total
volume of production with the provinces of
Bulacan, Tarlac, and Laguna as the top
producers for 2014 (DENR-MBCO,2015).
Fisheries and Aquaculture. Manila Bay is the
oldest traditional fishing ground of the country
and one of the most heavily exploited (Silvestre
et al., 1987; Alino, n.d.). In the last 30 years,
papers have been published reporting an
increasing trend in fisheries exploitation,
declining productivity, increased pollution,
biodiversity loss and widespread ecological
damage of Manila Bay (i.e., Muñoz, 1991; DENR
et al. 2015; Santos et al., 2017). These factors
have negatively impacted fish population in
the bay and contributed significantly to its
current state.
Brackish water fish farming is the most
common type of aquaculture employed by fish
farmers in the provinces around Manila Bay
(DENR-MBCO, 2015). Fish ponds, fish cages
and shellfish growing areas were established in
the shallow, nutrient rich near-shore waters of
the bay providing livelihood to the numerous
coastal residents of the bay. Milkfish, tilapia,
mud crabs, shrimp, prawn, oysters and mussels
23
Table 1. Income, Expenditure and Savings by Region.
Region 2015 (in thousand pesos) 2012 (in thousand pesos)
Income Expenditure Savings Income Expenditure Savings
Philippines 267 215 52 235 193 42
NCR 425 349 76 379 325 54
Region 2 237 162 75 195 140 55
Region 3 299 239 60 259 211 48
Region 4 A 312 269 43 284 243 41
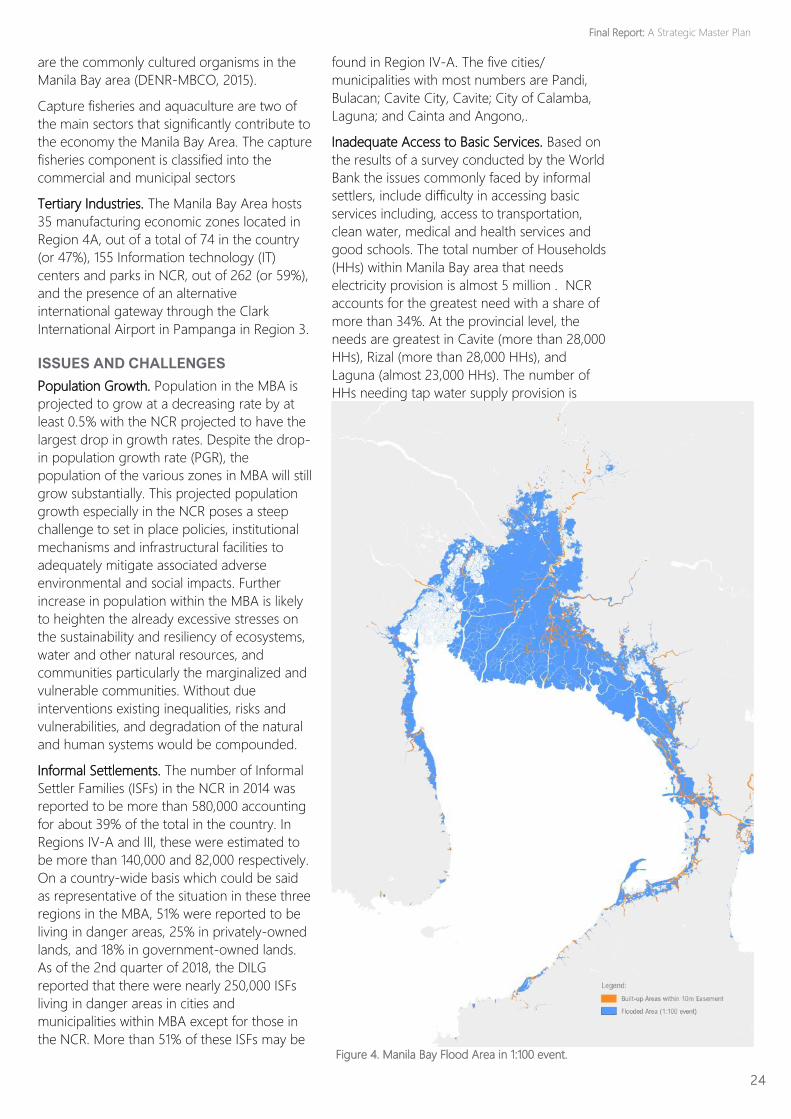
are the commonly cultured organisms in the
Manila Bay area (DENR-MBCO, 2015).
Capture fisheries and aquaculture are two of
the main sectors that significantly contribute to
the economy the Manila Bay Area. The capture
fisheries component is classified into the
commercial and municipal sectors
Tertiary Industries. The Manila Bay Area hosts
35 manufacturing economic zones located in
Region 4A, out of a total of 74 in the country
(or 47%), 155 Information technology (IT)
centers and parks in NCR, out of 262 (or 59%),
and the presence of an alternative
international gateway through the Clark
International Airport in Pampanga in Region 3.
ISSUES AND CHALLENGES
Population Growth. Population in the MBA is
projected to grow at a decreasing rate by at
least 0.5% with the NCR projected to have the
largest drop in growth rates. Despite the drop-
in population growth rate (PGR), the
population of the various zones in MBA will still
grow substantially. This projected population
growth especially in the NCR poses a steep
challenge to set in place policies, institutional
mechanisms and infrastructural facilities to
adequately mitigate associated adverse
environmental and social impacts. Further
increase in population within the MBA is likely
to heighten the already excessive stresses on
the sustainability and resiliency of ecosystems,
water and other natural resources, and
communities particularly the marginalized and
vulnerable communities. Without due
interventions existing inequalities, risks and
vulnerabilities, and degradation of the natural
and human systems would be compounded.
Informal Settlements. The number of Informal
Settler Families (ISFs) in the NCR in 2014 was
reported to be more than 580,000 accounting
for about 39% of the total in the country. In
Regions IV-A and III, these were estimated to
be more than 140,000 and 82,000 respectively.
On a country-wide basis which could be said
as representative of the situation in these three
regions in the MBA, 51% were reported to be
living in danger areas, 25% in privately-owned
lands, and 18% in government-owned lands.
As of the 2nd quarter of 2018, the DILG
reported that there were nearly 250,000 ISFs
living in danger areas in cities and
municipalities within MBA except for those in
the NCR. More than 51% of these ISFs may be
found in Region IV-A. The five cities/
municipalities with most numbers are Pandi,
Bulacan; Cavite City, Cavite; City of Calamba,
Laguna; and Cainta and Angono,.
Inadequate Access to Basic Services. Based on
the results of a survey conducted by the World
Bank the issues commonly faced by informal
settlers, include difficulty in accessing basic
services including, access to transportation,
clean water, medical and health services and
good schools. The total number of Households
(HHs) within Manila Bay area that needs
electricity provision is almost 5 million . NCR
accounts for the greatest need with a share of
more than 34%. At the provincial level, the
needs are greatest in Cavite (more than 28,000
HHs), Rizal (more than 28,000 HHs), and
Laguna (almost 23,000 HHs). The number of
HHs needing tap water supply provision is
24
Figure 4. Manila Bay Flood Area in 1:100 event.
Final Report: A Strategic Master Plan
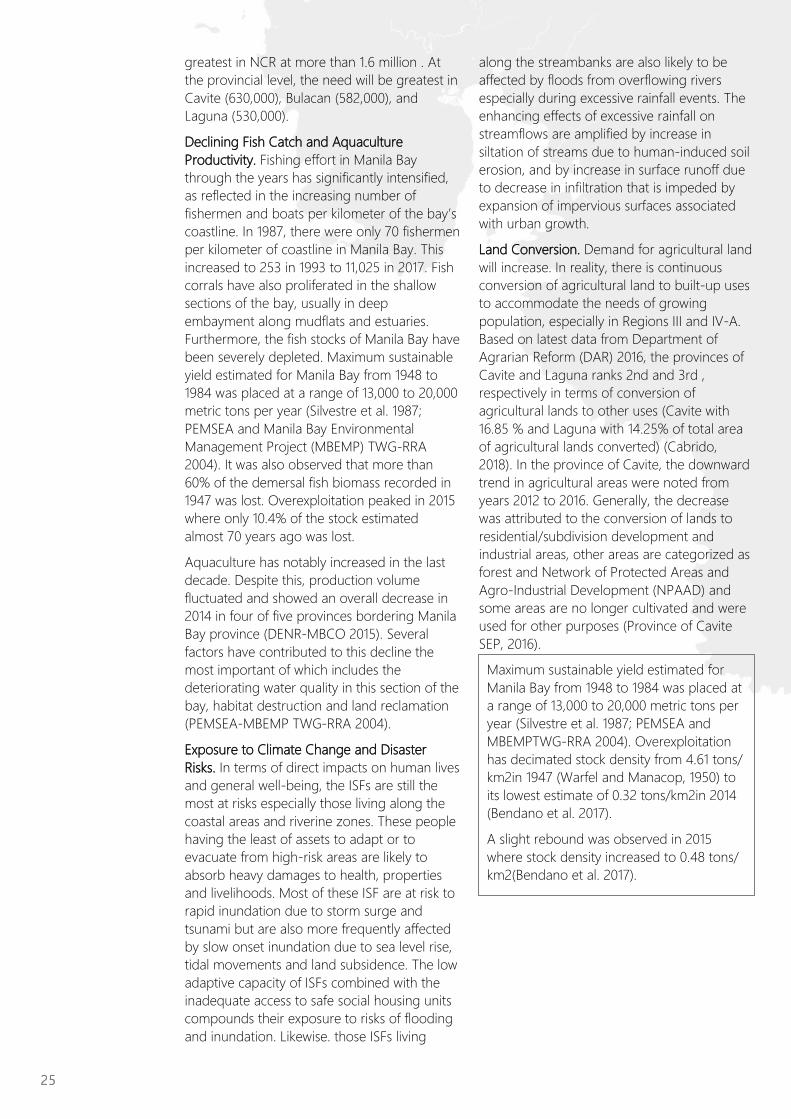
greatest in NCR at more than 1.6 million . At
the provincial level, the need will be greatest in
Cavite (630,000), Bulacan (582,000), and
Laguna (530,000).
Declining Fish Catch and Aquaculture
Productivity. Fishing effort in Manila Bay
through the years has significantly intensified,
as reflected in the increasing number of
fishermen and boats per kilometer of the bay’s
coastline. In 1987, there were only 70 fishermen
per kilometer of coastline in Manila Bay. This
increased to 253 in 1993 to 11,025 in 2017. Fish
corrals have also proliferated in the shallow
sections of the bay, usually in deep
embayment along mudflats and estuaries.
Furthermore, the fish stocks of Manila Bay have
been severely depleted. Maximum sustainable
yield estimated for Manila Bay from 1948 to
1984 was placed at a range of 13,000 to 20,000
metric tons per year (Silvestre et al. 1987;
PEMSEA and Manila Bay Environmental
Management Project (MBEMP) TWG-RRA
2004). It was also observed that more than
60% of the demersal fish biomass recorded in
1947 was lost. Overexploitation peaked in 2015
where only 10.4% of the stock estimated
almost 70 years ago was lost.
Aquaculture has notably increased in the last
decade. Despite this, production volume
fluctuated and showed an overall decrease in
2014 in four of five provinces bordering Manila
Bay province (DENR-MBCO 2015). Several
factors have contributed to this decline the
most important of which includes the
deteriorating water quality in this section of the
bay, habitat destruction and land reclamation
(PEMSEA-MBEMP TWG-RRA 2004).
Exposure to Climate Change and Disaster
Risks. In terms of direct impacts on human lives
and general well-being, the ISFs are still the
most at risks especially those living along the
coastal areas and riverine zones. These people
having the least of assets to adapt or to
evacuate from high-risk areas are likely to
absorb heavy damages to health, properties
and livelihoods. Most of these ISF are at risk to
rapid inundation due to storm surge and
tsunami but are also more frequently affected
by slow onset inundation due to sea level rise,
tidal movements and land subsidence. The low
adaptive capacity of ISFs combined with the
inadequate access to safe social housing units
compounds their exposure to risks of flooding
and inundation. Likewise. those ISFs living
along the streambanks are also likely to be
affected by floods from overflowing rivers
especially during excessive rainfall events. The
enhancing effects of excessive rainfall on
streamflows are amplified by increase in
siltation of streams due to human-induced soil
erosion, and by increase in surface runoff due
to decrease in infiltration that is impeded by
expansion of impervious surfaces associated
with urban growth.
Land Conversion. Demand for agricultural land
will increase. In reality, there is continuous
conversion of agricultural land to built-up uses
to accommodate the needs of growing
population, especially in Regions III and IV-A.
Based on latest data from Department of
Agrarian Reform (DAR) 2016, the provinces of
Cavite and Laguna ranks 2nd and 3rd ,
respectively in terms of conversion of
agricultural lands to other uses (Cavite with
16.85 % and Laguna with 14.25% of total area
of agricultural lands converted) (Cabrido,
2018). In the province of Cavite, the downward
trend in agricultural areas were noted from
years 2012 to 2016. Generally, the decrease
was attributed to the conversion of lands to
residential/subdivision development and
industrial areas, other areas are categorized as
forest and Network of Protected Areas and
Agro-Industrial Development (NPAAD) and
some areas are no longer cultivated and were
used for other purposes (Province of Cavite
SEP, 2016).
25
Maximum sustainable yield estimated for
Manila Bay from 1948 to 1984 was placed at
a range of 13,000 to 20,000 metric tons per
year (Silvestre et al. 1987; PEMSEA and
MBEMPTWG-RRA 2004). Overexploitation
has decimated stock density from 4.61 tons/
km2in 1947 (Warfel and Manacop, 1950) to
its lowest estimate of 0.32 tons/km2in 2014
(Bendano et al. 2017).
A slight rebound was observed in 2015
where stock density increased to 0.48 tons/
km2(Bendano et al. 2017).
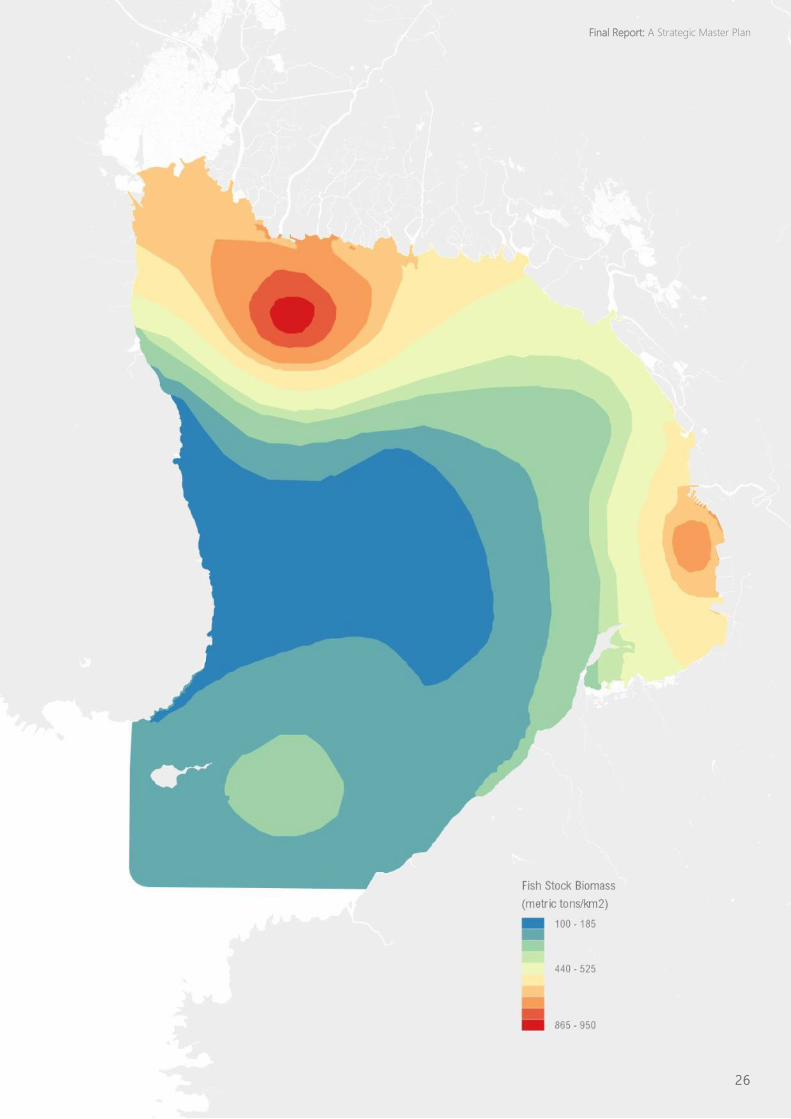
26
Final Report: A Strategic Master Plan
ADMINISTRATIVE AND
INSTITUTIONAL SYSTEM
GOVERNMENT INSTITUTION
Mandamus Agencies
The Mandamus Agencies are mandated by the
Supreme Court to clean up, rehabilitate and
preserve Manila Bay, and restore its waters to
SB level that is fit for swimming, skin-diving,
and other forms of contact recreation. There
are also Government Agencies directly and
indirectly involved and affected by Manila Bay
Developments but are not Mandamus Agency.
The Manila Bay Coordinating Office (MBCO)
To institutionalize the efforts of rehabilitating
Manila Bay, DENR established the Manila Bay
Coordinating Office (MBCO) which will focus
on the vast coordination works needed to
comply to the Continuing Mandamus of the
Supreme Court.
Manila Bay Task Force
By Administrative Order 16 (AO 16) dated Feb-
ruary 19, 2019, President Rodrigo R. Duterte
created the Manila Bay Task Force and tasked
it to expedite the writ of the Mandamus and
other regulations already in place in order to
rehabilitate Manila Bay. The Task force is
chaired by DENR and vice-chaired by DILG
and DOT. The other members are DPWH,
DOH, DA, HUDCC, MMDA, PRRC, LWUA,
MWSS, PNP-MG, PCG, PPA, Manila Water and
Maynilad.
Legislative Body
In the House of Senate, the Committee on En-
vironment and Natural Resources is focused
on bills related to ecology, climate change and
related issues. At the House of Representatives,
the Committee on Ecology looks into issues
and possible bills on environment and natural
resources.
Regional Development Councils (RDCs)
The Regional Development Council (RDC) is
the highest policy-making body in the region.
It is the primary institution that coordinates
and sets the direction of all economic and so-
cial development efforts in the region. The Ma-
nila Bay Area covers four (4) regions namely
the National Capital Region (NCR), Region II,
Region III, and Region IV-A.
Local Government Units (PLGUS, CLGUS, AND
MLGUS)
Four (4) regions are within the MBA, namely
the National Capital Region (NCR), Region II,
Region III, and Region IV-A. The administrative
boundaries of the MBA are as follows: 14 Prov-
inces, and 203 Municipalities and Cities.
The League of LGUs
There are three (3) official and registered
leagues of LGUs: The League of Cities, The
League of Municipalities and the League of
Provinces. Membership is not by person but by
government entity.
Each of these are registered as a private entity
and their sources of funds are coming from
member contributions (allowed by the Com-
mission on Audit (COA)), fund raising events
and donor-sponsored programs and projects
implemented thru the Leagues.
LGU Alliances
Aside from the Leagues, LGUs at the frontline
also collaborate and form formal alliances
along Manila Bay: The alliance of Bulacan and
Pampanga LGUs (ABB BP), of Cavite-Bataan-
Zambales (CABATALES) and Caloocan, Mala-
bon, Navotas, Valenzuela (CAMANAVA)
including Quezon City. These serve as struc-
tures for developing common advocacies, cre-
ating the audience for their cause, and provid-
ing a wider venue for participation of different
sectors.
Mandamus Agencies
The 13 mandamus agencies are:
▪ Department of Environment and Natural
Resources (DENR)
▪ Department of Agriculture (DA) - Bureau
of Fisheries and Aquatic Resources (BFAR)
▪ Department of Education (DepEd)
▪ Department of Health (DOH)
▪ Department of Public Works and
Highways (DPWH)
▪ Department of Budget and Management
(DBM)
▪ Department of the Interior and Local
Government (DILG)
▪ Metro Manila Development Authority
(MMDA)
▪ Metropolitan Waterworks and Sewerage
27
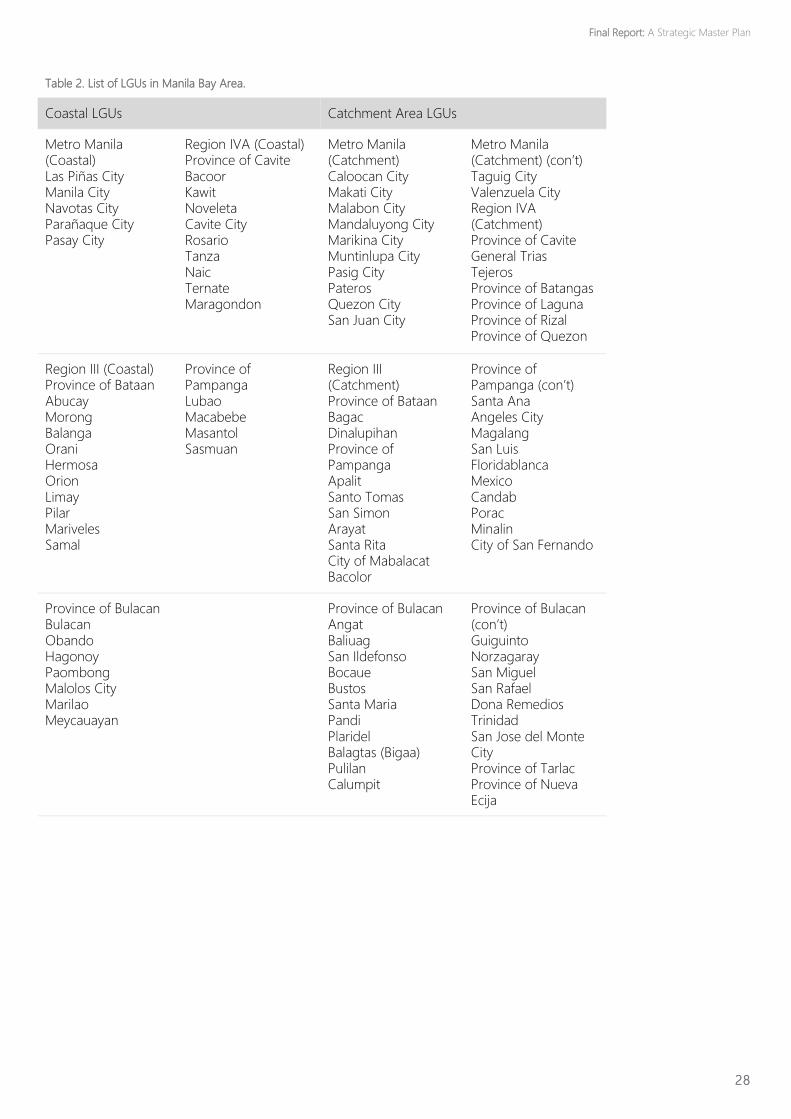
28
Table 2. List of LGUs in Manila Bay Area.
Coastal LGUs Catchment Area LGUs
Metro Manila (Coastal) Las Piñas City Manila City Navotas City Parañaque City Pasay City
Region IVA (Coastal) Province of Cavite Bacoor Kawit Noveleta Cavite City Rosario Tanza Naic Ternate Maragondon
Metro Manila (Catchment) Caloocan City Makati City Malabon City Mandaluyong City Marikina City Muntinlupa City Pasig City Pateros Quezon City San Juan City
Metro Manila (Catchment) (con’t) Taguig City Valenzuela City Region IVA (Catchment) Province of Cavite General Trias Tejeros Province of Batangas Province of Laguna Province of Rizal Province of Quezon
Region III (Coastal) Province of Bataan Abucay Morong Balanga Orani Hermosa Orion Limay Pilar Mariveles Samal
Province of Pampanga Lubao Macabebe Masantol Sasmuan
Region III (Catchment) Province of Bataan Bagac Dinalupihan Province of Pampanga Apalit Santo Tomas San Simon Arayat Santa Rita City of Mabalacat Bacolor
Province of Pampanga (con’t) Santa Ana Angeles City Magalang San Luis Floridablanca Mexico Candab Porac Minalin City of San Fernando
Province of Bulacan Bulacan Obando Hagonoy Paombong Malolos City Marilao Meycauayan
Province of Bulacan Angat Baliuag San Ildefonso Bocaue Bustos Santa Maria Pandi Plaridel Balagtas (Bigaa) Pulilan Calumpit
Province of Bulacan (con’t) Guiguinto Norzagaray San Miguel San Rafael Dona Remedios Trinidad San Jose del Monte City Province of Tarlac Province of Nueva Ecija
Final Report: A Strategic Master Plan
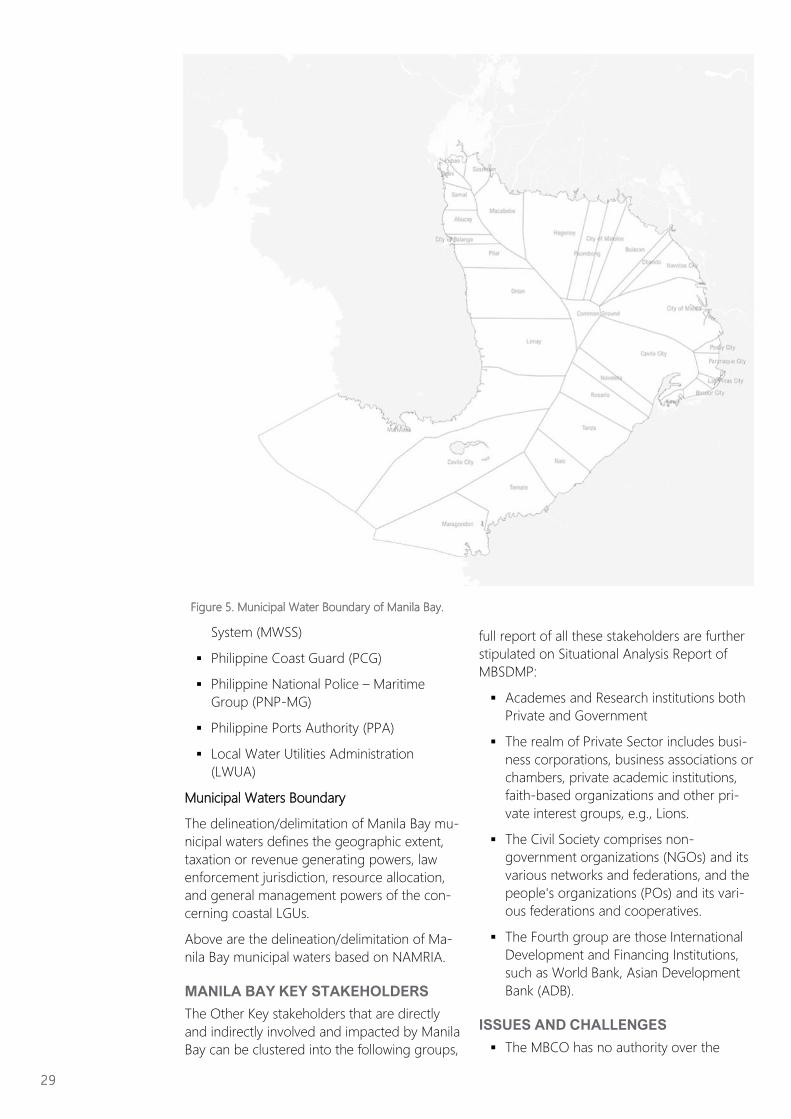
System (MWSS)
▪ Philippine Coast Guard (PCG)
▪ Philippine National Police – Maritime
Group (PNP-MG)
▪ Philippine Ports Authority (PPA)
▪ Local Water Utilities Administration
(LWUA)
Municipal Waters Boundary
The delineation/delimitation of Manila Bay mu-
nicipal waters defines the geographic extent,
taxation or revenue generating powers, law
enforcement jurisdiction, resource allocation,
and general management powers of the con-
cerning coastal LGUs.
Above are the delineation/delimitation of Ma-
nila Bay municipal waters based on NAMRIA.
MANILA BAY KEY STAKEHOLDERS
The Other Key stakeholders that are directly
and indirectly involved and impacted by Manila
Bay can be clustered into the following groups,
full report of all these stakeholders are further
stipulated on Situational Analysis Report of
MBSDMP:
▪ Academes and Research institutions both
Private and Government
▪ The realm of Private Sector includes busi-
ness corporations, business associations or
chambers, private academic institutions,
faith-based organizations and other pri-
vate interest groups, e.g., Lions.
▪ The Civil Society comprises non-
government organizations (NGOs) and its
various networks and federations, and the
people's organizations (POs) and its vari-
ous federations and cooperatives.
▪ The Fourth group are those International
Development and Financing Institutions,
such as World Bank, Asian Development
Bank (ADB).
ISSUES AND CHALLENGES
▪ The MBCO has no authority over the
29
Figure 5. Municipal Water Boundary of Manila Bay.
mandamus agencies to compel submis-
sion of reports and to have them account
for the progress of targets in the Imple-
mentation Plan of the OPMBCS. The Of-
fice are also not officially included in the
RDCs where they could actively advocate
for Manila Bay and provide information
relevant to Manila Bay and its surrounding
tributaries. They are likewise not officially
engaged and consulted in matters per-
taining to approval of businesses and
structures in the Manila Bay areas.
▪ There are accomplishments from different
LGUs, but they are not known, shared and
acknowledged by key NGAs and other
LGUs
▪ LGUs are not fully cognizant of the Writ of
Mandamus and the specific roles of the 13
agencies identified by the Supreme Court
order. They deal with NGAs based on
what they know of their mandates and
projects, but they are able to maximize or
tap into the specific role of certain manda-
mus agencies.
▪ Apart from numerous reports that must
be submitted to different national agen-
cies, the LGUs are also tasked to imple-
ment national programs on the environ-
ment, disaster mitigation, etc., from differ-
ent agencies as well.
▪ At the local level, the venue for integration
is at the Regional Development Council
(RDC) and the Provincial Government.
PAPs integration and coordination at
these levels however are also dependent
on several key factors: the competencies
of elected officials, regional heads of na-
tional agencies and leaders of sectoral
representatives who are members of the
council, degree of political influence and
partisanship within the council and level of
participation and engagement of civil soci-
ety representatives in the council.
▪ At the provincial level, political partisan-
ship and strategic competencies of elected
and appointed leaders in the provincial
government determine the degree of
PAPs integration and inter-LGU collabora-
tion, including the sharing of resources
from the NGAs.
▪ Resource and capacity limitations prevent
the LGUs from implementing sustainable
development plans and programs, espe-
cially at the municipal levels. While the
Local Government Code specified the im-
portance of local environment office, such
is not a mandated office.
▪ The Regional Development Councils play
a vital role in local integration of plans and
programs. But Manila Bay sustainable de-
velopment is not a top of mind priority
among so many other concerns and
plans. The representation of MBCO is like-
wise not mandatory; they can be called if
the governing elected leaders are keen on
Manila bay development. Advocacy in this
venue about Manila Bay is not felt by
LGUs.
▪ Political rivalry, clan-oriented practices and
special favors granted friends and interest-
ed parties affect how LGUs, especially the
heads of environment office and planning
office, implement policies and programs.
▪ LGUs consider themselves capable of im-
plementing programs and projects related
to ecological protection and climate
change. However, limitation in structural
and technological support is badly needed
▪ National agencies and appointed heads of
offices of LGUs however observe that the
ability of the LGUs, esp., at the municipal
level, is highly dependent on the strategic
competencies of the locally elected lead-
ers. Even without the technical know-how
on environment and sustainable develop-
ment, the political determination of a
Mayor to pursue environment agenda and
to source out technical and resources sup-
port differentiates the more progressive
LGUs than those that are highly reliant on
external assistance either from NGAs, the
province and donors.
▪ The leagues of LGUs are not tapped by
both the local and national leaders
(elected and appointed) and agencies as
another institution that can push for Ma-
nila Bay sustainable development. When
asked about efforts to develop Manila Bay,
both leagues of municipalities and cities
are not aware of such efforts from the
chapters of the leagues (municipalities)
and its members.
▪ Issue on sustainability and continuity of
programs is a concern for both LGU
league and alliances as both are subject to
changes based on the terms of office of
30
Final Report: A Strategic Master Plan
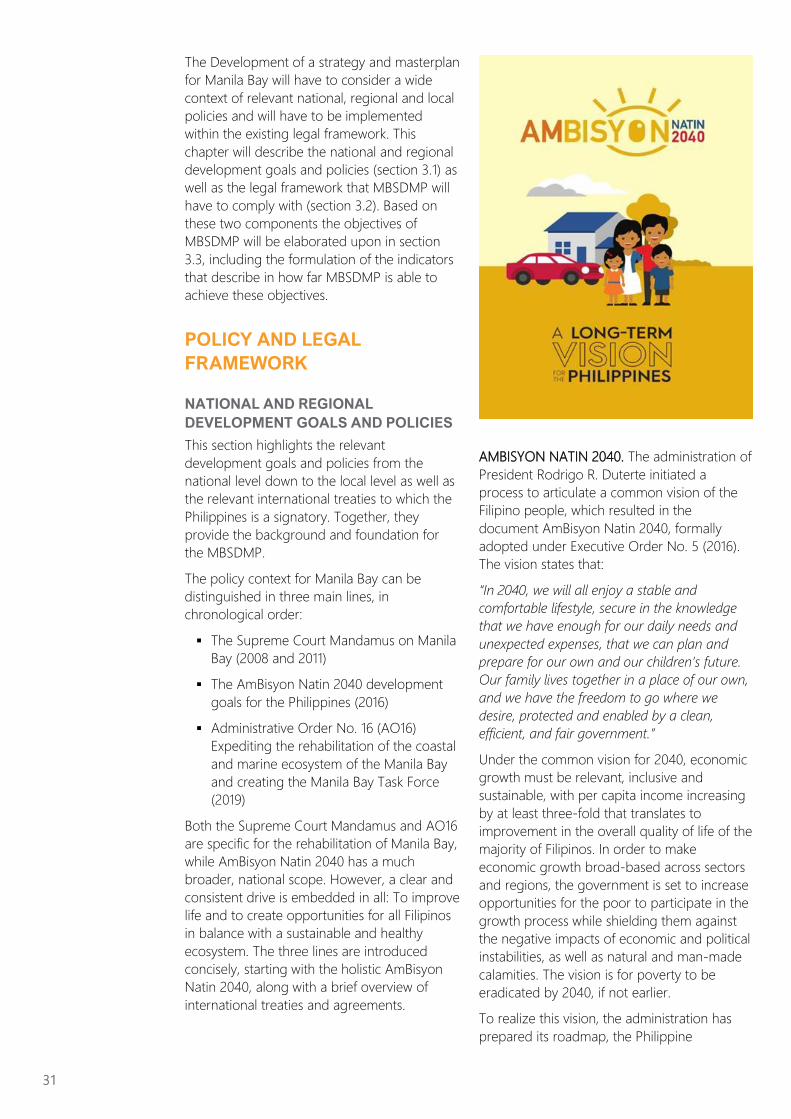
The Development of a strategy and masterplan
for Manila Bay will have to consider a wide
context of relevant national, regional and local
policies and will have to be implemented
within the existing legal framework. This
chapter will describe the national and regional
development goals and policies (section 3.1) as
well as the legal framework that MBSDMP will
have to comply with (section 3.2). Based on
these two components the objectives of
MBSDMP will be elaborated upon in section
3.3, including the formulation of the indicators
that describe in how far MBSDMP is able to
achieve these objectives.
POLICY AND LEGAL
FRAMEWORK
NATIONAL AND REGIONAL
DEVELOPMENT GOALS AND POLICIES
This section highlights the relevant
development goals and policies from the
national level down to the local level as well as
the relevant international treaties to which the
Philippines is a signatory. Together, they
provide the background and foundation for
the MBSDMP.
The policy context for Manila Bay can be
distinguished in three main lines, in
chronological order:
▪ The Supreme Court Mandamus on Manila
Bay (2008 and 2011)
▪ The AmBisyon Natin 2040 development
goals for the Philippines (2016)
▪ Administrative Order No. 16 (AO16)
Expediting the rehabilitation of the coastal
and marine ecosystem of the Manila Bay
and creating the Manila Bay Task Force
(2019)
Both the Supreme Court Mandamus and AO16
are specific for the rehabilitation of Manila Bay,
while AmBisyon Natin 2040 has a much
broader, national scope. However, a clear and
consistent drive is embedded in all: To improve
life and to create opportunities for all Filipinos
in balance with a sustainable and healthy
ecosystem. The three lines are introduced
concisely, starting with the holistic AmBisyon
Natin 2040, along with a brief overview of
international treaties and agreements.
AMBISYON NATIN 2040. The administration of
President Rodrigo R. Duterte initiated a
process to articulate a common vision of the
Filipino people, which resulted in the
document AmBisyon Natin 2040, formally
adopted under Executive Order No. 5 (2016).
The vision states that:
“In 2040, we will all enjoy a stable and
comfortable lifestyle, secure in the knowledge
that we have enough for our daily needs and
unexpected expenses, that we can plan and
prepare for our own and our children’s future.
Our family lives together in a place of our own,
and we have the freedom to go where we
desire, protected and enabled by a clean,
efficient, and fair government.”
Under the common vision for 2040, economic
growth must be relevant, inclusive and
sustainable, with per capita income increasing
by at least three-fold that translates to
improvement in the overall quality of life of the
majority of Filipinos. In order to make
economic growth broad-based across sectors
and regions, the government is set to increase
opportunities for the poor to participate in the
growth process while shielding them against
the negative impacts of economic and political
instabilities, as well as natural and man-made
calamities. The vision is for poverty to be
eradicated by 2040, if not earlier.
To realize this vision, the administration has
prepared its roadmap, the Philippine
31
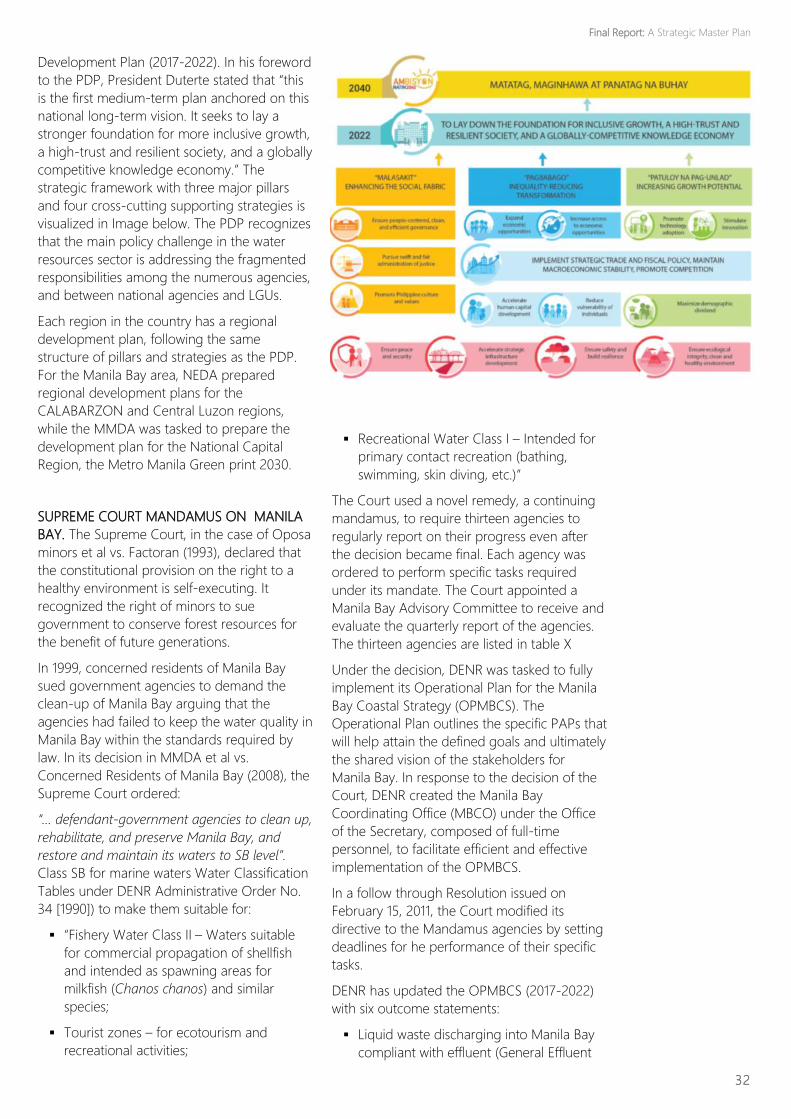
Development Plan (2017-2022). In his foreword
to the PDP, President Duterte stated that “this
is the first medium-term plan anchored on this
national long-term vision. It seeks to lay a
stronger foundation for more inclusive growth,
a high-trust and resilient society, and a globally
competitive knowledge economy.” The
strategic framework with three major pillars
and four cross-cutting supporting strategies is
visualized in Image below. The PDP recognizes
that the main policy challenge in the water
resources sector is addressing the fragmented
responsibilities among the numerous agencies,
and between national agencies and LGUs.
Each region in the country has a regional
development plan, following the same
structure of pillars and strategies as the PDP.
For the Manila Bay area, NEDA prepared
regional development plans for the
CALABARZON and Central Luzon regions,
while the MMDA was tasked to prepare the
development plan for the National Capital
Region, the Metro Manila Green print 2030.
SUPREME COURT MANDAMUS ON MANILA
BAY. The Supreme Court, in the case of Oposa
minors et al vs. Factoran (1993), declared that
the constitutional provision on the right to a
healthy environment is self-executing. It
recognized the right of minors to sue
government to conserve forest resources for
the benefit of future generations.
In 1999, concerned residents of Manila Bay
sued government agencies to demand the
clean-up of Manila Bay arguing that the
agencies had failed to keep the water quality in
Manila Bay within the standards required by
law. In its decision in MMDA et al vs.
Concerned Residents of Manila Bay (2008), the
Supreme Court ordered:
“… defendant-government agencies to clean up,
rehabilitate, and preserve Manila Bay, and
restore and maintain its waters to SB level”.
Class SB for marine waters Water Classification
Tables under DENR Administrative Order No.
34 [1990]) to make them suitable for:
▪ “Fishery Water Class II – Waters suitable
for commercial propagation of shellfish
and intended as spawning areas for
milkfish (Chanos chanos) and similar
species;
▪ Tourist zones – for ecotourism and
recreational activities;
▪ Recreational Water Class I – Intended for
primary contact recreation (bathing,
swimming, skin diving, etc.)”
The Court used a novel remedy, a continuing
mandamus, to require thirteen agencies to
regularly report on their progress even after
the decision became final. Each agency was
ordered to perform specific tasks required
under its mandate. The Court appointed a
Manila Bay Advisory Committee to receive and
evaluate the quarterly report of the agencies.
The thirteen agencies are listed in table X
Under the decision, DENR was tasked to fully
implement its Operational Plan for the Manila
Bay Coastal Strategy (OPMBCS). The
Operational Plan outlines the specific PAPs that
will help attain the defined goals and ultimately
the shared vision of the stakeholders for
Manila Bay. In response to the decision of the
Court, DENR created the Manila Bay
Coordinating Office (MBCO) under the Office
of the Secretary, composed of full-time
personnel, to facilitate efficient and effective
implementation of the OPMBCS.
In a follow through Resolution issued on
February 15, 2011, the Court modified its
directive to the Mandamus agencies by setting
deadlines for he performance of their specific
tasks.
DENR has updated the OPMBCS (2017-2022)
with six outcome statements:
▪ Liquid waste discharging into Manila Bay
compliant with effluent (General Effluent
32
Final Report: A Strategic Master Plan
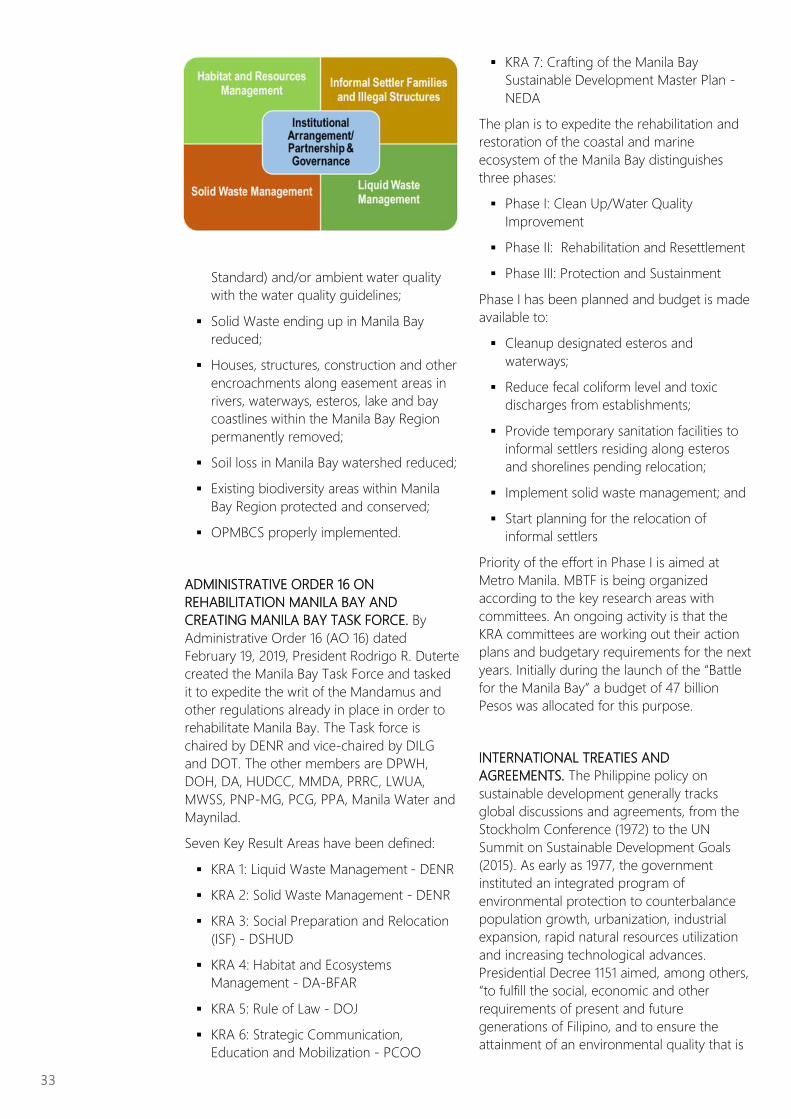
Standard) and/or ambient water quality
with the water quality guidelines;
▪ Solid Waste ending up in Manila Bay
reduced;
▪ Houses, structures, construction and other
encroachments along easement areas in
rivers, waterways, esteros, lake and bay
coastlines within the Manila Bay Region
permanently removed;
▪ Soil loss in Manila Bay watershed reduced;
▪ Existing biodiversity areas within Manila
Bay Region protected and conserved;
▪ OPMBCS properly implemented.
ADMINISTRATIVE ORDER 16 ON
REHABILITATION MANILA BAY AND
CREATING MANILA BAY TASK FORCE. By
Administrative Order 16 (AO 16) dated
February 19, 2019, President Rodrigo R. Duterte
created the Manila Bay Task Force and tasked
it to expedite the writ of the Mandamus and
other regulations already in place in order to
rehabilitate Manila Bay. The Task force is
chaired by DENR and vice-chaired by DILG
and DOT. The other members are DPWH,
DOH, DA, HUDCC, MMDA, PRRC, LWUA,
MWSS, PNP-MG, PCG, PPA, Manila Water and
Maynilad.
Seven Key Result Areas have been defined:
▪ KRA 1: Liquid Waste Management - DENR
▪ KRA 2: Solid Waste Management - DENR
▪ KRA 3: Social Preparation and Relocation
(ISF) - DSHUD
▪ KRA 4: Habitat and Ecosystems
Management - DA-BFAR
▪ KRA 5: Rule of Law - DOJ
▪ KRA 6: Strategic Communication,
Education and Mobilization - PCOO
▪ KRA 7: Crafting of the Manila Bay
Sustainable Development Master Plan -
NEDA
The plan is to expedite the rehabilitation and
restoration of the coastal and marine
ecosystem of the Manila Bay distinguishes
three phases:
▪ Phase I: Clean Up/Water Quality
Improvement
▪ Phase II: Rehabilitation and Resettlement
▪ Phase III: Protection and Sustainment
Phase I has been planned and budget is made
available to:
▪ Cleanup designated esteros and
waterways;
▪ Reduce fecal coliform level and toxic
discharges from establishments;
▪ Provide temporary sanitation facilities to
informal settlers residing along esteros
and shorelines pending relocation;
▪ Implement solid waste management; and
▪ Start planning for the relocation of
informal settlers
Priority of the effort in Phase I is aimed at
Metro Manila. MBTF is being organized
according to the key research areas with
committees. An ongoing activity is that the
KRA committees are working out their action
plans and budgetary requirements for the next
years. Initially during the launch of the “Battle
for the Manila Bay” a budget of 47 billion
Pesos was allocated for this purpose.
INTERNATIONAL TREATIES AND
AGREEMENTS. The Philippine policy on
sustainable development generally tracks
global discussions and agreements, from the
Stockholm Conference (1972) to the UN
Summit on Sustainable Development Goals
(2015). As early as 1977, the government
instituted an integrated program of
environmental protection to counterbalance
population growth, urbanization, industrial
expansion, rapid natural resources utilization
and increasing technological advances.
Presidential Decree 1151 aimed, among others,
“to fulfill the social, economic and other
requirements of present and future
generations of Filipino, and to ensure the
attainment of an environmental quality that is
33
conducive to a life of dignity and well-being.” It
laid the foundation for the environmental
impact assessment system that is implemented
today.
In 1989, the government adopted the
Philippine Strategy for Sustainable
Development that set the “general strategies
to resolve and reconcile the diverse and
sometimes conflicting environmental,
demographic, economic and natural resource
use issues arising from the country's
development efforts; and sectoral strategies
identified after a review of the current efforts
being undertaken in each of the identified
sectors.” In response to the Rio Summit (1992),
the country adopted the Philippine Agenda 21
in 1997 setting the platform for integrating
sustainable development in decision -making
structures and processes in government,
institutionalizing multi-stakeholder
participation in decision making at all levels,
and setting action agendas for specific
ecosystems.
With the adoption by UN member states of the
Millennium Declaration in 2000, the Philippines
integrated the millennium development goals
(MDGs) into national development planning.
By 2016, the country has made significant gains
in reducing poverty and child mortality, and in
achieving primary education and gender
equality.
However, in the area of environmental
sustainability, the country recorded an increase
in the number of species under threat of
extinction and made almost no dent in
improving security of tenure of informal
settlers (PSA, 2016). In 2015, the Philippines,
together with other UN member states,
committed to attain the more comprehensive
sustainable development goals (SDGs). The
country has compiled baseline data on the all
the SDGs and is on track to measure progress
until 2030 (PSA, 2018).
OTHER SPATIAL PLANNING AND MASTER
PLANNING DEVELOPMENTS. Besides the
above-described developments directly related
to Manila Bay there are many more
development plans that directly and indirectly
influence the functioning of the Bay. In
particular the successful implementation of
these plans are expected to contribute
substantially to the attainment of the strategic
goals of MBSDMP and in the overall fulfillment
of vision to make Manila Bay sustainable and
resilient. The most important ones are briefly
describe below.
▪ National Sewage and Septage
Management Plan - In accordance with
the Clean Water Act, the National Sewage
and Septage Management Plan (NSSMP)
was developed and formally adopted. In
addition to the NSSMP, a National
Sustainable Sanitation Road Map was
likewise prepared.
▪ Philippine Master Plan for Water Supply
and Sanitation - There is an ongoing
effort led by NEDA to formulate the
Philippine Master Plan for Water Supply
and Sanitation where among other things,
the National Sustainable Sanitation Road
Map will be integrated with the National
Road Map for Water Supply.
▪ Laguna de Bay Master Plan—This plan is
designed to facilitate the rehabilitation
and restoration of the lake ecosystem
functions including the sustainable use
and management of the catchment areas
of the Laguna Lake Basin in collaboration
with all the surrounding LGUs.
▪ Pampanga Master Plan—The PRBMP is a
comprehensive plan to promote the
holistic development of the entire
Pampanga River Basin that will ensure the
protection and sustainability of its waters
resources concurrently with the attainment
of other development goals particularly
economic development and poverty
eradication, biodiversity conservation,
food security and human security.
▪ Transportation Master Plan—This is a
comprehensive plan for the rationalized
development of transportation
infrastructure, facilities and services that
will spur agile mobility of people, products
and raw materials in support to balanced
local and national development with
reduced impacts on the quality of the
environment.
Policies:
▪ EO 74 - Repealing Executive Order (EO)
no. 798 (s. 2009) and EO no. 146 (s. 2013),
transferring the Philippine Reclamation
Authority (PRA) to the Office of the
President (OP), delegating to the PRA
governing board the power of the
President to approve reclamation projects,
34
Final Report: A Strategic Master Plan
and for other purposes
▪ EO 533 - Integrated Coastal
Management (ICM) - The EO 533 on
Integrated Coastal Management was
issued by the President of the Philippines
in 2006 and remains in effect. It was
issued as a policy for sustainable
development. It mandates the LGUs as the
frontline for its implementation and
employ best practices on (i) Coastal and
marine use zonation as a management
tool; (ii) Sustainable fisheries and
conservation of living resources; (iii)
Protection and rehabilitation of coral reefs,
mangroves, seagrass, estuaries and other
habitats, particularly through
implementation of marine protected
areas, nature reserves and sanctuaries; (iv)
Development of upland, watershed,
catchment areas and basin wide
management approaches; (v) Integrated
waste management, including, sewage
and solid, hazardous, toxic and other
wastes by major sources; (vi) Integrated
management of port safety, health,
security and environmental protection;
and (vii) Involvement of the private sector/
business sector as a partner in ICM.
▪ Spatial planning framework—In terms of
spatial planning, NEDA formulated the
National Physical Framework Plan (2016-
2045), wherein the National Spatial
Strategy is the core strategy. NEDA
initiated the preparation of interregional
plans to operationalize the NSS. For the
island of Luzon the Luzon Spatial
Development Framework (LSDF) Plan was
prepared to cover the eight regions,
namely: CAR, Ilocos (I), Cagayan Valley (II),
Central Luzon (III), CALABARZON (IVA),
MIMAROPA (IVB), Bicol (V) and the
National Capital Region (NCR). The LSDF
formulates the interregional Luzon spatial
strategies and also adopted the three core
strategies of the NSS, namely:
Concentration, Connectivity, and
Vulnerability Reduction (CCVR). The
challenge for the LGUs is how to align with
the above national and regional
development frameworks without limiting
and compromising its opportunities to
realize its own potential for development
and for contributing to the attainment of
national and regional development goals.
The same challenge is posed to the
preparation of MBSDMP on how it can be
packaged as a comprehensive
development plan for Manila Bay
consistent with overarching development
frameworks and in synergy with related
local, regional and national development
plans.
LEGAL FRAMEWORK The Philippine legal framework is composed of
an hierarchy of laws that includes the
Constitution at the highest level, followed by
laws passed by Congress, rules and regulations
issued by relevant executive agencies to
implement the laws, policies and programs
issued by the President and executive agencies
pursuant to their mandates, and local
ordinances passed by local government units
applicable in their respective jurisdictions.
Treaties that the Philippines entered into are
part of the legal framework, but these require
ratification by Congress in order for the
country to meet its international obligations.
Lastly, decisions of the courts are also part of
the legal framework; especially relevant are the
decisions interpreting the Constitution and
laws, clarifying agency powers and mandates,
and defining citizen rights and obligations.
There are several global conventions and
regional initiatives that the Philippines has
ratified and has signed on to. Those that are
pertinent to the desired objectives of MBSDMP
are listed below. As a member of the global
community, the Philippines is committed to
meeting the targets of the desired actions.
CONSTITUTION. The Constitution is the
highest law of the land. It provides the
foundation for policies and laws. The
Constitution provides principles and policies to
guide sustainable development, including:
The State shall promote a just and dynamic
social order that will ensure the prosperity and
independence of the nation and free the
people from poverty through policies that
provide adequate social services, promote full
employment, a rising standard of living, and an
improved quality of life for all (Sec. 9);
The State shall promote social justice in all
phases of national development (Sec. 10);
The State shall protect and promote the right
to health of the people and instill health
consciousness among them (Sec. 15);
The State shall protect and advance the right
35
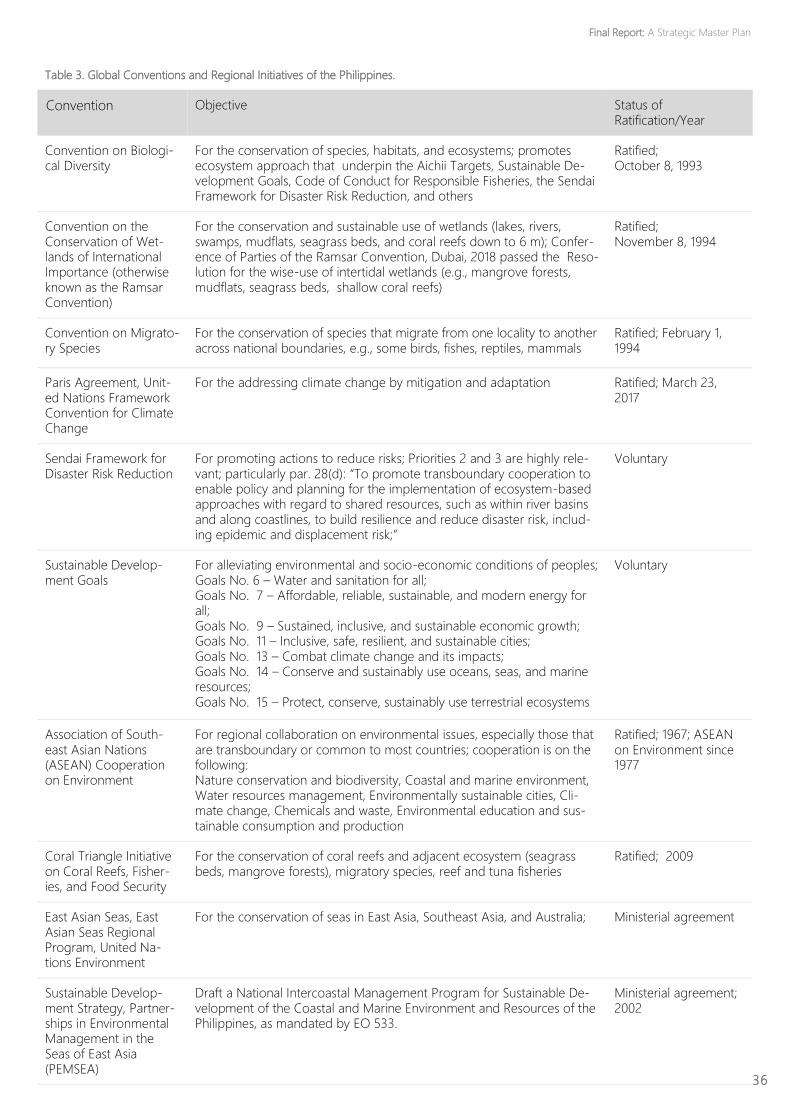
36
Table 3. Global Conventions and Regional Initiatives of the Philippines.
Convention Objective Status of Ratification/Year
Convention on Biologi-cal Diversity
For the conservation of species, habitats, and ecosystems; promotes ecosystem approach that underpin the Aichii Targets, Sustainable De-velopment Goals, Code of Conduct for Responsible Fisheries, the Sendai Framework for Disaster Risk Reduction, and others
Ratified; October 8, 1993
Convention on the Conservation of Wet-lands of International Importance (otherwise known as the Ramsar Convention)
For the conservation and sustainable use of wetlands (lakes, rivers, swamps, mudflats, seagrass beds, and coral reefs down to 6 m); Confer-ence of Parties of the Ramsar Convention, Dubai, 2018 passed the Reso-lution for the wise-use of intertidal wetlands (e.g., mangrove forests, mudflats, seagrass beds, shallow coral reefs)
Ratified; November 8, 1994
Convention on Migrato-ry Species
For the conservation of species that migrate from one locality to another across national boundaries, e.g., some birds, fishes, reptiles, mammals
Ratified; February 1, 1994
Paris Agreement, Unit-ed Nations Framework Convention for Climate Change
For the addressing climate change by mitigation and adaptation Ratified; March 23, 2017
Sendai Framework for Disaster Risk Reduction
For promoting actions to reduce risks; Priorities 2 and 3 are highly rele-vant; particularly par. 28(d): “To promote transboundary cooperation to enable policy and planning for the implementation of ecosystem-based approaches with regard to shared resources, such as within river basins and along coastlines, to build resilience and reduce disaster risk, includ-ing epidemic and displacement risk;”
Voluntary
Sustainable Develop-ment Goals
For alleviating environmental and socio-economic conditions of peoples; Goals No. 6 – Water and sanitation for all; Goals No. 7 – Affordable, reliable, sustainable, and modern energy for all; Goals No. 9 – Sustained, inclusive, and sustainable economic growth; Goals No. 11 – Inclusive, safe, resilient, and sustainable cities; Goals No. 13 – Combat climate change and its impacts; Goals No. 14 – Conserve and sustainably use oceans, seas, and marine resources; Goals No. 15 – Protect, conserve, sustainably use terrestrial ecosystems
Voluntary
Association of South-east Asian Nations (ASEAN) Cooperation on Environment
For regional collaboration on environmental issues, especially those that are transboundary or common to most countries; cooperation is on the following: Nature conservation and biodiversity, Coastal and marine environment, Water resources management, Environmentally sustainable cities, Cli-mate change, Chemicals and waste, Environmental education and sus-tainable consumption and production
Ratified; 1967; ASEAN on Environment since 1977
Coral Triangle Initiative on Coral Reefs, Fisher-ies, and Food Security
For the conservation of coral reefs and adjacent ecosystem (seagrass beds, mangrove forests), migratory species, reef and tuna fisheries
Ratified; 2009
East Asian Seas, East Asian Seas Regional Program, United Na-tions Environment
For the conservation of seas in East Asia, Southeast Asia, and Australia; Ministerial agreement
Sustainable Develop-ment Strategy, Partner-ships in Environmental Management in the Seas of East Asia (PEMSEA)
Draft a National Intercoastal Management Program for Sustainable De-velopment of the Coastal and Marine Environment and Resources of the Philippines, as mandated by EO 533.
Ministerial agreement; 2002
Final Report: A Strategic Master Plan
of the people to a balanced and healthful
ecology in accord with the rhythm and
harmony of nature (Sec. 16).
The Constitution elaborates on these basic
principles in the Articles on the National
Economy and Patrimony (Article XII) and Social
Justice and Human Rights (Article XIII). The
Constitution mandates that urban
development should be inclusive:
The State shall, by law, and for the common
good, undertake, in cooperation with the
private sector, a continuing program of urban
land reform and housing which will make
available at affordable cost, decent housing
and basic services to under-privileged and
homeless citizens in urban centers and
resettlement areas. It shall also promote
adequate employment opportunities to such
citizens. In the implementation of such
program, the State shall respect the rights of
small property owners (Art XIII, Sec. 9);
Urban or rural poor dwellers shall not be
evicted nor their dwelling demolished, except
in accordance with law and in a just and
humane manner. No resettlement of urban or
rural dwellers shall be undertaken without
adequate consultation with them and the
communities where they are to be relocated
(Art. XIII, Sec. 10).
The legal framework for the formulation of the
MBSDMP, to achieve the various objectives of
the Master plan and the Continuing
Mandamus of the Supreme Court, are
described in the section below.
ON WATER QUALITY IMPROVEMENT. The
Philippine Clean Water Act of 2004 (Republic
Act 9275) is the primary law relevant to Water
Quality Improvement. It aims to protect the
country’s water bodies from pollution from
land-based sources (industries and commercial
establishments, agriculture and community/
household activities) making use of a
multisectoral and participatory approach
involving all the stakeholders. Management of
water quality is based on watershed, river basin
or water resources region. Water quality
management areas with similar hydrological,
hydrogeological, meteorological, or
geographic conditions which affect the
reaction and diffusion of pollutants in water
bodies are designated by the DENR in
coordination with the National Water
Resources Board (NWRB). All owners or
operators of facilities that discharge
wastewater are required to get a permit to
discharge from either the DENR or the Laguna
Lake Development Authority (LLDA).
DPWH, in coordination with local government
units is mandated to prepare a national
program on sewage and septage
management. A priority list for the
construction and rehabilitation of required
facilities is to be prepared on an annual basis
for the allotment of funds by the national
government. DOH is tasked to formulate
guidelines and standards for the collection,
treatment and disposal of sewage as well as
the guidelines for the establishment and
operation of centralized sewage treatment
system. The MWSS and its concessionaires are
mandated to provide water supply and
sewerage facilities, the latter requiring
connection of existing sewage lines, subject to
sewerage service charges/fees (polluters pay
principle). Similarly, local water districts that
supply water to LGUs outside of
concessionaires area are responsible in
providing, maintaining and operating
wastewater collection, treatment and disposal
facilities for its serviced area. Local Water
Utilities Administration (LWUA) is the
authorized agency that monitor the
performance of water districts in fulfilling this
mandate, and provide support programs, such
as the Feasibility Study and Concept Design
Assistance for Sanitation Projects.
While the Clean Water Act deals mainly with
regulating pollution from land-based sources,
the standards set by DENR, the civil and
criminal liabilities for violation still apply for
pollution coming from ships and other sea-
based or offshore sources. The Oil Pollution
Compensation Act deals with civil liability
arising from ship-based pollution, consistent
with the international agreements on marine
pollution. The Coast Guard Law mandates the
Philippine Coast Guard as lead agency for
regulation, monitoring and enforcement of
potential ship-based sources of pollution.
In terms of solid waste, the Ecological Solid
Waste Management Act (RA 9003) serves as
the legal framework for the comprehensive,
systematic and environmentally-sound solid
waste management in the country. RA 9003
requires segregation at source to allow for
37
more efficient recovery of the different waste
components which are still useful, be they
biodegradable waste which can be composted,
used as animal feed or processed in
biodigesters to generate methane for energy;
or non-biodegradable waste which can be
recycled or re-used.
The Act requires all open dumpsites to be
closed and transformed into controlled
dumpsites, and for all controlled dumpsites to
be closed or transformed into sanitary landfills,
within 3 and 5 years of the effectivity of the
law, respectively. It sets a target of 25%
diversion of waste materials from disposal sites
that is to be increased every 3 years thereafter.
It also prohibits open burning of wastes.
RA 9003 provides the needed institutional
arrangement to oversee the implementation of
the law and prescribe guidelines for the
preparation and implementation of solid waste
management plans though the creation of the
National Solid Waste Management
Commission (NSWMC). The institutional
section of the law highlights that LGUs shall be
primarily responsible for the implementation
and enforcement of the provisions of this Act
within their respective jurisdictions.
Through the years, the Commission has issued
various policies to guide the implementation of
the law. Worth noting among their recent
issuances are:
▪ Resolution No. 66, series of 2013 which
provides the policy direction on the
clustering or pooling of resources of LGUs
for common SWM disposal facilities and
services. Said policy is deemed beneficial
to LGUs since it allows economies of scale
and assists in identifying and addressing
the development needs anchored on
equitable sharing among the cluster of
LGUs.
▪ Resolution No. 669, series of 2016, on
“Guidelines on the Establishment and
Operation of Waste-to-Energy
Technologies for Municipal Solid Waste”.
The DENR Administrative Order (DAO) on the
WTE is yet to be issued by the DENR. In the
interim, the Environmental Management
Bureau (EMB) issued Memorandum Circular
No. 08-2019 adopting NSWMC Resolution No.
669. This is very important since WTE
technologies can help address the increasing
volume of waste generated that yet cannot be
recycled or re-used. MC 08-2019 is expected
to guide the EMB Regional Directors in
providing technical assistance to LGUS and
other stakeholders in the establishment and
operations of their WTE facilities. All WTE
proposals should strictly adhere to other
existing environmental rules, regulations and
standards such as the emission and effluent
standards set by the DENR, the guidelines on
the handling storage, transport, treatment and
disposal of Toxic and Hazardous Waste, the
conduct of an Environmental Impact
Assessment (EIA), among others.
ON ECOSYSTEM PROTECTION. The
Philippines has a comprehensive set of
environmental laws to protect natural
ecosystems. The Environmental Impact
Statement System establishes procedures for
assessing the impact of development activities
and requiring the implementation of mitigation
measures to prevent or reduce adverse
impacts to the environment. The National
Integrated Protected Areas System Act or
Republic Act No. 11038 standardizes
procedures for the management of protected
areas that are reserved for protection of
unique habitats, biodiversity, among others,
and in which only non-extractive use is
allowed.
The Philippine Biodiversity Strategy and Action
Plan (PBSAP) 2015 – 2028. It is the country’s
roadmap to conserve its biodiversity and
achieve its vision -“By 2028, biodiversity is
restored and rehabilitated, valued, effectively
managed and secured, maintaining ecosystem
services to sustain healthy, resilient Filipino
communities and delivering benefits to all.” It is
anchored in the Philippine Development Plan
(PDP). While the PDP adopts the framework
for inclusive growth, the PBSAP articulates the
same direction of pursuing economic growth
while protecting the environment. The PBSAP
includes nine priority strategies and national
targets with respective indicators that conform
to the global Aichi Biodiversity Targets. The
strategies and targets are highly relevant for
the development and implementation of the
MBSDMP.
The Forestry Code governs the use of forest
resources. These regulations have evolved
from exploitation to conservation and
rehabilitation. Logging in natural forests is
currently prohibited, as well as the harvesting
38
Final Report: A Strategic Master Plan
of mangrove species. Priority for limited
extraction of non-timber forest resources and
utilization of planted trees is given to local
communities under the community-based
forest management program.
The Fisheries Code governs the conservation
and utilization of fisheries and other aquatic
resources. It mandates the local governments
to set aside at least 15% of the waters under
their jurisdiction as sanctuaries or refugia. The
Wildlife Resources Conservation and
Protection Act governs the protection of
endangered species and their habitats. Laws
protecting ecosystems from the harmful effects
of human development activities include the
Clean Air Act, Clean Water Act, Ecological
Solid Waste Management Act and the Toxic
Substances, Hazardous and Nuclear Wastes
Control Act.
ON DISASTER RISK REDUCTION AND
CLIMATE CHANGE ADAPTATION. Through RA
10121 the National Disaster Risk Reduction and
Management Council (NDRRMC) was created
and replaced the former National Disaster
Coordinating Council (NDCC) to spearhead the
national effort to prevent and reduce the
adverse impacts of climate related and other
hazards. It works in close coordination with the
regional, provincial and local Disaster Risk
Reduction Management (DRRM) councils. The
National Calamity Fund and the Local Calamity
Fund that is equivalent to 5% of LGUs total
revenue from regular sources, were
established by virtue of RA 7160 and reinforced
by RA 8185 from which the LGUs at risk of
being affected by climate related and other
natural disasters can draw funds for
undertaking appropriate (Climate Change
Adaptation) CCA and (Disaster Risk Reduction)
DRR measures.
The Government has drawn the National
Climate Change Action Plan (NCCAP), and the
Joint Roadmap of the Cabinet Cluster for
Climate Change Adaptation and Mitigation
and Disaster Risk Reduction (CCAM-DRR) for
2018 to 2022, to serve as framework for NGAs
and LGUs in plotting out their respective DRR/
CCA plans. All LGUs are mandated to develop
and implement their respective Local Climate
Change Adaptation Plan (LCCAP) and Disaster
Risk Reduction Management Plan (DRRMP) .
The People Survival Fund (PSF) is established
as a facility for providing technical and
supplementary financial assistance to LGUs and
local communities in developing and
implementing CCA and DRR action agenda
(RA 10174). The PSF provides grants to LGUs in
carrying out projects that will reduce its
exposure and vulnerability to disaster risks and
slow onset climate change impacts as assessed
and indicated in their LCCAP and DRRMP.
Through RA 9729 the Climate Change
Commission (CCC) was created as a
coordinative and facilitative agency to develop
the capacity of local and national government
agencies to set and implement their respective
CCA and DRR plans in harmony and synergy
with the plans of other agencies and sectors;
and to promote integrated and multiagency
approach to CCA and DRR. DENR, DILG, DA
and other government agencies including
some LGUs have established its own climate
change offices mainly to educate and build the
capacity of people and communities at risk to
climate related hazards.
Some coastal LGUs are banding together to
carry out unified and coordinated action
programs to address among others their
common struggles against flooding and other
related hazards. Some six (6) coastal LGUs in
Bulacan (i.e., Malolos, Hagonoy, Calumpit,
Paombong, Obando, and Bulacan), and three
(3) in Pampanga (i.e., Lubao, Macabebe and
Masantol) formed the Alyansa ng mga
Baybaying Bayan ng Bulacan at Pampanga
(ABBBP) to pursue common goals including
reducing their vulnerability and exposure to
coastal flooding and other climate related
hazards. They have implemented successfully a
few projects but are still highly limited in their
technical and financial resources. While they
get technical assistance from a private
university in strengthening their organization,
the ABBBP remain needful of assistance
particularly from the national government.
There is also a need for a closer coordination
between the concerned NGAs and ABBBP in
order to increase synergy and
complementation of the national and local
response programs.
ON UPGRADING INFORMAL SETTLEMENTS.
“Our family lives together in a place of our
own…” is a key aspiration of Filipinos as
expressed in the national vision AmBisyon
Natin 2040. This assumes that the home is
safe, with access to basic services and the
39
rights to the property are legitimate and
secure.
The current legal framework focuses on
creating options and opportunities for the
poor to avail of affordable housing. The basic
relevant law is the Urban Development and
Housing Act of 1992 (UDHA), and the related
laws on socialized/balanced housing and
shelter financing. Other sectoral laws have
special provisions for settlements (e.g. Fisheries
Code on fisherfolk settlements). Aside from
creating opportunities for affordable housing,
another important aspect of the legal
framework is the protection of urban poor
against displacement and demolition.
However, this is balanced with drive against
professional squatting. The issue of
displacement is especially sensitive when
informal settlements are located in danger
zones, or when the settlements obstruct/affect
government infrastructure projects.
The Republic Act 11201 merged the Housing
and Urban Development Coordinating Council
(HUDCC) and Housing and Land Use
Regulatory Board (HLURB) to create the
Department of Human Settlements and Urban
Development (DHSUD), an agency that is
responsible for the management of the
country’s housing and related developments.
Part of the new agency’s mandate is to own
and administer government lands for public
housing and other urban uses. DHSUD aims to
have its housing programs to be truly aligned
with AmBisyon Natin 2040’s vision of home
ownership for every Filipino.
ON INCLUSIVE GROWTH. Inclusive growth is
driven more by the administration’s priority
policies and programs than by legislation. The
government’s priority is to first address
poverty. The Department of Social Welfare and
Development implements several programs on
poverty alleviation. The Pantawid Pamilyang
Pilipino Program (4Ps) is a conditional cash
transfer scheme where more than 4.4 million
poor households receive cash grants in
exchange for responsibilities to keep mothers
and infants healthy and for school-age minors
to attend school. The known as the Kapit-Bisig
Laban sa Kahirapan - Comprehensive and
Integrated Delivery of Social Services (Kalahi-
CIDSS) uses the community driven
development approach to help communities in
poor municipalities identify challenges around
reducing poverty and make informed decisions
on a range of locally identified development
initiatives. Communities, civil society and local
governments become empowered to achieve
improved access to services and to participate
in more inclusive local planning, budgeting,
and implementation. The Sustainable
Livelihood Program (SLP) is a capability
building program for poor, vulnerable and
marginalized communities by developing skills
that enhances employment opportunities or
providing training for micro-enterprise
development.
The Social Reform and Poverty Alleviation Act
(RA 8425) seeks to reduce “absolute
poverty” (below the food threshold level) and
“relative poverty” (gap between the rich and
the poor). The law created the multi-sectoral
National Anti-Poverty Commission (NAPC)
that ensures coordinated implementation of all
national and local social reform and poverty
alleviation programs. The law also created a
People’s Development Trust Fund intended to
support microfinance initiatives and supported
by other programs for credit and guarantee. In
addition to the social reform law, there are
laws recognizing the role of women in
development, granting benefits and privileges
to persons with disabilities and senior citizens.
Aside from laws that integrate marginalized
sectors, there are laws integrating
environmental awareness in education, and
protecting cultural heritage that are more
broadly intended to improve the quality of life
of the people beyond poverty alleviation.
DRIVING FORCES-PRESSURES
-STATE-IMPACTS-RESPONSES
(DPSIR) FRAMEWORK
Manila bay has become the center of
international trade and industry in the
Philippines. However, the quality of the
environment within the bay has been declining
due to rapid increase in human population
leading to overexploitation of resources and
degradation of ecosystems. In addition,
increasing climate change and climate
variability are compounding these problems
impacting the people dependent on these
resources. Decent laws and regulations
addressing the Manila Bay pressures are
available, but the implementation of these, are
currently insufficient.
40
Final Report: A Strategic Master Plan
The DPSIR framework (Driving Forces-
Pressures-State-Impacts-Responses) analyze,
assess, and manage environmental issues and
concerns emanating from human activities.
Driving forces are the changes in the social,
economic and institutional system that directly
and indirectly trigger pressures on the
environmental state (EEA, 2007)12, Drivers
could be categorized as anthropogenic and
naturally occurring. Pressures is defined by EEA
(2007) as the social, demographic and
economic developments in societies and the
corresponding changes in lifestyles, overall
levels of consumption and production
patterns. The pressures exerted may lead to
unintended or intended changes in the State
which is the condition of the natural system.
Impacts are the consequences of
environmental degradation affecting social,
economic and environmental dimension which
initiates Responses, referring to the actions by
society to the environmental situation.
DRIVING FORCE
The state of Manila Bay is influenced by
external human and natural driving forces that
include change in climate conditions and
increasing population growth. Population
growth leading to increased needs of food,
water and shelter determines the development
of natural resources in a given area. The
Manila Bay Area is a natural magnet for
Filipinos to reside because of its economic
opportunities it offers. In fact, the localities
within Manila bay region are amongst the
most crowded places in the world ranging
from the least dense of 23 persons per square
kilometer to the densest of 42 thousand per
square kilometer. Increasing population
without adequate and availability of
infrastructure that includes water supply and
sanitation, solid waste management facilities,
food production, and housing settlements add
pressures to the degradation of Manila Bay
Ecosystem.
The Manila Bay Area is exposed and vulnerable
to climate change, climate variability, and
extreme events. Generally, the entire
Philippines will experience warmer temperature
projecting to rise by 0.9°C to 1.1°C in 2020 and
by 1.8°C to 2.2°C in 2050. Future rainfall is
projected to continue in its upward trend with
areas currently wet becoming wetter and the
currently dry areas becoming drier. Increases
in the intensity of severe cyclones have been
experienced in recent years that are attributed
to the rising sea surface temperature. It is
expected that the projected continuous
warming in the future could further enhance
the intensity of typhoons and exacerbate its
damaging effects.
PRESSURES
Excessive use of Natural Resources
Most of the Manila Bay area is utilized for
agriculture, specifically the Pampanga river
basin and Cavite watershed. Capture fisheries
and aquaculture on the other hand are two of
the main sectors that significantly contribute to
the economy of the Manila Bay Area. As the
population in the Manila Bay is rapidly
increasing, and natural resources remain
limited. The use of the available resources has
been intensified and has led to
overexploitation.
Agricultural inputs such as chemical fertilizers
and pesticides are washed away by the rains
and contribute to increased nutrient levels of
the Bay. In addition, the lack of soil
conservation measures in agroforestry and
agriculture also lead to increased soil erosion.
Improperly managed livestock waste also
contribute to water pollution. The resulting
poor water quality also adversely affects the
health of the ecosystem
Waste Discharges (Solid and Liquid)
Population growth is closely related to
increasing economic activities that is usually
associated with increasing demand for water,
generation of wastewater and solid wastes that
degrade water quality in rivers, lakes and the
bay. The increase in generation of solid wastes
and wastewater that end up polluting the bay
because of absence of adequate waste
management facilities and the weak
enforcement of related laws and regulations
makes the task of protecting the ecosystems
more difficult it is already.
Ground Water Extraction
Groundwater is used for drinking by about 50
percent of the people in the country
(Philippine Environment Monitor, 2003). Since
2015, groundwater extraction has been
prohibited throughout Metro Manila and
certain parts of Bulacan and Cavite provinces.
However, Philippine Environment Monitor
(2003) estimated that about 60 percent of the
groundwater extraction is without water-right
41
permits, resulting in indiscriminate withdrawal.
In CAMANAVA (Caloocan, Malabon, Navotas,
and Valenzuela) land subsidence is mainly due
to excessive groundwater pumping by
fishpond operators (Rodolfo and Siringan
2006). These LGUs are considered as ground
subsidence “hot spots” along with Manila and
neighboring areas of Guiguinto, Marilao, and
Meycauayan in Bulacan; Rosario and
Dasmarinas in Cavite; and Binan in Laguna.
Ground subsidence rates in these LGUs are up
to 5.5 to 6.0 cm per year and are highest in
Marilao, Meycauayan, and Caloocan. The
absence of updated assessment on the extent
and use of groundwater resources within the
Manila Bay Area constrains a more precise
understanding on the magnitude of problems
related to groundwater extraction. It thereby
limits the formulation of precise intervention to
remedy land subsidence and the associated
flooding problems.
Land Use Changes and Land Reclamation
The distribution of the total number of housing
units demonstrates centrality towards the
National Capital Region. The number of
occupied housing units in the Manila Bay Area
had been increasing at a rate of about 3.8%
per annum from 1990 to 2015. It is projected
that somewhere between 2050 and 2055, the
urban area in the Manilla Bay will double in
both southern and northern directions. To
accommodate the needs of growing
population, there is a continuous conversion of
agricultural land to built-up especially in
Regions III and IV-A. Agricultural lands are
foregone and converted to address the needs
for housing, commercial and other non-
agricultural uses. Reclaiming islands in the
Manila Bay, is one of the identified options, to
accommodate the need for additional space
because of rapid growth. As of this writing,
there are at least 20 reclamation projects in
various stages of permitting, development and
implementation, according to the Philippine
Reclamation Authority (PRA).
Climate Change, Climate Variability, and
Extreme Events
Climate change significantly influences sea
level rise. In the last 20 years the magnitude of
sea level rise east of the Philippines has been
observed to be between 5-7 mm per year
which is more than double the global average
(Rodolfo and Siringan, 2006 as cited by Kahana
et al., 2016). Sea level rise have also been
known to influence erosion in coastal areas,
alteration of coastal ecosystems, and saltwater
intrusion.
Increase in rainfall increases surface soil
erosion especially in sloping lands with scant
vegetation cover or hilly lands used for
farming. Consequently, the fertility of soil
decreases along with the income of farmers.
The amount of sediments that are carried away
by streams and deposited in streambeds,
coastal areas, seabed and corals often cause
damages to ecosystems and the plants and
animal life therein. The increase in inflow of
freshwater into the coastal areas and marine
ecosystems due to increase in rainfall also
often means increase in the amount of loading
of nutrients, and organic and inorganic
pollutants. This could be harmful especially to
marine life that is sensitive to even the slight
increase in the amount of nutrients and
pollution in seawater.
Increasing intensity of tropical cyclones and the
associated storm surges inflicts greater than
normal physical damages to mangroves,
mudflats, and corals.
STATE
In Manila Bay, several important habitats have
been identified. The largest habitat type is the
deep and shallow muddy habitats, followed by
the patchy coral reefs, mangrove stands, and
mud flats. Seagrass was conservatively
estimated as the habitat with the lowest
coverage since very limited information on
their distribution and abundance in Manila Bay
was reported in literature. At present, however,
the situational analysis has shown that these
habitats are in an advance state of degradation
resulting primarily from increased coastal
population, land conversions and reclamation
activities. The impacts of these activities are
exacerbated by climate change-driven
increases in precipitation, storminess,
acidification, and warming sea surface
temperature. The synergistic effect of these
processes, in general, results to; (a) increased
sediment deposition in the bay; (b) pollution
(which includes nutrification); and, (c)
destruction of coastal settlements and loss of
property. Sustained sediment deposition and
increased pollution have significantly caused
the degradation of all habitats particularly in
the deeply embayed section of Manila Bay (i.e.,
North-eastern Bataan, Pampanga, Bulacan,
NCR and the Northern part of Cavite).
42
Final Report: A Strategic Master Plan
Physically, terrigenous sediments smother soft
bottom macrofaunal communities in mudflats
and subtidal muddy habitats. Sediments also
smother seagrass beds and in severe causes,
clog roots of mangrove resulting to death of
saplings, seedlings and even trees. Increased
nutrient flux from land and aquaculture areas
contributed to algal blooms and anoxic
conditions in deep bottom sediment-water
interphase.
The fish stocks of Manila Bay have been
severely depleted. Maximum sustainable yield
estimated for Manila Bay from 1948 to 1984
was placed at a range of 13,000 to 20,000
metric tons per year (Silvestre et al. 1987;
PEMSEA and MBEMPTWG-RRA 2004). This
figure was believed to have already been
achieved in the 1980’s (Bureau of Agricultural
Statistics, 2007; PEMSEA and MBEMPTWG-RRA
2004). During this period, it was also observed
that more than 60% of the demersal fish
biomass recorded in 1947 was lost.
Overexploitation peaked in 2015 where only
10.4% of the stock estimated almost 70 years
ago was lost.
The water quality of Manila Bay has
continuously deteriorated due to increasing
discharges from untreated domestic,
agricultural and industrial sources, sea-based
activities such as aquaculture and waste
dumping, and pollution brought about by
inadequate solid waste management. Several
studies have noted that the water quality in
Manila Bay is deteriorating due to increase in
toxic chemicals and other biochemical
contaminants discharged from heavily polluted
river systems beyond the allowable standards.
Consequently, the amount of organic wastes
and nutrients loaded into the bay has
increased causing nutrification and
degradation of habitat quality of shallow and
deep mudflats, In the absence of proper waste
management, the discharge of organic wastes
and nutrients in major river systems that drain
to Manila Bay also increased.
Coastal flooding in Manila Bay is due to the
combined effects of sea level rise, land
subsidence, tidal movements and discharge of
water from major river basins. It periodically
affects the coastal LGUs within Manila Bay.
Approximately 29,000 ha of built up areas in
coastal LGUs are low to very highly frequently
affected by floods of which 6,027 ha are highly
to very highly frequently affected by floods.
Coastal flooding in Manila Bay is due to the
combined effects of sea level rise, land
subsidence, tidal movements and discharge of
water from major river basins. It
periodicallysignificantly affects the coastal LGUs
within Manila Bay. Approximately 29,000 ha of
built up areas in coastal LGUs are low to very
highly frequently affected by floods of which
6,027 ha are highly to very highly frequently
affected by floods (i.e., areas that are already
permanently inundated or inundated for most
part of the year).
IMPACT
The natural ecosystem is the foundation for
social and economic development. In Manila
Bay, the ecosystem historically drove inclusive
growth, contributed to water quality
improvement, reduced the community’s
exposure to disasters and vulnerability to
climate extremes, and provided coastal
protection that led to safer coastal settlements.
However, through time, ecosystem function
and the services it provides have degenerated
as a result of increasing coastal population,
continuous land conversions and reclamations,
and the frequent occurrence of climate
extremes. These changes have resulted to
severe sediment deposition in the bay,
extensive habitat destruction, severe pollution,
water quality degradation, overfishing and
increased vulnerability of coastal settlements.
The collective impact of these stressors has
reduced overall community resilience by
exacerbating poverty and aggravating
settlement problems, particularly by the
marginalized sector. This further marginalizes
the poor, particularly the fishermen and
informal settlers of the bay, alienating them to
the inclusive growth targeted by the
government.
Flooding is still the most frequently occurring
disaster event in the Manila Bay Area. Coastal
flooding is periodically triggered by tidal
movement that is aggravated by sea level rise
and surges of waves courtesy of strong
cyclones. During heavy rains overflowing of
riverbanks due to high volume of stormflows
and the shrinking water holding capacity of
rivers and drainage systems due to clogging
and sedimentation commonly occurs that
inundate farms, residential and urban areas.
This is aggravated by the expansion of
impervious surfaces associated with urban
development that slows down infiltration of
43
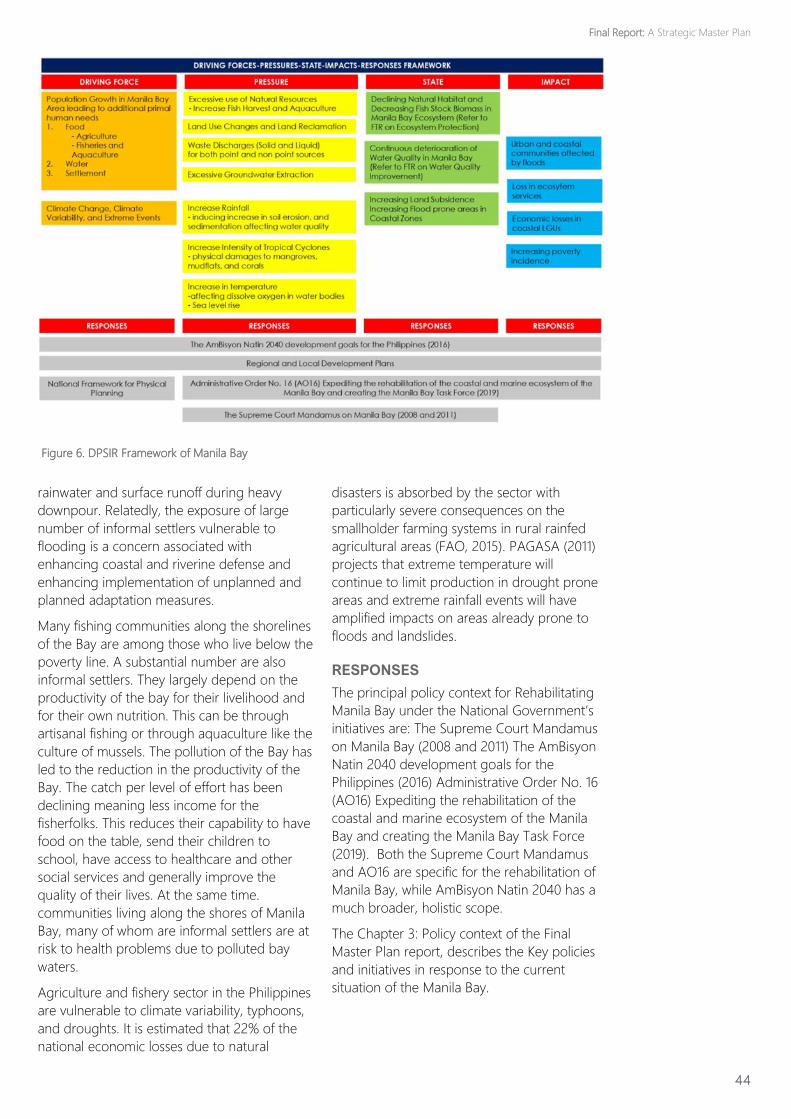
rainwater and surface runoff during heavy
downpour. Relatedly, the exposure of large
number of informal settlers vulnerable to
flooding is a concern associated with
enhancing coastal and riverine defense and
enhancing implementation of unplanned and
planned adaptation measures.
Many fishing communities along the shorelines
of the Bay are among those who live below the
poverty line. A substantial number are also
informal settlers. They largely depend on the
productivity of the bay for their livelihood and
for their own nutrition. This can be through
artisanal fishing or through aquaculture like the
culture of mussels. The pollution of the Bay has
led to the reduction in the productivity of the
Bay. The catch per level of effort has been
declining meaning less income for the
fisherfolks. This reduces their capability to have
food on the table, send their children to
school, have access to healthcare and other
social services and generally improve the
quality of their lives. At the same time.
communities living along the shores of Manila
Bay, many of whom are informal settlers are at
risk to health problems due to polluted bay
waters.
Agriculture and fishery sector in the Philippines
are vulnerable to climate variability, typhoons,
and droughts. It is estimated that 22% of the
national economic losses due to natural
disasters is absorbed by the sector with
particularly severe consequences on the
smallholder farming systems in rural rainfed
agricultural areas (FAO, 2015). PAGASA (2011)
projects that extreme temperature will
continue to limit production in drought prone
areas and extreme rainfall events will have
amplified impacts on areas already prone to
floods and landslides.
RESPONSES
The principal policy context for Rehabilitating
Manila Bay under the National Government’s
initiatives are: The Supreme Court Mandamus
on Manila Bay (2008 and 2011) The AmBisyon
Natin 2040 development goals for the
Philippines (2016) Administrative Order No. 16
(AO16) Expediting the rehabilitation of the
coastal and marine ecosystem of the Manila
Bay and creating the Manila Bay Task Force
(2019). Both the Supreme Court Mandamus
and AO16 are specific for the rehabilitation of
Manila Bay, while AmBisyon Natin 2040 has a
much broader, holistic scope.
The Chapter 3: Policy context of the Final
Master Plan report, describes the Key policies
and initiatives in response to the current
situation of the Manila Bay.
44
Figure 6. DPSIR Framework of Manila Bay
Final Report: A Strategic Master Plan
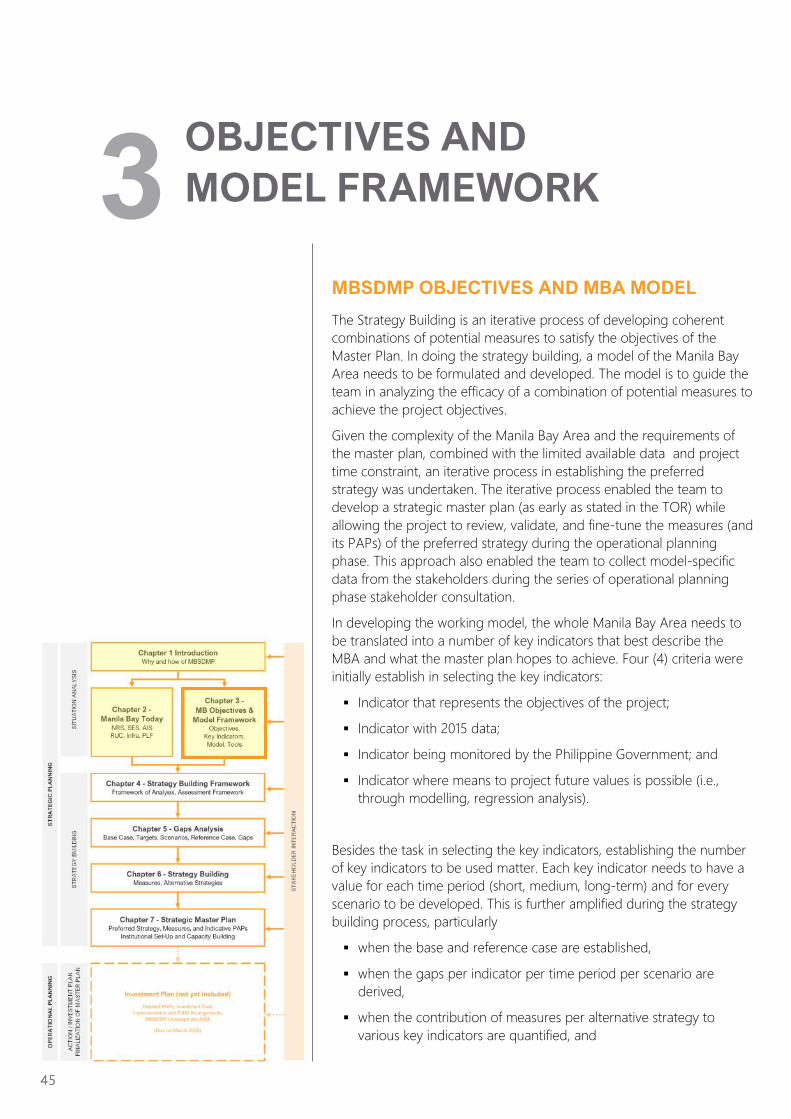
MBSDMP OBJECTIVES AND MBA MODEL
The Strategy Building is an iterative process of developing coherent
combinations of potential measures to satisfy the objectives of the
Master Plan. In doing the strategy building, a model of the Manila Bay
Area needs to be formulated and developed. The model is to guide the
team in analyzing the efficacy of a combination of potential measures to
achieve the project objectives.
Given the complexity of the Manila Bay Area and the requirements of
the master plan, combined with the limited available data and project
time constraint, an iterative process in establishing the preferred
strategy was undertaken. The iterative process enabled the team to
develop a strategic master plan (as early as stated in the TOR) while
allowing the project to review, validate, and fine-tune the measures (and
its PAPs) of the preferred strategy during the operational planning
phase. This approach also enabled the team to collect model-specific
data from the stakeholders during the series of operational planning
phase stakeholder consultation.
In developing the working model, the whole Manila Bay Area needs to
be translated into a number of key indicators that best describe the
MBA and what the master plan hopes to achieve. Four (4) criteria were
initially establish in selecting the key indicators:
▪ Indicator that represents the objectives of the project;
▪ Indicator with 2015 data;
▪ Indicator being monitored by the Philippine Government; and
▪ Indicator where means to project future values is possible (i.e.,
through modelling, regression analysis).
Besides the task in selecting the key indicators, establishing the number
of key indicators to be used matter. Each key indicator needs to have a
value for each time period (short, medium, long-term) and for every
scenario to be developed. This is further amplified during the strategy
building process, particularly
▪ when the base and reference case are established,
▪ when the gaps per indicator per time period per scenario are
derived,
▪ when the contribution of measures per alternative strategy to
various key indicators are quantified, and
45
OBJECTIVES AND
MODEL FRAMEWORK
3
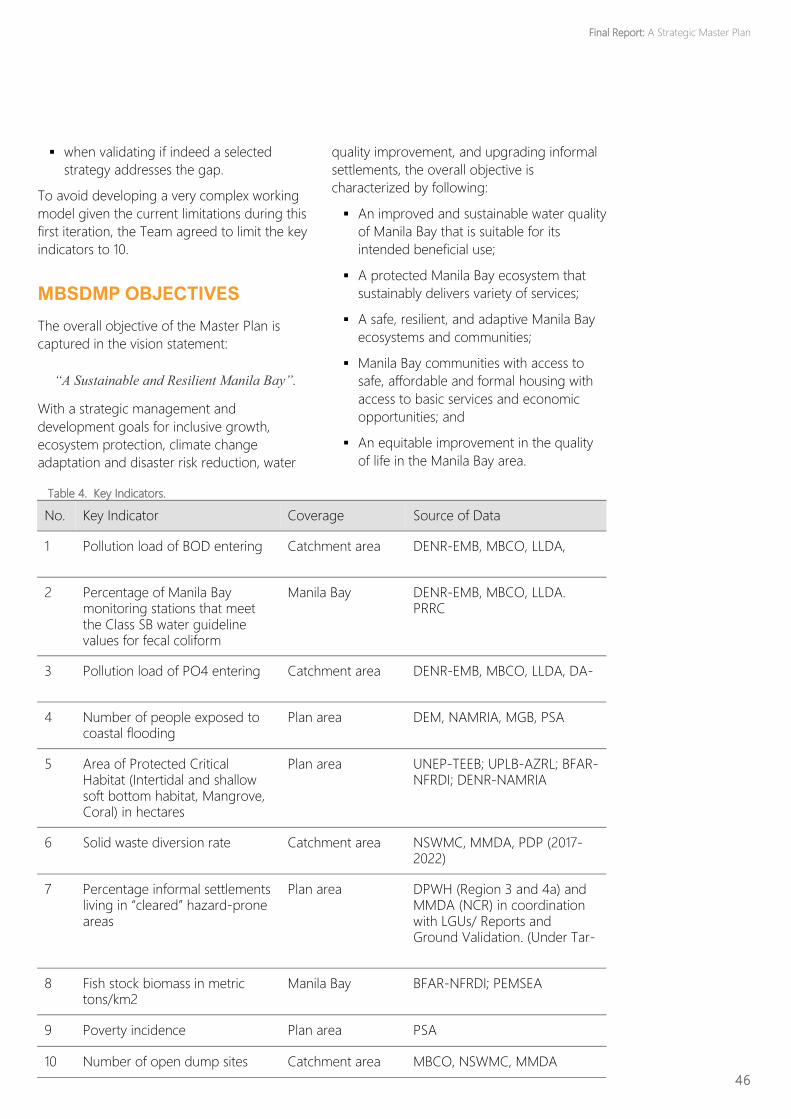
46
▪ when validating if indeed a selected
strategy addresses the gap.
To avoid developing a very complex working
model given the current limitations during this
first iteration, the Team agreed to limit the key
indicators to 10.
MBSDMP OBJECTIVES
The overall objective of the Master Plan is
captured in the vision statement:
“A Sustainable and Resilient Manila Bay”.
With a strategic management and
development goals for inclusive growth,
ecosystem protection, climate change
adaptation and disaster risk reduction, water
quality improvement, and upgrading informal
settlements, the overall objective is
characterized by following:
▪ An improved and sustainable water quality
of Manila Bay that is suitable for its
intended beneficial use;
▪ A protected Manila Bay ecosystem that
sustainably delivers variety of services;
▪ A safe, resilient, and adaptive Manila Bay
ecosystems and communities;
▪ Manila Bay communities with access to
safe, affordable and formal housing with
access to basic services and economic
opportunities; and
▪ An equitable improvement in the quality
of life in the Manila Bay area.
No. Key Indicator Coverage Source of Data
1 Pollution load of BOD entering Catchment area DENR-EMB, MBCO, LLDA,
2 Percentage of Manila Bay monitoring stations that meet the Class SB water guideline values for fecal coliform
Manila Bay DENR-EMB, MBCO, LLDA. PRRC
3 Pollution load of PO4 entering Catchment area DENR-EMB, MBCO, LLDA, DA-
4 Number of people exposed to coastal flooding
Plan area DEM, NAMRIA, MGB, PSA
5 Area of Protected Critical Habitat (Intertidal and shallow soft bottom habitat, Mangrove, Coral) in hectares
Plan area UNEP-TEEB; UPLB-AZRL; BFAR-NFRDI; DENR-NAMRIA
6 Solid waste diversion rate Catchment area NSWMC, MMDA, PDP (2017-2022)
7 Percentage informal settlements living in “cleared” hazard-prone areas
Plan area DPWH (Region 3 and 4a) and MMDA (NCR) in coordination with LGUs/ Reports and Ground Validation. (Under Tar-
8 Fish stock biomass in metric tons/km2
Manila Bay BFAR-NFRDI; PEMSEA
9 Poverty incidence Plan area PSA
10 Number of open dump sites Catchment area MBCO, NSWMC, MMDA
Table 4. Key Indicators.
Final Report: A Strategic Master Plan
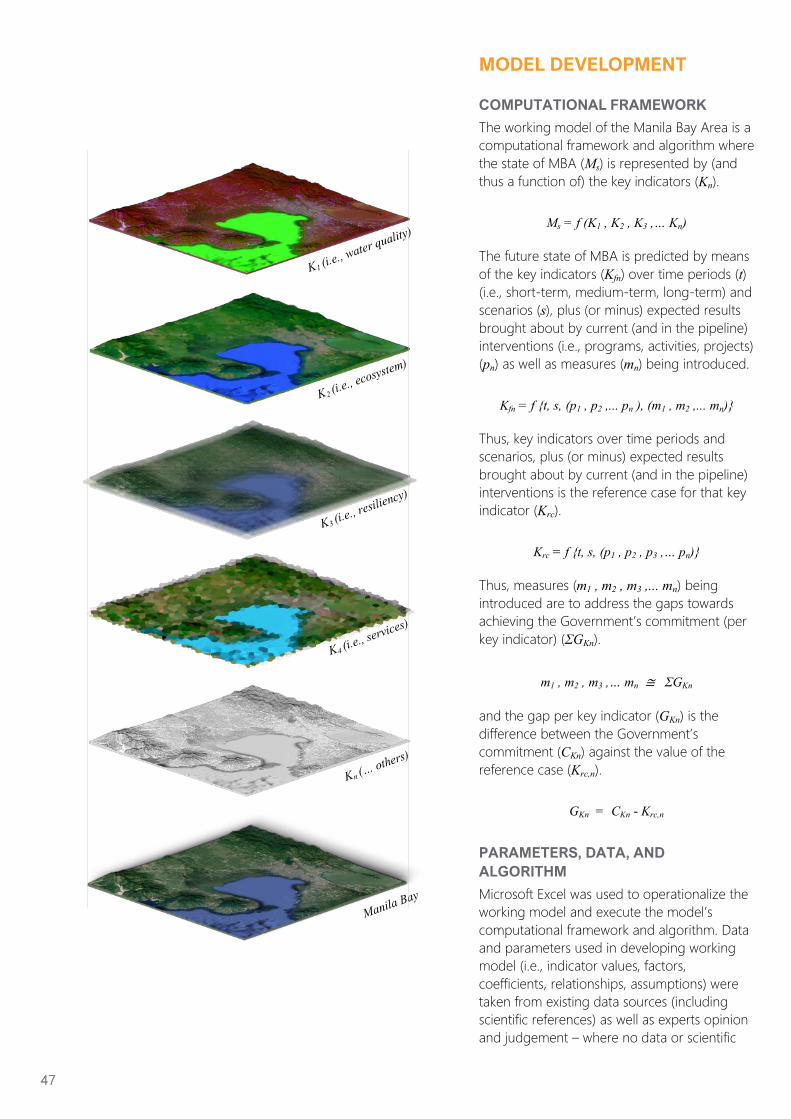
MODEL DEVELOPMENT
COMPUTATIONAL FRAMEWORK
The working model of the Manila Bay Area is a
computational framework and algorithm where
the state of MBA (Ms) is represented by (and
thus a function of) the key indicators (Kn).
Ms = f (K1 , K2 , K3 ,… Kn)
The future state of MBA is predicted by means
of the key indicators (Kfn) over time periods (t)
(i.e., short-term, medium-term, long-term) and
scenarios (s), plus (or minus) expected results
brought about by current (and in the pipeline)
interventions (i.e., programs, activities, projects)
(pn) as well as measures (mn) being introduced.
Kfn = f {t, s, (p1 , p2 ,... pn ), (m1 , m2 ,... mn)}
Thus, key indicators over time periods and
scenarios, plus (or minus) expected results
brought about by current (and in the pipeline)
interventions is the reference case for that key
indicator (Krc).
Krc = f {t, s, (p1 , p2 , p3 ,… pn)}
Thus, measures (m1 , m2 , m3 ,... mn) being
introduced are to address the gaps towards
achieving the Government’s commitment (per
key indicator) (ΣGKn).
m1 , m2 , m3 ,… mn ≅ ΣGKn
and the gap per key indicator (GKn) is the
difference between the Government’s
commitment (CKn) against the value of the
reference case (Krc,n).
GKn = CKn - Krc,n
PARAMETERS, DATA, AND
ALGORITHM
Microsoft Excel was used to operationalize the
working model and execute the model’s
computational framework and algorithm. Data
and parameters used in developing working
model (i.e., indicator values, factors,
coefficients, relationships, assumptions) were
taken from existing data sources (including
scientific references) as well as experts opinion
and judgement – where no data or scientific
47
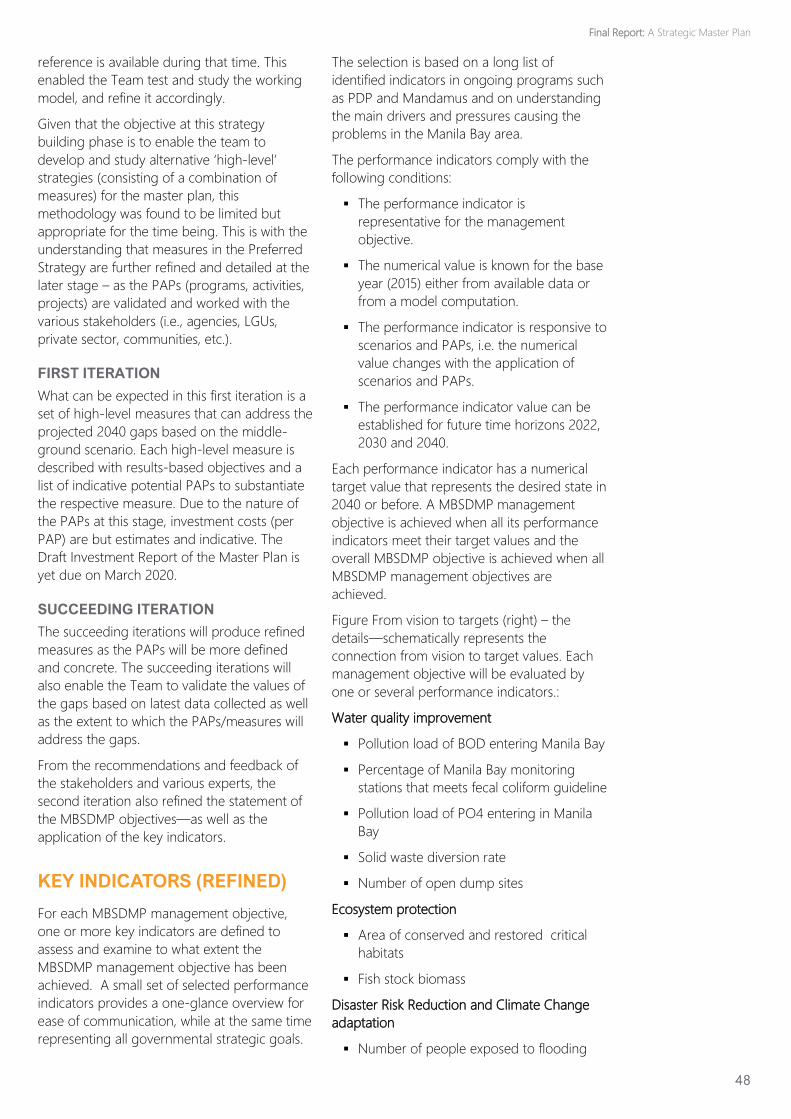
reference is available during that time. This
enabled the Team test and study the working
model, and refine it accordingly.
Given that the objective at this strategy
building phase is to enable the team to
develop and study alternative ‘high-level’
strategies (consisting of a combination of
measures) for the master plan, this
methodology was found to be limited but
appropriate for the time being. This is with the
understanding that measures in the Preferred
Strategy are further refined and detailed at the
later stage – as the PAPs (programs, activities,
projects) are validated and worked with the
various stakeholders (i.e., agencies, LGUs,
private sector, communities, etc.).
FIRST ITERATION
What can be expected in this first iteration is a
set of high-level measures that can address the
projected 2040 gaps based on the middle-
ground scenario. Each high-level measure is
described with results-based objectives and a
list of indicative potential PAPs to substantiate
the respective measure. Due to the nature of
the PAPs at this stage, investment costs (per
PAP) are but estimates and indicative. The
Draft Investment Report of the Master Plan is
yet due on March 2020.
SUCCEEDING ITERATION
The succeeding iterations will produce refined
measures as the PAPs will be more defined
and concrete. The succeeding iterations will
also enable the Team to validate the values of
the gaps based on latest data collected as well
as the extent to which the PAPs/measures will
address the gaps.
From the recommendations and feedback of
the stakeholders and various experts, the
second iteration also refined the statement of
the MBSDMP objectives—as well as the
application of the key indicators.
KEY INDICATORS (REFINED)
For each MBSDMP management objective,
one or more key indicators are defined to
assess and examine to what extent the
MBSDMP management objective has been
achieved. A small set of selected performance
indicators provides a one-glance overview for
ease of communication, while at the same time
representing all governmental strategic goals.
The selection is based on a long list of
identified indicators in ongoing programs such
as PDP and Mandamus and on understanding
the main drivers and pressures causing the
problems in the Manila Bay area.
The performance indicators comply with the
following conditions:
▪ The performance indicator is
representative for the management
objective.
▪ The numerical value is known for the base
year (2015) either from available data or
from a model computation.
▪ The performance indicator is responsive to
scenarios and PAPs, i.e. the numerical
value changes with the application of
scenarios and PAPs.
▪ The performance indicator value can be
established for future time horizons 2022,
2030 and 2040.
Each performance indicator has a numerical
target value that represents the desired state in
2040 or before. A MBSDMP management
objective is achieved when all its performance
indicators meet their target values and the
overall MBSDMP objective is achieved when all
MBSDMP management objectives are
achieved.
Figure From vision to targets (right) – the
details—schematically represents the
connection from vision to target values. Each
management objective will be evaluated by
one or several performance indicators.:
Water quality improvement
▪ Pollution load of BOD entering Manila Bay
▪ Percentage of Manila Bay monitoring
stations that meets fecal coliform guideline
▪ Pollution load of PO4 entering in Manila
Bay
▪ Solid waste diversion rate
▪ Number of open dump sites
Ecosystem protection
▪ Area of conserved and restored critical
habitats
▪ Fish stock biomass
Disaster Risk Reduction and Climate Change
adaptation
▪ Number of people exposed to flooding
48
Final Report: A Strategic Master Plan
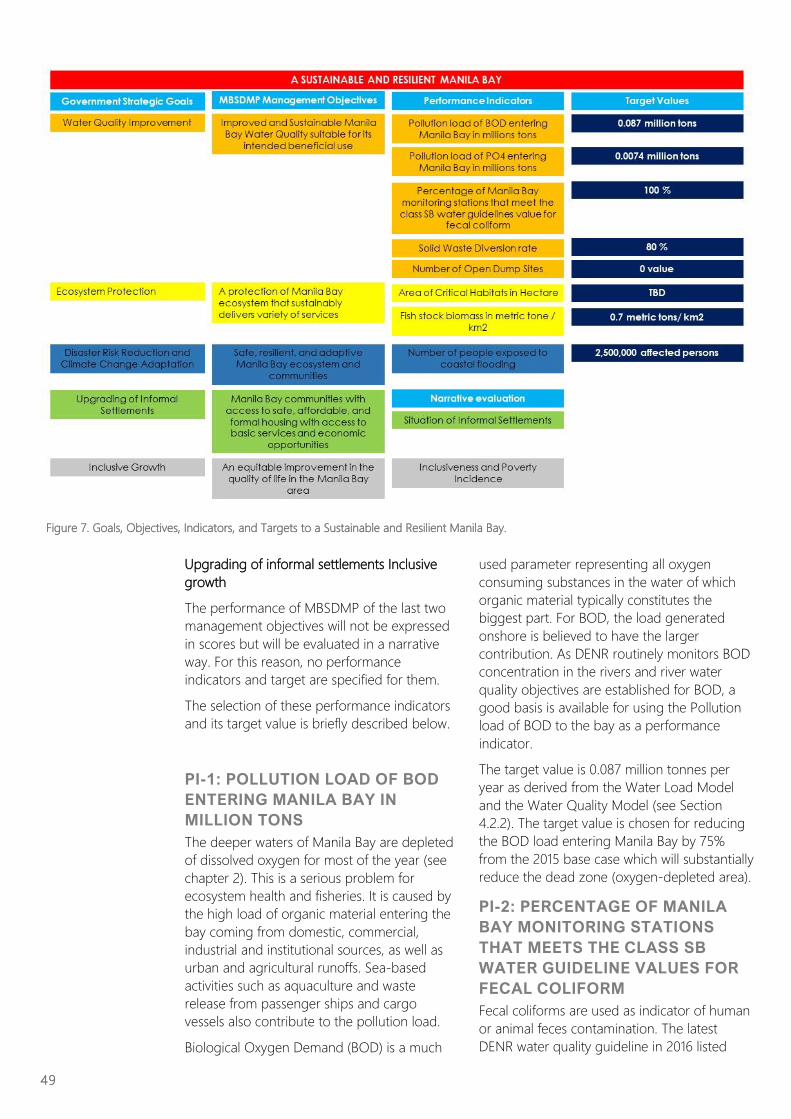
Upgrading of informal settlements Inclusive
growth
The performance of MBSDMP of the last two
management objectives will not be expressed
in scores but will be evaluated in a narrative
way. For this reason, no performance
indicators and target are specified for them.
The selection of these performance indicators
and its target value is briefly described below.
PI-1: POLLUTION LOAD OF BOD
ENTERING MANILA BAY IN
MILLION TONS
The deeper waters of Manila Bay are depleted
of dissolved oxygen for most of the year (see
chapter 2). This is a serious problem for
ecosystem health and fisheries. It is caused by
the high load of organic material entering the
bay coming from domestic, commercial,
industrial and institutional sources, as well as
urban and agricultural runoffs. Sea-based
activities such as aquaculture and waste
release from passenger ships and cargo
vessels also contribute to the pollution load.
Biological Oxygen Demand (BOD) is a much
used parameter representing all oxygen
consuming substances in the water of which
organic material typically constitutes the
biggest part. For BOD, the load generated
onshore is believed to have the larger
contribution. As DENR routinely monitors BOD
concentration in the rivers and river water
quality objectives are established for BOD, a
good basis is available for using the Pollution
load of BOD to the bay as a performance
indicator.
The target value is 0.087 million tonnes per
year as derived from the Water Load Model
and the Water Quality Model (see Section
4.2.2). The target value is chosen for reducing
the BOD load entering Manila Bay by 75%
from the 2015 base case which will substantially
reduce the dead zone (oxygen-depleted area).
PI-2: PERCENTAGE OF MANILA
BAY MONITORING STATIONS
THAT MEETS THE CLASS SB
WATER GUIDELINE VALUES FOR
FECAL COLIFORM
Fecal coliforms are used as indicator of human
or animal feces contamination. The latest
DENR water quality guideline in 2016 listed
49
Figure 7. Goals, Objectives, Indicators, and Targets to a Sustainable and Resilient Manila Bay.
fecal coliform as one of the primary
parameters recommended for water quality
monitoring for coastal and marine waters.
Stations near the coasts, river outfalls and
bathing beaches are often used as reference
points in describing the water quality condition
of Manila Bay itself. Fecal coliforms are
included in the Class SB water quality
objectives and therefore are a direct link to the
Mandamus objective to restore Manila Bay to
Class SB.
The Class SB objective for the Fecal coliforms is
200 MPN/100 ml. All Manila Bay monitoring
stations have to meet this standard and
therefore the percentage of monitoring
stations meeting this standard is set to 100%.
PI-3: POLLUTION LOAD OF PO4
ENTERING MANILA BAY IN
MILLION TONS
Nutrients, particularly ammonia, nitrate and
phosphate, are generally associated with
sewage and wastewater discharges.
Phosphates are considered a major contributor
to eutrophication of water bodies often
leading to harmful algal bloom that prevents
light and oxygen from getting into water and
that can be toxic to aquatic life.
From these three nutrients, phosphate (PO4) is
selected as indicator as it is included in the
Class SB water quality objectives. Therefore, a
direct link with the Mandamus objective to
restore Manila Bay to Class SB can be made.
Ammonia and Nitrate are not included in Class
SB. PO4 is also regularly monitored in the
DENR-EMB Manila Bay offshore stations.
The Class SB objective for the PO4
concentration is 0.5 mg/l. However, as the
observed dynamics of PO4 in Manila Bay are
not fully understood, insufficient knowledge is
currently available to link the PO4 load to a
PO4 concentration in the bay (see chapter 2).
Pragmatically, a 75% PO4 load reduction from
the 2015 base case conform the BOD target is
set, leading to an PO4 load of 0.0075 million
tonnes per year.
PI-4: NUMBER OF PEOPLE
AFFECTED BY COASTAL
FLOODING
Of the natural hazards in the Manila Bay area,
the MBSDMP addresses coastal flooding from
the sea. In some areas, coastal flooding occurs
frequently, i.e., every high tide, every spring
tide, while in other areas coastal flooding
occurs only with severe typhoons. Land
subsidence aggravates coastal flooding and
sea level rise is a long term threat.
Casualties and damage to infrastructure and
livelihood are typical indicators for DRR and
(risk of) CCA. However as these are difficult to
predict with the available data, the more
straightforward number of people affected by
coastal flooding is selected as a performance
indicator under the assumption that there is
correlation with infrastructure and livelihoods
affected. Level of protection, risk reduction and
adaptation are ideally set for a certain return
period; often based on a least cost approach
by adding annualized costs of responses to the
annual expected damages given a protection
level.
According to the Global Target B of the Sendai
Framework of “substantially reducing the
number of people directly affected by
disasters”, the target adopted for this indicator
is to reduce the number of people exposed to
coastal flooding by 50% by 2030 as compared
to the Base case 2015. Derived from the model
and assuming a 1:100 year flood event, the
number of people potentially at risk of coastal
flooding is about five million people. Thus, the
target value is 2.5 million people potentially at
risk in a 1:100 year flood event by 2030. To be
consistent with the target stated in the
OPMBCS, the number of people affected by
coastal flooding in 2040 should be zero.
PI-5: AREA OF CONSERVED AND
RESTORED PROTECTEDCRITICAL
HABITATS IN HECTARES
Habitat type, size, distribution, intactness, and
connectivity are important in sustaining
ecosystem productivity and resilience. In
Manila Bay, these habitat types include
mangroves, coral reefs and soft bottom
habitats including tidal flats, both vegetated
and un-vegetated. Habitats of good ecological
quality are the basis for all flora and fauna. As
data for flora and fauna based indicators such
as biodiversity are relatively scarce except for
avifauna and such future projections are very
complicated, habitat area is a much used
performance indicator.
Measuring the size of natural habitat areas
under a certain degree of protection is a good
indicator for ecosystem health and function
since emergent properties of complex systems
50
Final Report: A Strategic Master Plan
are directly influenced by their size and
distribution. As an indicator, determining
habitat size is ideal for the following reasons:
(1) it is specific, non-destructive and
interpretable; (2) it could be measured in space
and time; (3) it has a good association with
physical-chemical and biological processes; (4)
can be cost effectively monitored; (5) it is
grounded in theory; and, (6) provides
important information that could be used in
management.
The target value for the Area of Critical
Habitats is set to 21,660 ha. Note that for
mangroves, only 5% (instead of 40%) of the
original 1900 cover was targeted to be
restored since based on the consultation
meetings and expert opinion, most of the
previous mangrove area is already titled or
converted to other land use (i.e., subdivisions
in Cavite). However, for mudflats, 40% of the
1977 base value is recommended for strict
protection. For coral reefs, 40% of the 2015
values is recommended for strict protection.
For macrophyte beds, 40% of 2015 current
value is also for strict protection. Lastly, the
41,695 hectares of shallow, unvegetated
subtidal foreshore area must be properly
managed both for fisheries and wildlife
conservation. However, 40% of 16,678 hectares
of these area in Manila Bay is recommended to
be placed under strict protection.
PI-6: SOLID WASTE DIVERSION
RATE
All solid waste must be handled properly, so
that no solid waste ends up in Manila Bay.
Based on RA 9003, solid waste materials
should be segregated at the source in order to
reduce or eliminate the amount of solid wastes
that needs to be disposed off in sanitary
landfills. Diversion to sanitory landfills should
only occur after composting, recovery,
recycling and reuse of collected materials has
been exhausted. The Solid waste diversion rate
is included as an indicator in the Philippine
Development Plan 2017-2022.
The target for the solid waste diversion rate in
the Philippine Development Plan for 2017 to
2022 is 80% by year 2022 and to be sustained
until 2050.
PI-7: FISH STOCK BIOMASS IN
METRIC TONS/KM2
Fish populations are integral to the ecology of
the natural system of Manila Bay and to the
economy of the surrounding communities. The
state of fisheries, to a degree, is a good
representation of the relative condition of the
natural environment and the socio-economic
status of the communities in its vicinity. Hence,
the fish stock biomass is selected as a
performance indicator in evaluating
sustainability and resiliency of Manila Bay. Fish
stock biomass (tons/km2) is a commonly used
indicator to reflect the state of the fish
populations and its productivity in a particular
area. Only fish population will be considered.
Fish stock biomass derived from aquaculture
will not be included primarily since the biomass
of these farmed fish is strongly influenced by
artificial inputs and not by natural processes.
Fish stock biomass data for Manila Bay was
generally few and collected far in between.
From 1947 to 1993, only three stock
assessments were conducted in Manila Bay.
The results showed a significant decline in fish
productivity from 4.61 tons/km2 in 1947 (Warfel
and Manacop 1950) to only 0.47 tons/km2 in
1993 (MADECOR and National Museum, 1995)
and have remained low ever since with 0.32
tons/km2 in 2014 (Bendano et al. 2017) and
0.48 tons/km2 in 2015 (Bendano et al. 2017)).
The target value for fish stock biomass is set at
0.70 metric tons/km2 by 2040. The 46%
increase in fish biomass from the reference
case is achievable with the implementation of
strategies geared towards increasing the
abundance of large, mature individuals and
reducing catch of immature individuals which
will enhance the ability of the fish stock to
replenish in time. And also with the
combination of strict protection and
management of critical habitats, fish stock
biomass will improve through time.
PI-8: NUMBER OF OPEN DUMP
SITES
Open dumps, especially those near coastal
areas, are major sources of solid wastes
floating in Manila Bay especially during
monsoon rains and strong typhoon. Open
dumps also produce leachate from the
garbage which pollutes the waters, is toxic to
aquatic life and is a potential source of
groundwater contamination. Any practice or
disposal involving the use of open dumpsites is
prohibited under the RA 9003. Conversion of
open dumpsites into controlled disposal
facilities was allowed only until 2006 as a
temporary and remedial measure.
51
Nevertheless, all over the country, many open
and controlled disposal facilities remain in
operation at present posing continuous health
risks to human health and the environment.
Therefore, the number of open dump sites is a
useful performance indicator for both the
implementation and enforcement of
regulations and for solid waste ending up
uncontrollably in Manila Bay. As open dump
sites are prohibited under RA 9003, the target
value is set to 0 (zero).
MB MODEL = COMPUTER
MODELS WITH EXPERT
KNOWLEDGE
In projecting the future values of key indicators
per scenario and the assessment of how the
measures address the gap, a combined
approach of using computer models and
expert knowledge has been applied. These two
inputs might seem quite different but a
computer model is just encapsulated expert
knowledge. Computers models were used
when appropriate models and sufficient data
were available. In all other cases use was made
of expert knowledge and estimates.
The assessment approach takes the following
steps for each of the Key Indicators:
▪ Quantification of the reference case value
either based on computer model support
and/or on expert assessment.
▪ Determination of the gap value as the
difference between the reference case
value and the target value
▪ Normalization of the gap value to 100%
▪ Determination of the extent of measures
(a thematic package of PAPs) contributes
to closing the gap. Thus, each measure is
assigned a % gap closure either based on
computer model support or on expert
assessment.
▪ Combination of measures and
subsequently Strategies. The % gap
closure for each measure is accumulated.
A gap is fully closed when the combined
% gap closures add up to 100%.
The impacts of the measures and strategies are
expressed in a percentage (%) of the gap that
these interventions will close of a certain
Performance Indicator. A score of 100% means
that the full gap is closed and that the target
objective for that Performance Indicator will be
achieved. In case models were available the
impacts were determined in absolute effects (#
of people, tons, etc.). These absolute impacts
were translated into a % of gap closure.
Not all PAPs will directly contribute to closing a
gap but still are important to enable other
PAPs to become effective. Examples are
policies, new legislation, awareness raising and
capacity building. Still, their implementation is
crucial and a small % of gap-closure has been
determined for such measures. Supporting
studies have not been given a % gap closure.
The percentages of gap closure by PAP as
used in the analysis are given in the tables of
Section 5.5.
In Strategy Design a selection is made of the
PAPs that will be included in a certain strategy.
The impact of that strategy will be determined
by summing the % gap closure of each
individual PAP. This assumes that the principle
of superimposition can be applied, i.e. that the
measures do not influence each other. In
general, this will be the case, but experts have
been consulted to make corrections in this
summing when PAPs do influence each other.
This applies only for the summing. In case
impacts are determined by models most
effects of these interactions and feedbacks are
already included in the model concept.
SUPPORTING TOOLS TO
DERIVE KEY INDICATOR
VALUES
The basis of the supporting tools is formed by
the models that were updated in 2017 and
2018 as one of the OPMBCS 2017-2022
activities, to be precise the “Updating and
Application of the Nutrient Reduction
Modeling in the Laguna de Bay-Pasig River-
Manila Bay Watershed” by MBCO and LLDA as
partner agency. In the MBSDMP project, these
models were expanded with the Manila Bay
Spatial Model that forecasts where people will
live in the future years 2022, 2030 and 2040.
With the output of Manila Bay Spatial Model,
the Waste Load Model that forecasts the
pollution load of BOD, nutrients and fecal
coliforms per river catchment, has been
enhanced and improved for future time
horizons. The output of the Manila Bay Spatial
Model has also been used to estimate the
number of people affected by coastal flooding.
52
Final Report: A Strategic Master Plan
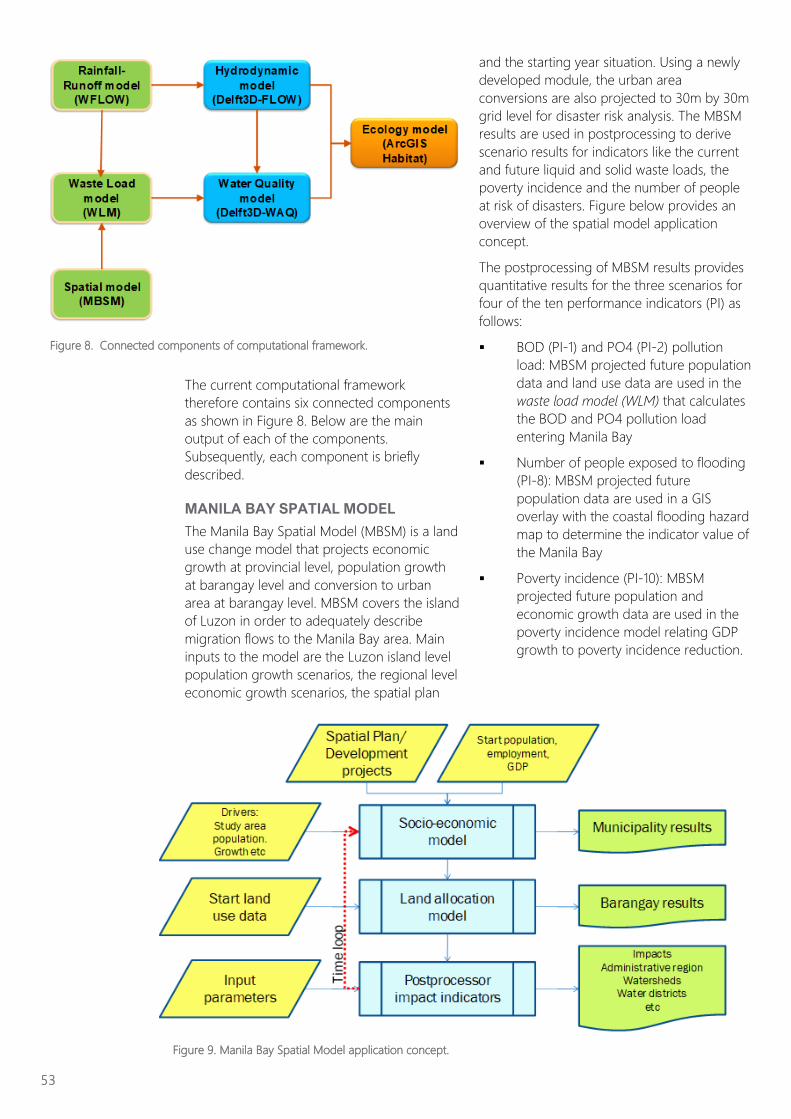
The current computational framework
therefore contains six connected components
as shown in Figure 8. Below are the main
output of each of the components.
Subsequently, each component is briefly
described.
MANILA BAY SPATIAL MODEL
The Manila Bay Spatial Model (MBSM) is a land
use change model that projects economic
growth at provincial level, population growth
at barangay level and conversion to urban
area at barangay level. MBSM covers the island
of Luzon in order to adequately describe
migration flows to the Manila Bay area. Main
inputs to the model are the Luzon island level
population growth scenarios, the regional level
economic growth scenarios, the spatial plan
and the starting year situation. Using a newly
developed module, the urban area
conversions are also projected to 30m by 30m
grid level for disaster risk analysis. The MBSM
results are used in postprocessing to derive
scenario results for indicators like the current
and future liquid and solid waste loads, the
poverty incidence and the number of people
at risk of disasters. Figure below provides an
overview of the spatial model application
concept.
The postprocessing of MBSM results provides
quantitative results for the three scenarios for
four of the ten performance indicators (PI) as
follows:
▪ BOD (PI-1) and PO4 (PI-2) pollution
load: MBSM projected future population
data and land use data are used in the
waste load model (WLM) that calculates
the BOD and PO4 pollution load
entering Manila Bay
▪ Number of people exposed to flooding
(PI-8): MBSM projected future
population data are used in a GIS
overlay with the coastal flooding hazard
map to determine the indicator value of
the Manila Bay
▪ Poverty incidence (PI-10): MBSM
projected future population and
economic growth data are used in the
poverty incidence model relating GDP
growth to poverty incidence reduction.
53
Figure 8. Connected components of computational framework.
Figure 9. Manila Bay Spatial Model application concept.
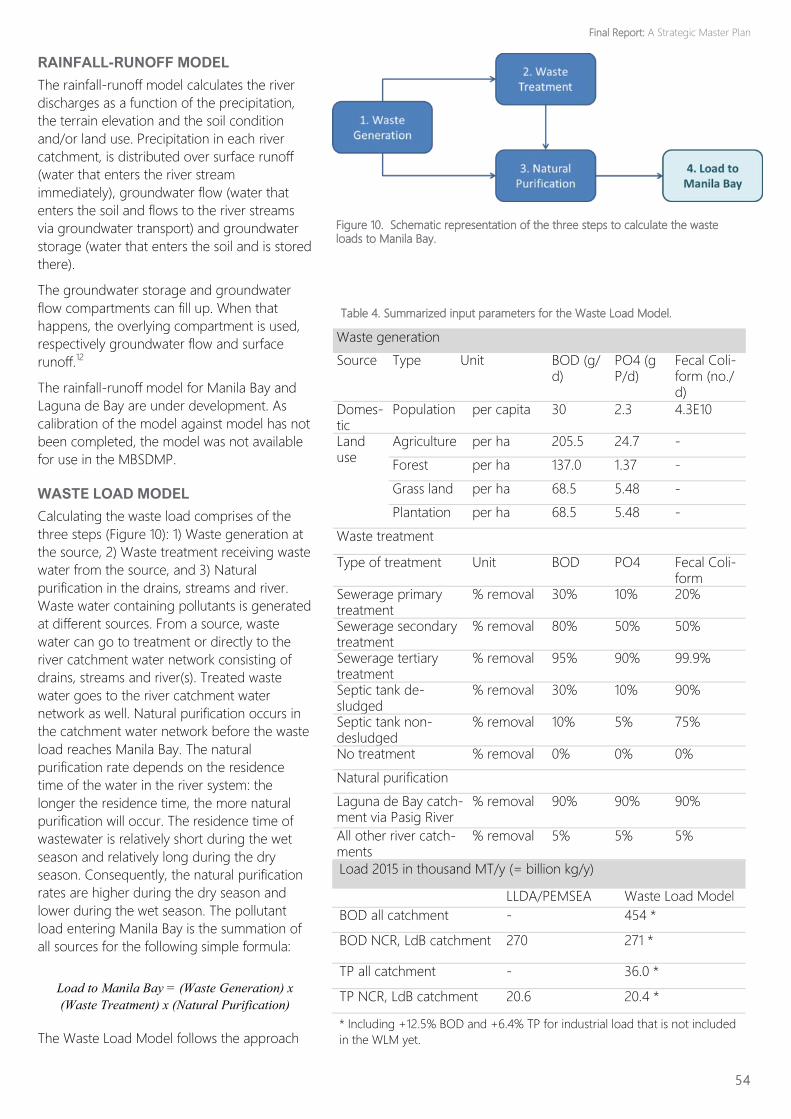
RAINFALL-RUNOFF MODEL
The rainfall-runoff model calculates the river
discharges as a function of the precipitation,
the terrain elevation and the soil condition
and/or land use. Precipitation in each river
catchment, is distributed over surface runoff
(water that enters the river stream
immediately), groundwater flow (water that
enters the soil and flows to the river streams
via groundwater transport) and groundwater
storage (water that enters the soil and is stored
there).
The groundwater storage and groundwater
flow compartments can fill up. When that
happens, the overlying compartment is used,
respectively groundwater flow and surface
runoff.12
The rainfall-runoff model for Manila Bay and
Laguna de Bay are under development. As
calibration of the model against model has not
been completed, the model was not available
for use in the MBSDMP.
WASTE LOAD MODEL
Calculating the waste load comprises of the
three steps (Figure 10): 1) Waste generation at
the source, 2) Waste treatment receiving waste
water from the source, and 3) Natural
purification in the drains, streams and river.
Waste water containing pollutants is generated
at different sources. From a source, waste
water can go to treatment or directly to the
river catchment water network consisting of
drains, streams and river(s). Treated waste
water goes to the river catchment water
network as well. Natural purification occurs in
the catchment water network before the waste
load reaches Manila Bay. The natural
purification rate depends on the residence
time of the water in the river system: the
longer the residence time, the more natural
purification will occur. The residence time of
wastewater is relatively short during the wet
season and relatively long during the dry
season. Consequently, the natural purification
rates are higher during the dry season and
lower during the wet season. The pollutant
load entering Manila Bay is the summation of
all sources for the following simple formula:
Load to Manila Bay = (Waste Generation) x
(Waste Treatment) x (Natural Purification)
The Waste Load Model follows the approach
54
Waste generation
Source Type Unit BOD (g/d)
PO4 (g P/d)
Fecal Coli-form (no./d)
Domes-tic
Population per capita 30 2.3 4.3E10
Land use
Agriculture per ha 205.5 24.7 -
Forest per ha 137.0 1.37 -
Grass land per ha 68.5 5.48 -
Plantation per ha 68.5 5.48 -
Waste treatment
Type of treatment Unit BOD PO4 Fecal Coli-form
Sewerage primary treatment
% removal 30% 10% 20%
Sewerage secondary treatment
% removal 80% 50% 50%
Sewerage tertiary treatment
% removal 95% 90% 99.9%
Septic tank de-sludged
% removal 30% 10% 90%
Septic tank non-desludged
% removal 10% 5% 75%
No treatment % removal 0% 0% 0%
Natural purification
Laguna de Bay catch-ment via Pasig River
% removal 90% 90% 90%
All other river catch-ments
% removal 5% 5% 5%
Table 4. Summarized input parameters for the Waste Load Model.
Load 2015 in thousand MT/y (= billion kg/y)
LLDA/PEMSEA Waste Load Model
BOD all catchment - 454 *
BOD NCR, LdB catchment 270 271 *
TP all catchment - 36.0 *
TP NCR, LdB catchment 20.6 20.4 *
* Including +12.5% BOD and +6.4% TP for industrial load that is not included
in the WLM yet.
Figure 10. Schematic representation of the three steps to calculate the waste loads to Manila Bay.
Final Report: A Strategic Master Plan
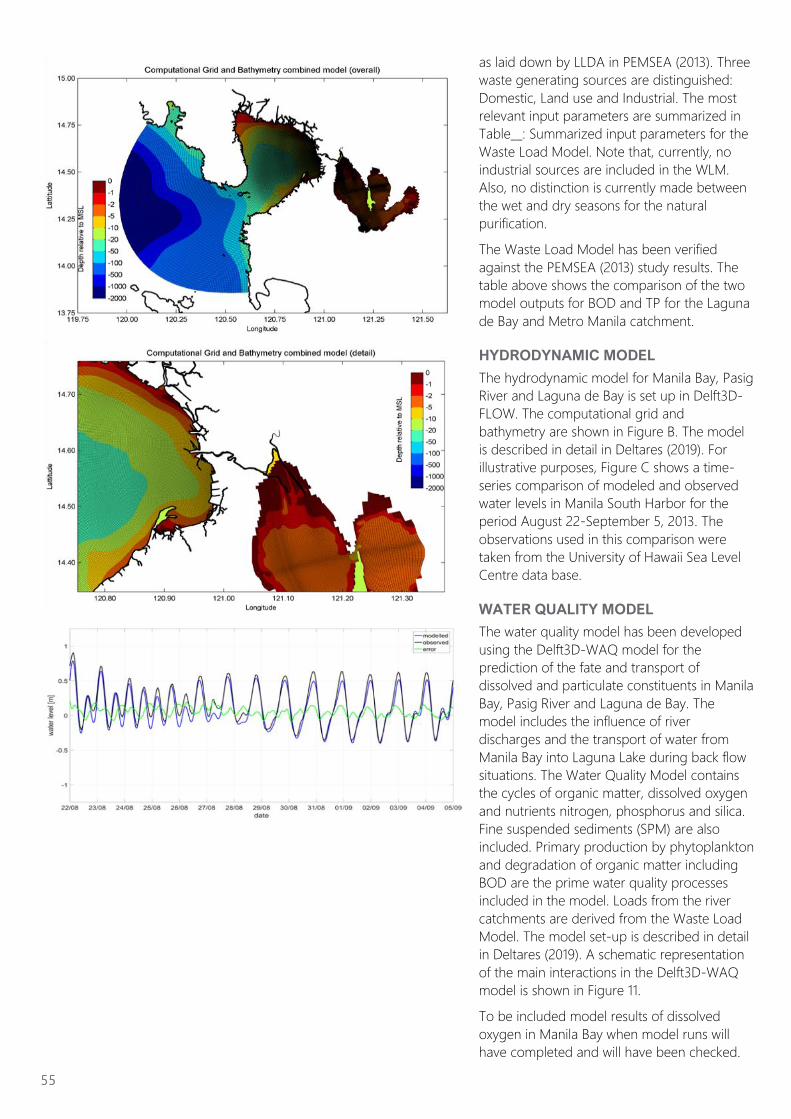
as laid down by LLDA in PEMSEA (2013). Three
waste generating sources are distinguished:
Domestic, Land use and Industrial. The most
relevant input parameters are summarized in
Table__: Summarized input parameters for the
Waste Load Model. Note that, currently, no
industrial sources are included in the WLM.
Also, no distinction is currently made between
the wet and dry seasons for the natural
purification.
The Waste Load Model has been verified
against the PEMSEA (2013) study results. The
table above shows the comparison of the two
model outputs for BOD and TP for the Laguna
de Bay and Metro Manila catchment.
HYDRODYNAMIC MODEL
The hydrodynamic model for Manila Bay, Pasig
River and Laguna de Bay is set up in Delft3D-
FLOW. The computational grid and
bathymetry are shown in Figure B. The model
is described in detail in Deltares (2019). For
illustrative purposes, Figure C shows a time-
series comparison of modeled and observed
water levels in Manila South Harbor for the
period August 22-September 5, 2013. The
observations used in this comparison were
taken from the University of Hawaii Sea Level
Centre data base.
WATER QUALITY MODEL
The water quality model has been developed
using the Delft3D-WAQ model for the
prediction of the fate and transport of
dissolved and particulate constituents in Manila
Bay, Pasig River and Laguna de Bay. The
model includes the influence of river
discharges and the transport of water from
Manila Bay into Laguna Lake during back flow
situations. The Water Quality Model contains
the cycles of organic matter, dissolved oxygen
and nutrients nitrogen, phosphorus and silica.
Fine suspended sediments (SPM) are also
included. Primary production by phytoplankton
and degradation of organic matter including
BOD are the prime water quality processes
included in the model. Loads from the river
catchments are derived from the Waste Load
Model. The model set-up is described in detail
in Deltares (2019). A schematic representation
of the main interactions in the Delft3D-WAQ
model is shown in Figure 11.
To be included model results of dissolved
oxygen in Manila Bay when model runs will
have completed and will have been checked.
55
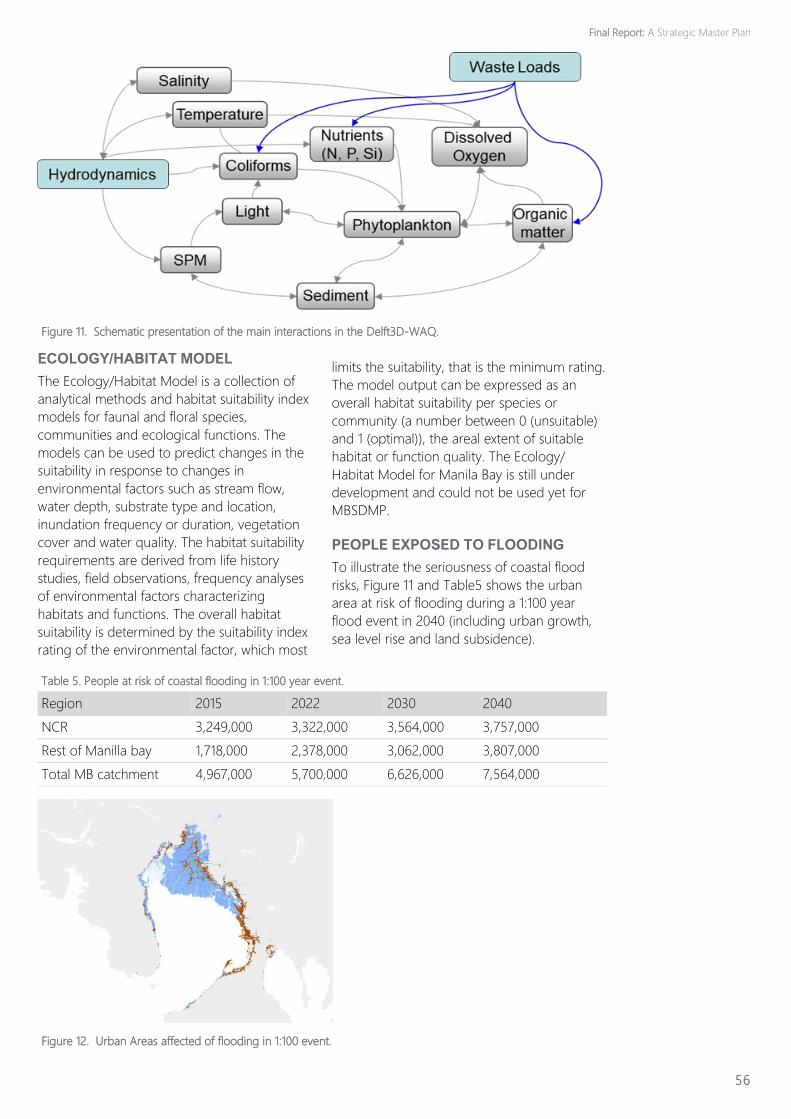
ECOLOGY/HABITAT MODEL
The Ecology/Habitat Model is a collection of
analytical methods and habitat suitability index
models for faunal and floral species,
communities and ecological functions. The
models can be used to predict changes in the
suitability in response to changes in
environmental factors such as stream flow,
water depth, substrate type and location,
inundation frequency or duration, vegetation
cover and water quality. The habitat suitability
requirements are derived from life history
studies, field observations, frequency analyses
of environmental factors characterizing
habitats and functions. The overall habitat
suitability is determined by the suitability index
rating of the environmental factor, which most
limits the suitability, that is the minimum rating.
The model output can be expressed as an
overall habitat suitability per species or
community (a number between 0 (unsuitable)
and 1 (optimal)), the areal extent of suitable
habitat or function quality. The Ecology/
Habitat Model for Manila Bay is still under
development and could not be used yet for
MBSDMP.
PEOPLE EXPOSED TO FLOODING
To illustrate the seriousness of coastal flood
risks, Figure 11 and Table5 shows the urban
area at risk of flooding during a 1:100 year
flood event in 2040 (including urban growth,
sea level rise and land subsidence).
56
Figure 11. Schematic presentation of the main interactions in the Delft3D-WAQ.
Table 5. People at risk of coastal flooding in 1:100 year event.
Region 2015 2022 2030 2040
NCR 3,249,000 3,322,000 3,564,000 3,757,000
Rest of Manilla bay 1,718,000 2,378,000 3,062,000 3,807,000
Total MB catchment 4,967,000 5,700,000 6,626,000 7,564,000
Figure 12. Urban Areas affected of flooding in 1:100 event.
Final Report: A Strategic Master Plan
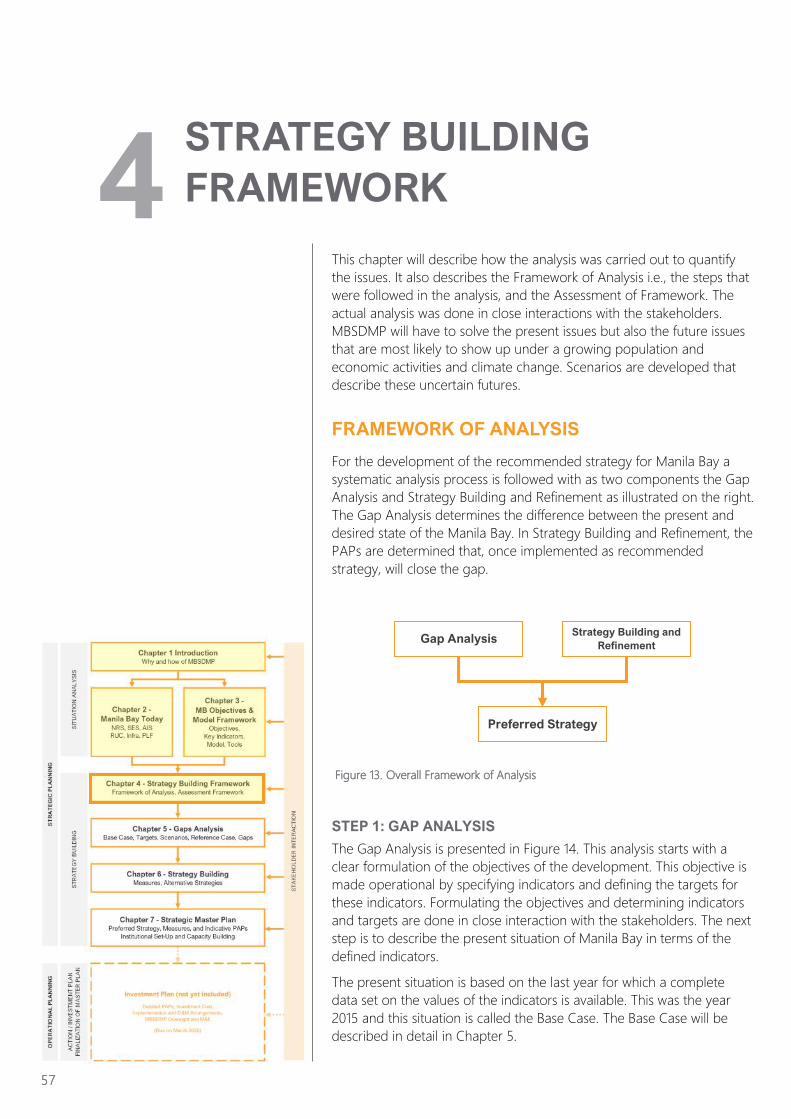
This chapter will describe how the analysis was carried out to quantify
the issues. It also describes the Framework of Analysis i.e., the steps that
were followed in the analysis, and the Assessment of Framework. The
actual analysis was done in close interactions with the stakeholders.
MBSDMP will have to solve the present issues but also the future issues
that are most likely to show up under a growing population and
economic activities and climate change. Scenarios are developed that
describe these uncertain futures.
FRAMEWORK OF ANALYSIS
For the development of the recommended strategy for Manila Bay a
systematic analysis process is followed with as two components the Gap
Analysis and Strategy Building and Refinement as illustrated on the right.
The Gap Analysis determines the difference between the present and
desired state of the Manila Bay. In Strategy Building and Refinement, the
PAPs are determined that, once implemented as recommended
strategy, will close the gap.
STEP 1: GAP ANALYSIS
The Gap Analysis is presented in Figure 14. This analysis starts with a
clear formulation of the objectives of the development. This objective is
made operational by specifying indicators and defining the targets for
these indicators. Formulating the objectives and determining indicators
and targets are done in close interaction with the stakeholders. The next
step is to describe the present situation of Manila Bay in terms of the
defined indicators.
The present situation is based on the last year for which a complete
data set on the values of the indicators is available. This was the year
2015 and this situation is called the Base Case. The Base Case will be
described in detail in Chapter 5.
57
STRATEGY BUILDING
FRAMEWORK
4
Figure 13. Overall Framework of Analysis
Gap Analysis Strategy Building and
Refinement
Preferred Strategy
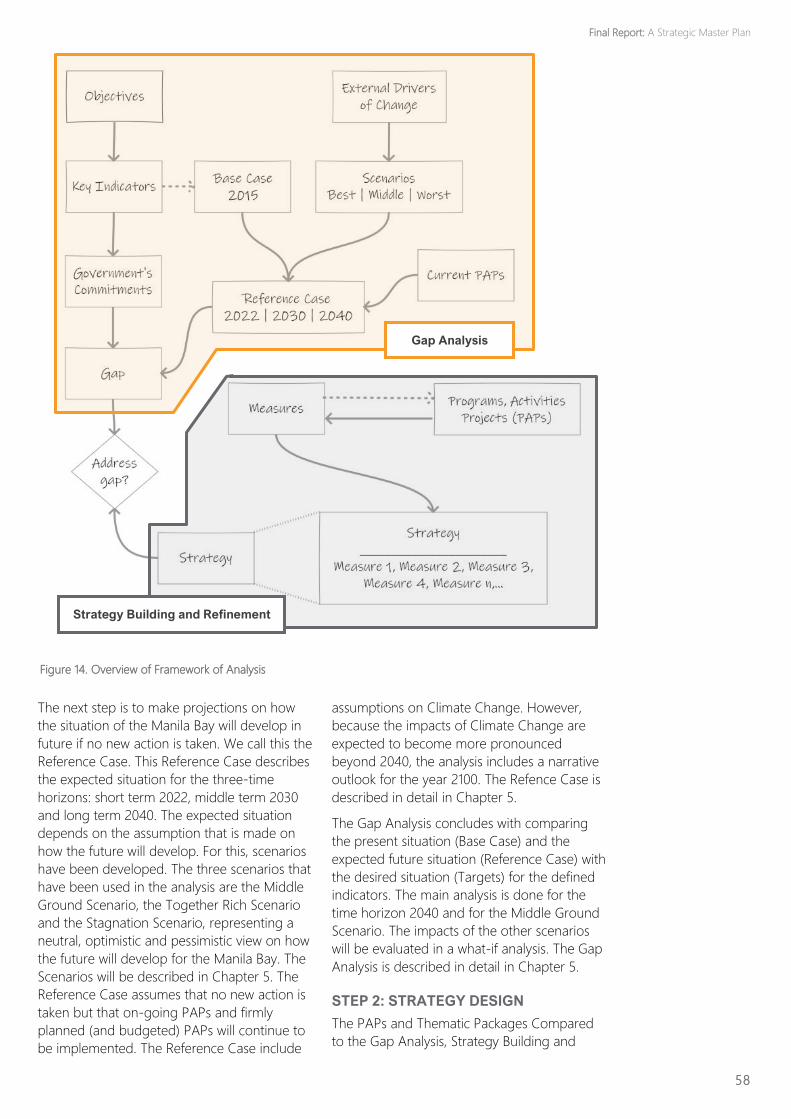
58
The next step is to make projections on how
the situation of the Manila Bay will develop in
future if no new action is taken. We call this the
Reference Case. This Reference Case describes
the expected situation for the three-time
horizons: short term 2022, middle term 2030
and long term 2040. The expected situation
depends on the assumption that is made on
how the future will develop. For this, scenarios
have been developed. The three scenarios that
have been used in the analysis are the Middle
Ground Scenario, the Together Rich Scenario
and the Stagnation Scenario, representing a
neutral, optimistic and pessimistic view on how
the future will develop for the Manila Bay. The
Scenarios will be described in Chapter 5. The
Reference Case assumes that no new action is
taken but that on-going PAPs and firmly
planned (and budgeted) PAPs will continue to
be implemented. The Reference Case include
assumptions on Climate Change. However,
because the impacts of Climate Change are
expected to become more pronounced
beyond 2040, the analysis includes a narrative
outlook for the year 2100. The Refence Case is
described in detail in Chapter 5.
The Gap Analysis concludes with comparing
the present situation (Base Case) and the
expected future situation (Reference Case) with
the desired situation (Targets) for the defined
indicators. The main analysis is done for the
time horizon 2040 and for the Middle Ground
Scenario. The impacts of the other scenarios
will be evaluated in a what-if analysis. The Gap
Analysis is described in detail in Chapter 5.
STEP 2: STRATEGY DESIGN
The PAPs and Thematic Packages Compared
to the Gap Analysis, Strategy Building and
Figure 14. Overview of Framework of Analysis
Strategy Building and Refinement
Gap Analysis
Final Report: A Strategic Master Plan
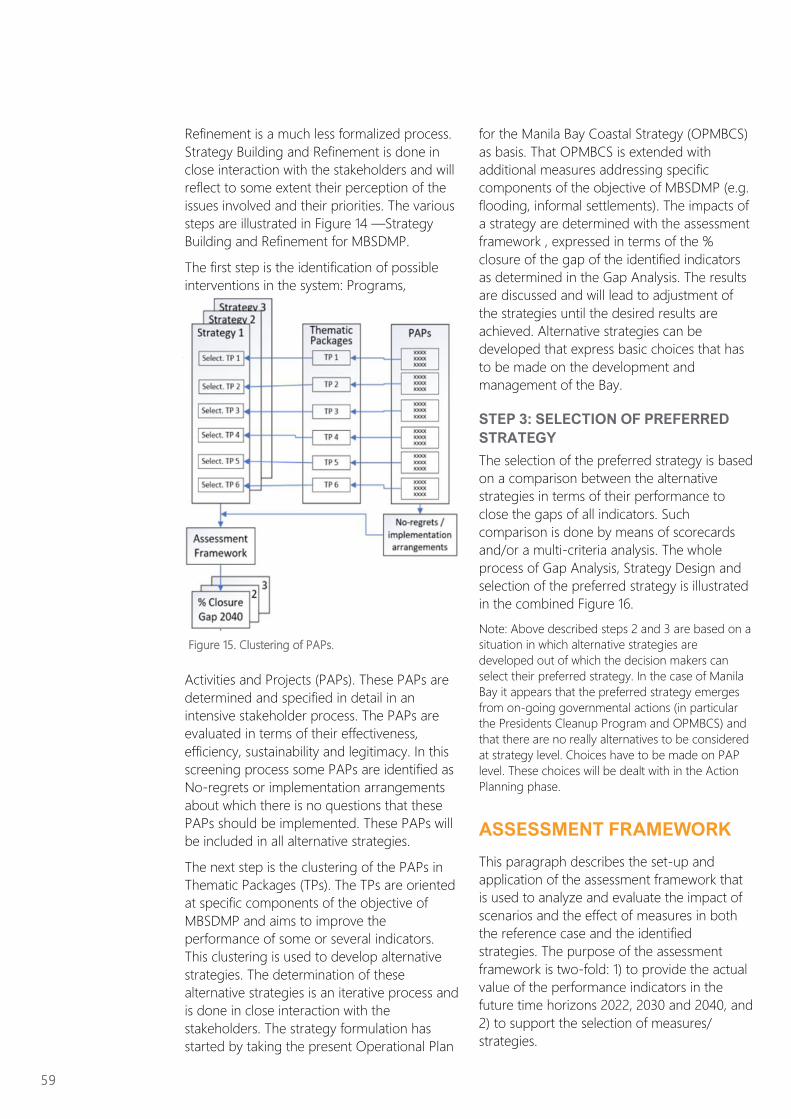
Refinement is a much less formalized process.
Strategy Building and Refinement is done in
close interaction with the stakeholders and will
reflect to some extent their perception of the
issues involved and their priorities. The various
steps are illustrated in Figure 14 —Strategy
Building and Refinement for MBSDMP.
The first step is the identification of possible
interventions in the system: Programs,
Activities and Projects (PAPs). These PAPs are
determined and specified in detail in an
intensive stakeholder process. The PAPs are
evaluated in terms of their effectiveness,
efficiency, sustainability and legitimacy. In this
screening process some PAPs are identified as
No-regrets or implementation arrangements
about which there is no questions that these
PAPs should be implemented. These PAPs will
be included in all alternative strategies.
The next step is the clustering of the PAPs in
Thematic Packages (TPs). The TPs are oriented
at specific components of the objective of
MBSDMP and aims to improve the
performance of some or several indicators.
This clustering is used to develop alternative
strategies. The determination of these
alternative strategies is an iterative process and
is done in close interaction with the
stakeholders. The strategy formulation has
started by taking the present Operational Plan
for the Manila Bay Coastal Strategy (OPMBCS)
as basis. That OPMBCS is extended with
additional measures addressing specific
components of the objective of MBSDMP (e.g.
flooding, informal settlements). The impacts of
a strategy are determined with the assessment
framework , expressed in terms of the %
closure of the gap of the identified indicators
as determined in the Gap Analysis. The results
are discussed and will lead to adjustment of
the strategies until the desired results are
achieved. Alternative strategies can be
developed that express basic choices that has
to be made on the development and
management of the Bay.
STEP 3: SELECTION OF PREFERRED
STRATEGY
The selection of the preferred strategy is based
on a comparison between the alternative
strategies in terms of their performance to
close the gaps of all indicators. Such
comparison is done by means of scorecards
and/or a multi-criteria analysis. The whole
process of Gap Analysis, Strategy Design and
selection of the preferred strategy is illustrated
in the combined Figure 16.
Note: Above described steps 2 and 3 are based on a
situation in which alternative strategies are
developed out of which the decision makers can
select their preferred strategy. In the case of Manila
Bay it appears that the preferred strategy emerges
from on-going governmental actions (in particular
the Presidents Cleanup Program and OPMBCS) and
that there are no really alternatives to be considered
at strategy level. Choices have to be made on PAP
level. These choices will be dealt with in the Action
Planning phase.
ASSESSMENT FRAMEWORK
This paragraph describes the set-up and
application of the assessment framework that
is used to analyze and evaluate the impact of
scenarios and the effect of measures in both
the reference case and the identified
strategies. The purpose of the assessment
framework is two-fold: 1) to provide the actual
value of the performance indicators in the
future time horizons 2022, 2030 and 2040, and
2) to support the selection of measures/
strategies.
59
Figure 15. Clustering of PAPs.
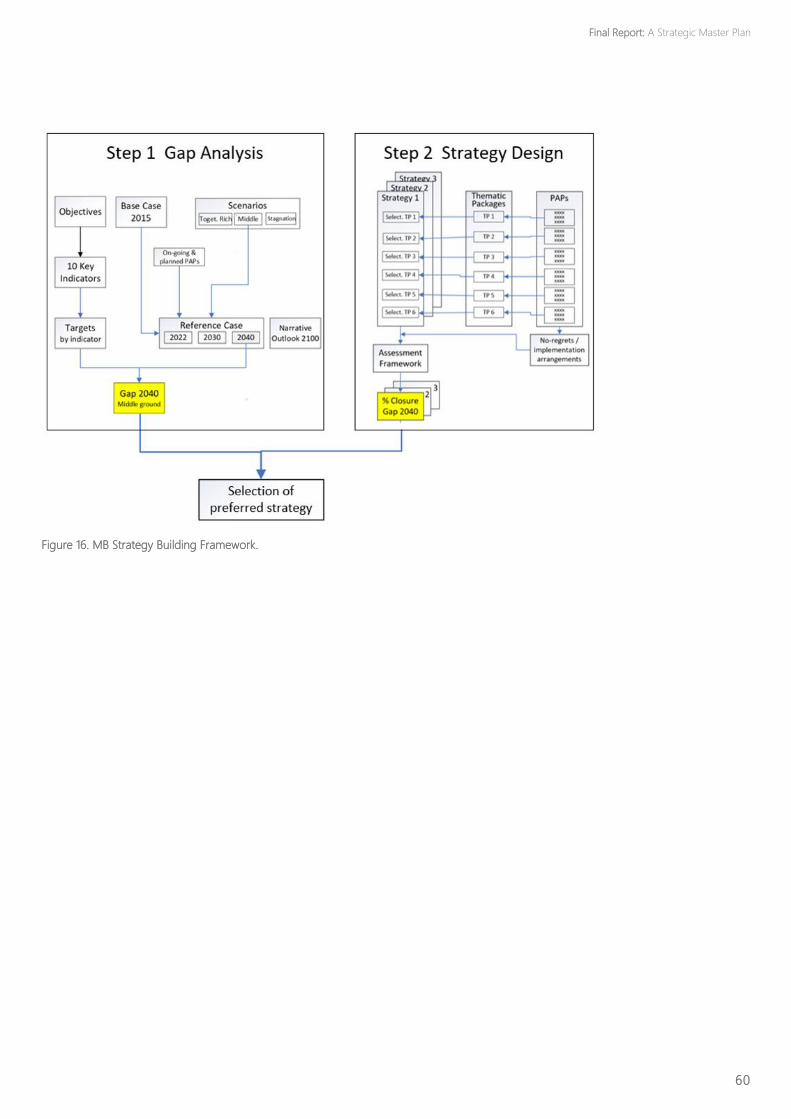
60
Figure 16. MB Strategy Building Framework.
Final Report: A Strategic Master Plan
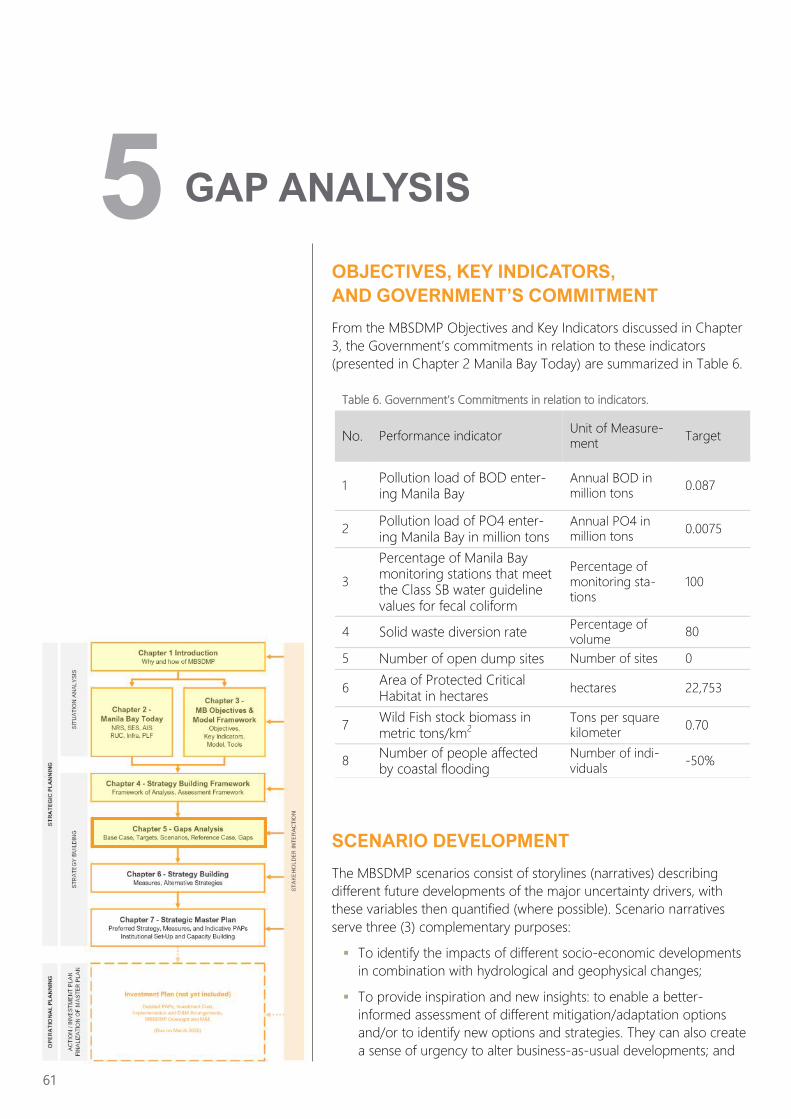
OBJECTIVES, KEY INDICATORS,
AND GOVERNMENT’S COMMITMENT
From the MBSDMP Objectives and Key Indicators discussed in Chapter
3, the Government’s commitments in relation to these indicators
(presented in Chapter 2 Manila Bay Today) are summarized in Table 6.
SCENARIO DEVELOPMENT
The MBSDMP scenarios consist of storylines (narratives) describing
different future developments of the major uncertainty drivers, with
these variables then quantified (where possible). Scenario narratives
serve three (3) complementary purposes:
▪ To identify the impacts of different socio-economic developments
in combination with hydrological and geophysical changes;
▪ To provide inspiration and new insights: to enable a better-
informed assessment of different mitigation/adaptation options
and/or to identify new options and strategies. They can also create
a sense of urgency to alter business-as-usual developments; and
61
GAP ANALYSIS
5
Table 6. Government’s Commitments in relation to indicators.
No. Performance indicator Unit of Measure-ment
Target
1 Pollution load of BOD enter-ing Manila Bay
Annual BOD in million tons
0.087
2 Pollution load of PO4 enter-ing Manila Bay in million tons
Annual PO4 in million tons
0.0075
3
Percentage of Manila Bay monitoring stations that meet the Class SB water guideline values for fecal coliform
Percentage of monitoring sta-tions
100
4 Solid waste diversion rate Percentage of volume
80
5 Number of open dump sites Number of sites 0
6 Area of Protected Critical Habitat in hectares
hectares 22,753
7 Wild Fish stock biomass in metric tons/km2
Tons per square kilometer
0.70
8 Number of people affected by coastal flooding
Number of indi-viduals
-50%
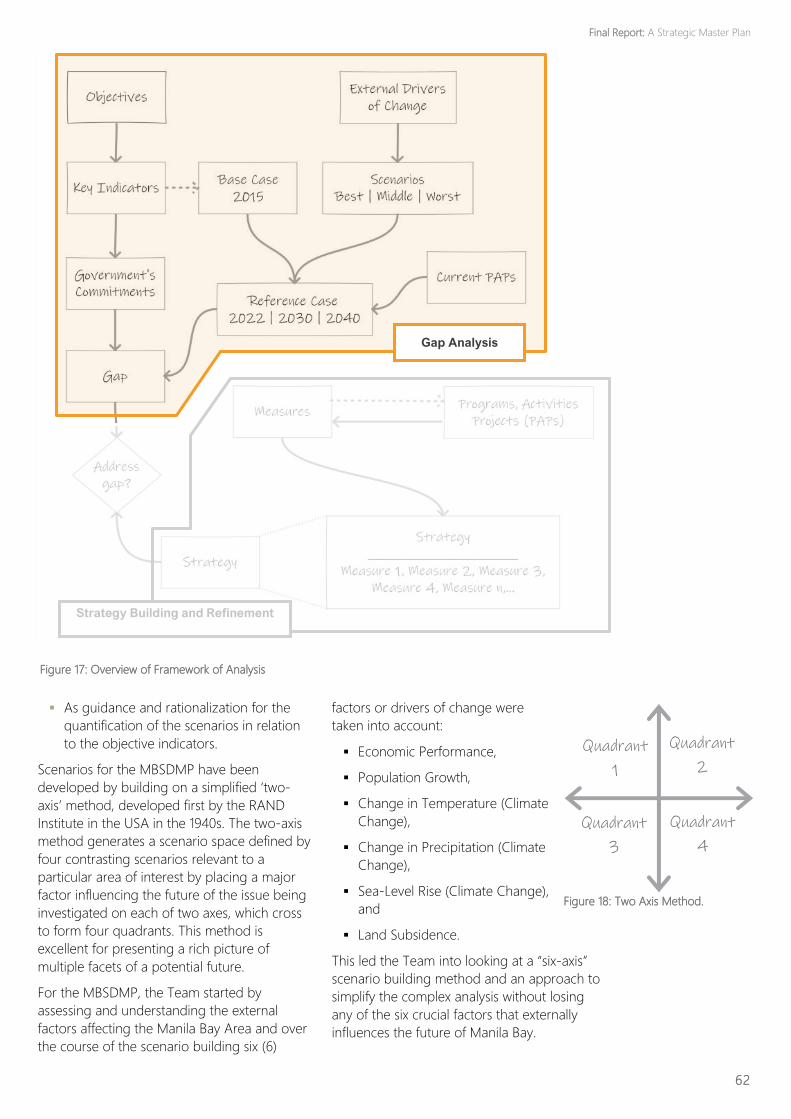
62
▪ As guidance and rationalization for the
quantification of the scenarios in relation
to the objective indicators.
Scenarios for the MBSDMP have been
developed by building on a simplified ‘two-
axis’ method, developed first by the RAND
Institute in the USA in the 1940s. The two-axis
method generates a scenario space defined by
four contrasting scenarios relevant to a
particular area of interest by placing a major
factor influencing the future of the issue being
investigated on each of two axes, which cross
to form four quadrants. This method is
excellent for presenting a rich picture of
multiple facets of a potential future.
For the MBSDMP, the Team started by
assessing and understanding the external
factors affecting the Manila Bay Area and over
the course of the scenario building six (6)
factors or drivers of change were
taken into account:
▪ Economic Performance,
▪ Population Growth,
▪ Change in Temperature (Climate
Change),
▪ Change in Precipitation (Climate
Change),
▪ Sea-Level Rise (Climate Change),
and
▪ Land Subsidence.
This led the Team into looking at a “six-axis”
scenario building method and an approach to
simplify the complex analysis without losing
any of the six crucial factors that externally
influences the future of Manila Bay.
Figure 1: MB Strategy Building Framework
Figure 17: Overview of Framework of Analysis
Quadrant
2
Quadrant
1
Quadrant
3
Quadrant
4
Strategy Building and Refinement
Gap Analysis
Figure 18: Two Axis Method.
Final Report: A Strategic Master Plan
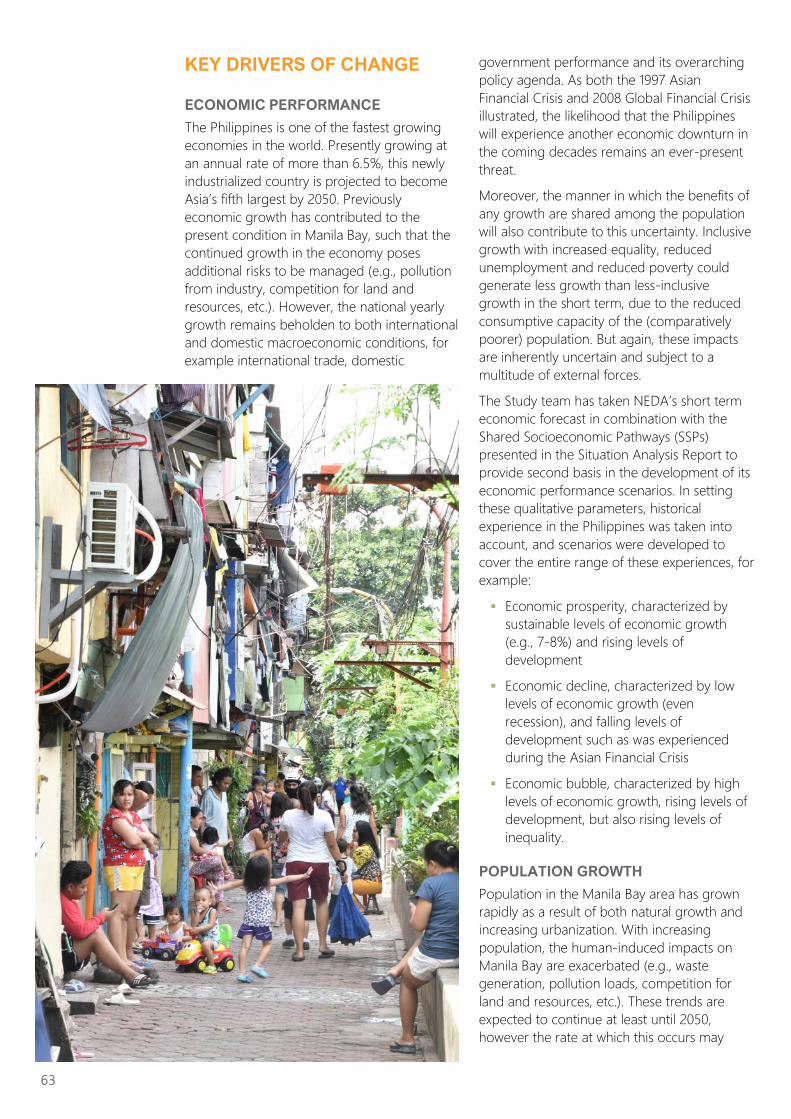
KEY DRIVERS OF CHANGE
ECONOMIC PERFORMANCE
The Philippines is one of the fastest growing
economies in the world. Presently growing at
an annual rate of more than 6.5%, this newly
industrialized country is projected to become
Asia’s fifth largest by 2050. Previously
economic growth has contributed to the
present condition in Manila Bay, such that the
continued growth in the economy poses
additional risks to be managed (e.g., pollution
from industry, competition for land and
resources, etc.). However, the national yearly
growth remains beholden to both international
and domestic macroeconomic conditions, for
example international trade, domestic
government performance and its overarching
policy agenda. As both the 1997 Asian
Financial Crisis and 2008 Global Financial Crisis
illustrated, the likelihood that the Philippines
will experience another economic downturn in
the coming decades remains an ever-present
threat.
Moreover, the manner in which the benefits of
any growth are shared among the population
will also contribute to this uncertainty. Inclusive
growth with increased equality, reduced
unemployment and reduced poverty could
generate less growth than less-inclusive
growth in the short term, due to the reduced
consumptive capacity of the (comparatively
poorer) population. But again, these impacts
are inherently uncertain and subject to a
multitude of external forces.
The Study team has taken NEDA’s short term
economic forecast in combination with the
Shared Socioeconomic Pathways (SSPs)
presented in the Situation Analysis Report to
provide second basis in the development of its
economic performance scenarios. In setting
these qualitative parameters, historical
experience in the Philippines was taken into
account, and scenarios were developed to
cover the entire range of these experiences, for
example:
▪ Economic prosperity, characterized by
sustainable levels of economic growth
(e.g., 7-8%) and rising levels of
development
▪ Economic decline, characterized by low
levels of economic growth (even
recession), and falling levels of
development such as was experienced
during the Asian Financial Crisis
▪ Economic bubble, characterized by high
levels of economic growth, rising levels of
development, but also rising levels of
inequality.
POPULATION GROWTH
Population in the Manila Bay area has grown
rapidly as a result of both natural growth and
increasing urbanization. With increasing
population, the human-induced impacts on
Manila Bay are exacerbated (e.g., waste
generation, pollution loads, competition for
land and resources, etc.). These trends are
expected to continue at least until 2050,
however the rate at which this occurs may
63
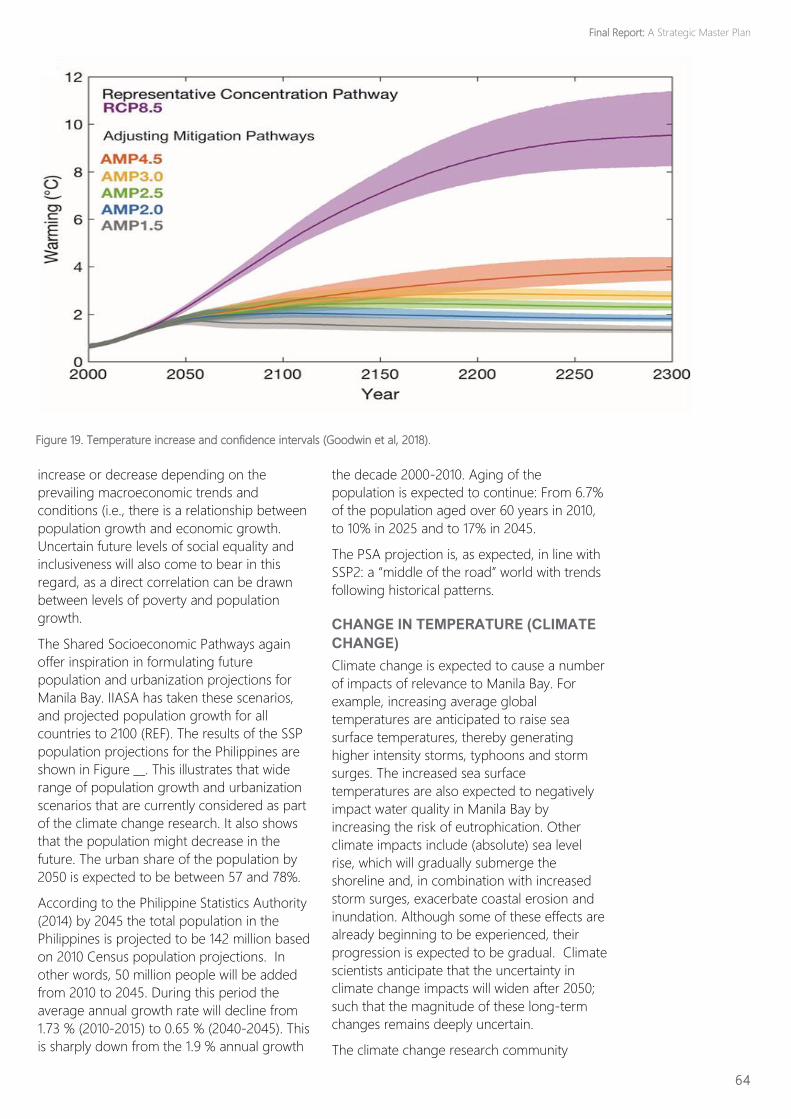
increase or decrease depending on the
prevailing macroeconomic trends and
conditions (i.e., there is a relationship between
population growth and economic growth.
Uncertain future levels of social equality and
inclusiveness will also come to bear in this
regard, as a direct correlation can be drawn
between levels of poverty and population
growth.
The Shared Socioeconomic Pathways again
offer inspiration in formulating future
population and urbanization projections for
Manila Bay. IIASA has taken these scenarios,
and projected population growth for all
countries to 2100 (REF). The results of the SSP
population projections for the Philippines are
shown in Figure __. This illustrates that wide
range of population growth and urbanization
scenarios that are currently considered as part
of the climate change research. It also shows
that the population might decrease in the
future. The urban share of the population by
2050 is expected to be between 57 and 78%.
According to the Philippine Statistics Authority
(2014) by 2045 the total population in the
Philippines is projected to be 142 million based
on 2010 Census population projections. In
other words, 50 million people will be added
from 2010 to 2045. During this period the
average annual growth rate will decline from
1.73 % (2010-2015) to 0.65 % (2040-2045). This
is sharply down from the 1.9 % annual growth
the decade 2000-2010. Aging of the
population is expected to continue: From 6.7%
of the population aged over 60 years in 2010,
to 10% in 2025 and to 17% in 2045.
The PSA projection is, as expected, in line with
SSP2: a “middle of the road” world with trends
following historical patterns.
CHANGE IN TEMPERATURE (CLIMATE
CHANGE)
Climate change is expected to cause a number
of impacts of relevance to Manila Bay. For
example, increasing average global
temperatures are anticipated to raise sea
surface temperatures, thereby generating
higher intensity storms, typhoons and storm
surges. The increased sea surface
temperatures are also expected to negatively
impact water quality in Manila Bay by
increasing the risk of eutrophication. Other
climate impacts include (absolute) sea level
rise, which will gradually submerge the
shoreline and, in combination with increased
storm surges, exacerbate coastal erosion and
inundation. Although some of these effects are
already beginning to be experienced, their
progression is expected to be gradual. Climate
scientists anticipate that the uncertainty in
climate change impacts will widen after 2050;
such that the magnitude of these long-term
changes remains deeply uncertain.
The climate change research community
64
Figure 19. Temperature increase and confidence intervals (Goodwin et al, 2018).
Final Report: A Strategic Master Plan
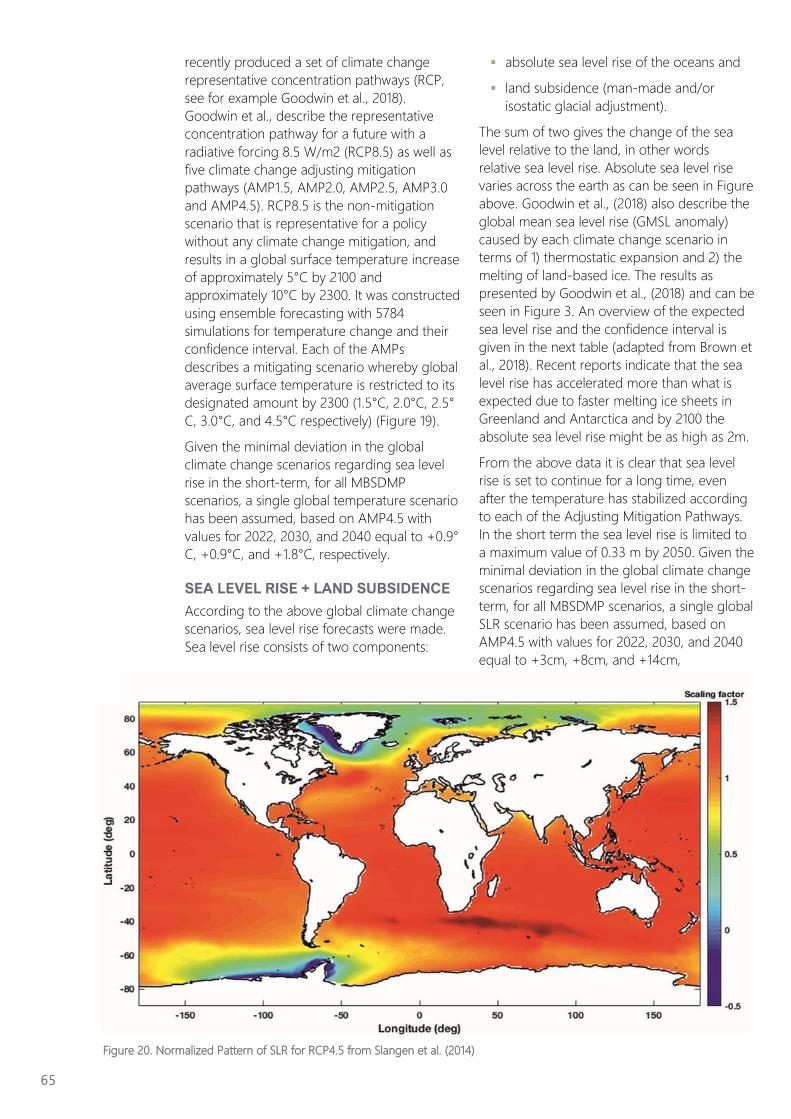
recently produced a set of climate change
representative concentration pathways (RCP,
see for example Goodwin et al., 2018).
Goodwin et al., describe the representative
concentration pathway for a future with a
radiative forcing 8.5 W/m2 (RCP8.5) as well as
five climate change adjusting mitigation
pathways (AMP1.5, AMP2.0, AMP2.5, AMP3.0
and AMP4.5). RCP8.5 is the non-mitigation
scenario that is representative for a policy
without any climate change mitigation, and
results in a global surface temperature increase
of approximately 5°C by 2100 and
approximately 10°C by 2300. It was constructed
using ensemble forecasting with 5784
simulations for temperature change and their
confidence interval. Each of the AMPs
describes a mitigating scenario whereby global
average surface temperature is restricted to its
designated amount by 2300 (1.5°C, 2.0°C, 2.5°
C, 3.0°C, and 4.5°C respectively) (Figure 19).
Given the minimal deviation in the global
climate change scenarios regarding sea level
rise in the short-term, for all MBSDMP
scenarios, a single global temperature scenario
has been assumed, based on AMP4.5 with
values for 2022, 2030, and 2040 equal to +0.9°
C, +0.9°C, and +1.8°C, respectively.
SEA LEVEL RISE + LAND SUBSIDENCE
According to the above global climate change
scenarios, sea level rise forecasts were made.
Sea level rise consists of two components:
▪ absolute sea level rise of the oceans and
▪ land subsidence (man-made and/or
isostatic glacial adjustment).
The sum of two gives the change of the sea
level relative to the land, in other words
relative sea level rise. Absolute sea level rise
varies across the earth as can be seen in Figure
above. Goodwin et al., (2018) also describe the
global mean sea level rise (GMSL anomaly)
caused by each climate change scenario in
terms of 1) thermostatic expansion and 2) the
melting of land-based ice. The results as
presented by Goodwin et al., (2018) and can be
seen in Figure 3. An overview of the expected
sea level rise and the confidence interval is
given in the next table (adapted from Brown et
al., 2018). Recent reports indicate that the sea
level rise has accelerated more than what is
expected due to faster melting ice sheets in
Greenland and Antarctica and by 2100 the
absolute sea level rise might be as high as 2m.
From the above data it is clear that sea level
rise is set to continue for a long time, even
after the temperature has stabilized according
to each of the Adjusting Mitigation Pathways.
In the short term the sea level rise is limited to
a maximum value of 0.33 m by 2050. Given the
minimal deviation in the global climate change
scenarios regarding sea level rise in the short-
term, for all MBSDMP scenarios, a single global
SLR scenario has been assumed, based on
AMP4.5 with values for 2022, 2030, and 2040
equal to +3cm, +8cm, and +14cm,
65
Figure 20. Normalized Pattern of SLR for RCP4.5 from Slangen et al. (2014)
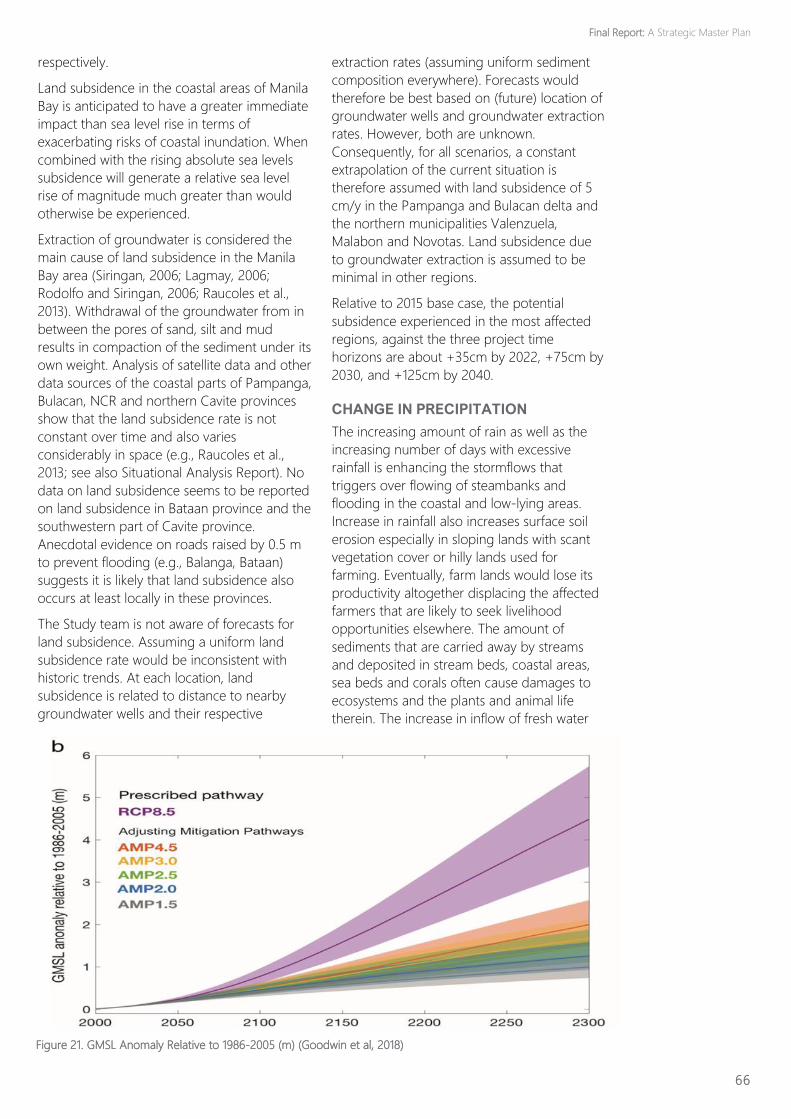
respectively.
Land subsidence in the coastal areas of Manila
Bay is anticipated to have a greater immediate
impact than sea level rise in terms of
exacerbating risks of coastal inundation. When
combined with the rising absolute sea levels
subsidence will generate a relative sea level
rise of magnitude much greater than would
otherwise be experienced.
Extraction of groundwater is considered the
main cause of land subsidence in the Manila
Bay area (Siringan, 2006; Lagmay, 2006;
Rodolfo and Siringan, 2006; Raucoles et al.,
2013). Withdrawal of the groundwater from in
between the pores of sand, silt and mud
results in compaction of the sediment under its
own weight. Analysis of satellite data and other
data sources of the coastal parts of Pampanga,
Bulacan, NCR and northern Cavite provinces
show that the land subsidence rate is not
constant over time and also varies
considerably in space (e.g., Raucoles et al.,
2013; see also Situational Analysis Report). No
data on land subsidence seems to be reported
on land subsidence in Bataan province and the
southwestern part of Cavite province.
Anecdotal evidence on roads raised by 0.5 m
to prevent flooding (e.g., Balanga, Bataan)
suggests it is likely that land subsidence also
occurs at least locally in these provinces.
The Study team is not aware of forecasts for
land subsidence. Assuming a uniform land
subsidence rate would be inconsistent with
historic trends. At each location, land
subsidence is related to distance to nearby
groundwater wells and their respective
extraction rates (assuming uniform sediment
composition everywhere). Forecasts would
therefore be best based on (future) location of
groundwater wells and groundwater extraction
rates. However, both are unknown.
Consequently, for all scenarios, a constant
extrapolation of the current situation is
therefore assumed with land subsidence of 5
cm/y in the Pampanga and Bulacan delta and
the northern municipalities Valenzuela,
Malabon and Novotas. Land subsidence due
to groundwater extraction is assumed to be
minimal in other regions.
Relative to 2015 base case, the potential
subsidence experienced in the most affected
regions, against the three project time
horizons are about +35cm by 2022, +75cm by
2030, and +125cm by 2040.
CHANGE IN PRECIPITATION
The increasing amount of rain as well as the
increasing number of days with excessive
rainfall is enhancing the stormflows that
triggers over flowing of steambanks and
flooding in the coastal and low-lying areas.
Increase in rainfall also increases surface soil
erosion especially in sloping lands with scant
vegetation cover or hilly lands used for
farming. Eventually, farm lands would lose its
productivity altogether displacing the affected
farmers that are likely to seek livelihood
opportunities elsewhere. The amount of
sediments that are carried away by streams
and deposited in stream beds, coastal areas,
sea beds and corals often cause damages to
ecosystems and the plants and animal life
therein. The increase in inflow of fresh water
66
Figure 21. GMSL Anomaly Relative to 1986-2005 (m) (Goodwin et al, 2018)
Final Report: A Strategic Master Plan
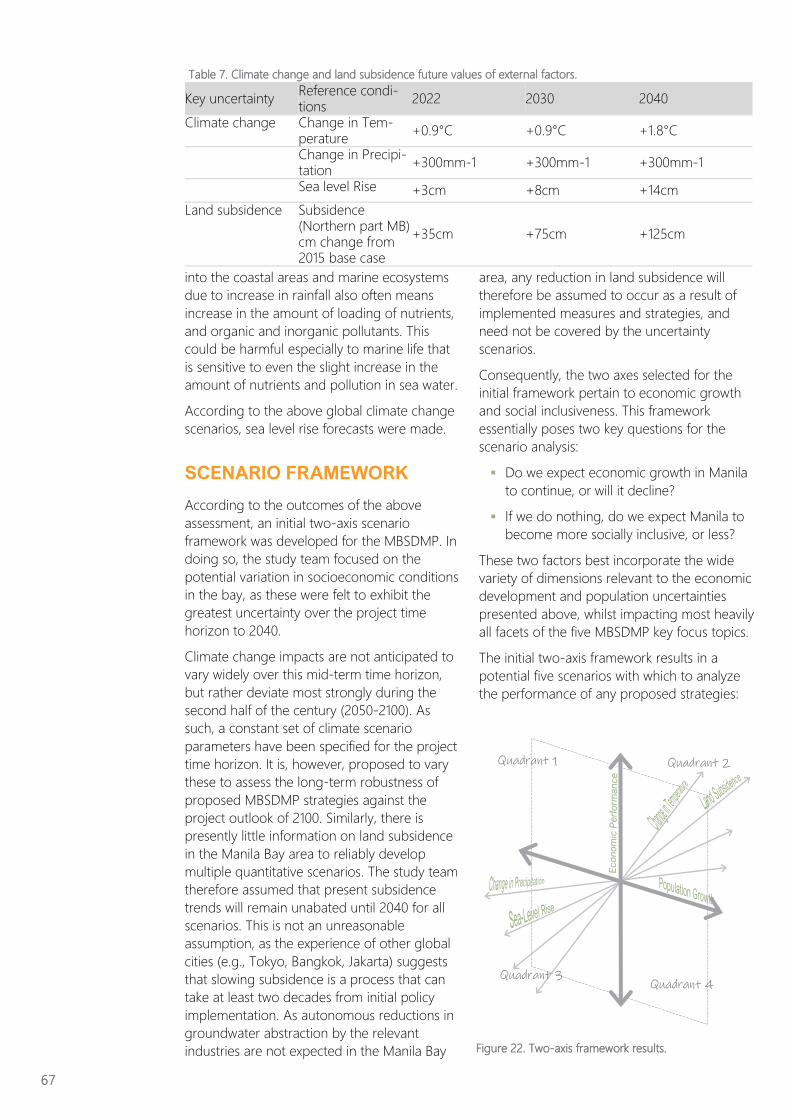
into the coastal areas and marine ecosystems
due to increase in rainfall also often means
increase in the amount of loading of nutrients,
and organic and inorganic pollutants. This
could be harmful especially to marine life that
is sensitive to even the slight increase in the
amount of nutrients and pollution in sea water.
According to the above global climate change
scenarios, sea level rise forecasts were made.
SCENARIO FRAMEWORK
According to the outcomes of the above
assessment, an initial two-axis scenario
framework was developed for the MBSDMP. In
doing so, the study team focused on the
potential variation in socioeconomic conditions
in the bay, as these were felt to exhibit the
greatest uncertainty over the project time
horizon to 2040.
Climate change impacts are not anticipated to
vary widely over this mid-term time horizon,
but rather deviate most strongly during the
second half of the century (2050-2100). As
such, a constant set of climate scenario
parameters have been specified for the project
time horizon. It is, however, proposed to vary
these to assess the long-term robustness of
proposed MBSDMP strategies against the
project outlook of 2100. Similarly, there is
presently little information on land subsidence
in the Manila Bay area to reliably develop
multiple quantitative scenarios. The study team
therefore assumed that present subsidence
trends will remain unabated until 2040 for all
scenarios. This is not an unreasonable
assumption, as the experience of other global
cities (e.g., Tokyo, Bangkok, Jakarta) suggests
that slowing subsidence is a process that can
take at least two decades from initial policy
implementation. As autonomous reductions in
groundwater abstraction by the relevant
industries are not expected in the Manila Bay
area, any reduction in land subsidence will
therefore be assumed to occur as a result of
implemented measures and strategies, and
need not be covered by the uncertainty
scenarios.
Consequently, the two axes selected for the
initial framework pertain to economic growth
and social inclusiveness. This framework
essentially poses two key questions for the
scenario analysis:
▪ Do we expect economic growth in Manila
to continue, or will it decline?
▪ If we do nothing, do we expect Manila to
become more socially inclusive, or less?
These two factors best incorporate the wide
variety of dimensions relevant to the economic
development and population uncertainties
presented above, whilst impacting most heavily
all facets of the five MBSDMP key focus topics.
The initial two-axis framework results in a
potential five scenarios with which to analyze
the performance of any proposed strategies:
67
FIGURE 4: Key Drivers of Change / Uncertainty
Quadrant 1 Quadrant 2
Quadrant 3 Quadrant 4
Figure 22. Two-axis framework results.
Key uncertainty Reference condi-tions
2022 2030 2040
Climate change Change in Tem-perature
+0.9°C +0.9°C +1.8°C
Change in Precipi-tation
+300mm-1 +300mm-1 +300mm-1
Sea level Rise +3cm +8cm +14cm
Land subsidence Subsidence (Northern part MB) cm change from 2015 base case
+35cm +75cm +125cm
Table 7. Climate change and land subsidence future values of external factors.
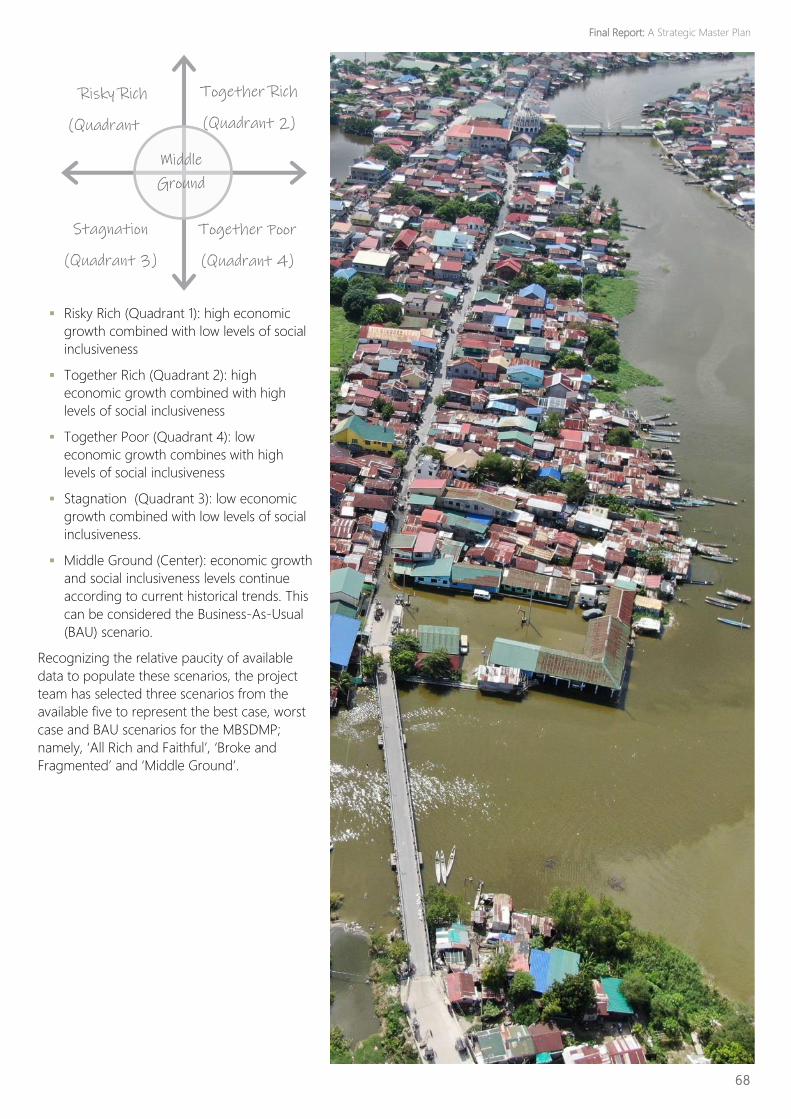
▪ Risky Rich (Quadrant 1): high economic
growth combined with low levels of social
inclusiveness
▪ Together Rich (Quadrant 2): high
economic growth combined with high
levels of social inclusiveness
▪ Together Poor (Quadrant 4): low
economic growth combines with high
levels of social inclusiveness
▪ Stagnation (Quadrant 3): low economic
growth combined with low levels of social
inclusiveness.
▪ Middle Ground (Center): economic growth
and social inclusiveness levels continue
according to current historical trends. This
can be considered the Business-As-Usual
(BAU) scenario.
Recognizing the relative paucity of available
data to populate these scenarios, the project
team has selected three scenarios from the
available five to represent the best case, worst
case and BAU scenarios for the MBSDMP;
namely, ‘All Rich and Faithful’, ‘Broke and
Fragmented’ and ‘Middle Ground’.
68
Risky Rich
(Quadrant
Middle
Ground
Together Rich
(Quadrant 2)
Stagnation
(Quadrant 3)
Together Poor
(Quadrant 4)
Final Report: A Strategic Master Plan
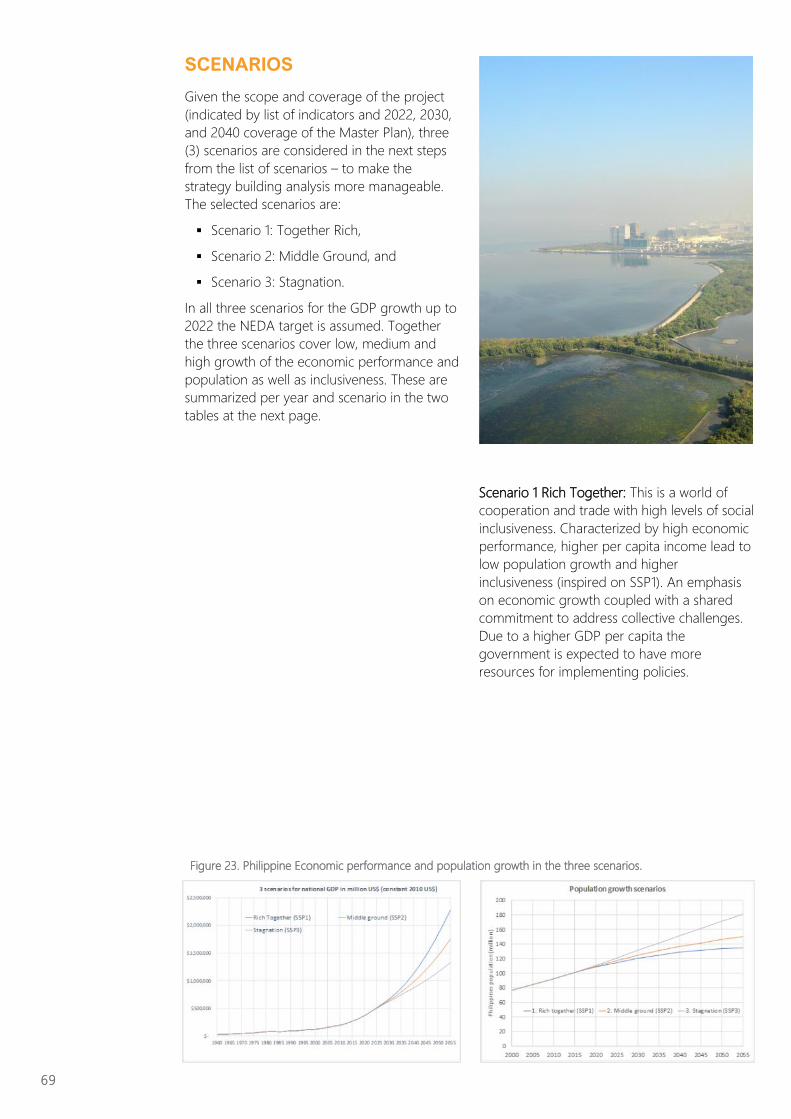
SCENARIOS
Given the scope and coverage of the project
(indicated by list of indicators and 2022, 2030,
and 2040 coverage of the Master Plan), three
(3) scenarios are considered in the next steps
from the list of scenarios – to make the
strategy building analysis more manageable.
The selected scenarios are:
▪ Scenario 1: Together Rich,
▪ Scenario 2: Middle Ground, and
▪ Scenario 3: Stagnation.
In all three scenarios for the GDP growth up to
2022 the NEDA target is assumed. Together
the three scenarios cover low, medium and
high growth of the economic performance and
population as well as inclusiveness. These are
summarized per year and scenario in the two
tables at the next page.
Scenario 1 Rich Together: This is a world of
cooperation and trade with high levels of social
inclusiveness. Characterized by high economic
performance, higher per capita income lead to
low population growth and higher
inclusiveness (inspired on SSP1). An emphasis
on economic growth coupled with a shared
commitment to address collective challenges.
Due to a higher GDP per capita the
government is expected to have more
resources for implementing policies.
69
Figure 23. Philippine Economic performance and population growth in the three scenarios.
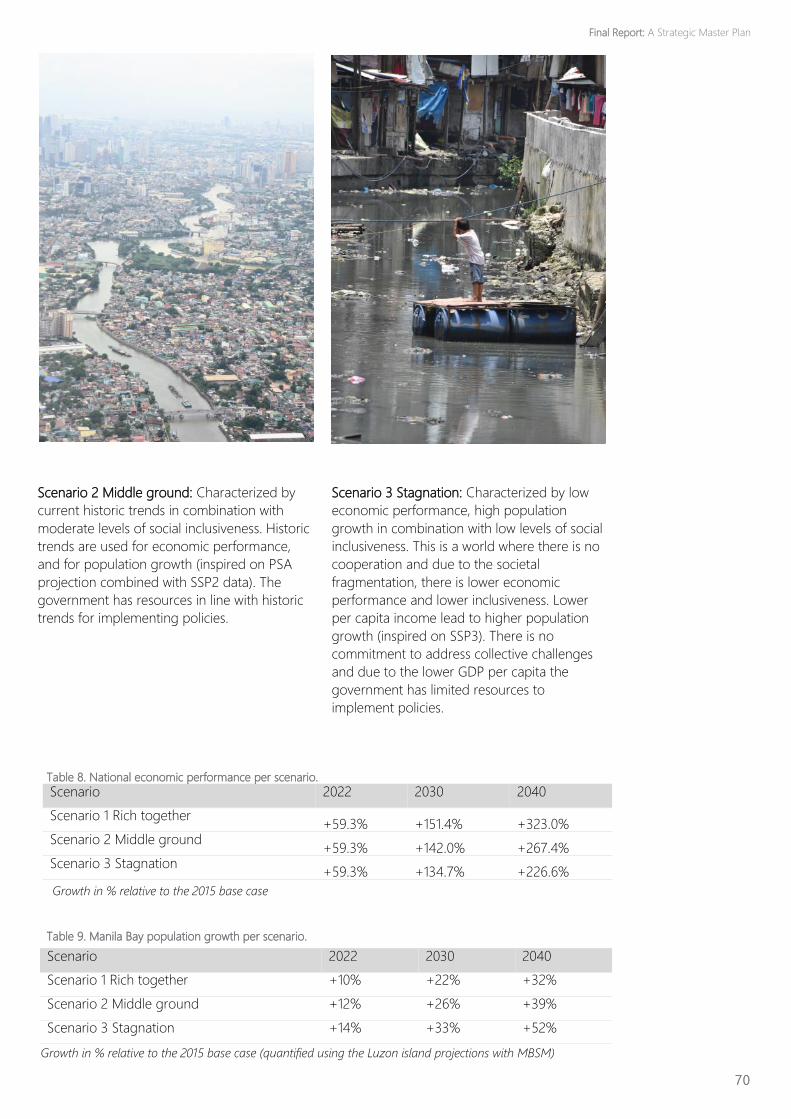
Scenario 2 Middle ground: Characterized by
current historic trends in combination with
moderate levels of social inclusiveness. Historic
trends are used for economic performance,
and for population growth (inspired on PSA
projection combined with SSP2 data). The
government has resources in line with historic
trends for implementing policies.
Scenario 3 Stagnation: Characterized by low
economic performance, high population
growth in combination with low levels of social
inclusiveness. This is a world where there is no
cooperation and due to the societal
fragmentation, there is lower economic
performance and lower inclusiveness. Lower
per capita income lead to higher population
growth (inspired on SSP3). There is no
commitment to address collective challenges
and due to the lower GDP per capita the
government has limited resources to
implement policies.
70
Scenario 2022 2030 2040
Scenario 1 Rich together +59.3% +151.4% +323.0%
Scenario 2 Middle ground +59.3% +142.0% +267.4%
Scenario 3 Stagnation +59.3% +134.7% +226.6%
Table 8. National economic performance per scenario.
Growth in % relative to the 2015 base case
Table 9. Manila Bay population growth per scenario.
Scenario 2022 2030 2040
Scenario 1 Rich together +10% +22% +32%
Scenario 2 Middle ground +12% +26% +39%
Scenario 3 Stagnation +14% +33% +52%
Growth in % relative to the 2015 base case (quantified using the Luzon island projections with MBSM)
Final Report: A Strategic Master Plan
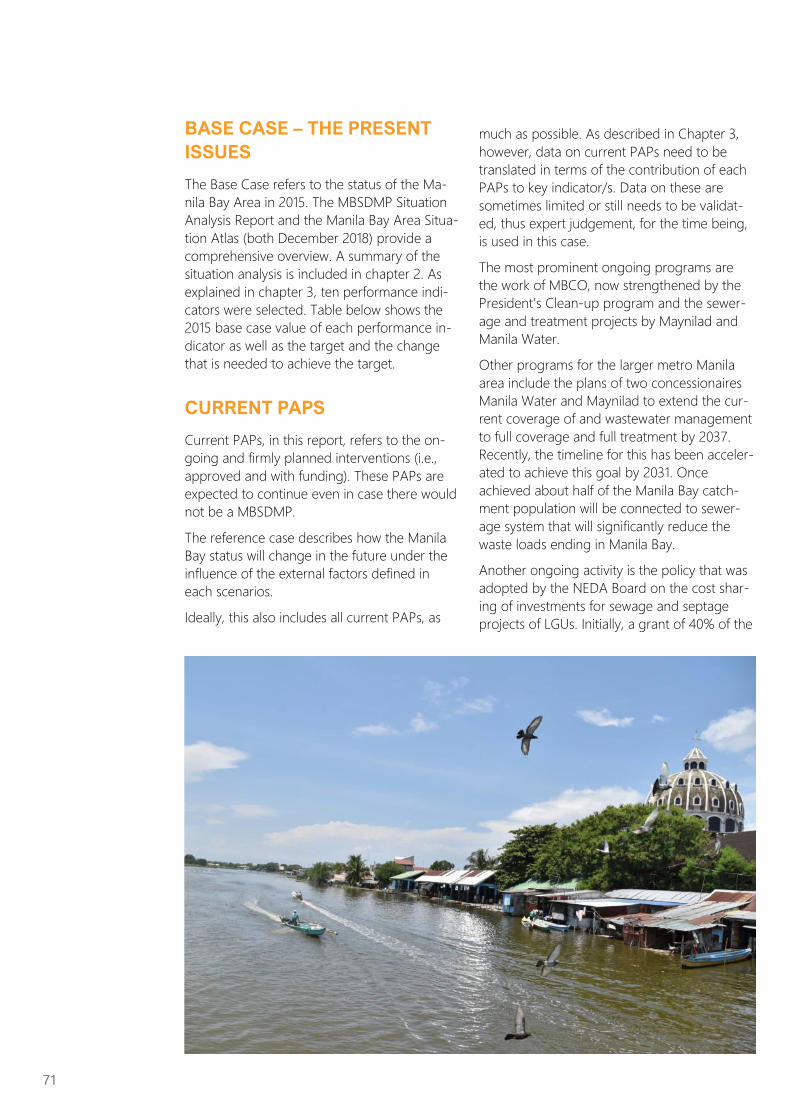
BASE CASE – THE PRESENT
ISSUES
The Base Case refers to the status of the Ma-
nila Bay Area in 2015. The MBSDMP Situation
Analysis Report and the Manila Bay Area Situa-
tion Atlas (both December 2018) provide a
comprehensive overview. A summary of the
situation analysis is included in chapter 2. As
explained in chapter 3, ten performance indi-
cators were selected. Table below shows the
2015 base case value of each performance in-
dicator as well as the target and the change
that is needed to achieve the target.
CURRENT PAPS
Current PAPs, in this report, refers to the on-
going and firmly planned interventions (i.e.,
approved and with funding). These PAPs are
expected to continue even in case there would
not be a MBSDMP.
The reference case describes how the Manila
Bay status will change in the future under the
influence of the external factors defined in
each scenarios.
Ideally, this also includes all current PAPs, as
much as possible. As described in Chapter 3,
however, data on current PAPs need to be
translated in terms of the contribution of each
PAPs to key indicator/s. Data on these are
sometimes limited or still needs to be validat-
ed, thus expert judgement, for the time being,
is used in this case.
The most prominent ongoing programs are
the work of MBCO, now strengthened by the
President’s Clean-up program and the sewer-
age and treatment projects by Maynilad and
Manila Water.
Other programs for the larger metro Manila
area include the plans of two concessionaires
Manila Water and Maynilad to extend the cur-
rent coverage of and wastewater management
to full coverage and full treatment by 2037.
Recently, the timeline for this has been acceler-
ated to achieve this goal by 2031. Once
achieved about half of the Manila Bay catch-
ment population will be connected to sewer-
age system that will significantly reduce the
waste loads ending in Manila Bay.
Another ongoing activity is the policy that was
adopted by the NEDA Board on the cost shar-
ing of investments for sewage and septage
projects of LGUs. Initially, a grant of 40% of the
71
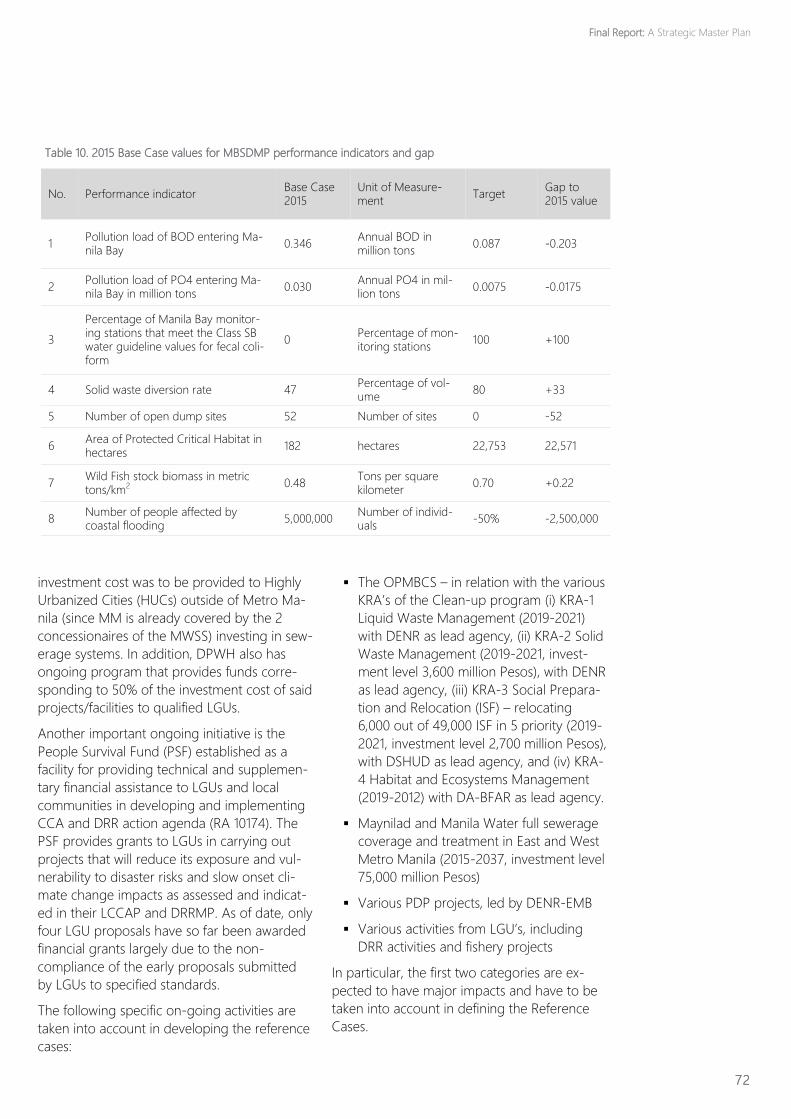
investment cost was to be provided to Highly
Urbanized Cities (HUCs) outside of Metro Ma-
nila (since MM is already covered by the 2
concessionaires of the MWSS) investing in sew-
erage systems. In addition, DPWH also has
ongoing program that provides funds corre-
sponding to 50% of the investment cost of said
projects/facilities to qualified LGUs.
Another important ongoing initiative is the
People Survival Fund (PSF) established as a
facility for providing technical and supplemen-
tary financial assistance to LGUs and local
communities in developing and implementing
CCA and DRR action agenda (RA 10174). The
PSF provides grants to LGUs in carrying out
projects that will reduce its exposure and vul-
nerability to disaster risks and slow onset cli-
mate change impacts as assessed and indicat-
ed in their LCCAP and DRRMP. As of date, only
four LGU proposals have so far been awarded
financial grants largely due to the non-
compliance of the early proposals submitted
by LGUs to specified standards.
The following specific on-going activities are
taken into account in developing the reference
cases:
▪ The OPMBCS – in relation with the various
KRA’s of the Clean-up program (i) KRA-1
Liquid Waste Management (2019-2021)
with DENR as lead agency, (ii) KRA-2 Solid
Waste Management (2019-2021, invest-
ment level 3,600 million Pesos), with DENR
as lead agency, (iii) KRA-3 Social Prepara-
tion and Relocation (ISF) – relocating
6,000 out of 49,000 ISF in 5 priority (2019-
2021, investment level 2,700 million Pesos),
with DSHUD as lead agency, and (iv) KRA-
4 Habitat and Ecosystems Management
(2019-2012) with DA-BFAR as lead agency.
▪ Maynilad and Manila Water full sewerage
coverage and treatment in East and West
Metro Manila (2015-2037, investment level
75,000 million Pesos)
▪ Various PDP projects, led by DENR-EMB
▪ Various activities from LGU’s, including
DRR activities and fishery projects
In particular, the first two categories are ex-
pected to have major impacts and have to be
taken into account in defining the Reference
Cases.
72
No. Performance indicator Base Case 2015
Unit of Measure-ment
Target Gap to 2015 value
1 Pollution load of BOD entering Ma-nila Bay
0.346 Annual BOD in million tons
0.087 -0.203
2 Pollution load of PO4 entering Ma-nila Bay in million tons
0.030 Annual PO4 in mil-lion tons
0.0075 -0.0175
3
Percentage of Manila Bay monitor-ing stations that meet the Class SB water guideline values for fecal coli-form
0 Percentage of mon-itoring stations
100 +100
4 Solid waste diversion rate 47 Percentage of vol-ume
80 +33
5 Number of open dump sites 52 Number of sites 0 -52
6 Area of Protected Critical Habitat in hectares
182 hectares 22,753 22,571
7 Wild Fish stock biomass in metric tons/km2
0.48 Tons per square kilometer
0.70 +0.22
8 Number of people affected by coastal flooding
5,000,000 Number of individ-uals
-50% -2,500,000
Table 10. 2015 Base Case values for MBSDMP performance indicators and gap
Final Report: A Strategic Master Plan
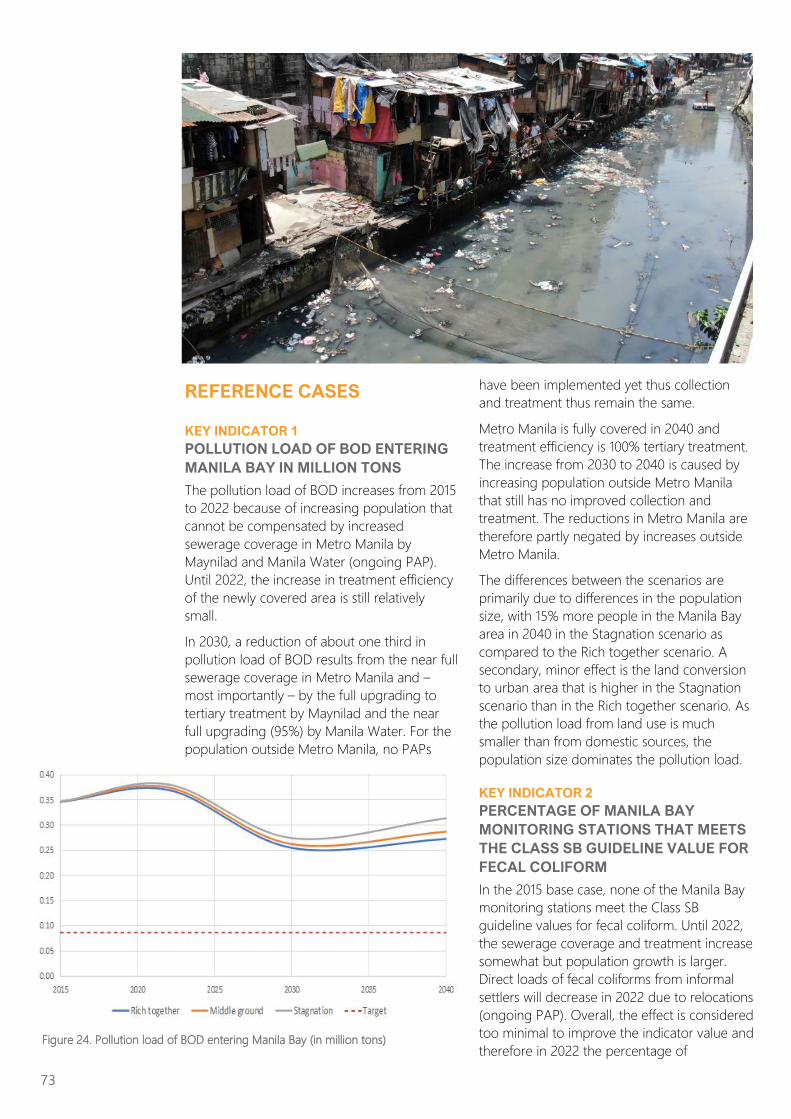
REFERENCE CASES
KEY INDICATOR 1
POLLUTION LOAD OF BOD ENTERING
MANILA BAY IN MILLION TONS
The pollution load of BOD increases from 2015
to 2022 because of increasing population that
cannot be compensated by increased
sewerage coverage in Metro Manila by
Maynilad and Manila Water (ongoing PAP).
Until 2022, the increase in treatment efficiency
of the newly covered area is still relatively
small.
In 2030, a reduction of about one third in
pollution load of BOD results from the near full
sewerage coverage in Metro Manila and –
most importantly – by the full upgrading to
tertiary treatment by Maynilad and the near
full upgrading (95%) by Manila Water. For the
population outside Metro Manila, no PAPs
have been implemented yet thus collection
and treatment thus remain the same.
Metro Manila is fully covered in 2040 and
treatment efficiency is 100% tertiary treatment.
The increase from 2030 to 2040 is caused by
increasing population outside Metro Manila
that still has no improved collection and
treatment. The reductions in Metro Manila are
therefore partly negated by increases outside
Metro Manila.
The differences between the scenarios are
primarily due to differences in the population
size, with 15% more people in the Manila Bay
area in 2040 in the Stagnation scenario as
compared to the Rich together scenario. A
secondary, minor effect is the land conversion
to urban area that is higher in the Stagnation
scenario than in the Rich together scenario. As
the pollution load from land use is much
smaller than from domestic sources, the
population size dominates the pollution load.
KEY INDICATOR 2
PERCENTAGE OF MANILA BAY
MONITORING STATIONS THAT MEETS
THE CLASS SB GUIDELINE VALUE FOR
FECAL COLIFORM
In the 2015 base case, none of the Manila Bay
monitoring stations meet the Class SB
guideline values for fecal coliform. Until 2022,
the sewerage coverage and treatment increase
somewhat but population growth is larger.
Direct loads of fecal coliforms from informal
settlers will decrease in 2022 due to relocations
(ongoing PAP). Overall, the effect is considered
too minimal to improve the indicator value and
therefore in 2022 the percentage of
73
Figure 24. Pollution load of BOD entering Manila Bay (in million tons)
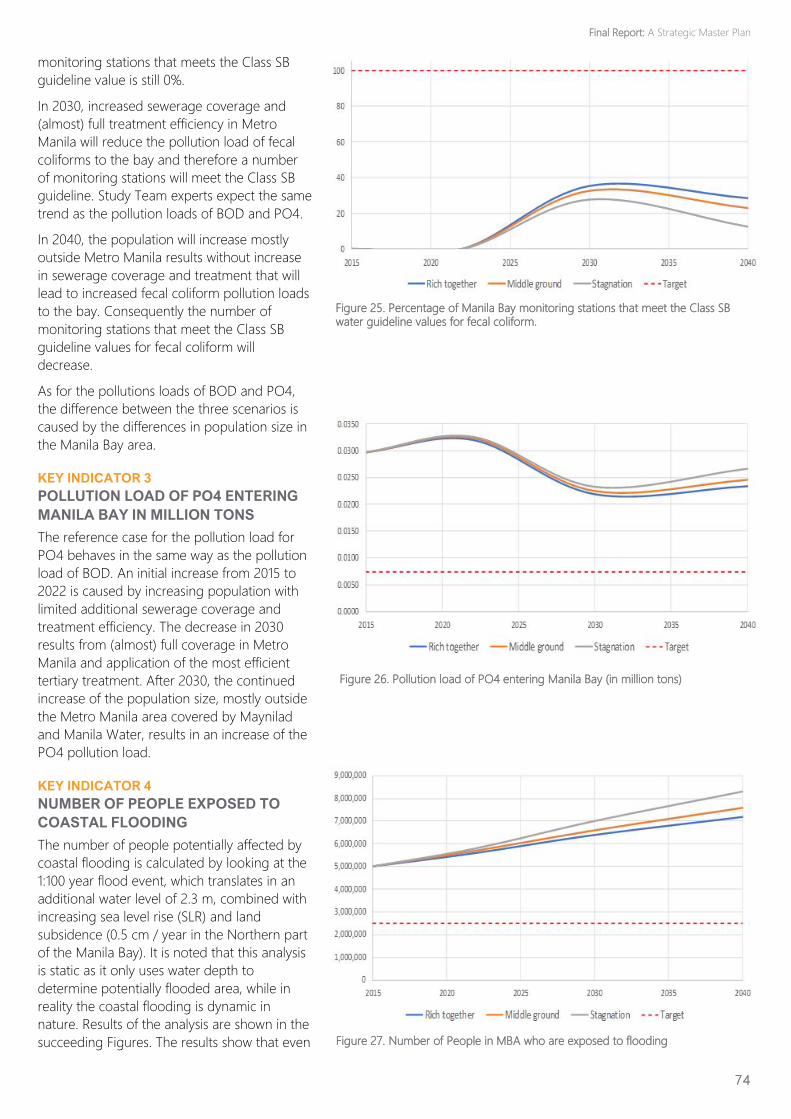
monitoring stations that meets the Class SB
guideline value is still 0%.
In 2030, increased sewerage coverage and
(almost) full treatment efficiency in Metro
Manila will reduce the pollution load of fecal
coliforms to the bay and therefore a number
of monitoring stations will meet the Class SB
guideline. Study Team experts expect the same
trend as the pollution loads of BOD and PO4.
In 2040, the population will increase mostly
outside Metro Manila results without increase
in sewerage coverage and treatment that will
lead to increased fecal coliform pollution loads
to the bay. Consequently the number of
monitoring stations that meet the Class SB
guideline values for fecal coliform will
decrease.
As for the pollutions loads of BOD and PO4,
the difference between the three scenarios is
caused by the differences in population size in
the Manila Bay area.
KEY INDICATOR 3
POLLUTION LOAD OF PO4 ENTERING
MANILA BAY IN MILLION TONS
The reference case for the pollution load for
PO4 behaves in the same way as the pollution
load of BOD. An initial increase from 2015 to
2022 is caused by increasing population with
limited additional sewerage coverage and
treatment efficiency. The decrease in 2030
results from (almost) full coverage in Metro
Manila and application of the most efficient
tertiary treatment. After 2030, the continued
increase of the population size, mostly outside
the Metro Manila area covered by Maynilad
and Manila Water, results in an increase of the
PO4 pollution load.
KEY INDICATOR 4
NUMBER OF PEOPLE EXPOSED TO
COASTAL FLOODING
The number of people potentially affected by
coastal flooding is calculated by looking at the
1:100 year flood event, which translates in an
additional water level of 2.3 m, combined with
increasing sea level rise (SLR) and land
subsidence (0.5 cm / year in the Northern part
of the Manila Bay). It is noted that this analysis
is static as it only uses water depth to
determine potentially flooded area, while in
reality the coastal flooding is dynamic in
nature. Results of the analysis are shown in the
succeeding Figures. The results show that even
74
Figure 26. Pollution load of PO4 entering Manila Bay (in million tons)
Figure 25. Percentage of Manila Bay monitoring stations that meet the Class SB water guideline values for fecal coliform.
Figure 27. Number of People in MBA who are exposed to flooding
Final Report: A Strategic Master Plan
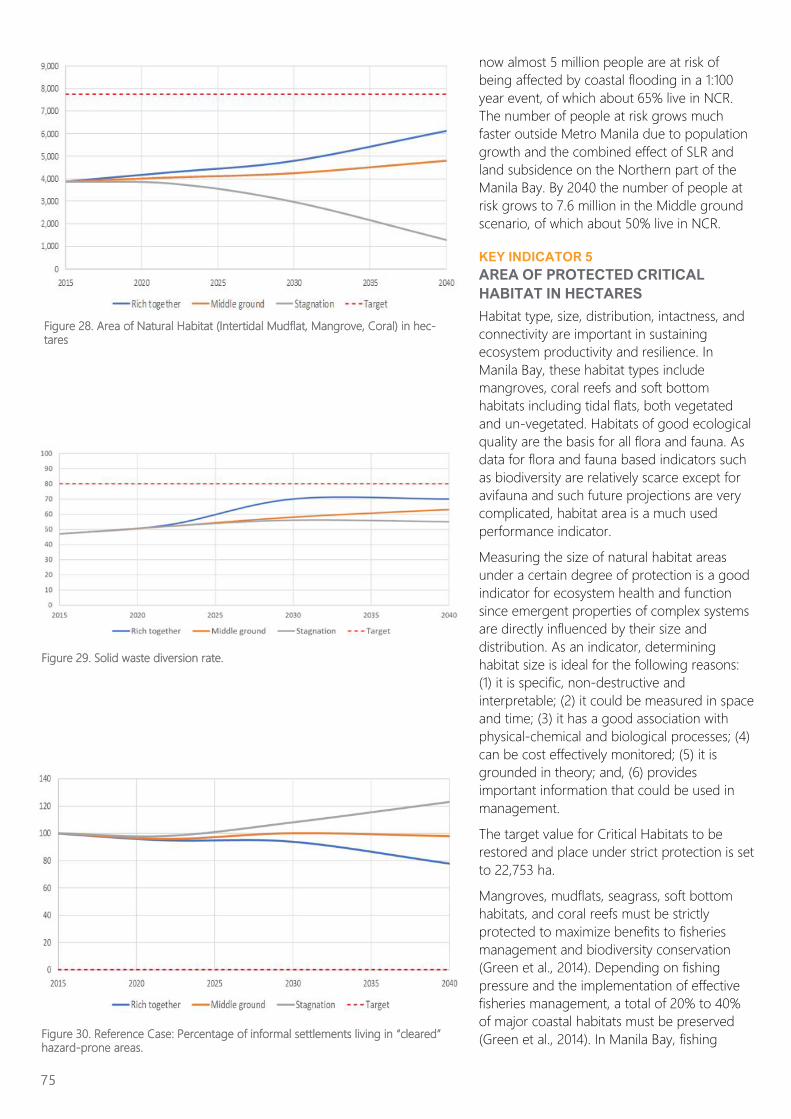
now almost 5 million people are at risk of
being affected by coastal flooding in a 1:100
year event, of which about 65% live in NCR.
The number of people at risk grows much
faster outside Metro Manila due to population
growth and the combined effect of SLR and
land subsidence on the Northern part of the
Manila Bay. By 2040 the number of people at
risk grows to 7.6 million in the Middle ground
scenario, of which about 50% live in NCR.
KEY INDICATOR 5
AREA OF PROTECTED CRITICAL
HABITAT IN HECTARES
Habitat type, size, distribution, intactness, and
connectivity are important in sustaining
ecosystem productivity and resilience. In
Manila Bay, these habitat types include
mangroves, coral reefs and soft bottom
habitats including tidal flats, both vegetated
and un-vegetated. Habitats of good ecological
quality are the basis for all flora and fauna. As
data for flora and fauna based indicators such
as biodiversity are relatively scarce except for
avifauna and such future projections are very
complicated, habitat area is a much used
performance indicator.
Measuring the size of natural habitat areas
under a certain degree of protection is a good
indicator for ecosystem health and function
since emergent properties of complex systems
are directly influenced by their size and
distribution. As an indicator, determining
habitat size is ideal for the following reasons:
(1) it is specific, non-destructive and
interpretable; (2) it could be measured in space
and time; (3) it has a good association with
physical-chemical and biological processes; (4)
can be cost effectively monitored; (5) it is
grounded in theory; and, (6) provides
important information that could be used in
management.
The target value for Critical Habitats to be
restored and place under strict protection is set
to 22,753 ha.
Mangroves, mudflats, seagrass, soft bottom
habitats, and coral reefs must be strictly
protected to maximize benefits to fisheries
management and biodiversity conservation
(Green et al., 2014). Depending on fishing
pressure and the implementation of effective
fisheries management, a total of 20% to 40%
of major coastal habitats must be preserved
(Green et al., 2014). In Manila Bay, fishing
75
Figure 29. Solid waste diversion rate.
Figure 28. Area of Natural Habitat (Intertidal Mudflat, Mangrove, Coral) in hec-tares
Figure 30. Reference Case: Percentage of informal settlements living in “cleared” hazard-prone areas.
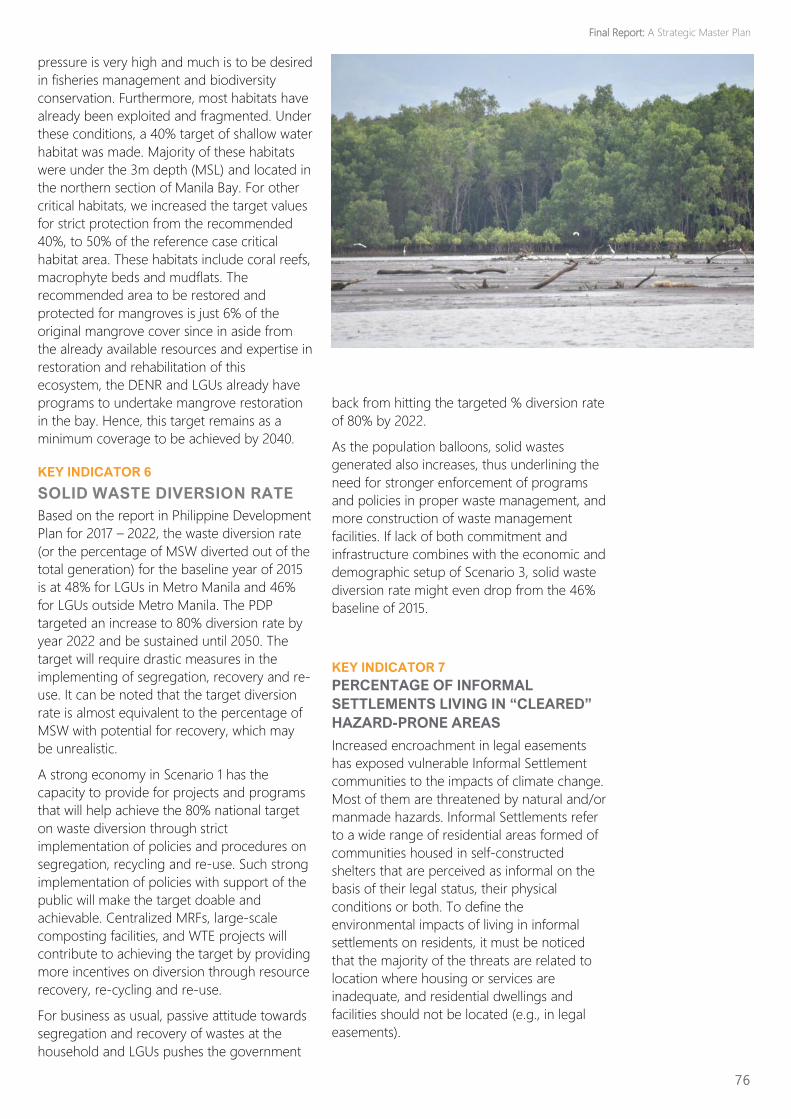
pressure is very high and much is to be desired
in fisheries management and biodiversity
conservation. Furthermore, most habitats have
already been exploited and fragmented. Under
these conditions, a 40% target of shallow water
habitat was made. Majority of these habitats
were under the 3m depth (MSL) and located in
the northern section of Manila Bay. For other
critical habitats, we increased the target values
for strict protection from the recommended
40%, to 50% of the reference case critical
habitat area. These habitats include coral reefs,
macrophyte beds and mudflats. The
recommended area to be restored and
protected for mangroves is just 6% of the
original mangrove cover since in aside from
the already available resources and expertise in
restoration and rehabilitation of this
ecosystem, the DENR and LGUs already have
programs to undertake mangrove restoration
in the bay. Hence, this target remains as a
minimum coverage to be achieved by 2040.
KEY INDICATOR 6
SOLID WASTE DIVERSION RATE
Based on the report in Philippine Development
Plan for 2017 – 2022, the waste diversion rate
(or the percentage of MSW diverted out of the
total generation) for the baseline year of 2015
is at 48% for LGUs in Metro Manila and 46%
for LGUs outside Metro Manila. The PDP
targeted an increase to 80% diversion rate by
year 2022 and be sustained until 2050. The
target will require drastic measures in the
implementing of segregation, recovery and re-
use. It can be noted that the target diversion
rate is almost equivalent to the percentage of
MSW with potential for recovery, which may
be unrealistic.
A strong economy in Scenario 1 has the
capacity to provide for projects and programs
that will help achieve the 80% national target
on waste diversion through strict
implementation of policies and procedures on
segregation, recycling and re-use. Such strong
implementation of policies with support of the
public will make the target doable and
achievable. Centralized MRFs, large-scale
composting facilities, and WTE projects will
contribute to achieving the target by providing
more incentives on diversion through resource
recovery, re-cycling and re-use.
For business as usual, passive attitude towards
segregation and recovery of wastes at the
household and LGUs pushes the government
back from hitting the targeted % diversion rate
of 80% by 2022.
As the population balloons, solid wastes
generated also increases, thus underlining the
need for stronger enforcement of programs
and policies in proper waste management, and
more construction of waste management
facilities. If lack of both commitment and
infrastructure combines with the economic and
demographic setup of Scenario 3, solid waste
diversion rate might even drop from the 46%
baseline of 2015.
KEY INDICATOR 7
PERCENTAGE OF INFORMAL
SETTLEMENTS LIVING IN “CLEARED”
HAZARD-PRONE AREAS
Increased encroachment in legal easements
has exposed vulnerable Informal Settlement
communities to the impacts of climate change.
Most of them are threatened by natural and/or
manmade hazards. Informal Settlements refer
to a wide range of residential areas formed of
communities housed in self-constructed
shelters that are perceived as informal on the
basis of their legal status, their physical
conditions or both. To define the
environmental impacts of living in informal
settlements on residents, it must be noticed
that the majority of the threats are related to
location where housing or services are
inadequate, and residential dwellings and
facilities should not be located (e.g., in legal
easements).
76
Final Report: A Strategic Master Plan
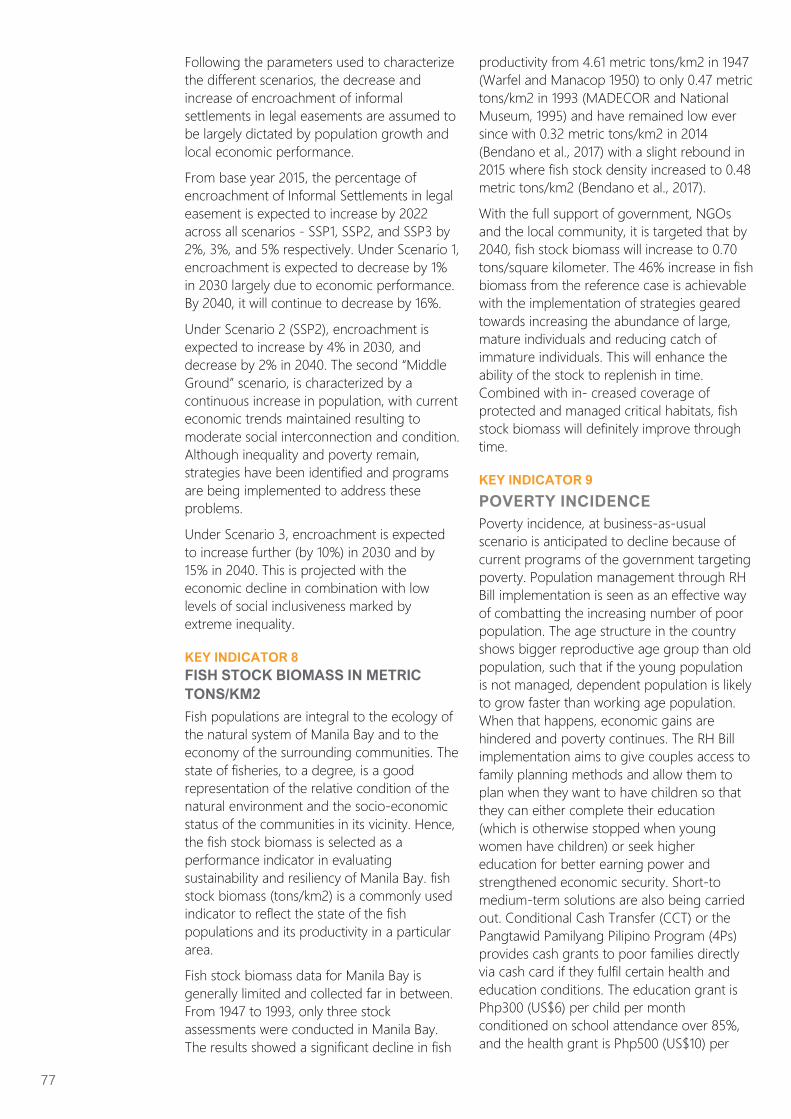
Following the parameters used to characterize
the different scenarios, the decrease and
increase of encroachment of informal
settlements in legal easements are assumed to
be largely dictated by population growth and
local economic performance.
From base year 2015, the percentage of
encroachment of Informal Settlements in legal
easement is expected to increase by 2022
across all scenarios - SSP1, SSP2, and SSP3 by
2%, 3%, and 5% respectively. Under Scenario 1,
encroachment is expected to decrease by 1%
in 2030 largely due to economic performance.
By 2040, it will continue to decrease by 16%.
Under Scenario 2 (SSP2), encroachment is
expected to increase by 4% in 2030, and
decrease by 2% in 2040. The second “Middle
Ground” scenario, is characterized by a
continuous increase in population, with current
economic trends maintained resulting to
moderate social interconnection and condition.
Although inequality and poverty remain,
strategies have been identified and programs
are being implemented to address these
problems.
Under Scenario 3, encroachment is expected
to increase further (by 10%) in 2030 and by
15% in 2040. This is projected with the
economic decline in combination with low
levels of social inclusiveness marked by
extreme inequality.
KEY INDICATOR 8
FISH STOCK BIOMASS IN METRIC
TONS/KM2
Fish populations are integral to the ecology of
the natural system of Manila Bay and to the
economy of the surrounding communities. The
state of fisheries, to a degree, is a good
representation of the relative condition of the
natural environment and the socio-economic
status of the communities in its vicinity. Hence,
the fish stock biomass is selected as a
performance indicator in evaluating
sustainability and resiliency of Manila Bay. fish
stock biomass (tons/km2) is a commonly used
indicator to reflect the state of the fish
populations and its productivity in a particular
area.
Fish stock biomass data for Manila Bay is
generally limited and collected far in between.
From 1947 to 1993, only three stock
assessments were conducted in Manila Bay.
The results showed a significant decline in fish
productivity from 4.61 metric tons/km2 in 1947
(Warfel and Manacop 1950) to only 0.47 metric
tons/km2 in 1993 (MADECOR and National
Museum, 1995) and have remained low ever
since with 0.32 metric tons/km2 in 2014
(Bendano et al., 2017) with a slight rebound in
2015 where fish stock density increased to 0.48
metric tons/km2 (Bendano et al., 2017).
With the full support of government, NGOs
and the local community, it is targeted that by
2040, fish stock biomass will increase to 0.70
tons/square kilometer. The 46% increase in fish
biomass from the reference case is achievable
with the implementation of strategies geared
towards increasing the abundance of large,
mature individuals and reducing catch of
immature individuals. This will enhance the
ability of the stock to replenish in time.
Combined with in- creased coverage of
protected and managed critical habitats, fish
stock biomass will definitely improve through
time.
KEY INDICATOR 9
POVERTY INCIDENCE
Poverty incidence, at business-as-usual
scenario is anticipated to decline because of
current programs of the government targeting
poverty. Population management through RH
Bill implementation is seen as an effective way
of combatting the increasing number of poor
population. The age structure in the country
shows bigger reproductive age group than old
population, such that if the young population
is not managed, dependent population is likely
to grow faster than working age population.
When that happens, economic gains are
hindered and poverty continues. The RH Bill
implementation aims to give couples access to
family planning methods and allow them to
plan when they want to have children so that
they can either complete their education
(which is otherwise stopped when young
women have children) or seek higher
education for better earning power and
strengthened economic security. Short-to
medium-term solutions are also being carried
out. Conditional Cash Transfer (CCT) or the
Pangtawid Pamilyang Pilipino Program (4Ps)
provides cash grants to poor families directly
via cash card if they fulfil certain health and
education conditions. The education grant is
Php300 (US$6) per child per month
conditioned on school attendance over 85%,
and the health grant is Php500 (US$10) per
77
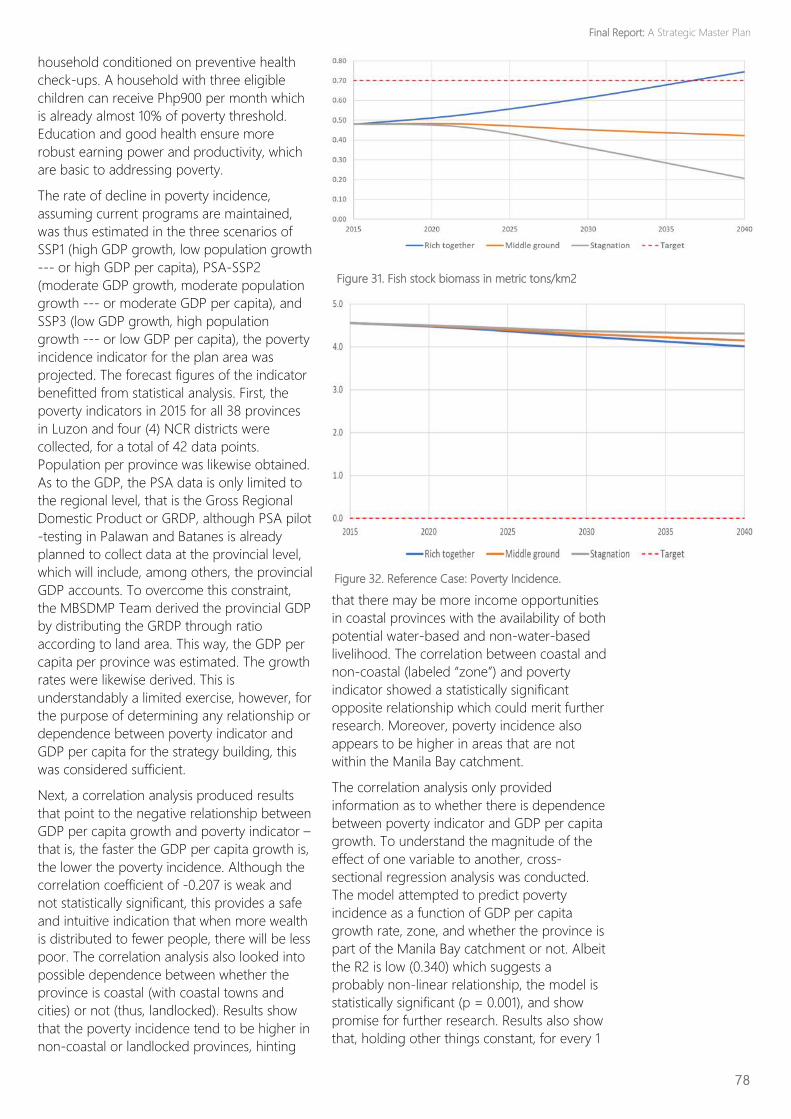
household conditioned on preventive health
check‐ups. A household with three eligible
children can receive Php900 per month which
is already almost 10% of poverty threshold.
Education and good health ensure more
robust earning power and productivity, which
are basic to addressing poverty.
The rate of decline in poverty incidence,
assuming current programs are maintained,
was thus estimated in the three scenarios of
SSP1 (high GDP growth, low population growth
--- or high GDP per capita), PSA-SSP2
(moderate GDP growth, moderate population
growth --- or moderate GDP per capita), and
SSP3 (low GDP growth, high population
growth --- or low GDP per capita), the poverty
incidence indicator for the plan area was
projected. The forecast figures of the indicator
benefitted from statistical analysis. First, the
poverty indicators in 2015 for all 38 provinces
in Luzon and four (4) NCR districts were
collected, for a total of 42 data points.
Population per province was likewise obtained.
As to the GDP, the PSA data is only limited to
the regional level, that is the Gross Regional
Domestic Product or GRDP, although PSA pilot
-testing in Palawan and Batanes is already
planned to collect data at the provincial level,
which will include, among others, the provincial
GDP accounts. To overcome this constraint,
the MBSDMP Team derived the provincial GDP
by distributing the GRDP through ratio
according to land area. This way, the GDP per
capita per province was estimated. The growth
rates were likewise derived. This is
understandably a limited exercise, however, for
the purpose of determining any relationship or
dependence between poverty indicator and
GDP per capita for the strategy building, this
was considered sufficient.
Next, a correlation analysis produced results
that point to the negative relationship between
GDP per capita growth and poverty indicator –
that is, the faster the GDP per capita growth is,
the lower the poverty incidence. Although the
correlation coefficient of -0.207 is weak and
not statistically significant, this provides a safe
and intuitive indication that when more wealth
is distributed to fewer people, there will be less
poor. The correlation analysis also looked into
possible dependence between whether the
province is coastal (with coastal towns and
cities) or not (thus, landlocked). Results show
that the poverty incidence tend to be higher in
non-coastal or landlocked provinces, hinting
that there may be more income opportunities
in coastal provinces with the availability of both
potential water-based and non-water-based
livelihood. The correlation between coastal and
non-coastal (labeled “zone”) and poverty
indicator showed a statistically significant
opposite relationship which could merit further
research. Moreover, poverty incidence also
appears to be higher in areas that are not
within the Manila Bay catchment.
The correlation analysis only provided
information as to whether there is dependence
between poverty indicator and GDP per capita
growth. To understand the magnitude of the
effect of one variable to another, cross-
sectional regression analysis was conducted.
The model attempted to predict poverty
incidence as a function of GDP per capita
growth rate, zone, and whether the province is
part of the Manila Bay catchment or not. Albeit
the R2 is low (0.340) which suggests a
probably non-linear relationship, the model is
statistically significant (p = 0.001), and show
promise for further research. Results also show
that, holding other things constant, for every 1
78
Figure 31. Fish stock biomass in metric tons/km2
Figure 32. Reference Case: Poverty Incidence.
Final Report: A Strategic Master Plan
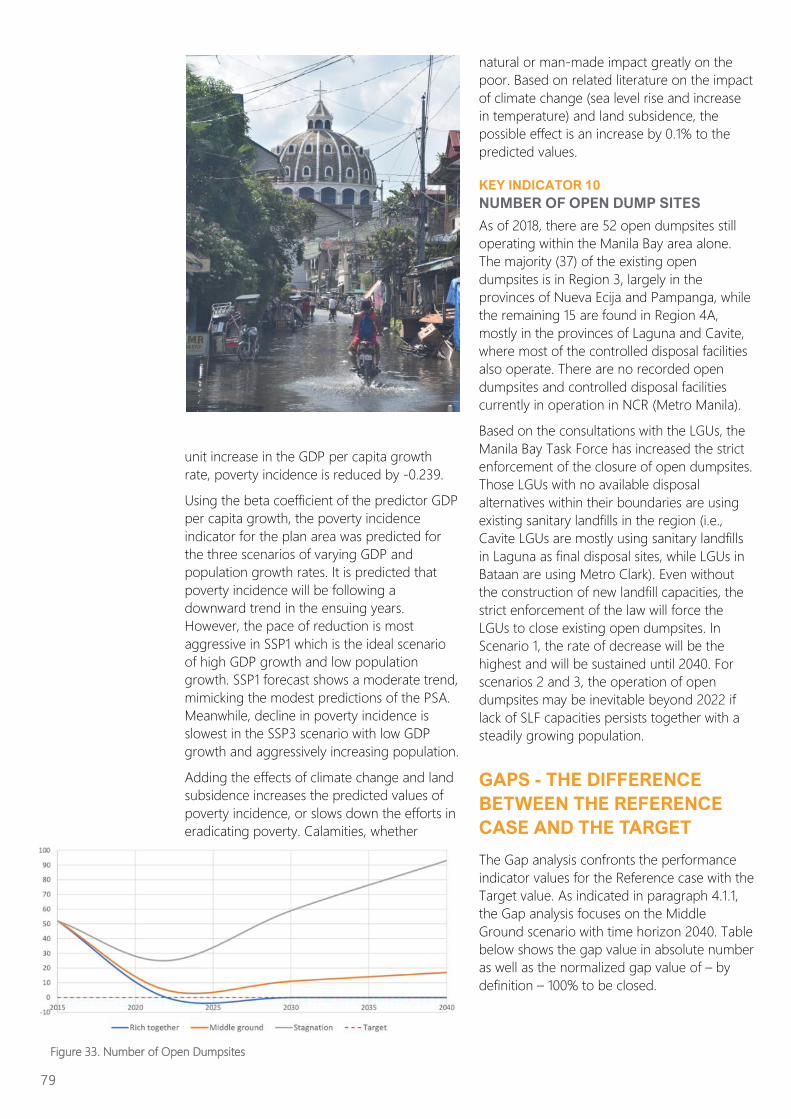
unit increase in the GDP per capita growth
rate, poverty incidence is reduced by -0.239.
Using the beta coefficient of the predictor GDP
per capita growth, the poverty incidence
indicator for the plan area was predicted for
the three scenarios of varying GDP and
population growth rates. It is predicted that
poverty incidence will be following a
downward trend in the ensuing years.
However, the pace of reduction is most
aggressive in SSP1 which is the ideal scenario
of high GDP growth and low population
growth. SSP1 forecast shows a moderate trend,
mimicking the modest predictions of the PSA.
Meanwhile, decline in poverty incidence is
slowest in the SSP3 scenario with low GDP
growth and aggressively increasing population.
Adding the effects of climate change and land
subsidence increases the predicted values of
poverty incidence, or slows down the efforts in
eradicating poverty. Calamities, whether
natural or man-made impact greatly on the
poor. Based on related literature on the impact
of climate change (sea level rise and increase
in temperature) and land subsidence, the
possible effect is an increase by 0.1% to the
predicted values.
KEY INDICATOR 10
NUMBER OF OPEN DUMP SITES
As of 2018, there are 52 open dumpsites still
operating within the Manila Bay area alone.
The majority (37) of the existing open
dumpsites is in Region 3, largely in the
provinces of Nueva Ecija and Pampanga, while
the remaining 15 are found in Region 4A,
mostly in the provinces of Laguna and Cavite,
where most of the controlled disposal facilities
also operate. There are no recorded open
dumpsites and controlled disposal facilities
currently in operation in NCR (Metro Manila).
Based on the consultations with the LGUs, the
Manila Bay Task Force has increased the strict
enforcement of the closure of open dumpsites.
Those LGUs with no available disposal
alternatives within their boundaries are using
existing sanitary landfills in the region (i.e.,
Cavite LGUs are mostly using sanitary landfills
in Laguna as final disposal sites, while LGUs in
Bataan are using Metro Clark). Even without
the construction of new landfill capacities, the
strict enforcement of the law will force the
LGUs to close existing open dumpsites. In
Scenario 1, the rate of decrease will be the
highest and will be sustained until 2040. For
scenarios 2 and 3, the operation of open
dumpsites may be inevitable beyond 2022 if
lack of SLF capacities persists together with a
steadily growing population.
GAPS - THE DIFFERENCE
BETWEEN THE REFERENCE
CASE AND THE TARGET
The Gap analysis confronts the performance
indicator values for the Reference case with the
Target value. As indicated in paragraph 4.1.1,
the Gap analysis focuses on the Middle
Ground scenario with time horizon 2040. Table
below shows the gap value in absolute number
as well as the normalized gap value of – by
definition – 100% to be closed.
79
Figure 33. Number of Open Dumpsites
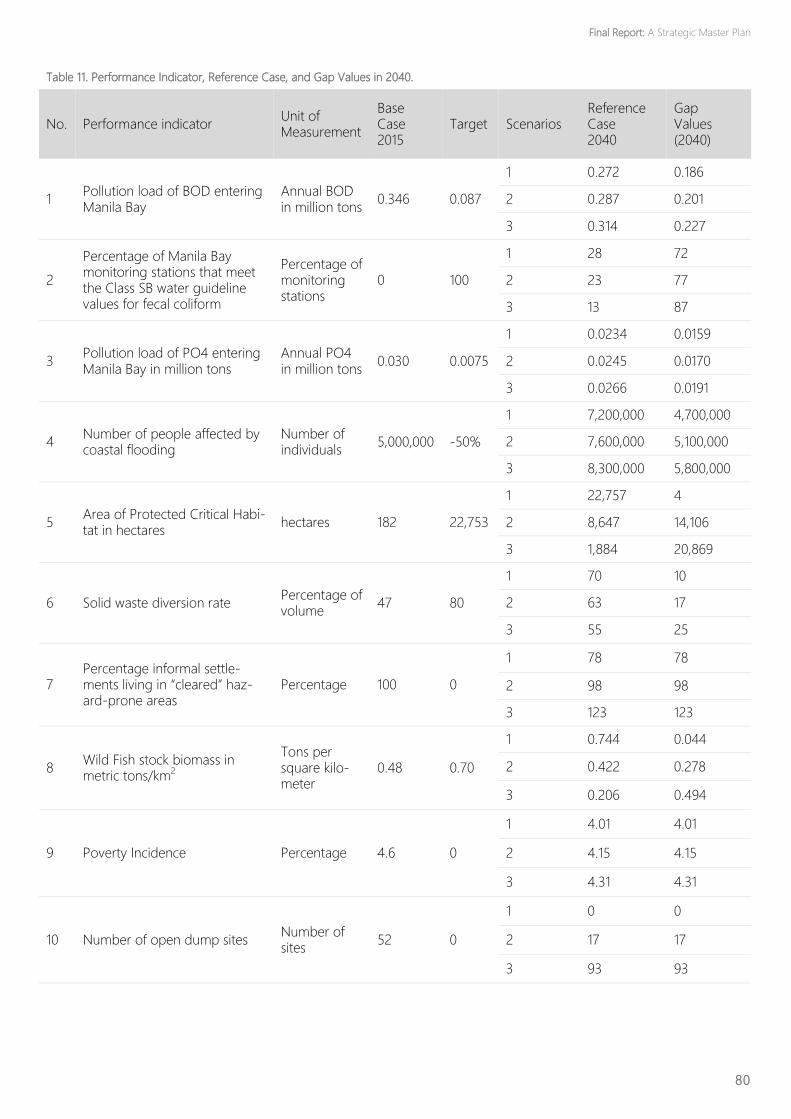
80
Table 11. Performance Indicator, Reference Case, and Gap Values in 2040.
No. Performance indicator Unit of Measurement
Base Case 2015
Target Scenarios Reference Case 2040
Gap Values (2040)
1 Pollution load of BOD entering Manila Bay
Annual BOD in million tons
0.346 0.087
1 0.272 0.186
2 0.287 0.201
3 0.314 0.227
2
Percentage of Manila Bay monitoring stations that meet the Class SB water guideline values for fecal coliform
Percentage of monitoring stations
0 100
1 28 72
2 23 77
3 13 87
3 Pollution load of PO4 entering Manila Bay in million tons
Annual PO4 in million tons
0.030 0.0075
1 0.0234 0.0159
2 0.0245 0.0170
3 0.0266 0.0191
4 Number of people affected by coastal flooding
Number of individuals
5,000,000 -50%
1 7,200,000 4,700,000
2 7,600,000 5,100,000
3 8,300,000 5,800,000
5 Area of Protected Critical Habi-tat in hectares
hectares 182 22,753
1 22,757 4
2 8,647 14,106
3 1,884 20,869
6 Solid waste diversion rate Percentage of volume
47 80
1 70 10
2 63 17
3 55 25
7 Percentage informal settle-ments living in “cleared” haz-ard-prone areas
Percentage 100 0
1 78 78
2 98 98
3 123 123
8 Wild Fish stock biomass in metric tons/km2
Tons per square kilo-meter
0.48 0.70
1 0.744 0.044
2 0.422 0.278
3 0.206 0.494
9 Poverty Incidence Percentage 4.6 0
1 4.01 4.01
2 4.15 4.15
3 4.31 4.31
10 Number of open dump sites Number of sites
52 0
1 0 0
2 17 17
3 93 93
Final Report: A Strategic Master Plan
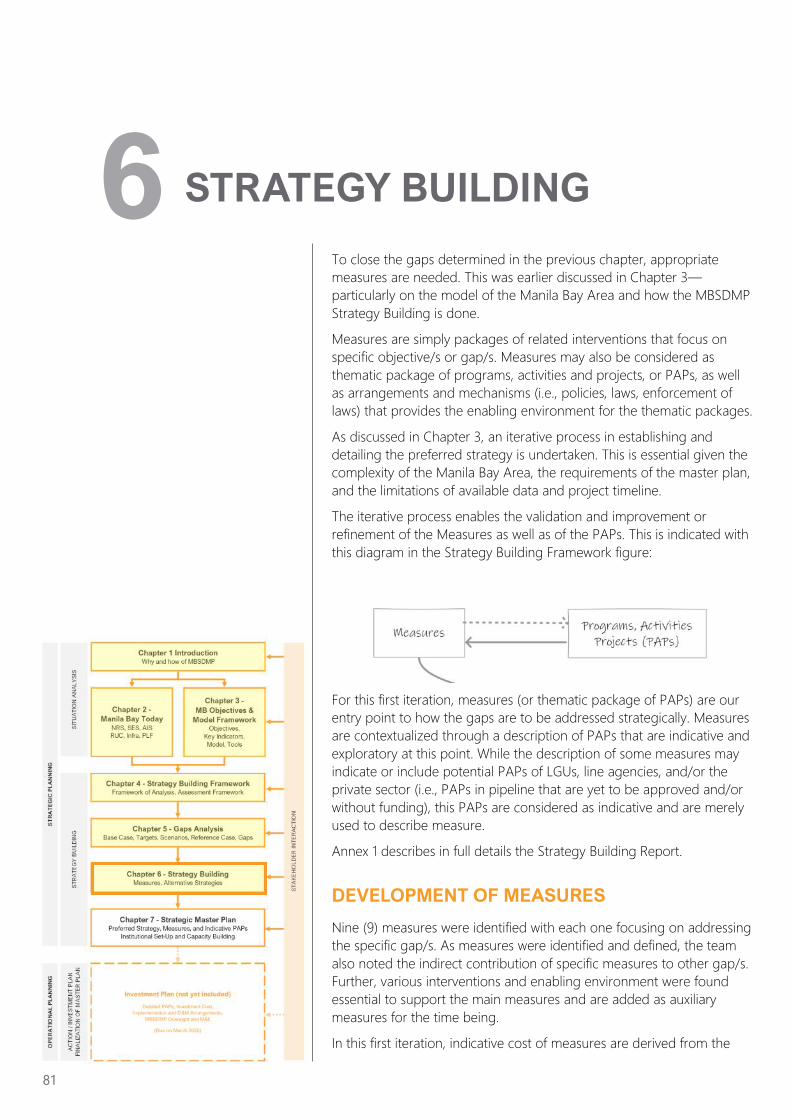
To close the gaps determined in the previous chapter, appropriate
measures are needed. This was earlier discussed in Chapter 3—
particularly on the model of the Manila Bay Area and how the MBSDMP
Strategy Building is done.
Measures are simply packages of related interventions that focus on
specific objective/s or gap/s. Measures may also be considered as
thematic package of programs, activities and projects, or PAPs, as well
as arrangements and mechanisms (i.e., policies, laws, enforcement of
laws) that provides the enabling environment for the thematic packages.
As discussed in Chapter 3, an iterative process in establishing and
detailing the preferred strategy is undertaken. This is essential given the
complexity of the Manila Bay Area, the requirements of the master plan,
and the limitations of available data and project timeline.
The iterative process enables the validation and improvement or
refinement of the Measures as well as of the PAPs. This is indicated with
this diagram in the Strategy Building Framework figure:
For this first iteration, measures (or thematic package of PAPs) are our
entry point to how the gaps are to be addressed strategically. Measures
are contextualized through a description of PAPs that are indicative and
exploratory at this point. While the description of some measures may
indicate or include potential PAPs of LGUs, line agencies, and/or the
private sector (i.e., PAPs in pipeline that are yet to be approved and/or
without funding), this PAPs are considered as indicative and are merely
used to describe measure.
Annex 1 describes in full details the Strategy Building Report.
DEVELOPMENT OF MEASURES
Nine (9) measures were identified with each one focusing on addressing
the specific gap/s. As measures were identified and defined, the team
also noted the indirect contribution of specific measures to other gap/s.
Further, various interventions and enabling environment were found
essential to support the main measures and are added as auxiliary
measures for the time being.
In this first iteration, indicative cost of measures are derived from the
81
STRATEGY BUILDING
6
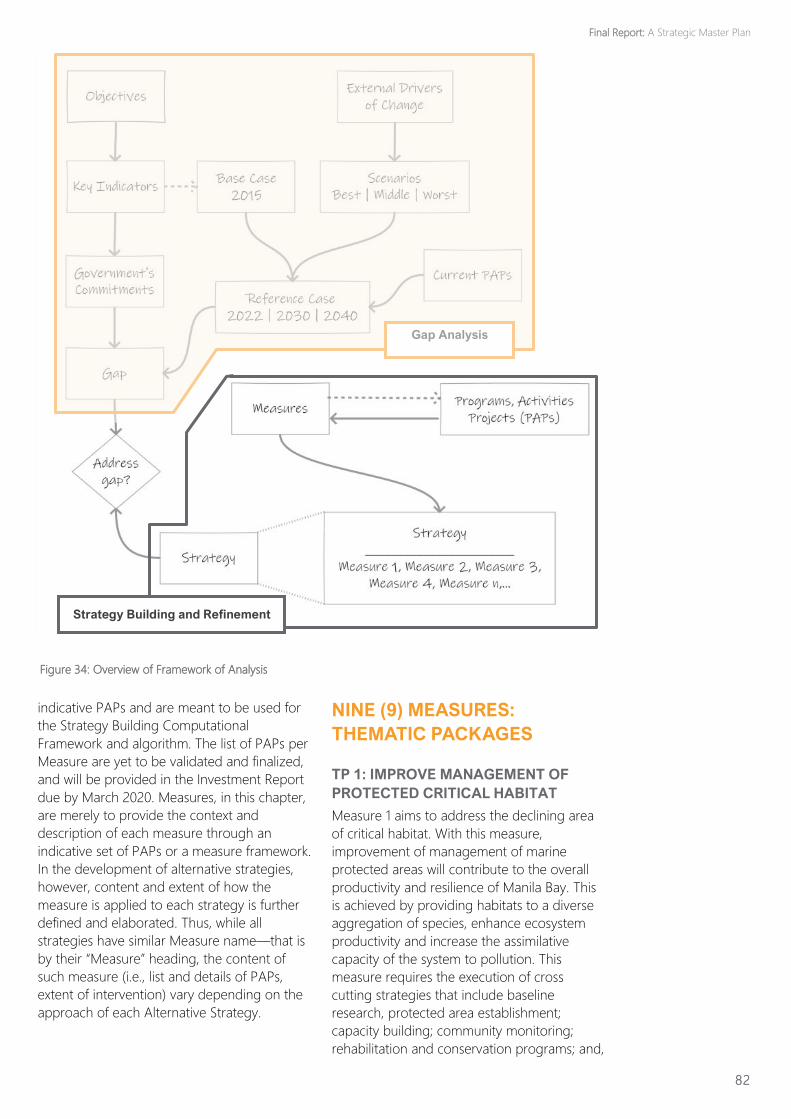
82
indicative PAPs and are meant to be used for
the Strategy Building Computational
Framework and algorithm. The list of PAPs per
Measure are yet to be validated and finalized,
and will be provided in the Investment Report
due by March 2020. Measures, in this chapter,
are merely to provide the context and
description of each measure through an
indicative set of PAPs or a measure framework.
In the development of alternative strategies,
however, content and extent of how the
measure is applied to each strategy is further
defined and elaborated. Thus, while all
strategies have similar Measure name—that is
by their “Measure” heading, the content of
such measure (i.e., list and details of PAPs,
extent of intervention) vary depending on the
approach of each Alternative Strategy.
NINE (9) MEASURES:
THEMATIC PACKAGES
TP 1: IMPROVE MANAGEMENT OF
PROTECTED CRITICAL HABITAT
Measure 1 aims to address the declining area
of critical habitat. With this measure,
improvement of management of marine
protected areas will contribute to the overall
productivity and resilience of Manila Bay. This
is achieved by providing habitats to a diverse
aggregation of species, enhance ecosystem
productivity and increase the assimilative
capacity of the system to pollution. This
measure requires the execution of cross
cutting strategies that include baseline
research, protected area establishment;
capacity building; community monitoring;
rehabilitation and conservation programs; and,
Strategy Building and Refinement
Gap Analysis
Figure 34: Overview of Framework of Analysis
Final Report: A Strategic Master Plan
the development of sustainable ecotourism
and the promotion of green tourism.
Measure 1 is primarily aimed to significantly
contribute to achieve the indicator on
“Increasing Area of Protected Natural Habitat”;
with moderate contribution to Fish stock
biomass and least contribution to number of
people exposed to flooding and Number of
open dump sites. In terms of indicative cost,
Measure 1 significantly less costly compared
with the most expensive proposed measure of
the project.
TP2: IMPROVE SOLID WASTE
MANAGEMENT
Measure 2 aims to improve solid waste
management in the Manila Bay region through
a combination of infrastructure and soft
measures varying from increased capacities of
solid waste disposal facilities to information,
education and communication campaigns and
institutional strengthening. PAPs initially
identified under this thematic package
includes:
▪ Increase capacities of sanitary landfill for
the MBR
▪ Construction and operation of regional
transfer stations and MRFs.
▪ Construction of large scale-composting
facilities.
▪ Waste-to-Energy (WTE) projects including
RDF, bio-digesters and other thermal and
non-thermal technologies with energy
recovery.
▪ Incentives for LGUs to increase diversion
rates.
▪ Strict enforcement of waste segregation
from households.
▪ IECs focusing on waste reduction.
▪ Ban on single-use plastics.
Similarly, continuous capacity building must be
provided to those implementing the solid
waste management policies and programs
which may include but not limited to latest
available technologies on recycling and
resource recovery; entrepreneurship;
advocacies and development of an effective
IEC campaign
Measure 2 has the highest positive
contribution to indicator: Solid waste diversion
rate and Number of open dump sites at 100
percent; with moderate contribution to
Pollution load of BOD entering Manila Bay and
least contribution to Percentage encroachment
of Informal settlements in legal easement,
Poverty Incidence, Number of people exposed
to flooding and Fish stock biomass in metric
tons/km2 Similar to Measure 1, Measure 2
required much less budget compared with the
most expensive proposed measure of the
project.
TP3: REDUCE POLLUTION LOAD
Key measures to improve the water quality of
the Bay will involve increase investment in
environmental infrastructures for wastewater
collection and treatment; enabling
environment with stricter enforcement of
pollution laws; and increase in pubic awareness
on the health and environmental hazards
associated with untreated wastewater.
Amongst the cluster of interventions initially
identified under this measure include:
▪ Domestic Wastewater Management
▪ Commercial and Other Sources of
Wastewater
▪ Industrial Wastewater Management
▪ Treatment of Industrial Effluents.
Measure 3 has the highest positive
contribution to indicator: Pollution load of BOD
entering Manila Bay , Percentage of Manila Bay
monitoring stations that meet the SB guideline
value for fecal coliform, and Pollution load of
PO4 entering Manila Bay at 100 percent; with
moderate contribution to Area of Protected
Natural Habitat and least contribution to
remaining 6 indicators
Measure 3 has a relatively high investment
requirement at its initial period of
implementation compared to 2030 and 2040.
It also much cheaper compared to the most
expensive proposed measure of the project.
TP4: ADDRESS CONCERNS OF
INFORMAL SETTLEMENT IN HAZARD-
PRONE AREAS
This measure is initially identified to address
the concerns of informal settlers families (ISFs),
particularly those who are in hazard-prone
areas and those who are living in areas with
inadequate access to basic facilities such as
basic sanitation and waste management.
Amongst the interventions initially identified
under this measure includes the following:
83
▪ increase the supply of affordable housing,
▪ reduce the motivation for people to live in
informal settlements, and
▪ policy reforms to strengthen the
capabilities of national and local
governments to enforce relevant laws that
discourage informal settlements.
It is expected that the above measure and
actions will lead to, among others, the removal
of informal settlements in legal easements,
reduction of pollution loads entering Manila
Bay, increase the area of protected natural
habitats, lessen the number of people exposed
to flooding and reduction of poverty incidence.
TP5: IMPLEMENT DRRM PROGRAMS
AND PROJECTS
This measure is intended primarily to reduce
the number of people exposed to flooding
particularly along the coastal areas and other
areas frequently affected by flooding. The
activities included in this measure are also
expected to reduce the percentage
encroachment in legal easements as well as
contribute in the attainment of other important
targets including increasing the area of natural
habitats, increasing the abundance of
demersal fish stocks, and reduction of poverty
incidence. The initial key cluster of
interventions/activities that are included in this
measure are.
▪ Nature-based coastal protection solutions
▪ Abate land subsidence and salt water
intrusion (i.e., reduction/stop groundwater
extraction, provision of alternative water
sources,
▪ Improvement of water management (i.e.,
rainwater, flood water, runoff and treated
resources, use of reward system on
alternative water sources, incentives
▪ Capacity-building of LGUs for Climate and
Disaster Risk Assessment (CDRA), LCCAP
and DRRMP
▪ Improvement of existing flood-mitigating
infrastructures (drainage, seawalls, river
bank rehabilitation, etc.)
Measure 5 has the highest positive
contribution to indicator: Percentage
encroachment of Informal settlements in legal
easement and Number of people exposed to
flooding at 100 percent; with moderate
contribution to Increasing Area of Protected
Natural Habitat and Fish stock biomass and
least contribution to Number of Open
Dumpsites, Solid Waste Diversion rate,
Pollution load of BOD and Percentage of
Manila Bay monitoring stations that meet the
SB guideline value for fecal coliform.
Measure 5 is much cheaper than the most
expensive proposed measure of the project.
TP6: IMPLEMENT SUSTAINABLE
FISHERIES MANAGEMENT
Measure 6 aims to increase fish biomass
through sustainable fisheries through holistic,
cross cutting interventions that is essential in
reversing the process of overfishing in Manila
Bay.
Reducing fishing pressure is also essential in
increasing fish stock density to the target level.
Aside from enforcing the protection of critical
fish habitats, the reduction of fishing pressure
also contributes to improving stock density.
Hence, the implementation of an alternative
livelihood, capacity building and incentives
program are necessary to slow down the cycle
of poverty and reduce the strong dependence
of fishermen to Manila Bay’s fish resource.
Measure 6 has the highest positive
contribution to indicator on fish stock biomass;
with moderate contribution to Increasing Area
of Protected Natural Habitat and least
contribution to remaining Indicators.
Measure 6 is much cheaper than the most
expensive proposed measure of the project.
TP7: RESPONSIBLE RECLAMATION
Measure 7 is not about promoting reclamation
in Manila Bay but is aimed to provide
measures that will ensure responsible
reclamation activities. While it is noted that
reclamation activities may provide positive
contribution to economic growth and reducing
poverty incidence in the area, negative effect
in natural habitat and sustainable fisheries is
also noted. This measure aims to provide a
framework to guide decision-makers if and
when reclamation projects is being proposed
and considered.
TP8: ENVIRONMENTALLY SOUND
DEVELOPMENT
Sustainable development has been defined in
many ways, but the most frequently quoted
definition is from Our Common Future, also
84
Final Report: A Strategic Master Plan
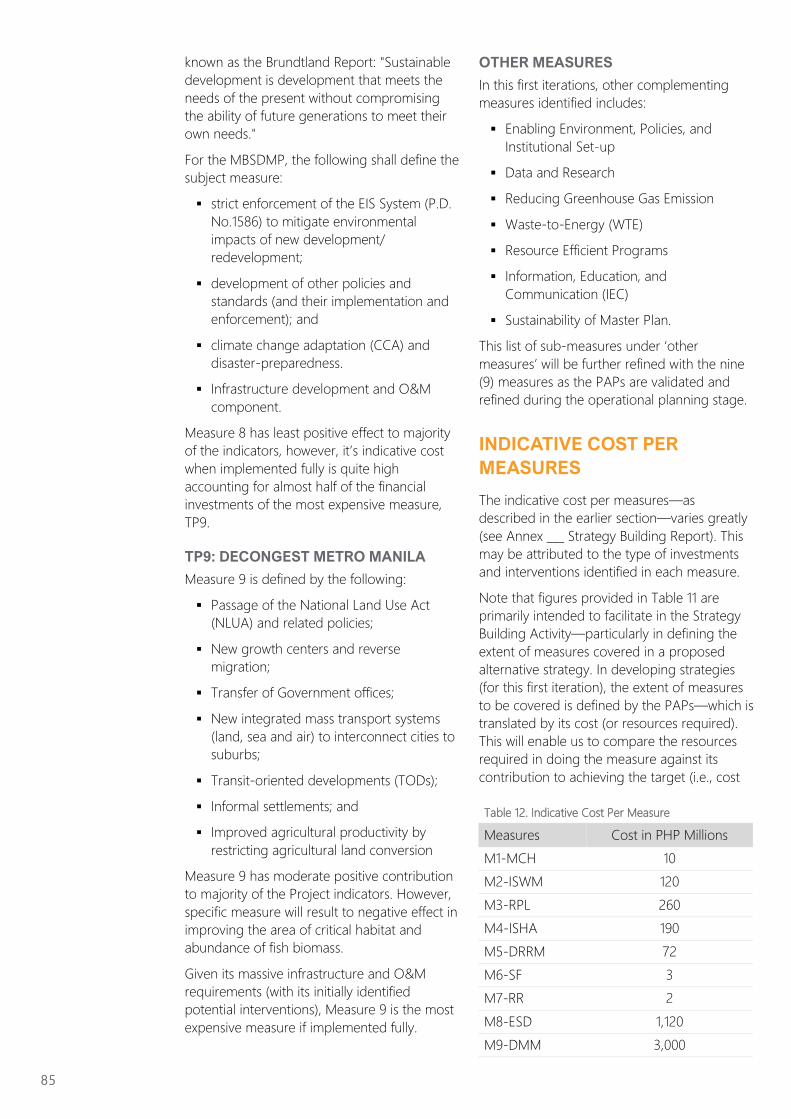
known as the Brundtland Report: "Sustainable
development is development that meets the
needs of the present without compromising
the ability of future generations to meet their
own needs."
For the MBSDMP, the following shall define the
subject measure:
▪ strict enforcement of the EIS System (P.D.
No.1586) to mitigate environmental
impacts of new development/
redevelopment;
▪ development of other policies and
standards (and their implementation and
enforcement); and
▪ climate change adaptation (CCA) and
disaster-preparedness.
▪ Infrastructure development and O&M
component.
Measure 8 has least positive effect to majority
of the indicators, however, it’s indicative cost
when implemented fully is quite high
accounting for almost half of the financial
investments of the most expensive measure,
TP9.
TP9: DECONGEST METRO MANILA
Measure 9 is defined by the following:
▪ Passage of the National Land Use Act
(NLUA) and related policies;
▪ New growth centers and reverse
migration;
▪ Transfer of Government offices;
▪ New integrated mass transport systems
(land, sea and air) to interconnect cities to
suburbs;
▪ Transit-oriented developments (TODs);
▪ Informal settlements; and
▪ Improved agricultural productivity by
restricting agricultural land conversion
Measure 9 has moderate positive contribution
to majority of the Project indicators. However,
specific measure will result to negative effect in
improving the area of critical habitat and
abundance of fish biomass.
Given its massive infrastructure and O&M
requirements (with its initially identified
potential interventions), Measure 9 is the most
expensive measure if implemented fully.
OTHER MEASURES
In this first iterations, other complementing
measures identified includes:
▪ Enabling Environment, Policies, and
Institutional Set-up
▪ Data and Research
▪ Reducing Greenhouse Gas Emission
▪ Waste-to-Energy (WTE)
▪ Resource Efficient Programs
▪ Information, Education, and
Communication (IEC)
▪ Sustainability of Master Plan.
This list of sub-measures under ‘other
measures’ will be further refined with the nine
(9) measures as the PAPs are validated and
refined during the operational planning stage.
INDICATIVE COST PER
MEASURES
The indicative cost per measures—as
described in the earlier section—varies greatly
(see Annex ___ Strategy Building Report). This
may be attributed to the type of investments
and interventions identified in each measure.
Note that figures provided in Table 11 are
primarily intended to facilitate in the Strategy
Building Activity—particularly in defining the
extent of measures covered in a proposed
alternative strategy. In developing strategies
(for this first iteration), the extent of measures
to be covered is defined by the PAPs—which is
translated by its cost (or resources required).
This will enable us to compare the resources
required in doing the measure against its
contribution to achieving the target (i.e., cost
85
Table 12. Indicative Cost Per Measure
Measures Cost in PHP Millions
M1-MCH 10
M2-ISWM 120
M3-RPL 260
M4-ISHA 190
M5-DRRM 72
M6-SF 3
M7-RR 2
M8-ESD 1,120
M9-DMM 3,000
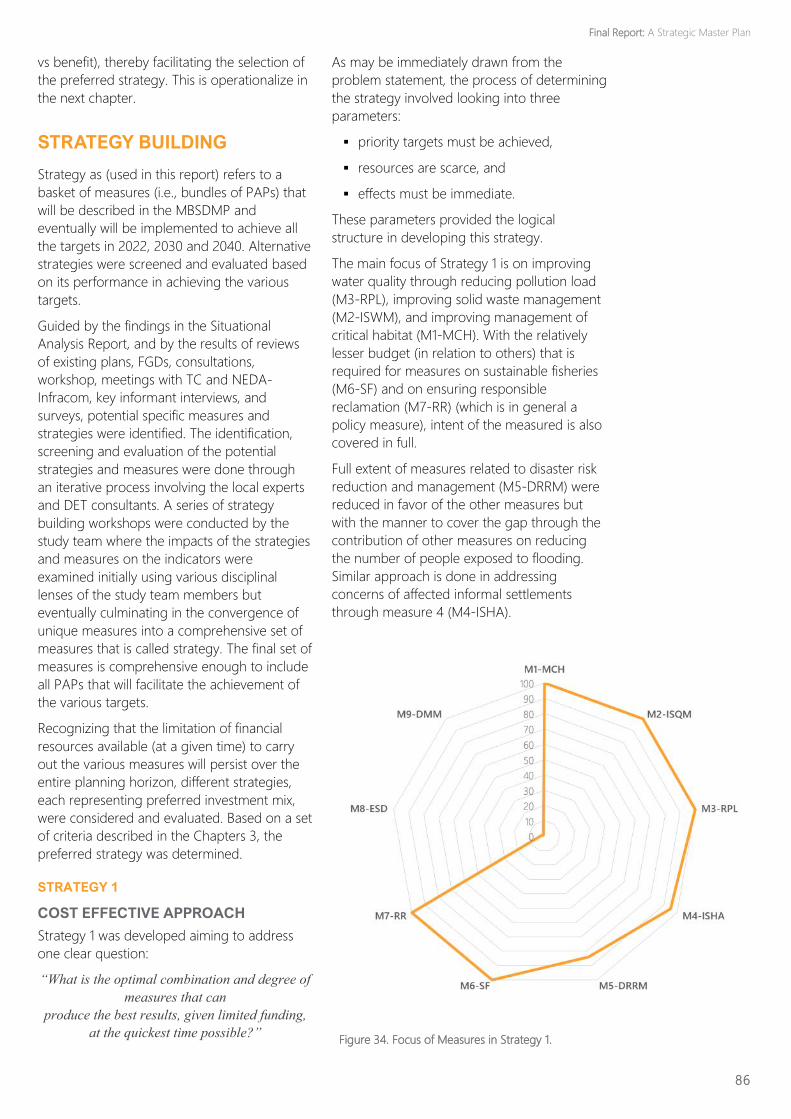
vs benefit), thereby facilitating the selection of
the preferred strategy. This is operationalize in
the next chapter.
STRATEGY BUILDING
Strategy as (used in this report) refers to a
basket of measures (i.e., bundles of PAPs) that
will be described in the MBSDMP and
eventually will be implemented to achieve all
the targets in 2022, 2030 and 2040. Alternative
strategies were screened and evaluated based
on its performance in achieving the various
targets.
Guided by the findings in the Situational
Analysis Report, and by the results of reviews
of existing plans, FGDs, consultations,
workshop, meetings with TC and NEDA-
Infracom, key informant interviews, and
surveys, potential specific measures and
strategies were identified. The identification,
screening and evaluation of the potential
strategies and measures were done through
an iterative process involving the local experts
and DET consultants. A series of strategy
building workshops were conducted by the
study team where the impacts of the strategies
and measures on the indicators were
examined initially using various disciplinal
lenses of the study team members but
eventually culminating in the convergence of
unique measures into a comprehensive set of
measures that is called strategy. The final set of
measures is comprehensive enough to include
all PAPs that will facilitate the achievement of
the various targets.
Recognizing that the limitation of financial
resources available (at a given time) to carry
out the various measures will persist over the
entire planning horizon, different strategies,
each representing preferred investment mix,
were considered and evaluated. Based on a set
of criteria described in the Chapters 3, the
preferred strategy was determined.
STRATEGY 1
COST EFFECTIVE APPROACH
Strategy 1 was developed aiming to address
one clear question:
“What is the optimal combination and degree of
measures that can
produce the best results, given limited funding,
at the quickest time possible?”
As may be immediately drawn from the
problem statement, the process of determining
the strategy involved looking into three
parameters:
▪ priority targets must be achieved,
▪ resources are scarce, and
▪ effects must be immediate.
These parameters provided the logical
structure in developing this strategy.
The main focus of Strategy 1 is on improving
water quality through reducing pollution load
(M3-RPL), improving solid waste management
(M2-ISWM), and improving management of
critical habitat (M1-MCH). With the relatively
lesser budget (in relation to others) that is
required for measures on sustainable fisheries
(M6-SF) and on ensuring responsible
reclamation (M7-RR) (which is in general a
policy measure), intent of the measured is also
covered in full.
Full extent of measures related to disaster risk
reduction and management (M5-DRRM) were
reduced in favor of the other measures but
with the manner to cover the gap through the
contribution of other measures on reducing
the number of people exposed to flooding.
Similar approach is done in addressing
concerns of affected informal settlements
through measure 4 (M4-ISHA).
86
Figure 34. Focus of Measures in Strategy 1.
Final Report: A Strategic Master Plan
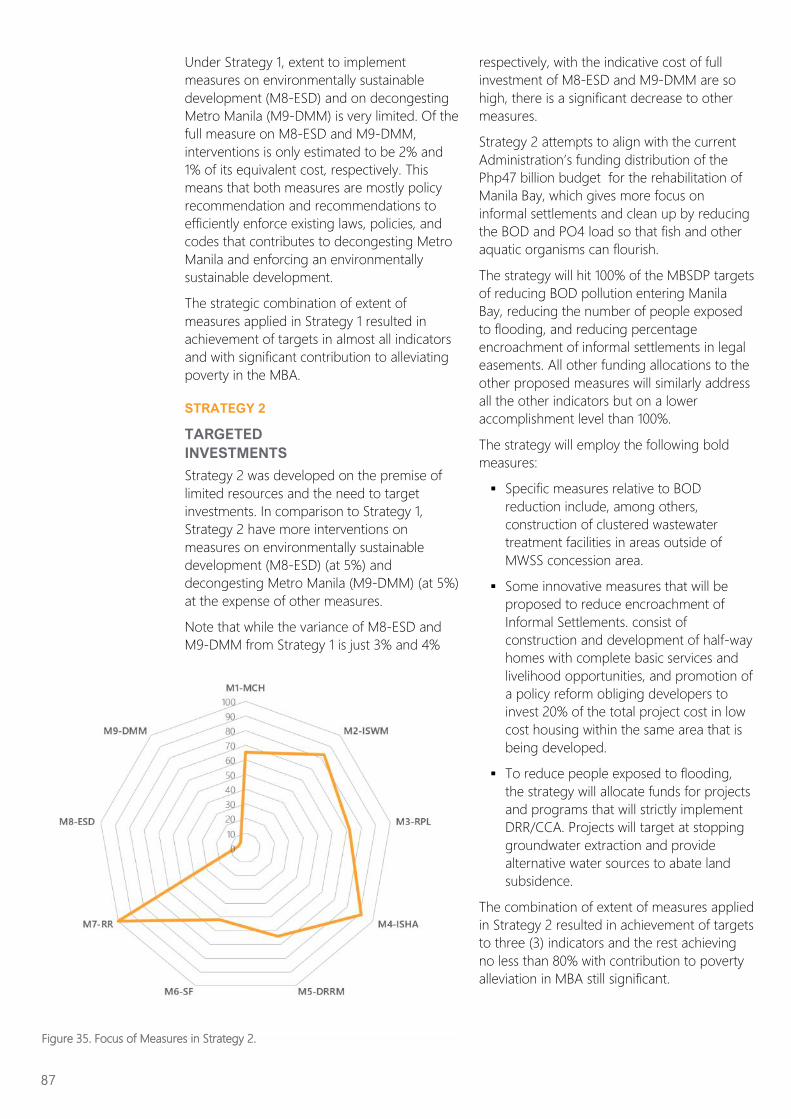
Under Strategy 1, extent to implement
measures on environmentally sustainable
development (M8-ESD) and on decongesting
Metro Manila (M9-DMM) is very limited. Of the
full measure on M8-ESD and M9-DMM,
interventions is only estimated to be 2% and
1% of its equivalent cost, respectively. This
means that both measures are mostly policy
recommendation and recommendations to
efficiently enforce existing laws, policies, and
codes that contributes to decongesting Metro
Manila and enforcing an environmentally
sustainable development.
The strategic combination of extent of
measures applied in Strategy 1 resulted in
achievement of targets in almost all indicators
and with significant contribution to alleviating
poverty in the MBA.
STRATEGY 2
TARGETED
INVESTMENTS
Strategy 2 was developed on the premise of
limited resources and the need to target
investments. In comparison to Strategy 1,
Strategy 2 have more interventions on
measures on environmentally sustainable
development (M8-ESD) (at 5%) and
decongesting Metro Manila (M9-DMM) (at 5%)
at the expense of other measures.
Note that while the variance of M8-ESD and
M9-DMM from Strategy 1 is just 3% and 4%
respectively, with the indicative cost of full
investment of M8-ESD and M9-DMM are so
high, there is a significant decrease to other
measures.
Strategy 2 attempts to align with the current
Administration’s funding distribution of the
Php47 billion budget for the rehabilitation of
Manila Bay, which gives more focus on
informal settlements and clean up by reducing
the BOD and PO4 load so that fish and other
aquatic organisms can flourish.
The strategy will hit 100% of the MBSDP targets
of reducing BOD pollution entering Manila
Bay, reducing the number of people exposed
to flooding, and reducing percentage
encroachment of informal settlements in legal
easements. All other funding allocations to the
other proposed measures will similarly address
all the other indicators but on a lower
accomplishment level than 100%.
The strategy will employ the following bold
measures:
▪ Specific measures relative to BOD
reduction include, among others,
construction of clustered wastewater
treatment facilities in areas outside of
MWSS concession area.
▪ Some innovative measures that will be
proposed to reduce encroachment of
Informal Settlements. consist of
construction and development of half-way
homes with complete basic services and
livelihood opportunities, and promotion of
a policy reform obliging developers to
invest 20% of the total project cost in low
cost housing within the same area that is
being developed.
▪ To reduce people exposed to flooding,
the strategy will allocate funds for projects
and programs that will strictly implement
DRR/CCA. Projects will target at stopping
groundwater extraction and provide
alternative water sources to abate land
subsidence.
The combination of extent of measures applied
in Strategy 2 resulted in achievement of targets
to three (3) indicators and the rest achieving
no less than 80% with contribution to poverty
alleviation in MBA still significant.
87
Figure 35. Focus of Measures in Strategy 2.
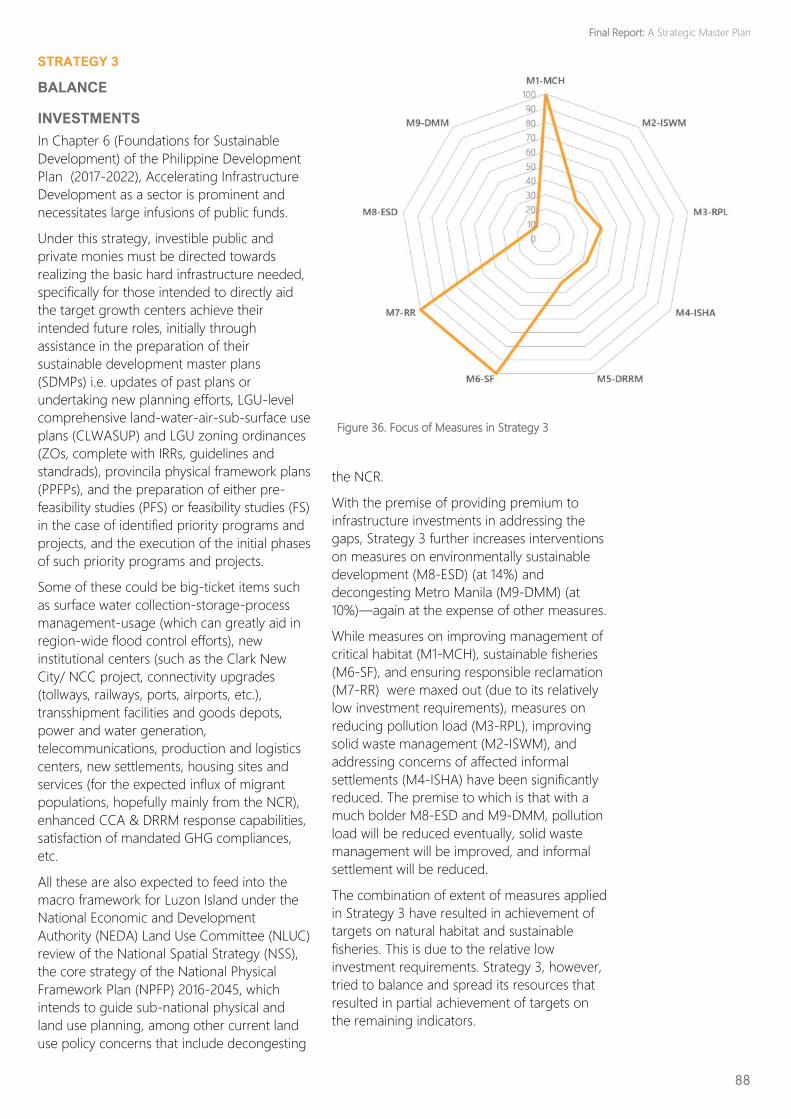
STRATEGY 3
BALANCE
INVESTMENTS
In Chapter 6 (Foundations for Sustainable
Development) of the Philippine Development
Plan (2017-2022), Accelerating Infrastructure
Development as a sector is prominent and
necessitates large infusions of public funds.
Under this strategy, investible public and
private monies must be directed towards
realizing the basic hard infrastructure needed,
specifically for those intended to directly aid
the target growth centers achieve their
intended future roles, initially through
assistance in the preparation of their
sustainable development master plans
(SDMPs) i.e. updates of past plans or
undertaking new planning efforts, LGU-level
comprehensive land-water-air-sub-surface use
plans (CLWASUP) and LGU zoning ordinances
(ZOs, complete with IRRs, guidelines and
standrads), provincila physical framework plans
(PPFPs), and the preparation of either pre-
feasibility studies (PFS) or feasibility studies (FS)
in the case of identified priority programs and
projects, and the execution of the initial phases
of such priority programs and projects.
Some of these could be big-ticket items such
as surface water collection-storage-process
management-usage (which can greatly aid in
region-wide flood control efforts), new
institutional centers (such as the Clark New
City/ NCC project, connectivity upgrades
(tollways, railways, ports, airports, etc.),
transshipment facilities and goods depots,
power and water generation,
telecommunications, production and logistics
centers, new settlements, housing sites and
services (for the expected influx of migrant
populations, hopefully mainly from the NCR),
enhanced CCA & DRRM response capabilities,
satisfaction of mandated GHG compliances,
etc.
All these are also expected to feed into the
macro framework for Luzon Island under the
National Economic and Development
Authority (NEDA) Land Use Committee (NLUC)
review of the National Spatial Strategy (NSS),
the core strategy of the National Physical
Framework Plan (NPFP) 2016-2045, which
intends to guide sub-national physical and
land use planning, among other current land
use policy concerns that include decongesting
the NCR.
With the premise of providing premium to
infrastructure investments in addressing the
gaps, Strategy 3 further increases interventions
on measures on environmentally sustainable
development (M8-ESD) (at 14%) and
decongesting Metro Manila (M9-DMM) (at
10%)—again at the expense of other measures.
While measures on improving management of
critical habitat (M1-MCH), sustainable fisheries
(M6-SF), and ensuring responsible reclamation
(M7-RR) were maxed out (due to its relatively
low investment requirements), measures on
reducing pollution load (M3-RPL), improving
solid waste management (M2-ISWM), and
addressing concerns of affected informal
settlements (M4-ISHA) have been significantly
reduced. The premise to which is that with a
much bolder M8-ESD and M9-DMM, pollution
load will be reduced eventually, solid waste
management will be improved, and informal
settlement will be reduced.
The combination of extent of measures applied
in Strategy 3 have resulted in achievement of
targets on natural habitat and sustainable
fisheries. This is due to the relative low
investment requirements. Strategy 3, however,
tried to balance and spread its resources that
resulted in partial achievement of targets on
the remaining indicators.
88
Figure 36. Focus of Measures in Strategy 3
Final Report: A Strategic Master Plan
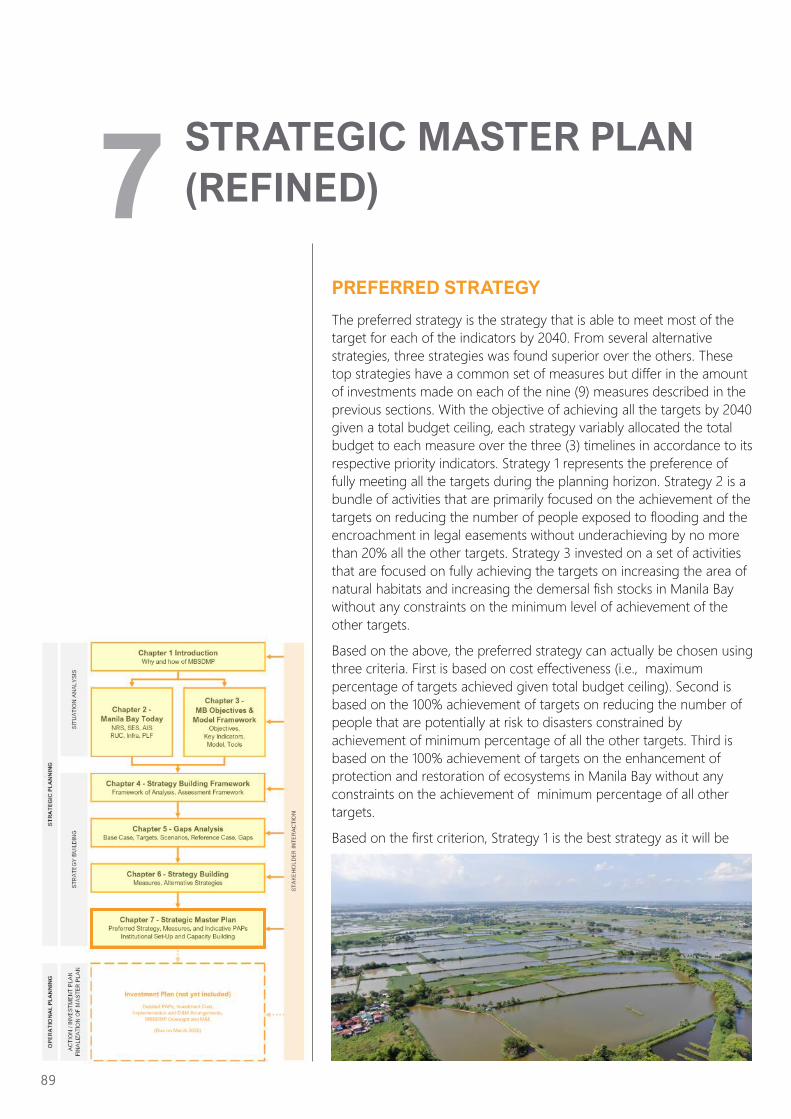
PREFERRED STRATEGY
The preferred strategy is the strategy that is able to meet most of the
target for each of the indicators by 2040. From several alternative
strategies, three strategies was found superior over the others. These
top strategies have a common set of measures but differ in the amount
of investments made on each of the nine (9) measures described in the
previous sections. With the objective of achieving all the targets by 2040
given a total budget ceiling, each strategy variably allocated the total
budget to each measure over the three (3) timelines in accordance to its
respective priority indicators. Strategy 1 represents the preference of
fully meeting all the targets during the planning horizon. Strategy 2 is a
bundle of activities that are primarily focused on the achievement of the
targets on reducing the number of people exposed to flooding and the
encroachment in legal easements without underachieving by no more
than 20% all the other targets. Strategy 3 invested on a set of activities
that are focused on fully achieving the targets on increasing the area of
natural habitats and increasing the demersal fish stocks in Manila Bay
without any constraints on the minimum level of achievement of the
other targets.
Based on the above, the preferred strategy can actually be chosen using
three criteria. First is based on cost effectiveness (i.e., maximum
percentage of targets achieved given total budget ceiling). Second is
based on the 100% achievement of targets on reducing the number of
people that are potentially at risk to disasters constrained by
achievement of minimum percentage of all the other targets. Third is
based on the 100% achievement of targets on the enhancement of
protection and restoration of ecosystems in Manila Bay without any
constraints on the achievement of minimum percentage of all other
targets.
Based on the first criterion, Strategy 1 is the best strategy as it will be
89
STRATEGIC MASTER PLAN
(REFINED)
7
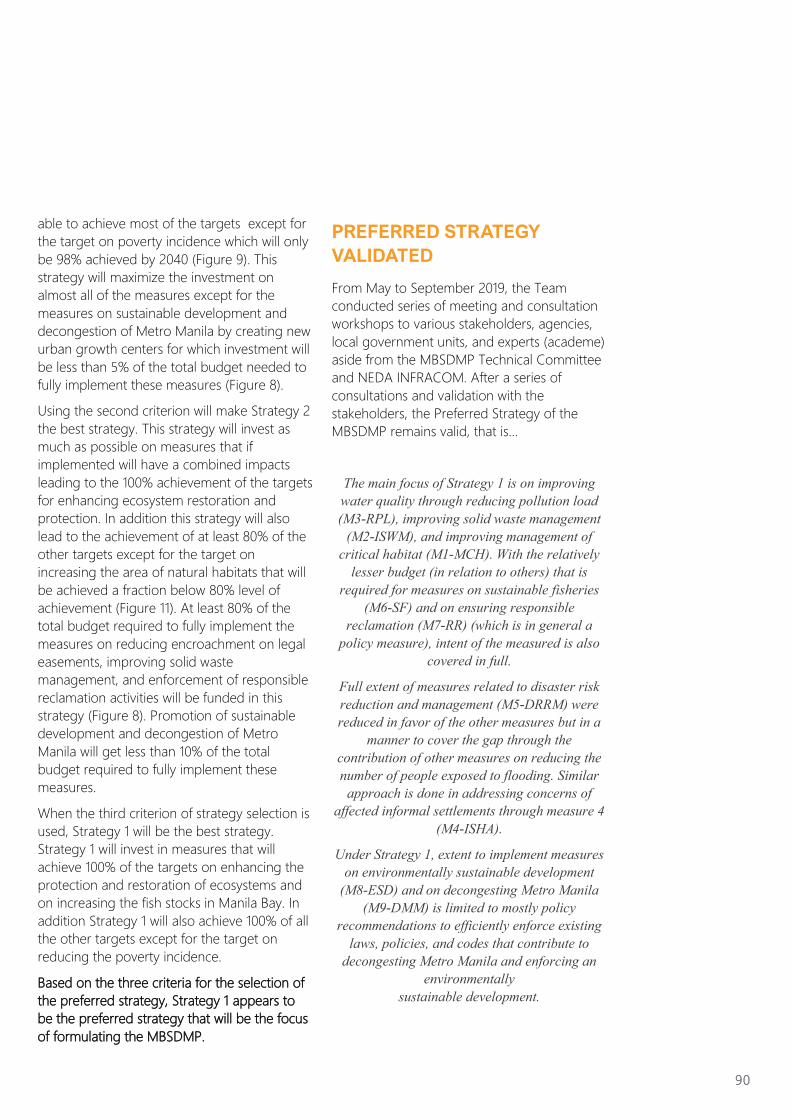
90
able to achieve most of the targets except for
the target on poverty incidence which will only
be 98% achieved by 2040 (Figure 9). This
strategy will maximize the investment on
almost all of the measures except for the
measures on sustainable development and
decongestion of Metro Manila by creating new
urban growth centers for which investment will
be less than 5% of the total budget needed to
fully implement these measures (Figure 8).
Using the second criterion will make Strategy 2
the best strategy. This strategy will invest as
much as possible on measures that if
implemented will have a combined impacts
leading to the 100% achievement of the targets
for enhancing ecosystem restoration and
protection. In addition this strategy will also
lead to the achievement of at least 80% of the
other targets except for the target on
increasing the area of natural habitats that will
be achieved a fraction below 80% level of
achievement (Figure 11). At least 80% of the
total budget required to fully implement the
measures on reducing encroachment on legal
easements, improving solid waste
management, and enforcement of responsible
reclamation activities will be funded in this
strategy (Figure 8). Promotion of sustainable
development and decongestion of Metro
Manila will get less than 10% of the total
budget required to fully implement these
measures.
When the third criterion of strategy selection is
used, Strategy 1 will be the best strategy.
Strategy 1 will invest in measures that will
achieve 100% of the targets on enhancing the
protection and restoration of ecosystems and
on increasing the fish stocks in Manila Bay. In
addition Strategy 1 will also achieve 100% of all
the other targets except for the target on
reducing the poverty incidence.
Based on the three criteria for the selection of
the preferred strategy, Strategy 1 appears to
be the preferred strategy that will be the focus
of formulating the MBSDMP.
PREFERRED STRATEGY
VALIDATED
From May to September 2019, the Team
conducted series of meeting and consultation
workshops to various stakeholders, agencies,
local government units, and experts (academe)
aside from the MBSDMP Technical Committee
and NEDA INFRACOM. After a series of
consultations and validation with the
stakeholders, the Preferred Strategy of the
MBSDMP remains valid, that is…
The main focus of Strategy 1 is on improving
water quality through reducing pollution load
(M3-RPL), improving solid waste management
(M2-ISWM), and improving management of
critical habitat (M1-MCH). With the relatively
lesser budget (in relation to others) that is
required for measures on sustainable fisheries
(M6-SF) and on ensuring responsible
reclamation (M7-RR) (which is in general a
policy measure), intent of the measured is also
covered in full.
Full extent of measures related to disaster risk
reduction and management (M5-DRRM) were
reduced in favor of the other measures but in a
manner to cover the gap through the
contribution of other measures on reducing the
number of people exposed to flooding. Similar
approach is done in addressing concerns of
affected informal settlements through measure 4
(M4-ISHA).
Under Strategy 1, extent to implement measures
on environmentally sustainable development
(M8-ESD) and on decongesting Metro Manila
(M9-DMM) is limited to mostly policy
recommendations to efficiently enforce existing
laws, policies, and codes that contribute to
decongesting Metro Manila and enforcing an
environmentally
sustainable development.
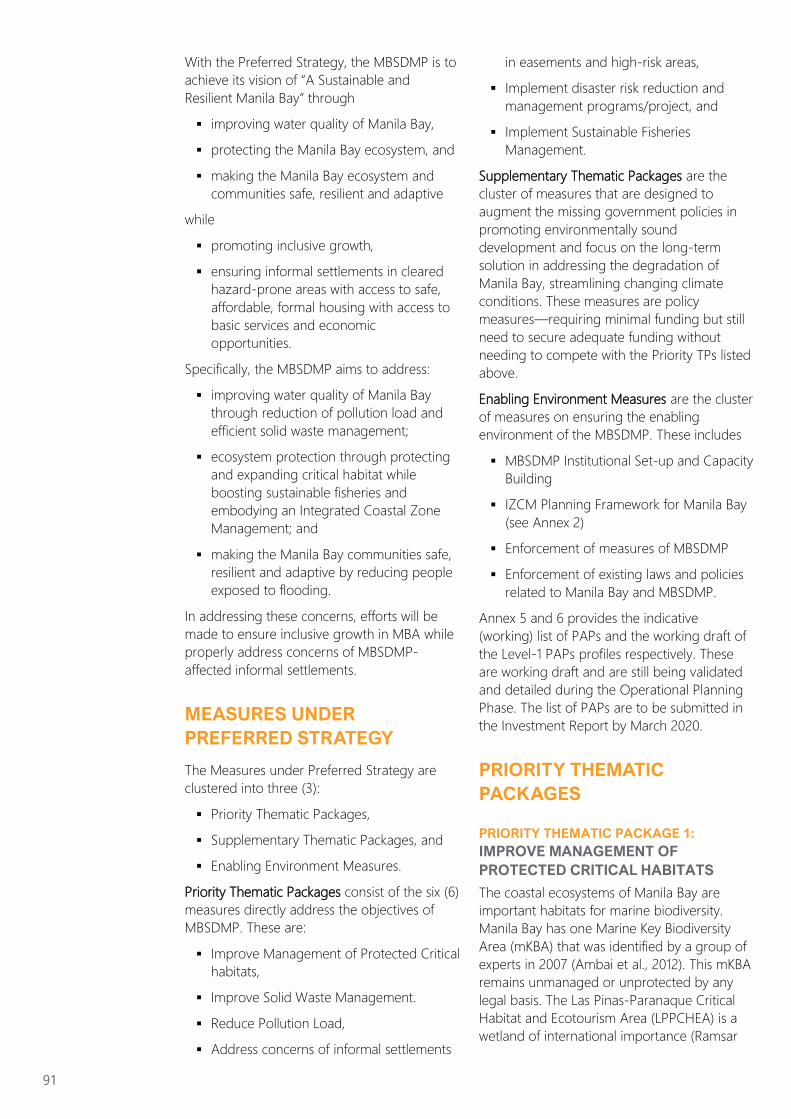
With the Preferred Strategy, the MBSDMP is to
achieve its vision of “A Sustainable and
Resilient Manila Bay” through
▪ improving water quality of Manila Bay,
▪ protecting the Manila Bay ecosystem, and
▪ making the Manila Bay ecosystem and
communities safe, resilient and adaptive
while
▪ promoting inclusive growth,
▪ ensuring informal settlements in cleared
hazard-prone areas with access to safe,
affordable, formal housing with access to
basic services and economic
opportunities.
Specifically, the MBSDMP aims to address:
▪ improving water quality of Manila Bay
through reduction of pollution load and
efficient solid waste management;
▪ ecosystem protection through protecting
and expanding critical habitat while
boosting sustainable fisheries and
embodying an Integrated Coastal Zone
Management; and
▪ making the Manila Bay communities safe,
resilient and adaptive by reducing people
exposed to flooding.
In addressing these concerns, efforts will be
made to ensure inclusive growth in MBA while
properly address concerns of MBSDMP-
affected informal settlements.
MEASURES UNDER
PREFERRED STRATEGY
The Measures under Preferred Strategy are
clustered into three (3):
▪ Priority Thematic Packages,
▪ Supplementary Thematic Packages, and
▪ Enabling Environment Measures.
Priority Thematic Packages consist of the six (6)
measures directly address the objectives of
MBSDMP. These are:
▪ Improve Management of Protected Critical
habitats,
▪ Improve Solid Waste Management.
▪ Reduce Pollution Load,
▪ Address concerns of informal settlements
in easements and high-risk areas,
▪ Implement disaster risk reduction and
management programs/project, and
▪ Implement Sustainable Fisheries
Management.
Supplementary Thematic Packages are the
cluster of measures that are designed to
augment the missing government policies in
promoting environmentally sound
development and focus on the long-term
solution in addressing the degradation of
Manila Bay, streamlining changing climate
conditions. These measures are policy
measures—requiring minimal funding but still
need to secure adequate funding without
needing to compete with the Priority TPs listed
above.
Enabling Environment Measures are the cluster
of measures on ensuring the enabling
environment of the MBSDMP. These includes
▪ MBSDMP Institutional Set-up and Capacity
Building
▪ IZCM Planning Framework for Manila Bay
(see Annex 2)
▪ Enforcement of measures of MBSDMP
▪ Enforcement of existing laws and policies
related to Manila Bay and MBSDMP.
Annex 5 and 6 provides the indicative
(working) list of PAPs and the working draft of
the Level-1 PAPs profiles respectively. These
are working draft and are still being validated
and detailed during the Operational Planning
Phase. The list of PAPs are to be submitted in
the Investment Report by March 2020.
PRIORITY THEMATIC
PACKAGES
PRIORITY THEMATIC PACKAGE 1:
IMPROVE MANAGEMENT OF
PROTECTED CRITICAL HABITATS
The coastal ecosystems of Manila Bay are
important habitats for marine biodiversity.
Manila Bay has one Marine Key Biodiversity
Area (mKBA) that was identified by a group of
experts in 2007 (Ambai et al., 2012). This mKBA
remains unmanaged or unprotected by any
legal basis. The Las Pinas-Paranaque Critical
Habitat and Ecotourism Area (LPPCHEA) is a
wetland of international importance (Ramsar
91
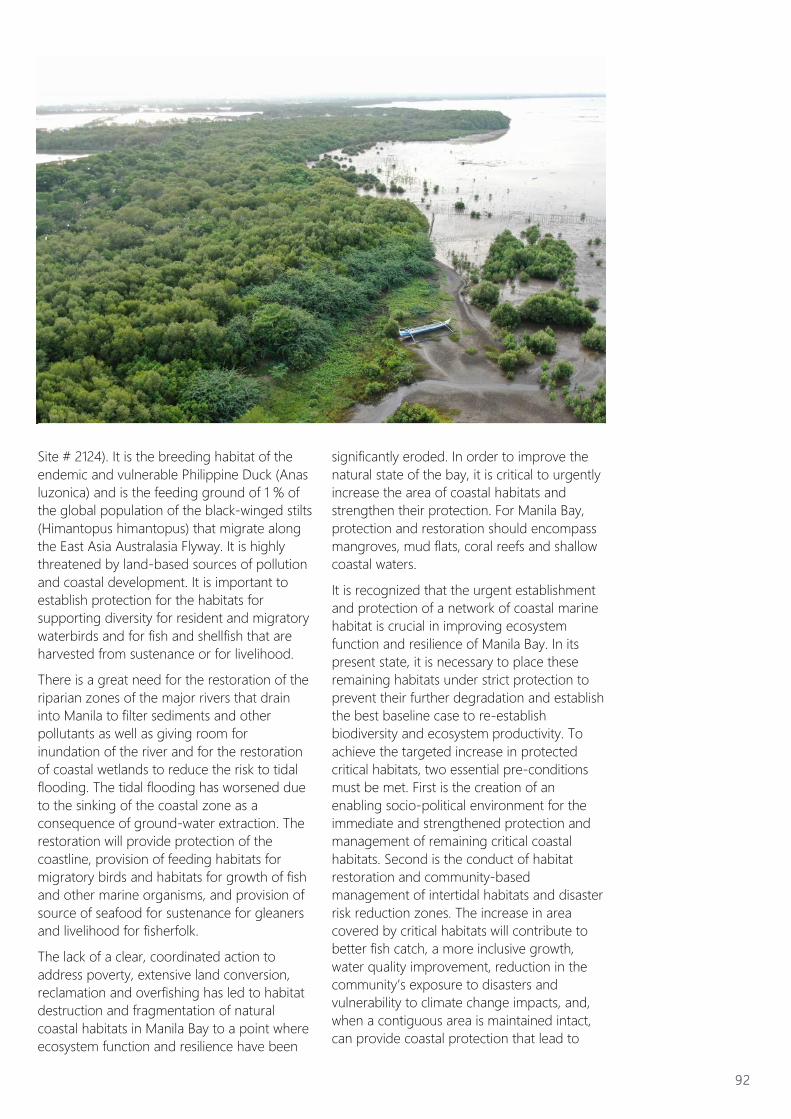
Site # 2124). It is the breeding habitat of the
endemic and vulnerable Philippine Duck (Anas
luzonica) and is the feeding ground of 1 % of
the global population of the black-winged stilts
(Himantopus himantopus) that migrate along
the East Asia Australasia Flyway. It is highly
threatened by land-based sources of pollution
and coastal development. It is important to
establish protection for the habitats for
supporting diversity for resident and migratory
waterbirds and for fish and shellfish that are
harvested from sustenance or for livelihood.
There is a great need for the restoration of the
riparian zones of the major rivers that drain
into Manila to filter sediments and other
pollutants as well as giving room for
inundation of the river and for the restoration
of coastal wetlands to reduce the risk to tidal
flooding. The tidal flooding has worsened due
to the sinking of the coastal zone as a
consequence of ground-water extraction. The
restoration will provide protection of the
coastline, provision of feeding habitats for
migratory birds and habitats for growth of fish
and other marine organisms, and provision of
source of seafood for sustenance for gleaners
and livelihood for fisherfolk.
The lack of a clear, coordinated action to
address poverty, extensive land conversion,
reclamation and overfishing has led to habitat
destruction and fragmentation of natural
coastal habitats in Manila Bay to a point where
ecosystem function and resilience have been
significantly eroded. In order to improve the
natural state of the bay, it is critical to urgently
increase the area of coastal habitats and
strengthen their protection. For Manila Bay,
protection and restoration should encompass
mangroves, mud flats, coral reefs and shallow
coastal waters.
It is recognized that the urgent establishment
and protection of a network of coastal marine
habitat is crucial in improving ecosystem
function and resilience of Manila Bay. In its
present state, it is necessary to place these
remaining habitats under strict protection to
prevent their further degradation and establish
the best baseline case to re-establish
biodiversity and ecosystem productivity. To
achieve the targeted increase in protected
critical habitats, two essential pre-conditions
must be met. First is the creation of an
enabling socio-political environment for the
immediate and strengthened protection and
management of remaining critical coastal
habitats. Second is the conduct of habitat
restoration and community-based
management of intertidal habitats and disaster
risk reduction zones. The increase in area
covered by critical habitats will contribute to
better fish catch, a more inclusive growth,
water quality improvement, reduction in the
community’s exposure to disasters and
vulnerability to climate change impacts, and,
when a contiguous area is maintained intact,
can provide coastal protection that lead to
92
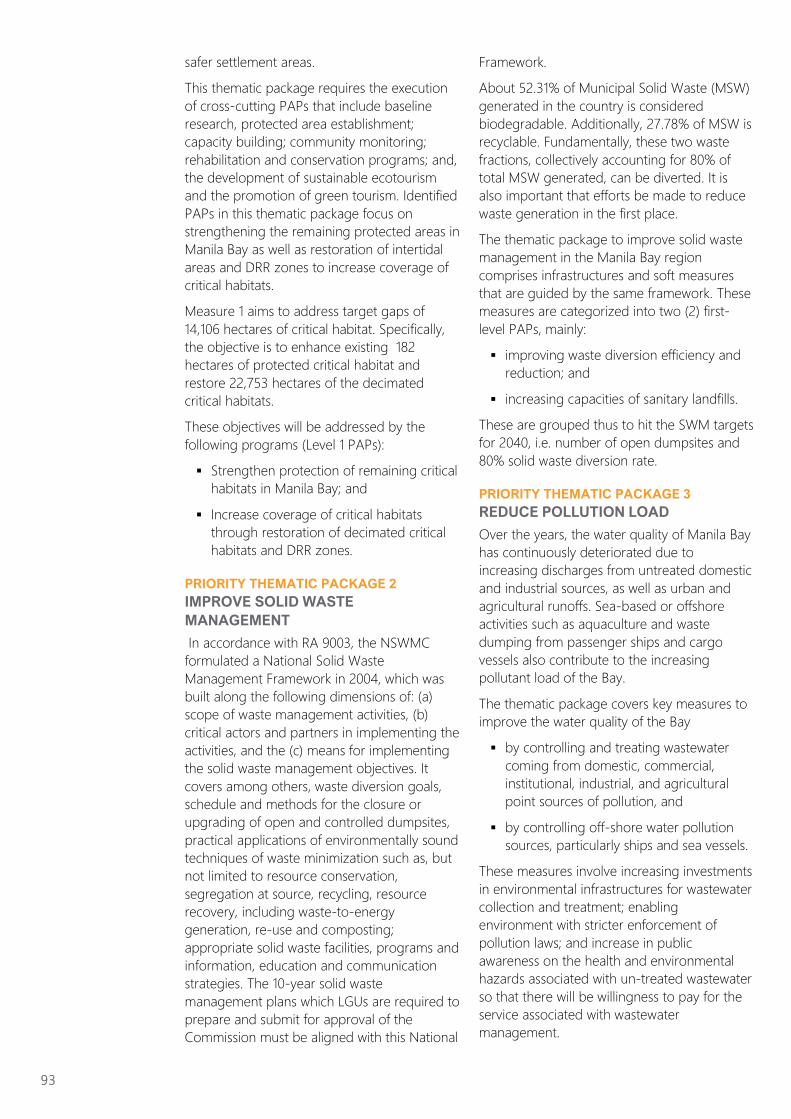
safer settlement areas.
This thematic package requires the execution
of cross-cutting PAPs that include baseline
research, protected area establishment;
capacity building; community monitoring;
rehabilitation and conservation programs; and,
the development of sustainable ecotourism
and the promotion of green tourism. Identified
PAPs in this thematic package focus on
strengthening the remaining protected areas in
Manila Bay as well as restoration of intertidal
areas and DRR zones to increase coverage of
critical habitats.
Measure 1 aims to address target gaps of
14,106 hectares of critical habitat. Specifically,
the objective is to enhance existing 182
hectares of protected critical habitat and
restore 22,753 hectares of the decimated
critical habitats.
These objectives will be addressed by the
following programs (Level 1 PAPs):
▪ Strengthen protection of remaining critical
habitats in Manila Bay; and
▪ Increase coverage of critical habitats
through restoration of decimated critical
habitats and DRR zones.
PRIORITY THEMATIC PACKAGE 2
IMPROVE SOLID WASTE
MANAGEMENT
In accordance with RA 9003, the NSWMC
formulated a National Solid Waste
Management Framework in 2004, which was
built along the following dimensions of: (a)
scope of waste management activities, (b)
critical actors and partners in implementing the
activities, and the (c) means for implementing
the solid waste management objectives. It
covers among others, waste diversion goals,
schedule and methods for the closure or
upgrading of open and controlled dumpsites,
practical applications of environmentally sound
techniques of waste minimization such as, but
not limited to resource conservation,
segregation at source, recycling, resource
recovery, including waste-to-energy
generation, re-use and composting;
appropriate solid waste facilities, programs and
information, education and communication
strategies. The 10-year solid waste
management plans which LGUs are required to
prepare and submit for approval of the
Commission must be aligned with this National
Framework.
About 52.31% of Municipal Solid Waste (MSW)
generated in the country is considered
biodegradable. Additionally, 27.78% of MSW is
recyclable. Fundamentally, these two waste
fractions, collectively accounting for 80% of
total MSW generated, can be diverted. It is
also important that efforts be made to reduce
waste generation in the first place.
The thematic package to improve solid waste
management in the Manila Bay region
comprises infrastructures and soft measures
that are guided by the same framework. These
measures are categorized into two (2) first-
level PAPs, mainly:
▪ improving waste diversion efficiency and
reduction; and
▪ increasing capacities of sanitary landfills.
These are grouped thus to hit the SWM targets
for 2040, i.e. number of open dumpsites and
80% solid waste diversion rate.
PRIORITY THEMATIC PACKAGE 3
REDUCE POLLUTION LOAD
Over the years, the water quality of Manila Bay
has continuously deteriorated due to
increasing discharges from untreated domestic
and industrial sources, as well as urban and
agricultural runoffs. Sea-based or offshore
activities such as aquaculture and waste
dumping from passenger ships and cargo
vessels also contribute to the increasing
pollutant load of the Bay.
The thematic package covers key measures to
improve the water quality of the Bay
▪ by controlling and treating wastewater
coming from domestic, commercial,
institutional, industrial, and agricultural
point sources of pollution, and
▪ by controlling off-shore water pollution
sources, particularly ships and sea vessels.
These measures involve increasing investments
in environmental infrastructures for wastewater
collection and treatment; enabling
environment with stricter enforcement of
pollution laws; and increase in public
awareness on the health and environmental
hazards associated with un-treated wastewater
so that there will be willingness to pay for the
service associated with wastewater
management.
93
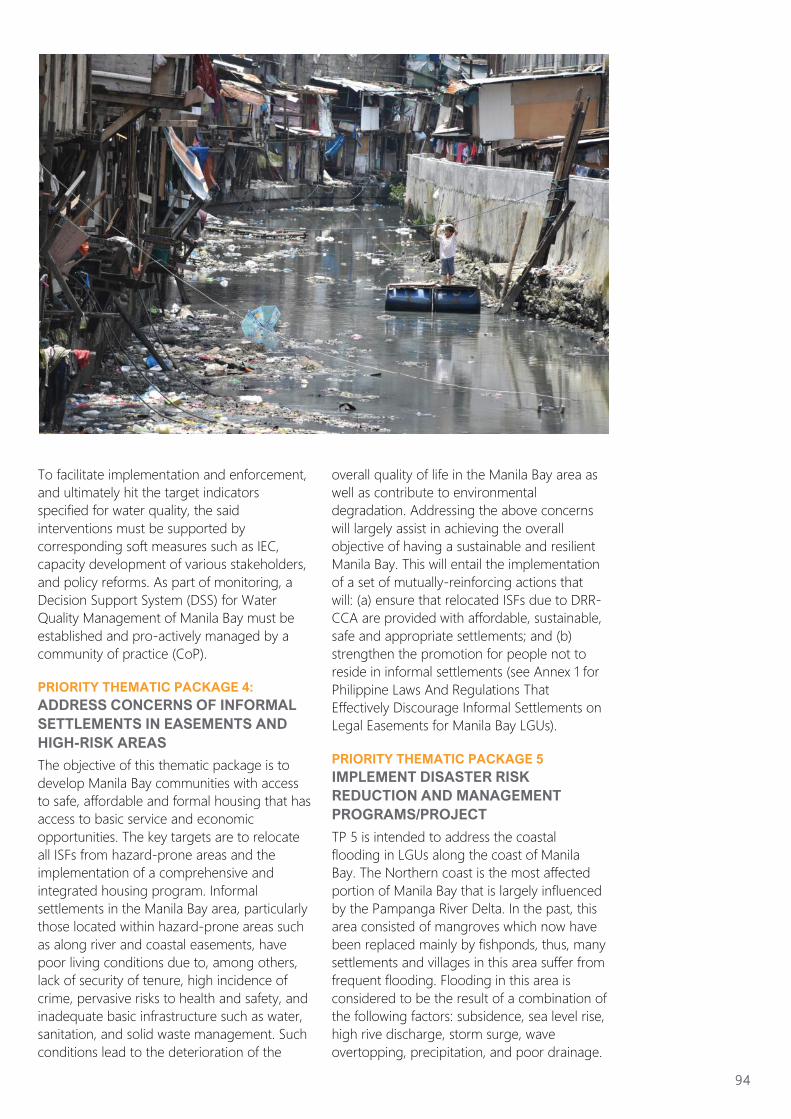
To facilitate implementation and enforcement,
and ultimately hit the target indicators
specified for water quality, the said
interventions must be supported by
corresponding soft measures such as IEC,
capacity development of various stakeholders,
and policy reforms. As part of monitoring, a
Decision Support System (DSS) for Water
Quality Management of Manila Bay must be
established and pro-actively managed by a
community of practice (CoP).
PRIORITY THEMATIC PACKAGE 4:
ADDRESS CONCERNS OF INFORMAL
SETTLEMENTS IN EASEMENTS AND
HIGH-RISK AREAS
The objective of this thematic package is to
develop Manila Bay communities with access
to safe, affordable and formal housing that has
access to basic service and economic
opportunities. The key targets are to relocate
all ISFs from hazard-prone areas and the
implementation of a comprehensive and
integrated housing program. Informal
settlements in the Manila Bay area, particularly
those located within hazard-prone areas such
as along river and coastal easements, have
poor living conditions due to, among others,
lack of security of tenure, high incidence of
crime, pervasive risks to health and safety, and
inadequate basic infrastructure such as water,
sanitation, and solid waste management. Such
conditions lead to the deterioration of the
overall quality of life in the Manila Bay area as
well as contribute to environmental
degradation. Addressing the above concerns
will largely assist in achieving the overall
objective of having a sustainable and resilient
Manila Bay. This will entail the implementation
of a set of mutually-reinforcing actions that
will: (a) ensure that relocated ISFs due to DRR-
CCA are provided with affordable, sustainable,
safe and appropriate settlements; and (b)
strengthen the promotion for people not to
reside in informal settlements (see Annex 1 for
Philippine Laws And Regulations That
Effectively Discourage Informal Settlements on
Legal Easements for Manila Bay LGUs).
PRIORITY THEMATIC PACKAGE 5
IMPLEMENT DISASTER RISK
REDUCTION AND MANAGEMENT
PROGRAMS/PROJECT
TP 5 is intended to address the coastal
flooding in LGUs along the coast of Manila
Bay. The Northern coast is the most affected
portion of Manila Bay that is largely influenced
by the Pampanga River Delta. In the past, this
area consisted of mangroves which now have
been replaced mainly by fishponds, thus, many
settlements and villages in this area suffer from
frequent flooding. Flooding in this area is
considered to be the result of a combination of
the following factors: subsidence, sea level rise,
high rive discharge, storm surge, wave
overtopping, precipitation, and poor drainage.
94
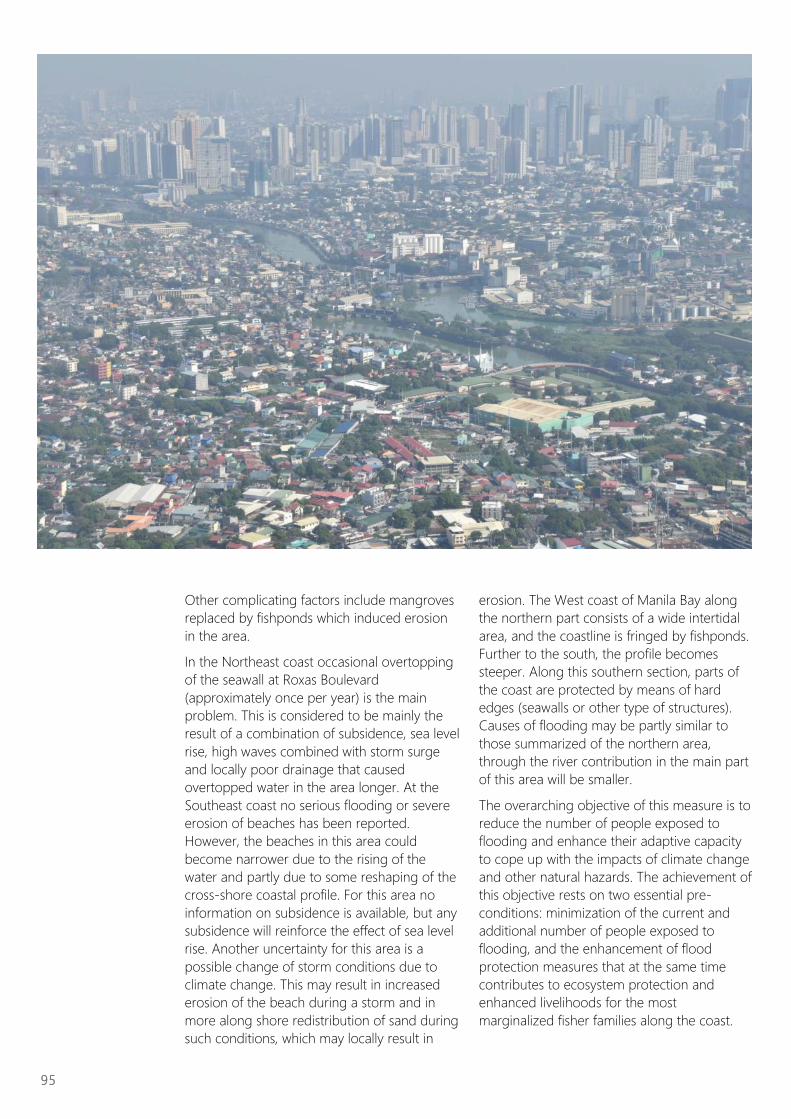
Other complicating factors include mangroves
replaced by fishponds which induced erosion
in the area.
In the Northeast coast occasional overtopping
of the seawall at Roxas Boulevard
(approximately once per year) is the main
problem. This is considered to be mainly the
result of a combination of subsidence, sea level
rise, high waves combined with storm surge
and locally poor drainage that caused
overtopped water in the area longer. At the
Southeast coast no serious flooding or severe
erosion of beaches has been reported.
However, the beaches in this area could
become narrower due to the rising of the
water and partly due to some reshaping of the
cross-shore coastal profile. For this area no
information on subsidence is available, but any
subsidence will reinforce the effect of sea level
rise. Another uncertainty for this area is a
possible change of storm conditions due to
climate change. This may result in increased
erosion of the beach during a storm and in
more along shore redistribution of sand during
such conditions, which may locally result in
erosion. The West coast of Manila Bay along
the northern part consists of a wide intertidal
area, and the coastline is fringed by fishponds.
Further to the south, the profile becomes
steeper. Along this southern section, parts of
the coast are protected by means of hard
edges (seawalls or other type of structures).
Causes of flooding may be partly similar to
those summarized of the northern area,
through the river contribution in the main part
of this area will be smaller.
The overarching objective of this measure is to
reduce the number of people exposed to
flooding and enhance their adaptive capacity
to cope up with the impacts of climate change
and other natural hazards. The achievement of
this objective rests on two essential pre-
conditions: minimization of the current and
additional number of people exposed to
flooding, and the enhancement of flood
protection measures that at the same time
contributes to ecosystem protection and
enhanced livelihoods for the most
marginalized fisher families along the coast.
95
PRIORITY THEMATIC PACKAGE 6
IMPLEMENT SUSTAINABLE FISHERIES
MANAGEMENT
About 90 % of the waters in Manila Bay are
municipal waters, which are under the
jurisdiction of the LGUs along the Bay. The
LGUs provide the permits to fish, collect fees
from fisherfolk, and manage the fisheries with
the Fisheries and Aquaculture Resources
Management Councils. The Philippine Statistics
Authority and the LGUs monitor the catches of
municipal fisherfolks. The Bureau of Fisheries
and Aquatic Resources Management provide
the technical advice required by the LGUs.
The purpose of this thematic package is to
improve the standing fish stock biomass in
Manila Bay by increasing the biomass of adult
spawning stock and the area of protected
critical fish habitats. In time, fish recruitment
will be enhanced since fecundity is dependent
on the size of the spawning adult, while the
survival of their larvae is strongly influenced by
the condition of the nursery habitat. Enhanced
recruitment, particularly that of commercially
important species, is essential to sustain the
fisheries sector in Manila Bay. In general, the
achievement rests on three essential pre-
conditions: the reduction of fishing pressure by
arresting illegal and unsustainable fishing
activities; the implementation of fish stock
enhancement programs; and the
strengthening of community development
programs. A sustained and improved standing
stock biomass of commercially important fish
species will benefit the marginalized municipal
fishermen and improve the overall social
inclusiveness at least within the designated
plan area.
SUPPLEMENTARY
THEMATIC PACKAGES
SUPPLEMENTARY
THEMATIC PACKAGES 7
PROMOTING ENVIRONMENTALLY
FRIENDLY DEVELOPMENT
Section 16 of the 1987 Philippine Constitution
declares that “The State shall protect and
advance the right of the people to a balanced
and healthful ecology in accord with the
rhythm and harmony of nature.” This is evident
with the comprehensive set of environmental
laws that the country has, yet there are still
missing government policies and standards to
safeguard the Philippine natural environment.
The PAPs under Promoting Environmental
Sound development safeguard the
unnecessary conversion of the land,
formulation of a Stream of Regulations (SoRs)
which would provide for clearer, more
comprehensive guidelines, and incentivizing
actions that promote the welfare of the
environment.
SUPPLEMENTARY
THEMATIC PACKAGES 8
DECONGESTING METRO MANILA
Manila bay region are amongst the most
crowded places in the world; Increasing
population without adequate infrastructure
support add pressures to the degradation of
Manila Bay Ecosystem. Urban population
growth is the primary driving force in the
continuously increasing waste load to Manila
Bay; an increasing population and urban area
also lead to higher exposure to natural
disasters in terms of people and urban area at
risk. The increasing population in Manila Bay
area suggests that policies that incentivize
movement outwards NCR must be carefully
explored to effectively decongest the region
and distribute development elsewhere.
ENABLING ENVIRONMENT
MEASURES
ENABLING ENVIRONMENT MEASURES
CREATING THE
ENABLING CONDITIONS
The Philippines has one of the most
comprehensive set of environmental laws in
the world. It is often said that the challenge lies
in the implementation. For Manila Bay, the
challenge of implementation lies in matching
the scale of decision-making to the ecological
scale of the Bay. Current laws and institutional
arrangements are anchored on the local
government unit as decision-maker or
implementer, such as solid waste management
and coastal habitat management. Laws on
pollution control target point sources.
Environmental impact assessment regulations
are focused on individual projects or activities.
In implementing the identified thematic
packages, policies and regulations have to be
modified to match the ecological scale of the
Bay:
For improving the management of marine
96
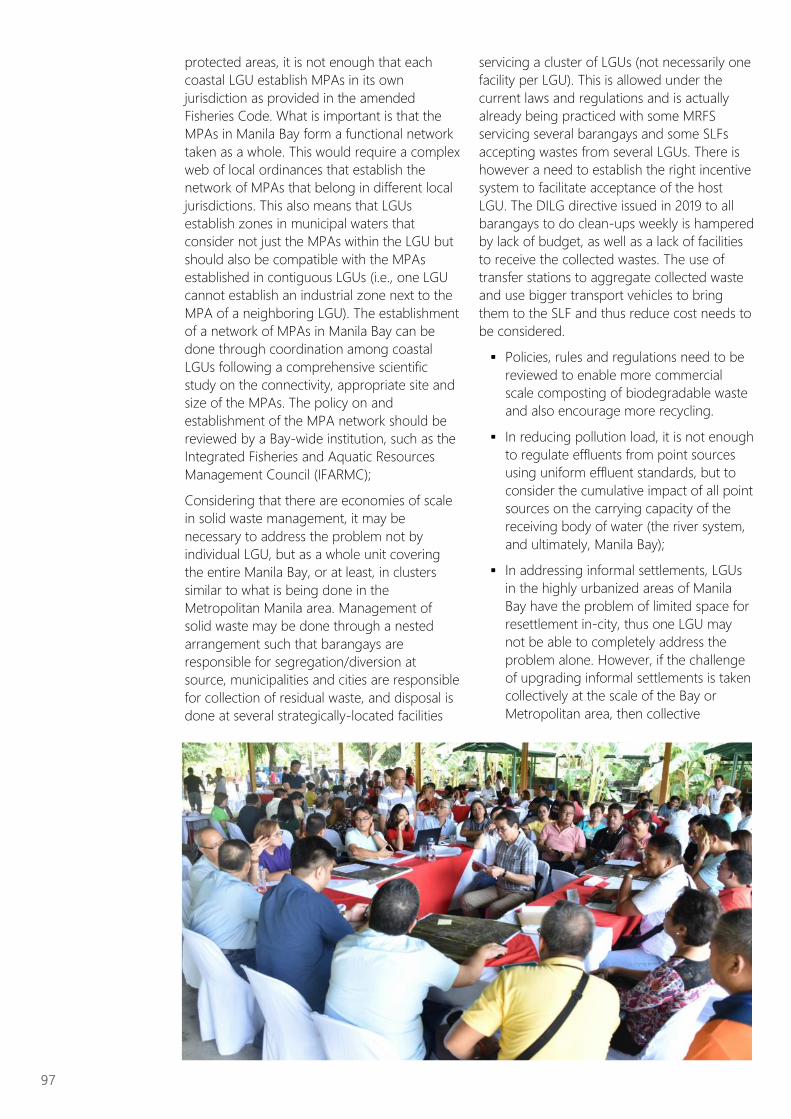
protected areas, it is not enough that each
coastal LGU establish MPAs in its own
jurisdiction as provided in the amended
Fisheries Code. What is important is that the
MPAs in Manila Bay form a functional network
taken as a whole. This would require a complex
web of local ordinances that establish the
network of MPAs that belong in different local
jurisdictions. This also means that LGUs
establish zones in municipal waters that
consider not just the MPAs within the LGU but
should also be compatible with the MPAs
established in contiguous LGUs (i.e., one LGU
cannot establish an industrial zone next to the
MPA of a neighboring LGU). The establishment
of a network of MPAs in Manila Bay can be
done through coordination among coastal
LGUs following a comprehensive scientific
study on the connectivity, appropriate site and
size of the MPAs. The policy on and
establishment of the MPA network should be
reviewed by a Bay-wide institution, such as the
Integrated Fisheries and Aquatic Resources
Management Council (IFARMC);
Considering that there are economies of scale
in solid waste management, it may be
necessary to address the problem not by
individual LGU, but as a whole unit covering
the entire Manila Bay, or at least, in clusters
similar to what is being done in the
Metropolitan Manila area. Management of
solid waste may be done through a nested
arrangement such that barangays are
responsible for segregation/diversion at
source, municipalities and cities are responsible
for collection of residual waste, and disposal is
done at several strategically-located facilities
servicing a cluster of LGUs (not necessarily one
facility per LGU). This is allowed under the
current laws and regulations and is actually
already being practiced with some MRFS
servicing several barangays and some SLFs
accepting wastes from several LGUs. There is
however a need to establish the right incentive
system to facilitate acceptance of the host
LGU. The DILG directive issued in 2019 to all
barangays to do clean-ups weekly is hampered
by lack of budget, as well as a lack of facilities
to receive the collected wastes. The use of
transfer stations to aggregate collected waste
and use bigger transport vehicles to bring
them to the SLF and thus reduce cost needs to
be considered.
▪ Policies, rules and regulations need to be
reviewed to enable more commercial
scale composting of biodegradable waste
and also encourage more recycling.
▪ In reducing pollution load, it is not enough
to regulate effluents from point sources
using uniform effluent standards, but to
consider the cumulative impact of all point
sources on the carrying capacity of the
receiving body of water (the river system,
and ultimately, Manila Bay);
▪ In addressing informal settlements, LGUs
in the highly urbanized areas of Manila
Bay have the problem of limited space for
resettlement in-city, thus one LGU may
not be able to completely address the
problem alone. However, if the challenge
of upgrading informal settlements is taken
collectively at the scale of the Bay or
Metropolitan area, then collective
97
solutions may be achieved by pooling
LGU resources for common relocation
sites in less congested areas provided with
better basic services and transportation
options to commute to work. Assistance/
incentives must be provided to the host
LGU which will shoulder the burden of
providing additional services to their
“newly acquired constituents” and formal
agreements to effect this between or
among the host LGU and the originating
LGUs must be forged;
▪ In implementing DRRM programs,
adaptation and mitigation measures (such
as flood control, GHG emission reduction)
should also be at the scale of the Bay, or
at least the Metropolitan Manila area, to
match the scale of risks to disasters and
climate change;
▪ For sustainable fisheries, Manila Bay
should be treated as one ecosystem with
shared fisheries stocks. The setting of
reference points and harvest control rules
should cover the entire Manila Bay. LGUs
should then set their licensing limits so as
not to exceed the limits for the Bay. As
with establishment of the MPA network,
the policy on sustainable fisheries should
also be reviewed by a Bay-wide institution,
such as the Integrated Fisheries and
Aquatic Resources Management Council
(IFARMC) because managing the fish
stocks in the Bay is beyond the control of
a single LGU; Enforcement of existing laws
and regulations and Continuing Effective
Government Initiatives
ENABLING ENVIRONMENT MEASURES
INSTITUTIONAL SET-UP AND
CAPACITY BUILDING
The institutional arrangements for Manila Bay
have to consider that management decisions
have to match the ecological scale of the Bay.
Coordination of LGU and NGA plans and
programs have to be mandatory, following the
guiding principles and strategies under the
Master Plan. To ensure adherence to these
guiding principles and strategies, the institution
that will oversee the implementation of the
Master Plan needs to have the powers to
regulate and enforce compliance. Additionally,
an umbrella institution may be considered to
oversee the inter-LGU, inter-agency
coordination, as well as monitor and evaluate
the implementation of the Master Plan. The
recommended institutional development and
capacity building for this will be described in
Chapter 6 as part of the Master Plan strategy.
A specific kind of external condition for Manila
Bay is how the land area that drains into
Manila Bay will develop. This is already partly
taken into account in the scenario
development but addressing the population,
economic activities and traffic issues in this
area will directly benefit Manila Bay.
Decongesting Metro Manila, moving
governmental offices out of Metro Manila,
reverse migration and even family planning
could be considered as measures to be taken
to improve the conditions for Manila Bay. To
keep MBSDMP focused it was decided not to
include these measures in our strategy but
developments in these fields should be kept in
mind when considering the overall problems of
the area.
Annex 3 and 4 are the MBSDMP Institutional
Set-Up Report and Capacity Building Report.
ENABLING ENVIRONMENT MEASURES
INTEGRATED COASTAL ZONE
MANAGEMENT (ICZM) PLANNING
FRAMEWORK PLANNING FRAMEWORK
The Integrated Coastal Zone Management
(ICZM) Planning Framework for Manila Bay is
the Overall Guiding Framework of the
MBSDMP. It adopts a holistic and integrative
approach in addressing the complex social and
ecological issues in the Manila Bay Coastal
Area. Further it seeks to engage the
participation and cooperation of all
stakeholders to realize the overall goal of
having a “Sustainable and Resilient Manila Bay”
by balancing and harmonizing the sectoral
objectives (environment, economic, social,
cultural and recreational). The Planning
Framework will be one of the key bases of
implementing both priority and supplementary
measures under MBSDMP.
In support to the Ambisyon Natin 2040:
Matatag, Maginhawa, at Panatag na Buhay,
the MBSDMP IZCM Planning Framework can
be used as follows:
▪ Basis for updating of CLUPs/Zoning
ordinances of coastal LGUs in a manner
that will harmonize the socioeconomic
development goals of the LGUs and
Manila Bay;
▪ Basis for LGUs in determining the best/
98
suitable uses of municipal waters within its
jurisdiction;
▪ Framework to guide in resolving use of
areas commonly claimed by two or more
LGUs;
▪ Framework for resolving conflicting uses
of Manila Bay;
▪ Framework for the evaluation of
unsolicited land reclamation proposals;
▪ Framework for identification of areas
where building activities may or may not
be allowed;
▪ Basis for implementing measures to
mitigate adverse impacts of existing and
prospective uses of, and practices/
activities in Manila Bay and coastal areas;
and
▪ Guide for the private sector in identifying
and developing potential projects.
KEY PRINCIPLES. The key principles governing
the ICZM Planning Framework are as follows:
▪ Sustainability – The ICZM Planning
Framework is to ensure uninterrupted
delivery of Manila Bay ecosystem services.
▪ Precautionary – The ICZM Planning
Framework is to adopt measures or
decisions to guard against uncertain
hazards to the Manila Bay ecosystems and
its communities.
▪ Optimization of multiple uses – The ICZM
Planning Framework is to ensure optimum
balance of ecological and socio-economic
goals in the management and
development of Manila Bay and ideally of
Manila Bay Region.
▪ Participatory – The ICZM Planning
Framework is developed through
engagement of concerned LGUs, NGAs,
private sector, and other key stakeholders
in making decisions on the use of Manila
Bay
▪ Multi-disciplinary – The ICZM Planning
Framework is developed through
engagement of experts from various
disciplines related to the management and
development of Manila Bay.
MANAGEMENT ZONES WITHIN PROTECTED
AREAS. The DENR Administrative Order No.
2008-17 (Annex C) amended Section of the
DAO No. 25 Series of 1992 and provided
criteria in the identification and procedures in
the delineation and/or demarcation of
management zones within protected areas.
The coverage of the administrative order is on
all protected areas under the National
Integrated Protected Areas System (NIPAS)
except for those protected areas which have
already been covered by specific enabling
laws. For Manila Bay, the nine (9) categories of
management zones in the DAO 25, S. of 1992
were reduced into two (2) classifications,
namely: Multiple Use Zones (MUZ) and Strict
Protection Zones (SPZ).
▪ Multiple Use Zones (MUZ) are areas where
settlement, traditional and/or sustainable
land-uses, including agriculture,
agroforestry, and other income-
generating or livelihood activities may be
allowed consistent with the Protected Area
Management Plan of the protected area.
The zone includes, among others, areas of
high recreational tourism, educational, or
environmental awareness values, and
areas consisting of installation allowed
under existing guidelines and of national
significance/interest such as facilities/
structures for renewable energy,
telecommunications, and electric power
generation.
▪ Strict Protection Zones (SPZ) are areas
consisting of natural areas with high
biodiversity value, closed to all human
activities except for scientific studies and/
or ceremonial or non-extractive uses by
the indigenous peoples. It may also
include habitats of threatened species, or
degraded areas that have been
designated for restoration and subsequent
protection.
Section 8 of the NIPAS Act stipulates a Buffer
Zone that states “for each protected area,
there shall be established peripheral buffer
zones when necessary, in the same manner as
Congress establishes the protected area, to
protect the same from activities that will
directly and indirectly harm it. Such buffer
zones shall be included in the individual
protected area management plan that shall be
prepared for each protected area. The DENR
shall exercise its authority over protected areas
as provided in this Act on such area and
designated as buffer zones.”
In the paper of Shanks et al. (2003), “Propagule
Dispersal Distance and the Size and Spacing of
99
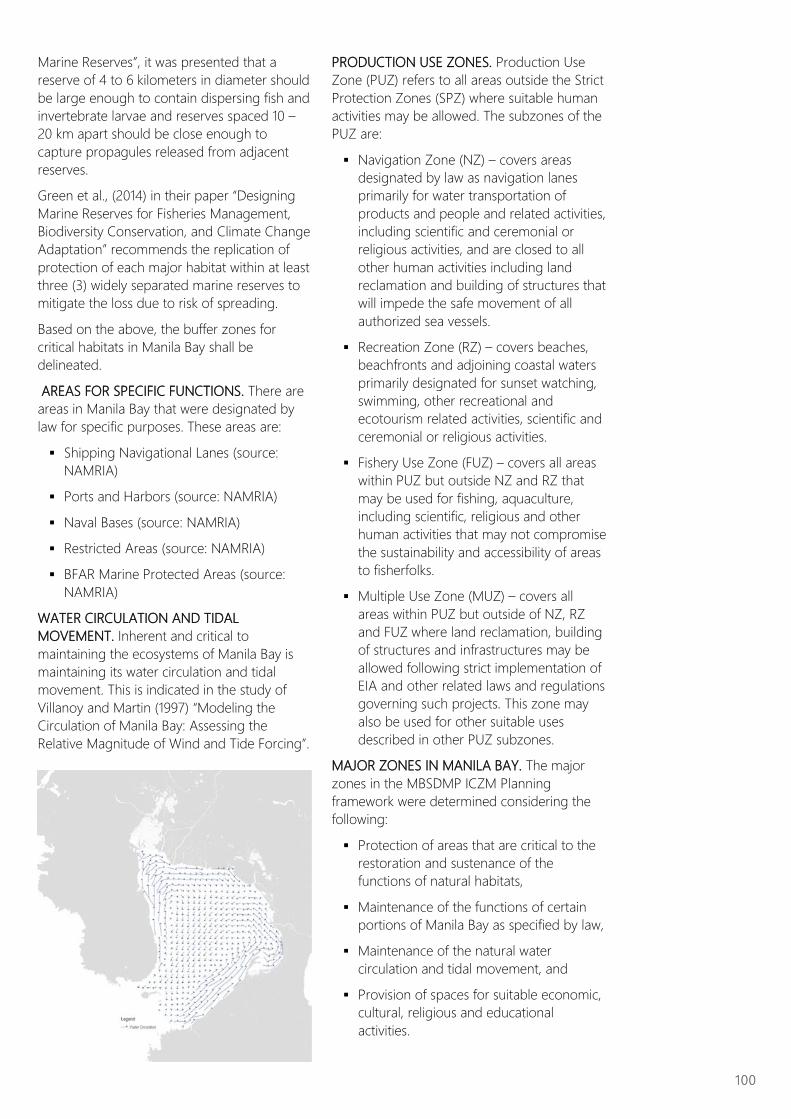
Marine Reserves”, it was presented that a
reserve of 4 to 6 kilometers in diameter should
be large enough to contain dispersing fish and
invertebrate larvae and reserves spaced 10 –
20 km apart should be close enough to
capture propagules released from adjacent
reserves.
Green et al., (2014) in their paper “Designing
Marine Reserves for Fisheries Management,
Biodiversity Conservation, and Climate Change
Adaptation” recommends the replication of
protection of each major habitat within at least
three (3) widely separated marine reserves to
mitigate the loss due to risk of spreading.
Based on the above, the buffer zones for
critical habitats in Manila Bay shall be
delineated.
AREAS FOR SPECIFIC FUNCTIONS. There are
areas in Manila Bay that were designated by
law for specific purposes. These areas are:
▪ Shipping Navigational Lanes (source:
NAMRIA)
▪ Ports and Harbors (source: NAMRIA)
▪ Naval Bases (source: NAMRIA)
▪ Restricted Areas (source: NAMRIA)
▪ BFAR Marine Protected Areas (source:
NAMRIA)
WATER CIRCULATION AND TIDAL
MOVEMENT. Inherent and critical to
maintaining the ecosystems of Manila Bay is
maintaining its water circulation and tidal
movement. This is indicated in the study of
Villanoy and Martin (1997) “Modeling the
Circulation of Manila Bay: Assessing the
Relative Magnitude of Wind and Tide Forcing”.
PRODUCTION USE ZONES. Production Use
Zone (PUZ) refers to all areas outside the Strict
Protection Zones (SPZ) where suitable human
activities may be allowed. The subzones of the
PUZ are:
▪ Navigation Zone (NZ) – covers areas
designated by law as navigation lanes
primarily for water transportation of
products and people and related activities,
including scientific and ceremonial or
religious activities, and are closed to all
other human activities including land
reclamation and building of structures that
will impede the safe movement of all
authorized sea vessels.
▪ Recreation Zone (RZ) – covers beaches,
beachfronts and adjoining coastal waters
primarily designated for sunset watching,
swimming, other recreational and
ecotourism related activities, scientific and
ceremonial or religious activities.
▪ Fishery Use Zone (FUZ) – covers all areas
within PUZ but outside NZ and RZ that
may be used for fishing, aquaculture,
including scientific, religious and other
human activities that may not compromise
the sustainability and accessibility of areas
to fisherfolks.
▪ Multiple Use Zone (MUZ) – covers all
areas within PUZ but outside of NZ, RZ
and FUZ where land reclamation, building
of structures and infrastructures may be
allowed following strict implementation of
EIA and other related laws and regulations
governing such projects. This zone may
also be used for other suitable uses
described in other PUZ subzones.
MAJOR ZONES IN MANILA BAY. The major
zones in the MBSDMP ICZM Planning
framework were determined considering the
following:
▪ Protection of areas that are critical to the
restoration and sustenance of the
functions of natural habitats,
▪ Maintenance of the functions of certain
portions of Manila Bay as specified by law,
▪ Maintenance of the natural water
circulation and tidal movement, and
▪ Provision of spaces for suitable economic,
cultural, religious and educational
activities.
100
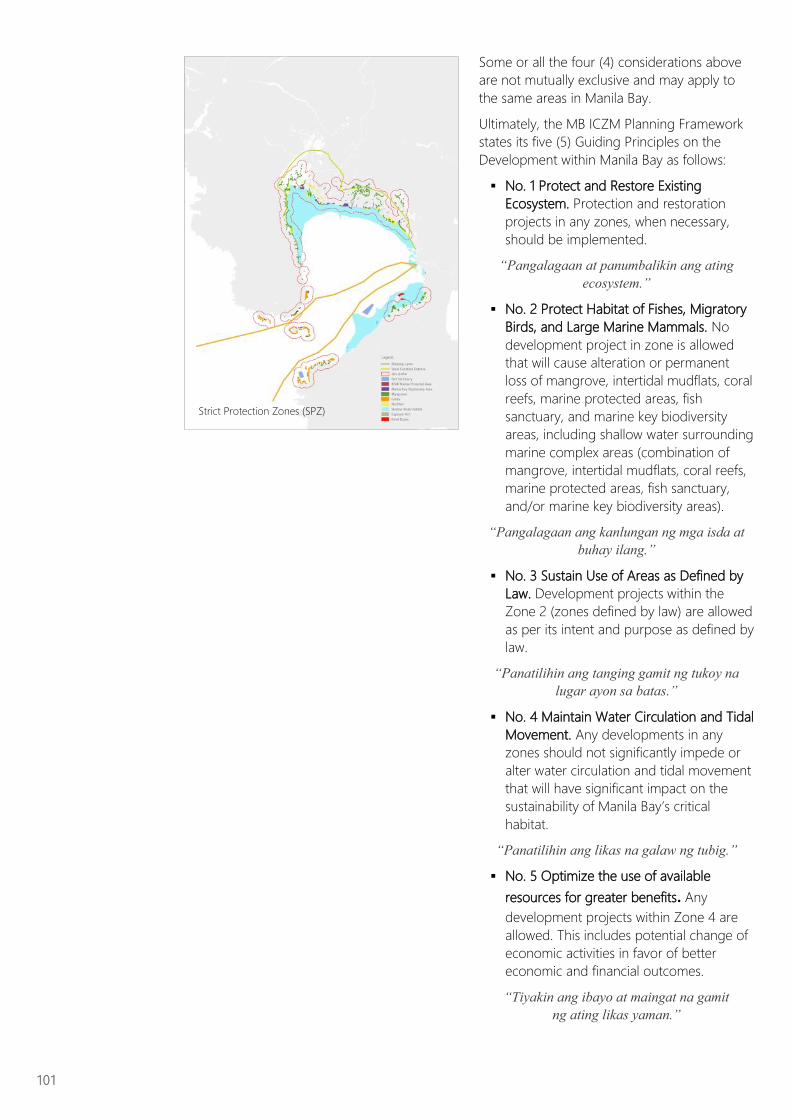
Some or all the four (4) considerations above
are not mutually exclusive and may apply to
the same areas in Manila Bay.
Ultimately, the MB ICZM Planning Framework
states its five (5) Guiding Principles on the
Development within Manila Bay as follows:
▪ No. 1 Protect and Restore Existing
Ecosystem. Protection and restoration
projects in any zones, when necessary,
should be implemented.
“Pangalagaan at panumbalikin ang ating
ecosystem.”
▪ No. 2 Protect Habitat of Fishes, Migratory
Birds, and Large Marine Mammals. No
development project in zone is allowed
that will cause alteration or permanent
loss of mangrove, intertidal mudflats, coral
reefs, marine protected areas, fish
sanctuary, and marine key biodiversity
areas, including shallow water surrounding
marine complex areas (combination of
mangrove, intertidal mudflats, coral reefs,
marine protected areas, fish sanctuary,
and/or marine key biodiversity areas).
“Pangalagaan ang kanlungan ng mga isda at
buhay ilang.”
▪ No. 3 Sustain Use of Areas as Defined by
Law. Development projects within the
Zone 2 (zones defined by law) are allowed
as per its intent and purpose as defined by
law.
“Panatilihin ang tanging gamit ng tukoy na
lugar ayon sa batas.”
▪ No. 4 Maintain Water Circulation and Tidal
Movement. Any developments in any
zones should not significantly impede or
alter water circulation and tidal movement
that will have significant impact on the
sustainability of Manila Bay’s critical
habitat.
“Panatilihin ang likas na galaw ng tubig.”
▪ No. 5 Optimize the use of available
resources for greater benefits. Any
development projects within Zone 4 are
allowed. This includes potential change of
economic activities in favor of better
economic and financial outcomes.
“Tiyakin ang ibayo at maingat na gamit
ng ating likas yaman.”
101
Strict Protection Zones (SPZ)
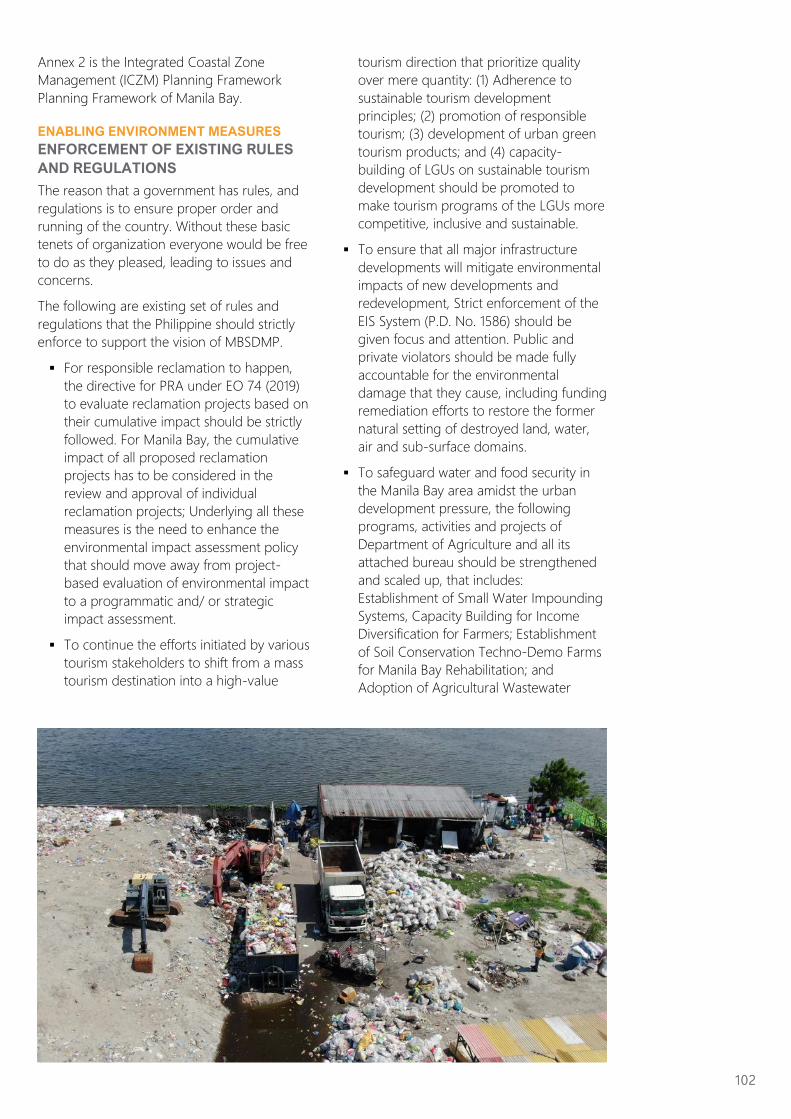
Annex 2 is the Integrated Coastal Zone
Management (ICZM) Planning Framework
Planning Framework of Manila Bay.
ENABLING ENVIRONMENT MEASURES
ENFORCEMENT OF EXISTING RULES
AND REGULATIONS
The reason that a government has rules, and
regulations is to ensure proper order and
running of the country. Without these basic
tenets of organization everyone would be free
to do as they pleased, leading to issues and
concerns.
The following are existing set of rules and
regulations that the Philippine should strictly
enforce to support the vision of MBSDMP.
▪ For responsible reclamation to happen,
the directive for PRA under EO 74 (2019)
to evaluate reclamation projects based on
their cumulative impact should be strictly
followed. For Manila Bay, the cumulative
impact of all proposed reclamation
projects has to be considered in the
review and approval of individual
reclamation projects; Underlying all these
measures is the need to enhance the
environmental impact assessment policy
that should move away from project-
based evaluation of environmental impact
to a programmatic and/ or strategic
impact assessment.
▪ To continue the efforts initiated by various
tourism stakeholders to shift from a mass
tourism destination into a high-value
tourism direction that prioritize quality
over mere quantity: (1) Adherence to
sustainable tourism development
principles; (2) promotion of responsible
tourism; (3) development of urban green
tourism products; and (4) capacity-
building of LGUs on sustainable tourism
development should be promoted to
make tourism programs of the LGUs more
competitive, inclusive and sustainable.
▪ To ensure that all major infrastructure
developments will mitigate environmental
impacts of new developments and
redevelopment, Strict enforcement of the
EIS System (P.D. No. 1586) should be
given focus and attention. Public and
private violators should be made fully
accountable for the environmental
damage that they cause, including funding
remediation efforts to restore the former
natural setting of destroyed land, water,
air and sub-surface domains.
▪ To safeguard water and food security in
the Manila Bay area amidst the urban
development pressure, the following
programs, activities and projects of
Department of Agriculture and all its
attached bureau should be strengthened
and scaled up, that includes:
Establishment of Small Water Impounding
Systems, Capacity Building for Income
Diversification for Farmers; Establishment
of Soil Conservation Techno-Demo Farms
for Manila Bay Rehabilitation; and
Adoption of Agricultural Wastewater
102
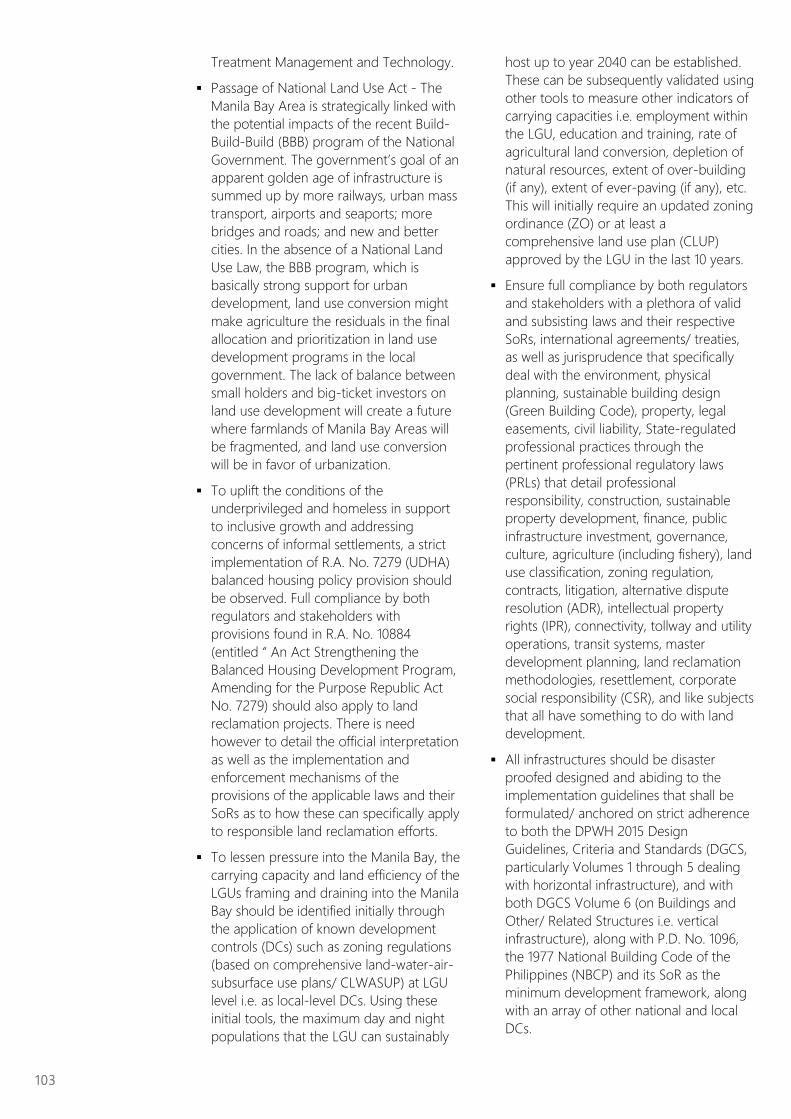
Treatment Management and Technology.
▪ Passage of National Land Use Act - The
Manila Bay Area is strategically linked with
the potential impacts of the recent Build-
Build-Build (BBB) program of the National
Government. The government’s goal of an
apparent golden age of infrastructure is
summed up by more railways, urban mass
transport, airports and seaports; more
bridges and roads; and new and better
cities. In the absence of a National Land
Use Law, the BBB program, which is
basically strong support for urban
development, land use conversion might
make agriculture the residuals in the final
allocation and prioritization in land use
development programs in the local
government. The lack of balance between
small holders and big-ticket investors on
land use development will create a future
where farmlands of Manila Bay Areas will
be fragmented, and land use conversion
will be in favor of urbanization.
▪ To uplift the conditions of the
underprivileged and homeless in support
to inclusive growth and addressing
concerns of informal settlements, a strict
implementation of R.A. No. 7279 (UDHA)
balanced housing policy provision should
be observed. Full compliance by both
regulators and stakeholders with
provisions found in R.A. No. 10884
(entitled “ An Act Strengthening the
Balanced Housing Development Program,
Amending for the Purpose Republic Act
No. 7279) should also apply to land
reclamation projects. There is need
however to detail the official interpretation
as well as the implementation and
enforcement mechanisms of the
provisions of the applicable laws and their
SoRs as to how these can specifically apply
to responsible land reclamation efforts.
▪ To lessen pressure into the Manila Bay, the
carrying capacity and land efficiency of the
LGUs framing and draining into the Manila
Bay should be identified initially through
the application of known development
controls (DCs) such as zoning regulations
(based on comprehensive land-water-air-
subsurface use plans/ CLWASUP) at LGU
level i.e. as local-level DCs. Using these
initial tools, the maximum day and night
populations that the LGU can sustainably
host up to year 2040 can be established.
These can be subsequently validated using
other tools to measure other indicators of
carrying capacities i.e. employment within
the LGU, education and training, rate of
agricultural land conversion, depletion of
natural resources, extent of over-building
(if any), extent of ever-paving (if any), etc.
This will initially require an updated zoning
ordinance (ZO) or at least a
comprehensive land use plan (CLUP)
approved by the LGU in the last 10 years.
▪ Ensure full compliance by both regulators
and stakeholders with a plethora of valid
and subsisting laws and their respective
SoRs, international agreements/ treaties,
as well as jurisprudence that specifically
deal with the environment, physical
planning, sustainable building design
(Green Building Code), property, legal
easements, civil liability, State-regulated
professional practices through the
pertinent professional regulatory laws
(PRLs) that detail professional
responsibility, construction, sustainable
property development, finance, public
infrastructure investment, governance,
culture, agriculture (including fishery), land
use classification, zoning regulation,
contracts, litigation, alternative dispute
resolution (ADR), intellectual property
rights (IPR), connectivity, tollway and utility
operations, transit systems, master
development planning, land reclamation
methodologies, resettlement, corporate
social responsibility (CSR), and like subjects
that all have something to do with land
development.
▪ All infrastructures should be disaster
proofed designed and abiding to the
implementation guidelines that shall be
formulated/ anchored on strict adherence
to both the DPWH 2015 Design
Guidelines, Criteria and Standards (DGCS,
particularly Volumes 1 through 5 dealing
with horizontal infrastructure), and with
both DGCS Volume 6 (on Buildings and
Other/ Related Structures i.e. vertical
infrastructure), along with P.D. No. 1096,
the 1977 National Building Code of the
Philippines (NBCP) and its SoR as the
minimum development framework, along
with an array of other national and local
DCs.
103
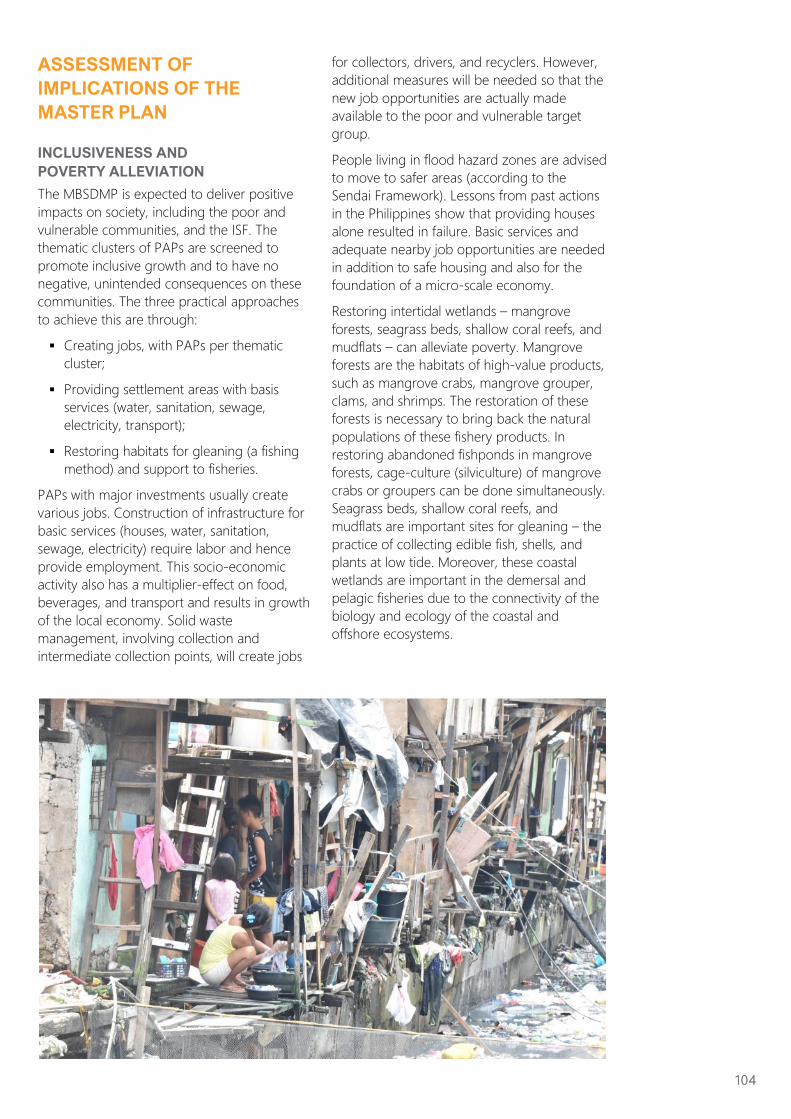
ASSESSMENT OF
IMPLICATIONS OF THE
MASTER PLAN
INCLUSIVENESS AND
POVERTY ALLEVIATION
The MBSDMP is expected to deliver positive
impacts on society, including the poor and
vulnerable communities, and the ISF. The
thematic clusters of PAPs are screened to
promote inclusive growth and to have no
negative, unintended consequences on these
communities. The three practical approaches
to achieve this are through:
▪ Creating jobs, with PAPs per thematic
cluster;
▪ Providing settlement areas with basis
services (water, sanitation, sewage,
electricity, transport);
▪ Restoring habitats for gleaning (a fishing
method) and support to fisheries.
PAPs with major investments usually create
various jobs. Construction of infrastructure for
basic services (houses, water, sanitation,
sewage, electricity) require labor and hence
provide employment. This socio-economic
activity also has a multiplier-effect on food,
beverages, and transport and results in growth
of the local economy. Solid waste
management, involving collection and
intermediate collection points, will create jobs
for collectors, drivers, and recyclers. However,
additional measures will be needed so that the
new job opportunities are actually made
available to the poor and vulnerable target
group.
People living in flood hazard zones are advised
to move to safer areas (according to the
Sendai Framework). Lessons from past actions
in the Philippines show that providing houses
alone resulted in failure. Basic services and
adequate nearby job opportunities are needed
in addition to safe housing and also for the
foundation of a micro-scale economy.
Restoring intertidal wetlands – mangrove
forests, seagrass beds, shallow coral reefs, and
mudflats – can alleviate poverty. Mangrove
forests are the habitats of high-value products,
such as mangrove crabs, mangrove grouper,
clams, and shrimps. The restoration of these
forests is necessary to bring back the natural
populations of these fishery products. In
restoring abandoned fishponds in mangrove
forests, cage-culture (silviculture) of mangrove
crabs or groupers can be done simultaneously.
Seagrass beds, shallow coral reefs, and
mudflats are important sites for gleaning – the
practice of collecting edible fish, shells, and
plants at low tide. Moreover, these coastal
wetlands are important in the demersal and
pelagic fisheries due to the connectivity of the
biology and ecology of the coastal and
offshore ecosystems.
104
INFORMAL SETTLEMENTS
Reduction of the number of informal settler
families (ISF) that live within legal easements
has been identified as an indicator for the
MBSDMP, even though it not known how
many there are and where they live. The
rationale for this is that these ISF are in a high-
risk zone for flooding and that it would be
advisable to reduce their disaster risks
exposure by relocation. The “Battle for Manila
Bay” has earmarked a major part of the budget
to relocate 300.000 ISF. Relocation of ISF in
legal easements is legally allowed through
amongst other laws the Mandamus and the
Water code and since the ISF usually have no
right to live where they do, they have limited
options to prevent relocation.
From the point of view of the ISF relocation is
their greatest concern (MBSDMP Focal Theme
Report: Upgrading Informal Settlements, 2018).
A main reason for their concern is that due to
relocation they will lose their livelihood as the
new location will be too far from their
workplace. In addition to the threat of eviction,
ISFs are most concerned about crime and
access to medical and other basic services.
When faced with natural calamities, such as
floods, ISFs are most concerned about being
unable to go to work, and for their children to
miss school. Not all informal settlers are
income poor - even those who earn relatively
high income could end up in informal
settlements for lack of affordable housing
opportunities close to their work. They would
rather suffer the inconveniences and dangers
of poor living conditions than to live far away
from, or risk losing their source of income.
The focus on ISF relocation provides a partial
solution only, as from the point of view of the
MBSDMP their contribution to the waste loads
is small (Kalikasan, 2019) and as can be seen
from the coastal flooding exposure analysis not
only the ISF in legal easements are at risk of
flooding since already in 2015 about five
million people are at risk of flooding in the
case of an 1:100 year flood event. It is therefore
clear that when relocating all ISF in legal
easements there will only be limited
improvements on the remaining indicators of
MBSDMP.
Reducing (solid) waste discharges in the water
system by providing ISF with basic services and
in particular by providing solid waste collection
and through increased community awareness
could be considered as an alternative
approach. Should relocation be necessary, it is
clear that in addition to providing affordable
housing, access to basic services and adequate
nearby job opportunities are needed to
achieve a sustainable solution for the
concerned ISF. Particular care is needed to
avoid human rights violations (Kalikasan and
Both Ends, 2019). It is recommended that due
attention is given to protect the human rights
as required in the constitution, national laws
and international treaties with regards to life,
livelihood, jobs, housing, property, and a
balanced and healthful ecology. In particular
additional measures are needed to reduce the
inequity of women vis a vis their exposure to
disasters, increased poverty and increased non
-inclusivity.
LAND RECLAMATION – FROM A
THREAT TO MANILA BAY TO
AN OPPORTUNITY
Land reclamations aim at increasing the
available land for development in the vicinity
of existing built-up area. Especially land
reclamations that are close to Metro Manila will
be very attractive for development and can
deliver considerable benefits for the
developers.
With Executive order 74 (2019) the power for
approval of reclamation projects is delegated
to the Philippine Reclamation Authority (PRA)
and at the same time transferring the PRA to
the president’s office. Important aspects of the
required evaluation/advice of land
reclamations in EO 74 are that environmental
sustainability and compliance with
environmental laws shall be evaluated by
DENR, while NEDA shall evaluate the fit with
national and regional development plans and
the Department of Finance shall evaluate the
economic and fiscal feasibility.
Environmental Compliance Certificates and
Area Clearances are existing requirements
under the Environmental Impact Statement
(EIS) Law and its implementing administrative
orders of the Department of Environment and
natural Resources such as DENR Administrative
Order 2018-14. The ‘holistic approach’ of EO
74 specifies that the EIS should be assessed on
the cumulative impact of (nearby) projects, as
also stated in Article II Section 4.3 of the EIS
implementing rules and regulations. EO 74
also specifies that land reclamation plans
should include the “vertical” planning, in other
105
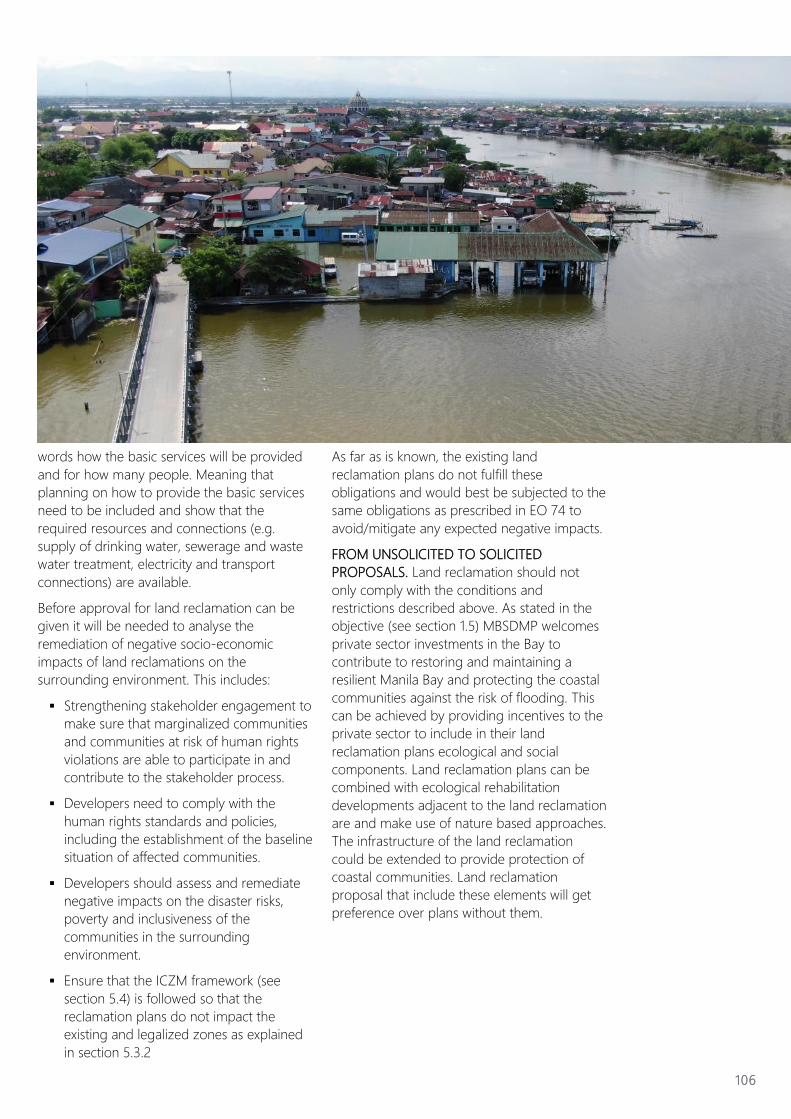
words how the basic services will be provided
and for how many people. Meaning that
planning on how to provide the basic services
need to be included and show that the
required resources and connections (e.g.
supply of drinking water, sewerage and waste
water treatment, electricity and transport
connections) are available.
Before approval for land reclamation can be
given it will be needed to analyse the
remediation of negative socio-economic
impacts of land reclamations on the
surrounding environment. This includes:
▪ Strengthening stakeholder engagement to
make sure that marginalized communities
and communities at risk of human rights
violations are able to participate in and
contribute to the stakeholder process.
▪ Developers need to comply with the
human rights standards and policies,
including the establishment of the baseline
situation of affected communities.
▪ Developers should assess and remediate
negative impacts on the disaster risks,
poverty and inclusiveness of the
communities in the surrounding
environment.
▪ Ensure that the ICZM framework (see
section 5.4) is followed so that the
reclamation plans do not impact the
existing and legalized zones as explained
in section 5.3.2
As far as is known, the existing land
reclamation plans do not fulfill these
obligations and would best be subjected to the
same obligations as prescribed in EO 74 to
avoid/mitigate any expected negative impacts.
FROM UNSOLICITED TO SOLICITED
PROPOSALS. Land reclamation should not
only comply with the conditions and
restrictions described above. As stated in the
objective (see section 1.5) MBSDMP welcomes
private sector investments in the Bay to
contribute to restoring and maintaining a
resilient Manila Bay and protecting the coastal
communities against the risk of flooding. This
can be achieved by providing incentives to the
private sector to include in their land
reclamation plans ecological and social
components. Land reclamation plans can be
combined with ecological rehabilitation
developments adjacent to the land reclamation
are and make use of nature based approaches.
The infrastructure of the land reclamation
could be extended to provide protection of
coastal communities. Land reclamation
proposal that include these elements will get
preference over plans without them.
106