Embed Size (px)
Citation preview
Stichting Deltares
SAR FTR | Inclusive Growth
NATIONAL ECONOMIC AND DEVELOPMENT AUTHORITY
REPUBLIC OF THE PHILIPPINES

Consulting Services for the
Formulation of the Manila Bay Sustainable Development Master Plan
Page i
Manila Bay Sustainable Development Master Plan
Situation Analysis Report | Focal Theme Reports
Inclusive Growth December 2018
Consulting Services for the
Formulation of the Manila Bay Sustainable Development Master Plan
Page iii
Table of Contents
Preface .................................................................................................................................................................. vi
1 Introduction .................................................................................................................................................. 1
1.1 A Short Narrative .................................................................................................................................... 1
1.1.1 Evaluation Framework and Scorecard ........................................................................................................ 2
1.1.2 What is and what is not Inclusive growth? .................................................................................................. 2
1.2 Relevance of Inclusive Growth for Manila Bay ....................................................................................... 2
2 Policy context: International, National and Regional Policy Objectives and Legal Framework ........... 5
2.1 Laws and relevant implementing rules and regulations ......................................................................... 5
2.2 National, regional and local (Manila Bay) development goals, plans and policies ................................. 6
2.3 Relevant international agreements and conventions (e.g. UN Sustainable Development Goals) .......... 7
2.4 Inventory of stakeholders ....................................................................................................................... 9
3 Targets and indicators ............................................................................................................................... 10
3.1 Long list of targets and indicators......................................................................................................... 10
3.2 Short list of targets and indicators ........................................................................................................ 10
4 Problem Analysis ....................................................................................................................................... 11
4.1 Description of Present Situation ........................................................................................................... 11
4.1.1 Regional Economic Growth Trend ............................................................................................................ 11
4.1.2 Performance of the Local Economy .......................................................................................................... 12
4.1.3 Population and Poverty ............................................................................................................................. 13
4.1.4 Underground Economy or the Informal Sector ......................................................................................... 16
4.1.5 Public Investment Programs ..................................................................................................................... 16
4.1.6 Transport .................................................................................................................................................. 16
4.1.7 Energy ...................................................................................................................................................... 17
4.1.8 Agriculture and Fisheries .......................................................................................................................... 18
4.1.9 Spatial Planning ........................................................................................................................................ 19
4.1.10 Smart City Development and the Adoption of ASEAN Smart Cities Network (ASCN) Framework .......... 20
4.2 System analysis: Drivers and Outcomes of Inequitable Growth........................................................... 20
5 Scenarios .................................................................................................................................................... 22
5.1 Base Case and Gap Analysis .............................................................................................................. 22
6 Summarizing and Concluding Problem Statement ................................................................................. 24
6.1 Relationships to Other Focal Themes .................................................................................................. 24
6.1.1 Linkage to Upgrading Informal Settlements .............................................................................................. 24
6.1.2 Linkage to Ecosystem Protection ............................................................................................................. 24
6.1.3 Linkage to Water Quality Improvement .................................................................................................... 25
6.1.4 Linkage to CCA and DRR ......................................................................................................................... 25
FOCAL THEME REPORT | INCLUSIVE GROWTH
December 2018
Page iv
Acronyms and Abbreviations CHED Commission on Higher Education
BCDA Bases Conversion & Development
Corporation
BFAR Bureau of Fishery and Aquatic Resources
CSW Completed Staff Work
CWA Clean Water Act
DA Department of Agriculture
DENR Department of Environment and Natural
Resources
DepEd Department of Education
DILG Department of Interior and Local
Government
DOH Department of Health
DOST Department of Science and Technology
DOTC Department of Transport and
Communications
DPWH Department of Public Works and Highways
DRR Dutch Risk Reduction
DTI-BOI Department of Trade and Industry - Board
of Investments
ECC Environmental Compliance Certificate
EIS Environmental Impact Statement
EO Executive Order
GOCC Government Owned or Controlled
Corporations
HLURB Housing and Land Use Regulatory Board
IA Implementing Agreement
IEE Initial Environmental Examination
ICC Investment Coordination Committee
IRR Implementing Rules and Regulations
JV Joint Venture
LGU Local Government Unit
LLDA Laguna Lake Development Authority
MBCO Manila Bay Coordinating Office
MBEMP Manila Bay Environmental Management
Project
MBSDMP Manila Bay Sustainable Development
Master Plan
MMDA Metro Manila Development Authority
MWWS Metropolitan Waterworks and Sewerage
System
NB NEDA Board
NEDA National Economic Development Authority
NGA National Government Agency
NHA National Housing Authority
NPC National Power Corporation
NRDC National Resources Defense Council
NWRB National Water Resources Board
PAMB Protected Area Management Board
PAPs programs, activities, projects
PCG Philippine Coast Guard
PER Project Evaluation Report
PIA Philippine Information Agency
PPA Philippine Ports Authority
PPP Public Private Partnership
PRA Philippine Reclamation Authority
PEZA Philippine Economic Zone Authority
PHIVIDEC Philippine Veterans Investment
Development Corporation
PNP Philippine National Police
PPA Philippine Port Authority
PRRC Pasig River Rehabilitation Commission
PSA Philippine Statistics Authority
PWSSMP Philippine Water Supply and Sanitation
Project
RA Reclamation Agreement
RBCO River Basin Control Office
RDC Regional Development Council
RIZLAQUE Rizal-Laguna-Aurora, Quezon
SMBA Subic Bay Metropolitan Authority
WD Water District
WQMA Water Quality Management Area

Consulting Services for the
Formulation of the Manila Bay Sustainable Development Master Plan
Page v
FOCAL THEME REPORT | INCLUSIVE GROWTH
December 2018
Page vi
Preface
The Manila Bay Sustainable Development Master Plan (MBSDMP) is to be a comprehensive and sustainable master
plan for Manila Bay and the immediate coastal zone together with its larger catchment area – the Manila Bay basin.
Consistent with the Philippine Development Plan (PDP) and contributes in achieving AmBisyon 2040, the master
plan is to be instrumental in linking economic planning and development projects to environmental and resource
management goals for Manila Bay and addressing social and ecological issues (such as poverty alleviation, food
security, public health and biodiversity) through the rehabilitation and sustainable development of marine and coastal
resources with appropriate financing/funding.
While the traditional plans for Coastal Management and Development assume public financing, the MBSDMP
approach aims to make use of solicited private sector investments to achieve strategic management and
development goals for five (5) focal themes, namely:
▪ inclusive growth,
▪ ecosystem protection,
▪ climate change adaptation and disaster risk reduction,
▪ water quality improvement, and
▪ upgrading informal settlements.
In preparing the Situation Analysis Report, five (5) Focal Theme Reports are prepared accordingly in preparation for
the next step – the Strategy Building Phase.
The Situation Analysis Report consist of:
▪ Executive Summary of the 5 Focal Themes,
▪ Manila Bay Area 2018 | A Situational Atlas, and
▪ Five (5) Focal Theme Reports, namely:
Inclusive Growth
Ecosystem Protection,
Climate change adaptation and disaster risk reduction,
Water quality improvement, and
Upgrading informal settlements.
This is the Focal Theme Report for Inclusive Growth.
Page 1
1 Introduction Rhetoric has been used to encapsulate dominant thinking and policy direction in development economics. In the
past, the terms “trickle down”, “ripple effect”, “broad-based growth”, and “pro-poor growth” have been constantly
used to describe models, sets of policies, targets, or desirable outcomes. Inclusive growth emerged as a term that
supports both economic growth and the poor in an astute catchphrase. It is an overarching theme that generally
means economic development for all while reducing inequality. It has multiple dimensions including: income, living
conditions, access to basic services, environmental protection, equal employment opportunities, access to
innovations, financial inclusion, participation, and empowerment in pursuing the path for economic growth and
development.
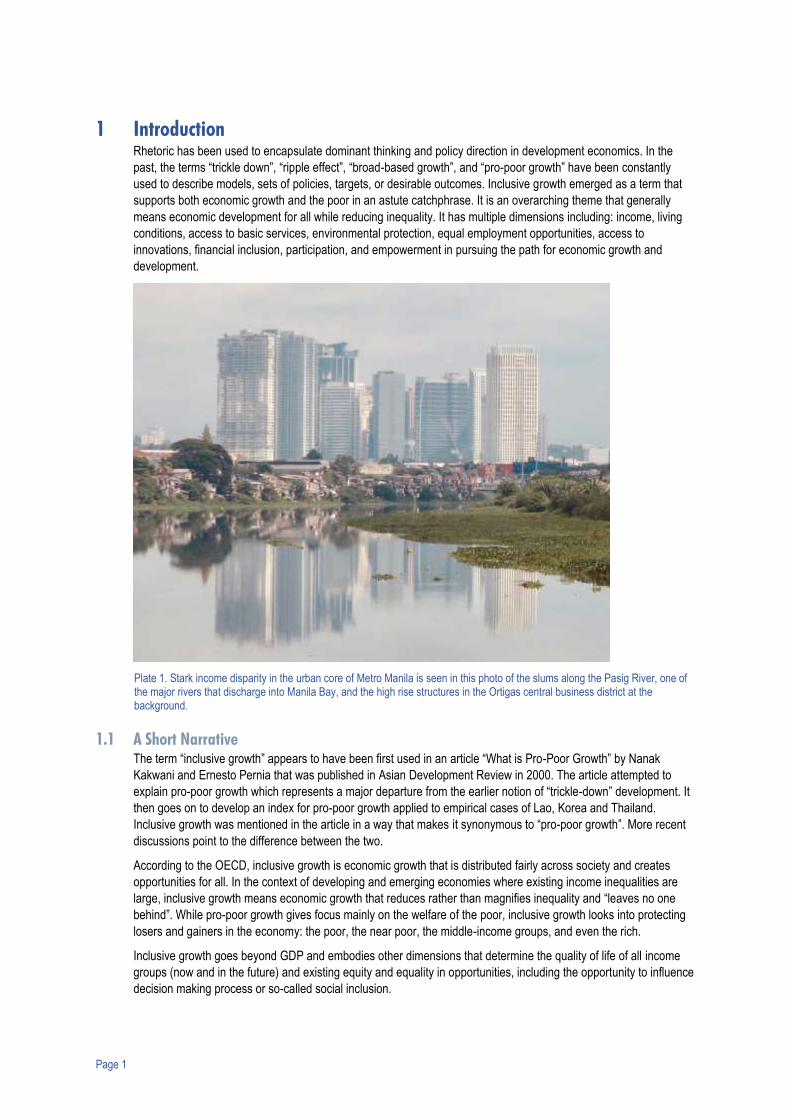
Plate 1. Stark income disparity in the urban core of Metro Manila is seen in this photo of the slums along the Pasig River, one of the major rivers that discharge into Manila Bay, and the high rise structures in the Ortigas central business district at the background.
1.1 A Short Narrative The term “inclusive growth” appears to have been first used in an article “What is Pro-Poor Growth” by Nanak
Kakwani and Ernesto Pernia that was published in Asian Development Review in 2000. The article attempted to
explain pro-poor growth which represents a major departure from the earlier notion of “trickle-down” development. It
then goes on to develop an index for pro-poor growth applied to empirical cases of Lao, Korea and Thailand.
Inclusive growth was mentioned in the article in a way that makes it synonymous to “pro-poor growth”. More recent
discussions point to the difference between the two.
According to the OECD, inclusive growth is economic growth that is distributed fairly across society and creates
opportunities for all. In the context of developing and emerging economies where existing income inequalities are
large, inclusive growth means economic growth that reduces rather than magnifies inequality and “leaves no one
behind”. While pro-poor growth gives focus mainly on the welfare of the poor, inclusive growth looks into protecting
losers and gainers in the economy: the poor, the near poor, the middle-income groups, and even the rich.
Inclusive growth goes beyond GDP and embodies other dimensions that determine the quality of life of all income
groups (now and in the future) and existing equity and equality in opportunities, including the opportunity to influence
decision making process or so-called social inclusion.
FOCAL THEME REPORT | INCLUSIVE GROWTH
December 2018
Page 2
Inclusive growth in the context of a city takes a slightly different emphasis. Cities are places where most
opportunities concentrate, they could be considered “full” of opportunities. However, cities are often divided and
isolate the most vulnerable groups of society in disadvantaged neighbourhoods. There are significant intra-urban
and spatial inequalities in cities that are a major challenge for inclusive growth. Some of the indicators are used for
instanced by the OECD to measure these spatial inequalities are income segregation (entropy index): the extent to
which poor and rich people live in separate neighbourhoods. The neighbourhood where people lives influences not
only the living conditions, as the poorest neighbourhoods are often the most exposed to floods and other hazards,
but also the access to jobs. A study of these inequalities in cities (OECD 2018) indicates that important factors to
reduce intra-urban inequalities are: equal access to quality education and health, efficient public transport and a well-
planned housing policy.
The previous Philippine Development Plan (PDP) 2011-2016 embraced the inclusive growth theme, making it a
vision of the medium-term plan. It defined inclusive growth to be, first of all, “growth that is rapid enough to matter”.
Meanwhile, PDP 2017-2022 sets the first steps towards the long-term AmBisyon 2040 with the vision of “matatag,
maginhawa at panatag na buhay”, in which the country is a middle-class society where no one is poor. It is a vision
where poverty is eradicated, not merely reduced --- which is central to inclusive growth.
1.1.1 Evaluation Framework and Scorecard In the context of a city master plan and an investment plan, inclusive growth translates to an evaluation lens that
includes in the economic analysis whether the planned investments not only aggregates surpluses but goes deeper
to analyse whether the net benefits are fairly distributed across the population and generate the expected Wider
Economic Benefits (WEB). If that is not the case, then these investments could be considered inequitable and not
conducive to inclusive growth.
In more simple terms this means evaluating whether the planned investments not only increase winners but also do
not leave behind losers.
1.1.2 What is and what is not Inclusive growth? ▪ Differentiated from trickle-down: a vertical model of growth wherein the poor only benefits when the rich
start spending their gains; inclusive growth ensures all income tiers have an equitable share on the gains
▪ Differentiated from pro-poor growth: pro-poor growth focuses on reducing poverty, neutral on growth of
other income tiers and on other dimensions of growth; inclusive growth strives for growth for all tiers, while
working on redistribution to lessen inequality
▪ Differentiated from business-as-usual: latter is distribution-neutral
▪ Differentiated from sustainable development: sustainable development is broader - balancing economic
growth with social and environmental benefits; inclusive growth is ensuring that the social benefit from
sustainable development is equitable
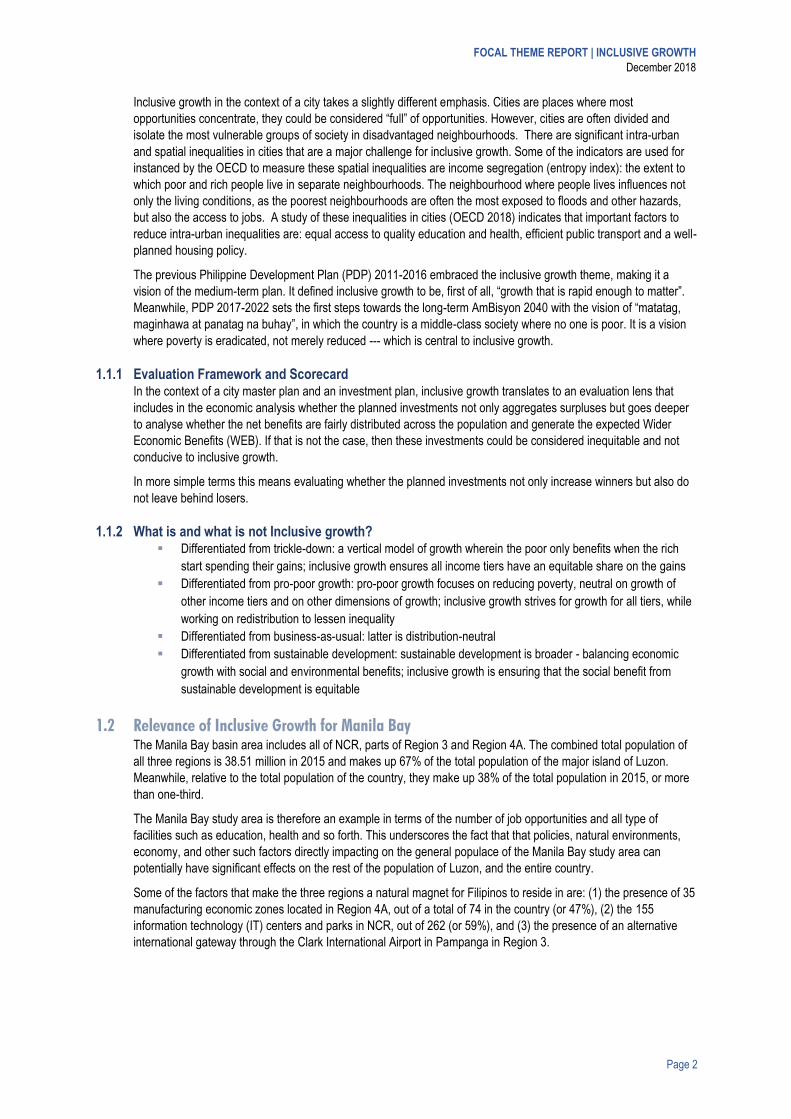
1.2 Relevance of Inclusive Growth for Manila Bay The Manila Bay basin area includes all of NCR, parts of Region 3 and Region 4A. The combined total population of
all three regions is 38.51 million in 2015 and makes up 67% of the total population of the major island of Luzon.
Meanwhile, relative to the total population of the country, they make up 38% of the total population in 2015, or more
than one-third.
The Manila Bay study area is therefore an example in terms of the number of job opportunities and all type of
facilities such as education, health and so forth. This underscores the fact that that policies, natural environments,
economy, and other such factors directly impacting on the general populace of the Manila Bay study area can
potentially have significant effects on the rest of the population of Luzon, and the entire country.
Some of the factors that make the three regions a natural magnet for Filipinos to reside in are: (1) the presence of 35
manufacturing economic zones located in Region 4A, out of a total of 74 in the country (or 47%), (2) the 155
information technology (IT) centers and parks in NCR, out of 262 (or 59%), and (3) the presence of an alternative
international gateway through the Clark International Airport in Pampanga in Region 3.
Page 3
Figure 1. Population of NCR, Region 3 and Region 4A relative to Luzon and the Philippines in 2015.
Daytime population in NCR also increases by about 3 million according to the PSA (albeit there are no official
surveys on this), with the influx of workers and students coming from the adjacent Region 3 and Region 4A.
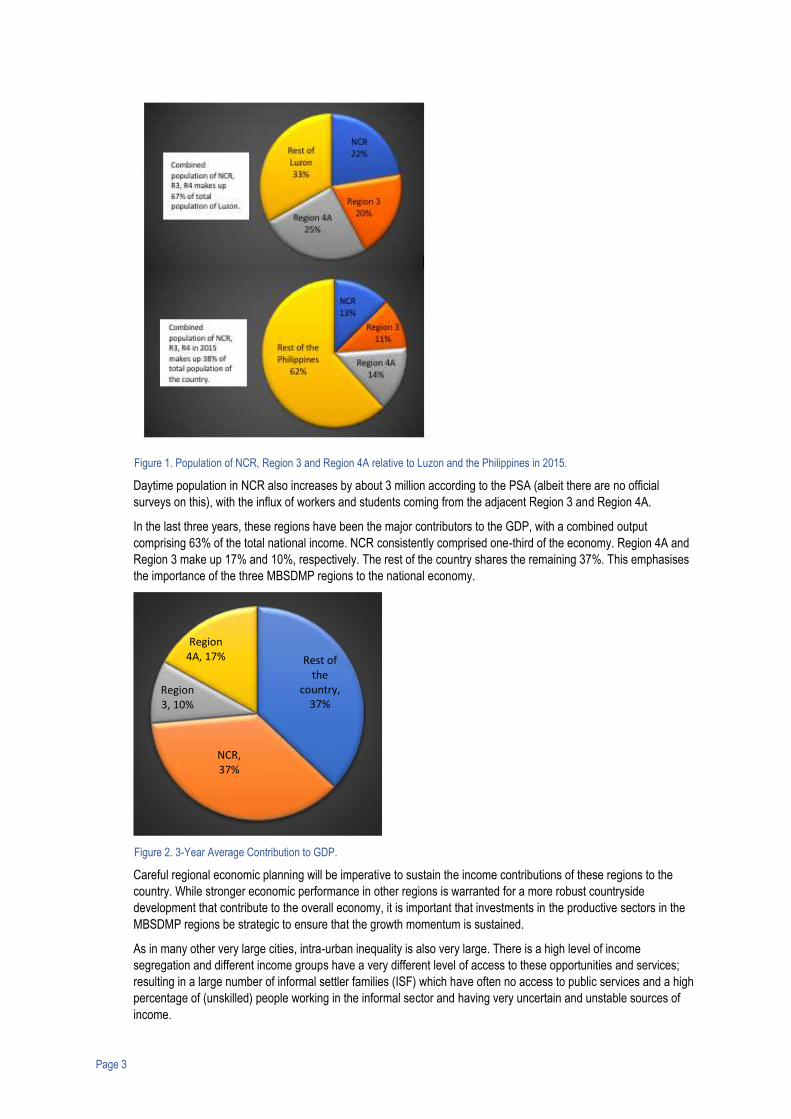
In the last three years, these regions have been the major contributors to the GDP, with a combined output
comprising 63% of the total national income. NCR consistently comprised one-third of the economy. Region 4A and
Region 3 make up 17% and 10%, respectively. The rest of the country shares the remaining 37%. This emphasises
the importance of the three MBSDMP regions to the national economy.
Figure 2. 3-Year Average Contribution to GDP.
Careful regional economic planning will be imperative to sustain the income contributions of these regions to the
country. While stronger economic performance in other regions is warranted for a more robust countryside
development that contribute to the overall economy, it is important that investments in the productive sectors in the
MBSDMP regions be strategic to ensure that the growth momentum is sustained.
As in many other very large cities, intra-urban inequality is also very large. There is a high level of income
segregation and different income groups have a very different level of access to these opportunities and services;
resulting in a large number of informal settler families (ISF) which have often no access to public services and a high
percentage of (unskilled) people working in the informal sector and having very uncertain and unstable sources of
income.
Rest of the
country, 37%
NCR, 37%
Region 3, 10%
Region 4A, 17%
FOCAL THEME REPORT | INCLUSIVE GROWTH
December 2018
Page 4
Besides the quality of life of all citizens that is significantly impacted by pollution (air and water quality), frequency of
floods, poor waste management system and a very inefficient and little inclusive transport system. Amongst these
essential public services, the transport sector has attracted a number of PPP and ODA-funded investment proposals.
However, investments on improved technology and scale in flood control, waste management and waste water
treatment services which, although these could potentially generate a lot of green jobs, are not enough. The
explanation of why these "public" services are not in place is probably in the limited capacity of the current
governance system (combination of national and local responsibilities) to enforce and monitor the compliance with
existing regulations and create the incentives for (private) investment to flow towards strengthening of these public
services. Specifically, public waste collection, have been pushed by DENR to the LGU’s realm of responsibilities and
their contractors. Moreover, these contractors provide only collection and landfilling services and do not reduce
waste volume through processing. Industrial waste processing is the responsibility of private polluters but the
system-wide capability of DENR to monitor and enforce compliance leaves huge room for improvement. Wastewater
treatment is largely a responsibility of the 2 main concessionaires accredited by MWSS for the NCR and selected
adjoining areas. The rest are given to Local Water Districts. Where septic tank wastes go is hardly monitored.
Technologies in these environmental engineering industries which have a direct impact on Manila Bay, are capital-
intensive and require economies of scale, which may not be achieved in a highly fragmented and uncoordinated
market, thus making massive investments into the sector unattractive.
The increasing climate variability and frequency in floods, combined with very poor solid waste management only
exacerbates existing inequalities as the already disadvantaged neighbourhoods are the most affected.
In terms of sectors, the most vulnerable sectors in the plan area is the agriculture sector which includes the fishing
communities. Increasing urbanization and land conversion has meant reduction in agricultural area, which, combined
with very poor productivity levels results in a significant decrease in number of agricultural jobs and average income
per farmer.
Productivity of the manufacturing industries and the services sector, which are the key economic drivers are also
vulnerable to the increasing lack of sufficient infrastructure to support a constantly growing population that is
concentrated in the core urban areas.
Although there are many solicited and unsolicited investments planned for the area and for different sectors that
could have a great impact on economic growth, the way these are being conceptualized and designed does not
indicate that this growth may result in a reduction of existing inequalities in the city.
Part of the explanation of why most planned investments in Manila Bay area do not result in a reduction of
inequalities is because of the existing problem of social exclusion. Due to a number of governance patterns, the most
vulnerable groups of society although sometimes consulted are not able to influence the final choices made.
Last but not least, looking towards the future and given the imminent hike in urban population; for inclusive growth to
be sustainable, it is expected that green growth strategies be emphasized. While green growth is in principle
distribution neutral – pursuing green growth will benefit the marginalized sectors the most since they are the most
vulnerable at the present the negative externalities of business-as-usual (BAU) growth strategies. As of now, Manila
Bay green spaces (also important from a health and flood management perspectives) are very limited. In NCR, the
current total for open spaces (all types) is 25.28 sq.km. or about 4% of the total land area. This includes the 33-
hectare La Mesa Watershed (which is part of the 2,700-hectare La Mesa Watershed), the Ninoy Aquino Parks and
Wildlife Center (80 ha.), the Marikina River Park (220 ha.), Rizal Park (58 ha.), and the Arroceros Forest Park (2.2
ha). Meanwhile, in 2016, the country enacted Republic Act (RA) 10771 or the Philippine Green Jobs Act (PGJA), as
part of its commitment to the Paris Agreement. Green jobs are now recognized and defined as “any form of
employment in any economic sector that contributes to the quality of the environment”. These green jobs are
required to be decent, in that they are productive, workers’ rights are respected, income is fair, workplace security as
well as social protection for families are provided, and that social dialogue is promoted. The law provides fiscal and
non-fiscal incentives to businesses that create green jobs. Such developments are geared towards growth that is
inclusive, in a sense that economic incentives are present for enterprises that endeavour in activities that protect the
environment, provide sustainable jobs for people, and potentially reduce society’s vulnerability to natural disasters.
Page 5
2 Policy context: International, National and Regional Policy Objectives and
Legal Framework Under the Constitutional provisions on the economy (Article XII), “(t)he goals of the national economy are a more
equitable distribution of opportunities, income, and wealth; a sustained increase in the amount of goods and services
produced by the nation for the benefit of the people; and an expanding productivity as the key to raising the quality of
life for all, especially the underprivileged” (Sec 1). Furthermore, “(t)he use of property bears a social function, and all
economic agents shall contribute to the common good. Individuals and private groups, including corporations,
cooperatives, and similar collective organizations, shall have the right to own establish, and operate economic
enterprises, subject to the duty of the State to promote distributive justice and to intervene when the common good
so demands” (Sec. 6). This is reiterated in the Article on social justice (Article XIII) that states, “(t)he Congress shall
give highest priority to the enactment of measures that protect and enhance the right of all the people to human
dignity, reduce social, economic, and political inequalities, and remove cultural inequities by equitably diffusing
wealth and political power for the common good” (Sec. 1).
Inclusive growth is driven more by the administration’s priority policies and programs than by legislation. The
government’s priority is to first address poverty. The Department of Social Welfare and Development implements a
number of programs on poverty alleviation. The Pantawid Pamilyang Pilipino Program (4Ps) is a conditional cash
transfer scheme where more than 4.4 million poor households receive cash grants in exchange for responsibilities to
keep mothers and infants healthy and for school-age minors to attend school. The known as the Kapit-Bisig Laban
sa Kahirapan-Comprehensive and Integrated Delivery of Social Services (Kalahi-CIDSS) uses the community-
driven development (CDD) approach to help communities in poor municipalities identify challenges around reducing
poverty and make informed decisions on a range of locally identified development initiatives. Communities, civil
society and local governments become empowered to achieve improved access to services and to participate in
more inclusive local planning, budgeting, and implementation. The Sustainable Livelihood Program (SLP) is a
capability building program for poor, vulnerable and marginalized communities by developing skills that enhances
employment opportunities or providing training for micro-enterprise development.
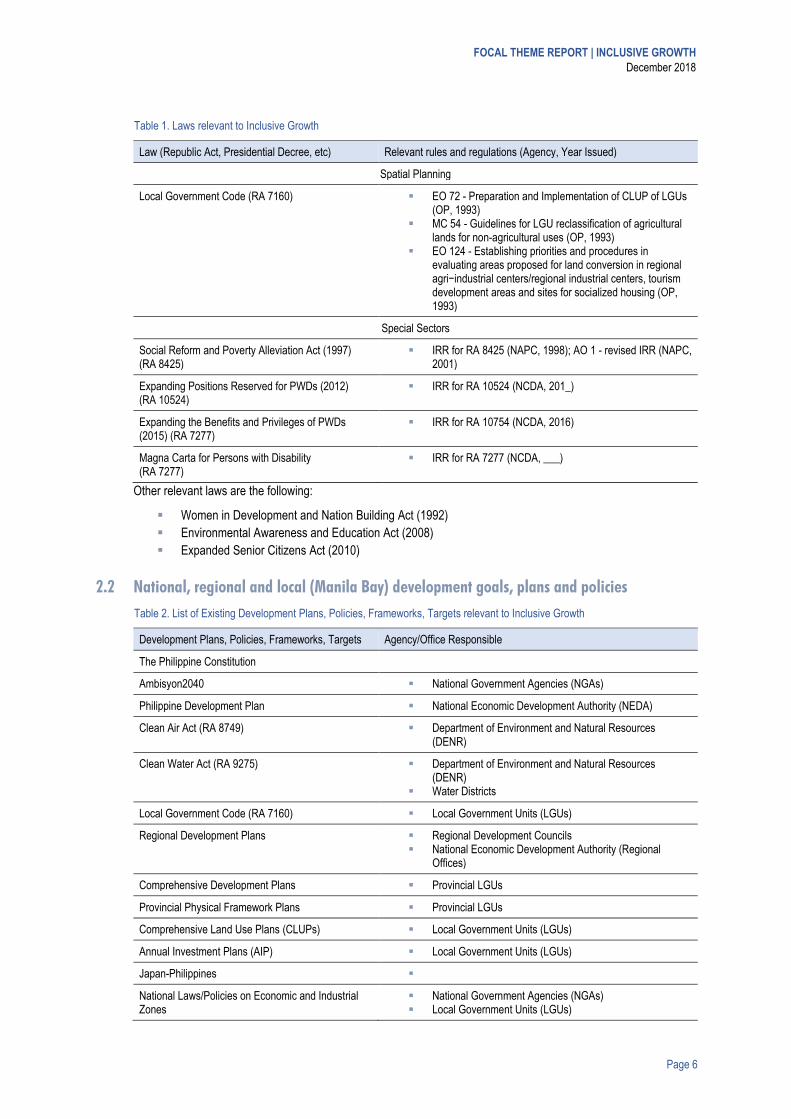
2.1 Laws and relevant implementing rules and regulations The Social Reform and Poverty Alleviation Act (RA 8425) seeks to reduce “absolute poverty” (below the food
threshold level) and “relative poverty” (gap between the rich and the poor). The law created the multi-sectoral
National Anti-Poverty Commission that ensures coordinated implementation of all national and local social reform
and poverty alleviation programs. The flagship programs and target sectors include:
▪ farmers and landless rural workers – agricultural development;
▪ fisherfolk – fisheries and aquatic resources conservation, management and development;
▪ indigenous peoples and indigenous communities – respect, protection and management of the ancestral
domains;
▪ workers in the informal sector – workers’ welfare and protection;
▪ urban poor – socialized housing; and
▪ members of other disadvantaged groups such as women, children, youth, persons with disabilities, the
elderly, and victims of disasters and calamities – the Comprehensive and Integrated Delivery of Social
Services (CIDSS)
The law also created a People’s Development Trust Fund intended to support microfinance initiatives and supported
by other programs for credit and guarantee.
In addition to the social reform law, there are laws recognizing the role of women in development, granting benefits
and privileges to persons with disabilities and senior citizens. Aside from laws that integrate marginalized sectors,
there are laws integrating environmental awareness in education, and protecting cultural heritage that are more
broadly intended to improve the quality of life of the people beyond poverty alleviation.
FOCAL THEME REPORT | INCLUSIVE GROWTH
December 2018
Page 6
Table 1. Laws relevant to Inclusive Growth
Law (Republic Act, Presidential Decree, etc) Relevant rules and regulations (Agency, Year Issued)
Spatial Planning
Local Government Code (RA 7160) ▪ EO 72 - Preparation and Implementation of CLUP of LGUs (OP, 1993)
▪ MC 54 - Guidelines for LGU reclassification of agricultural lands for non-agricultural uses (OP, 1993)
▪ EO 124 - Establishing priorities and procedures in evaluating areas proposed for land conversion in regional agri−industrial centers/regional industrial centers, tourism development areas and sites for socialized housing (OP, 1993)
Special Sectors
Social Reform and Poverty Alleviation Act (1997) (RA 8425)
▪ IRR for RA 8425 (NAPC, 1998); AO 1 - revised IRR (NAPC, 2001)
Expanding Positions Reserved for PWDs (2012) (RA 10524)
▪ IRR for RA 10524 (NCDA, 201_)
Expanding the Benefits and Privileges of PWDs (2015) (RA 7277)
▪ IRR for RA 10754 (NCDA, 2016)
Magna Carta for Persons with Disability (RA 7277)
▪ IRR for RA 7277 (NCDA, ___)
Other relevant laws are the following:
▪ Women in Development and Nation Building Act (1992)
▪ Environmental Awareness and Education Act (2008)
▪ Expanded Senior Citizens Act (2010)
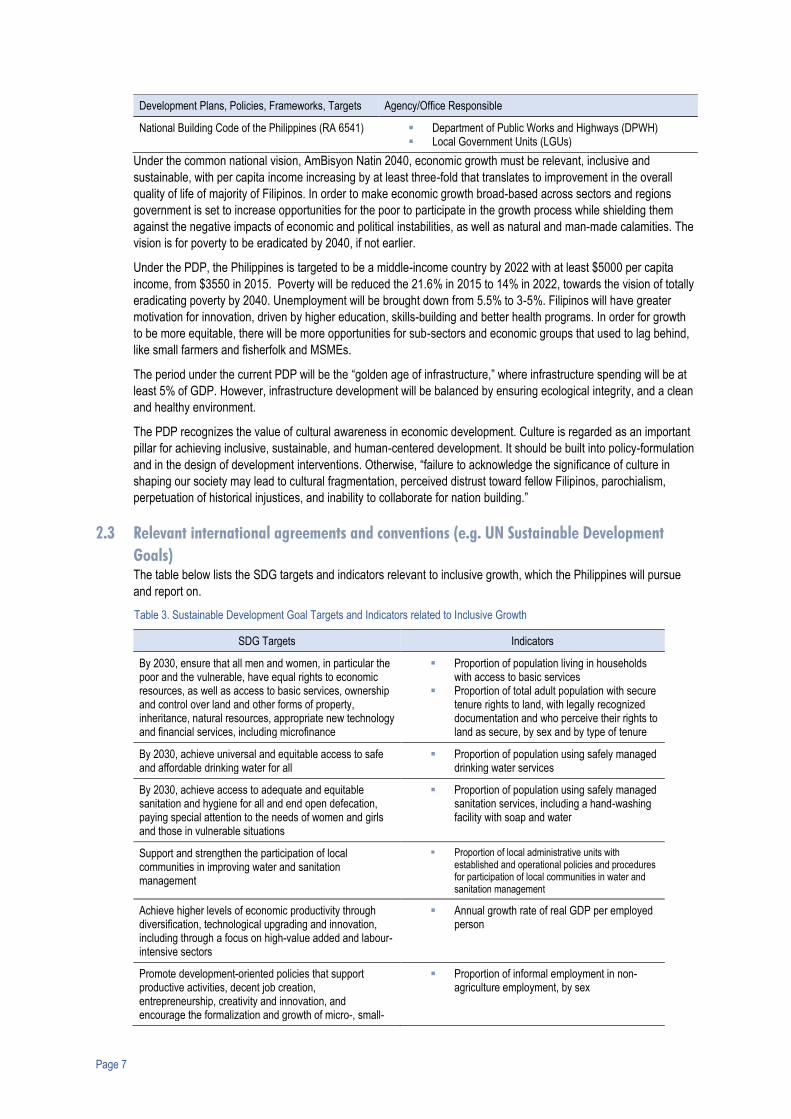
2.2 National, regional and local (Manila Bay) development goals, plans and policies
Table 2. List of Existing Development Plans, Policies, Frameworks, Targets relevant to Inclusive Growth
Development Plans, Policies, Frameworks, Targets Agency/Office Responsible
The Philippine Constitution
Ambisyon2040 ▪ National Government Agencies (NGAs)
Philippine Development Plan ▪ National Economic Development Authority (NEDA)
Clean Air Act (RA 8749) ▪ Department of Environment and Natural Resources (DENR)
Clean Water Act (RA 9275) ▪ Department of Environment and Natural Resources (DENR)
▪ Water Districts
Local Government Code (RA 7160) ▪ Local Government Units (LGUs)
Regional Development Plans ▪ Regional Development Councils ▪ National Economic Development Authority (Regional
Offices)
Comprehensive Development Plans ▪ Provincial LGUs
Provincial Physical Framework Plans ▪ Provincial LGUs
Comprehensive Land Use Plans (CLUPs) ▪ Local Government Units (LGUs)
Annual Investment Plans (AIP) ▪ Local Government Units (LGUs)
Japan-Philippines ▪
National Laws/Policies on Economic and Industrial Zones
▪ National Government Agencies (NGAs) ▪ Local Government Units (LGUs)
Page 7
Development Plans, Policies, Frameworks, Targets Agency/Office Responsible
National Building Code of the Philippines (RA 6541) ▪ Department of Public Works and Highways (DPWH) ▪ Local Government Units (LGUs)
Under the common national vision, AmBisyon Natin 2040, economic growth must be relevant, inclusive and
sustainable, with per capita income increasing by at least three-fold that translates to improvement in the overall
quality of life of majority of Filipinos. In order to make economic growth broad-based across sectors and regions
government is set to increase opportunities for the poor to participate in the growth process while shielding them
against the negative impacts of economic and political instabilities, as well as natural and man-made calamities. The
vision is for poverty to be eradicated by 2040, if not earlier.
Under the PDP, the Philippines is targeted to be a middle-income country by 2022 with at least $5000 per capita
income, from $3550 in 2015. Poverty will be reduced the 21.6% in 2015 to 14% in 2022, towards the vision of totally
eradicating poverty by 2040. Unemployment will be brought down from 5.5% to 3-5%. Filipinos will have greater
motivation for innovation, driven by higher education, skills-building and better health programs. In order for growth
to be more equitable, there will be more opportunities for sub-sectors and economic groups that used to lag behind,
like small farmers and fisherfolk and MSMEs.
The period under the current PDP will be the “golden age of infrastructure,” where infrastructure spending will be at
least 5% of GDP. However, infrastructure development will be balanced by ensuring ecological integrity, and a clean
and healthy environment.
The PDP recognizes the value of cultural awareness in economic development. Culture is regarded as an important
pillar for achieving inclusive, sustainable, and human-centered development. It should be built into policy-formulation
and in the design of development interventions. Otherwise, “failure to acknowledge the significance of culture in
shaping our society may lead to cultural fragmentation, perceived distrust toward fellow Filipinos, parochialism,
perpetuation of historical injustices, and inability to collaborate for nation building.”
2.3 Relevant international agreements and conventions (e.g. UN Sustainable Development
Goals) The table below lists the SDG targets and indicators relevant to inclusive growth, which the Philippines will pursue
and report on.
Table 3. Sustainable Development Goal Targets and Indicators related to Inclusive Growth
SDG Targets Indicators
By 2030, ensure that all men and women, in particular the poor and the vulnerable, have equal rights to economic resources, as well as access to basic services, ownership and control over land and other forms of property, inheritance, natural resources, appropriate new technology and financial services, including microfinance
▪ Proportion of population living in households with access to basic services
▪ Proportion of total adult population with secure tenure rights to land, with legally recognized documentation and who perceive their rights to land as secure, by sex and by type of tenure
By 2030, achieve universal and equitable access to safe and affordable drinking water for all
▪ Proportion of population using safely managed drinking water services
By 2030, achieve access to adequate and equitable sanitation and hygiene for all and end open defecation, paying special attention to the needs of women and girls and those in vulnerable situations
▪ Proportion of population using safely managed sanitation services, including a hand-washing facility with soap and water
Support and strengthen the participation of local communities in improving water and sanitation management
▪ Proportion of local administrative units with established and operational policies and procedures for participation of local communities in water and sanitation management
Achieve higher levels of economic productivity through diversification, technological upgrading and innovation, including through a focus on high-value added and labour-intensive sectors
▪ Annual growth rate of real GDP per employed person
Promote development-oriented policies that support productive activities, decent job creation, entrepreneurship, creativity and innovation, and encourage the formalization and growth of micro-, small-
▪ Proportion of informal employment in non-agriculture employment, by sex
FOCAL THEME REPORT | INCLUSIVE GROWTH
December 2018
Page 8
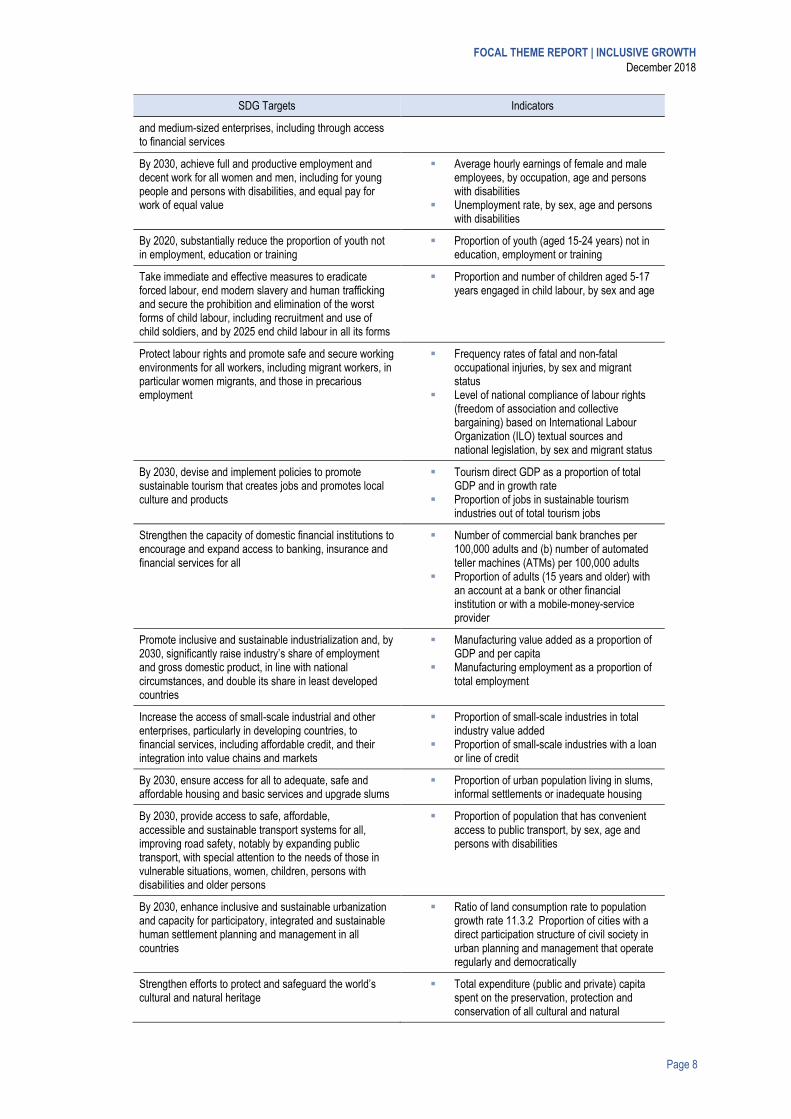
SDG Targets Indicators
and medium-sized enterprises, including through access to financial services
By 2030, achieve full and productive employment and decent work for all women and men, including for young people and persons with disabilities, and equal pay for work of equal value
▪ Average hourly earnings of female and male employees, by occupation, age and persons with disabilities
▪ Unemployment rate, by sex, age and persons with disabilities
By 2020, substantially reduce the proportion of youth not in employment, education or training
▪ Proportion of youth (aged 15-24 years) not in education, employment or training
Take immediate and effective measures to eradicate forced labour, end modern slavery and human trafficking and secure the prohibition and elimination of the worst forms of child labour, including recruitment and use of child soldiers, and by 2025 end child labour in all its forms
▪ Proportion and number of children aged 5-17 years engaged in child labour, by sex and age
Protect labour rights and promote safe and secure working environments for all workers, including migrant workers, in particular women migrants, and those in precarious employment
▪ Frequency rates of fatal and non-fatal occupational injuries, by sex and migrant status
▪ Level of national compliance of labour rights (freedom of association and collective bargaining) based on International Labour Organization (ILO) textual sources and national legislation, by sex and migrant status
By 2030, devise and implement policies to promote sustainable tourism that creates jobs and promotes local culture and products
▪ Tourism direct GDP as a proportion of total GDP and in growth rate
▪ Proportion of jobs in sustainable tourism industries out of total tourism jobs
Strengthen the capacity of domestic financial institutions to encourage and expand access to banking, insurance and financial services for all
▪ Number of commercial bank branches per 100,000 adults and (b) number of automated teller machines (ATMs) per 100,000 adults
▪ Proportion of adults (15 years and older) with an account at a bank or other financial institution or with a mobile-money-service provider
Promote inclusive and sustainable industrialization and, by 2030, significantly raise industry’s share of employment and gross domestic product, in line with national circumstances, and double its share in least developed countries
▪ Manufacturing value added as a proportion of GDP and per capita
▪ Manufacturing employment as a proportion of total employment
Increase the access of small-scale industrial and other enterprises, particularly in developing countries, to financial services, including affordable credit, and their integration into value chains and markets
▪ Proportion of small-scale industries in total industry value added
▪ Proportion of small-scale industries with a loan or line of credit
By 2030, ensure access for all to adequate, safe and affordable housing and basic services and upgrade slums
▪ Proportion of urban population living in slums, informal settlements or inadequate housing
By 2030, provide access to safe, affordable, accessible and sustainable transport systems for all, improving road safety, notably by expanding public transport, with special attention to the needs of those in vulnerable situations, women, children, persons with disabilities and older persons
▪ Proportion of population that has convenient access to public transport, by sex, age and persons with disabilities
By 2030, enhance inclusive and sustainable urbanization and capacity for participatory, integrated and sustainable human settlement planning and management in all countries
▪ Ratio of land consumption rate to population growth rate 11.3.2 Proportion of cities with a direct participation structure of civil society in urban planning and management that operate regularly and democratically
Strengthen efforts to protect and safeguard the world’s cultural and natural heritage
▪ Total expenditure (public and private) capita spent on the preservation, protection and conservation of all cultural and natural
Page 9
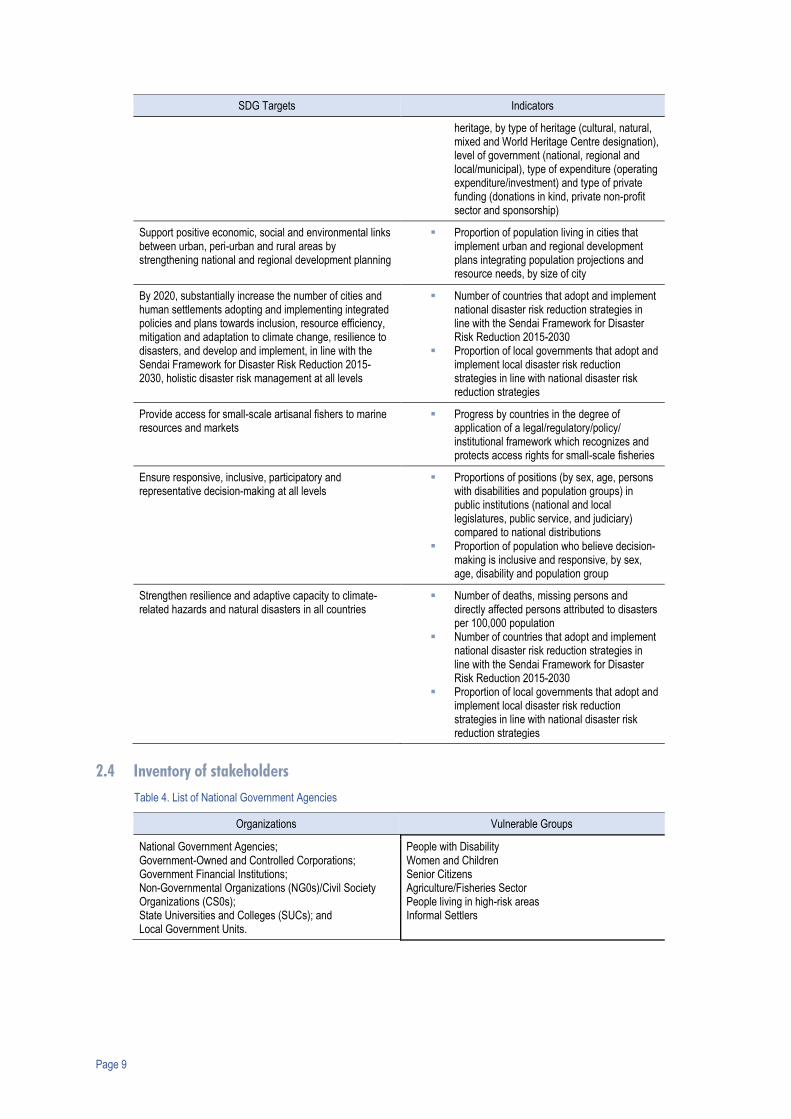
SDG Targets Indicators
heritage, by type of heritage (cultural, natural, mixed and World Heritage Centre designation), level of government (national, regional and local/municipal), type of expenditure (operating expenditure/investment) and type of private funding (donations in kind, private non-profit sector and sponsorship)
Support positive economic, social and environmental links between urban, peri-urban and rural areas by strengthening national and regional development planning
▪ Proportion of population living in cities that implement urban and regional development plans integrating population projections and resource needs, by size of city
By 2020, substantially increase the number of cities and human settlements adopting and implementing integrated policies and plans towards inclusion, resource efficiency, mitigation and adaptation to climate change, resilience to disasters, and develop and implement, in line with the Sendai Framework for Disaster Risk Reduction 2015-2030, holistic disaster risk management at all levels
▪ Number of countries that adopt and implement national disaster risk reduction strategies in line with the Sendai Framework for Disaster Risk Reduction 2015-2030
▪ Proportion of local governments that adopt and implement local disaster risk reduction strategies in line with national disaster risk reduction strategies
Provide access for small-scale artisanal fishers to marine resources and markets
▪ Progress by countries in the degree of application of a legal/regulatory/policy/ institutional framework which recognizes and protects access rights for small-scale fisheries
Ensure responsive, inclusive, participatory and representative decision-making at all levels
▪ Proportions of positions (by sex, age, persons with disabilities and population groups) in public institutions (national and local legislatures, public service, and judiciary) compared to national distributions
▪ Proportion of population who believe decision- making is inclusive and responsive, by sex, age, disability and population group
Strengthen resilience and adaptive capacity to climate-related hazards and natural disasters in all countries
▪ Number of deaths, missing persons and directly affected persons attributed to disasters per 100,000 population
▪ Number of countries that adopt and implement national disaster risk reduction strategies in line with the Sendai Framework for Disaster Risk Reduction 2015-2030
▪ Proportion of local governments that adopt and implement local disaster risk reduction strategies in line with national disaster risk reduction strategies
2.4 Inventory of stakeholders
Table 4. List of National Government Agencies
Organizations Vulnerable Groups
National Government Agencies; Government-Owned and Controlled Corporations; Government Financial Institutions; Non-Governmental Organizations (NG0s)/Civil Society Organizations (CS0s); State Universities and Colleges (SUCs); and Local Government Units.
People with Disability Women and Children Senior Citizens Agriculture/Fisheries Sector People living in high-risk areas Informal Settlers
FOCAL THEME REPORT | INCLUSIVE GROWTH
December 2018
Page 10
3 Targets and indicators
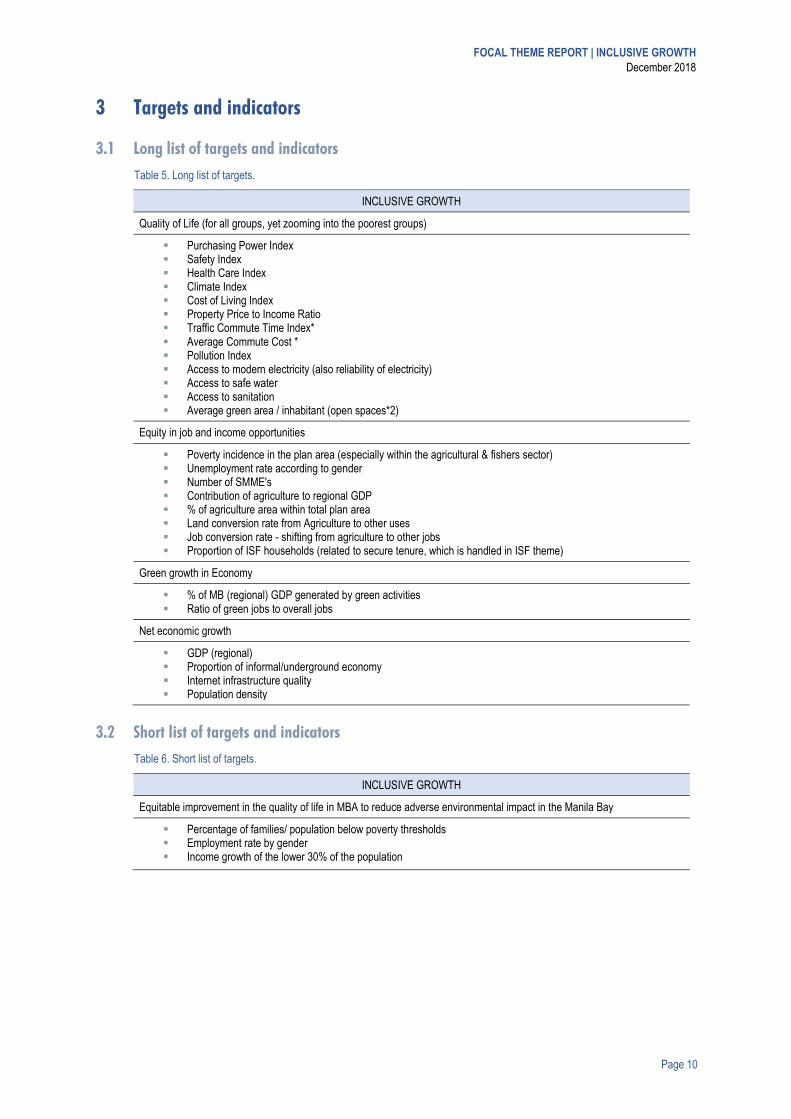
3.1 Long list of targets and indicators
Table 5. Long list of targets.
INCLUSIVE GROWTH
Quality of Life (for all groups, yet zooming into the poorest groups)
▪ Purchasing Power Index ▪ Safety Index ▪ Health Care Index ▪ Climate Index ▪ Cost of Living Index ▪ Property Price to Income Ratio ▪ Traffic Commute Time Index* ▪ Average Commute Cost * ▪ Pollution Index ▪ Access to modern electricity (also reliability of electricity) ▪ Access to safe water ▪ Access to sanitation ▪ Average green area / inhabitant (open spaces*2)
Equity in job and income opportunities
▪ Poverty incidence in the plan area (especially within the agricultural & fishers sector) ▪ Unemployment rate according to gender ▪ Number of SMME's ▪ Contribution of agriculture to regional GDP ▪ % of agriculture area within total plan area ▪ Land conversion rate from Agriculture to other uses ▪ Job conversion rate - shifting from agriculture to other jobs ▪ Proportion of ISF households (related to secure tenure, which is handled in ISF theme)
Green growth in Economy
▪ % of MB (regional) GDP generated by green activities ▪ Ratio of green jobs to overall jobs
Net economic growth
▪ GDP (regional) ▪ Proportion of informal/underground economy ▪ Internet infrastructure quality ▪ Population density
3.2 Short list of targets and indicators
Table 6. Short list of targets.
INCLUSIVE GROWTH
Equitable improvement in the quality of life in MBA to reduce adverse environmental impact in the Manila Bay
▪ Percentage of families/ population below poverty thresholds ▪ Employment rate by gender ▪ Income growth of the lower 30% of the population
Page 11
4 Problem Analysis
4.1 Description of Present Situation
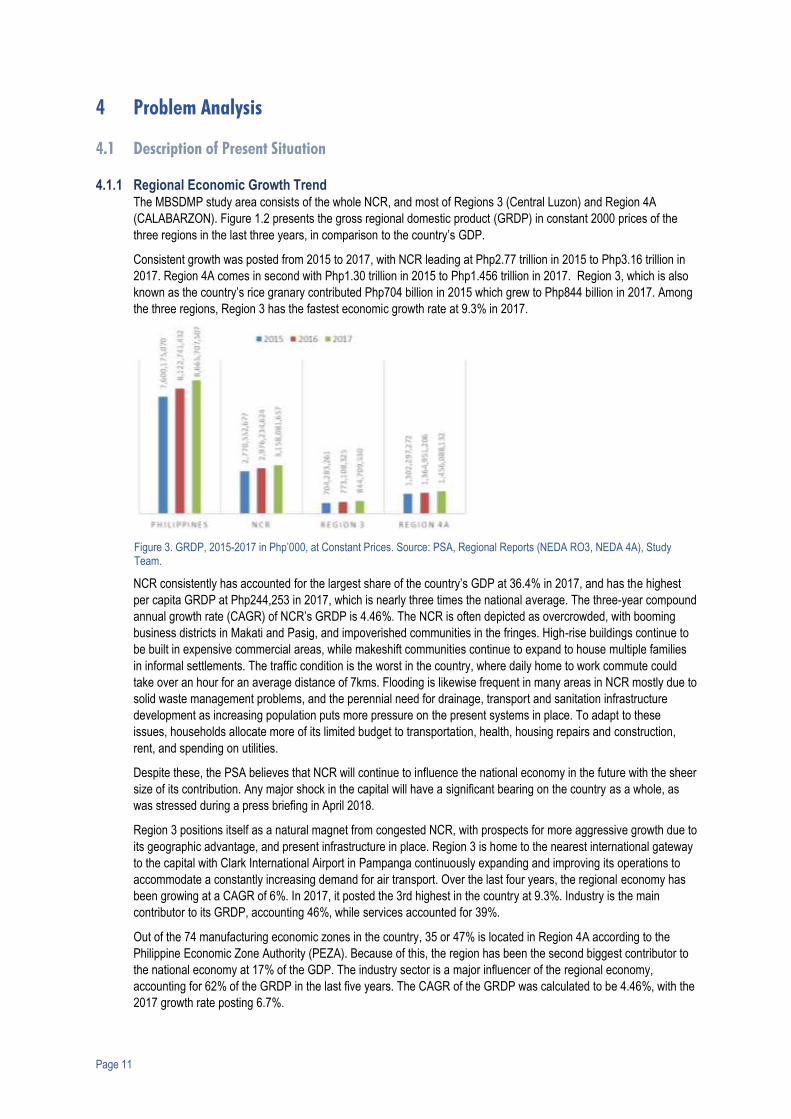
4.1.1 Regional Economic Growth Trend The MBSDMP study area consists of the whole NCR, and most of Regions 3 (Central Luzon) and Region 4A
(CALABARZON). Figure 1.2 presents the gross regional domestic product (GRDP) in constant 2000 prices of the
three regions in the last three years, in comparison to the country’s GDP.
Consistent growth was posted from 2015 to 2017, with NCR leading at Php2.77 trillion in 2015 to Php3.16 trillion in
2017. Region 4A comes in second with Php1.30 trillion in 2015 to Php1.456 trillion in 2017. Region 3, which is also
known as the country’s rice granary contributed Php704 billion in 2015 which grew to Php844 billion in 2017. Among
the three regions, Region 3 has the fastest economic growth rate at 9.3% in 2017.
Figure 3. GRDP, 2015-2017 in Php’000, at Constant Prices. Source: PSA, Regional Reports (NEDA RO3, NEDA 4A), Study Team.
NCR consistently has accounted for the largest share of the country’s GDP at 36.4% in 2017, and has the highest
per capita GRDP at Php244,253 in 2017, which is nearly three times the national average. The three-year compound
annual growth rate (CAGR) of NCR’s GRDP is 4.46%. The NCR is often depicted as overcrowded, with booming
business districts in Makati and Pasig, and impoverished communities in the fringes. High-rise buildings continue to
be built in expensive commercial areas, while makeshift communities continue to expand to house multiple families
in informal settlements. The traffic condition is the worst in the country, where daily home to work commute could
take over an hour for an average distance of 7kms. Flooding is likewise frequent in many areas in NCR mostly due to
solid waste management problems, and the perennial need for drainage, transport and sanitation infrastructure
development as increasing population puts more pressure on the present systems in place. To adapt to these
issues, households allocate more of its limited budget to transportation, health, housing repairs and construction,
rent, and spending on utilities.
Despite these, the PSA believes that NCR will continue to influence the national economy in the future with the sheer
size of its contribution. Any major shock in the capital will have a significant bearing on the country as a whole, as
was stressed during a press briefing in April 2018.
Region 3 positions itself as a natural magnet from congested NCR, with prospects for more aggressive growth due to
its geographic advantage, and present infrastructure in place. Region 3 is home to the nearest international gateway
to the capital with Clark International Airport in Pampanga continuously expanding and improving its operations to
accommodate a constantly increasing demand for air transport. Over the last four years, the regional economy has
been growing at a CAGR of 6%. In 2017, it posted the 3rd highest in the country at 9.3%. Industry is the main
contributor to its GRDP, accounting 46%, while services accounted for 39%.
Out of the 74 manufacturing economic zones in the country, 35 or 47% is located in Region 4A according to the
Philippine Economic Zone Authority (PEZA). Because of this, the region has been the second biggest contributor to
the national economy at 17% of the GDP. The industry sector is a major influencer of the regional economy,
accounting for 62% of the GRDP in the last five years. The CAGR of the GRDP was calculated to be 4.46%, with the
2017 growth rate posting 6.7%.
FOCAL THEME REPORT | INCLUSIVE GROWTH
December 2018
Page 12
4.1.2 Performance of the Local Economy In 1991, the country adopted the ground breaking Local Government Code (RA 7160), which, among others,
authorized and encouraged LGUs to create revenues within its legal bounds, to fund its own economic development,
and ease the burden of the national government. Nearly three decades later, dependence on the internal revenue
allotments (IRA) have remained high. The IRA is an intergovernmental fiscal transfer (IFT) that allows LGUs to carry
out functions that are decentralized to them. Data from the Bureau of Local Government Finance (BLGF) shows that
IRA has historically been increasing compared with the LGUs' own-source revenues or locally generated income.
The mandated 40% allocation from the internal revenue tax collections of the national government is the primary
source of this increase.
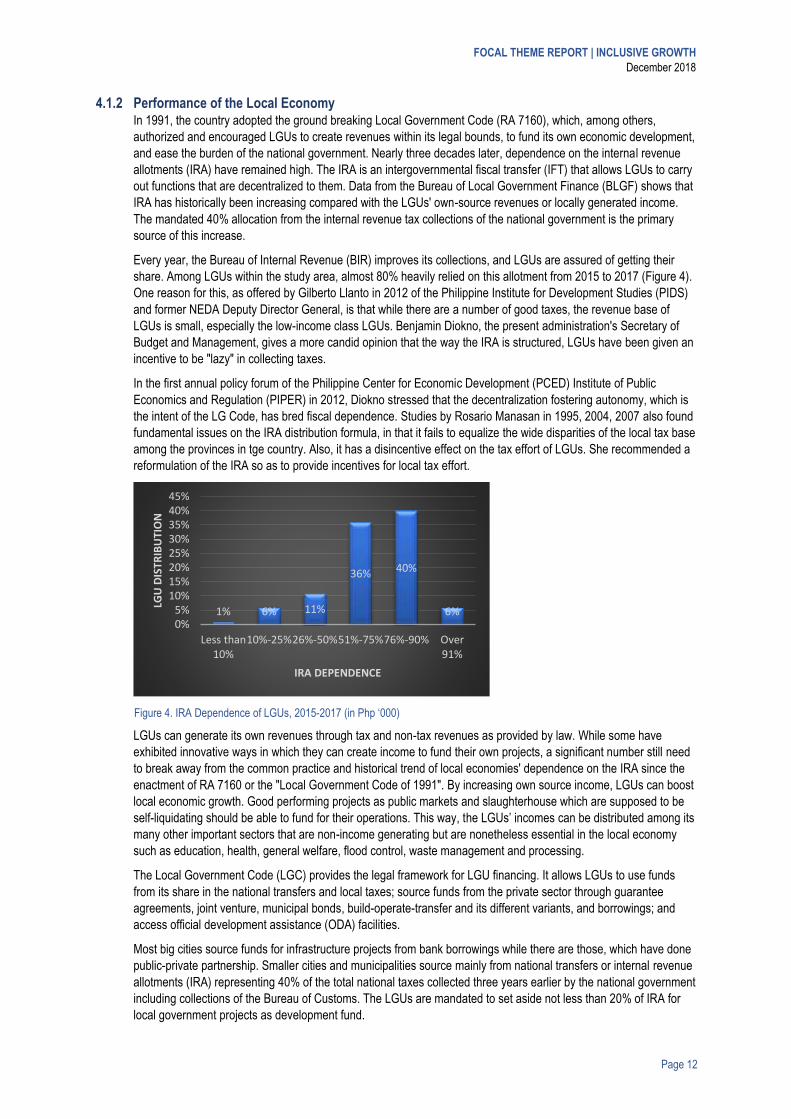
Every year, the Bureau of Internal Revenue (BIR) improves its collections, and LGUs are assured of getting their
share. Among LGUs within the study area, almost 80% heavily relied on this allotment from 2015 to 2017 (Figure 4).
One reason for this, as offered by Gilberto Llanto in 2012 of the Philippine Institute for Development Studies (PIDS)
and former NEDA Deputy Director General, is that while there are a number of good taxes, the revenue base of
LGUs is small, especially the low-income class LGUs. Benjamin Diokno, the present administration's Secretary of
Budget and Management, gives a more candid opinion that the way the IRA is structured, LGUs have been given an
incentive to be "lazy" in collecting taxes.
In the first annual policy forum of the Philippine Center for Economic Development (PCED) Institute of Public
Economics and Regulation (PIPER) in 2012, Diokno stressed that the decentralization fostering autonomy, which is
the intent of the LG Code, has bred fiscal dependence. Studies by Rosario Manasan in 1995, 2004, 2007 also found
fundamental issues on the IRA distribution formula, in that it fails to equalize the wide disparities of the local tax base
among the provinces in tge country. Also, it has a disincentive effect on the tax effort of LGUs. She recommended a
reformulation of the IRA so as to provide incentives for local tax effort.
Figure 4. IRA Dependence of LGUs, 2015-2017 (in Php ‘000)
LGUs can generate its own revenues through tax and non-tax revenues as provided by law. While some have
exhibited innovative ways in which they can create income to fund their own projects, a significant number still need
to break away from the common practice and historical trend of local economies' dependence on the IRA since the
enactment of RA 7160 or the "Local Government Code of 1991". By increasing own source income, LGUs can boost
local economic growth. Good performing projects as public markets and slaughterhouse which are supposed to be
self-liquidating should be able to fund for their operations. This way, the LGUs’ incomes can be distributed among its
many other important sectors that are non-income generating but are nonetheless essential in the local economy
such as education, health, general welfare, flood control, waste management and processing.
The Local Government Code (LGC) provides the legal framework for LGU financing. It allows LGUs to use funds
from its share in the national transfers and local taxes; source funds from the private sector through guarantee
agreements, joint venture, municipal bonds, build-operate-transfer and its different variants, and borrowings; and
access official development assistance (ODA) facilities.
Most big cities source funds for infrastructure projects from bank borrowings while there are those, which have done
public-private partnership. Smaller cities and municipalities source mainly from national transfers or internal revenue
allotments (IRA) representing 40% of the total national taxes collected three years earlier by the national government
including collections of the Bureau of Customs. The LGUs are mandated to set aside not less than 20% of IRA for
local government projects as development fund.
1% 6% 11%
36% 40%
6%0%5%
10%15%20%25%30%35%40%45%
Less than10%
10%-25%26%-50%51%-75%76%-90% Over91%
LGU
DIS
TRIB
UTI
ON
IRA DEPENDENCE
Page 13
For climate change adaptation/mitigation and disaster risk reduction and management related projects, there are two
very specific funds that are mandated by Congress to be made available to local governments: (1) People’s Survival
Fund (PSF) - Republic Act No. 10174, an Act establishing the people's survival fund to provide long-term finance
streams to enable the government to effectively address the problem of Climate Change, amending for the purpose
Republic Act No. 9729, Otherwise known as the "Climate Change Act of 2009"; and (2) Local Disaster Risk
Reduction and Management Fund (LDRRMF) - R.A, No. 10121, Philippines Disaster Risk Reduction and
Management Act of 2010. The Act mandates that not less than five percent (5%) of the estimated revenue from
regular sources shall be set aside as the LDRRMF to support disaster risk management activities such as, but not
limited to, pre-disaster preparedness programs including training, purchasing life-saving rescue equipment, supplies
and medicines, for post-disaster activities, and for the payment of premiums on calamity insurance. The LDRRMF
shall cover 30% allocation for quick response, and 70% for disaster prevention, preparedness, response,
rehabilitation, and recovery.
Local governments may also impose environmental or green taxes. These are taxes on economic activities that
negatively impact the environment (e.g. pollution), collected for interventions that result in a direct positive
environmental impact. The proceeds can be directly invested in sustainable projects. This is being levied by some
LGUs for users of tourism or resort facilities.
4.1.3 Population and Poverty Metro Manila is characterized by a daytime population, 25% higher during the day than during the night. This creates
much higher demand of transport and other public services during the day and peak times. There are no official
surveys conducted to capture daytime population. The swelling of the Metro Manila population during the day is due
to the influx of workers and students from the neighbouring provinces of Cavite, Laguna, Rizal, Bulacan, and
Pampanga, all within the MB basin area. The PSA just recently launched the National Migration Survey, which
should provide important statistics regarding movement of people across regions and across countries.
The trend is that population growth will continue, at least for the next 10 years and if there are no limits to
immigration or no policies on residencies; as all the opportunities are concentrated in Manila. A large number of
people, especially young people, come to Manila to their relatives for studies and work. This has been the trends for
many years, even though there have been plans such as the DENR program and the program of other governments
agencies that provided opportunities of work outside of Manila.
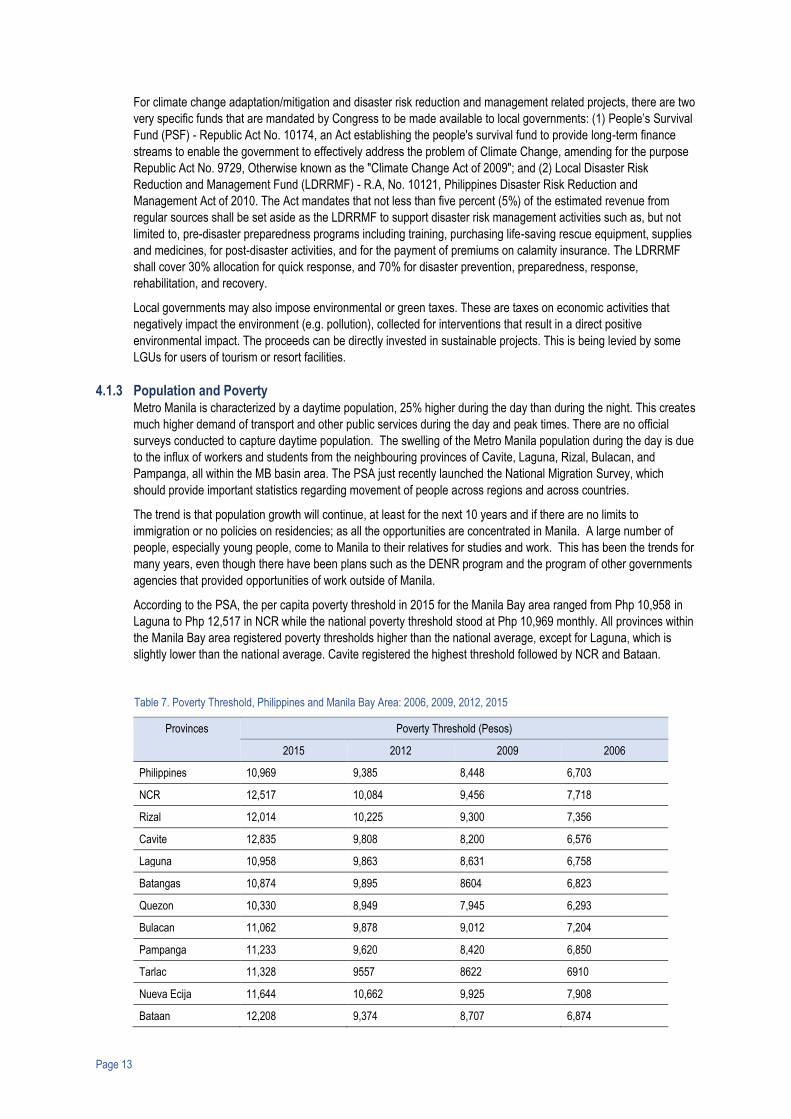
According to the PSA, the per capita poverty threshold in 2015 for the Manila Bay area ranged from Php 10,958 in
Laguna to Php 12,517 in NCR while the national poverty threshold stood at Php 10,969 monthly. All provinces within
the Manila Bay area registered poverty thresholds higher than the national average, except for Laguna, which is
slightly lower than the national average. Cavite registered the highest threshold followed by NCR and Bataan.
Table 7. Poverty Threshold, Philippines and Manila Bay Area: 2006, 2009, 2012, 2015
Provinces Poverty Threshold (Pesos)
2015 2012 2009 2006
Philippines 10,969 9,385 8,448 6,703
NCR 12,517 10,084 9,456 7,718
Rizal 12,014 10,225 9,300 7,356
Cavite 12,835 9,808 8,200 6,576
Laguna 10,958 9,863 8,631 6,758
Batangas 10,874 9,895 8604 6,823
Quezon 10,330 8,949 7,945 6,293
Bulacan 11,062 9,878 9,012 7,204
Pampanga 11,233 9,620 8,420 6,850
Tarlac 11,328 9557 8622 6910
Nueva Ecija 11,644 10,662 9,925 7,908
Bataan 12,208 9,374 8,707 6,874
FOCAL THEME REPORT | INCLUSIVE GROWTH
December 2018
Page 14
Provinces Poverty Threshold (Pesos)
2015 2012 2009 2006
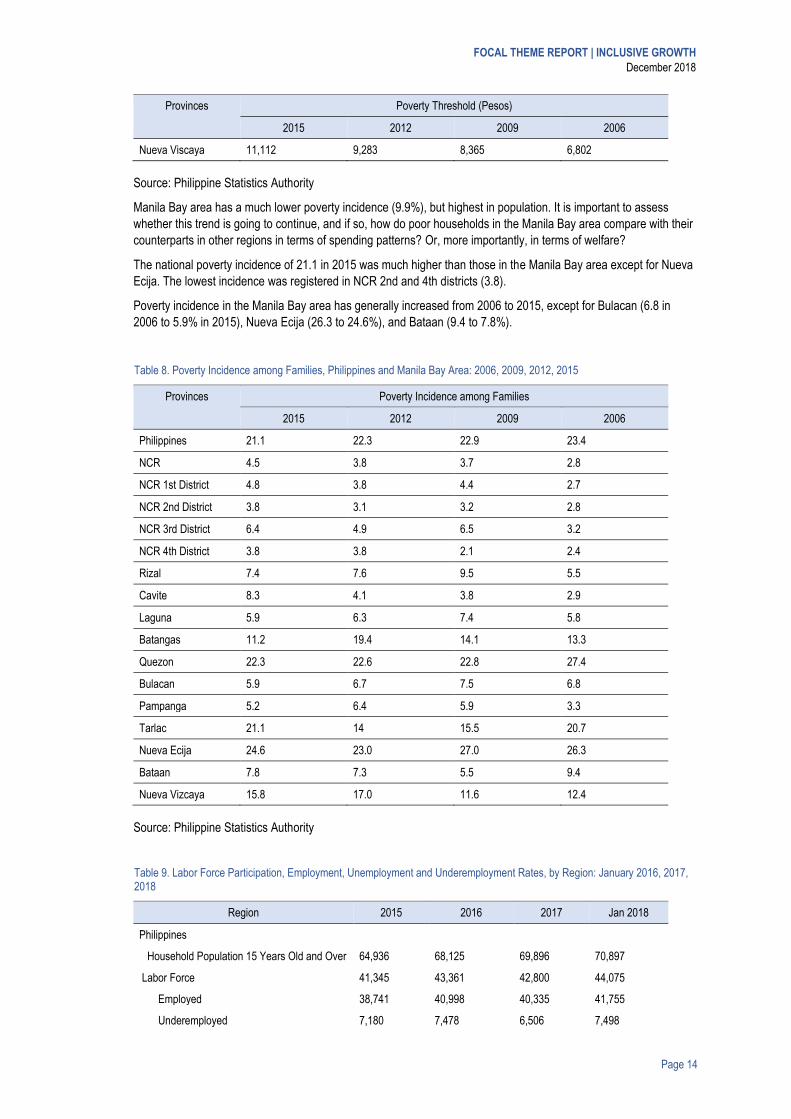
Nueva Viscaya 11,112 9,283 8,365 6,802
Source: Philippine Statistics Authority
Manila Bay area has a much lower poverty incidence (9.9%), but highest in population. It is important to assess
whether this trend is going to continue, and if so, how do poor households in the Manila Bay area compare with their
counterparts in other regions in terms of spending patterns? Or, more importantly, in terms of welfare?
The national poverty incidence of 21.1 in 2015 was much higher than those in the Manila Bay area except for Nueva
Ecija. The lowest incidence was registered in NCR 2nd and 4th districts (3.8).
Poverty incidence in the Manila Bay area has generally increased from 2006 to 2015, except for Bulacan (6.8 in
2006 to 5.9% in 2015), Nueva Ecija (26.3 to 24.6%), and Bataan (9.4 to 7.8%).
Table 8. Poverty Incidence among Families, Philippines and Manila Bay Area: 2006, 2009, 2012, 2015
Provinces Poverty Incidence among Families
2015 2012 2009 2006
Philippines 21.1 22.3 22.9 23.4
NCR 4.5 3.8 3.7 2.8
NCR 1st District 4.8 3.8 4.4 2.7
NCR 2nd District 3.8 3.1 3.2 2.8
NCR 3rd District 6.4 4.9 6.5 3.2
NCR 4th District 3.8 3.8 2.1 2.4
Rizal 7.4 7.6 9.5 5.5
Cavite 8.3 4.1 3.8 2.9
Laguna 5.9 6.3 7.4 5.8
Batangas 11.2 19.4 14.1 13.3
Quezon 22.3 22.6 22.8 27.4
Bulacan 5.9 6.7 7.5 6.8
Pampanga 5.2 6.4 5.9 3.3
Tarlac 21.1 14 15.5 20.7
Nueva Ecija 24.6 23.0 27.0 26.3
Bataan 7.8 7.3 5.5 9.4
Nueva Vizcaya 15.8 17.0 11.6 12.4
Source: Philippine Statistics Authority
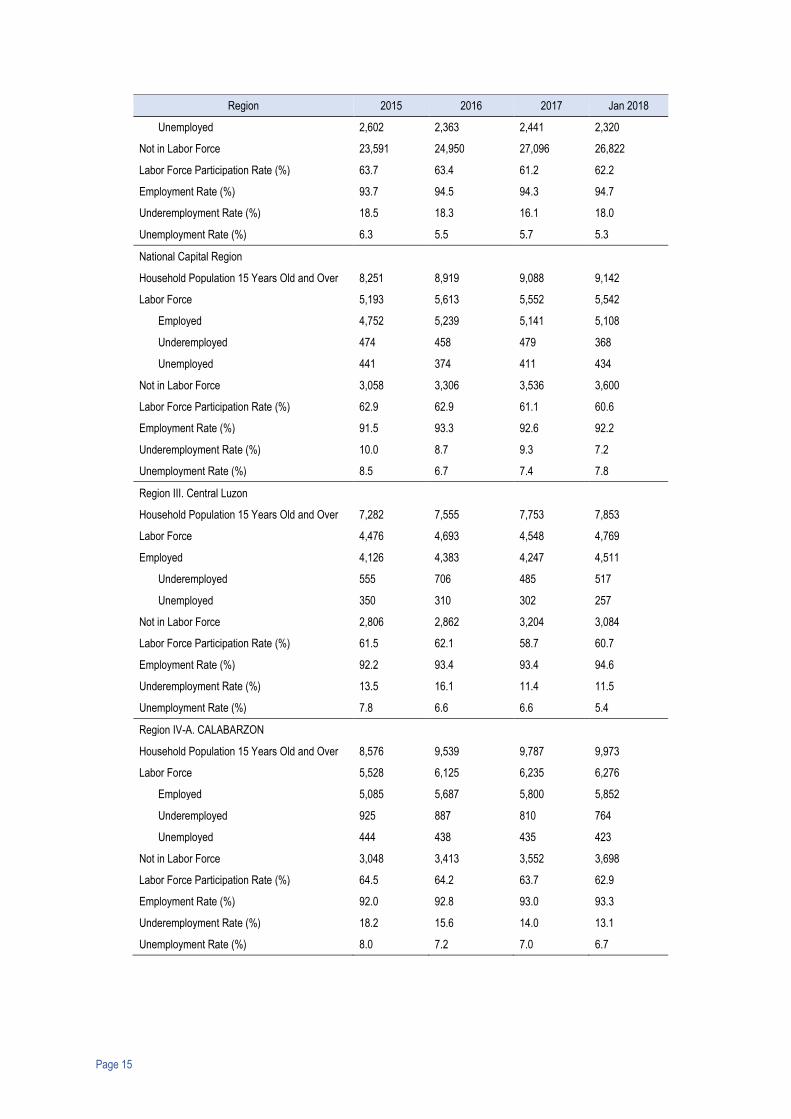
Table 9. Labor Force Participation, Employment, Unemployment and Underemployment Rates, by Region: January 2016, 2017, 2018
Region 2015 2016 2017 Jan 2018
Philippines
Household Population 15 Years Old and Over 64,936 68,125 69,896 70,897
Labor Force 41,345 43,361 42,800 44,075
Employed 38,741 40,998 40,335 41,755
Underemployed 7,180 7,478 6,506 7,498
Page 15
Region 2015 2016 2017 Jan 2018
Unemployed 2,602 2,363 2,441 2,320
Not in Labor Force 23,591 24,950 27,096 26,822
Labor Force Participation Rate (%) 63.7 63.4 61.2 62.2
Employment Rate (%) 93.7 94.5 94.3 94.7
Underemployment Rate (%) 18.5 18.3 16.1 18.0
Unemployment Rate (%) 6.3 5.5 5.7 5.3
National Capital Region
Household Population 15 Years Old and Over 8,251 8,919 9,088 9,142
Labor Force 5,193 5,613 5,552 5,542
Employed 4,752 5,239 5,141 5,108
Underemployed 474 458 479 368
Unemployed 441 374 411 434
Not in Labor Force 3,058 3,306 3,536 3,600
Labor Force Participation Rate (%) 62.9 62.9 61.1 60.6
Employment Rate (%) 91.5 93.3 92.6 92.2
Underemployment Rate (%) 10.0 8.7 9.3 7.2
Unemployment Rate (%) 8.5 6.7 7.4 7.8
Region III. Central Luzon
Household Population 15 Years Old and Over 7,282 7,555 7,753 7,853
Labor Force 4,476 4,693 4,548 4,769
Employed 4,126 4,383 4,247 4,511
Underemployed 555 706 485 517
Unemployed 350 310 302 257
Not in Labor Force 2,806 2,862 3,204 3,084
Labor Force Participation Rate (%) 61.5 62.1 58.7 60.7
Employment Rate (%) 92.2 93.4 93.4 94.6
Underemployment Rate (%) 13.5 16.1 11.4 11.5
Unemployment Rate (%) 7.8 6.6 6.6 5.4
Region IV-A. CALABARZON
Household Population 15 Years Old and Over 8,576 9,539 9,787 9,973
Labor Force 5,528 6,125 6,235 6,276
Employed 5,085 5,687 5,800 5,852
Underemployed 925 887 810 764
Unemployed 444 438 435 423
Not in Labor Force 3,048 3,413 3,552 3,698
Labor Force Participation Rate (%) 64.5 64.2 63.7 62.9
Employment Rate (%) 92.0 92.8 93.0 93.3
Underemployment Rate (%) 18.2 15.6 14.0 13.1
Unemployment Rate (%) 8.0 7.2 7.0 6.7
FOCAL THEME REPORT | INCLUSIVE GROWTH
December 2018
Page 16
4.1.4 Underground Economy or the Informal Sector A 2002 World Bank study estimated the size of informal sector or the underground economy in 104 countries.
Georgia topped the list with 67.3% of the GDP, while Canada is at the bottom with 3%. In the study, the Philippines
was 22nd on the list with an estimated 43% of the total economy. With the MB area influencing 63% of the total
GDP, it is possible that underground economy is as much as 27%.
Excluding illegal goods and services such as drugs and smuggled items, the informal sector consists of businesses
engaged in selling goods and services, the transactions of which are deliberately hidden from government accounts
to avoid payment of taxes and compliance with related regulations. In other words, these are businesses that do not
support government programs through taxes and other fees. However, the underground business serves a purpose.
It has supported the unemployed and the poor, and contributes vibrantly to consumer spending, which, in turn boosts
the economy. This lifeline is important in a way that it provides food for the penniless, various odd jobs that serve as
(temporary) employment for people to support their own needs.
4.1.5 Public Investment Programs The Public Investment Program (PIP) 2017-2022 identifies the rolling list of priority programs and projects (PAPs) to
be implemented by national government agencies (NGAs), government-owned and controlled corporations
(GOCCs), government financial institutions (GFIs), and other national government offices and instrumentalities within
the medium term. These projects are deemed to contribute to the achievement of the societal goal and targets in the
Philippine Development Plan (PDP) 2017-2022 and responsive to the outcomes and outputs in its accompanying
Results Matrices (RM).
The Omnibus Investment Code being implemented by the Department of Trade and Industry-Board of Investment
(DTI-BOI) provide a comprehensive set of incentives for local and foreign enterprises engaged in public services,
specifically activities considered as priority for national development.
The Philippines has robust experience on PPPs. The government has engaged the private sector in the last 30 years
in various sectors such as transport, power, water, education, property development, information technology, among
others. Continued keen interest in government projects by the private sector has been observed in the numerous
unsolicited proposals submitted to various agencies of government including local governments in support of the
current administration’s “Build Build Build” program. As evidence of the country’s long experience in PPPs, the
Philippine government in recent years has awarded projects with estimated project cost of over PhP200 billion under
the Amended BOT Law (RA 7718), the NEDA JV Guidelines and BCDA JV Guidelines. These projects were able to
source funding from local and foreign banks with ease.
Despite a few unwanted experiences in PPP concession contracts such as the NAIA-3 Concession Agreement, the
long ongoing arbitration of the MRT3 Build-Lease-Transfer (BLT) Agreement1, the ongoing arbitration on water
concessions in relation to tariff issues and contracts, including the legal framework governing these projects, in most
cases, PPP programs have minimized risk for government. The market risk is absorbed in full by the private sector.
Under all of these investment programs, immediate benefits such as employment generation are expected. Jobs
propel the economy through a more vibrant consumer spending. But long-term effects of these big-ticket projects
must aim to contribute to inclusive growth. How projects will be evaluated by the government and then designed and
operated by the private sector will be critical and must be well-guided by a strategic plan for Manila Bay.
4.1.6 Transport The Greater Capital Region (GCR), comprising of NCR, and parts of Region 3 and 4A --- or the MB area, remains to
be the lifeblood of the whole country, where major economic activities: trade, education, finance, government,
employment and industries are located. Within such a limited space, accelerated and unbridled urbanization has led
to construction of mixed-use high-rise educational, commercial and residential spaces. Worsened by decades of
infrastructure backlog, lack of quality infrastructure, and inconsistency in the implementation of master plans, the
traffic situation causes the public to contend with arduous daily commute through pedestrian-unfriendly and unsafe
streets.
1 The arbitration proceedings in Singapore involving the MRT Dev.Corp’s development-rights payment (DRP) obligations amounting to P2.3 billion pesos remains to be resolved. Pending this payment, DOTr refused to issue access and work permits to MRTDC in the MRT-3 system. In August 2018, the Court of Appeals affirmed the ruling to bar MRTDC from exercising advertising and commercial leasing rights at the MRT-3 system pending the arbitration results.
Page 17
A city’s transportation system is a key and effective reallocator of spaces for economic and social activities. Land use
and transport systems feed into each other, meaning a change in transport systems brings about a change in land
use and likewise, a change in land use brings about a change in transport systems.
The Ambisyon Natin 2040 survey indicate that Filipinos desire the freedom to go where they want, and that Filipinos
dream of owning at least one vehicle. If we look at other economies’ experiences, underlying the desire of being free
to go anywhere is more achievable with cheaper and more convenient public mass transport system. Jim Miara said,
"Traffic congestion has increased so much in virtually every metropolitan area that two-hour commutes now are
routine. Attempts to alleviate the problem by constructing more highways almost always have led to more sprawl
and, eventually, more congestion." Vehicles need fuel and parking spaces, both of which will impact on the car
owners’ net disposable income. Likewise, they will also impact the environment.
Evidently, unbridled urbanization, increasing car dependence, uncontrolled increase of informal settlers, influx of
jobseekers from the provinces, and economic growth all contribute to unmet demand and inadequate supply of
efficient transport in the study area.
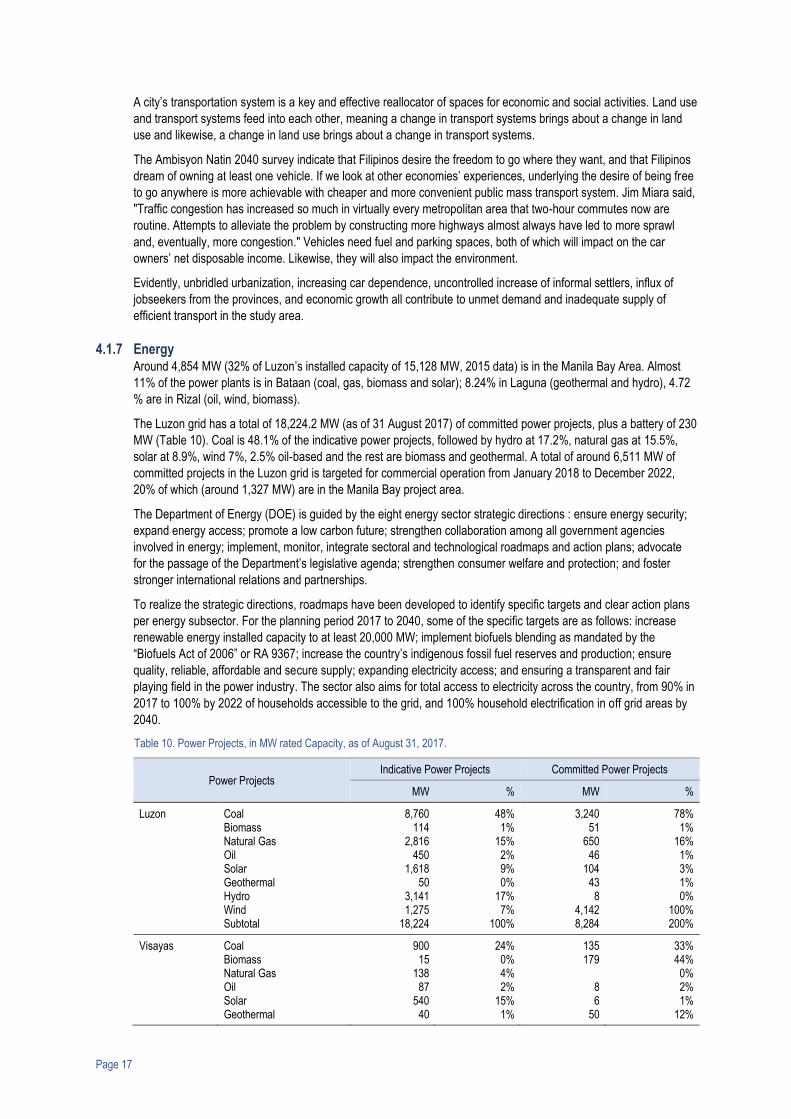
4.1.7 Energy Around 4,854 MW (32% of Luzon’s installed capacity of 15,128 MW, 2015 data) is in the Manila Bay Area. Almost
11% of the power plants is in Bataan (coal, gas, biomass and solar); 8.24% in Laguna (geothermal and hydro), 4.72
% are in Rizal (oil, wind, biomass).
The Luzon grid has a total of 18,224.2 MW (as of 31 August 2017) of committed power projects, plus a battery of 230
MW (Table 10). Coal is 48.1% of the indicative power projects, followed by hydro at 17.2%, natural gas at 15.5%,
solar at 8.9%, wind 7%, 2.5% oil-based and the rest are biomass and geothermal. A total of around 6,511 MW of
committed projects in the Luzon grid is targeted for commercial operation from January 2018 to December 2022,
20% of which (around 1,327 MW) are in the Manila Bay project area.
The Department of Energy (DOE) is guided by the eight energy sector strategic directions : ensure energy security;
expand energy access; promote a low carbon future; strengthen collaboration among all government agencies
involved in energy; implement, monitor, integrate sectoral and technological roadmaps and action plans; advocate
for the passage of the Department’s legislative agenda; strengthen consumer welfare and protection; and foster
stronger international relations and partnerships.
To realize the strategic directions, roadmaps have been developed to identify specific targets and clear action plans
per energy subsector. For the planning period 2017 to 2040, some of the specific targets are as follows: increase
renewable energy installed capacity to at least 20,000 MW; implement biofuels blending as mandated by the
“Biofuels Act of 2006” or RA 9367; increase the country’s indigenous fossil fuel reserves and production; ensure
quality, reliable, affordable and secure supply; expanding electricity access; and ensuring a transparent and fair
playing field in the power industry. The sector also aims for total access to electricity across the country, from 90% in
2017 to 100% by 2022 of households accessible to the grid, and 100% household electrification in off grid areas by
2040.
Table 10. Power Projects, in MW rated Capacity, as of August 31, 2017.
Power Projects Indicative Power Projects Committed Power Projects
MW % MW %
Luzon Coal Biomass Natural Gas Oil Solar Geothermal Hydro Wind Subtotal
8,760 114
2,816 450
1,618 50
3,141 1,275
18,224
48% 1%
15% 2% 9% 0%
17% 7%
100%
3,240 51
650 46
104 43 8
4,142 8,284
78% 1%
16% 1% 3% 1% 0%
100% 200%
Visayas Coal Biomass Natural Gas Oil Solar Geothermal
900 15
138 87
540 40
24% 0% 4% 2%
15% 1%
135 179
8 6
50
33% 44% 0% 2% 1%
12%
FOCAL THEME REPORT | INCLUSIVE GROWTH
December 2018
Page 18
Hydro Wind Subtotal
694 1,268 3,681
19% 34%
100%
31
408
8% 0%
100%
Mindanao Coal Biomass Natural Gas Oil Solar Geothermal Hydro Wind Subtotal
1,243 89
45
410 30
750
2,568
48% 3% 0% 2%
16% 1%
29% 0%
100%
1,090 12
30
157
1,289
85% 1% 0% 2% 0% 0%
12% 0%
100%
Philippines Coal Biomass Natural Gas Oil Solar Geothermal Hydro Wind Subtotal
10,903 218
2,954 582
2,567 120
4,585 2,543
24,473
45% 1%
12% 2%
10% 0%
19% 10%
100%
4,465 241 650
84 110
93 196
4,142 9,981
45% 2% 7% 1% 1% 1% 2%
41% 100%
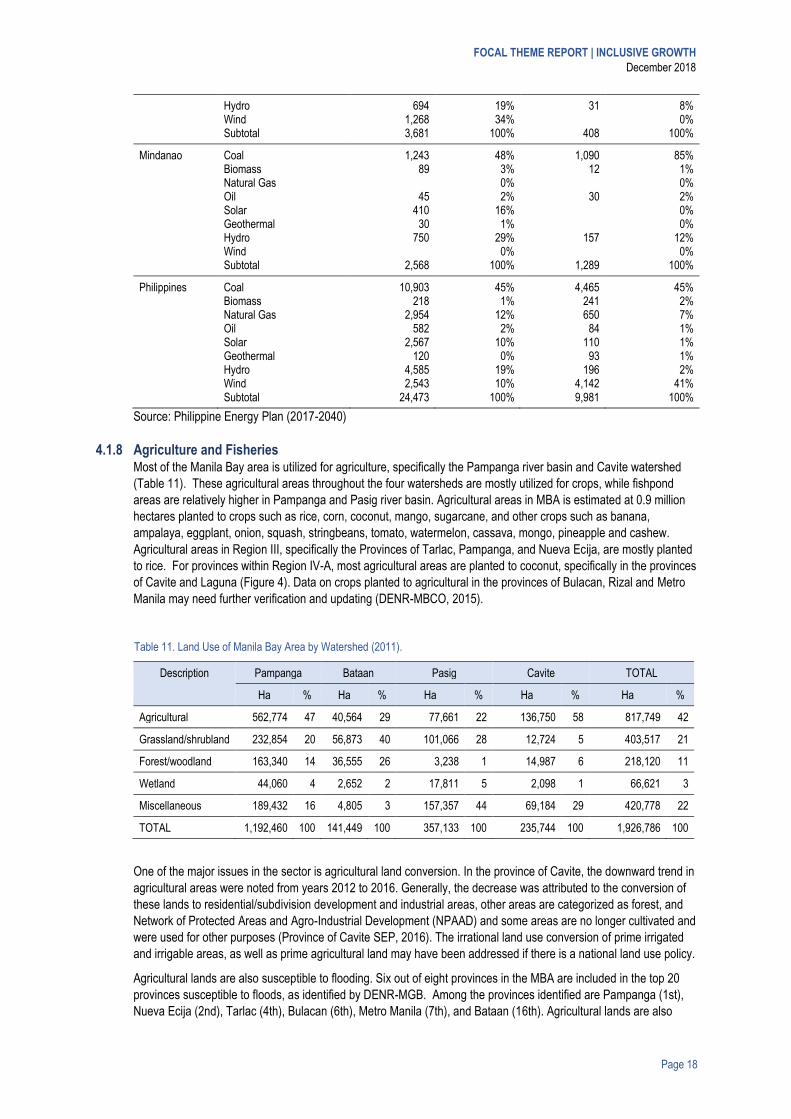
Source: Philippine Energy Plan (2017-2040)
4.1.8 Agriculture and Fisheries Most of the Manila Bay area is utilized for agriculture, specifically the Pampanga river basin and Cavite watershed
(Table 11). These agricultural areas throughout the four watersheds are mostly utilized for crops, while fishpond
areas are relatively higher in Pampanga and Pasig river basin. Agricultural areas in MBA is estimated at 0.9 million
hectares planted to crops such as rice, corn, coconut, mango, sugarcane, and other crops such as banana,
ampalaya, eggplant, onion, squash, stringbeans, tomato, watermelon, cassava, mongo, pineapple and cashew.
Agricultural areas in Region III, specifically the Provinces of Tarlac, Pampanga, and Nueva Ecija, are mostly planted
to rice. For provinces within Region IV-A, most agricultural areas are planted to coconut, specifically in the provinces
of Cavite and Laguna (Figure 4). Data on crops planted to agricultural in the provinces of Bulacan, Rizal and Metro
Manila may need further verification and updating (DENR-MBCO, 2015).
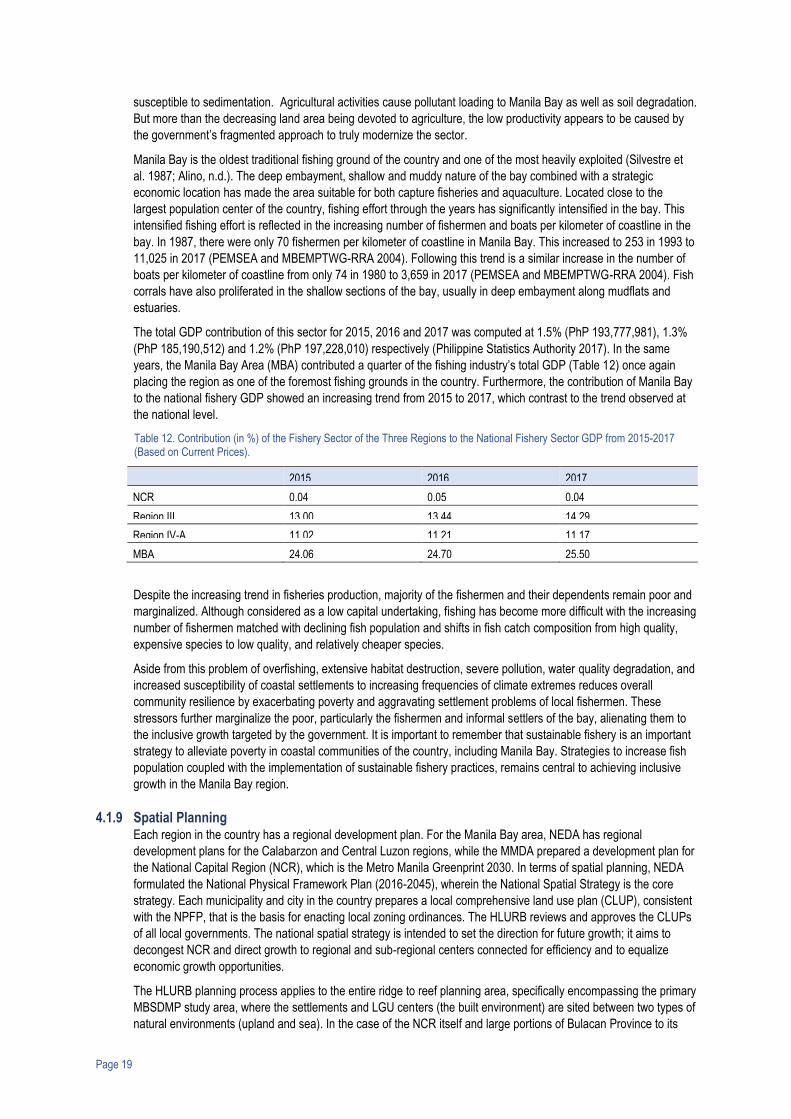
Table 11. Land Use of Manila Bay Area by Watershed (2011).
Description Pampanga Bataan Pasig Cavite TOTAL
Ha % Ha % Ha % Ha % Ha %
Agricultural 562,774 47 40,564 29 77,661 22 136,750 58 817,749 42
Grassland/shrubland 232,854 20 56,873 40 101,066 28 12,724 5 403,517 21
Forest/woodland 163,340 14 36,555 26 3,238 1 14,987 6 218,120 11
Wetland 44,060 4 2,652 2 17,811 5 2,098 1 66,621 3
Miscellaneous 189,432 16 4,805 3 157,357 44 69,184 29 420,778 22
TOTAL 1,192,460 100 141,449 100 357,133 100 235,744 100 1,926,786 100
One of the major issues in the sector is agricultural land conversion. In the province of Cavite, the downward trend in
agricultural areas were noted from years 2012 to 2016. Generally, the decrease was attributed to the conversion of
these lands to residential/subdivision development and industrial areas, other areas are categorized as forest, and
Network of Protected Areas and Agro-Industrial Development (NPAAD) and some areas are no longer cultivated and
were used for other purposes (Province of Cavite SEP, 2016). The irrational land use conversion of prime irrigated
and irrigable areas, as well as prime agricultural land may have been addressed if there is a national land use policy.
Agricultural lands are also susceptible to flooding. Six out of eight provinces in the MBA are included in the top 20
provinces susceptible to floods, as identified by DENR-MGB. Among the provinces identified are Pampanga (1st),
Nueva Ecija (2nd), Tarlac (4th), Bulacan (6th), Metro Manila (7th), and Bataan (16th). Agricultural lands are also
Page 19
susceptible to sedimentation. Agricultural activities cause pollutant loading to Manila Bay as well as soil degradation.
But more than the decreasing land area being devoted to agriculture, the low productivity appears to be caused by
the government’s fragmented approach to truly modernize the sector.
Manila Bay is the oldest traditional fishing ground of the country and one of the most heavily exploited (Silvestre et
al. 1987; Alino, n.d.). The deep embayment, shallow and muddy nature of the bay combined with a strategic
economic location has made the area suitable for both capture fisheries and aquaculture. Located close to the
largest population center of the country, fishing effort through the years has significantly intensified in the bay. This
intensified fishing effort is reflected in the increasing number of fishermen and boats per kilometer of coastline in the
bay. In 1987, there were only 70 fishermen per kilometer of coastline in Manila Bay. This increased to 253 in 1993 to
11,025 in 2017 (PEMSEA and MBEMPTWG-RRA 2004). Following this trend is a similar increase in the number of
boats per kilometer of coastline from only 74 in 1980 to 3,659 in 2017 (PEMSEA and MBEMPTWG-RRA 2004). Fish
corrals have also proliferated in the shallow sections of the bay, usually in deep embayment along mudflats and
estuaries.
The total GDP contribution of this sector for 2015, 2016 and 2017 was computed at 1.5% (PhP 193,777,981), 1.3%
(PhP 185,190,512) and 1.2% (PhP 197,228,010) respectively (Philippine Statistics Authority 2017). In the same
years, the Manila Bay Area (MBA) contributed a quarter of the fishing industry’s total GDP (Table 12) once again
placing the region as one of the foremost fishing grounds in the country. Furthermore, the contribution of Manila Bay
to the national fishery GDP showed an increasing trend from 2015 to 2017, which contrast to the trend observed at
the national level.
Table 12. Contribution (in %) of the Fishery Sector of the Three Regions to the National Fishery Sector GDP from 2015-2017 (Based on Current Prices).
2015 2016 2017
NCR 0.04 0.05 0.04
Region III 13.00 13.44 14.29
Region IV-A 11.02 11.21 11.17
MBA 24.06 24.70 25.50
Despite the increasing trend in fisheries production, majority of the fishermen and their dependents remain poor and
marginalized. Although considered as a low capital undertaking, fishing has become more difficult with the increasing
number of fishermen matched with declining fish population and shifts in fish catch composition from high quality,
expensive species to low quality, and relatively cheaper species.
Aside from this problem of overfishing, extensive habitat destruction, severe pollution, water quality degradation, and
increased susceptibility of coastal settlements to increasing frequencies of climate extremes reduces overall
community resilience by exacerbating poverty and aggravating settlement problems of local fishermen. These
stressors further marginalize the poor, particularly the fishermen and informal settlers of the bay, alienating them to
the inclusive growth targeted by the government. It is important to remember that sustainable fishery is an important
strategy to alleviate poverty in coastal communities of the country, including Manila Bay. Strategies to increase fish
population coupled with the implementation of sustainable fishery practices, remains central to achieving inclusive
growth in the Manila Bay region.
4.1.9 Spatial Planning Each region in the country has a regional development plan. For the Manila Bay area, NEDA has regional
development plans for the Calabarzon and Central Luzon regions, while the MMDA prepared a development plan for
the National Capital Region (NCR), which is the Metro Manila Greenprint 2030. In terms of spatial planning, NEDA
formulated the National Physical Framework Plan (2016-2045), wherein the National Spatial Strategy is the core
strategy. Each municipality and city in the country prepares a local comprehensive land use plan (CLUP), consistent
with the NPFP, that is the basis for enacting local zoning ordinances. The HLURB reviews and approves the CLUPs
of all local governments. The national spatial strategy is intended to set the direction for future growth; it aims to
decongest NCR and direct growth to regional and sub-regional centers connected for efficiency and to equalize
economic growth opportunities.
The HLURB planning process applies to the entire ridge to reef planning area, specifically encompassing the primary
MBSDMP study area, where the settlements and LGU centers (the built environment) are sited between two types of
natural environments (upland and sea). In the case of the NCR itself and large portions of Bulacan Province to its
FOCAL THEME REPORT | INCLUSIVE GROWTH
December 2018
Page 20
immediate north, the same have been generally characterized as huge floodplains, which are perennially (if not
perpetually) subjected to flash-flooding and inundation, exacerbated of course by over- development at the landside
portions (i.e. the sites of settlements and LGU centers), most commonly manifested by over-building, over-paving,
the massive/ continuing illegal reclamation of inland waterways (that unlawfully convert the mandated legal
easements into private property) and related practices that are actually covered by a plethora of development
controls (DCs), the implementation and enforcement of which leaves so much to be desired.
Some of the concerns are rapid urban growth, increasing unemployment and limited economic growth, lack of urban
basic services, ineffective urban planning and land management, and vulnerability of the urban poor. Other issues
that are worth-noting within the planning area are: lack of open spaces, land use inefficiency, over-building, over-
paving and flooding.
4.1.10 Smart City Development and the Adoption of ASEAN Smart Cities Network (ASCN) Framework
An emerging global trend that can significantly enhance capabilities is the development of Smart Cities. Smart City Development involves the use of Information and Communications Technology (ICT) to better inform decisions with regard to city development which in turn leads to improved quality of life of citizens, particularly those in urban areas. Noting that the NCR is primarily urban, Smart City Development can greatly benefit the region and its surrounding areas (i.e., Regions III and IV-A). On the Regional Front, it may be noted that the ASEAN recently adopted the ASCN framework. The ASCN is a platform which helps ASEAN Member State (AMS) gain from the technical and financial capabilities for Smart City Development.
4.2 System analysis: Drivers and Outcomes of Inequitable Growth To understand what it will take to achieve inclusive growth in the MBA, an analysis of the drivers and outcomes of
inequitable growth that now prevail is conducted and encapsulated in Figure 3. Inequitable growth apparently is
driven mainly by the governing policies specifically on where public and private investments on infrastructure and
land development are made. Concentration of investments in a limited region tends to direct the movement of people
and resources towards it that creates problems such as environmental degradation, poverty and human insecurity.
These problems usually have the heaviest impacts on the already poverty stricken and highly vulnerable poor
sectors. However, looking at some key policies including the PDP, the NFPP and the NSS, the spirit of inclusive
growth is palpable with the intent to disperse development in growth centers outside Greater Metro Manila Area
(GMMA) to spread out development opportunities. It is in the execution of these policies where departure from the
real intention to make economic growth equitable originates. Limitations in financial and technical assets as well as
the lack of political will by the LGUs and NGAs, are the common considered reasons why good policies are not
properly implemented.
Natural drivers most specifically climate change and natural disasters such as floods and typhoons undermine the
ability of the poor sectors including the ISFs in capturing development opportunities to improve their quality of life.
Natural drivers also compromise the stability of ecosystems and derail the delivery of vital ecosystem services to
those in most need for livelihood opportunities be it in agriculture, fishery and business, and for protection against
calamities. Natural disasters exacerbate environmental and ecological degradation including water pollution caused
by excessively high population concentration in GMMA and the coastal areas. This is further aggravated by the
inadequate enforcement of regulatory laws on land use and development, and waste management among others.
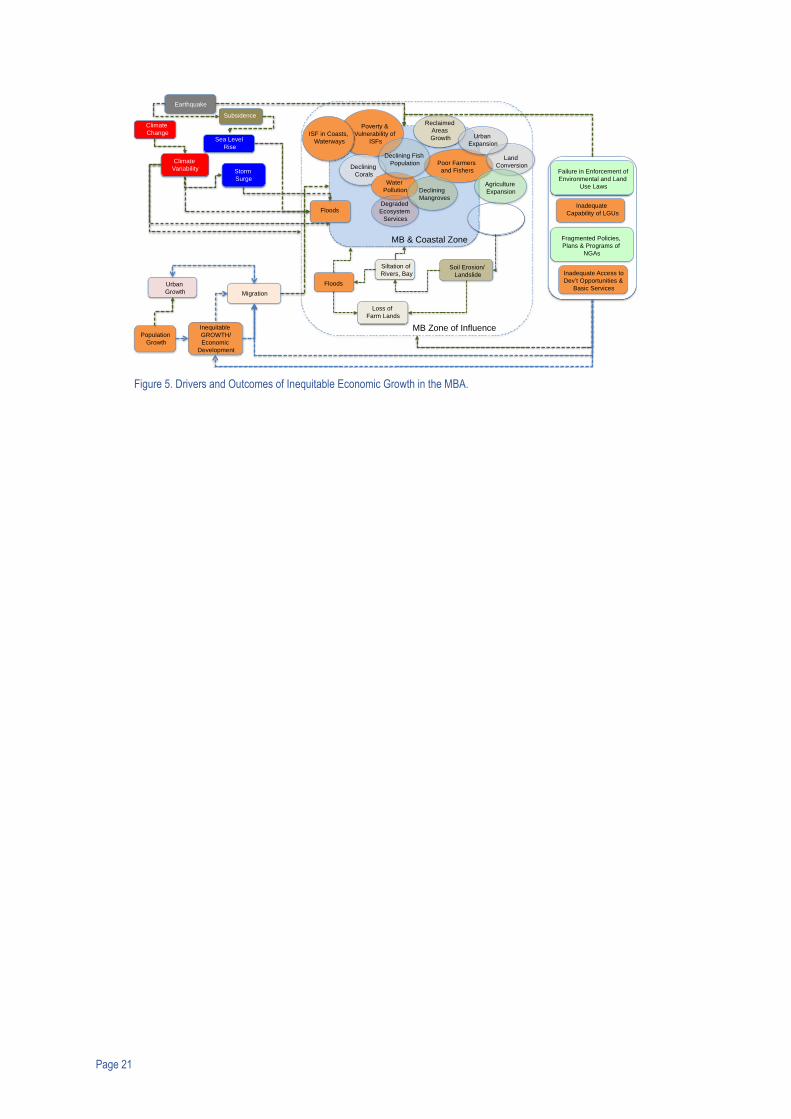
Page 21
Figure 5. Drivers and Outcomes of Inequitable Economic Growth in the MBA.
Poverty &
Vulnerability of
ISFs
ISF in Coasts,
Waterways
Declining
Corals
Reclaimed
Areas
Growth
MB & Coastal Zone
Water
Pollution
Climate
Change
Climate
Variability
Subsidence
Sea Level
Rise
Storm
Surge
Floods
MB Zone of Influence Population
Growth
Migration
Urban
Growth
Earthquake
Soil Erosion/
Landslide
Floods
Siltation of
Rivers, Bay
Loss of
Farm Lands
Deforestation
Inequitable
GROWTH/
Economic
Development
Failure in Enforcement of
Environmental and Land
Use Laws
Inadequate
Capability of LGUs
Fragmented Policies,
Plans & Programs of
NGAs
Degraded
Ecosystem
Services
Poor Farmers
and Fishers
Inadequate Access to
Dev’t Opportunities &
Basic Services
Land
Conversion
Agriculture
Expansion
Urban
Expansion
Declining Fish
Population
Declining
Mangroves
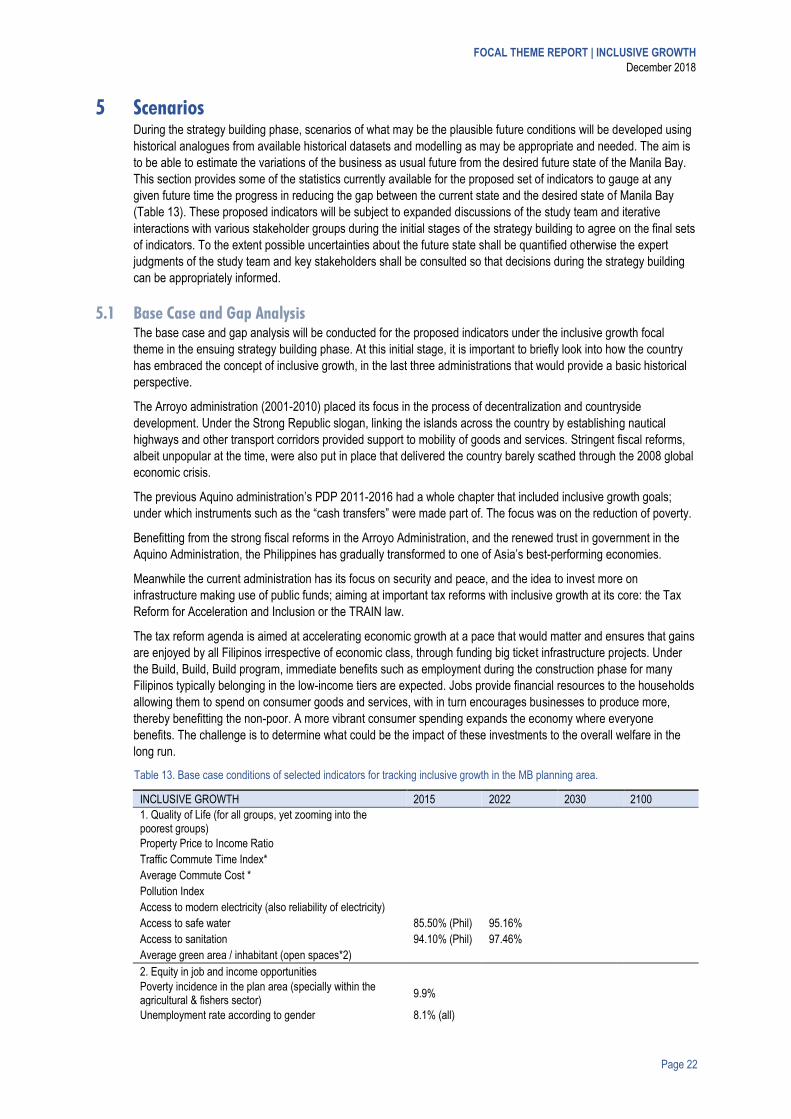
FOCAL THEME REPORT | INCLUSIVE GROWTH
December 2018
Page 22
5 Scenarios During the strategy building phase, scenarios of what may be the plausible future conditions will be developed using
historical analogues from available historical datasets and modelling as may be appropriate and needed. The aim is
to be able to estimate the variations of the business as usual future from the desired future state of the Manila Bay.
This section provides some of the statistics currently available for the proposed set of indicators to gauge at any
given future time the progress in reducing the gap between the current state and the desired state of Manila Bay
(Table 13). These proposed indicators will be subject to expanded discussions of the study team and iterative
interactions with various stakeholder groups during the initial stages of the strategy building to agree on the final sets
of indicators. To the extent possible uncertainties about the future state shall be quantified otherwise the expert
judgments of the study team and key stakeholders shall be consulted so that decisions during the strategy building
can be appropriately informed.
5.1 Base Case and Gap Analysis The base case and gap analysis will be conducted for the proposed indicators under the inclusive growth focal
theme in the ensuing strategy building phase. At this initial stage, it is important to briefly look into how the country
has embraced the concept of inclusive growth, in the last three administrations that would provide a basic historical
perspective.
The Arroyo administration (2001-2010) placed its focus in the process of decentralization and countryside
development. Under the Strong Republic slogan, linking the islands across the country by establishing nautical
highways and other transport corridors provided support to mobility of goods and services. Stringent fiscal reforms,
albeit unpopular at the time, were also put in place that delivered the country barely scathed through the 2008 global
economic crisis.
The previous Aquino administration’s PDP 2011-2016 had a whole chapter that included inclusive growth goals;
under which instruments such as the “cash transfers” were made part of. The focus was on the reduction of poverty.
Benefitting from the strong fiscal reforms in the Arroyo Administration, and the renewed trust in government in the
Aquino Administration, the Philippines has gradually transformed to one of Asia’s best-performing economies.
Meanwhile the current administration has its focus on security and peace, and the idea to invest more on
infrastructure making use of public funds; aiming at important tax reforms with inclusive growth at its core: the Tax
Reform for Acceleration and Inclusion or the TRAIN law.
The tax reform agenda is aimed at accelerating economic growth at a pace that would matter and ensures that gains
are enjoyed by all Filipinos irrespective of economic class, through funding big ticket infrastructure projects. Under
the Build, Build, Build program, immediate benefits such as employment during the construction phase for many
Filipinos typically belonging in the low-income tiers are expected. Jobs provide financial resources to the households
allowing them to spend on consumer goods and services, with in turn encourages businesses to produce more,
thereby benefitting the non-poor. A more vibrant consumer spending expands the economy where everyone
benefits. The challenge is to determine what could be the impact of these investments to the overall welfare in the
long run.
Table 13. Base case conditions of selected indicators for tracking inclusive growth in the MB planning area.
INCLUSIVE GROWTH 2015 2022 2030 2100
1. Quality of Life (for all groups, yet zooming into the poorest groups)
Property Price to Income Ratio
Traffic Commute Time Index*
Average Commute Cost *
Pollution Index
Access to modern electricity (also reliability of electricity)
Access to safe water 85.50% (Phil) 95.16%
Access to sanitation 94.10% (Phil) 97.46%
Average green area / inhabitant (open spaces*2)
2. Equity in job and income opportunities
Poverty incidence in the plan area (specially within the agricultural & fishers sector)
9.9%
Unemployment rate according to gender 8.1% (all)
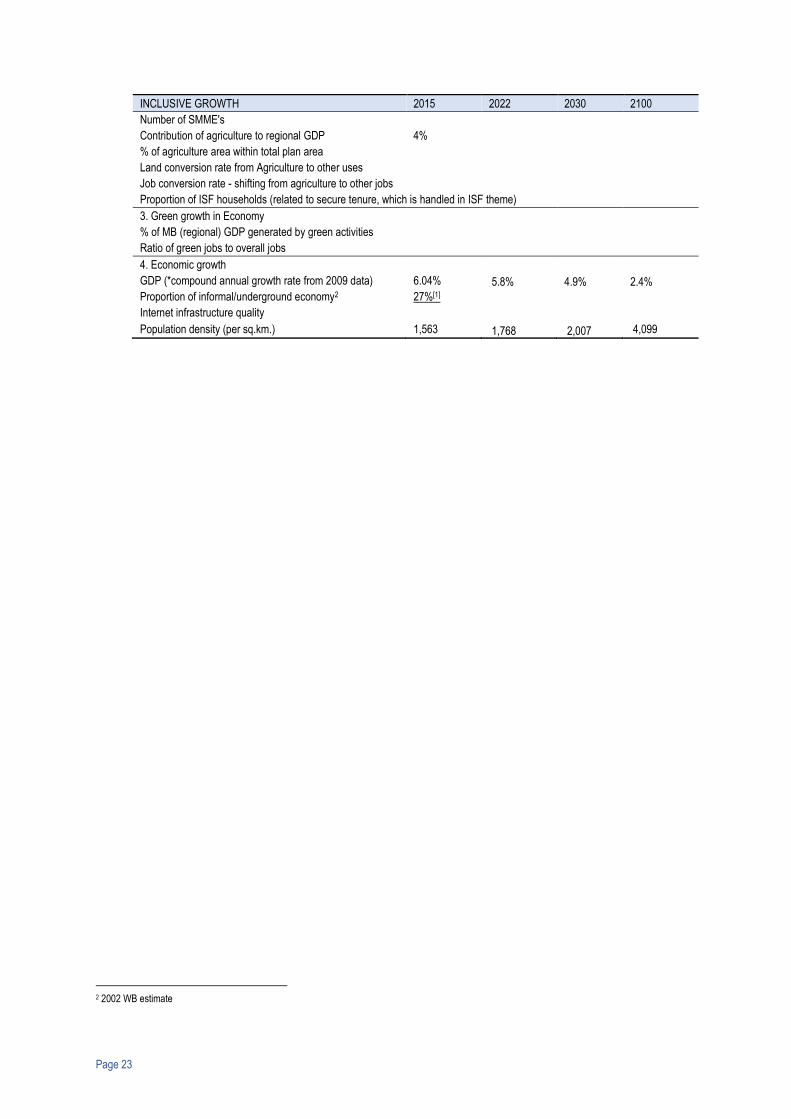
Page 23
INCLUSIVE GROWTH 2015 2022 2030 2100
Number of SMME's
Contribution of agriculture to regional GDP 4%
% of agriculture area within total plan area
Land conversion rate from Agriculture to other uses
Job conversion rate - shifting from agriculture to other jobs
Proportion of ISF households (related to secure tenure, which is handled in ISF theme)
3. Green growth in Economy
% of MB (regional) GDP generated by green activities
Ratio of green jobs to overall jobs
4. Economic growth
GDP (*compound annual growth rate from 2009 data) 6.04% 5.8% 4.9% 2.4%
Proportion of informal/underground economy2 27%[1]
Internet infrastructure quality
Population density (per sq.km.) 1,563 1,768 2,007 4,099
2 2002 WB estimate
FOCAL THEME REPORT | INCLUSIVE GROWTH
December 2018
Page 24
6 Summarizing and Concluding Problem Statement Inclusive growth is an all-encompassing theme. It looks into growth and development through the lens with both
losers and gainers in mind and is income-neutral.
The Manila Bay area is home to one-third of the country’s total population, and it is also a main driver of economic
growth. This underscores the fact that policies, natural environments, economy, and other such factors with direct
impacts on the general populace of the Manila Bay study area can potentially have significant effects on the rest of
the population of Luzon, and the entire country.
Careful regional economic planning will be imperative to sustain the income contributions of these regions to the
country. While stronger economic performance in other regions is warranted for a more robust countryside
development that contribute to the overall economy, it is important that investments in the productive sectors in the
MBSDMP regions be strategic to ensure that the growth momentum is sustained.
How then can inclusive growth be achieved? For example, what is the vision about agriculture? Metro Manila is not
per se the "food bowl", so a decreasing percent of contribution to GDP is not necessarily bad news; it could mean
that people are shifting to other sectors. But Region 3 and Region 4A are major contributors to agricultural output.
And how is the welfare of the remaining people employed in the agricultural sector? When people shift from
agriculture to other more productive sectors happen, must a corresponding decrease in agricultural productivity take
place? Or, can public spending be realigned to target investment on technologies and facilities that can result to the
increase in productivity even despite the decreasing land area devoted to the sector in the planning area? How about
in the fisheries sector? Food security is surely an important concern in inclusive growth.
The Build, Build, Build program seems to consider mostly transport investments that does not always translate into
more inclusive development. Meanwhile investments in infrastructure for waste management and wastewater
treatment management seem to be limited within the BBB program, while these are expected to have a much higher
impact on inclusive growth as defined within the master plan and operationalized in the scorecard presented here.
Whether an infrastructure investment will result in inclusive growth depends to a great degree on the design of the
project and the implementation arrangements and procurement strategy opted for.
6.1 Relationships to Other Focal Themes A diagram to understand the link of one focal theme to another, through smart indicators was created during a 2-day
workshop of the study team (Figure 6). In essence, the diagram illustrates the potential impacts of an intervention in
one sector to the other sectors. All are connected and contribute to an overall metric for inclusive growth, which in
this sample diagram created was the poverty incidence.
6.1.1 Linkage to Upgrading Informal Settlements The Bay is a multiple use water body used for navigation, recreation and fisheries. Many fishing communities who
live along the shorelines of the Bay are among those who live below the poverty line. A substantial number are also
informal settlers. They largely depend on the productivity of the bay for their livelihood and for their own nutrition.
This can be through artisanal fishing or through aquaculture like the culture of mussels.
The pollution of the Bay has led to the reduction in the productivity of the Bay. The catch per level of effort has been
declining meaning less income for the fisherfolks. This reduces their capability to have food on the table, send their
children to school, have access to healthcare and other social services and generally improve the quality of their
lives. At the same time. communities living along the shores of Manila Bay, many of whom are informal settlers are
at risk to health problems due to polluted bay waters. These issues are central to the theme of Inclusive Growth.
6.1.2 Linkage to Ecosystem Protection The most vulnerable groups in the study area depend on the sea and water quality that results to great degree from
ecosystem protection. Agricultural productivity, which includes the fisheries subsector, is highly vulnerable to the
quality of the environment. As the country has been adopting the ridge-to-reef concept of environmental protection, it
is important to note that the most vulnerable and marginalized communities are those that directly work on the earth
or on the waters. Development projects that target ecosystem protection directly impacts on the most vulnerable
groups in the society, and therefore addresses concerns on the inclusivity of development. Moreover, environmental
protection encourages another vibrant sector, which is tourism. Tourism appeals to income classes.
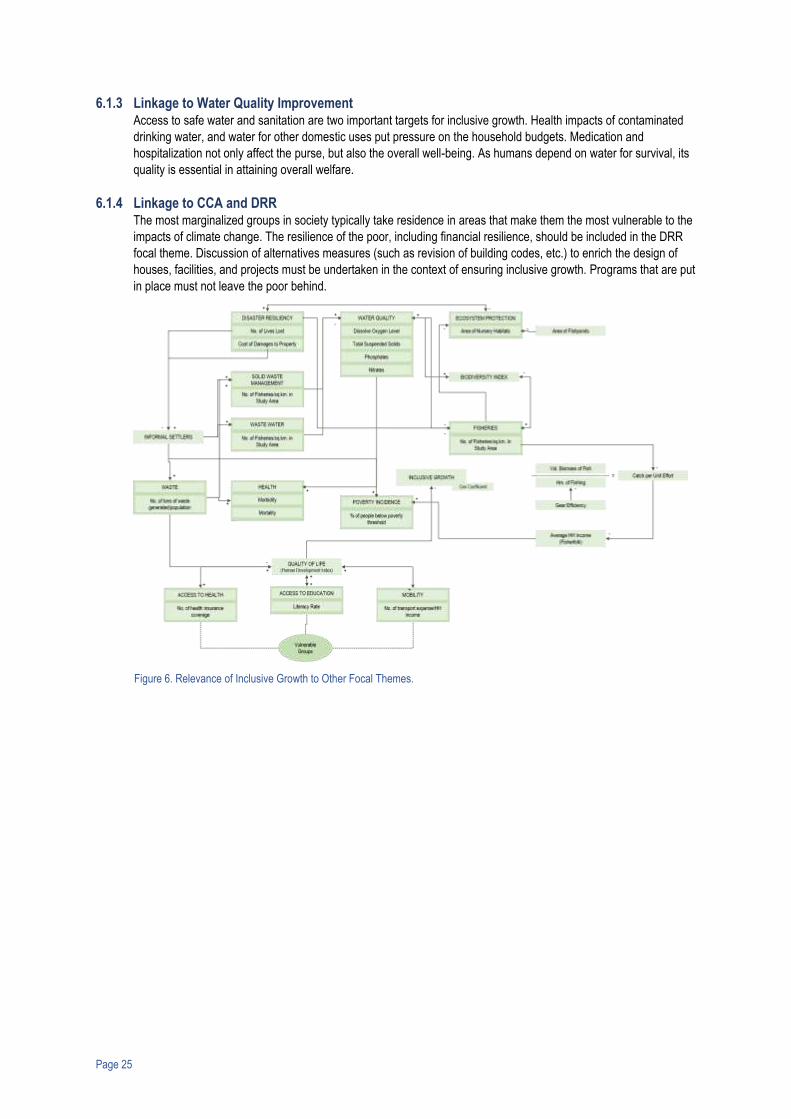
Page 25
6.1.3 Linkage to Water Quality Improvement Access to safe water and sanitation are two important targets for inclusive growth. Health impacts of contaminated
drinking water, and water for other domestic uses put pressure on the household budgets. Medication and
hospitalization not only affect the purse, but also the overall well-being. As humans depend on water for survival, its
quality is essential in attaining overall welfare.
6.1.4 Linkage to CCA and DRR The most marginalized groups in society typically take residence in areas that make them the most vulnerable to the
impacts of climate change. The resilience of the poor, including financial resilience, should be included in the DRR
focal theme. Discussion of alternatives measures (such as revision of building codes, etc.) to enrich the design of
houses, facilities, and projects must be undertaken in the context of ensuring inclusive growth. Programs that are put
in place must not leave the poor behind.
Figure 6. Relevance of Inclusive Growth to Other Focal Themes.