Embed Size (px)
Citation preview
ARTICLESPUBLISHED ONLINE: 14 NOVEMBER 2016 | DOI: 10.1038/NMAT4793
Structure of a model TiO2 photocatalytic interfaceH. Hussain1,2†, G. Tocci1†, T. Woolcot1, X. Torrelles3, C. L. Pang1, D. S. Humphrey1, C. M. Yim1,D. C. Grinter1†, G. Cabailh4, O. Bikondoa5, R. Lindsay6, J. Zegenhagen2†, A. Michaelides1
and G. Thornton1*The interaction of water with TiO2 is crucial to many of its practical applications, including photocatalytic water splitting.Following the first demonstration of this phenomenon 40 years ago there have been numerous studies of the rutile single-crystal TiO2(110) interface with water. This has provided an atomic-level understanding of the water–TiO2 interaction.However, nearly all of the previous studies of water/TiO2 interfaces involve water in the vapour phase. Here, we explorethe interfacial structure between liquid water and a rutile TiO2(110) surface pre-characterized at the atomic level. Scanningtunnelling microscopy and surface X-ray di�raction are used to determine the structure, which is comprised of an orderedarray of hydroxyl molecules withmolecular water in the second layer. Static and dynamic density functional theory calculationssuggest that a possible mechanism for formation of the hydroxyl overlayer involves the mixed adsorption of O2 and H2O ona partially defected surface. The quantitative structural properties derived here provide a basis with which to explore theatomistic properties and hence mechanisms involved in TiO2 photocatalysis.
The generally accepted mechanism of photocatalysis by TiO2involves photoexcitation of electrons from the valence bandto the conduction band by light with energy greater than
the 3 eV bandgap1,2. Holes in the valence band and electronsin the conduction band created by this excitation travel to thesurface where they initiate chemical reactions. For example, theelectrons can reduce water to hydrogen. The potential for harvestinglight in this way to produce a portable fuel in the form ofH2 has motivated the study of technical catalysts. It has alsomotivated the study of model systems in the form of single-crystal surfaces as a route to understanding the nature of thesurface reactions at the atomic and molecular scale. Indeed, theinteraction of water with TiO2 in ultrahigh vacuum (UHV) hasbeen extensively studied (see, for example, refs 1,3–10). This isespecially true for the most commonly explored rutile TiO2(110)surface (depicted in Fig. 1a), which is the lowest energy terminationof rutile11 and hence is the most appropriate model system for atechnical catalyst.
The surface chemistry of water interacting with TiO2(110) underUHV is complex and has been the subject of considerable debate,mostly focusing on the level of water dissociation and the role ofsurface defects (see, for example, refs 1,3–7,10,12). However, manyaspects of the adsorption process have now been established. It isknown, for example, that at room temperature water dissociates atbridging oxygen vacancies (Ob-vac) as well as 〈111〉-oriented steps,producing bridging OH (OHb) groups1,3–7,10,12. These groups can beconverted into terminal OH groups bound to five-fold-coordinatedTi atoms by reaction with O2 (ref. 13).
Although in the past the emphasis has been on studies of thegas-phase H2O interface with TiO2, it is clear that the liquid/solidinterface is more relevant for practical applications. Surface X-ray
diffraction (SXRD) provides a potential means of elucidating thestructure of this model photocatalytic interface at a quantitativelevel. This technique has been used extensively to determinemetal/liquid interfacial structures under electrochemical control14,which allows the metal surface to be cleaned in situ. This procedureis less straightforward for a semiconducting oxide substrate suchas TiO2. There has been a ground-breaking SXRD measurement ofa TiO2(110)/water interface15, and one of the first near-ambient-pressure photoemission measurements investigated the chemicalstates at the interface between TiO2(110) and an ultrathin film ofwater16. However, in both cases a non-standard surface preparationmethod was employed. As for related modelling of the interface,there have been several computational studies of the water interfaceformed by the perfect TiO2(110) surface. The results of thesecalculations are controversial, being centred around the question ofdissociation on the pristine surface17–22.
Here we employ a novel approach to provide the first quantitativestructure of a well-defined metal oxide/water interface, which alsorepresents a model of the interface present in the rutile TiO2photocatalyst. More specifically, we perform both ex situ and in situmeasurements of the liquid water/TiO2 interface in an aerobicenvironment, formed by either temporarily immersing (dipping)a rutile TiO2(110) surface into water or by depositing a waterdroplet, respectively. Here we simplify the model photocatalystto its oxide component in the absence of bandgap light andmetal co-catalyst. However, we note that ultraviolet light does notmodify TiO2(110)23. Moreover, themost effective co-catalyst is well-dispersed Pt nanoparticles24, which are not expected to affect theTiO2(110)/water component. Understanding a simplemodel systemsuch as the one considered here is an essential first step towards thecharacterization of more complex TiO2 photocatalysts.
1London Centre for Nanotechnology and Department of Chemistry, University College London, 20 Gordon Street, London WC1H OAJ, UK. 2ESRF, 6 rueJules Horowitz, F-38000 Grenoble cedex, France. 3Institut de Ciència de Materials de Barcelona (CSIC), Campus UAB, 08193 Bellaterra, Spain. 4SorbonneUniversités, UPMC Univ Paris 06, CNRS-UMR 7588, Institut des NanoSciences de Paris, F-75005 Paris, France. 5Department of Physics, University ofWarwick, Gibbet Hill Road, Coventry C4 7AL, UK. 6Corrosion and Protection Centre, School of Materials, The University of Manchester, Sackville Street,Manchester M13 9PL, UK. †Present addresses: Diamond Light Source Ltd, Diamond House, Harwell Science and Innovation Campus, Didcot OX11 0DE, UK(H.H.); Laboratory for Fundamental BioPhotonics and Laboratory of Computational Science and Modeling, Institutes of Bioengineering and MaterialsScience and Engineering, School of Engineering, and Lausanne Centre for Ultrafast Science, École Polytechnique Fédérale de Lausanne (EPFL), CH-1015Lausanne, Switzerland (G.T.); Chemistry Department, Building 555, Brookhaven National Laboratory, Upton, New York 11973, USA (D.C.G.); Diamond LightSource Ltd, Diamond House, Harwell Science and Innovation Campus, Didcot OX11 0DE, UK (J.Z.). *e-mail: [email protected]
NATUREMATERIALS | ADVANCE ONLINE PUBLICATION | www.nature.com/naturematerials 1
© Macmillan Publishers Limited . All rights reserved
ARTICLES NATUREMATERIALS DOI: 10.1038/NMAT4793
OHb Oad
Ob-vac
OHt
[001]
[110]
[001]
[110]
[001]
[110]
a
b
c
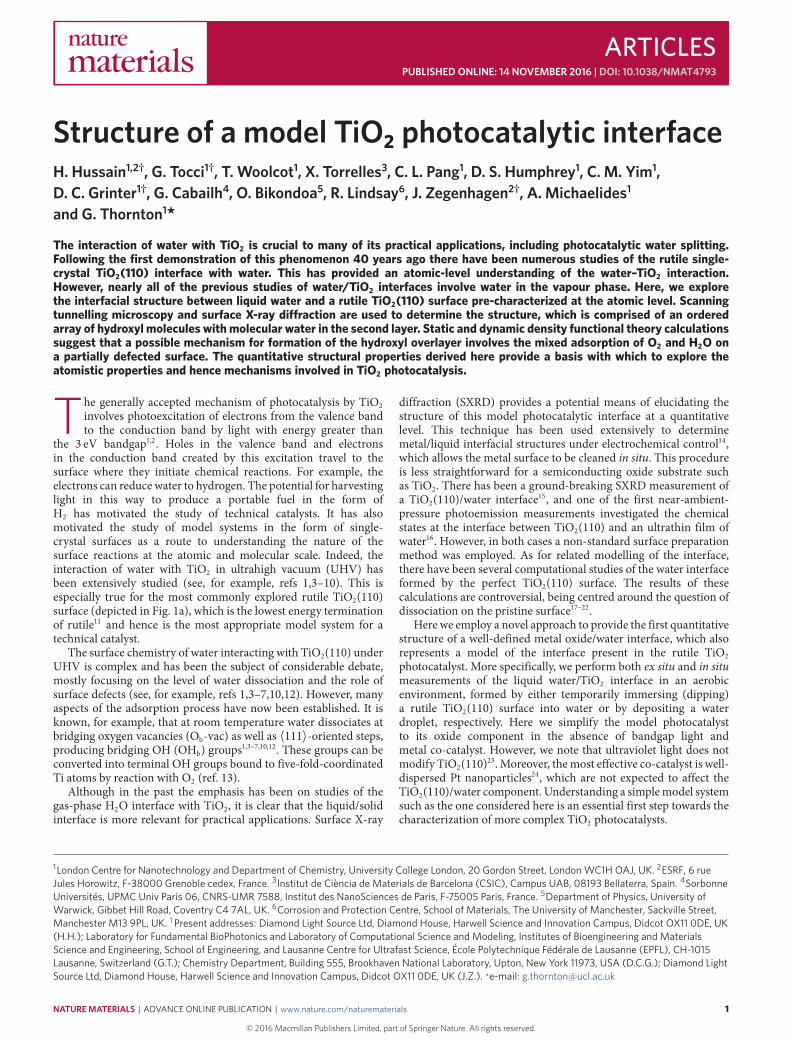
Figure 1 | The TiO2(110) surface. a, Ball model of TiO2(110) together withOb-vac, OHb, OHt and Oad. Ti is shown red and O blue: Ob is shown lighter,and adsorbed O lighter still. H is shown yellow. b,c, STM images (0.2 nA,Vs= 1.2 V) of the surface before and after immersion in liquid water,respectively. In the large-area images, the red scale bars are 100 Å and inthe insets 20 Å. Before immersion, the TiO2(110) surface is characterizedby bright rows that arise from Ti5c atoms and bright spots that correspondto Ob-vac (0.11 ML) and OHb (0.10 ML). After immersion in liquid water toform the H2Odip sample, the surface is characterized by bright spotsarranged with a (2× 1) periodicity. The blue and green shapes mark areasthat are particularly well ordered. Note that these two areas are antiphasedomains; the bright spots are o�set by one TiO2 surface unit cell in the[001] direction.
The surfaces were characterized before and after exposure toliquid water using UHV scanning tunnelling microscopy (STM)and SXRD. STM measurements in conjunction with photoelectronspectroscopy in the same instrument evidence the formation of
an ordered (2 × 1) hydroxyl overlayer formed after dipping.The SXRD results identify the bonding site as the five-fold-coordinated Ti atoms. This site is also occupied at the in situ liquidwater/TiO2(110) interface, with ordering of molecular water in thesecond layer. This result is surprising on the basis of what is knownfrom UHV studies. It appears to arise from the availability of asmall concentration of O2 during the formation of the interface,which was not previously anticipated. This work demonstratesthe importance of in situ structural characterization of modelphotocatalytic interfaces and provides the basis for the modellingof the photocatalytic interface under aqueous conditions.
In order for our liquid-phase experiments to be connected withthe results from TiO2(110) UHV studies and to ensure accuratecomparison with calculations19,20,25, we employ UHV preparationand analysis methods that are known to produce and verify thepresence of an atomically ordered substrate1. A section of thevacuum chamber (base pressures∼1×10⁻¹⁰ mbar) is then ventedto N2 (BOC, 99.998% purity) before dipping the sample in water ordepositing a droplet of water to form a meniscus. The N2 gas usedhas a nominal O2 content of 5 ppm by volume, which introduces anaerobic environment as found in a real photocatalytic system. At thenear-atmospheric pressure used for venting, this equates to a partialO2 pressure of∼5×10⁻³ mbar and an equivalent exposure of∼105langmuir (1L=1.33×10⁻⁶ mbar sec).
Figure 1b shows STM images of the as-prepared TiO2(110)surface10. In the high-resolution image of the inset, bright (Ti) rowsare seen that run in the [001] direction. Bright spots are also presentand these are a mixture of Ob-vacs and bridging hydroxyls (OHb),the latter being formed by water dissociation at defect sites. Afterventing to N2 and immersion in 10ml water (18.2M� cm, totalorganic content<2 ppm) for 5min, the sample (H2Odip sample) wasreintroduced to UHV. STM images of the H2Odip sample are shownin Fig. 1c. The basic morphology of the surface is the same as thatin Fig. 1b. There is no evidence of any pitting or erosion of the stepedges following immersion in water26.
The high-resolution image shown in the inset of Fig. 1c evidencesa (2× 1) overlayer. Antiphase domains of this overlayer can formby an offset of one unit cell along the [001] direction. The domainsare small, most being shorter than ten TiO2(110) unit cell lengthsin [001] (∼30Å) and four units in [11̄0] (∼26Å). Half-order low-energy electron diffraction beams were not observed, most likelydue to either the small domain size and/or electron-stimulateddesorption of the adsorbate. X-ray photoelectron spectroscopy(XPS) measurements indicate the level of C contamination to bearound 0.1monolayer (ML) (see Supplementary Fig. 1), where 1MLis the density of primitive surface unit cells. Venting an as-preparedTiO2(110) sample to air or pure O2 without immersion in water wasfound not to form a (2× 1) overlayer. A previous study also notedthe absence of an ordered overlayer after exposure to a nitrogenatmosphere27. Hence, we conclude that the (2× 1) overlayer isformed specifically by immersion in liquid water.
From the STM images, we find the coverage of the orderedoverlayer to be 0.30± 0.05ML. This coverage and the domain sizedid not vary when we used samples with different initial Ob-vacconcentrations of 0.16 and 0.07ML. This suggests that neitherOb-vacs norOHb (the coverage of which is proportional to the initialOb-vac density) play a key role in the nucleation process. Hence,strain is a likely origin of the limited domain size28.
To probe the chemical nature of the (2 × 1) overlayer, weemployed XPS and ultraviolet photoelectron spectroscopy (UPS).A peak at ∼532 eV binding energy in the O 1s spectrum thatoriginates from OH becomes more intense after immersion.Supplementary Fig. 2a,b shows a pair of XPS spectra taken beforeand after immersion of TiO2(110) in water. Similarly, in UPS spectrataken after immersion in water, peaks appear at 8.0 and 10.2 eVbelow the Fermi level (EF) that are characteristic of chemisorbed
2
© Macmillan Publishers Limited . All rights reserved
NATUREMATERIALS | ADVANCE ONLINE PUBLICATION | www.nature.com/naturematerials
NATUREMATERIALS DOI: 10.1038/NMAT4793 ARTICLES
c
b
104
[0,1]
[1,2]
[2,1]
a
102
104
102
104
102
1 2 3L (r.l.u.)
4 5 6
dStru
ctur
e fa
ctor
(a.u
.)
O(1#)Ti(1)
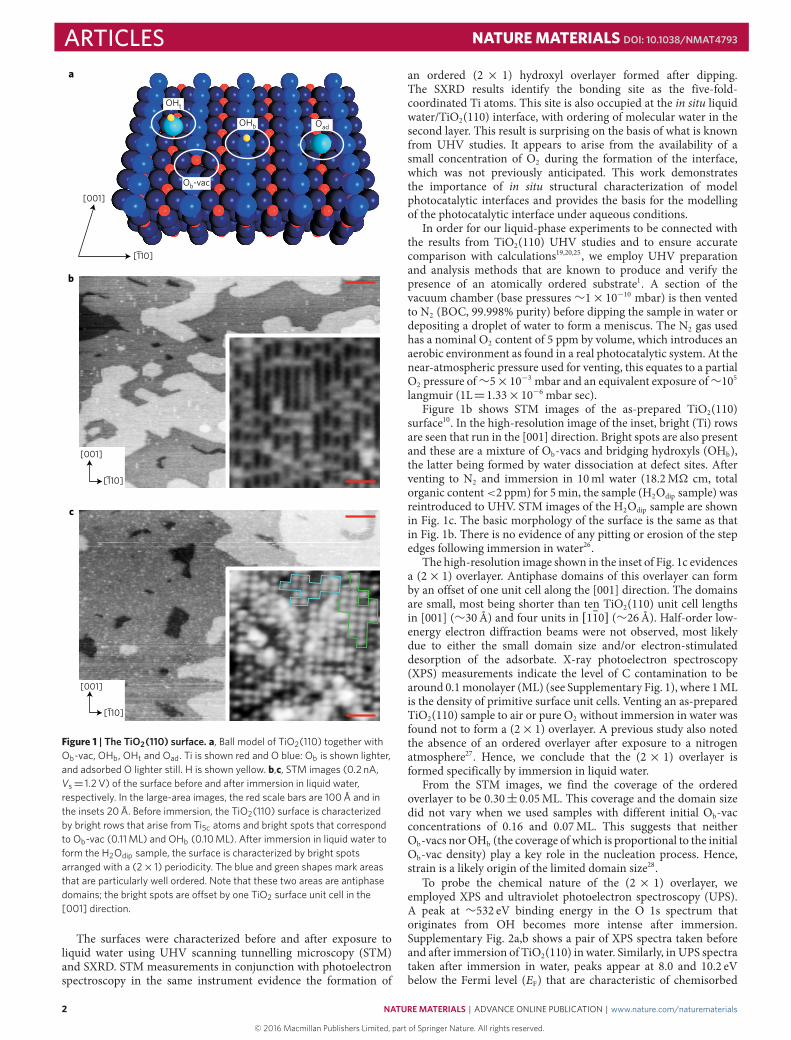
Figure 2 | Selected CTRs from the SXRDmeasurements alongsideproposed models. a, The structure factors of the di�erent TiO2(110)surfaces are plotted for the (0,1,l), (1,2,l) and (2,1,l) CTRs. Black, red andblue error bars represent the measured experimental data from theas-prepared surface, H2Odip and H2Odrop samples, respectively, with solidlines being the calculated data. Profiles are o�set for clarity. Notches on thex axes correspond to Bragg peaks. b–d, Ball–stick models for clean, H2Odipand H2Odrop samples, respectively.
OH (ref. 2) (Supplementary Fig. 2c). UPS also detects a bandgapstate (BGS) associated withOb-vac andOHb that lies∼0.8 eV belowEF(refs 29–31). This BGS is quenched after immersion in water,which can be explained by healing of the Ob-vacs/OHb by exposuretoO2 during theN2 venting procedure (Supplementary Fig. 2d). TheO2 exposure of∼105 L is at least an order of magnitude larger thanthat required to attenuate the BGS (∼400 L)3,29.
Figure 2a shows selected SXRD results in the form of crystaltruncation rods (CTRs) recorded from the H2Odip surface togetherwith those from the as-prepared UHV surface. The latter resultsare consistent with those reported previously32. Best fits to thedata are also shown in Fig. 2a, with a larger data set beingpresented in Supplementary Fig. 3. A model for the clean surfaceis shown in Fig. 2b and the best-fit model for the H2Odip surfaceis shown in Fig. 2c. Supplementary Tables 1 and 2 show theatomic displacements, the key for each atom being obtained fromSupplementary Fig. 4.
Due to its low X-ray scattering contribution, hydrogen is notincluded in the analysis and is not shown in the model. Instead,water molecules or hydroxyls are represented only by their oxygenatoms. The bond distance between O(1#) and Ti(2) (see Fig. 2c)is 1.95± 0.03Å, which is in good agreement with the literaturevalue for the Ti–OHt (terminal OH) bond of 1.85± 0.08Å (ref. 33),whereas the Ti–H2O bond is much longer at 2.21±0.02Å (ref. 34).Hence, we assign O(1#) to OHt, which is also consistent with ourphotoelectron spectroscopy data. The SXRD data cannot rule outthe presence of OHb; however, both the XPS and STM results fromthe H2Odip surface suggest that only one form of OH species ispresent. In the case of XPS, the OH-related peak in the O 1s spec-trum increases by a factor of 5± 1 after dipping. The STM image ap-pears to contain only one type of adsorbate in the (2×1) overlayer.
As STM showed very little change to the morphology of thesurface after immersion in liquid water, a near-perfect model wassimulated; that is, the occupancies were fixed to 1 during thefit, except that of the OHt molecule. This has an occupancy of0.45±0.1, consistent with the STM results. If the occupancy of theOHt molecule is fixed at unity, the goodness of fit (χ 2) worsens to 1.6from a minimum value 1.4 at 0.45ML. This occupancy of below 0.5is what one would expect for the (2×1) overlayer with domain wallabsences and therefore supports the model. There is no intensity inthe position of half-order rods, which is consistent with the smalldomain sizes found in STM.
The dipping (ex situ) experiments allow us to gain chemicalcomposition as well as direct (STM) and reciprocal space (SXRD)information about the interface initially formed at the liquid waterinterface. Taken together, thesemeasurements paint a robust pictureof the interface. Only in situ SXRDmeasurements are possible at theliquid water interface (H2Odrop sample). As we shall show below, aclear connection can bemade between the structures obtained fromthe in situ and ex situmeasurements.
Selected CTRs of the H2Odrop surface are shown together withthose from the H2Odip and as-prepared UHV surfaces in Fig. 2.A larger data set is shown in Supplementary Fig. 5. The best-fitmodel (hydrated model) is shown in Fig. 2d and has a χ 2 of 1.7.The model is essentially the same as that of the OHt model (Fig. 2c),except for the presence of a hydration layer above the (2× 1) OHtcontact layer. As with the H2Odip sample, evidence for OHt (andnot H2O molecules) at the Ti5c sites comes from the bond distancebetween OHt and Ti(2) of 1.95± 0.03Å (see Supplementary Fig. 4and Supplementary Table 1). Our model differs from that derivedfrom a previous SXRD measurement of a TiO2(110)/liquid waterinterface. In this case an experimental Ti–OHt bond distance of2.12 ± 0.02Å was found15, which is closer to the Ti–H2O bonddistance34. Ourmodel also differs from that obtained from the near-ambient-pressure photoemission study, which concluded that onlybridging hydroxyls were present at the interface16. In both cases thediscrepancy will arise from the difference in sample preparationand characterization. A (2× 1) overlayer was recently observed inSTM measurements of a TiO2(110)/liquid water interface, wherethe substrate was prepared in the same manner employed here. Bycomparison with DFT calculations, water dimers are thought toform the overlayer35. However, on the basis of the work presentedhere, it seems more likely that the (2× 1) overlayer arises fromOHt groups.
To understand the formation of OHt from exposure of theTiO2(110) surface to liquid water, we note that UHV-preparedsamples contain Ob-vac and that these react with water in theresidual vacuum to form OHb (refs 3–7,10,12). Approximately105 L O2 is also supplied here during the N2 venting procedure.Thus, water, O2(g), OHb and Ob-vac are all potential reactantswhen we expose our TiO2(110) surfaces to liquid water and whencombined, OHt is a likely candidate product13. Subsurface defects,such as subsurface Ti interstitials (Tiint), can also participate in thereaction process, by providing a source of excess electrons for thedissociation of O2(g)30,36.
With the above considerations in mind, we performed an ex-tensive series of density functional theory (DFT) calculations tounderstand the formation of the (2×1) OHt overlayer. Both geom-etry optimizations for the interface under UHV-like conditions andab initio molecular dynamics (AIMD) under aqueous conditionswere performed. Taken together these suggest that this overlayermost likely forms through the mixed dissociation of O2 and H2O ona TiO2(110) surface containing point defects, in the form of OHb,oxygen adatoms (Oad) and Tiint. Specifically, in Fig. 3 we show thepotential energy diagram obtained for the vacuum interface for apossible mechanism through which the (2× 1) OHt overlayer canform. The mechanism that governs the stabilization of the overlayer
NATUREMATERIALS | ADVANCE ONLINE PUBLICATION | www.nature.com/naturematerials
© Macmillan Publishers Limited . All rights reserved
3
ARTICLES NATUREMATERIALS DOI: 10.1038/NMAT4793
2OHb + Oad 2OHb + Oad + O2 2OHt + Oad
Adsorbed species
Pote
ntia
l ene
rgy
(eV
)
−9−8−7−6−5−4−3−2−101a
b c d
e f g
2OH b + O ad
2OH b + O ad
+ O 2
2OH t + O ad
2OH t + O ad
+ 3H 2O
4OH t + 2H 2
O4OH t
2OHt + Oad + 3H2O 4OHt + 2H2O 4OHt
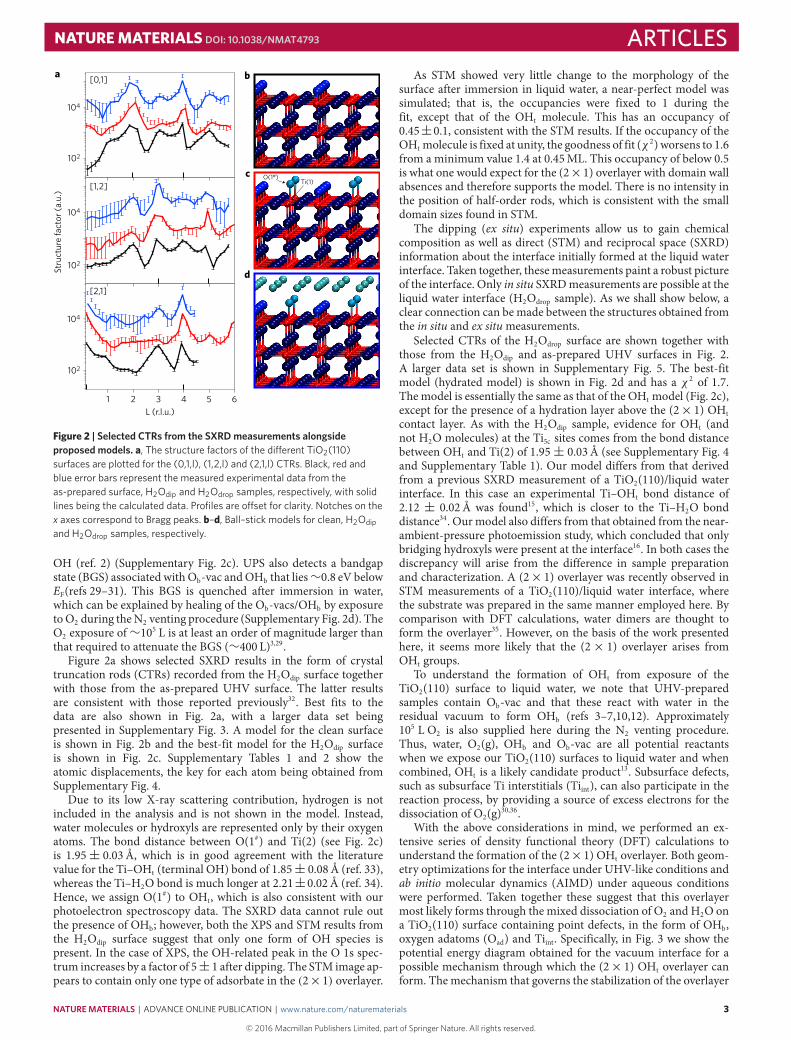
Figure 3 | Possible sequence of reaction steps leading to the formation ofthe OHt (2× 1) overlayer. a, Potential energy diagram for the formationof the OHt overlayer resulting from the mixed adsorption of O2 and H2Oon a defective TiO2(110) surface model. The value of the potential energy1E at each state s is obtained as the di�erence between the totalenergy of that state Es and that of the previous state Es−1, that is,1Es=Es−Es−1−E(gas−ads)
s +E(gas−des)s , and where E(gas−ads)
s andE(gas−des)s are the total energy of any gas-phase species that has been
adsorbed or desorbed upon going from state s− 1 to state s, respectively.The index s goes from 1 to 5 and the state for s=0 corresponds to thereference zero state composed of a surface with 1/4 ML of subsurface Tiint,1/4 ML of OHb, and 1/8 ML of Oad, where the OHb and the Oad are formedfrom the pre-adsorption of H2O at an Ob-vac and 1/2O2 from thegas-phase. The values of the potential energy refer to a (4×2) unit cell.The dashed line connecting the 4OHt+ 2H2O state with the 4OHt stateindicates the desorption of two water molecules to the gas phase.b–g, Structures of adsorbates on the defective TiO2(110). Theconfigurations are labelled according to the states shown in the potentialenergy diagram in a.
relies on a competition between charge transfer arising from thepresence of defects (see Supplementary Fig. 6) and the surfacedistortion due to the adsorption of the OHt (refs 37,38).
In the process shown in Fig. 3, the energy zero reference state (seeFig. 3a,b) is represented by a TiO2(110) surface model with 1/4MLof OHb, 1/8ML of Oad and 1/4ML of subsurface Tiint. From thisinitial state, the formation of the (2× 1) OHt overlayer proceedswith the adsorption of O2 from the gas phase on a Ti5c site adjacentto a OHb site (Fig. 3c). O2 can then react with the OHb to form apair of OHt (Fig. 3d). Following this step, water may adsorb on Ti5csites to form a mixed overlayer made of an OHt pair, an Oad andthree H2O (Fig. 3e). Through a sequence of proton transfer eventsinvolving the water and the OHt pair, as well as water and the Oad, a(2×1) OHt overlayer can form. In this state (see Fig. 3f), two watermolecules are co-adsorbed with four OHt arranged in a (2× 1)symmetry. The 4OHt+ 2H2O and the 2OHt+ Oad+ 3H2O statesare almost degenerate (the 4OHt+ 2H2O state is about 50meV lessstable). In the final step shown in Fig. 3, water is desorbed to the
gas phase, leaving only a (2× 1) overlayer of OHt (Fig. 3g). FromFig. 3 it is clear that the bare OHt (2× 1) overlayer is less stablethan the state where water is present. This result is consistent withour STM measurements, where it has been observed that the OHtspecies are arranged in (2× 1) symmetry only after dipping thesample in water. Under aqueous conditions instead, the OHt (2×1)overlayer may be stabilized by the presence of water molecules fromthe liquid phase. This is indeed what we find from analysis of ourAIMD simulations of the interface under aqueous conditions, wherewe find that: the OHt (2× 1) overlayer remains stable over twoseparate AIMD simulations with a total length of 70 ps; and onaverage 0.18ML of the Ti5c sites adjacent to the terminal OH groupsare occupied by water molecules.
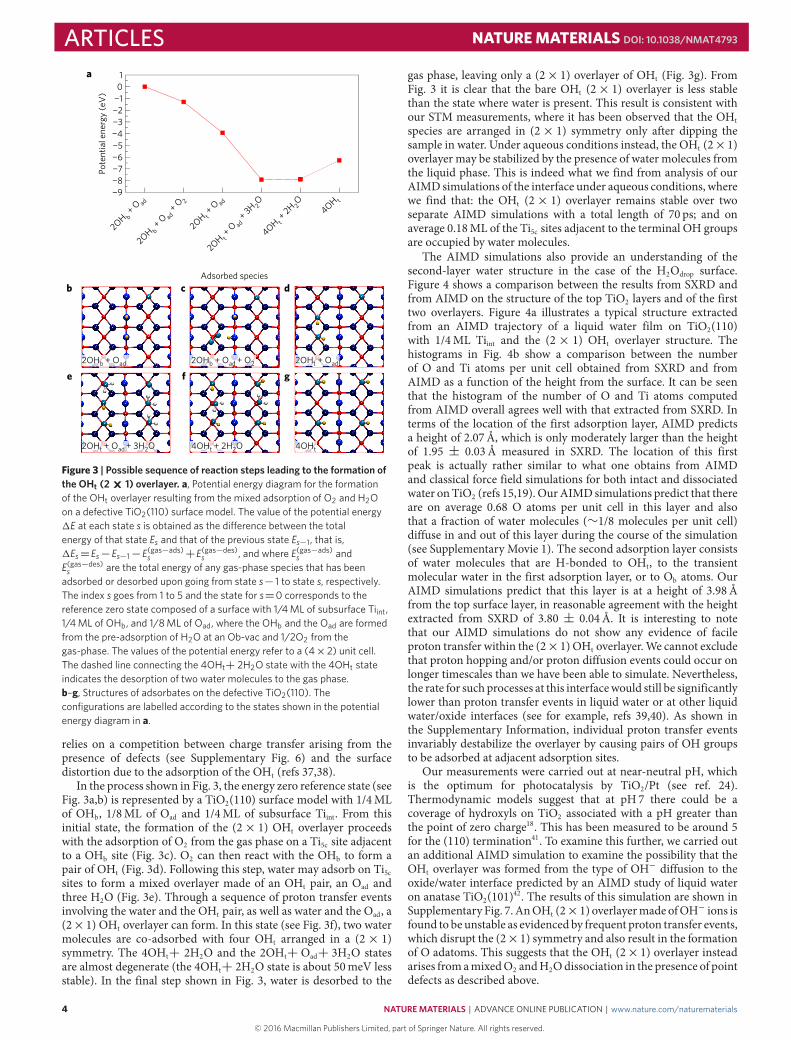
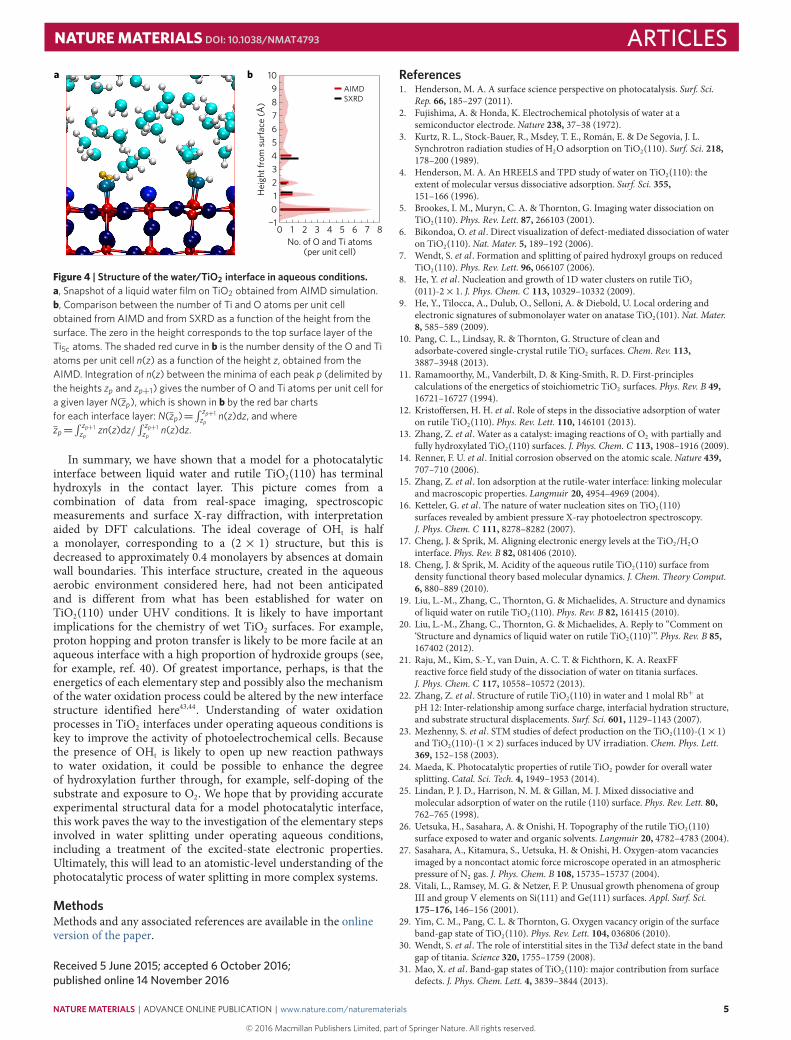
The AIMD simulations also provide an understanding of thesecond-layer water structure in the case of the H2Odrop surface.Figure 4 shows a comparison between the results from SXRD andfrom AIMD on the structure of the top TiO2 layers and of the firsttwo overlayers. Figure 4a illustrates a typical structure extractedfrom an AIMD trajectory of a liquid water film on TiO2(110)with 1/4ML Tiint and the (2× 1) OHt overlayer structure. Thehistograms in Fig. 4b show a comparison between the numberof O and Ti atoms per unit cell obtained from SXRD and fromAIMD as a function of the height from the surface. It can be seenthat the histogram of the number of O and Ti atoms computedfrom AIMD overall agrees well with that extracted from SXRD. Interms of the location of the first adsorption layer, AIMD predictsa height of 2.07Å, which is only moderately larger than the heightof 1.95 ± 0.03Å measured in SXRD. The location of this firstpeak is actually rather similar to what one obtains from AIMDand classical force field simulations for both intact and dissociatedwater onTiO2 (refs 15,19). OurAIMD simulations predict that thereare on average 0.68 O atoms per unit cell in this layer and alsothat a fraction of water molecules (∼1/8 molecules per unit cell)diffuse in and out of this layer during the course of the simulation(see Supplementary Movie 1). The second adsorption layer consistsof water molecules that are H-bonded to OHt, to the transientmolecular water in the first adsorption layer, or to Ob atoms. OurAIMD simulations predict that this layer is at a height of 3.98Åfrom the top surface layer, in reasonable agreement with the heightextracted from SXRD of 3.80 ± 0.04Å. It is interesting to notethat our AIMD simulations do not show any evidence of facileproton transfer within the (2×1) OHt overlayer.We cannot excludethat proton hopping and/or proton diffusion events could occur onlonger timescales than we have been able to simulate. Nevertheless,the rate for such processes at this interfacewould still be significantlylower than proton transfer events in liquid water or at other liquidwater/oxide interfaces (see for example, refs 39,40). As shown inthe Supplementary Information, individual proton transfer eventsinvariably destabilize the overlayer by causing pairs of OH groupsto be adsorbed at adjacent adsorption sites.
Our measurements were carried out at near-neutral pH, whichis the optimum for photocatalysis by TiO2/Pt (see ref. 24).Thermodynamic models suggest that at pH 7 there could be acoverage of hydroxyls on TiO2 associated with a pH greater thanthe point of zero charge18. This has been measured to be around 5for the (110) termination41. To examine this further, we carried outan additional AIMD simulation to examine the possibility that theOHt overlayer was formed from the type of OH− diffusion to theoxide/water interface predicted by an AIMD study of liquid wateron anatase TiO2(101)42. The results of this simulation are shown inSupplementary Fig. 7. AnOHt (2×1) overlayermade ofOH− ions isfound to be unstable as evidenced by frequent proton transfer events,which disrupt the (2×1) symmetry and also result in the formationof O adatoms. This suggests that the OHt (2×1) overlayer insteadarises fromamixedO2 andH2Odissociation in the presence of pointdefects as described above.
4
© Macmillan Publishers Limited . All rights reserved
NATUREMATERIALS | ADVANCE ONLINE PUBLICATION | www.nature.com/naturematerials
NATUREMATERIALS DOI: 10.1038/NMAT4793 ARTICLES
AIMDSXRD
a b
Hei
ght f
rom
sur
face
(Å)
No. of O and Ti atoms(per unit cell)
876543210
10987654321
0−1
Figure 4 | Structure of the water/TiO2 interface in aqueous conditions.a, Snapshot of a liquid water film on TiO2 obtained from AIMD simulation.b, Comparison between the number of Ti and O atoms per unit cellobtained from AIMD and from SXRD as a function of the height from thesurface. The zero in the height corresponds to the top surface layer of theTi5c atoms. The shaded red curve in b is the number density of the O and Tiatoms per unit cell n(z) as a function of the height z, obtained from theAIMD. Integration of n(z) between the minima of each peak p (delimited bythe heights zp and zp+1) gives the number of O and Ti atoms per unit cell fora given layer N(zp), which is shown in b by the red bar chartsfor each interface layer: N(zp)=
∫ zp+1zp n(z)dz, and where
zp=∫ zp+1zp zn(z)dz/
∫ zp+1zp n(z)dz.
In summary, we have shown that a model for a photocatalyticinterface between liquid water and rutile TiO2(110) has terminalhydroxyls in the contact layer. This picture comes from acombination of data from real-space imaging, spectroscopicmeasurements and surface X-ray diffraction, with interpretationaided by DFT calculations. The ideal coverage of OHt is halfa monolayer, corresponding to a (2 × 1) structure, but this isdecreased to approximately 0.4 monolayers by absences at domainwall boundaries. This interface structure, created in the aqueousaerobic environment considered here, had not been anticipatedand is different from what has been established for water onTiO2(110) under UHV conditions. It is likely to have importantimplications for the chemistry of wet TiO2 surfaces. For example,proton hopping and proton transfer is likely to be more facile at anaqueous interface with a high proportion of hydroxide groups (see,for example, ref. 40). Of greatest importance, perhaps, is that theenergetics of each elementary step and possibly also the mechanismof the water oxidation process could be altered by the new interfacestructure identified here43,44. Understanding of water oxidationprocesses in TiO2 interfaces under operating aqueous conditions iskey to improve the activity of photoelectrochemical cells. Becausethe presence of OHt is likely to open up new reaction pathwaysto water oxidation, it could be possible to enhance the degreeof hydroxylation further through, for example, self-doping of thesubstrate and exposure to O2. We hope that by providing accurateexperimental structural data for a model photocatalytic interface,this work paves the way to the investigation of the elementary stepsinvolved in water splitting under operating aqueous conditions,including a treatment of the excited-state electronic properties.Ultimately, this will lead to an atomistic-level understanding of thephotocatalytic process of water splitting in more complex systems.
MethodsMethods and any associated references are available in the onlineversion of the paper.
Received 5 June 2015; accepted 6 October 2016;published online 14 November 2016
References1. Henderson, M. A. A surface science perspective on photocatalysis. Surf. Sci.
Rep. 66, 185–297 (2011).2. Fujishima, A. & Honda, K. Electrochemical photolysis of water at a
semiconductor electrode. Nature 238, 37–38 (1972).3. Kurtz, R. L., Stock-Bauer, R., Msdey, T. E., Román, E. & De Segovia, J. L.
Synchrotron radiation studies of H2O adsorption on TiO2(110). Surf. Sci. 218,178–200 (1989).
4. Henderson, M. A. An HREELS and TPD study of water on TiO2(110): theextent of molecular versus dissociative adsorption. Surf. Sci. 355,151–166 (1996).
5. Brookes, I. M., Muryn, C. A. & Thornton, G. Imaging water dissociation onTiO2(110). Phys. Rev. Lett. 87, 266103 (2001).
6. Bikondoa, O. et al . Direct visualization of defect-mediated dissociation of wateron TiO2(110). Nat. Mater. 5, 189–192 (2006).
7. Wendt, S. et al . Formation and splitting of paired hydroxyl groups on reducedTiO2(110). Phys. Rev. Lett. 96, 066107 (2006).
8. He, Y. et al . Nucleation and growth of 1D water clusters on rutile TiO2
(011)-2×1. J. Phys. Chem. C 113, 10329–10332 (2009).9. He, Y., Tilocca, A., Dulub, O., Selloni, A. & Diebold, U. Local ordering and
electronic signatures of submonolayer water on anatase TiO2(101). Nat. Mater.8, 585–589 (2009).
10. Pang, C. L., Lindsay, R. & Thornton, G. Structure of clean andadsorbate-covered single-crystal rutile TiO2 surfaces. Chem. Rev. 113,3887–3948 (2013).
11. Ramamoorthy, M., Vanderbilt, D. & King-Smith, R. D. First-principlescalculations of the energetics of stoichiometric TiO2 surfaces. Phys. Rev. B 49,16721–16727 (1994).
12. Kristoffersen, H. H. et al . Role of steps in the dissociative adsorption of wateron rutile TiO2(110). Phys. Rev. Lett. 110, 146101 (2013).
13. Zhang, Z. et al . Water as a catalyst: imaging reactions of O2 with partially andfully hydroxylated TiO2(110) surfaces. J. Phys. Chem. C 113, 1908–1916 (2009).
14. Renner, F. U. et al . Initial corrosion observed on the atomic scale. Nature 439,707–710 (2006).
15. Zhang, Z. et al . Ion adsorption at the rutile-water interface: linking molecularand macroscopic properties. Langmuir 20, 4954–4969 (2004).
16. Ketteler, G. et al . The nature of water nucleation sites on TiO2(110)surfaces revealed by ambient pressure X-ray photoelectron spectroscopy.J. Phys. Chem. C 111, 8278–8282 (2007).
17. Cheng, J. & Sprik, M. Aligning electronic energy levels at the TiO2/H2Ointerface. Phys. Rev. B 82, 081406 (2010).
18. Cheng, J. & Sprik, M. Acidity of the aqueous rutile TiO2(110) surface fromdensity functional theory based molecular dynamics. J. Chem. Theory Comput.6, 880–889 (2010).
19. Liu, L.-M., Zhang, C., Thornton, G. & Michaelides, A. Structure and dynamicsof liquid water on rutile TiO2(110). Phys. Rev. B 82, 161415 (2010).
20. Liu, L.-M., Zhang, C., Thornton, G. & Michaelides, A. Reply to ‘‘Comment on‘Structure and dynamics of liquid water on rutile TiO2(110)’’’. Phys. Rev. B 85,167402 (2012).
21. Raju, M., Kim, S.-Y., van Duin, A. C. T. & Fichthorn, K. A. ReaxFFreactive force field study of the dissociation of water on titania surfaces.J. Phys. Chem. C 117, 10558–10572 (2013).
22. Zhang, Z. et al . Structure of rutile TiO2(110) in water and 1 molal Rb+ atpH 12: Inter-relationship among surface charge, interfacial hydration structure,and substrate structural displacements. Surf. Sci. 601, 1129–1143 (2007).
23. Mezhenny, S. et al . STM studies of defect production on the TiO2(110)-(1×1)and TiO2(110)-(1×2) surfaces induced by UV irradiation. Chem. Phys. Lett.369, 152–158 (2003).
24. Maeda, K. Photocatalytic properties of rutile TiO2 powder for overall watersplitting. Catal. Sci. Tech. 4, 1949–1953 (2014).
25. Lindan, P. J. D., Harrison, N. M. & Gillan, M. J. Mixed dissociative andmolecular adsorption of water on the rutile (110) surface. Phys. Rev. Lett. 80,762–765 (1998).
26. Uetsuka, H., Sasahara, A. & Onishi, H. Topography of the rutile TiO2(110)surface exposed to water and organic solvents. Langmuir 20, 4782–4783 (2004).
27. Sasahara, A., Kitamura, S., Uetsuka, H. & Onishi, H. Oxygen-atom vacanciesimaged by a noncontact atomic force microscope operated in an atmosphericpressure of N2 gas. J. Phys. Chem. B 108, 15735–15737 (2004).
28. Vitali, L., Ramsey, M. G. & Netzer, F. P. Unusual growth phenomena of groupIII and group V elements on Si(111) and Ge(111) surfaces. Appl. Surf. Sci.175–176, 146–156 (2001).
29. Yim, C. M., Pang, C. L. & Thornton, G. Oxygen vacancy origin of the surfaceband-gap state of TiO2(110). Phys. Rev. Lett. 104, 036806 (2010).
30. Wendt, S. et al . The role of interstitial sites in the Ti3d defect state in the bandgap of titania. Science 320, 1755–1759 (2008).
31. Mao, X. et al . Band-gap states of TiO2(110): major contribution from surfacedefects. J. Phys. Chem. Lett. 4, 3839–3844 (2013).
NATUREMATERIALS | ADVANCE ONLINE PUBLICATION | www.nature.com/naturematerials
© Macmillan Publishers Limited . All rights reserved
5
ARTICLES NATUREMATERIALS DOI: 10.1038/NMAT4793
32. Cabailh, G. et al . Geometric structure of TiO2(110)(1×1): achievingexperimental consensus. Phys. Rev. B 75, 241403 (2007).
33. Duncan, D. A., Allegretti, F. & Woodruff, D. P. Water does partially dissociateon the perfect TiO2(110) surface: a quantitative structure determination.Phys. Rev. B 86, 045411 (2012).
34. Allegretti, F., O’Brien, S., Polcik, M., Sayago, D. I. & Woodruff, D. P. Adsorptionbond length for H2O on TiO2(110): a key parameter for theoreticalunderstanding. Phys. Rev. Lett. 95, 226104 (2005).
35. Serrano, G. et al . Molecular ordering at the interface between liquid water andrutile TiO2(110). Adv. Mater. Interfaces 2, 1500256 (2015).
36. Papageorgiou, A. C. et al . Electron traps and their effect on the surfacechemistry of TiO2(110). Proc. Natl Acad. Sci. USA 107, 2391–2396 (2010).
37. Deskins, N. A., Rousseau, R. & Dupuis, M. Defining the role of excess electronsin the surface chemistry of TiO2. J. Phys. Chem. C 114, 5891–5897 (2010).
38. Amft, M. et al . A molecular mechanism for the water–hydroxyl balance duringwetting of TiO2. J. Phys. Chem. C 117, 17078–17083 (2013).
39. Berkelbach, T. C., Lee, H.-S. & Tuckerman, M. E. Concerted hydrogen-bonddynamics in the transport mechanism of the hydrated proton: a first-principlesmolecular dynamics study. Phys. Rev. Lett. 103, 238302 (2009).
40. Tocci, G. & Michaelides, A. Solvent-induced proton hopping at a water–oxideinterface. J. Phys. Chem. Lett. 5, 474–480 (2014).
41. Bullard, J. W. & Cima, M. J. Orientation dependence of the isoelectric point ofTiO2 (Rutile) surfaces. Langmuir 22, 10264–10271 (2006).
42. Cheng, H. & Selloni, A. Hydroxide ions at the water/anatase TiO2(101)interface: structure and electronic states from first principles moleculardynamics. Langmuir 26, 11518–11525 (2010).
43. Cheng, J., Liu, X., Kattirtzi, J. A., VandeVondele, J. & Sprik, M. Aligningelectronic and protonic energy levels of proton-coupled electron transfer inwater oxidation on aqueous TiO2. Angew. Chem. Int. Ed. 53,12046–12050 (2014).
44. Valdés, A., Qu, Z.-W., Kroes, G.-J., Rossmeisl, J. & Nørskov, J. K. Oxidation andphoto-oxidation of water on TiO2 surface. J. Phys. Chem. C 112,9872–9879 (2008).
AcknowledgementsThe authors would like to thank M. Nicotra, Y. Zhang and M. Allan for assistance withsome measurements. This work was funded by grants from the EPSRC (UK)(EP/C541898/1), M.E.C. (Spain) through project MAT2015-68760-C2-2-P, EU ITNSMALL, EU COST Action CM1104, ERC Advanced Grant (G.Thornton, ENERGYSURFNo. 267768), ERC Consolidator Grant (A.M., HeteroIce project No. 616121) and theRoyal Society. We are grateful to the London Centre for Nanotechnology and UCLResearch Computing for computation resources, and to the UKCP consortium (EP/F036884/1) for access to Archer.
Author contributionsG.Thornton, J.Z. and A.M. designed the project. D.S.H., T.W., C.L.P., C.M.Y., D.C.G. andH.H. performed the STMmeasurements and T.W. analysed the data. T.W. and C.M.Y.performed the UPS experiments with T.W. analysing the data. H.H., G.C., O.B., X.T., R.L.and G.Thornton performed the SXRD measurements and H.H. and X.T. analysed thedata. G.Tocci and A.M. conceived, designed and analysed the ab initio calculations.G.Tocci performed the ab initio calculations. H.H., T.W., G.Tocci, C.L.P., A.M. andG.Thornton wrote the manuscript and the Supplementary Information with input fromall authors. All authors participated in discussing the data.
Additional informationSupplementary information is available in the online version of the paper. Reprints andpermissions information is available online at www.nature.com/reprints.Correspondence and requests for materials should be addressed to G.Thornton
Competing financial interestsThe authors declare no competing financial interests.
6
© Macmillan Publishers Limited . All rights reserved
NATUREMATERIALS | ADVANCE ONLINE PUBLICATION | www.nature.com/naturematerials
NATUREMATERIALS DOI: 10.1038/NMAT4793 ARTICLESMethodsThe TiO2(110) (Pi-Kem) samples were prepared following an establishedprocedure10 involving cycles of Ar+ ion sputtering and annealing to∼1,000K inUHV. Auger electron spectroscopy or X-ray photoelectron spectroscopy was usedto confirm the surface cleanliness and low-energy electron diffraction or scanningtunnelling microscopy (STM) was used to ensure that the surfaces were wellordered and unreconstructed. For all three methods, any adventitiousultraviolet-induced modification was avoided by using a red light. Prior to dipping,ultrapure water was de-aerated by bubbling N2 through the liquid for>1 h. Thisresults in a pH of 6.9.
Scanning tunnelling microscopy. STMmeasurements were performed with anOmicron UHV variable-temperature STM. Tunnelling was into empty samplestates with the sample bias (Vs=1.2–1.5V) and tunnelling current(It=0.2–0.5 nA). The sample was dipped in ultrapure, deoxygenated H2O for arange of volumes (2ml–2 l) and times (15 s–10min). Surface contamination wasminimized by purging the load-lock with N2. Immediately after the immersion, thesample was reintroduced into UHV where it was transferred to the analysischamber for STMmeasurements.
Photoelectron spectroscopy. Normal emission measurements were performed atroom temperature in an Omicron UHV low-temperature STM system,incorporating an Omicron HA125 hemispherical energy analyser. Ultravioletphotoelectron spectra used He II (hv= 40.80 eV) and He I (hv= 21.20 eV)excitation to monitor the valence band and bandgap regions. The Fermi energy(EF) was determined from the tantalum sample holder that was in electrical contactwith the sample. Samples were also monitored using the in situ STM to ensure thepresence of a (2×1) overlayer.
Surface X-ray diffraction. All surface X-ray diffraction measurements werecarried out on the ID32 beamline at the European Synchrotron Radiation Facility,employing UHV facilities located in the associated surface characterizationlaboratory for sample preparation. Once prepared, the sample was transferredunder UHV to one of two bespoke, small portable UHV chambers that weremounted on a six-circle diffractometer with the sample surface in the horizontalplane. For the H2Odip measurements, data acquisition and analysis followed theprocedures described in ref. 32 and references therein. For H2Odrop measurements,a total of 1,450 non-equivalent reflections were measured, employing an‘electrochemical cell’ apparatus45. H2Odip measurements, following a similarprocedure to STMmeasurements, were conducted on a sample that was dipped in∼20ml of ultrapure, deoxygenated H2O for approximately 15 s. A large data set of20 crystal truncation rods was collected that, after corrections, comprised of 835non-equivalent reflections. The following reflections were monitored at regularintervals to ensure that there was no sample degradation: (1,0,1) H2Odip; (1,0,0.2)UHVas-prepared; (1,3,0.05) H2Odrop. Data for the last reflection are shown inSupplementary Fig. 8. The best-fit model takes into account Ti sites that are bothoccupied/unoccupied with OH, with the latter simulating domain walls.
Theoretical. Adsorption of the various species on TiO2(110) was modelledthrough spin-polarized DFT structure optimizations using periodic supercellsranging from (2×1) to (4×2). Adsorption on one side of a four tri-layerTiO2(110) surface was considered with the bottom tri-layer fixed at its bulkposition and at least 15Å separating periodic images along the surface normal.
We considered a degree of hydroxylation of the surface ranging from 1/4 to1ML and a range of Tiint located in the second subsurface layer in a range ofconcentrations between 0 and 1/2ML (see Supplementary Fig. 5). The referencestates for the adsorption of O2 or H2O (see Fig. 3 and Supplementary Fig. 5, for O2
only) were taken to be their total energies in the gas phase. Interstitials were located
in the second subsurface layer, and the position of defects has shown only a littleeffect on the adsorption of O2 on the surface37. The VASP46,47 code was used forthese calculations with a plane-wave cutoff of 400 eV and projector augmentedwave potentials48. Sampling of the Brillouin zone was achieved using a 0-centred(4×2×1) per primitive surface cell k-point mesh. The PBE49
exchange–correlation functional with a Hubbard-U correction of 4.2 eV was used.By comparing our results with the hybrid functional HSE0650 (see SupplementaryInformation) we ensured that the chosen value of U did not significantly affect theresults regarding the formation of the (2×1) OHt overlayer.
The other set of simulations performed as part of this study involvedspin-polarized DFT-based molecular dynamics. These AIMD simulations wereperformed to investigate the structure of the liquid water/TiO2 interface and thestability of the OHt (2×1) overlayer under aqueous conditions. The computationaldetails are similar to those reported in our previous work (see refs 19,20) but areincluded here for clarity. In brief, we used the CP2K/QUICKSTEP51 code with thePBE exchange–correlation functional. CP2K/QUICKSTEP employs a mixedGaussian and plane-wave basis set and norm-conserving pseudopotentials. Weused a short-range double valence polarized Gaussian basis52 and a 480 Ry cutofffor the plane-wave expansion. The AIMD trajectory analysed in the main text is 50ps in length, with a 1 fs time step and deuterium masses for the hydrogens in thecanonical ensemble with a target temperature of 360K. As with the static DFTcalculations, TiO2(110) was modelled using a (4×2) unit cell, comprised of fourtri-layers and 15Å of vacuum. The liquid water film in contact with the surface wasabout 2 nm thick, being comprised of 87 molecules. The (2×1) overlayer wasmodelled with neutral OHt adsorbed at Ti5c sites with Tiint positioned in the secondsubsurface layer at a concentration of 1/4ML. We also performed an additional50-ps-long AIMD simulation without interstitials to test their effect on the stabilityof the OHt overlayer. The results of these tests show that the OHt (2×1) overlayeris stable only in the presence of interstitials and with neutral OH species as opposedto OH− (results are shown in Supplementary Figs 5 and 6). Finally, we performed anumber of additional AIMD simulations (each of which is about 20 ps long) ofTiO2(110) under aqueous conditions as well as static DFT calculations underUHV-like conditions to compare the stability of the OHt (2×1) overlayer againstthat of other less ordered overlayers and to investigate the proclivity of protontransfer at the water/TiO2(110) interface. Overall, we find that proton transfer andproton diffusion is much more facile at less ordered structures compared with theOHt (2×1) overlayer (see Supplementary Figs 9–11).
References45. Renner, F. U., Gründer, Y. & Zegenhagen, J. Portable chamber for the study of
UHV prepared electrochemical interfaces by hard x-ray diffraction. Rev. Sci.Instrum. 78, 033903 (2007).
46. Kresse, G. & Hafner, J. Ab initiomolecular dynamics for liquid metals.Phys. Rev. B 47, 558–561 (1993).
47. Kresse, G. & Furthmüller, J. Efficient iterative schemes for ab initio total-energycalculations using a plane-wave basis set. Phys. Rev. B 54, 11169–11186 (1996).
48. Kresse, G. & Joubert, D. From ultrasoft pseudopotentials to the projectoraugmented-wave method. Phys. Rev. B 59, 1758–1775 (1999).
49. Perdew, J. P., Burke, K. & Ernzerhof, M. Generalized gradient approximationmade simple. Phys. Rev. Lett. 77, 3865–3868 (1996).
50. Heyd, J., Scuseria, G. E. & Ernzerhof, M. Hybrid functionals based on ascreened Coulomb potential. J. Chem. Phys. 118, 8207–8215 (2003).
51. VandeVondele, J. et al . Quickstep: fast and accurate density functionalcalculations using a mixed Gaussian and plane waves approach. Comput. Phys.Commun. 167, 103–128 (2005).
52. VandeVondele, J. & Hutter, J. Gaussian basis sets for accurate calculations onmolecular systems in gas and condensed phases. J. Chem. Phys. 127,114105 (2007).
NATUREMATERIALS | www.nature.com/naturematerials
© Macmillan Publishers Limited . All rights reserved