Embed Size (px)
Citation preview

Structure elucidation of uniformly 13C-labeled bacterialcelluloses from different Gluconacetobacter xylinus strains
Stephanie Hesse-Ertelt Æ Thomas Heinze ÆEiji Togawa Æ Tetsuo Kondo
Received: 17 March 2009 / Accepted: 9 August 2009 / Published online: 25 August 2009
� Springer Science+Business Media B.V. 2009
Abstract The morphological and supramolecular
structures of native cellulose pellicles from two
strains of Gluconacetobacter xylinus (ATCC 53582,
ATCC 23769) were investigated. Samples had been
statically cultivated in Hestrin-Schramm medium
containing fully 13C-labeled b-D-glucose-U-13C6 as
the sole source of carbon. The results are compared
with structure data of bacterial celluloses with a
natural 13C abundance of 1.1%. Non-enriched and13C-labeled cellulose pellicles formed crystalline
structures as revealed by cross-polarized/magic-angle
spinning (CP/MAS) 13C{1H}-NMR and near infrared
(NIR) FT-Raman spectroscopic measurements as
well as wide-angle X-ray diffraction (WAXD) inves-
tigations. Atomic force microscopy (AFM) was
applied for analyzing fiber morphologies and sur-
face properties. For the first time, details about the
manipulation of fiber widths and pellicle formation
were shown for different bacterial strains of
G. xylinus depending on the use of b-D-glucose-
U-13C6 for the biosynthesis.
Keywords Bacterial cellulose �Gluconacetobacter xylinus � 13C-Labeling �Biosynthesis � 13C Nuclear magnetic resonance �NIR FT-Raman � Atomic force microscopy �Wide-angle X-ray diffraction � Crystallinity
Abbreviations
A. xylinum Acetobacter xylinum
AFM Atomic force microscopy
ATCC American type culture collection
AY-201 Bacterial strain ATCC 23769
BC Bacterial cellulose
CI Crystallinity index
CP Cross polarization
DSM Deutsche Sammlung von
Mikroorganismen
FT-Raman Fourier transformed Raman
FWHM Full width at half maximum
G. xylinus Gluconacetobacter xylinus
HS Hestrin-Schramm
Ia, Ib Cellulose modifications
Ic Crystallinity value obtained by
NMR
INADEQUATE Incredible natural abundance
double quantum transfer
experiment
S. Hesse-Ertelt (&) � T. Heinze
Friedrich Schiller University of Jena,
Centre of Excellence for Polysaccharide Research,
Humboldtstrasse 10, 07743 Jena, Germany
e-mail: [email protected]
E. Togawa
Forestry and Forest Products Research Institute (FFPRI),
Matusnosato 1, Tsukuba, Ibaraki 305-8687, Japan
T. Kondo
Bio-Architecture Center (KBAC) and Graduate School
of Bioresource and Bioenvironmental Sciences,
Kyushu University, 6-10-1 Hakozaki, Higashi-ku,
Fukuoka 812-8581, Japan
123
Cellulose (2010) 17:139–151
DOI 10.1007/s10570-009-9355-4

MAS Magic angle spinning
NIR Near infrared
NMR Nuclear magnetic resonance
NOC Nematic ordered cellulose
NQ-5 Bacterial strain ATCC 53582
TPPM Two pulse phase modulation
WAXD Wide-angle X-ray diffraction
xc Crystallinity value obtained by
WAXD
Introduction
Cellulose possesses a large complexity and variability
in its supramolecular arrangement and, depending on
the conditions of its structure formation, displays a
significant diversity in structural features such as
lattice composition, crystallite dimensions, crystal-
linity, and fibrillar orientation (Ganster and Fink
1999; Klemm et al. 2005). Besides the monoclinic
structure model (Meyer and Misch 1937) describing
the allomorph Ib (space group: P21), a triclinic
structure (Sarko and Muggli 1974) was defined for
the native cellulose I, characterizing the allomorph Ia(space group: P1). As a model substance for the
investigation of biosynthesis and crystallization of
native cellulose, bacterial cellulose (BC) from Glu-
conacetobacter xylinus (previously referred to as
Acetobacter xylinum) was used (Brown et al. 1976;
Kuga and Brown 1991). Never-dried BC is a highly
swollen biopolymer with approximately 99 wt.% of
water (Fink et al. 1997), and was investigated in
dependence on the drying conditions (Bohn 2000;
Udhardt et al. 2005). It could be shown that the
biosynthesis of cellulose macromolecules was con-
nected with their self assembling. Caused by the
drying procedure, the sizes of the cellulose crystal-
lites decreased. Moreover, a uniplanar orientation
value already resulted in the never-dried state. It was
found that the (1–10) crystal lattice plane was parallel
oriented to the macroscopic surface of the cellulose
pellicle (Bohn et al. 2000). Formation and structure
of BC can be controlled by varying the components
of both nutrient medium and cultivation conditions
(Klemm et al. 2001; Seifert et al. 2004), which sparks
interest in fundamental investigations of the biosyn-
thesis and microgravitative effects of the formation of
cellulose by G. xylinus. Besides vibrational spectros-
copy, which played an important role in the
investigation of the molecular conformations and
hydrogen bonding patterns of cellulose (Schenzel and
Fischer 2001; Schenzel et al. 2005; Fischer et al.
2005), solid-state nuclear magnetic resonance (NMR)
spectroscopy was widely used to study the structure
of cellulose from different sources (Erata et al. 1997;
Atalla and VanderHart 1999; Kono et al. 2002, 2003;
Numata et al. 2003; Kono and Numata 2006). With
regard to NMR investigations, the impact of the 13C
isotope in isotopically enriched samples is of partic-
ular interest. However, investigations on the 13C-
labeling are rarely described (Gagnaire and Taravel
1980; Arashida et al. 1993; Kai et al. 1994, 1998;
Evans et al. 1996). Recent publications explain the
finally received BC and the mechanism of labeling
transfer from carbon to carbon. Further results are
limited to cell movement- and cell division rates. In
this regard, Kondo and co-workers found a cell
movement rate on nematic ordered cellulose (NOC:
Togawa and Kondo 1999; Kondo et al. 2001) of
about 4.5 lm per min for G. xylinus ATCC 53582 in
non-enriched nutrient media (Kondo et al. 2002).
These results were confirmed later using G. xylinus
ATCC 53582 and ATCC 23769 in different cultiva-
tion media and furthermore, the influence of a
modified distribution of carbon isotopes on both
biological systems and microgravitative effects of the
cellulose building was proven using b-D-glucose-
U-13C6 for the biosynthesis (Hesse and Kondo 2005).
It was found that the bacterial strains divided faster in
a 13C-enriched than in common nutrient media, and
the cell movement was influenced by the bacterial
strain and by the carbon isotope distribution of the
D-glucose used. On NOC, the movement of a single
G. xylinus ATCC 53582 cell was decelerated by the13C-isotope to be only half the speed, while the
movement of a single G. xylinus ATCC 23769 cell
was less influenced. Caused by their different sizes,
G. xylinus ATCC 23769 cells generally produce
smaller cellulose microfibrils than G. xylinus ATCC
53582 cells. Nevertheless, the fiber structure of
freshly biosynthesized and deposited cellulose nano-
fibers on the surface of NOC was proved to be in the
crystalline state of cellulose I (Hesse and Kondo
2005). These studies are related to shaken cultures of
G. xylinus. Continuing studies are concerned with the
investigation of G. xylinus ATCC 53582 and ATCC
23769 in static culture. BC pellicles biosynthesized
by these bacterial strains with b-D-glucose-U-13C6
140 Cellulose (2010) 17:139–151
123

were analyzed and compared with non-enriched
samples. Previously, refined 13C-NMR chemical shift
data of the dominant cellulose Ia modification were
obtained using 2D refocused INADEQUATE on 13C-
labeled BC pellicles (Hesse-Ertelt et al. 2008). Their
respective isotropic 13C chemical shifts exhibited
only slight differences, but there were major discrep-
ancies compared to the 13C chemical shift data of BC
from another G. xylinus strain (DSM 13368) grown at
different cultivation conditions. Apparently, the
structure of the crystalline allomorph Ia does not
only depend on its origin (algae or bacterial cellulose,
etc.), but also on the cultivation conditions and
possibly on the type of bacterium used for
biosynthesis.
Even though NMR spectroscopy just showed
marginal differences for the non-enriched- and 13C-
labeled BC produced by the same strain of G. xylinus,
further structural investigations of the cellulose
pellicles are required. Since isotopically exchanged
BC samples are notably used as model substances in
solid-state NMR spectroscopy, it is necessary to
know if they are representative of the corresponding
natural celluloses. It should be ensured that the
application of fully 13C-labeled b-D-glucose-U-13C6
does not have any influence on the building of
cellulose pellicles. In this work, the insight on the
distinctive character of BC samples from different
strains of G. xylinus discussed in (Hesse-Ertelt et al.
2008) are also confirmed by analytical methods other
than solid-state NMR. Differences in the morpholog-
ical and crystalline structures of the BC pellicles
produced by G. xylinus ATCC 53582 and G. xylinus
ATCC 23769 are described depending on their 13C-
labeling.
Experimental section
Bacterial cellulose
Two types of G. xylinus strains (NQ-5: ATCC 53582
of about 10 lm length, and AY-201: ATCC 23769 of
about 2 lm length) were cultured in sterilized
Hestrin-Schramm (HS) medium (Hestrin and
Schramm 1954) at pH 6.0 using different kinds of
carbon sources: b-D-glucose (13C, 1.1%; Sigma–
Aldrich Chemicals Co., USA) and uniformly 13C-
enriched b-D-glucose-U-13C6 (13C, 99%; Campro
Scientific, Germany and Sigma–Aldrich Chemicals
Co. USA). For cultivation, 200 lL of preparatory
cultures of the respective G. xylinus strains grown
with b-D-glucose (13C, 1.1%) were inoculated per
8.3 ml of autoclaved HS media. The culture media
were incubated statically at 30 �C for a period of
14 days, during which the pre-polymer was not
removed. After cultivation, the pellicles were washed
with distilled water, treated with 0.1N aqueous NaOH
solution at 80 �C for 4 h, and washed again with
running water to a neutral reaction of the rinsing
agent. Finally, the pellicles were air dried (covered by
aluminum foil) at 50 �C for 24 h.
BC pellicles 1–3 were prepared using b-D-glucose
(13C, 1.1%) by G. xylinus ATCC 53582 (1) and
G. xylinus ATCC 23769 (2, 3). BC samples 4–6 were
prepared using b-D-glucose-U-13C6 (13C, 99%) by
G. xylinus ATCC 53582 (4) and G. xylinus ATCC
23769 (5, 6).
Atomic force microscopy
Samples were measured in the air dried state using
SHIMADZU’s SPM-9500J3. The AFM measurements
were carried out in contact mode at a scan rate of
1 Hz using etched silicon tips with a cantilever spring
constant of about 0.13 N.
Wide-angle X-ray diffraction
For WAXD measurements, samples were investi-
gated in the air dried state using the RIGAKU X-ray
diffractometer RINT-2500HF. CuKa irradiation and
transmission technique have been used at following
conditions: 0.5�/min, 2h = 5…60�, 40 kV, and
200 mA, whereas step sizes of 0.02� were applied.
NIR FT-Raman spectroscopy
The samples were placed across the sample holders
and measured in the air dried state using the Bruker
Equinox 55 (FRA 106/S with D 418-T) spectrometer
with a liquid-nitrogen cooled Ge diode as detector. A
cw-Nd:YAG-laser operating at kNd:YAG = 1,064 nm
with a maximum power of 450 mW was used as light
source for the excitation of the Raman scattering. The
spectra have been detected over the range of 3,500–
400 cm-1 using an operating spectral resolution of
4 cm-1 and averaged over 500 scans.
Cellulose (2010) 17:139–151 141
123

NMR spectroscopy
CP/MAS 13C{1H}-NMR spectra were recorded on a
Bruker AMX 400 MHz (AMX 400) spectrometer
operating at 100.58 MHz for 13C, with a 4 mm MAS
double resonance probe and ZrO2 rotors. The mea-
surements were carried out at 6.5 kHz MAS. The
cross polarization (CP) contact time was 1 ms; 64,
4 k, and 20 k scans were accumulated. Two-pulse
phase modulation (TPPM: ±10�, 7 ls and 8 ls,
respectively) was applied for proton decoupling. The
recycle delay was set to 2 s for all experiments, and
adamantane was used as an external reference having13C chemical shifts of 29.50 ± 0.10 ppm (CH) and
38.56 ± 0.10 ppm (CH2) with respect to tetramethyl-
silane at 0.0 ppm (Earl and VanderHart 1982).
Results and discussion
Bacterial cellulose
To investigate the biosynthesis properties of
G. xylinus NQ-5 and AY-201 as well as pellicle
surfaces of their products, the subspecies of
G. xylinus were biosynthesized in static culture.
During the first incubation days, no significant
differences in the cultivation behavior of both
bacterial strains occurred. The microorganisms
always produced gelatinous and transparent sub-
stances on the surface of the HS medium. Compa-
rable to results of (Groebe et al. 1991), BC pellicles
were able to bind high amount of water. Typically,
these substances increasingly gained thickness and
became turbid after about three incubation days. The
maximum cellulose production could be observed
after 6 days cultivation period. The slight shift in the
incipient cellulose production with respect to the
growth of cells was due to a limitation of nutrients in
the HS medium. Thus, BC pellicles are considered as
products of the secondary metabolism of cells. It was
proven that the morphology of BC pellicles varied
between different subspecies of G. xylinus, and the
polydispersities were different for BC NQ-5 (Mw/
Mn = 2.82) and BC AY-201 (Mw/Mn = 5.69). Fur-
thermore, significant varieties in the pellicle forma-
tion occurred in the presence of b-D-glucose-U-13C6
(13C, 99%) with respect to b-D-glucose (13C, 1.1%).
BC NQ-5 was produced each with b-D-glucose (1)
and with b-D-glucose-U-13C6 (4). Considering their
sensitivity and associated risks of irregular pellicle
formation, AY-201 (ATCC 23769) cells were used
for the biosynthesis of two different batches of non-
enriched (2, 3) and 13C-labeled BC (5, 6). For both
batches, the simultaneous synthesis of non-enriched
BC NQ-5 served as reference (R1, R2). Reference
samples were prepared independently from the batch
of BC NQ-5 (1, 4), just for the purpose of comparison
with sample 1. R1 and R2 were biosynthesized using
the same non-enriched nutrient media as used for the
synthesis of the corresponding BC AY-201 (2, 3).
Thicknesses and weights of the biosynthesized BC
pellicles were analyzed. Each sample was weighted
again after air-drying. Table 1 shows results of the
never-dried BC pellicles (thicknesses dp) and after
sample drying (weights ma, fiber widths df).
1. In case of BC NQ-5, the pellicle formation
proceeded uniformly for the non-enriched and13C-labeled samples. The averaged pellicle thick-
nesses varied at about 0.7 mm. However, the part
of the produced dry mass of 13C-labeled BC (4,
ma & 17 mg) was obviously higher than that of
conventional BC NQ-5 (1, ma & 13 mg). The
pellicle growths of the reference samples R1 and
R2 occurred homogeneously as well, although
their dry masses were slightly lower (ma &12 mg) than that of sample 1.
2. In contrast, the first batch of BC AY-201 (BC
AY-2011: 2, 5) showed an inhomogeneous
growth of pellicles. After five incubation days,
a stagnancy of growth was observed for the non-
enriched BC 2 at about 2.5 mm pellicle thick-
ness, whereas the AY-201 cells already produced
more than twice the number (dp & 6 mm) of13C-labeled BC (5) in the same time. Pellicle
thicknesses and -weights of 2 and 5 were
significantly different. This fact permits several
explanations. The cellulose production of non-
enriched samples was obviously affected, which
might be due to impurities of the nutrient
medium. Qualitative differences in the HS
medium could also explain the lower mass of
R1 compared to BC 1. Furthermore, it could be
possible that AY-201 cells were able to metab-
olize the 13C-labeled b-D-glucose-U-13C6 more
efficiently than b-D-glucose.
142 Cellulose (2010) 17:139–151
123

3. Hence, a second batch of BC AY-201 (BC AY-
2012: 3, 6) was produced for verification, exhib-
iting pellicles of almost the same thicknesses
(dp & 11 mm), cf. Table 1. However, the
weights of the air-dried samples still varied to
about 1 mg between non-enriched (3) and 13C-
labeled BC AY-201 (6). Extremely different
thicknesses were measured for the two 13C-
enriched pellicles of BC AY-201 (5, 6), but their
weights in the air-dried state were identical
(ma & 7 mg). This fact suggests that AY-201
cells were able to include high and different
amount of water in the same mass of cellulose
pellicles. Since the nutrient media of both batches
were not varied, the process of water retention
was irregular and obviously uncontrollable.
In each case, however, a deceleration of pellicle
growth was observed with increasing time of incuba-
tion. This fact might be due to the limitation and a
non-warranted supply of nutrients in the HS medium.
The partial pressure of O2 decreased for instance with
increasing film thickness. Active bacteria were just
found in a subsurface band of 1 mm size. Further-
more, the concentration of b-D-glucose decreased with
longer incubation time, which was independent from
the 13C-labeling. The glucose was completely metab-
olized in the aerobic surface area after about 15 days.
Finally, it was shown that non-enriched samples of
BC NQ-5 and BC AY-201 were always of lower
mass than the 13C-enriched ones of the same batches.
Thus, b-D-glucose-U-13C6 (13C, 99%) seemed to
enhance the cellulose production.
Atomic force microscopy
The widths of cellulose fibers from common and 13C-
enriched BC pellicles were determined by atomic
force microscopy (AFM) for further quantitative
information. Different ranges have been scanned for
both subspecies of G. xylinus (Fig. 1).
It was found that a scan range of 5 9 5 lm was
optimum for quantitative analyses. AFM measurements
have been carried out at five different scan ranges for
each sample. The fiber widths could be determined by
SPM-9500J3 software, at which five fibers per mea-
surement were analyzed for each sample. The results
were averaged with a standard deviation of about 1 nm.
Even though drastic differences occurred in their
thicknesses and weights, the fiber widths of BC AY-
201 were almost constant for 13C-labeled- and non-
enriched pellicles, cf. Table 1. In contrast, the
averaged fiber width of BC NQ-5 decreased by
14 nm (17%) from 81 nm to about 67 nm using b-D-
glucose-U-13C6 (13C, 99%) for the biosynthesis.
Pellicle thicknesses and -weights (Table 1), however,
suggested that NQ-5 cells prefer metabolizing 13C-
labeled b-D-glucose. Considering the smaller fiber
widths of 13C-enriched BC NQ-5 in combination with
Table 1 Averaged pellicle thicknesses (mm), -weights (mg), and fiber widths (nm) of bacterial celluloses biosynthesized by G.xylinus strains
Pellicle thicknessesa
dp (mm)
Pellicle weightsa
ma (mg)
Fiber widthsa
df (nm)
R1 Reference BC NQ-5 5.8 11.7 -/-
R2 6.8 11.8 -/-
b-D-glucose (13C, 1.1%) 1 BC NQ-5 7.0 13.1 81.1
2 BC AY-201b 2.5 3.6 59.0
3 BC AY-201c 10.5 5.7 60.0
b-D-glucose-U-13C6 (13C, 99%) 4 BC NQ-5 7.7 16.9 67.4
5 BC AY-201b 6.2 6.8 59.2
6 BC AY-201c 10.8 6.6 60.5
R1/R2 reference BC of the two batches of BC AY-201a Standard deviations turned out to be 0.5 mm (thicknesses), 0.8 mg (weights), and 1 nm (widths); fiber widths were obtained by 25
single measurements per BC pellicle using AFMb First batch of BC AY-201 (2, 5)c Retry (3, 6)
Cellulose (2010) 17:139–151 143
123

slower cell movement on templates and higher cell
division rates of G. xylinus NQ-5 in 13C-enriched HS
media (Hesse and Kondo 2005), b-D-glucose-U-13C6
(13C, 99%) seemed to stimulate the cell division only.
Consequently, more NQ-5 bacteria produced a
larger quantity of cellulose with averaged smaller
fiber widths in the presence of the 13C-isotope in the
same time. In comparison, AY-201 bacteria were also
swayed by the 13C-labeling of the carbon source, but
they were more susceptible to least modifications of
the HS medium and/or cultivation conditions.
Wide-angle X-ray diffraction
The parameters of the supermolecular structure of BC
pellicles like crystallite sizes and orientations were
determined by wide-angle X-ray diffraction (WAXD)
measurements. In this work, the convention of (Sarko
and Muggli 1974) was used for the description of BC.
Figure 2 and 3 show that, in general, each of the
typical reflections of cellulose I could be found.
Usually, the (110) crystal lattice planes describe
the orientation of crystallites to the sample surface. In
case of BC NQ-5 (1, 4), the reflections qualitatively
pointed out a crystalline cellulose modification I of
high degree of order (Fig. 2). Figure 3 shows WAXD
curves of BC AY-201 (2, 3, 5, and 6); here, an
additional interference at 2H = 12.6� was detected
for sample 2, which was not typical for native
cellulose of modification I. It could be assigned to the
(1-10) crystal lattice plane of cellulose II indicating a
change in the cellulose polymorphs of BC AY-2011
(2). However, sample 2 was characterized by a high
planar orientation. It was confirmed previously that
the typical structure of cellulose produced by wild-
type ATCC 23769 cells was a twisting ribbon of
cellulose I and furthermore, a small quantity of
anomalous material. This band material composed
of cellulose II was recognized by careful examination
(Brown et al. 1976; Brown 1989; Kuga et al. 1993). A
continuative phenomenon was found by (Hirai et al.
1997). They stated that the same cell of ATCC 23769
Fig. 1 AFM topographies
(5 9 5 lm) of bacterial
celluloses produced by
different G. xylinus strains
in different culture media: acommon BC AY-2012 (3),
b 13C-enriched BC AY-
2012 (6), c common BC
NQ-5 (1), and d 13C-
enriched BC NQ-5 (4)
144 Cellulose (2010) 17:139–151
123

can produce cellulose I and II depending on the
culture temperature. Thus, the bacterium AY-201
seems to be readily manipulable. Cellulose produced
by these cells possibly consists of a compound of
cellulose modification I and II meaning that the
cultivation conditions widely influenced the amount
of biosynthesized cellulose II by the bacterium.
Additionally, the first batch of BC AY-201 (2, 5)
exhibited the abort of pellicle’s growth in common
HS media after 5 days incubation time, whereas b-D-
glucose-U-13C6 (13C, 99%) forced bacteria to keep on
biosynthesizing cellulose. Finally, the two 13C-
enriched pellicles of BC AY-201 (5, 6) were twice
as thick as pellicles grown in common HS media (2,
3), cf. Table 1. Moreover, their WAXD curves
diverge. Neither for the 13C-labeled BC of the first
batch nor for the 13C-enriched one of the retry, such
an intensive reflex was detected at 12.6� as for the
non-enriched pellicle of the first batch of BC AY-201
(2). Crystal lattice planes, wide angle 2H, and
distance d of this sample were given in cursive
characters in Table 2. All of the other data were
averaged.
To analyse WAXD curves, the crystallite index CI
was determined according to (Jayme and Knolle
1964) using Eq. 1. Their method is mainly based on
investigations of (Hermans and Weidinger 1946) and
(Kast and Flaschner 1948).
CI ¼ Fc
Fc þ Fa
ð1Þ
The CI values of the WAXD intensity curves were
determined using integral values of crystalline and
non-crystalline regions obtained by ORIGIN PEAK
FITTING. Results of five measurements were averaged;
the maximum standard deviation is 0.01.
Crystallinity values between 64.4 and 66.5% were
determined. However, there was almost no difference
between pellicles of the different G. xylinus strains
nor of different 13C-percentage. BC NQ-5 (1, 4)
exhibited more crystalline parts than pellicles of BC
AY-201; and in each case, the crystallinity values
decreased marginally by 13C-enrichment. These
results correlate with CP/MAS 13C{1H}-NMR data.
Generally, Bragg reflections cannot be sharpened
randomly, they were broadened. This fact was
described quantitatively by D(2H), the full width at
half maximum (FWHM), of the observed reflections
that have FWHM as a function of the wide angle 2H.
The experimentally obtained FWHM values of the
respective line positions were caused by the finite
grading of the tested powder and were inversely
correlated to the crystallite sizes. The FWHM values
increased with decreasing number of the involved
crystal lattice planes. The crystallite dimensions of
the equatorial and meridional wide-angle interfer-
ences could be calculated from the size-depending
increment of the FWHM values using the formula of
Scherrer 2. It should be noted that FWHM values
were falsified by crystal lattice defects, broad grain
size distributions, and instrumental peak broadening.
Thus, experimentally determined crystallite sizes
should refer to as averaged minimum crystallite
dimensions. In case of cellulose, the deviation from
Fig. 2 WAXD curves of bacterial cellulose pellicles of the
strain G. xylinus NQ-5 that were biosynthesized a In 13C-
enriched culture liquid (4) and b In common HS medium (1); #
meridian interferences
Fig. 3 WAXD curves of bacterial cellulose pellicles of the
strain G. xylinus AY-201 that were biosynthesized a In 13C-
enriched culture liquid (5, 6) and b In common HS medium (2,
3). # meridian interferences; * reflex of the (1–10) plane of
cellulose II. 1first batch of BC AY-201 (2, 5), 2retry (3, 6)
Cellulose (2010) 17:139–151 145
123

the actual crystallite dimensions should be less than
10% (Fink and Walenta 1994; Fink et al. 1995).
D 2Hð Þ�¼ k � kDhkl � cos Hð Þ ð2Þ
The parameters of Equation 2 were defined as
follows: Dhkl = crystallite size � k, k = 0.89, D(2H)*
= FWHM-increment, k = wavelength of CuKa-irradi-
ation, and 2H = wide angle. It should be mentioned
that D(2H)* just describes an increment of FWHM that
contains an equipment-sourced part besides the actually
resulting FWHM valueD(2H) from the experiment. The
parameter variation, depending on the X-ray diffraction
equipment, was not included in the calculations.
Independent from the 13C-enrichment, the crystal-
lite sizes of BC averaged out to be 5–7 nm for both,
BC NQ-5 and BC AY-201 with the exception of the
(012) crystal lattice plane of BC NQ-5 (1, 4). Here,
crystallite sizes turned out to be Dhkl[ & 12 nm for
the non-enriched and 13C-labeled samples. No
remarkable difference between common BC pellicles
and BC grown on the 13C isotope was found.
NIR FT-Raman spectroscopy
Previously, it was published that NIR FT-Raman
spectra of 3 days old cellulose fibers produced by G.
xylinus NQ-5 in shaken cultures clearly proved the
polymorphic state of cellulose I (Hesse and Kondo
2005).
In this work, NIR FT-Raman spectra demonstrated
the vibrational behavior of BC NQ-5- and BC AY-201
pellicles depending on the polymorphic state of
cellulose. The assignment of vibrational modes was
derived from literature (Blackwell et al. 1970; Atalla
1976; Wiley and Atalla 1987). Our focus was simply
directed towards the vibrational modes in the confor-
mational sensitive range below 1,500 cm-1 that were
favorable for characterizing polymorphic changes.
The cross-denoted wave numbers of the NIR FT-
Raman spectra of BC pellicles (BC NQ-5: 1, 4; BC
AY-2012: 3, 6) in Fig. 4 clearly indicated vibrational
frequencies, which characterized the crystalline phase
of cellulose I. Similar results were obtained for BC
AY-2011 (2, 5—without illustration).
Table 2 Averaged crystallite indices CI, crystallinities xc (%), wide angles 2H, full widths at half maximum D(2H), crystallite sizes
Dhkl (nm) and distances d (nm) of bacterial cellulose pellicles produced by G. xylinus strains
Lattice plane Bacterial cellulose from G. xylinus ATCC 53582 (NQ-5)
Natural 13C abundance (1.1%) (CI = 0.665, xc = 66.5%) Uniformly 13C-labeled (94%) (CI = 0.651, xc = 65.1%)
2H (�) D(2H) Dhkl (nm) d (nm) 2H (�) D(2H) Dhkl (nm) d (nm)
1 -1 0 14.7 0.741 10.7 0.604 14.6 0.741 10.7 0.605
1 1 0 17.1 1.231 6.5 0.517 17.1 1.330 6.0 0.518
0 1 2 20.6 0.769 10.4 0.431 20.6 0.612 13.1 0.432
2 0 0 22.9 1.404 5.7 0.387 22.9 1.365 5.9 0.388
0 0 4 35.0 1.263 6.5 0.256 34.9 1.212 6.8 0.257
Lattice plane Bacterial cellulose from G. xylinus ATCC 23769 (AY-201)
Natural 13C abundance (1.1%) (CI = 0.657, xc = 65.7%) Uniformly 13C-labeled (94%) (CI = 0.644, xc = 64.4%)
2H (�) D(2H) Dhkl (nm) d (nm) 2H (�) D(2H) Dhkl (nm) d (nm)
1 -1 0 12.6 -/- -/- 0.700 -/- -/- -/- -/-
1 -1 0 15.0 -/- -/- 0.591 15.0 -/- -/- 0.590
1 1 0 17.2 1.275 6.2 0.515 17.2 1.271 6.3 0.516
0 1 2 20.6 1.299 6.2 0.432 20.5 1.365 5.9 0.431
2 0 0 23.0 1.440 5.6 0.387 23.0 1.482 5.4 0.387
0 0 4 35.0 1.247 6.6 0.256 35.0 1.259 6.5 0.256
BC NQ-5: samples 1, 4, R1, and R2 were investigated; BC AY-201: samples 2, 5, 3, and 6 were investigated. Cursive values: sample
2 (BC AY-2011)
146 Cellulose (2010) 17:139–151
123
The internal coordinates of the frequency range of
1,500–800 cm-1 were due to modes involving con-
siderable couplings of methine bending, methylene
rocking and wagging, and COH in-plane bending
vibrations. Except for the internal modes of the
CH2OH groups, all motions were completely delo-
calized. The results of the NIR FT-Raman spectra of
samples 1–6 were in good agreement with data of BC
published by (Schenzel and Fischer 2001), even
though just medium-weak intensity bands could be
detected below 1,400 cm-1 compared with the band at
1,452 cm-1. Interestingly, the NIR FT-Raman band
at 895 cm-1, which was inversely correlated with the
lateral size of the cellulose crystallites (Wiley and
Atalla 1987), possessed a very low intensity. 13C-
NMR experiments of native celluloses suggested that
the intensity of this band is proportional to the
amount of disorder in cellulose (VanderHart & Atalla
1984). Accordingly, the weak NIR FT-Raman band at
895 cm-1 was an indication of the high order of
crystalline state of the biosynthesized cellulose
pellicles. The vibrational spectrum of BC in the
range of skeletal deformations was characterized by
typical Raman peaks: 435, 378, 345 and 328 cm-1.
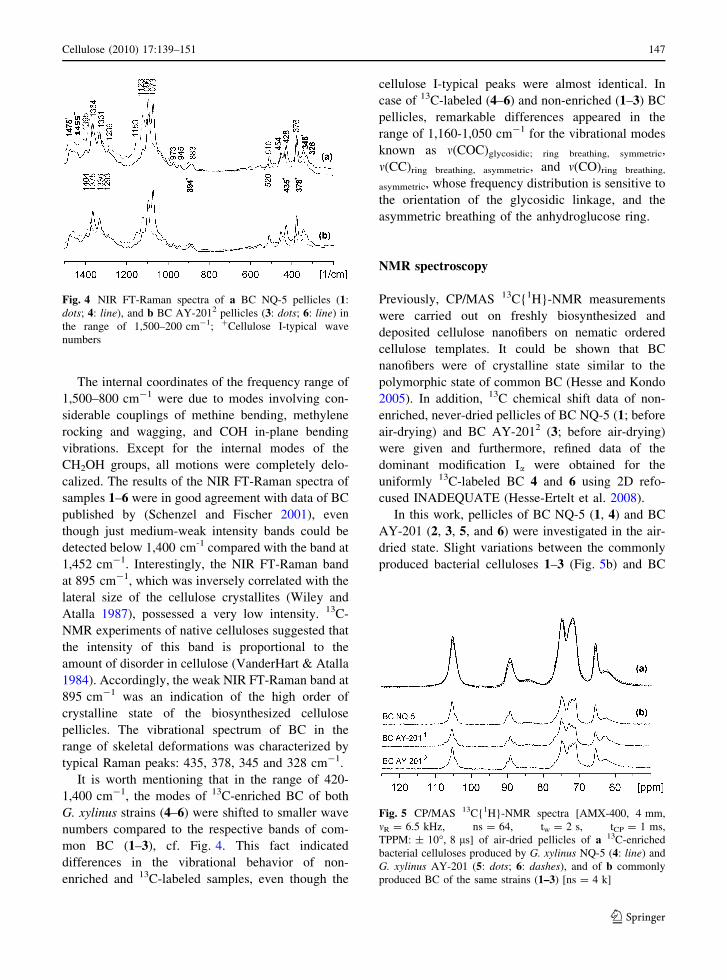
It is worth mentioning that in the range of 420-
1,400 cm-1, the modes of 13C-enriched BC of both
G. xylinus strains (4–6) were shifted to smaller wave
numbers compared to the respective bands of com-
mon BC (1–3), cf. Fig. 4. This fact indicated
differences in the vibrational behavior of non-
enriched and 13C-labeled samples, even though the
cellulose I-typical peaks were almost identical. In
case of 13C-labeled (4–6) and non-enriched (1–3) BC
pellicles, remarkable differences appeared in the
range of 1,160-1,050 cm-1 for the vibrational modes
known as m(COC)glycosidic; ring breathing, symmetric,
m(CC)ring breathing, asymmetric, and m(CO)ring breathing,
asymmetric, whose frequency distribution is sensitive to
the orientation of the glycosidic linkage, and the
asymmetric breathing of the anhydroglucose ring.
NMR spectroscopy
Previously, CP/MAS 13C{1H}-NMR measurements
were carried out on freshly biosynthesized and
deposited cellulose nanofibers on nematic ordered
cellulose templates. It could be shown that BC
nanofibers were of crystalline state similar to the
polymorphic state of common BC (Hesse and Kondo
2005). In addition, 13C chemical shift data of non-
enriched, never-dried pellicles of BC NQ-5 (1; before
air-drying) and BC AY-2012 (3; before air-drying)
were given and furthermore, refined data of the
dominant modification Ia were obtained for the
uniformly 13C-labeled BC 4 and 6 using 2D refo-
cused INADEQUATE (Hesse-Ertelt et al. 2008).
In this work, pellicles of BC NQ-5 (1, 4) and BC
AY-201 (2, 3, 5, and 6) were investigated in the air-
dried state. Slight variations between the commonly
produced bacterial celluloses 1–3 (Fig. 5b) and BC
Fig. 4 NIR FT-Raman spectra of a BC NQ-5 pellicles (1:
dots; 4: line), and b BC AY-2012 pellicles (3: dots; 6: line) in
the range of 1,500–200 cm-1; ?Cellulose I-typical wave
numbers
Fig. 5 CP/MAS 13C{1H}-NMR spectra [AMX-400, 4 mm,
mR = 6.5 kHz, ns = 64, tw = 2 s, tCP = 1 ms,
TPPM: ± 10�, 8 ls] of air-dried pellicles of a 13C-enriched
bacterial celluloses produced by G. xylinus NQ-5 (4: line) and
G. xylinus AY-201 (5: dots; 6: dashes), and of b commonly
produced BC of the same strains (1–3) [ns = 4 k]
Cellulose (2010) 17:139–151 147
123

4–6, grown on the 13C-isotope, (Fig. 5a) could be
proved. Furthermore, differences in the NMR spectra
of the two batches of BC AY-201 occurred.
Figure 5a shows CP/MAS 13C{1H}-NMR spectra
of uniformly 13C-labeled BC samples 4–6. The
samples were called BC NQ-5 (4; line), BC AY-
2011 (5; dots), and BC AY-2012 (6; dashes). The data
show that the 13C-enrichment of samples 4-6 was
successful with about 94% yield, virtually uniformly
at all carbon positions. Compared to CP/MAS13C{1H}-NMR spectra of non-enriched BC, the line
shape characteristics and spectral resolution of the
three fully 13C-labeled samples in Fig. 5a were rather
limited because of the strong homonuclear dipolar
carbon–carbon couplings. Nevertheless, line shape
analysis allowed the assignment of all 13C chemical
shifts of samples 4–6 on the basis of values of non-
enriched BC (Hesse-Ertelt et al. 2008). There was no
significant shift in their isotropic values.
As aforementioned, Fig. 5b shows CP/MAS13C{1H}-NMR spectra of the non-enriched samples
1–3. At first view, spectra exhibited typical resonances
of cellulose modification I. However, varieties were
observed for the different subspecies of G. xylinus.
Comparing the non-enriched pellicles of BC AY-2011
(2) and BC AY-2012 (3), slight differences in the
spectral line shapes became apparent. In case of BC 2,
additional parts could be detected, cf. Fig. 5b. The
consideration of these additional parts was necessary
for further analysis of sample 2. Contrary to BC 2, no
indication of structural changes was observed for the
respective 13C-labeled sample in Fig. 5a, which might
be due to the line broadening of the CP/MAS 13C{1H}-
NMR spectra.
The CP/MAS 13C{1H}-NMR spectra of non-
enriched, never-dried pellicles of BC NQ-5 (1; before
air-drying) and BC AY-2011 (2; before air-drying)
were used for exact assignment, cf. Fig. 6. The 13C
chemical shifts of each BC could be readily assigned
by line shape analysis taking into account data from
the literature, e.g. (Kono et al. 2003). The fact that the
chains in cellulose Ia are constructed by –A1–A2– b-
D-glucopyranose repeating units, while cellulose Ib is
composed of two independent chains –B–B– and
–B0–B0– (Kono and Numata 2006), was fully consis-
tent with NMR data obtained. Caused by the excel-
lent spectral resolution of the never-dried samples,
CP/MAS 13C{1H}-NMR spectra were easily investi-
gated by line shape analysis, cf. (Hesse-Ertelt et al.
2008). In case of BC AY-2011 (2; before air-drying)
an assignment was exclusively possible taking into
account 13C chemical shift data of other crystalline
modifications of cellulose. Resonances at 107.4 and
76.8 ppm could be assigned to the C11 and C32
carbons of cellulose II, which might be a attributed to
conformational changes of the BC AY-2011 (2).
Moreover, Fig. 6a showed peaks at 87.8 ppm and
between 63 and 64 ppm corresponding to carbons of
cellulose II, meaning that sample 2 consists of
different cellulose modifications. These results were
consistent with WAXD data. It should be mentioned
that additional resonances could not be observed for
BC AY-201 of the retry preparation (3). The 13C-
chemical shifts of pellicle 3 were in good agreement
with data of BC NQ-5 (1) and each of the reference
samples (R1, R2), respectively. By means of line
shape analysis, the cellulose I-type with a high
content of the Ia-allomorph could also be proved for
the pellicles of BC NQ-5 (4) and BC AY-201 (5, 6)
biosynthesized in HS medium containing b-D-glu-
cose-U-13C6 (Ia:Ib & 2.5:1).
Crystalline parts Ic (%) and Ia/Ib ratios of the
several BC samples obtained by line shape analysis
were summarized in Table 3. Basically, it could be
shown in Fig. 5a that 13C-labeled BC from G. xylinus
ATCC 53582 and ATCC 23769 were of high
crystallinity. As for the commonly produced BC
NQ-5 (1), the quantitative analysis of the C4 reso-
nances of the crystalline (*90 ppm) and amorphous
(*84 ppm) components indicated that only about
one-fourth of the 13C-labeled BC NQ-5 (4) occurred
Fig. 6 CP/MAS 13C{1H}-NMR spectra [AMX-400, 4 mm,
mR = 6.5 kHz, tw = 2 s, tCP = 1 ms, ns = 20 k,
TPPM: ± 10�, 7 ls] of non-enriched BC pellicles produced
by a G. xylinus AY-201 (2; before air-drying) and b G. xylinusNQ-5 (1; before air-drying); *signs of an incipient change of
the cellulose structure
148 Cellulose (2010) 17:139–151
123

in non-crystalline regions. Comparable results were
obtained for both batches of the 13C-labeled BC AY-
201 (5, 6).<Dummy RefID="Tab3
In principle, the crystallinity values determined by13C-NMR spectroscopy (Ic = 67…71%) were mar-
ginally higher than the WAXD data obtained
(xc = 64.4…66.5%). Crystallinities of about 70%
and the ratio of the crystalline modifications
(Ia:Ib & 2.6:1) were similar to data from e.g.
(Watanabe et al. 1998) and comparable to the values
of never-dried BC from G. xylinus DSM 14666
(Hesse and Jaeger 2005), even though CP/MAS13C{1H}-NMR spectra of non-enriched BC AY-201
(2) indicated structural changes and the simultaneous
existence of cellulose I- and II-type.
Conclusion
It was shown that b-D-glucose-U-13C6 (13C, 99%)
possibly enhanced the cellulose production of
G. xylinus ATCC 53582 (NQ-5) and ATCC 23769
(AY-201) depending on the cell type. Usually, non-
enriched samples of BC NQ-5 and BC AY-201 were of
lower mass than the 13C-enriched ones of the same
batches. No differences could be found in fiber widths
of BC AY-201 pellicles, while the averaged fiber width
of BC NQ-5 decreased by 17% using b-D-glucose-
U-13C6 (13C, 99%) for the biosynthesis. Thus, NQ-5
bacteria produced a larger quantity of averaged smaller
fibers in the presence of the 13C-isotope, meaning that
b-D-glucose-U-13C6 (13C, 99%) stimulated the cell
division. This fact is in agreement with previous results
(Hesse and Kondo 2005). Using NIR FT-Raman
spectroscopy, further differences in the vibrational
behavior of non-enriched and 13C-labeled samples of
G. xylinus NQ-5 and AY-201 occurred, even though
the cellulose I-typical peaks were almost identical. For
the non-enriched and 13C-labeled material, remarkable
differences appeared for the skeletal stretching vibra-
tions m(COC), whose frequency distribution is sensi-
tive to the orientation of the glycosidic linkage, and the
asymmetric breathing of the anhydroglucose ring
known as m(CC) and m(CO) vibrations. For BC NQ-5
and BC AY-201, the crystallite sizes of pellicles
averaged out to be 5–12 nm independent from the13C-enrichment of the samples. Crystallinities of about
70% found by 13C-NMR were marginally greater than
the WAXD data, however, no remarkable differences
between common BC and BC pellicles grown on the13C isotope were found by WAXD- and NMR-
investigations. The ratio of the crystalline modifica-
tions (Ia:Ib & 2.6:1) was comparable to the values of
never-dried BC from G. xylinus DSM 14666 (Hesse
and Jaeger 2005), even though CP/MAS 13C{1H}-
NMR spectra of the non-enriched BC AY-201 indi-
cated conformational changes. It should be mentioned
that strong fluctuations in the pellicle formation of BC
AY-201 occurred, due to inconsistent water retention.
In summary, the use of 13C-labeled D-glucose can lead
to changes in the nature of the cellulose that might not
be detectable by NMR- or WAXD-, but using NIR
FT-Raman and AFM investigations. Consequently,
some degree of caution is required, even using 13C-
enriched material as standard model in solid-state NMR.
Acknowledgments This research was financial supported by
the Friedrich Schiller University of Jena (Foerderung von Frauenin Forschung und Lehre, Kapitel 1524/TG 84, 2002) for StHE, by
MAFF Nanotechnology Project, Ministry of Agriculture, Forestry
and Fisheries, and partly by a Grant-in-Aid for Scientific Research
(No. 14360101), Japan Society for the Promotion of Science
(JSPS) for TK. The authors are also indebted to Dr. U. Sternberg
(FZ Karlsruhe, Germany) for partly financing D-glucose-U-13C6.
Table 3 Quantitative signal analysis of the CP/MAS 13C{1H}-NMR spectra (Fig. 5)
Natural 13C abundance (1.1%) Uniformly 13C-labeled (94%)
BC NQ-5 BC AY-201a BC AY-201b BC NQ-5 BC AY-201a BC AY-201b
1 2 3 4 5 6
Ia:Ib 2.7:1 2.2:1 2.7:1 2.6:1 2.4:1 2.5:1
Ic (%) 71 67 72 69 67 69
xc (%) 67 -/- 66 65 -/- 64
Determination of the ratio Ia:Ib and the crystalline rates Ic (%) by line shape analysis of the C1 and C4 resonancesa First batch of BC AY-201 (2, 5)b Retry (3, 6)
Cellulose (2010) 17:139–151 149
123

We thank Dr. S. Kimura and Ms. A. Morohoshi (FFPRI Tsukuba,
Japan) for their kind assistance through this research, and Dr. W.
Plass and Dr. A. Pohlmann (IAAC, FSU Jena, Germany) for
providing the NIR FT-Raman spectrometer. StHE particularly
thanks TK for the chance of sample preparation and
characterization with his former group at the Forestry and Forest
Products Research Institute (FFPRI), Matusnosato 1, Tsukuba,
Ibaraki 305-8687, Japan.
References
Arashida T, Ishino T, Kai A, Hatanaka K, Akaike T, Matsuzaki
K, Kaneko Y, Mimura T (1993) Biosynthesis of cellulose
from culture media containing 13C-labeled glucose as a
carbon source. J Carbohydr Chem 12:641–649
Atalla RH (1976) Raman spectral studies of polymorphy in
cellulose. Part I: Celluloses I and II. Appl Polym Symp
28:659–669
Atalla RH, VanderHart DL (1999) The role of solid state 13C
NMR spectroscopy in studies of the nature of native
celluloses. Solid State Nucl Magn Reson 15:1–19
Blackwell J, Vasko PD, Koenig JL (1970) Infrared and Raman
spectra of the cellulose from the cell wall of Valoniaventricosa. J Appl Phys 41:4375–4379
Bohn A (2000) Rontgenuntersuchungen zur Vorzugsorientie-
rung und ubermolekularen Struktur nativer und regeneri-
erter Cellulose. Dissertation, TU Berlin
Bohn A, Fink HP, Ganster J, Pinnow M (2000) X-ray texture
investigations of bacterial cellulose. Macromol Chem
Phys 201:1913–1921
Brown RM Jr (1989) Cellulose biogenesis and a decade of
progress: a personal perspective. In: Schuerch C (ed)
Cellulose and wood: chemistry and technology. John
Wiley and Sons, New York, pp 639–657
Brown RM Jr, Willison JHM, Richardson CL (1976) Cellulose
biosynthesis in Acetobacter xylinum: visualization of the
site of synthesis and direct measurement of the in vivo
process. Proc Natl Acad Sci USA 73:4565–4569
Earl WL, VanderHart DL (1982) Measurement of 13C chemical
shifts in solids. J Magn Reson 48:35–54
Erata T, Shikano T, Yunoki S, Takai M (1997) The complete
assignment of the 13C CP/MAS NMR spectrum of native
cellulose by using 13C labeled glucose. Cellulose Com-
mun 4:128–131
Evans RJ, Wang D, Agblevor FA, Chum HL, Baldwin SD
(1996) Mass spectrometric studies of the thermal
decomposition of carbohydrates using 13C-labeled cellu-
lose and glucose. Carbohydr Res 281(2):219–235
Fink HP, Walenta E (1994) Models of cellulose structure from
the viewpoint of the cellulose I ? II transition. Papier
12:739–748
Fink HP, Hofmann D, Philipp B (1995) Some aspects of lateral
chain order in cellulosics from X-ray scattering. Cellulose
2:51–70
Fink HP, Purz HJ, Bohn A, Kunze J (1997) Investigation of the
supramolecular structure of never dried bacterial cellu-
lose. Macromol Symp 120:207–217
Fischer S, Schenzel K, Fischer K, Diepenbrock W (2005)
Applications of FT Raman spectroscopy and micro
spectroscopy characterizing cellulose and cellulosic bio-
materials. Macromol Symp 223:41–56
Gagnaire D, Taravel FR (1980) Biosynthese de cellulose bac-
terienne a partir de D-glucose uniformement enrichi en13C. Eur Biochem 103:133–143
Ganster J, Fink HP (1999) Physical constants of cellulose. In:
Immergut EH, Grulke EA (eds) Polymer handbook, 4th
edn. Wiley, New York, p V/135ff
Groebe A, Chmiel H, Strathmann H (1991) Verfahren zur
Herstellung von Cellulose-Membranen aus bakteriell
erzeugter Cellulose. EU Patent No. 0416470A2
Hermans PH, Weidinger A (1946) On the recrystallization of
amorphous cellulose. J Am Chem Soc 68:2547–2552
Hesse S, Jaeger C (2005) Determination of the 13C chemical
shift anisotropies of cellulose I and cellulose II. Cellulose
12:5–14
Hesse S, Kondo T (2005) Behavior of cellulose production of
Acetobacter xylinum in 13C-enriched cultivation media
including movements on nematic ordered cellulose tem-
plates. Carbohydr Polym 60(4):457–465
Hesse-Ertelt S, Witter R, Ulrich AS, Kondo T, Heinze T (2008)
Spectral assignments and anisotropy data of cellulose Ia:13C-NMR chemical shift data of cellulose Ia determined
by INADEQUATE and RAI techniques applied to uni-
formly 13C-labeled bacterial celluloses of different Glu-conacetobacter xylinus strains. Magn Reson Chem
46:1030–1036
Hestrin S, Schramm M (1954) Synthesis of cellulose by Ace-tobacter xylinum. 2. Preparation of freeze dried cells
capable of polymerizing glucose to cellulose. Biochem J
58:345–352
Hirai A, Tsuji M, Horii F (1997) Culture conditions producing
structure entities composed of cellulose I and II in bac-
terial cellulose. Cellulose 4:239–245
Jayme G, Knolle H (1964) The empirical X-ray determination
of the degree of crystallinity of cellulosic material. Papier
18:249–255
Kai A, Arashida T, Hatanaka K, Akaike T, Matsuzaki K,
Mimura T, Kaneko Y (1994) Analysis of the biosynthetic
process of cellulose and curdlan using 13C-labeled glu-
cose. Carbohydr Polym 23:235–239
Kai A, Karasawa H, Kikawa M, Hatanaka K, Matsuzaki K,
Mimura T, Kaneko Y (1998) Biosynthesis of 13C-labeled
branched polysaccharides by pestalotiopsis from 13C-
labeled glucoses and the mechanism of formation. Car-
bohydr Polym 35:271–278
Kast W, Flaschner L (1948) Eine rontgenographische Methode
zur Bestimmung des Verhaltnisses von kristalliner und
amorpher Substanz in Zellulosefasern. Coll Polym Sci
111(1):6–15
Klemm D, Schumann D, Udhardt U, Marsch S (2001) Bacterial
synthesized cellulose—artificial blood vessels for micro-
surgery. Prog Polym Sci 26:1561–1603
Klemm D, Heublein B, Fink HP, Bohn A (2005) Cellulose:
Fascinating biopolymer and sustainable raw material.
Angew Chem Int Ed 44:3358–3393
Kondo T, Togawa E, Brown RM Jr (2001) Nematic ordered
cellulose: a concept of glucan chain association. Bio-
macromolecules 2:1324–1330
Kondo T, Nojiri M, Hishikawa Y, Togawa E, Romanovicz D,
Brown RM Jr (2002) Biodirected epitaxial nanodeposition
150 Cellulose (2010) 17:139–151
123

of polymers on oriented macromolecular templates. Proc
Natl Acad Sci USA 99:14008–14013
Kono H, Numata Y (2006) Structural investigation of cellulose
Ia and Ib by 2D RFDR NMR spectroscopy: determination
of sequence of magnetically inequivalent D-glucose units
along cellulose chain. Cellulose 13:317–326
Kono H, Yunoki S, Shikano T, Fujiwara M, Erata T, Takai MJ
(2002) CP/MAS 13C NMR study of cellulose and cellu-
lose derivatives. 1. Complete assignment of the CP/MAS13C NMR spectrum of the native cellulose. Am Chem Soc
124:7506–7511
Kono H, Erata T, Takai M (2003) Determination of the
through-bond carbon–carbon and carbon-proton connec-
tivities of the native celluloses in the solid state. Macro-
molecules 36:5131–5138
Kuga S, Brown RM Jr (1991) Physical structure of cellulose
microfibrils: Implication for biogenesis. In: Haigler CH,
Weimer PJ (eds) Biosynthesis and biodegradation of
cellulose. M. Dekker, Inc, New York, Basel, Hong Kong,
p VI/125ff
Kuga S, Takagi S, Brown RM Jr (1993) Native folded-chain
cellulose II. Polymer 34:3293–3297
Meyer KH, Misch L (1937) Position des atomes dans le nou-
veau module spatial de la cellulose. Helv chim Acta
20:232–244
Numata Y, Kono H, Kawano S, Erata T, Takai M (2003)
Cross-polarization/magic-angle spinning 13C nuclear
magnetic resonance study of cellulose I–ethylenediamine
complex. J Biosci Bioeng 96:461–466
Sarko A, Muggli R (1974) Packing analysis of carbohydrates
and polysaccharides. III. Valonia cellulose and cellulose
II. Macromolecules 7:486–494
Schenzel K, Fischer S (2001) NIR FT Raman spectroscopy–a
rapid analytical tool for detecting the transformation of
cellulose polymorphs. Cellulose 8:49–57
Schenzel K, Fischer S, Brendler E (2005) New method for
determining the degree of cellulose I crystallinity by
means of FT Raman spectroscopy. Cellulose 12:223–231
Seifert M, Hesse S, Kabrelian V, Klemm D (2004) Controlling
the water content of never dried and reswollen bacterial
cellulose by the addition of water-soluble polymers to the
culture medium. J Polym Sci A (Chem) 42:463–470
Togawa E, Kondo T (1999) Change of morphological prop-
erties in drawing water-swollen cellulose films prepared
from organic solutions: a view of molecular orientation in
the drawing process. J Polym Sci B (Phys) 37:451–459
Udhardt U, Hesse S, Klemm D (2005) Analytical investiga-
tions of bacterial cellulose. Macromol Symp 223:201–212
VanderHart DL, Atalla RH (1984) Studies of microstructure in
native celluloses using solid state 13C NMR. Macromol-
ecules 17:1465–1472
Watanabe K, Tabuchi M, Morinaga Y, Yoshinaga F (1998)
Structural features and properties of bacterial cellulose
produced in agitated culture. Cellulose 5:187–200
Wiley JH, Atalla RH (1987) Bands assignments in the Raman
spectra of celluloses. Carbohydr Res 160:113–129
Cellulose (2010) 17:139–151 151
123