Embed Size (px)
Citation preview

coatings
Article
Structure and Properties of AlCrN CoatingsDeposited Using Cathodic Arc Evaporation
Bogdan Warcholinski * , Adam Gilewicz, Piotr Myslinski, Ewa Dobruchowska andDawid Murzynski
Faculty of Mechanical Engineering, Koszalin University of Technology, 75-453 Koszalin, Poland;[email protected] (A.G.); [email protected] (P.M.);[email protected] (E.D.); [email protected] (D.M.)* Correspondence: [email protected]; Tel.: +48-94-3486-334
Received: 10 July 2020; Accepted: 13 August 2020; Published: 15 August 2020
Abstract: Al–Cr–N coatings were formed at various nitrogen pressures, substrate bias voltages andsubstrate temperatures using cathodic arc evaporation. The relationship between technologicalparameters and properties of the coatings was investigated. The phase and chemical compositionof the coatings, roughness, hardness, adhesion and thermal stability were analyzed by X-raydiffraction (XRD), scanning electron microscope (SEM), Energy-dispersive X-ray spectroscopy (EDX),micro-indenter, Rockwell, scratch tester and thermomechanical methods. The corrosion resistanceof selected coatings was also investigated. XRD analysis indicates that the coatings crystallize in acubic structure and show preferential orientation (200) CrN. With the increase of nitrogen pressure,the preferential orientation changes to (111). EDX analysis shows that as nitrogen pressure increases,the Al/(Al + Cr) rate decreases. Microscopic observations indicate that the number of macroparticlesreduces as nitrogen pressure increases. As a result, the surface roughness parameter Ra of the coatingsdecreases. The effects of deposition temperature, nitrogen pressure and substrate bias voltage onthe mechanical and tribological properties of the coatings were investigated. It was found that theabove parameters influence the mechanical properties in different ways. The hardness and adhesionof coatings formed at higher temperatures was lower. Coatings formed under a higher nitrogenpressure or substrate bias voltage were characterized by higher hardness and better wear resistance.
Keywords: PVD coating; AlCrN; hardness; adhesion; roughness; thermal stability
1. Introduction
Chromium nitride coatings have found wide industrial applications due to their goodmechanical and tribological properties and corrosion resistance [1,2]. However, their relativelylow hardness as compared to the other coatings of transition metal nitrides reduces the area of theirapplication—especially in tribology, in which the hardness is crucial. Additionally, for high-temperatureapplications, the thermal coating’s stability determines the lifetime [3].
An addition to the two-component Cr–N coatings, metallic and nonmetal elements can provideimprovement in their properties, including increased hardness [4–7].
The coatings were deposited on separate Al and Cr cathodes [6,8] and from alloy cathodes withthe composition Al1-xCrxN, where x = 0.2 [9], 0.3 [7,10], 0.5 [11]. Another composition of cathodes wasalso used [4,5,7,12–15]. It was found that the hardness, oxidation resistance and tribological propertiesof AlCrN coatings improved with an increase of Al content, up to 70%–75%—as long as a face-centeredcubic structure dominates [4,15]. This results in an increase in resistance to oxidation compared tothe CrN, TiN and TiAlN coatings and hardness stability up to temperature of 800 C [2]. With theconcentration of aluminum increase in the AlCrN coating AlN hexagonal phase (h-AlN) is formed.
Coatings 2020, 10, 793; doi:10.3390/coatings10080793 www.mdpi.com/journal/coatings
Coatings 2020, 10, 793 2 of 21
The presence of h-AlN in the coating reduces its mechanical properties [16]. h-AlN phase is morestable than the cubic phase, thus transformation c-AlN→ h-AlN occurs spontaneously. Under theoperating conditions of coated tools at elevated temperature there may be a phase transformation andmechanical properties of the coating can be deteriorated.
The properties of CrAlN coatings can be changed by selecting appropriate coating depositionparameters, including nitrogen pressure [9,14], AlCr-cathode composition [4,15] and substrate biasvoltage [5,7,14]. It has been shown that the microstructure and mechanical properties are stronglyrelated to the cathode composition [4,14] and the pressure of the reactive gas [11]. It was found that theapplication of the negative bias voltage to the substrate significantly affected the mechanical propertiesand the structure of the coatings [7]. Reiter et al. [4] indicates that with an increase of Al content to about70% in the coating, the hardness increases to about 30% and then decreases. An improved abrasionresistance compared to conventional TiN and TiAlN is also observed [4]. However, Aihua et al. [12]states that CrAlN and AlTiN coatings with high aluminum concentration, deposited by cathodic arcevaporation, do not show higher wear resistance compared to TiN and TiAlN.
The AlCrN coating exhibits excellent toughness at a high temperature and wear resistance underextreme conditions of mechanical stress and is used for tools for working gears, cylinders, stamps andforms. This coating is also dedicated to the treatment of hard-to-cut materials [17].
AlCrN coatings can be formed using various methods including magnetron sputtering fromseparate targets Al and Cr [6,7,18], HIPIMS [11] and cathodic evaporation [4,5,7,9,13,19]. Among theplasma-vacuum technologies, cathodic arc evaporation (CAE) is used more often. It is characterized bya high degree of plasma ionization and particle energy, which results in a high density of coatings andits good mechanical properties, including hardness and adhesion. The disadvantage of the method is alarge number of surface defects, macroparticles and craters. Using the magnetron sputtering process,it is possible to obtain smooth coating surfaces. The low degree of plasma ionization results in a lowcoating density and, as a result, inferior mechanical properties compared to CAE [20].
The goal of this work was to determine the effect of AlCrN deposition parameters on the structural andmechanical properties including thermal stability determined by the thermomechanical analysis (TMA).
The coatings were deposited by cathodic arc evaporation on HS6-5-2 steel substrates. A variableparameters during the coating deposition were: the substrate bias voltage, nitrogen pressure andsubstrate temperature. The coating structure, deposition rate, chemical composition, hardness,adhesion and wear were studied.
2. Materials and Methods
2.1. Coating Deposition
AlCrN coatings were deposited using cathodic arc evaporation method in semi-industrial TINA900 M system (Vakuumtechnik Dresden GmbH, Germany) equipped in arc sources with AlCr (50:50)alloy cathode with 99.995% purity. HS6-5-2 steel flat discs with 32 mm in diameter and cylindricalrods with 3 mm in diameter and 30 mm in length (for thermal stability testing) were applied as thesubstrates. Before deposition they were ground and polished to roughness parameter Ra about 0.02 µm.They were then ultrasonically cleaned in an alkaline bath to remove organic contaminations, rinsed indeionized water and dried in warm air. The substrates were placed on a rotating holder within thevacuum chamber at a distance of 18 cm from the arc sources. The planetary rotation about 2 rpm wasapplied. The vacuum chamber was evacuated to pressure of 1 mPa. The next step prior to formingthe coatings was an ion-etching of the substrate surface to remove surface oxides and to improve theadhesion of the coatings on the substrate. Ion etching using argon and chromium ions was carried outin an argon environment. In order to improve the adhesion of coatings on the substrate surface, a thinchromium layer with thickness of about 0.2 µm was deposited.

Coatings 2020, 10, 793 3 of 21
The AlCrN deposition process was carried out using the arc current of 80 A. The coatings wereprepared at substrate bias voltage (UB) −100 V and nitrogen pressure in the chamber ranged from 1 to5 Pa. The deposition parameters are summarized in Table 1.
Table 1. Basic technological parameters for synthesizing AlCrN coatings.
Parameter Ion Etching Adhesive Layer AlCrN Coating
AlCr cathode current – – 80 ACr cathode current 80 A 80 A –
Argon pressure 0.5 Pa 0.5 Pa –Nitrogen pressure – – 1–5 Pa
Voltage −600 V −100 V −100 VDeposition time 10 min 6 min 120 min
Temperature 350 C 350 C 350 C
Additionally, the coatings were deposited using other technological parameters: substrate temperatureof 450 C, substrate bias voltage ranging from 0 to −300 V. These coatings were not studied systematically.
The gas pressure and gas flow (argon, nitrogen) were controlled, respectively, using a Baratron typecapacity gauge (MKS Instruments, Inc., Austin, TX, USA) and MKS flow controller (MKS Instruments,Inc., Austin, TX, USA).
2.2. Characterization Methods
X’Pert Panalytical device with CuKα radiation was applied to register the X-ray diffraction(XRD, Malvern Panalytical Ltd., Malvern, UK). The measurements were performed with a glancingangle (ω = 3) and Bragg–Brentano geometry in the range of 2 theta angles between 30 and 120.The grain size was calculated using Scherrer’s formula [21]. Due to instrumental peak broadening,0.2 for silicon standard, the Warren–Biscoe correction method was used [21].
Microstructure and surface morphology was measured by scanning electron microscopy(JEOL JSM-5500LV, JEOL Ltd., Tokyo, Japan). The Energy Dispersive X-ray Spectroscopy (EDS)and Wavelength-dispersive X-ray spectroscopy (WDS, thermo Fisher Scientific, Waltham, MA,USA) were applied to analyze the chemical composition of the coatings. Oxford Link ISIS 300(Link Analytical/Oxford Instruments, High Wycombe, UK) and Noran Instruments IBEX systems(NORAN instruments, Inc., Middleton, WI, USA) were used, respectively.
Coating thickness was determined using spherical abrasion test. Hardness measurements wereperformed using Fischerscope® HM2000 microtester (Fischer Technology Inc., Windsor, CT, USA)equipped in WIN-HCU® software. Microhardness was determined with the fixed penetration depthof 0.3 µm, lower than 10% of coating thickness. It enables the correct measurement of coatinghardness. Due to high roughness of the coating surface the procedure described by Romero et al. [5]including the coating surface polishing by fine-grained diamond powder (2 µm) was used. After thisoperation, significantly reducing the surface roughness of the coating (to Ra~0.05 µm), the hardnesswas determined with a much smaller measurement uncertainty was applied. The hardness value wasan average of 20 measurements.
Adhesion was assessed by Revetest scratch tester (CSM Instruments, Peseux, Switzerland)equipped with diamond indenter Rockwell type C with a tip radius of 0.2 mm. The indenter wasmoved with a sliding speed of 10 mm/min. Simultaneously, normal force increased linearly from 0to 100 N. Lc1 critical load was determined as the load at which the first cracks in the coating appearand Lc2 critical load was defined as the load at which the total delamination of the coating from thesubstrate was observed. These loads were determined by observation using an optical microscope asthe mean of at least three measurements. Adhesion was also evaluated using the Daimler–Benz testwith a six-mode scale of adhesion quality [22]. According to this scale assigned to specific damage tothe coating, HF1 to HF4 refer to relatively good adhesion with only few cracks or delamination close to
Coatings 2020, 10, 793 4 of 21
contact with the Rockwell indenter. Notations HF5 and HF6 indicate poor adhesion with extensivespalling of the coating.
The surface roughness of the coatings was determined using contact profilometer Hommel TesterT8000 (Hommelwerke GmbH, Schwenningen, Germany). The test was performed five times foreach sample.
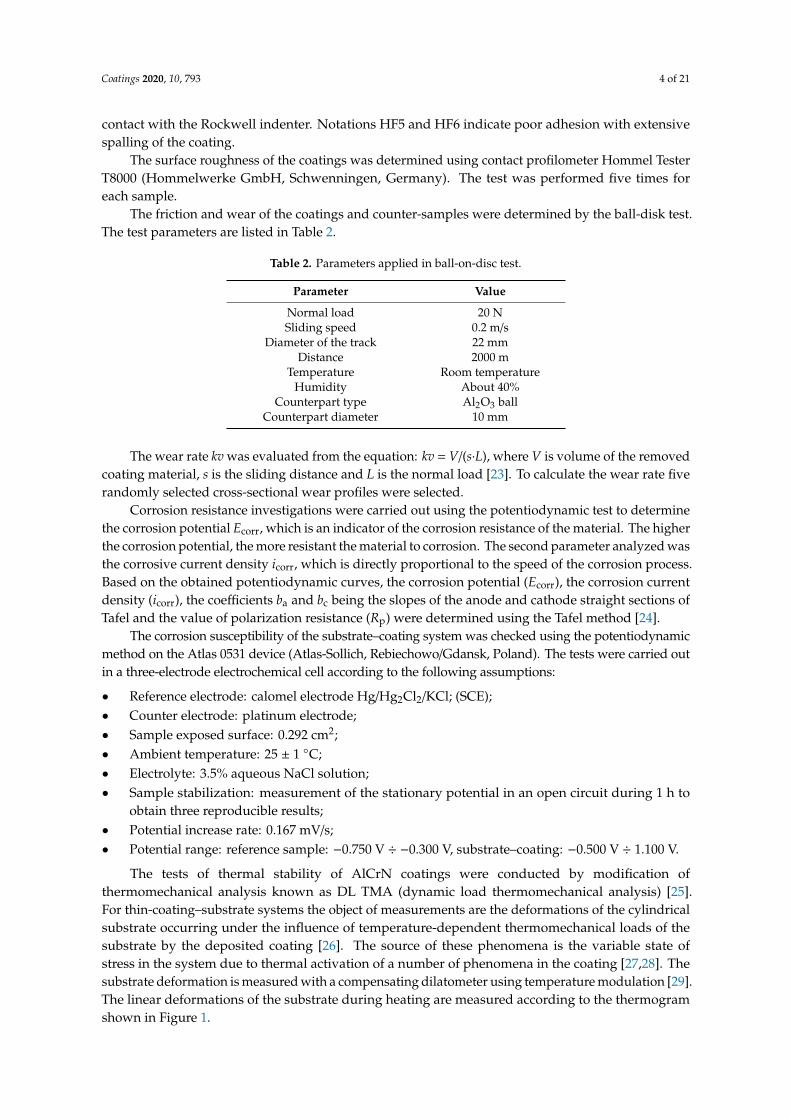
The friction and wear of the coatings and counter-samples were determined by the ball-disk test.The test parameters are listed in Table 2.
Table 2. Parameters applied in ball-on-disc test.
Parameter Value
Normal load 20 NSliding speed 0.2 m/s
Diameter of the track 22 mmDistance 2000 m
Temperature Room temperatureHumidity About 40%
Counterpart type Al2O3 ballCounterpart diameter 10 mm
The wear rate kv was evaluated from the equation: kv = V/(s·L), where V is volume of the removedcoating material, s is the sliding distance and L is the normal load [23]. To calculate the wear rate fiverandomly selected cross-sectional wear profiles were selected.
Corrosion resistance investigations were carried out using the potentiodynamic test to determinethe corrosion potential Ecorr, which is an indicator of the corrosion resistance of the material. The higherthe corrosion potential, the more resistant the material to corrosion. The second parameter analyzed wasthe corrosive current density icorr, which is directly proportional to the speed of the corrosion process.Based on the obtained potentiodynamic curves, the corrosion potential (Ecorr), the corrosion currentdensity (icorr), the coefficients ba and bc being the slopes of the anode and cathode straight sections ofTafel and the value of polarization resistance (Rp) were determined using the Tafel method [24].
The corrosion susceptibility of the substrate–coating system was checked using the potentiodynamicmethod on the Atlas 0531 device (Atlas-Sollich, Rebiechowo/Gdansk, Poland). The tests were carried outin a three-electrode electrochemical cell according to the following assumptions:
• Reference electrode: calomel electrode Hg/Hg2Cl2/KCl; (SCE);• Counter electrode: platinum electrode;• Sample exposed surface: 0.292 cm2;• Ambient temperature: 25 ± 1 C;• Electrolyte: 3.5% aqueous NaCl solution;• Sample stabilization: measurement of the stationary potential in an open circuit during 1 h to
obtain three reproducible results;• Potential increase rate: 0.167 mV/s;• Potential range: reference sample: −0.750 V ÷ −0.300 V, substrate–coating: −0.500 V ÷ 1.100 V.
The tests of thermal stability of AlCrN coatings were conducted by modification ofthermomechanical analysis known as DL TMA (dynamic load thermomechanical analysis) [25].For thin-coating–substrate systems the object of measurements are the deformations of the cylindricalsubstrate occurring under the influence of temperature-dependent thermomechanical loads of thesubstrate by the deposited coating [26]. The source of these phenomena is the variable state ofstress in the system due to thermal activation of a number of phenomena in the coating [27,28]. Thesubstrate deformation is measured with a compensating dilatometer using temperature modulation [29].The linear deformations of the substrate during heating are measured according to the thermogramshown in Figure 1.

Coatings 2020, 10, 793 5 of 21
Coatings 2020, 10, x FOR PEER REVIEW 5 of 21
substrate deformation is measured with a compensating dilatometer using temperature modulation [29]. The linear deformations of the substrate during heating are measured according to the thermogram shown in Figure 1.
Figure 1. Thermogram to thermal stability diagnostics.
The samples were annealed successively at temperature Ta = 320, 430, and 520 °C for 3 h in the argon atmosphere. A characteristic feature of the testing method applied is that at the temperature of 200 °C. An isothermal heating sequence was used with a sinusoidal temperature modulation with an amplitude of ±10 °C and a period of 6 min. The rate of linear temperature changes was 5 °C/min.
The value of substrate linear expansion during heating depends both on the substrate material properties and the coating material applied, the adhesion of the coating to the substrate and the current value of stresses occurring in the tested coating [28,30].
The applied metrological solution allows identification of the thermal stability of the thermomechanical loads of the substrate by determining changes in the values of two quantities: -at temperature above 150 °C—the effective coefficient of the substrate deformation—αDL, -at temperature of 20 °C of the fixed increase in the elongation of the substrate ΔLs after consecutive isothermal heating of the sample of the system successively at temperatures Ta = 320, 430, and 520 °C according to the thermogram in Figure 1.
The αDL coefficient is a value depending on the current thermomechanical load of the substrate and is measured under temperature modulation conditions that is calculated from the equation: 𝛼 = ∙ ⟨ ⟩ , (1)
where: <AL>—the average amplitude of the cyclic changes in the elongation of the substrate temperature, <AT>—the average amplitude of the cyclic changes of the temperature modulation, L0—the substrate length at temperature 200 °C.
The proper measurement resolution for the measured values of substrate deformations is obtained by using temperature modulation [31]. Thermal stability of the thermomechanical interactions between the substrate and the coating was defined by determining the relative changes of substrate expansion coefficient αDL after subsequent heating cycles, measured at a temperature of 200 °C after annealing at temperature Ta = 320, 430, and 520 °C (Figure 1) which is calculated using formula: ∆𝛼 = ∙ 100%, (2)
where: αDLa—expansion coefficient of the coating–substrate system after annealing in selected temperature mentioned above, αDLd—expansion coefficient of the coating–substrate system after coating deposition.
The values of fixed increments ΔLs after a given isothermal heating can also be used to describe the thermomechanical loads of the substrate of the examined system. For systems in which the compressive stress resides in the coating at 20 °C, the substrate is stretched under the influence of the
Figure 1. Thermogram to thermal stability diagnostics.
The samples were annealed successively at temperature Ta = 320, 430, and 520 C for 3 h in theargon atmosphere. A characteristic feature of the testing method applied is that at the temperature of200 C. An isothermal heating sequence was used with a sinusoidal temperature modulation with anamplitude of ±10 C and a period of 6 min. The rate of linear temperature changes was 5 C/min.
The value of substrate linear expansion during heating depends both on the substrate materialproperties and the coating material applied, the adhesion of the coating to the substrate and the currentvalue of stresses occurring in the tested coating [28,30].
The applied metrological solution allows identification of the thermal stability of thethermomechanical loads of the substrate by determining changes in the values of two quantities: -attemperature above 150 C—the effective coefficient of the substrate deformation—αDL, -at temperatureof 20 C of the fixed increase in the elongation of the substrate ∆Ls after consecutive isothermal heatingof the sample of the system successively at temperatures Ta = 320, 430, and 520 C according to thethermogram in Figure 1.
The αDL coefficient is a value depending on the current thermomechanical load of the substrateand is measured under temperature modulation conditions that is calculated from the equation:
αDL =1L0·
(< AL >
AT
), (1)
where: <AL>—the average amplitude of the cyclic changes in the elongation of the substratetemperature, <AT>—the average amplitude of the cyclic changes of the temperature modulation,L0—the substrate length at temperature 200 C.
The proper measurement resolution for the measured values of substrate deformations is obtainedby using temperature modulation [31]. Thermal stability of the thermomechanical interactions betweenthe substrate and the coating was defined by determining the relative changes of substrate expansioncoefficient αDL after subsequent heating cycles, measured at a temperature of 200 C after annealing attemperature Ta = 320, 430, and 520 C (Figure 1) which is calculated using formula:
∆αDL =αDLa − αDLd
αDLd·100%, (2)
where: αDLa—expansion coefficient of the coating–substrate system after annealing in selectedtemperature mentioned above, αDLd—expansion coefficient of the coating–substrate system aftercoating deposition.
The values of fixed increments ∆Ls after a given isothermal heating can also be used to describe thethermomechanical loads of the substrate of the examined system. For systems in which the compressivestress resides in the coating at 20 C, the substrate is stretched under the influence of the depositedcoating. As a consequence of thermal activation in the coating of a number of processes [2,13,14,27,28],

Coatings 2020, 10, 793 6 of 21
the state of stress in the system changes, whose metrological effect is the recorded change in thesubstrate length ∆Ls related to the substrate length immediately after the adhesive coating is deposited.For a system where compressive stresses occur in the coating, a positive value of ∆Ls after a givenisothermal heating means an increase in compressive stress, while a negative value means a decreasein compressive stress. Changes in the absolute values of length increments ∆Ls can be a quantitativemeasure of the thermal stability of the AlCrN coatings tested.
A consequence of the change in the stress state in the system is the increase in the length ∆Ls ofthe substrate of the tested coating–substrate system after a given annealing. It is mainly caused by thethermal activation of a number of structural and chemical processes in the coating. They are treated asa source of changes in the dynamic load on the substrate by the deposited coating. Hence, the valueof ∆Ls measured at 20 C was adopted as a measure of the thermal stability of the coating structure.Modulated dilatometry enables the measurement of changes in the substrate length with the resolutionappropriate for these changes, while maintaining specific metrological conditions.
3. Results
The thickness of the coatings deposited at temperature 350 C was in the range of 4.5 to 6.0 µmwith maximum thickness for coating deposited in nitrogen pressure 3 Pa. The coatings depositedat higher substrate temperature, 450 C, characterize by about 20% lower thickness ranged from 3.9to 5 µm. For this substrate temperature the maximum thickness for coating deposited in nitrogenpressure 3 Pa was also observed. Due to the fact that deposition time of all coatings was the same,the deposition rates (Figure 2) are relevant.
Coatings 2020, 10, x FOR PEER REVIEW 6 of 21
deposited coating. As a consequence of thermal activation in the coating of a number of processes [2,13,14,27,28], the state of stress in the system changes, whose metrological effect is the recorded change in the substrate length ΔLs related to the substrate length immediately after the adhesive coating is deposited. For a system where compressive stresses occur in the coating, a positive value of ΔLs after a given isothermal heating means an increase in compressive stress, while a negative value means a decrease in compressive stress. Changes in the absolute values of length increments ΔLs can be a quantitative measure of the thermal stability of the AlCrN coatings tested.
A consequence of the change in the stress state in the system is the increase in the length ΔLs of the substrate of the tested coating–substrate system after a given annealing. It is mainly caused by the thermal activation of a number of structural and chemical processes in the coating. They are treated as a source of changes in the dynamic load on the substrate by the deposited coating. Hence, the value of ΔLs measured at 20 °C was adopted as a measure of the thermal stability of the coating structure. Modulated dilatometry enables the measurement of changes in the substrate length with the resolution appropriate for these changes, while maintaining specific metrological conditions.
3. Results
The thickness of the coatings deposited at temperature 350 °C was in the range of 4.5 to 6.0 µm with maximum thickness for coating deposited in nitrogen pressure 3 Pa. The coatings deposited at higher substrate temperature, 450 °C, characterize by about 20% lower thickness ranged from 3.9 to 5 µm. For this substrate temperature the maximum thickness for coating deposited in nitrogen pressure 3 Pa was also observed. Due to the fact that deposition time of all coatings was the same, the deposition rates (Figure 2) are relevant.
Figure 2. Deposition rates of AlCrN coatings formed at 350 and 450 °C.
3.1. Phase and Chemical Composition
The typical XRD diffraction patterns of AlCrN coatings deposited at temperature of 350 and 450 °C, negative substrate bias voltage 100 V and nitrogen pressure ranged from 1 to 5 Pa are shown in Figure 3. The coatings crystallized in cubic CrN and AlN structure with main (111), (200) and (220) planes. The (311) and (222) planes with smaller intensity are also visible. In coating deposited at pressure of 1 Pa three phases can be identified: cubic CrN (ICDD 11-0065), cubic AlN (ICDD 46-1200) and Al3Cr7 (ICDD 03-065-6108). For nitrogen pressure higher than 2 Pa Al3Cr7 phase decays. In coatings deposited at nitrogen pressure ranged from 3 to 5 Pa only CrN phase is observed.
Figure 2. Deposition rates of AlCrN coatings formed at 350 and 450 C.
3.1. Phase and Chemical Composition
The typical XRD diffraction patterns of AlCrN coatings deposited at temperature of 350 and 450 C,negative substrate bias voltage 100 V and nitrogen pressure ranged from 1 to 5 Pa are shown in Figure 3.The coatings crystallized in cubic CrN and AlN structure with main (111), (200) and (220) planes.The (311) and (222) planes with smaller intensity are also visible. In coating deposited at pressureof 1 Pa three phases can be identified: cubic CrN (ICDD 11-0065), cubic AlN (ICDD 46-1200) andAl3Cr7 (ICDD 03-065-6108). For nitrogen pressure higher than 2 Pa Al3Cr7 phase decays. In coatingsdeposited at nitrogen pressure ranged from 3 to 5 Pa only CrN phase is observed.
Coatings 2020, 10, 793 7 of 21Coatings 2020, 10, x FOR PEER REVIEW 7 of 21
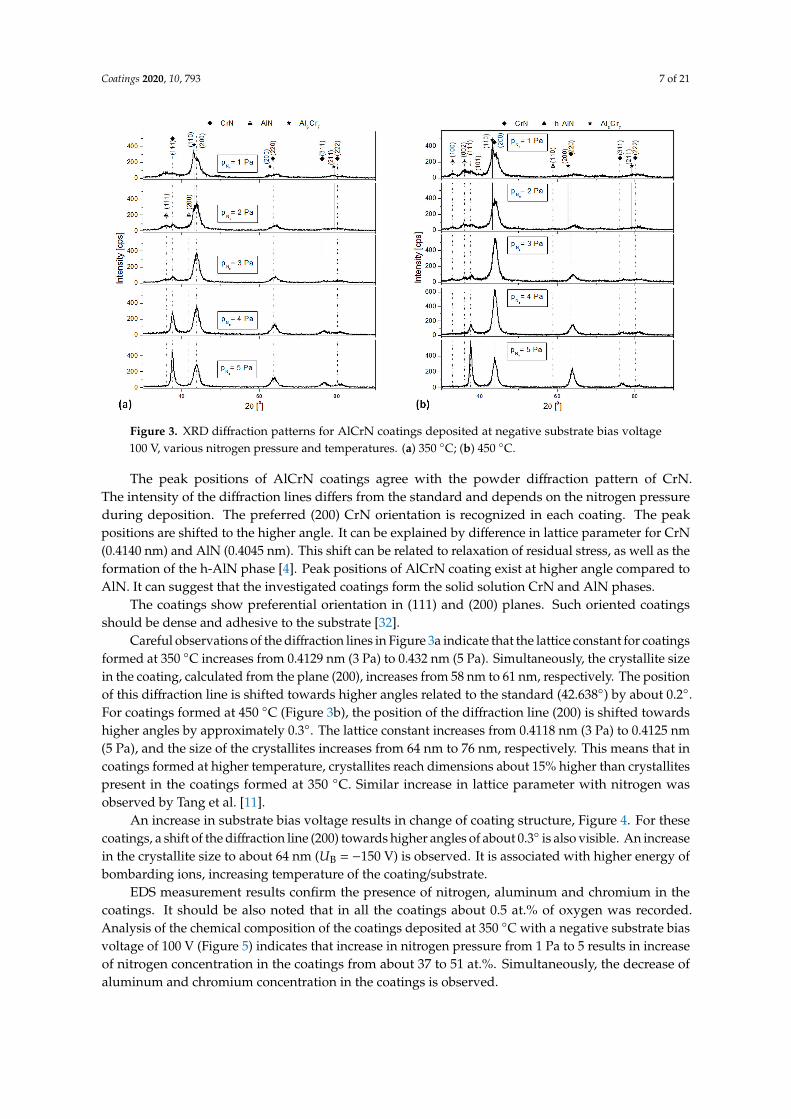
Figure 3. XRD diffraction patterns for AlCrN coatings deposited at negative substrate bias voltage 100 V, various nitrogen pressure and temperatures. (a) 350 °C; (b) 450 °C.
The peak positions of AlCrN coatings agree with the powder diffraction pattern of CrN. The intensity of the diffraction lines differs from the standard and depends on the nitrogen pressure during deposition. The preferred (200) CrN orientation is recognized in each coating. The peak positions are shifted to the higher angle. It can be explained by difference in lattice parameter for CrN (0.4140 nm) and AlN (0.4045 nm). This shift can be related to relaxation of residual stress, as well as the formation of the h-AlN phase [4]. Peak positions of AlCrN coating exist at higher angle compared to AlN. It can suggest that the investigated coatings form the solid solution CrN and AlN phases.
The coatings show preferential orientation in (111) and (200) planes. Such oriented coatings should be dense and adhesive to the substrate [32].
Careful observations of the diffraction lines in Figure 3a indicate that the lattice constant for coatings formed at 350 °C increases from 0.4129 nm (3 Pa) to 0.432 nm (5 Pa). Simultaneously, the crystallite size in the coating, calculated from the plane (200), increases from 58 nm to 61 nm, respectively. The position of this diffraction line is shifted towards higher angles related to the standard (42.638°) by about 0.2°. For coatings formed at 450 °C (Figure 3b), the position of the diffraction line (200) is shifted towards higher angles by approximately 0.3°. The lattice constant increases from 0.4118 nm (3 Pa) to 0.4125 nm (5 Pa), and the size of the crystallites increases from 64 nm to 76 nm, respectively. This means that in coatings formed at higher temperature, crystallites reach dimensions about 15% higher than crystallites present in the coatings formed at 350 °C. Similar increase in lattice parameter with nitrogen was observed by Tang et al. [11].
An increase in substrate bias voltage results in change of coating structure, Figure 4. For these coatings, a shift of the diffraction line (200) towards higher angles of about 0.3° is also visible. An increase in the crystallite size to about 64 nm (UB = −150 V) is observed. It is associated with higher energy of bombarding ions, increasing temperature of the coating/substrate.
Figure 3. XRD diffraction patterns for AlCrN coatings deposited at negative substrate bias voltage100 V, various nitrogen pressure and temperatures. (a) 350 C; (b) 450 C.
The peak positions of AlCrN coatings agree with the powder diffraction pattern of CrN.The intensity of the diffraction lines differs from the standard and depends on the nitrogen pressureduring deposition. The preferred (200) CrN orientation is recognized in each coating. The peakpositions are shifted to the higher angle. It can be explained by difference in lattice parameter for CrN(0.4140 nm) and AlN (0.4045 nm). This shift can be related to relaxation of residual stress, as well as theformation of the h-AlN phase [4]. Peak positions of AlCrN coating exist at higher angle compared toAlN. It can suggest that the investigated coatings form the solid solution CrN and AlN phases.
The coatings show preferential orientation in (111) and (200) planes. Such oriented coatingsshould be dense and adhesive to the substrate [32].
Careful observations of the diffraction lines in Figure 3a indicate that the lattice constant for coatingsformed at 350 C increases from 0.4129 nm (3 Pa) to 0.432 nm (5 Pa). Simultaneously, the crystallite sizein the coating, calculated from the plane (200), increases from 58 nm to 61 nm, respectively. The positionof this diffraction line is shifted towards higher angles related to the standard (42.638) by about 0.2.For coatings formed at 450 C (Figure 3b), the position of the diffraction line (200) is shifted towardshigher angles by approximately 0.3. The lattice constant increases from 0.4118 nm (3 Pa) to 0.4125 nm(5 Pa), and the size of the crystallites increases from 64 nm to 76 nm, respectively. This means that incoatings formed at higher temperature, crystallites reach dimensions about 15% higher than crystallitespresent in the coatings formed at 350 C. Similar increase in lattice parameter with nitrogen wasobserved by Tang et al. [11].
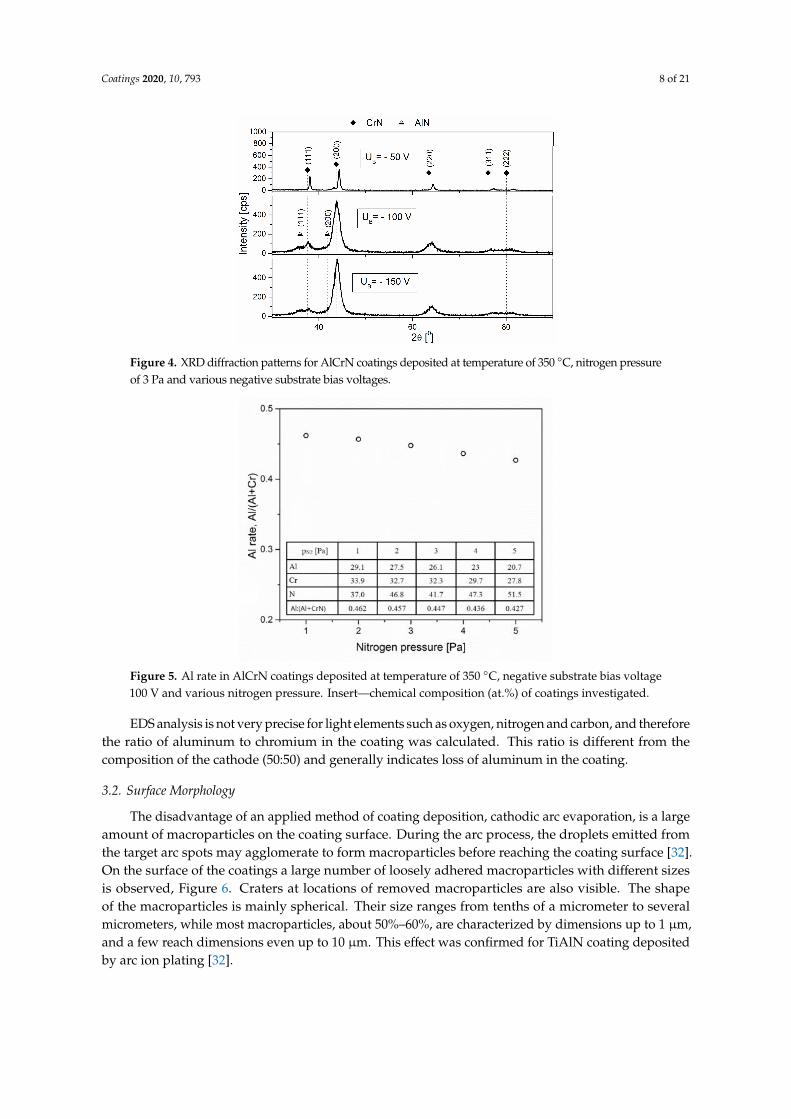
An increase in substrate bias voltage results in change of coating structure, Figure 4. For thesecoatings, a shift of the diffraction line (200) towards higher angles of about 0.3 is also visible. An increasein the crystallite size to about 64 nm (UB = −150 V) is observed. It is associated with higher energy ofbombarding ions, increasing temperature of the coating/substrate.
EDS measurement results confirm the presence of nitrogen, aluminum and chromium in thecoatings. It should be also noted that in all the coatings about 0.5 at.% of oxygen was recorded.Analysis of the chemical composition of the coatings deposited at 350 C with a negative substrate biasvoltage of 100 V (Figure 5) indicates that increase in nitrogen pressure from 1 Pa to 5 results in increaseof nitrogen concentration in the coatings from about 37 to 51 at.%. Simultaneously, the decrease ofaluminum and chromium concentration in the coatings is observed.
Coatings 2020, 10, 793 8 of 21Coatings 2020, 10, x FOR PEER REVIEW 8 of 21
Figure 4. XRD diffraction patterns for AlCrN coatings deposited at temperature of 350 °C, nitrogen pressure of 3 Pa and various negative substrate bias voltages.
EDS measurement results confirm the presence of nitrogen, aluminum and chromium in the coatings. It should be also noted that in all the coatings about 0.5 at.% of oxygen was recorded. Analysis of the chemical composition of the coatings deposited at 350 °C with a negative substrate bias voltage of 100 V (Figure 5) indicates that increase in nitrogen pressure from 1 Pa to 5 results in increase of nitrogen concentration in the coatings from about 37 to 51 at.%. Simultaneously, the decrease of aluminum and chromium concentration in the coatings is observed.
Figure 5. Al rate in AlCrN coatings deposited at temperature of 350 °C, negative substrate bias voltage 100 V and various nitrogen pressure. Insert—chemical composition (at.%) of coatings investigated.
EDS analysis is not very precise for light elements such as oxygen, nitrogen and carbon, and therefore the ratio of aluminum to chromium in the coating was calculated. This ratio is different from the composition of the cathode (50:50) and generally indicates loss of aluminum in the coating.
3.2. Surface Morphology
The disadvantage of an applied method of coating deposition, cathodic arc evaporation, is a large amount of macroparticles on the coating surface. During the arc process, the droplets emitted from the target arc spots may agglomerate to form macroparticles before reaching the coating surface [32]. On the surface of the coatings a large number of loosely adhered macroparticles with different sizes is observed, Figure 6. Craters at locations of removed macroparticles are also visible. The shape of the macroparticles is mainly spherical. Their size ranges from tenths of a micrometer to several micrometers, while most macroparticles, about 50%–60%, are characterized by dimensions up to
Figure 4. XRD diffraction patterns for AlCrN coatings deposited at temperature of 350 C, nitrogen pressureof 3 Pa and various negative substrate bias voltages.
1
Figure 5. Al rate in AlCrN coatings deposited at temperature of 350 C, negative substrate bias voltage100 V and various nitrogen pressure. Insert—chemical composition (at.%) of coatings investigated.
EDS analysis is not very precise for light elements such as oxygen, nitrogen and carbon, and thereforethe ratio of aluminum to chromium in the coating was calculated. This ratio is different from thecomposition of the cathode (50:50) and generally indicates loss of aluminum in the coating.
3.2. Surface Morphology
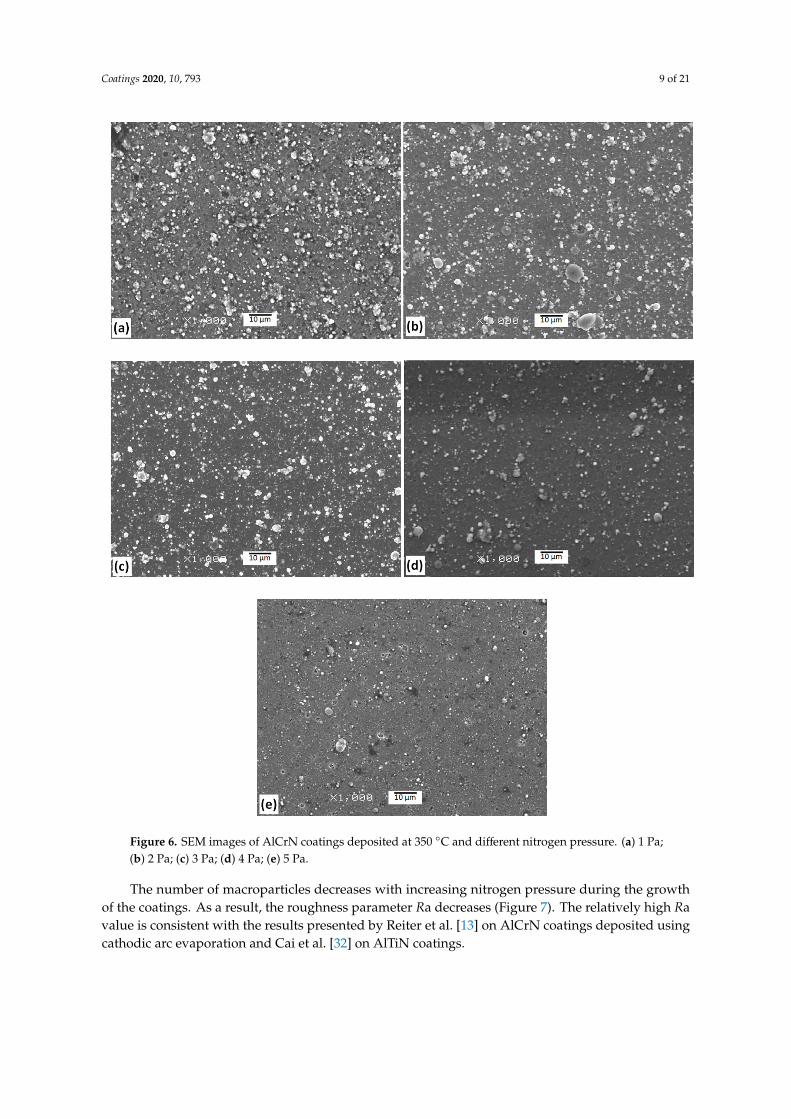
The disadvantage of an applied method of coating deposition, cathodic arc evaporation, is a largeamount of macroparticles on the coating surface. During the arc process, the droplets emitted fromthe target arc spots may agglomerate to form macroparticles before reaching the coating surface [32].On the surface of the coatings a large number of loosely adhered macroparticles with different sizesis observed, Figure 6. Craters at locations of removed macroparticles are also visible. The shapeof the macroparticles is mainly spherical. Their size ranges from tenths of a micrometer to severalmicrometers, while most macroparticles, about 50%–60%, are characterized by dimensions up to 1 µm,and a few reach dimensions even up to 10 µm. This effect was confirmed for TiAlN coating depositedby arc ion plating [32].
Coatings 2020, 10, 793 9 of 21
Coatings 2020, 10, x FOR PEER REVIEW 9 of 21
1 µm, and a few reach dimensions even up to 10 µm. This effect was confirmed for TiAlN coating deposited by arc ion plating [32].
Figure 6. SEM images of AlCrN coatings deposited at 350 °C and different nitrogen pressure. (a) 1 Pa; (b) 2 Pa; (c) 3 Pa; (d) 4 Pa; (e) 5 Pa.
The number of macroparticles decreases with increasing nitrogen pressure during the growth of the coatings. As a result, the roughness parameter Ra decreases (Figure 7). The relatively high Ra value is consistent with the results presented by Reiter et al. [13] on AlCrN coatings deposited using cathodic arc evaporation and Cai et al. [32] on AlTiN coatings.
Figure 6. SEM images of AlCrN coatings deposited at 350 C and different nitrogen pressure. (a) 1 Pa;(b) 2 Pa; (c) 3 Pa; (d) 4 Pa; (e) 5 Pa.
The number of macroparticles decreases with increasing nitrogen pressure during the growthof the coatings. As a result, the roughness parameter Ra decreases (Figure 7). The relatively high Ravalue is consistent with the results presented by Reiter et al. [13] on AlCrN coatings deposited usingcathodic arc evaporation and Cai et al. [32] on AlTiN coatings.

Coatings 2020, 10, 793 10 of 21Coatings 2020, 10, x FOR PEER REVIEW 10 of 21
Figure 7. Roughness parameter (Ra) of AlCrN coatings.
The investigations of the coatings formed at the nitrogen pressure of 5 Pa and at different substrate bias voltages indicate that with increase of substrate bias voltage the deposition rate of the coating, as well as the surface roughness parameter Ra (arithmetic mean deviation of roughness profile) decrease, Figure 8.
Figure 8. Deposition rate and roughness parameter (Ra) of AlCrN coatings deposited at substrate temperature of 350 °C and nitrogen pressure 5 Pa at different substrate bias voltages.
3.3. Hardness
The coatings were deposited on the substrates heated to temperature of 350 °C using a nitrogen pressure from 1 to 5 Pa. In Figure 9 an increase in the hardness of the coatings deposited at higher nitrogen pressures is visible.
Figure 9. Hardness of AlCrN coatings formed at various nitrogen pressure.
Figure 7. Roughness parameter (Ra) of AlCrN coatings.
The investigations of the coatings formed at the nitrogen pressure of 5 Pa and at different substratebias voltages indicate that with increase of substrate bias voltage the deposition rate of the coating,as well as the surface roughness parameter Ra (arithmetic mean deviation of roughness profile) decrease,Figure 8.
Coatings 2020, 10, x FOR PEER REVIEW 10 of 21
Figure 7. Roughness parameter (Ra) of AlCrN coatings.
The investigations of the coatings formed at the nitrogen pressure of 5 Pa and at different substrate bias voltages indicate that with increase of substrate bias voltage the deposition rate of the coating, as well as the surface roughness parameter Ra (arithmetic mean deviation of roughness profile) decrease, Figure 8.
Figure 8. Deposition rate and roughness parameter (Ra) of AlCrN coatings deposited at substrate temperature of 350 °C and nitrogen pressure 5 Pa at different substrate bias voltages.
3.3. Hardness
The coatings were deposited on the substrates heated to temperature of 350 °C using a nitrogen pressure from 1 to 5 Pa. In Figure 9 an increase in the hardness of the coatings deposited at higher nitrogen pressures is visible.
Figure 9. Hardness of AlCrN coatings formed at various nitrogen pressure.
Figure 8. Deposition rate and roughness parameter (Ra) of AlCrN coatings deposited at substratetemperature of 350 C and nitrogen pressure 5 Pa at different substrate bias voltages.
3.3. Hardness
The coatings were deposited on the substrates heated to temperature of 350 C using a nitrogenpressure from 1 to 5 Pa. In Figure 9 an increase in the hardness of the coatings deposited at highernitrogen pressures is visible.
Coatings 2020, 10, x FOR PEER REVIEW 10 of 21
Figure 7. Roughness parameter (Ra) of AlCrN coatings.
The investigations of the coatings formed at the nitrogen pressure of 5 Pa and at different substrate bias voltages indicate that with increase of substrate bias voltage the deposition rate of the coating, as well as the surface roughness parameter Ra (arithmetic mean deviation of roughness profile) decrease, Figure 8.
Figure 8. Deposition rate and roughness parameter (Ra) of AlCrN coatings deposited at substrate temperature of 350 °C and nitrogen pressure 5 Pa at different substrate bias voltages.
3.3. Hardness
The coatings were deposited on the substrates heated to temperature of 350 °C using a nitrogen pressure from 1 to 5 Pa. In Figure 9 an increase in the hardness of the coatings deposited at higher nitrogen pressures is visible.
Figure 9. Hardness of AlCrN coatings formed at various nitrogen pressure. Figure 9. Hardness of AlCrN coatings formed at various nitrogen pressure.
Coatings 2020, 10, 793 11 of 21
Not only hardness, but also deformation relative to yielding (H/E) and resistance to the plasticdeformation (H3/E2) ratios [33,34] can be significant indicators for tribological applications. The H/Erate indicates the possible wear of the coating due to its hardness and allows a probable evaluationof the tribological properties of the materials. Better resistance of the coating on the deformationrelative to yielding is connected with higher H/E ratio. The higher H3/E2 ratio the higher resistance toplastic deformation. The H/E and H3/E2 ratios are the lowest for the coating deposited under nitrogenpressure of 1 Pa and are 0.068 and 0.074, respectively. They increase with nitrogen pressure duringcoating deposition and they reach the highest values for the AlCrN coating deposited under nitrogenpressure of 5 Pa, 0.94 and 0.231, respectively.
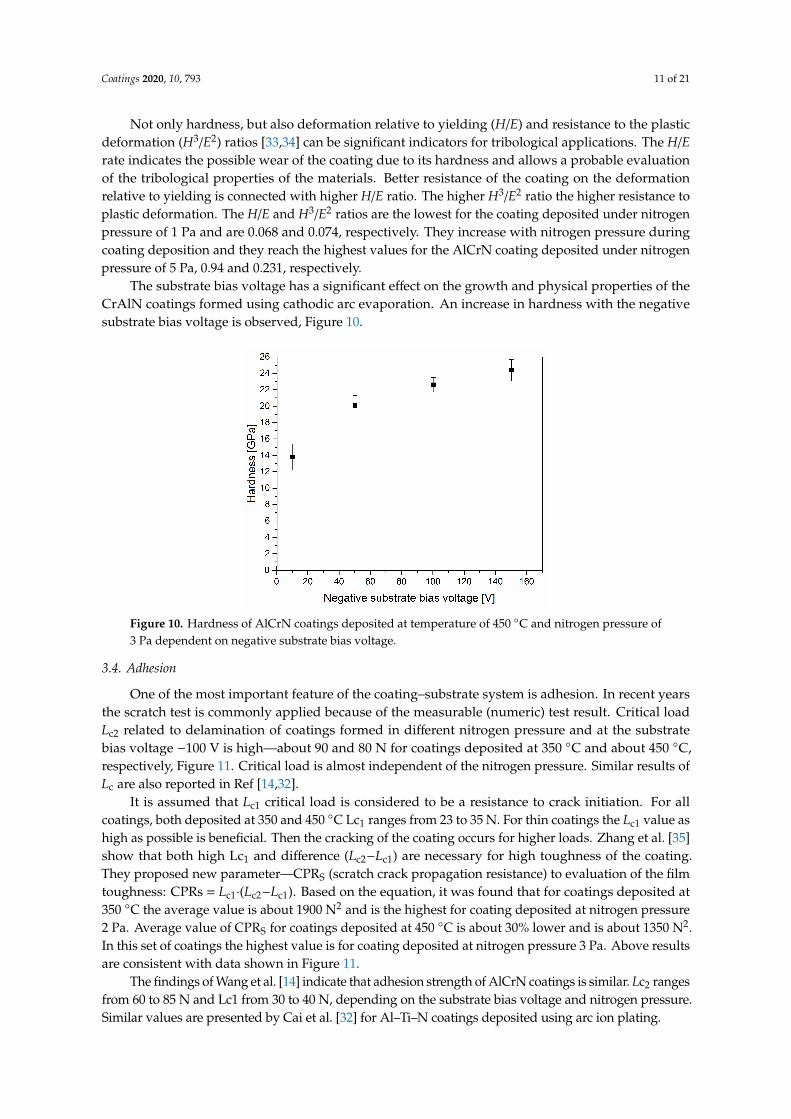
The substrate bias voltage has a significant effect on the growth and physical properties of theCrAlN coatings formed using cathodic arc evaporation. An increase in hardness with the negativesubstrate bias voltage is observed, Figure 10.
Coatings 2020, 10, x FOR PEER REVIEW 11 of 21
Not only hardness, but also deformation relative to yielding (H/E) and resistance to the plastic deformation (H3/E2) ratios [33,34] can be significant indicators for tribological applications. The H/E rate indicates the possible wear of the coating due to its hardness and allows a probable evaluation of the tribological properties of the materials. Better resistance of the coating on the deformation relative to yielding is connected with higher H/E ratio. The higher H3/E2 ratio the higher resistance to plastic deformation. The H/E and H3/E2 ratios are the lowest for the coating deposited under nitrogen pressure of 1 Pa and are 0.068 and 0.074, respectively. They increase with nitrogen pressure during coating deposition and they reach the highest values for the AlCrN coating deposited under nitrogen pressure of 5 Pa, 0.94 and 0.231, respectively.
The substrate bias voltage has a significant effect on the growth and physical properties of the CrAlN coatings formed using cathodic arc evaporation. An increase in hardness with the negative substrate bias voltage is observed, Figure 10.
Figure 10. Hardness of AlCrN coatings deposited at temperature of 450 °C and nitrogen pressure of 3 Pa dependent on negative substrate bias voltage.
3.4. Adhesion
One of the most important feature of the coating–substrate system is adhesion. In recent years the scratch test is commonly applied because of the measurable (numeric) test result. Critical load Lc2 related to delamination of coatings formed in different nitrogen pressure and at the substrate bias voltage −100 V is high—about 90 and 80 N for coatings deposited at 350 °C and about 450 °C, respectively, Figure 11. Critical load is almost independent of the nitrogen pressure. Similar results of Lc are also reported in Ref [14,32].
Figure 11. Critical load (Lc2) of the coatings deposited using different nitrogen pressure and substrate bias voltage UB = −100 V.
Figure 10. Hardness of AlCrN coatings deposited at temperature of 450 C and nitrogen pressure of3 Pa dependent on negative substrate bias voltage.
3.4. Adhesion
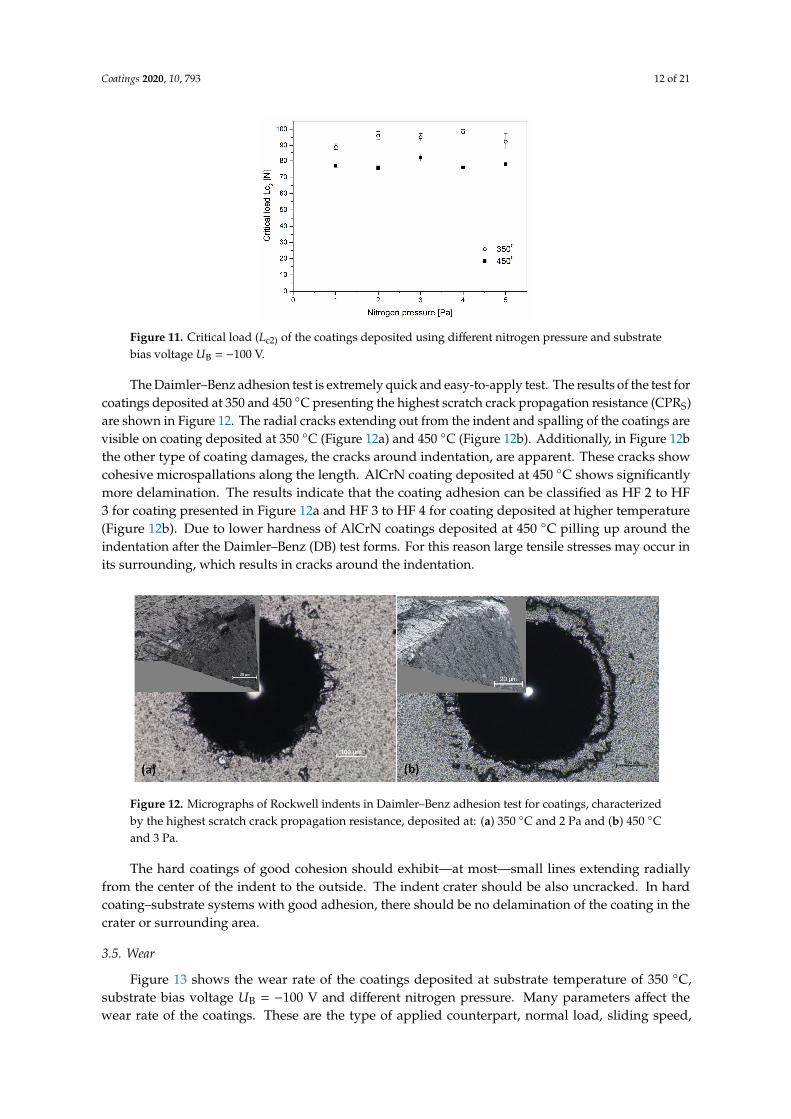
One of the most important feature of the coating–substrate system is adhesion. In recent yearsthe scratch test is commonly applied because of the measurable (numeric) test result. Critical loadLc2 related to delamination of coatings formed in different nitrogen pressure and at the substratebias voltage −100 V is high—about 90 and 80 N for coatings deposited at 350 C and about 450 C,respectively, Figure 11. Critical load is almost independent of the nitrogen pressure. Similar results ofLc are also reported in Ref [14,32].
It is assumed that Lc1 critical load is considered to be a resistance to crack initiation. For allcoatings, both deposited at 350 and 450 C Lc1 ranges from 23 to 35 N. For thin coatings the Lc1 value ashigh as possible is beneficial. Then the cracking of the coating occurs for higher loads. Zhang et al. [35]show that both high Lc1 and difference (Lc2−Lc1) are necessary for high toughness of the coating.They proposed new parameter—CPRS (scratch crack propagation resistance) to evaluation of the filmtoughness: CPRs = Lc1·(Lc2−Lc1). Based on the equation, it was found that for coatings deposited at350 C the average value is about 1900 N2 and is the highest for coating deposited at nitrogen pressure2 Pa. Average value of CPRS for coatings deposited at 450 C is about 30% lower and is about 1350 N2.In this set of coatings the highest value is for coating deposited at nitrogen pressure 3 Pa. Above resultsare consistent with data shown in Figure 11.
The findings of Wang et al. [14] indicate that adhesion strength of AlCrN coatings is similar. Lc2 rangesfrom 60 to 85 N and Lc1 from 30 to 40 N, depending on the substrate bias voltage and nitrogen pressure.Similar values are presented by Cai et al. [32] for Al–Ti–N coatings deposited using arc ion plating.
Coatings 2020, 10, 793 12 of 21
Coatings 2020, 10, x FOR PEER REVIEW 11 of 21
Not only hardness, but also deformation relative to yielding (H/E) and resistance to the plastic deformation (H3/E2) ratios [33,34] can be significant indicators for tribological applications. The H/E rate indicates the possible wear of the coating due to its hardness and allows a probable evaluation of the tribological properties of the materials. Better resistance of the coating on the deformation relative to yielding is connected with higher H/E ratio. The higher H3/E2 ratio the higher resistance to plastic deformation. The H/E and H3/E2 ratios are the lowest for the coating deposited under nitrogen pressure of 1 Pa and are 0.068 and 0.074, respectively. They increase with nitrogen pressure during coating deposition and they reach the highest values for the AlCrN coating deposited under nitrogen pressure of 5 Pa, 0.94 and 0.231, respectively.
The substrate bias voltage has a significant effect on the growth and physical properties of the CrAlN coatings formed using cathodic arc evaporation. An increase in hardness with the negative substrate bias voltage is observed, Figure 10.
Figure 10. Hardness of AlCrN coatings deposited at temperature of 450 °C and nitrogen pressure of 3 Pa dependent on negative substrate bias voltage.
3.4. Adhesion
One of the most important feature of the coating–substrate system is adhesion. In recent years the scratch test is commonly applied because of the measurable (numeric) test result. Critical load Lc2 related to delamination of coatings formed in different nitrogen pressure and at the substrate bias voltage −100 V is high—about 90 and 80 N for coatings deposited at 350 °C and about 450 °C, respectively, Figure 11. Critical load is almost independent of the nitrogen pressure. Similar results of Lc are also reported in Ref [14,32].
Figure 11. Critical load (Lc2) of the coatings deposited using different nitrogen pressure and substrate bias voltage UB = −100 V. Figure 11. Critical load (Lc2) of the coatings deposited using different nitrogen pressure and substratebias voltage UB = −100 V.
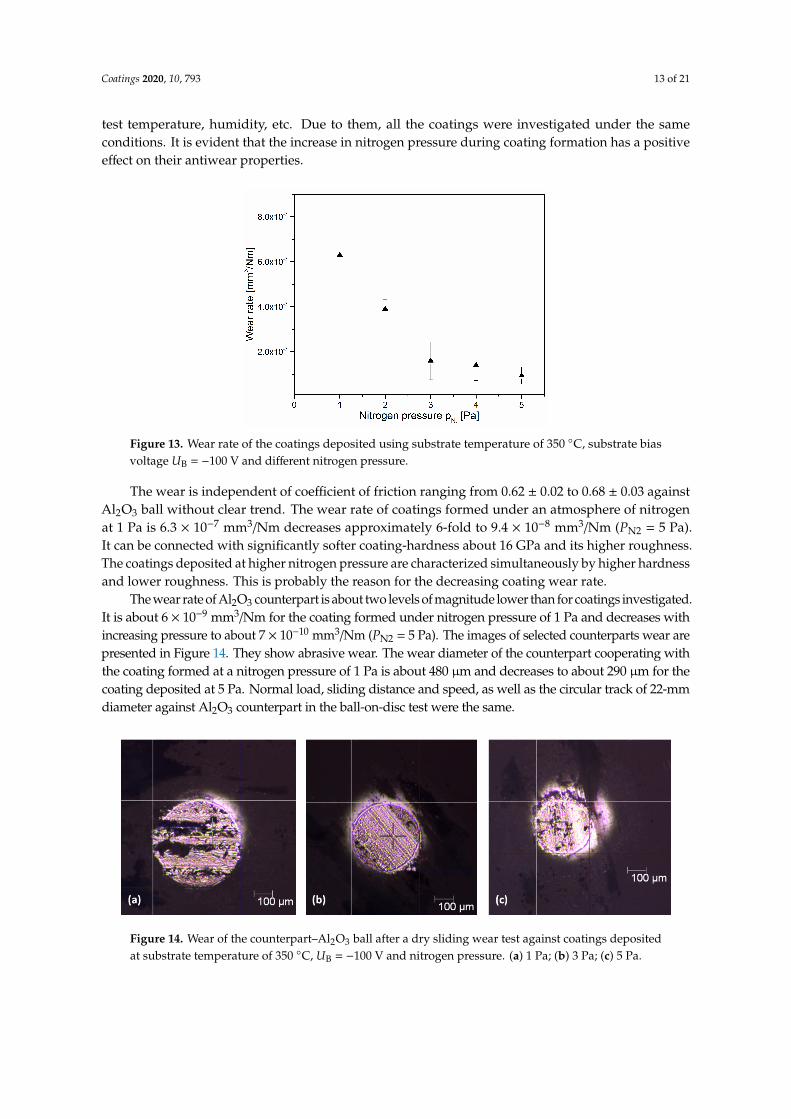
The Daimler–Benz adhesion test is extremely quick and easy-to-apply test. The results of the test forcoatings deposited at 350 and 450 C presenting the highest scratch crack propagation resistance (CPRS)are shown in Figure 12. The radial cracks extending out from the indent and spalling of the coatings arevisible on coating deposited at 350 C (Figure 12a) and 450 C (Figure 12b). Additionally, in Figure 12bthe other type of coating damages, the cracks around indentation, are apparent. These cracks showcohesive microspallations along the length. AlCrN coating deposited at 450 C shows significantlymore delamination. The results indicate that the coating adhesion can be classified as HF 2 to HF3 for coating presented in Figure 12a and HF 3 to HF 4 for coating deposited at higher temperature(Figure 12b). Due to lower hardness of AlCrN coatings deposited at 450 C pilling up around theindentation after the Daimler–Benz (DB) test forms. For this reason large tensile stresses may occur inits surrounding, which results in cracks around the indentation.
Coatings 2020, 10, x FOR PEER REVIEW 12 of 21
It is assumed that Lc1 critical load is considered to be a resistance to crack initiation. For all coatings, both deposited at 350 and 450 °C Lc1 ranges from 23 to 35 N. For thin coatings the Lc1 value as high as possible is beneficial. Then the cracking of the coating occurs for higher loads. Zhang et al. [35] show that both high Lc1 and difference (Lc2−Lc1) are necessary for high toughness of the coating. They proposed new parameter—CPRS (scratch crack propagation resistance) to evaluation of the film toughness: CPRs = Lc1·(Lc2−Lc1). Based on the equation, it was found that for coatings deposited at 350 °C the average value is about 1900 N2 and is the highest for coating deposited at nitrogen pressure 2 Pa. Average value of CPRS for coatings deposited at 450 °C is about 30% lower and is about 1350 N2. In this set of coatings the highest value is for coating deposited at nitrogen pressure 3 Pa. Above results are consistent with data shown in Figure 11.
The findings of Wang et al. [14] indicate that adhesion strength of AlCrN coatings is similar. Lc2 ranges from 60 to 85 N and Lc1 from 30 to 40 N, depending on the substrate bias voltage and nitrogen pressure. Similar values are presented by Cai et al. [32] for Al–Ti–N coatings deposited using arc ion plating.
The Daimler–Benz adhesion test is extremely quick and easy-to-apply test. The results of the test for coatings deposited at 350 and 450 °C presenting the highest scratch crack propagation resistance (CPRS) are shown in Figure 12. The radial cracks extending out from the indent and spalling of the coatings are visible on coating deposited at 350 °C (Figure 12a) and 450 °C (Figure 12b). Additionally, in Figure 13b the other type of coating damages, the cracks around indentation, are apparent. These cracks show cohesive microspallations along the length. AlCrN coating deposited at 450 °C shows significantly more delamination. The results indicate that the coating adhesion can be classified as HF 2 to HF 3 for coating presented in Figure 12a and HF 3 to HF 4 for coating deposited at higher temperature (Figure 12b). Due to lower hardness of AlCrN coatings deposited at 450 °C pilling up around the indentation after the Daimler–Benz (DB) test forms. For this reason large tensile stresses may occur in its surrounding, which results in cracks around the indentation.
Figure 12. Micrographs of Rockwell indents in Daimler–Benz adhesion test for coatings, characterized by the highest scratch crack propagation resistance, deposited at: (a) 350 °C and 2 Pa and (b) 450 °C and 3 Pa.
The hard coatings of good cohesion should exhibit—at most—small lines extending radially from the center of the indent to the outside. The indent crater should be also uncracked. In hard coating–substrate systems with good adhesion, there should be no delamination of the coating in the crater or surrounding area.
3.5. Wear Figure 13 shows the wear rate of the coatings deposited at substrate temperature of 350 °C,
substrate bias voltage UB = −100 V and different nitrogen pressure. Many parameters affect the wear rate of the coatings. These are the type of applied counterpart, normal load, sliding speed, test temperature, humidity, etc. Due to them, all the coatings were investigated under the same
Figure 12. Micrographs of Rockwell indents in Daimler–Benz adhesion test for coatings, characterizedby the highest scratch crack propagation resistance, deposited at: (a) 350 C and 2 Pa and (b) 450 Cand 3 Pa.
The hard coatings of good cohesion should exhibit—at most—small lines extending radiallyfrom the center of the indent to the outside. The indent crater should be also uncracked. In hardcoating–substrate systems with good adhesion, there should be no delamination of the coating in thecrater or surrounding area.
3.5. Wear
Figure 13 shows the wear rate of the coatings deposited at substrate temperature of 350 C,substrate bias voltage UB = −100 V and different nitrogen pressure. Many parameters affect thewear rate of the coatings. These are the type of applied counterpart, normal load, sliding speed,
Coatings 2020, 10, 793 13 of 21
test temperature, humidity, etc. Due to them, all the coatings were investigated under the sameconditions. It is evident that the increase in nitrogen pressure during coating formation has a positiveeffect on their antiwear properties.
Coatings 2020, 10, x FOR PEER REVIEW 13 of 21
conditions. It is evident that the increase in nitrogen pressure during coating formation has a positive effect on their antiwear properties.
Figure 13. Wear rate of the coatings deposited using substrate temperature of 350 °C, substrate bias voltage UB = −100 V and different nitrogen pressure.
The wear is independent of coefficient of friction ranging from 0.62 ± 0.02 to 0.68 ± 0.03 against Al2O3 ball without clear trend. The wear rate of coatings formed under an atmosphere of nitrogen at 1 Pa is 6.3 × 10⁻⁷ mm3/Nm decreases approximately 6-fold to 9.4 × 10⁻⁸ mm3/Nm (PN2 = 5 Pa). It can be connected with significantly softer coating-hardness about 16 GPa and its higher roughness. The coatings deposited at higher nitrogen pressure are characterized simultaneously by higher hardness and lower roughness. This is probably the reason for the decreasing coating wear rate.
The wear rate of Al2O3 counterpart is about two levels of magnitude lower than for coatings investigated. It is about 6 × 10⁻⁹ mm3/Nm for the coating formed under nitrogen pressure of 1 Pa and decreases with increasing pressure to about 7 × 10⁻¹⁰ mm3/Nm (PN2 = 5 Pa). The images of selected counterparts wear are presented in Figure 14. They show abrasive wear. The wear diameter of the counterpart cooperating with the coating formed at a nitrogen pressure of 1 Pa is about 480 µm and decreases to about 290 µm for the coating deposited at 5 Pa. Normal load, sliding distance and speed, as well as the circular track of 22-mm diameter against Al2O3 counterpart in the ball-on-disc test were the same.
Figure 14. Wear of the counterpart–Al2O3 ball after a dry sliding wear test against coatings deposited at substrate temperature of 350 °C, UB = −100 V and nitrogen pressure. (a) 1 Pa; (b) 3 Pa; (c) 5 Pa.
3.6. Corrosion
The potentiodynamic tests showed that all AlCrN coatings significantly improve the corrosion resistance of HS6-5-2 steel, Figure 15. The change of nitrogen pressure in the coating process do not result in significant changes in the corrosion properties of the steel–coating system. Similar values of both corrosion potential and corrosion current density were registered. The best corrosion properties
Figure 13. Wear rate of the coatings deposited using substrate temperature of 350 C, substrate biasvoltage UB = −100 V and different nitrogen pressure.
The wear is independent of coefficient of friction ranging from 0.62 ± 0.02 to 0.68 ± 0.03 againstAl2O3 ball without clear trend. The wear rate of coatings formed under an atmosphere of nitrogenat 1 Pa is 6.3 × 10⁻⁷ mm3/Nm decreases approximately 6-fold to 9.4 × 10⁻⁸ mm3/Nm (PN2 = 5 Pa).It can be connected with significantly softer coating-hardness about 16 GPa and its higher roughness.The coatings deposited at higher nitrogen pressure are characterized simultaneously by higher hardnessand lower roughness. This is probably the reason for the decreasing coating wear rate.
The wear rate of Al2O3 counterpart is about two levels of magnitude lower than for coatings investigated.It is about 6 × 10⁻⁹ mm3/Nm for the coating formed under nitrogen pressure of 1 Pa and decreases withincreasing pressure to about 7 × 10⁻¹⁰ mm3/Nm (PN2 = 5 Pa). The images of selected counterparts wear arepresented in Figure 14. They show abrasive wear. The wear diameter of the counterpart cooperating withthe coating formed at a nitrogen pressure of 1 Pa is about 480 µm and decreases to about 290 µm for thecoating deposited at 5 Pa. Normal load, sliding distance and speed, as well as the circular track of 22-mmdiameter against Al2O3 counterpart in the ball-on-disc test were the same.
Coatings 2020, 10, x FOR PEER REVIEW 13 of 21
conditions. It is evident that the increase in nitrogen pressure during coating formation has a positive effect on their antiwear properties.
Figure 13. Wear rate of the coatings deposited using substrate temperature of 350 °C, substrate bias voltage UB = −100 V and different nitrogen pressure.
The wear is independent of coefficient of friction ranging from 0.62 ± 0.02 to 0.68 ± 0.03 against Al2O3 ball without clear trend. The wear rate of coatings formed under an atmosphere of nitrogen at 1 Pa is 6.3 × 10⁻⁷ mm3/Nm decreases approximately 6-fold to 9.4 × 10⁻⁸ mm3/Nm (PN2 = 5 Pa). It can be connected with significantly softer coating-hardness about 16 GPa and its higher roughness. The coatings deposited at higher nitrogen pressure are characterized simultaneously by higher hardness and lower roughness. This is probably the reason for the decreasing coating wear rate.
The wear rate of Al2O3 counterpart is about two levels of magnitude lower than for coatings investigated. It is about 6 × 10⁻⁹ mm3/Nm for the coating formed under nitrogen pressure of 1 Pa and decreases with increasing pressure to about 7 × 10⁻¹⁰ mm3/Nm (PN2 = 5 Pa). The images of selected counterparts wear are presented in Figure 14. They show abrasive wear. The wear diameter of the counterpart cooperating with the coating formed at a nitrogen pressure of 1 Pa is about 480 µm and decreases to about 290 µm for the coating deposited at 5 Pa. Normal load, sliding distance and speed, as well as the circular track of 22-mm diameter against Al2O3 counterpart in the ball-on-disc test were the same.
Figure 14. Wear of the counterpart–Al2O3 ball after a dry sliding wear test against coatings deposited at substrate temperature of 350 °C, UB = −100 V and nitrogen pressure. (a) 1 Pa; (b) 3 Pa; (c) 5 Pa.
3.6. Corrosion
The potentiodynamic tests showed that all AlCrN coatings significantly improve the corrosion resistance of HS6-5-2 steel, Figure 15. The change of nitrogen pressure in the coating process do not result in significant changes in the corrosion properties of the steel–coating system. Similar values of both corrosion potential and corrosion current density were registered. The best corrosion properties
Figure 14. Wear of the counterpart–Al2O3 ball after a dry sliding wear test against coatings depositedat substrate temperature of 350 C, UB = −100 V and nitrogen pressure. (a) 1 Pa; (b) 3 Pa; (c) 5 Pa.

Coatings 2020, 10, 793 14 of 21
3.6. Corrosion
The potentiodynamic tests showed that all AlCrN coatings significantly improve the corrosionresistance of HS6-5-2 steel, Figure 15. The change of nitrogen pressure in the coating process do notresult in significant changes in the corrosion properties of the steel–coating system. Similar values ofboth corrosion potential and corrosion current density were registered. The best corrosion propertieswere obtained for the coating deposited at nitrogen pressure of 3 Pa. The corrosion potential Ecorr was−0.010 V and the corrosion current density icorr 0.044 µA/cm2. However, it should be noted that thedifferences are small. All calculated parameters are presented in Table 3.
Coatings 2020, 10, x FOR PEER REVIEW 14 of 21
were obtained for the coating deposited at nitrogen pressure of 3 Pa. The corrosion potential Ecorr was −0.010 V and the corrosion current density icorr 0.044 µA/cm2. However, it should be noted that the differences are small. All calculated parameters are presented in Table 3.
Figure 15. List of polarization curves for investigated coatings.
Table 3. Summary of all calculated parameters of the potentiodynamic corrosion tests.
Sample Ecorr (V) icorr (A/cm2) Rp (kΩ·cm2) ba (V) bc (V) HS6-5-2 steel −0.702 2.8 13 0.080 0.380
CrN 0.002 0.053 256.01 0.036 0.229
AlCrN PN2 =3 Pa −0.010 0.044 439 0.061 0.169 PN2 =4 Pa −0.014 0.103 419.32 0.170 0.235 PN2 =5 Pa −0.007 0.065 339 0.070 0.188
AlCrN coatings were also compared with CrN coating deposited at nitrogen pressure PN2 = 3 Pa and other parameters the same as for AlCrN coatings. The samples showed almost identical anti-corrosion properties, the difference in the corrosion potential is 0.003 V, while in the corrosion current density 0.011 µA/cm2 in favor for CrN coating. There is also a noticeable difference in the course of the corrosion process. AlCrN samples show “noise” in the recording of anode current density, which was not recorded in the sample with the CrN coating applied. Current density fluctuations can, most likely, be attributed to alternating passivation and transpassivation processes occurring on the surface or in the vicinity of the microdroplets of Al. In addition, in the case of AlCrN coatings, a passive state was recorded in the potential range from 0.130 to 0.630 V, which does not occur in the CrN coating.
In order to determine the resistance of the applied coatings to pitting corrosion, potentiodynamic cyclic tests were carried out, in which the sample was subjected to 12 h of stabilization in a corrosive environment. An example of a curve is shown in Figure 16. In all cases, similar curve runs and hysteresis loops were observed, which indicates a lack of pitting corrosion resistance.
Figure 15. List of polarization curves for investigated coatings.
Table 3. Summary of all calculated parameters of the potentiodynamic corrosion tests.
Sample Ecorr (V) icorr (A/cm2) Rp (kΩ·cm2) ba (V) bc (V)
HS6-5-2 steel −0.702 2.8 13 0.080 0.380CrN 0.002 0.053 256.01 0.036 0.229
AlCrNPN2 = 3 Pa −0.010 0.044 439 0.061 0.169PN2 = 4 Pa −0.014 0.103 419.32 0.170 0.235PN2 = 5 Pa −0.007 0.065 339 0.070 0.188
AlCrN coatings were also compared with CrN coating deposited at nitrogen pressure PN2 = 3 Paand other parameters the same as for AlCrN coatings. The samples showed almost identicalanti-corrosion properties, the difference in the corrosion potential is 0.003 V, while in the corrosioncurrent density 0.011 µA/cm2 in favor for CrN coating. There is also a noticeable difference in thecourse of the corrosion process. AlCrN samples show “noise” in the recording of anode current density,which was not recorded in the sample with the CrN coating applied. Current density fluctuationscan, most likely, be attributed to alternating passivation and transpassivation processes occurring onthe surface or in the vicinity of the microdroplets of Al. In addition, in the case of AlCrN coatings,a passive state was recorded in the potential range from 0.130 to 0.630 V, which does not occur in theCrN coating.
In order to determine the resistance of the applied coatings to pitting corrosion, potentiodynamiccyclic tests were carried out, in which the sample was subjected to 12 h of stabilization in a corrosiveenvironment. An example of a curve is shown in Figure 16. In all cases, similar curve runs andhysteresis loops were observed, which indicates a lack of pitting corrosion resistance.
Coatings 2020, 10, 793 15 of 21
Coatings 2020, 10, x FOR PEER REVIEW 15 of 21
Figure 16. Measurement of pitting corrosion resistance for a coating formed at nitrogen pressure of 5 Pa on a steel HS6-5-2 substrate.
3.7. Thermal Stability
The thermal stability of AlCrN coatings formed at different nitrogen pressure in the vacuum chamber was investigated by controlled annealing according to the thermogram shown in Figure 1. In Figure 17 is presented comparison of relative variations of the α coefficient at 200 °C for each coating, calculated according to Equations (1) and (2) after subsequent annealing at temperature Ta = 320, 430, and 520 °C.
Figure 17. Result of thermal stability testing of AlCrN coatings formed at different nitrogen pressure in the technological chamber. Determined by means of relative changes in αDL coefficient at 200 °C.
As described above in applied method positive values of ΔαDL changes mean that the given annealing caused an increase in thermomechanical loads of the substrate through the coating, which is a consequence of the increase in the compressive stress in the coating. It relates for coating deposited at nitrogen pressure of 1 Pa annealed and 320 °C. With regard to the suitability of the analyzed coating–substrate system. This indicates the improvement of thermomechanical coupling conditions between these elements of the system. In the conditions of operation at elevated temperature. It may result in increased durability of these coatings. Negative values of ΔαDL changes mean loss of compressive stress value, which leads to deterioration of thermomechanical interaction conditions between the substrate and the coating. Which in turn affects the deterioration of the service life of the tested system. Such phenomena were recorded when coatings were deposited at nitrogen pressure P = 2, 3, and 4 Pa. The coating–substrate system deposited at PN2 = 4 Pa shows the most favorable stability. The obtained results of thermal stability tests of the coatings are qualitatively
Figure 16. Measurement of pitting corrosion resistance for a coating formed at nitrogen pressure of5 Pa on a steel HS6-5-2 substrate.
3.7. Thermal Stability
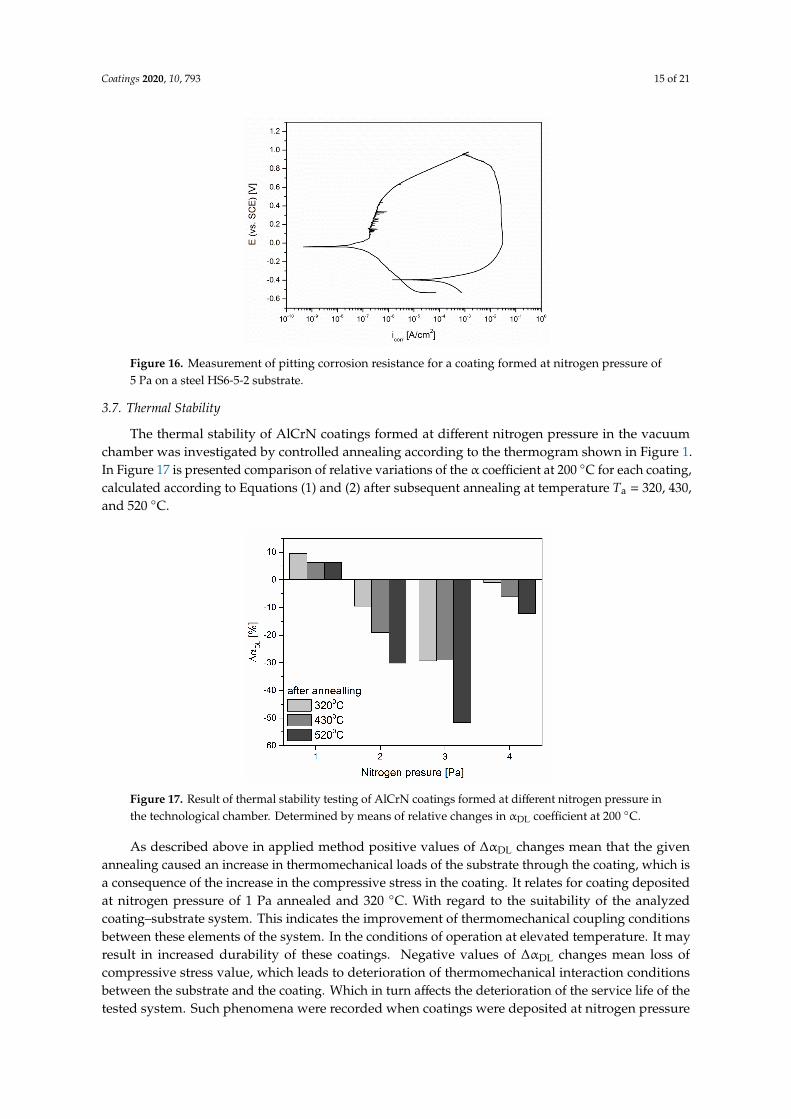
The thermal stability of AlCrN coatings formed at different nitrogen pressure in the vacuumchamber was investigated by controlled annealing according to the thermogram shown in Figure 1.In Figure 17 is presented comparison of relative variations of the α coefficient at 200 C for each coating,calculated according to Equations (1) and (2) after subsequent annealing at temperature Ta = 320, 430,and 520 C.
Coatings 2020, 10, x FOR PEER REVIEW 15 of 21
Figure 16. Measurement of pitting corrosion resistance for a coating formed at nitrogen pressure of 5 Pa on a steel HS6-5-2 substrate.
3.7. Thermal Stability
The thermal stability of AlCrN coatings formed at different nitrogen pressure in the vacuum chamber was investigated by controlled annealing according to the thermogram shown in Figure 1. In Figure 17 is presented comparison of relative variations of the α coefficient at 200 °C for each coating, calculated according to Equations (1) and (2) after subsequent annealing at temperature Ta = 320, 430, and 520 °C.
Figure 17. Result of thermal stability testing of AlCrN coatings formed at different nitrogen pressure in the technological chamber. Determined by means of relative changes in αDL coefficient at 200 °C.
As described above in applied method positive values of ΔαDL changes mean that the given annealing caused an increase in thermomechanical loads of the substrate through the coating, which is a consequence of the increase in the compressive stress in the coating. It relates for coating deposited at nitrogen pressure of 1 Pa annealed and 320 °C. With regard to the suitability of the analyzed coating–substrate system. This indicates the improvement of thermomechanical coupling conditions between these elements of the system. In the conditions of operation at elevated temperature. It may result in increased durability of these coatings. Negative values of ΔαDL changes mean loss of compressive stress value, which leads to deterioration of thermomechanical interaction conditions between the substrate and the coating. Which in turn affects the deterioration of the service life of the tested system. Such phenomena were recorded when coatings were deposited at nitrogen pressure P = 2, 3, and 4 Pa. The coating–substrate system deposited at PN2 = 4 Pa shows the most favorable stability. The obtained results of thermal stability tests of the coatings are qualitatively
Figure 17. Result of thermal stability testing of AlCrN coatings formed at different nitrogen pressure inthe technological chamber. Determined by means of relative changes in αDL coefficient at 200 C.
As described above in applied method positive values of ∆αDL changes mean that the givenannealing caused an increase in thermomechanical loads of the substrate through the coating, which isa consequence of the increase in the compressive stress in the coating. It relates for coating depositedat nitrogen pressure of 1 Pa annealed and 320 C. With regard to the suitability of the analyzedcoating–substrate system. This indicates the improvement of thermomechanical coupling conditionsbetween these elements of the system. In the conditions of operation at elevated temperature. It mayresult in increased durability of these coatings. Negative values of ∆αDL changes mean loss ofcompressive stress value, which leads to deterioration of thermomechanical interaction conditionsbetween the substrate and the coating. Which in turn affects the deterioration of the service life of thetested system. Such phenomena were recorded when coatings were deposited at nitrogen pressure

Coatings 2020, 10, 793 16 of 21
P = 2, 3, and 4 Pa. The coating–substrate system deposited at PN2 = 4 Pa shows the most favorablestability. The obtained results of thermal stability tests of the coatings are qualitatively consistent withthe test results of the temperature evolution of the stress in the AlCrN [36] and TiN coatings [37,38]deposited on a silicon substrate. In general, it can be assumed that the rule is used to interpret theresults: the more negative value of the ∆αDL changes, the less favorable operational lifetime forecast ofthe given system is.
In Figure 18 the results of the thermal stability tests of AlCrN coatings by registering the ∆Lsvalues are shown. The results of measurements of ∆Ls substrate length change after their subsequentannealing were applied. ∆Ls measurements are performed at 20 C after each annealing. The coatingsshow compressive stresses. In this case, the analysis of the system service life based on ∆Ls changesafter the next annealing is carried out according to the rule: if after the given annealing a positivechange of ∆Ls occurred, the consequence of this annealing is the increase of compressive stresses andcreation of conditions for increasing the service life of the tested system. The negative changes of ∆Lsindex after the annealing are the loss of compressive stresses in the coating, if the adhesion of thecoating to the substrate has not changed. The qualitative compliance of the thermal stability of thetested systems, determined by the ∆αDL coefficients measured at 200 C, was registered.
Coatings 2020, 10, x FOR PEER REVIEW 16 of 21
consistent with the test results of the temperature evolution of the stress in the AlCrN [36] and TiN coatings [37,38] deposited on a silicon substrate. In general, it can be assumed that the rule is used to interpret the results: the more negative value of the ΔαDL changes, the less favorable operational lifetime forecast of the given system is.
In Figure 18 the results of the thermal stability tests of AlCrN coatings by registering the ΔLs values are shown. The results of measurements of ΔLs substrate length change after their subsequent annealing were applied. ΔLs measurements are performed at 20 °C after each annealing. The coatings show compressive stresses. In this case, the analysis of the system service life based on ΔLs changes after the next annealing is carried out according to the rule: if after the given annealing a positive change of ΔLs occurred, the consequence of this annealing is the increase of compressive stresses and creation of conditions for increasing the service life of the tested system. The negative changes of ΔLs index after the annealing are the loss of compressive stresses in the coating, if the adhesion of the coating to the substrate has not changed. The qualitative compliance of the thermal stability of the tested systems, determined by the ΔαDL coefficients measured at 200 °C, was registered.
Figure 18. Changes in ΔLs index after annealing of tested AlCrN coating–substrate systems. ΔLs index was calculated from investigated system length measurements performed at 20 °C.
The qualitative differences in the values of the relative changes of ΔαDL and ΔLs are consistent with the results of testing the functional parameters of AlCrN coatings [2,13,14].
4. Discussion
4.1. Effect of Deposition Temperature
The lower deposition rate for coatings deposited at higher temperature (Figure 2) may be explained by:
• So-called “target poisoning” [39]. When the nitride of the cathode material formed on the cathode has a higher melting point than the cathode, it can reduce the number of particles emitted from the arc spots;
• Other kinetics of the coating formation process. At higher substrate temperatures, the incident particles become more mobile, which can lead to easier resputtering.
The coatings formed at the temperature of 450 °C show a different phase composition, especially at lower nitrogen pressure, than the coatings formed at the temperature of 350 °C. Thus, the h-AlN phase is formed. As mentioned above, the crystallite size of the coatings deposited at the higher temperature (450 °C) is about 10%–25% greater than that of the coatings deposited at 350 °C. This results in less hardness of these coatings. This effect is consistent with the Hall–Petch relation [40]:
Figure 18. Changes in ∆Ls index after annealing of tested AlCrN coating–substrate systems. ∆Ls indexwas calculated from investigated system length measurements performed at 20 C.
The qualitative differences in the values of the relative changes of ∆αDL and ∆Ls are consistentwith the results of testing the functional parameters of AlCrN coatings [2,13,14].
4. Discussion
4.1. Effect of Deposition Temperature
The lower deposition rate for coatings deposited at higher temperature (Figure 2) may be explained by:
• So-called “target poisoning” [39]. When the nitride of the cathode material formed on the cathodehas a higher melting point than the cathode, it can reduce the number of particles emitted fromthe arc spots;
• Other kinetics of the coating formation process. At higher substrate temperatures, the incidentparticles become more mobile, which can lead to easier resputtering.
The coatings formed at the temperature of 450 C show a different phase composition, especially atlower nitrogen pressure, than the coatings formed at the temperature of 350 C. Thus, the h-AlN phaseis formed. As mentioned above, the crystallite size of the coatings deposited at the higher temperature
Coatings 2020, 10, 793 17 of 21
(450 C) is about 10–25% greater than that of the coatings deposited at 350 C. This results in lesshardness of these coatings. This effect is consistent with the Hall–Petch relation [40]:
H = H0 +kHP
Λ0.5 , (3)
where: H—coating hardness, H0, kHP—constants, Λ—grain size.In this relation for greater crystallite size the hardness is smaller. The relatively low hardness of
the coatings deposited at the nitrogen pressure of 1 Pa may be associated with the presence of α-Crphase, Figure 9. In a mixture of α-Cr and Cr2N hexagonal phases Cr phase is significantly softer.The increase in nitrogen pressure promotes the formation of CrN cubic phase [41]. Smaller hardness ofthe coatings deposited at higher temperature at lower nitrogen pressure is probably connected withphase composition. The coatings with h-AlN phase present significantly lower hardness [9].
AlCrN coatings characterized by a relatively low hardness of 10–20 GPa and increasing withnegative substrate bias voltage increase were described by Wang et al. [18]. They indicate that lowhardness may be caused by grains of relatively large size and the large number of defects resulting in aloose structure of the coating. Similar in hardness with nitrogen was observed by Tang et al. [11].
4.2. Effect of Nitrogen Pressure
The results of deposition rate, Figure 2 are consistent with the data presented elsewhere [5,14,19].Cai et al. [32] indicate other relationship—increasing the deposition rate in nitrogen pressure from 0.7 to1.2 Pa and decreasing from 1.2 to 1.7 Pa. Smaller thickness of the coatings deposited at a higher nitrogenpressure may result from the greater dissipation of ions due to collisions with gas particles [42].
With an increase in the nitrogen pressure during deposition process Al rate decreases, Figure 5.This may be related to the lower atomic mass of aluminum, which may result in greater dispersion ofaluminum ions in comparison with chromium in collisions with nitrogen ions and leads to its lowercondensation on the substrate. This effect was presented previously [10].
The findings of Xu et al. [43] indicate that H3/E2 ratio for Al0.68Cr0.32 N is about 0.09.The investigations of Cr–Al–N coatings deposited using multi-arc ion plating conducted byWang et al. [14] indicate that H/E and H3/E2 ratios range from about 0.08 to 0.09 and from 0.20to 0.23 GPa, respectively dependent on substrate bias voltage. Similar investigations on magnetronsputtered coatings show lower H/E and H3/E2 ratios [18]. They range from 0.05 to 0.07 and from 0.02to 0.12 GPa, respectively.
The wear rate of the coatings decreases from 6.3× 10⁻⁷ mm3/Nm (pN2 = 1 Pa) to 9.4 × 10⁻⁸ mm3/Nm(pN2 = 5 Pa). It can be connected with increasing hardness of the coatings. The course of changes inthe wear rate with nitrogen pressure is similar to coatings formed from the AlCr cathode (80:20) [9].Pulugurtha et al. [8] investigating CrAlN coatings deposited by AC reactive magnetron sputteringfound similar phenomena. The increase in nitrogen flow rate in the vacuum chamber during theirformation causes a decrease in the wear volume of the tested coating.
4.3. Effect of Substrate Bias Voltage
The smaller thickness of the coatings deposited at higher substrate bias voltage may result fromthe resputtering of the coating at which weakly bound particles are removed from the surface by highenergy particles. As a result a change in the morphology and/or chemical composition of the coatingscan be observed.
The energy of ions bombarding the substrate largely determines the nucleation and the growthof the coating as well as its quality. The changes the microstructure and properties of the coating,dependent on the parameters of the coating deposition, i.e., substrate bias voltage, the substratetemperature and the nitrogen pressure can be expected. The increase in ion energy (higher substratebias voltage) contributes to the fine grain structure [14] with high hardness coatings (in some casesdouble the harder than the columnar structure). Additional features are as follows: a non-porous

Coatings 2020, 10, 793 18 of 21
coating of high ductility and high adhesion to the substrate [44]. A small value of the substrate biasvoltage favors the columnar structure formation of higher surface roughness [39]. It can be seen that forsmall substrate bias voltage the roughness parameter Ra of AlCrN coatings formed at PN2 = 5 Pa andsubstrate temperature of 350 C (Figure 4) is the largest, (0.17 ± 0.03) µm and decreases to (0.06 ± 0.02)µm with increasing negative substrate bias voltage to about −300 V. A similar effect of reduction of thesurface coating roughness with the substrate bias voltage increase was presented previously for AlCrNcoating [5,13] and CrN [44–46].
It is probably connected with more dense and fine grained structure of the coatings deposited athigher negative voltage. This effect was earlier confirmed by Sabitzer et al. [7]. Due to reduction in thegrain size the contribution of grain boundary fraction in the coating increases. In this case additionalbarriers for the lattice dislocation motion appear and it improves the strength of the coating [18].The opposite effect is shown by Wang et al. [14] with an increase in the negative substrate bias voltagethe hardness of the coating decreases. Such differing literature data may be related to differentcompositions of AlCrN coatings and probably the formation of other chromium (aluminum) nitridephases in the coatings.
5. Conclusions
The CrAlN coatings were deposited form cathode Al50Cr50 on HS6-5-2 steel substratesusing cathodic arc evaporation. The effect of technological parameters: substrate temperature,nitrogen pressure, substrate bias voltage on chemical and phase composition and mechanical propertiesof the coatings were investigated. The above results allow to conclude as follows:
• The highest deposition rate was observed for coatings deposited at nitrogen pressure of threepascals independent of substrate temperature. The deposition rate was higher for coatingsdeposited at lower substrate temperature. The deposition rate decreased with negative substratebias voltage increase. This was connected with coating resputtering phenomenon due to higherenergy of bombarding ions;
• The roughness parameter Ra of the decreased with nitrogen pressure during deposition.The roughness Ra was similar for coatings deposited at substrate temperature 350 and 450 C.This was probably connected with the number of surface defects;
• The hardness of the coatings deposited in both temperatures 350 and 450 C increased with nitrogenpressure. Coatings deposited at higher temperature were characterized by lower hardness;
• The coatings were characterized by very good adhesion to the substrate. The critical force Lc2 wasabout 90 N;
• The wear resistance of investigated coatings was dependent on nitrogen pressure duringdeposition. The coatings deposited at the highest nitrogen pressure showed the best wearresistance. Poor antiwear properties were observed for coatings formed at low nitrogen pressure;
• AlCrN coatings significantly improved the corrosion resistance of HS6-5-2 steel. The change ofnitrogen pressure in deposition process did not significantly affect the course of the corrosionprocess; the differences in the obtained parameters were small. The best anti-corrosion propertieswere registered for the coating deposited at nitrogen pressure of three pascals. None of thecoatings showed resistance to pitting corrosion. In all cases, hysteresis loops were observed incyclic measurements;
• The results of thermomechanical tests of thermal stability of AlCrN coatings deposited withdifferent nitrogen pressures in the technological chamber show that coatings deposited at nitrogenpressure of one pascal revealed the most favorable service life—provided that their operatingtemperature does not exceed 320 C. In the group of coatings deposited at higher pressures andsubstrate polarization UB = −100 V, the coatings deposited at a pressure of four pascals wereparticularly distinguished. They presented the most favorable thermal stability; the above coatingproperties were confirmed by the qualitative compliance of the two parameters αDL and ∆Ls.
Coatings 2020, 10, 793 19 of 21
Author Contributions: Conceptualization, B.W. and A.G.; methodology, B.W.; software, D.M.; validation, B.W.and A.G.; formal analysis, B.W., A.G., P.M., E.D., and D.M.; resources, A.G.; data curation, B.W. and A.G.;writing—original draft preparation, B.W.; writing—review and editing, E.D. and A.G.; visualization, B.W. andE.D.; supervision, A.G. and P.M.; project administration, P.M.; funding acquisition, P.M. All authors have read andagreed to the published version of the manuscript.
Funding: This research was funded by the National Center for Research and Development, Poland, Grant NumberBiostrateg3/344303/14/NCBR/2018. The APC was funded by Biostrateg3/344303/14/NCBR/2018
Conflicts of Interest: The authors declare no conflict of interest.
References
1. Mayrhofer, P.H.; HWillmann, H.; Mitterer, C. Oxidation kinetics of sputtered Cr–N hard coatings.Surf. Coat. Technol. 2001, 146, 222–228. [CrossRef]
2. Chim, Y.C.; Ding, Z.Z.; Zeng, X.T.; Zhang, S. Oxidation resistance of TiN. CrN. TiAlN and CrAlN coatingsdeposited by lateral rotating cathode arc. Thin Solid Films 2002, 517, 4845–4849. [CrossRef]
3. Mitterer, C.; Mayrhofer, P.H.; Musil, J. Thermal stability of PVD hard coatings. Vacuum 2003, 71, 279–284.[CrossRef]
4. Reiter, A.E.; Derflinger, V.H.; Hanselmann, B.; Bachmann, T.; Sartory, B. Investigation of the propertiesof Al1-xCrxN coatings prepared by cathodic arc evaporation. Surf. Coat. Technol. 2005, 200, 2114–2122.[CrossRef]
5. Romero, J.; Gómez, M.A.; Esteve, J.; Montalà, F.; Carreras, L.; Grifol, M.; Lousa, A. CrAlN coatings depositedby cathodic arc evaporation at different substrate bias. Thin Solid Films 2006, 515, 113–117. [CrossRef]
6. Benlatreche, Y.; Nouveau, C.; Aknouch, H.; Imhoff, L.; Martin, N.; Gavoille, J.; Rousselot, C.; Rauch, J.Y.;Pilloud, D. Physical and mechanical properties of CrAlN and CrSiN ternary systems for wood machiningapplications. Plasma Phys. Polym. 2009, 6, S113–S119. [CrossRef]
7. Sabitzer, C.; Paulitsch, J.; Kolozsvári, S.; Rachbauer, R.; Mayrhofer, P.H. Influence of bias potential andlayer arrangement on structure and mechanical properties of arc evaporated Al–Cr–N coatings. Vacuum2014, 106, 49–52. [CrossRef]
8. Pulugurtha, S.R.; Bhat, D.G.; Gordon, M.H.; Shultz, J.; MJoshi, S.V.S.; Govindarajan, S. Mechanical andtribological properties of compositionally graded CrAlN films deposited by AC reactive magnetron sputtering.Surf. Coat. Technol. 2007, 202, 1160–1166. [CrossRef]
9. Gilewicz, A.; Jedrzejewski, R.; Myslinski, P.; Warcholinski, B. Structure, morphology and mechanical propertiesof AlCrN coatings deposited by cathodic arc evaporation. J. Mater. Eng. Perform. 2019, 28, 1522–1531. [CrossRef]
10. Birol, Y.; Isler, D. Response to thermal cycling of CAPVD (Al,Cr)N-coated hot work tool steel. Surf. Coat.Technol. 2010, 205, 275–280. [CrossRef]
11. Tang, J.F.; Lin, C.Y.; Yang, F.C.; Chang, C.L. Influence of nitrogen content and bias voltage on residual stressand the tribological and mechanical properties of CrAlN films. Coatings 2020, 10, 546. [CrossRef]
12. Aihua, L.; Jianxin, D.; Haibing, C.; Yangyang, C.; Jun, Z. Friction and wear properties of TiN, TiAlN, AlTiNand CrAlN PVD nitride coatings. Int. J. Refract. Met. Hard Mater. 2012, 31, 82–88. [CrossRef]
13. Reiter, A.E.; Mitterer, C.; de Figueiredo, M.R.; Franz, R. Abrasive and adhesive wear behavior of arc-evaporatedAl1-xCrxN hard coatings. Tribol. Lett. 2010, 37, 605–611. [CrossRef]
14. Wang, L.; Zhang, S.; Chen, Z.; Li, J.; Li, M. Influence of deposition parameters on hard Cr–Al–N coatingsdeposited by multi-arc ion plating. Appl. Surf. Sci. 2012, 258, 3629–3636. [CrossRef]
15. Lin, J.; Mishra, B.; Moore, J.J.; Sproul, W.D. Microstructure, mechanical and tribological propertiesof Cr1–xAlxN films deposited by pulsed-closed field unbalanced magnetron sputtering (P-CFUBMS).Surf. Coat. Technol. 2006, 201, 4329–4334. [CrossRef]
16. Forsén, R.; Johansson, M.P.; Odén, M.; Ghafoor, N. Effects of Ti alloying of AlCrN coatings on thermalstability and oxidation resistance. Thin Solid Films 2013, 534, 394–402. [CrossRef]
17. Endrino, J.L.; Fox-Rabinovich, G.S.; Gey, C. Hard AlTiN, AlCrN PVD coatings for machining of austeniticstainless steel. Surf. Coat. Technol. 2006, 200, 6840–6845. [CrossRef]
18. Wang, Y.X.; Zhang, S.; Lee, J.W.; Lew, W.S.; Li, B. Influence of bias voltage on the hardness and toughness ofCrAlN coatings via magnetron sputtering. Surf. Coat. Technol. 2012, 206, 5103–5107. [CrossRef]
Coatings 2020, 10, 793 20 of 21
19. Vetter, J.; Lugscheider, E.; Guerreiro, S.S. (Cr:Al) N coatings deposited by the cathodic vacuum are evaporation.Surf. Coat. Technol. 1998, 98, 1233–1239. [CrossRef]
20. Fuentes, G.G.; Rodriguez, R.; Avelar-Batista, J.C.; Housden, J.; Montal’a, F.; Carreras, L.J.; Cristobal, A.A.;Damborenea, J.J.; Tate, T.J. Recent advances in the chromium nitride PVD process for forming and machiningsurface protection. J. Mater. Proc. Technol. 2005, 167, 415–421. [CrossRef]
21. Cullity, B.D. Elements of X-ray Diffraction, 2nd ed.; Addison-Wesley Publishing Company Inc.: London, UK, 1978.22. Vidakis, S.; Antoniadis, A.; Bilalis, N. The VDI 3198 indentation test evaluation of a reliable qualitative
control for layered compounds. J. Mater. Process. Technol. 2003, 143, 481–485. [CrossRef]23. Archard, F. Contact and rubbing of flat surface. J. Appl. Phys. 1953, 24, 981–988. [CrossRef]24. McCafferty, E. Validation of corrosion rates measured by the Tafel extrapolation method. Corros. Sci.
2005, 47, 3202–3215. [CrossRef]25. Wiedemann, H.; Riesen, R.; Boller, A. Elasticity characterization of materials during thermal treatment by
thermal mechanical analysis. In Materials Characterization by Thermomechanical Analysis; Riga, A., Neag, M.,Eds.; ASTM International: West Conshohocken, PA, USA, 1991; pp. 84–99.
26. Myslinski, P. Investigation of the thermal stability of hard coatings by Modulated Temperature Dilatometry.Vacuum 2009, 83, 757–760. [CrossRef]
27. Karlsson, L.; Hörling, A.; Johansson, M.P.; Hultman, L.; Ramanath, G. The influence of thermal annealingon residual stresses and mechanical propiertes of arc-evaporated TiCxN1-x (x = 0, 0.15 and 0.45) thin films.Acta Mater. 2002, 50, 5103–5114. [CrossRef]
28. Hultman, L.; Engström, C.; Birch, J.; Johannsson, M.P.; Oden, M. Review of the thermal and mechanicalstability of TiN-based thin films. Z. Metallkd. 1999, 90, 803–813.
29. Price, D.M. Modulated-temperature thermomechanical analysis. Thermochim. Acta 2000, 357, 23–29.[CrossRef]
30. Hultman, L. Thermal stability of nitride thin films. Vacuum 2000, 57, 1–30. [CrossRef]31. Kraftmakher, Y. Modulation calorimetry and related techniques. Phys. Rep. 2002, 356, 1–117. [CrossRef]32. Cai, F.; Zhang, S.; Li, J.; Chen, Z.; Li, M.; Wang, L. Effect of nitrogen partial pressure on Al–Ti–N films
deposited by arc ion plating. Appl. Surf. Sci. 2011, 258, 1819–1825. [CrossRef]33. Leyland, A.; Matthews, A. On the significance of the H/E ratio in wear control: A nanocomposite coating
approach to optimized tribological behaviour. Wear 2000, 246, 1–11. [CrossRef]34. Musil, J.; Kunc, F.; Zeman, H.; Polakova, H. Relationships between hardness, Young’s modulus and elastic
recovery in hard nanocomposite coatings. Surf. Coat. Technol. 2002, 54, 304–313. [CrossRef]35. Zhang, S.; Sun, D.; Fu, Y.; Du, H. Effect of sputtering target power on microstructure and mechanical
properties of nanocomposite nc-TiN/a-SiN thin films. Thin Solid Films 2004, 447, 462–467. [CrossRef]36. Tritremmel, C. Comparison of magnetron sputtering and arc evaporation by Al–Cr–N hard coating. Diploma
Thesis, Montanuniversität Leoben, Leoben, Austria, 2007.37. Bielawski, M.; Seo, D. Residual stress development in UMS TiN coatings. Surf. Coat. Technol.
2005, 200, 1476–1482. [CrossRef]38. Bielawski, M. Residual stress control in TiN/Si coatings deposited by unbalance magnetron sputtering.
Surf. Coat. Technol. 2006, 200, 3987–3995. [CrossRef]39. Wan, X.S.; Zhao, S.S.; Yang, Y.; Gong, J.; Sun, C. Effects of nitrogen pressure and pulse bias voltage on the
properties of Cr-N coatings deposited by arc ion plating. Surf. Coat. Technol. 2010, 204, 1800–1810. [CrossRef]40. Taha, A.S.; Hammad, F.H. Application of the Hall-Petch relation to microhardness measurements on Al, Cu,
Al–MD 105, and Al–Cu Alloys. Phys. Status Solidi 1990, 119, 455–462. [CrossRef]41. Rebholz, C.; Ziegele, H.; Leyland, A.; Matthew, A. Structure, mechanical and tribological properties of
nitrogen-containing chromium coatings prepared by reactive magnetron sputtering. Surf. Coat. Technol.1999, 115, 222–229. [CrossRef]
42. Choi, S.A.; Kim, S.W.; Lee, S.M.; Kim, H.T.; Oh, Y.S. Effect of working pressure and substrate bias on phaseformation and microstructure of Cr–Al–N coatings. J. Korean Ceram. Soc. 2017, 54, 511–517. [CrossRef]
43. Xu, Y.X.; Riedl, H.; Holec, D.; Chen, L.; Du, Y.; Mayrhofer, P. Thermal stability and oxidation resistance ofsputtered Ti–Al–Cr–N hard coatings. Surf. Coat. Technol. 2017, 324, 48–56. [CrossRef]
44. Oden, M.; Almer, J.; Hakansson, G. The effects of bias voltage and annealing on the microstructure andresidual stress of arc-evaporated Cr–N coatings. Surf. Coat. Technol. 1999, 120, 272–276. [CrossRef]

Coatings 2020, 10, 793 21 of 21
45. Wang, D.Y.; Weng, K.W. Deposition of CrN coatings by current-modulating cathodic arc evaporation.Surf. Coat. Technol. 2001, 137, 31–37. [CrossRef]
46. Lin, J.; Sproul, W.D.; Moore, J.J.; Wu, Z.L.; Lee, S.L. Effect of negative substrate bias voltage on the structureand properties of CrN films deposited by modulated pulsed power (MPP) magnetron sputtering. J. Phys. DAppl. Phys. 2011, 44, 425305. [CrossRef]
© 2020 by the authors. Licensee MDPI, Basel, Switzerland. This article is an open accessarticle distributed under the terms and conditions of the Creative Commons Attribution(CC BY) license (http://creativecommons.org/licenses/by/4.0/).


![Comparison of the PVD coatings deposited onto plasma nitrited … · PVD coatings have also been used for selected hot-working processes [7,8]. PVD TiN/(Ti,Al)N, CrN and TiN coatings](https://img.pdfslide.us/doc/110x75/5f0d269e7e708231d438ecfd/comparison-of-the-pvd-coatings-deposited-onto-plasma-nitrited-pvd-coatings-have.jpg)