Embed Size (px)
Citation preview

Structure and Dynamics of Brachypodium Primary Cell WallPolysaccharides from Two-Dimensional 13C Solid-State NuclearMagnetic Resonance SpectroscopyTuo Wang,† Andre Salazar,‡ Olga A. Zabotina,‡ and Mei Hong*,†
†Department of Chemistry and Ames Laboratory and ‡Department of Biochemistry, Biophysics and Molecular Biology, Iowa StateUniversity, Ames, Iowa 50011, United States
*S Supporting Information
ABSTRACT: The polysaccharide structure and dynamics in the primary cell wall of the model grass Brachypodium distachyonare investigated for the first time using solid-state nuclear magnetic resonance (NMR). While both grass and non-grass cell wallscontain cellulose as the main structural scaffold, the former contains xylan with arabinose and glucuronic acid substitutions as themain hemicellulose, with a small amount of xyloglucan (XyG) and pectins, while the latter contains XyG as the mainhemicellulose and significant amounts of pectins. We labeled the Brachypodium cell wall with 13C to allow two-dimensional (2D)13C correlation NMR experiments under magic-angle spinning. Well-resolved 2D spectra are obtained in which the 13C signals ofcellulose, glucuronoarabinoxylan (GAX), and other matrix polysaccharides can be assigned. The assigned 13C chemical shiftsindicate that there are a large number of arabinose and xylose linkages in the wall, and GAX is significantly branched at thedevelopmental stage of 2 weeks. 2D 13C−13C correlation spectra measured with long spin diffusion mixing times indicate that thebranched GAX approaches cellulose microfibrils on the nanometer scale, contrary to the conventional model in which onlyunbranched GAX can bind cellulose. The GAX chains are highly dynamic, with average order parameters of ∼0.4. Biexponential13C T1 and
1H T1ρ relaxation indicates that there are two dynamically distinct domains in GAX: the more rigid domain may beresponsible for cross-linking cellulose microfibrils, while the more mobile domain may fill the interfibrillar space. This dynamicheterogeneity is more pronounced than that of the non-grass hemicellulose, XyG, suggesting that GAX adopts the mixedcharacteristics of XyG and pectins. Moderate differences in cellulose rigidity are observed between the Brachypodium andArabidopsis cell walls, suggesting different effects of the matrix polysaccharides on cellulose. These data provide the firstmolecular-level structural information about the three-dimensional organization of the polysaccharides in the grass primary wall.
Grasses have long contributed to human society as cerealcrops for human diets and forage for animals. Recently,
growing interest has been directed toward developing grasses asa major source of alternative, renewable energy. Thepolysaccharides stored in grass cell walls (CWs) can beextracted and converted into biofuels;1,2 thus, an understandingof the polysaccharide structures in the CWs is important forefficient degradation of this biomass.3 Brachypodium distachyonhas been adopted as a model plant for structural and functionalgenomics of grasses, because it has a short lifecycle and a smallgenome, is self-pollinating, and is representative of manytemperate grasses.4 Thus, a detailed understanding of the
molecular structure and composition of the Brachypodium CWsin their native state is of significant interest.The primary CW (PCW) of monocotyledonous (monocot)
plants such as grasses differs from the PCW of dicotyledonous(dicot) plants as represented by Arabidopsis thaliana. In dicotPCWs, the main hemicellulose is xyloglucan (XyG), and themain pectins are linear homogalacturonan (HGA) andbranched rhamnogalacturonan (RG), which contains arabinan,galactan (Gal), and arabinogalactan (AG) side chains.5,6 In
Received: February 23, 2014Revised: April 4, 2014Published: April 10, 2014
Article
pubs.acs.org/biochemistry
© 2014 American Chemical Society 2840 dx.doi.org/10.1021/bi500231b | Biochemistry 2014, 53, 2840−2854
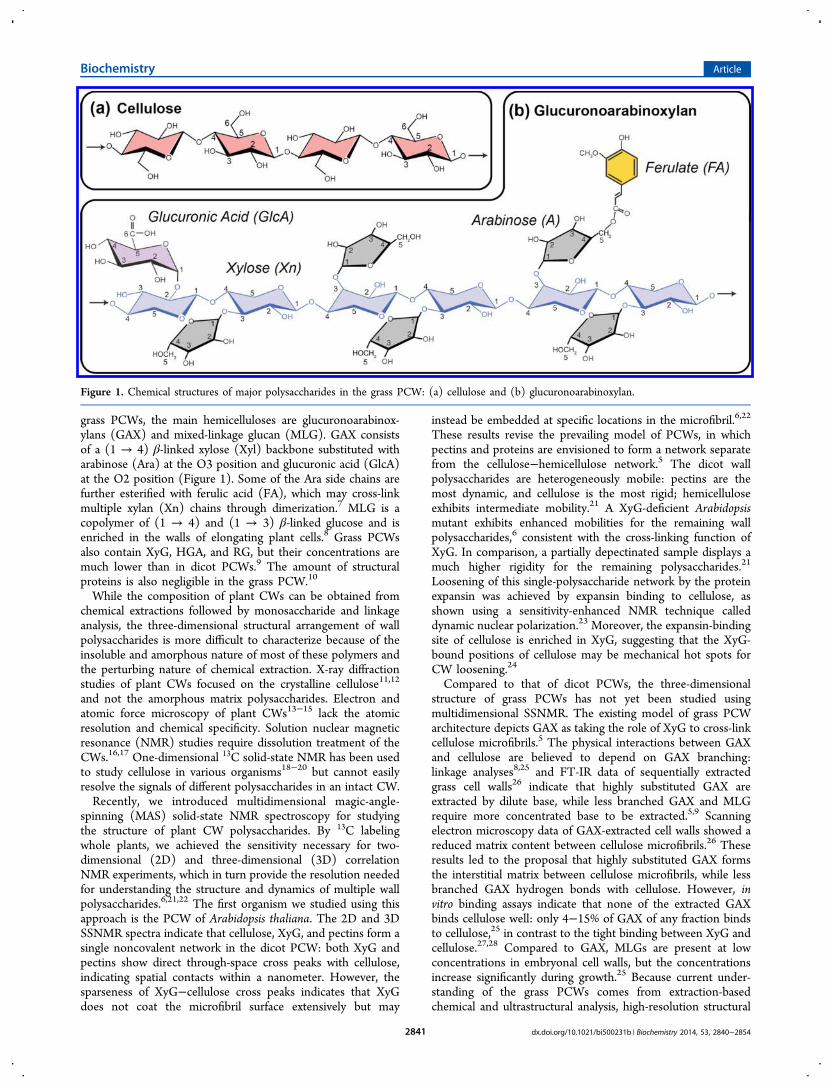
grass PCWs, the main hemicelluloses are glucuronoarabinox-ylans (GAX) and mixed-linkage glucan (MLG). GAX consistsof a (1 → 4) β-linked xylose (Xyl) backbone substituted witharabinose (Ara) at the O3 position and glucuronic acid (GlcA)at the O2 position (Figure 1). Some of the Ara side chains arefurther esterified with ferulic acid (FA), which may cross-linkmultiple xylan (Xn) chains through dimerization.7 MLG is acopolymer of (1 → 4) and (1 → 3) β-linked glucose and isenriched in the walls of elongating plant cells.8 Grass PCWsalso contain XyG, HGA, and RG, but their concentrations aremuch lower than in dicot PCWs.9 The amount of structuralproteins is also negligible in the grass PCW.10
While the composition of plant CWs can be obtained fromchemical extractions followed by monosaccharide and linkageanalysis, the three-dimensional structural arrangement of wallpolysaccharides is more difficult to characterize because of theinsoluble and amorphous nature of most of these polymers andthe perturbing nature of chemical extraction. X-ray diffractionstudies of plant CWs focused on the crystalline cellulose11,12
and not the amorphous matrix polysaccharides. Electron andatomic force microscopy of plant CWs13−15 lack the atomicresolution and chemical specificity. Solution nuclear magneticresonance (NMR) studies require dissolution treatment of theCWs.16,17 One-dimensional 13C solid-state NMR has been usedto study cellulose in various organisms18−20 but cannot easilyresolve the signals of different polysaccharides in an intact CW.Recently, we introduced multidimensional magic-angle-
spinning (MAS) solid-state NMR spectroscopy for studyingthe structure of plant CW polysaccharides. By 13C labelingwhole plants, we achieved the sensitivity necessary for two-dimensional (2D) and three-dimensional (3D) correlationNMR experiments, which in turn provide the resolution neededfor understanding the structure and dynamics of multiple wallpolysaccharides.6,21,22 The first organism we studied using thisapproach is the PCW of Arabidopsis thaliana. The 2D and 3DSSNMR spectra indicate that cellulose, XyG, and pectins form asingle noncovalent network in the dicot PCW: both XyG andpectins show direct through-space cross peaks with cellulose,indicating spatial contacts within a nanometer. However, thesparseness of XyG−cellulose cross peaks indicates that XyGdoes not coat the microfibril surface extensively but may
instead be embedded at specific locations in the microfibril.6,22
These results revise the prevailing model of PCWs, in whichpectins and proteins are envisioned to form a network separatefrom the cellulose−hemicellulose network.5 The dicot wallpolysaccharides are heterogeneously mobile: pectins are themost dynamic, and cellulose is the most rigid; hemicelluloseexhibits intermediate mobility.21 A XyG-deficient Arabidopsismutant exhibits enhanced mobilities for the remaining wallpolysaccharides,6 consistent with the cross-linking function ofXyG. In comparison, a partially depectinated sample displays amuch higher rigidity for the remaining polysaccharides.21
Loosening of this single-polysaccharide network by the proteinexpansin was achieved by expansin binding to cellulose, asshown using a sensitivity-enhanced NMR technique calleddynamic nuclear polarization.23 Moreover, the expansin-bindingsite of cellulose is enriched in XyG, suggesting that the XyG-bound positions of cellulose may be mechanical hot spots forCW loosening.24
Compared to that of dicot PCWs, the three-dimensionalstructure of grass PCWs has not yet been studied usingmultidimensional SSNMR. The existing model of grass PCWarchitecture depicts GAX as taking the role of XyG to cross-linkcellulose microfibrils.5 The physical interactions between GAXand cellulose are believed to depend on GAX branching:linkage analyses8,25 and FT-IR data of sequentially extractedgrass cell walls26 indicate that highly substituted GAX areextracted by dilute base, while less branched GAX and MLGrequire more concentrated base to be extracted.5,9 Scanningelectron microscopy data of GAX-extracted cell walls showed areduced matrix content between cellulose microfibrils.26 Theseresults led to the proposal that highly substituted GAX formsthe interstitial matrix between cellulose microfibrils, while lessbranched GAX hydrogen bonds with cellulose. However, invitro binding assays indicate that none of the extracted GAXbinds cellulose well: only 4−15% of GAX of any fraction bindsto cellulose,25 in contrast to the tight binding between XyG andcellulose.27,28 Compared to GAX, MLGs are present at lowconcentrations in embryonal cell walls, but the concentrationsincrease significantly during growth.25 Because current under-standing of the grass PCWs comes from extraction-basedchemical and ultrastructural analysis, high-resolution structural
Figure 1. Chemical structures of major polysaccharides in the grass PCW: (a) cellulose and (b) glucuronoarabinoxylan.
Biochemistry Article
dx.doi.org/10.1021/bi500231b | Biochemistry 2014, 53, 2840−28542841
studies by SSNMR under nonperturbing conditions willprovide valuable and unique information.In this study, we report the first comprehensive assignment
of the 13C chemical shifts of Brachypodium primary wallpolysaccharides and provide evidence of GAX−cellulose spatialcontact in 2D 13C−13C correlation spectra. We also investigatedthe mobilities of wall polysaccharides and show that GAX haslarger-amplitude motions than its counterpart, XyG, in thedicot PCW. These results shed light on the 3D architecture ofthe grass PCW and establish a basis for future studies of grasscell walls.
■ EXPERIMENTAL PROCEDURESPlant Material. Uniformly 13C-labeled B. distachyon PCW
samples were prepared using a procedure similar to thatreported previously.6 Briefly, plants were germinated and grownin the dark in a liquid containing 13C-labeled glucose (5 g/L) asthe only carbon source. Growth in the dark preventsphotosynthesis and the consequent dilution of 13C labels byunlabeled substrates produced from atmospheric CO2. Two-week-old seedlings were harvested, and roots and leaves wereseparated and powdered in liquid nitrogen, mixed with 80% (v/v) ethanol, heated at 80 °C for 1 h, and cooled to roomtemperature. PCWs were pelleted by centrifugation at 12000gfor 20 min. The PCW material was never dried throughout thepreparation. The wet pellet was washed with a chloroform/methanol (1:1) solution to remove nonpolar compounds andsuspended in 50 mM sodium acetate buffer (pH 5.2)containing 1.5% SDS and 5 mM sodium metabisulfate toremove most intracellular proteins and low-molecular weightcompounds. Starch was removed using α-amylase. Theseprocedures are expected to have a minimal impact on thewall polysaccharides and structural proteins because of theirlow solubility and their interaction via hydrogen bonding orcovalent cross-linking. Two samples were prepared from theroots and leaves of the plant. Approximately 76 mg of hydratedleaf CW and 58 mg of hydrated root CW were packed into two4 mm MAS rotors for SSNMR experiments. A previouslyprepared 13C-labeled Arabidopsis PCW sample6 was used tocompare with the Brachypodium PCW samples.Solid-State NMR Spectroscopy. All 13C NMR spectra
were measured on a 600 MHz Avance II SSNMR spectrometerat 14.1 T using a 4 mm MAS probe. Typical radiofrequency (rf)field strengths were 62−71 kHz for 1H and 50 kHz for 13C. 13Cchemical shifts were externally referenced to the Met Cε peak(14.0 ppm) in the model peptide formyl-Met-Leu-Phe-OH29,30
on the TMS scale.One-dimensional (1D) 13C MAS spectra were measured with
either 1H−13C cross-polarization (CP) or 13C direct polar-ization (DP) to create the initial transverse magnetization. CPspectra preferentially detect rigid molecules such as cellulose,while DP spectra with a short recycle delay (2 s) preferentiallydetect the signals of mobile polysaccharides. Quantitativespectra were measured using a DP experiment with a recycledelay of 15 s.Several 2D 13C−13C correlation experiments were conducted
to resolve and assign the 13C chemical shifts of wallpolysaccharides. The 2D J-INADEQUATE experiment31,32
correlates the double-quantum (DQ) or sum chemical shiftsof two directly bonded 13C spins with the single-quantum (SQ)chemical shifts of each 13C. The experiment used DP, 13C−13CJ coupling, and a recycle delay of 2 s to preferentially detect thesignals of mobile matrix polysaccharides. The experiment was
conducted at 293 K under 12 kHz MAS. A double-quantum-filtered (DQF) 2D 13C−13C correlation spectrum complementsthe J-INADEQUATE experiment by detecting one-bond crosspeaks of rigid polysaccharides. This experiment used SPC5-recoupled33 13C−13C dipolar coupling for polarization transferand was conducted at 253 K under 7 kHz MAS. To probeintermolecular contacts, we measured 2D 1H-driven 13C spindiffusion (PDSD) spectra22,34 with mixing times of 30 ms to 3.0s. These PDSD experiments used either CP (at 253 K) or DP(at 293 K) to generate the initial 13C magnetization. A PDSDexperiment with a short CP contact time of 35 μs wasconducted at 293 K to selectively detect only the cellulosesignals in the indirect dimension, whose cross peaks with GAXin the direct dimension can thus be better resolved in the 2Dspectra.Motional amplitudes were measured using the dipolar-
doubled 2D 13C−1H dipolar chemical shift (DIPSHIFT)correlation experiment35,36 under 7 kHz MAS. 1H homonucleardecoupling was achieved using the FSLG sequence,37 which hasa theoretical scaling factor of 0.577. The rigid-limit one-bondC−H dipolar coupling, after doubling and scaling, was found tobe 26.2 kHz on the crystalline model peptide formyl-MLF-OH.29,38 The ratios between the measured couplings of thepolysaccharides and this rigid-limit value gave the orderparameters.
13C T1 relaxation times, which reveal nanosecond motions,were measured using the inversion recovery sequence. Theinitial 13C magnetization was excited using a single pulse, and along recycle delay of 15 s was used to obtain quantitativespectra. 13C-detected 1H T1ρ relaxation times, which reflectmicrosecond motions, were measured using a Lee−Goldburgspin-lock sequence39−41 in which 1H spin diffusion wassuppressed during the spin-lock period and the CP period toobtain site-specific relaxation times of the protons that aredirectly bonded to a 13C spin. The tilted effective 1H spin-lockfield was 50 kHz. Most relaxation curves were fit with a double-exponential function (Tables S1 and S2 of the SupportingInformation).
Monosaccharide Composition Analysis. Approximately30 mg of PCWs from the Brachypodium leaves and roots washydrolyzed in 2 M trifluoroacetic acid for 2 h at 121 °C, afterwhich the acid was removed when the sample was dried underair at 50 °C. The dry material was solubilized in 100 μL ofddH2O, and the monosaccharide composition was determinedusing high-performance anion-exchange chromatography.The cellulose content was estimated by treating 10 mg of
CW material with acetic−nitric reagent (80% acetic acid andconcentrated nitric acid, 10:1) for 30 min at 100 °C.24
Undigested pellets were washed several times with deionizedwater and then acetone, air-dried, and weighed.
Glycosyl Linkage Analysis. The PCW samples werepermethylated, depolymerized, reduced, and acetylated. Theresulting partially methylated alditol acetates (PMAAs) wereanalyzed by gas chromatography and mass spectrometry (GC−MS) as previously described.42 Briefly, a 1−2 mg sample wassuspended in DMSO, permethylated by the addition ofHakomori base while being purged with nitrogen gas, andmixed for 7 h. Iodomethane was then added, and the samplewas mixed overnight. The sample then passed through a C18SEP-PAK column, dried, and reduced with lithium borodeu-teride in THF, which was neutralized and evaporated later. Thesample was then treated with NaOH and methyl iodide in dryDMSO.43 The sample was subjected to 4 M NaOH for 15 min;
Biochemistry Article
dx.doi.org/10.1021/bi500231b | Biochemistry 2014, 53, 2840−28542842
methyl iodide was added, and the mixture was left for 40 min toensure complete methylation. The permethylated material washydrolyzed using 2 M TFA, reduced with NaBD4, andacetylated using acetic anhydride and TFA. The resultingPMAAs were analyzed by GC−MS. Separation was performedon a 30 m Restek 2330 or Supelco 2380 bonded phase fusedsilica capillary column.
■ RESULTSBrachypodium Cell Wall Composition from Linkage
Analyses and Quantitative 13C NMR. We obtained 13C-labeled Brachypodium PCW by growing the plant for 2 weeks inthe dark with 13C-labeled glucose as the only carbon source,harvesting the roots and leaves, and preparing the insolubleCW material as described previously6 except without drying.This cell wall preparation procedure was mild, withoutinvolving strong acids or bases. Previous comparison ofArabidopsis PCW samples obtained from plants grown inlight without extraction versus plants grown in the dark withmild treatment showed similar polysaccharide 13C intensities,22
even though the Arabidopsis PCW has more pectins, which canbe extracted more easily.At 2 weeks, the Brachypodium PCW is expected to contain
mainly cellulose and GAX. Linkage analysis (Table 1) shows
that 4-Xyl, 2,4-Xyl, and 3,4-Xyl account for 19% of all linkages.Xyl O3 is 4 times more substituted than O2, indicating that Arais predominantly linked to Xyl O3 in the grass PCW, and Aradominates GlcA in the xylan side chains. The Xyl concentrationfrom the linkage analysis is lower than that from the sugarcomposition analysis (Table 2). This discrepancy may resultfrom the incomplete accessibility of GAX to methylation
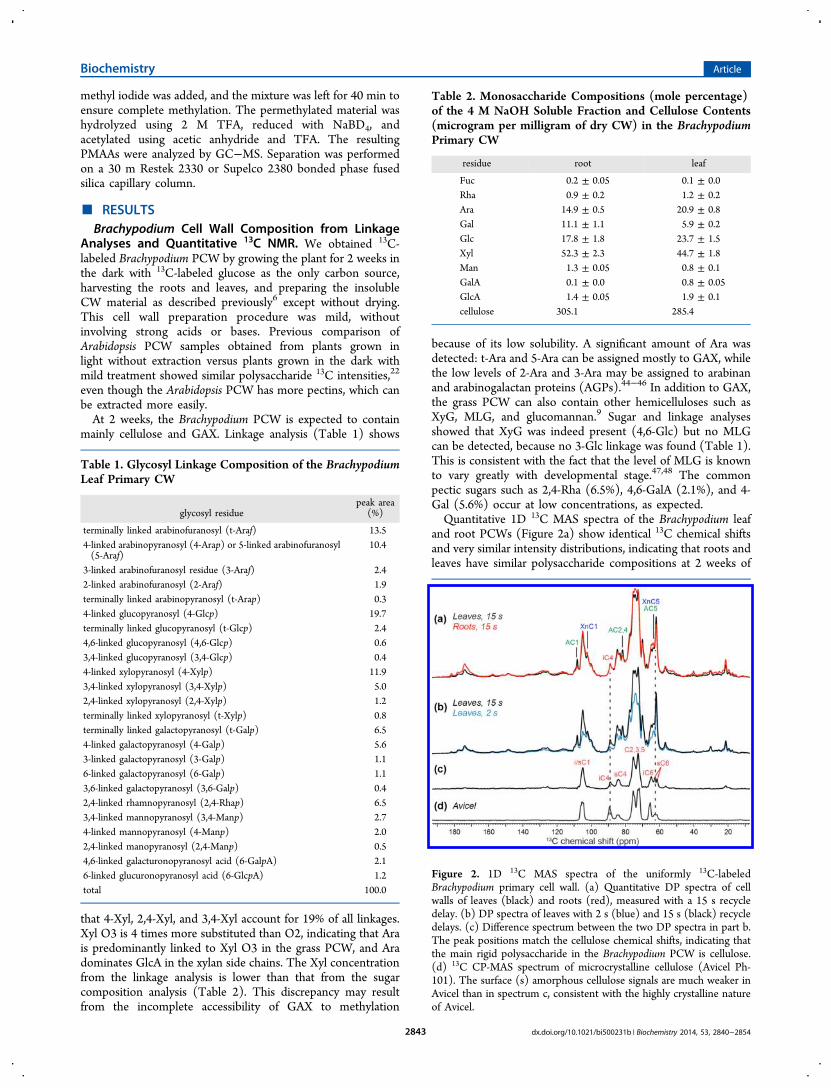
because of its low solubility. A significant amount of Ara wasdetected: t-Ara and 5-Ara can be assigned mostly to GAX, whilethe low levels of 2-Ara and 3-Ara may be assigned to arabinanand arabinogalactan proteins (AGPs).44−46 In addition to GAX,the grass PCW can also contain other hemicelluloses such asXyG, MLG, and glucomannan.9 Sugar and linkage analysesshowed that XyG was indeed present (4,6-Glc) but no MLGcan be detected, because no 3-Glc linkage was found (Table 1).This is consistent with the fact that the level of MLG is knownto vary greatly with developmental stage.47,48 The commonpectic sugars such as 2,4-Rha (6.5%), 4,6-GalA (2.1%), and 4-Gal (5.6%) occur at low concentrations, as expected.Quantitative 1D 13C MAS spectra of the Brachypodium leaf
and root PCWs (Figure 2a) show identical 13C chemical shiftsand very similar intensity distributions, indicating that roots andleaves have similar polysaccharide compositions at 2 weeks of
Table 1. Glycosyl Linkage Composition of the BrachypodiumLeaf Primary CW
glycosyl residuepeak area
(%)
terminally linked arabinofuranosyl (t-Araf) 13.54-linked arabinopyranosyl (4-Arap) or 5-linked arabinofuranosyl(5-Araf)
10.4
3-linked arabinofuranosyl residue (3-Araf) 2.42-linked arabinofuranosyl (2-Araf) 1.9terminally linked arabinopyranosyl (t-Arap) 0.34-linked glucopyranosyl (4-Glcp) 19.7terminally linked glucopyranosyl (t-Glcp) 2.44,6-linked glucopyranosyl (4,6-Glcp) 0.63,4-linked glucopyranosyl (3,4-Glcp) 0.44-linked xylopyranosyl (4-Xylp) 11.93,4-linked xylopyranosyl (3,4-Xylp) 5.02,4-linked xylopyranosyl (2,4-Xylp) 1.2terminally linked xylopyranosyl (t-Xylp) 0.8terminally linked galactopyranosyl (t-Galp) 6.54-linked galactopyranosyl (4-Galp) 5.63-linked galactopyranosyl (3-Galp) 1.16-linked galactopyranosyl (6-Galp) 1.13,6-linked galactopyranosyl (3,6-Galp) 0.42,4-linked rhamnopyranosyl (2,4-Rhap) 6.53,4-linked mannopyranosyl (3,4-Manp) 2.74-linked mannopyranosyl (4-Manp) 2.02,4-linked manopyranosyl (2,4-Manp) 0.54,6-linked galacturonopyranosyl acid (6-GalpA) 2.16-linked glucuronopyranosyl acid (6-GlcpA) 1.2total 100.0
Table 2. Monosaccharide Compositions (mole percentage)of the 4 M NaOH Soluble Fraction and Cellulose Contents(microgram per milligram of dry CW) in the BrachypodiumPrimary CW
residue root leaf
Fuc 0.2 ± 0.05 0.1 ± 0.0Rha 0.9 ± 0.2 1.2 ± 0.2Ara 14.9 ± 0.5 20.9 ± 0.8Gal 11.1 ± 1.1 5.9 ± 0.2Glc 17.8 ± 1.8 23.7 ± 1.5Xyl 52.3 ± 2.3 44.7 ± 1.8Man 1.3 ± 0.05 0.8 ± 0.1GalA 0.1 ± 0.0 0.8 ± 0.05GlcA 1.4 ± 0.05 1.9 ± 0.1cellulose 305.1 285.4
Figure 2. 1D 13C MAS spectra of the uniformly 13C-labeledBrachypodium primary cell wall. (a) Quantitative DP spectra of cellwalls of leaves (black) and roots (red), measured with a 15 s recycledelay. (b) DP spectra of leaves with 2 s (blue) and 15 s (black) recycledelays. (c) Difference spectrum between the two DP spectra in part b.The peak positions match the cellulose chemical shifts, indicating thatthe main rigid polysaccharide in the Brachypodium PCW is cellulose.(d) 13C CP-MAS spectrum of microcrystalline cellulose (Avicel Ph-101). The surface (s) amorphous cellulose signals are much weaker inAvicel than in spectrum c, consistent with the highly crystalline natureof Avicel.
Biochemistry Article
dx.doi.org/10.1021/bi500231b | Biochemistry 2014, 53, 2840−28542843

age. Subtle differences in the relative intensities of Ara and Xnpeaks are found between the two tissues: the leaf sample hasslightly higher Ara intensities (108 ppm for AC1 and 82 ppmfor AC2/C4) but lower Xn intensities (102 ppm for XnC1),indicating that the cell wall of leaves contains slightly moresubstituted GAX than the cell wall of leavess. The 13C CPspectra (Figure S1 of the Supporting Information) are also verysimilar between the two samples, indicating that thepolysaccharides have similar mobilities in the two tissues.When 1D 13C DP spectra were measured using a short recycledelay to preferentially detect the mobile polysaccharides, thespectrum differed from the quantitative 1D spectrum by
precisely the chemical shifts of crystalline and amorphouscellulose (Figure 2b,c),18 as verified by comparison with the 13Cspectrum of Avicel cellulose (Figure 2d). However, the grassPCW spectrum has much higher intensities of the surfaceamorphous cellulose than the Avicel spectrum, consistent withthe microcrystalline nature of Avicel. Overall, the main rigidpolysaccharide in the Brachypodium PCW is cellulose, whilehemicelluloses and pectins are mobile.To investigate how the PCW compositions differ between
Brachypodium and Arabidopsis, we compared the quantitative1D 13C spectra of the two plants (Figure 3). The Brachypodiumsample shows protein (10−50 and 170−180 ppm) and pectin
Figure 3. 1D 13C quantitative MAS spectra of Brachypodium (black) and Arabidopsis (red) primary cell walls. (a) Spectra plotted with the same totalintegrated intensities. (b) Spectra plotted to have the same iC4 peak intensity at 89 ppm. The Brachypodium spectrum shows higher xylose (Xn),arabinose (A), and ferulic acid (FA) intensities and lower protein and pectin intensities. Representative pectin signals are the 101 ppm peak ofgalacturonic acid (GalA) and rhamnose (R) and the 53.5 ppm peak of methyl ester.
Figure 4. 2D 13C J-INADEQUATE spectrum of the Brachypodium PCW, measured at 293 K under 12 kHz MAS. (a) Polysaccharide region of the2D spectrum. (b) Selected 1D cross sections along the single-quantum (ω2) dimension. Peaks are assigned using the abbreviations shown, andsuperscripts distinguish different subtypes of the same monosaccharide. For example, eight sets of arabinose C1−C2 cross peaks are identified andindicated by superscripts a−h.
Biochemistry Article
dx.doi.org/10.1021/bi500231b | Biochemistry 2014, 53, 2840−28542844

intensities lower than those of the Arabidopsis sample, bothrelative to the total spectral intensities and relative to the 89ppm iC4 peak. For example, the 101 ppm peak of GalA andRha C1 and the 80 ppm peak of GalA C4 and Rha C2 areweaker in the Brachypodium spectrum. The 53.5 ppm pectinmethyl ester peak in the Arabidopsis spectrum is replaced by a56 ppm ferulic acid (FA) methyl ester peak in theBrachypodium spectrum. However, the Brachypodium PCWhas stronger Ara C1 (108 ppm) and Xn C1 (102 ppm) peaks,consistent with the fact that GAX primarily exists in grass.
13C Resonance Assignments of Brachypodium CellWall Polysaccharides by 2D Correlation NMR. To fullyresolve the signals of all polysaccharides, we measured a 2D J-INADEQUATE spectrum31,49 at ambient temperature underconditions that favor the observation of the signals of mobilepolysaccharides while disfavoring cellulose.18 The resulting 2Dspectrum (Figure 4) shows narrow line widths of 0.4−0.9 ppm,indicating the highly dynamic nature of the matrix poly-saccharides. Several regions of the 2D spectrum are of particularinterest. First, the regions with DQ chemical shifts of 132−156and 172−182 ppm contain the Xyl peaks and are morecrowded than the corresponding region of the Arabidopsisspectrum (Figure 5) because of the presence of both GAX andXyG in the grass PCW. Five different sets of Xn peaks areidentified and denoted a−e. Types a and b are characterized bya C2 chemical shift of 77−78 ppm, which can be assigned toGlcA O2-substituted Xyl. This assignment is supported by thefact that the Xna and Xnb peaks have intensities similar to thoseof the GlcA peaks (Figure 4a). Type c was assigned to terminalXyl based on the C4 chemical shift of 70 ppm. We assigned Xnd
to Ara O2-substituted Xyl and Xne to unbranched xylan based
on literature chemical shifts.50,51 These Xn peaks are absent inthe Arabidopsis spectrum.10 In comparison, terminal Xyl signalsthat originate from XyG are stronger in the Arabidopsisspectrum. These α-Xyl signals of XyG differ from the β-Xylsignals of GAX because of the different configurations of theanomeric carbon.Eight sets of Ara C1−C2 cross peaks (denoted a−h) are
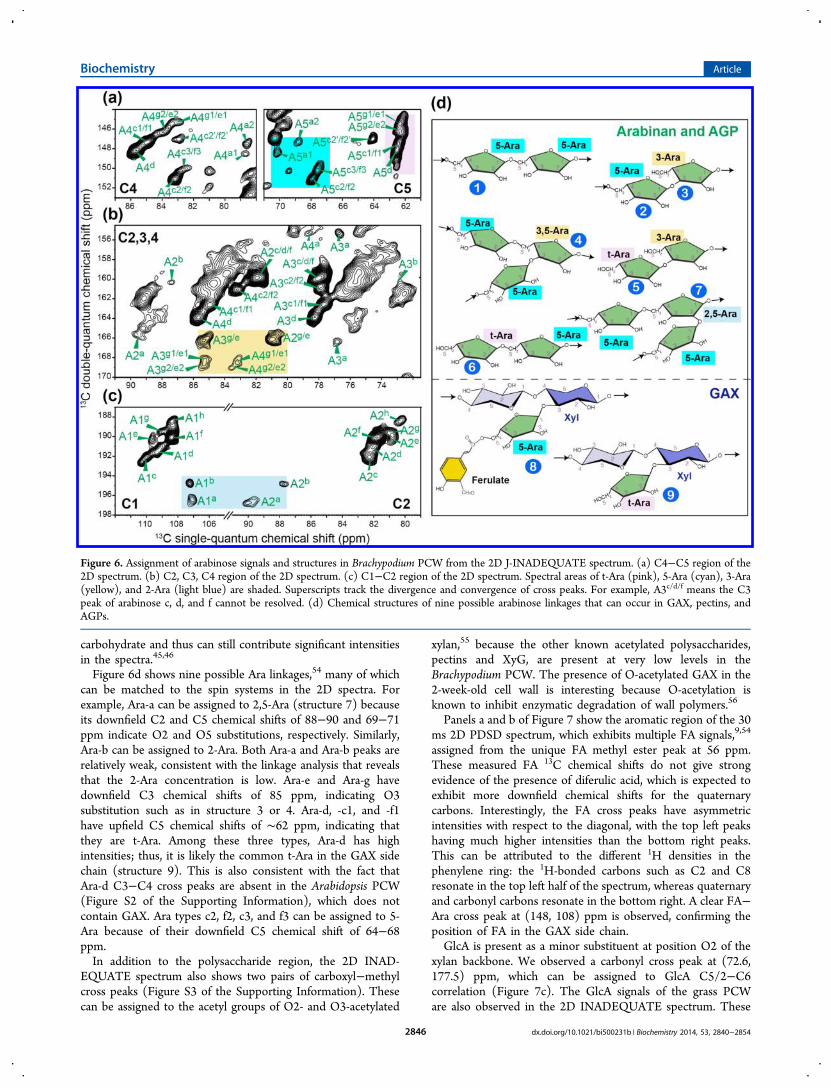
resolved in the 2D J-INADEQUATE spectrum based on thecharacteristic Ara C1 chemical shifts of 107−110 ppm21,52
(Figure 6), while nine sets of Ara C4−C5 cross peaks can beresolved. Unfortunately, the C2−C3 and C3−C4 cross peaks ofAra partially overlap (Figure 6b) and cannot be assignedunambiguously. The successive levels of ambiguity in the C2−C3 and C3−C4 assignments are denoted by symbols such asA2c/d/f and A3c2/f2, respectively. For example, while the C2chemical shifts of Ara-c, -d, and -f are resolved in the C1−C2region, they become overlapped in the C2−C3 region, givingrise to ambiguous A2c/d/f and A3c/d/f peaks. Subsequently, theAra-c and Ara-f C3−C4 peaks acquire another 2-foldassignment ambiguity, as denoted by symbols such as A3c1/f1
and A3c2/f2. In the C4−C5 region, the A4c2/f2 chemical shiftfurther splits into A4c2/f2 and A4c2′/f2′. These assignmentambiguities create 17 possible combinations of Ara spin systems(Table 3), but only nine different Ara structures should exist inthe sample, because only nine sets of C4−C5 cross peaks areresolved in the 2D spectrum. The Ara structural diversity in thegrass PCW is understandable, because Ara exists not only inGAX side chains9 but also in pectins and AGPs. The GAX sidechain Ara can be substituted with FA, while the pectic arabinanscan have linkages at O5, O2, and O3.9,53 Finally, while theprotein concentration in the grass CW is low, AGPs are ∼90%
Figure 5. Assignment of hemicelluloses from the 2D J-INADEQUATE spectra of (a) Brachypodium and (b) Arabidopsis PCWs. Brachypodium showsnumerous β-D-Xyl (Xn) signals and few α-D-Xyl (x) signals from XyG.
Biochemistry Article
dx.doi.org/10.1021/bi500231b | Biochemistry 2014, 53, 2840−28542845
carbohydrate and thus can still contribute significant intensitiesin the spectra.45,46
Figure 6d shows nine possible Ara linkages,54 many of whichcan be matched to the spin systems in the 2D spectra. Forexample, Ara-a can be assigned to 2,5-Ara (structure 7) becauseits downfield C2 and C5 chemical shifts of 88−90 and 69−71ppm indicate O2 and O5 substitutions, respectively. Similarly,Ara-b can be assigned to 2-Ara. Both Ara-a and Ara-b peaks arerelatively weak, consistent with the linkage analysis that revealsthat the 2-Ara concentration is low. Ara-e and Ara-g havedownfield C3 chemical shifts of 85 ppm, indicating O3substitution such as in structure 3 or 4. Ara-d, -c1, and -f1have upfield C5 chemical shifts of ∼62 ppm, indicating thatthey are t-Ara. Among these three types, Ara-d has highintensities; thus, it is likely the common t-Ara in the GAX sidechain (structure 9). This is also consistent with the fact thatAra-d C3−C4 cross peaks are absent in the Arabidopsis PCW(Figure S2 of the Supporting Information), which does notcontain GAX. Ara types c2, f2, c3, and f3 can be assigned to 5-Ara because of their downfield C5 chemical shift of 64−68ppm.In addition to the polysaccharide region, the 2D INAD-
EQUATE spectrum also shows two pairs of carboxyl−methylcross peaks (Figure S3 of the Supporting Information). Thesecan be assigned to the acetyl groups of O2- and O3-acetylated
xylan,55 because the other known acetylated polysaccharides,pectins and XyG, are present at very low levels in theBrachypodium PCW. The presence of O-acetylated GAX in the2-week-old cell wall is interesting because O-acetylation isknown to inhibit enzymatic degradation of wall polymers.56
Panels a and b of Figure 7 show the aromatic region of the 30ms 2D PDSD spectrum, which exhibits multiple FA signals,9,54
assigned from the unique FA methyl ester peak at 56 ppm.These measured FA 13C chemical shifts do not give strongevidence of the presence of diferulic acid, which is expected toexhibit more downfield chemical shifts for the quaternarycarbons. Interestingly, the FA cross peaks have asymmetricintensities with respect to the diagonal, with the top left peakshaving much higher intensities than the bottom right peaks.This can be attributed to the different 1H densities in thephenylene ring: the 1H-bonded carbons such as C2 and C8resonate in the top left half of the spectrum, whereas quaternaryand carbonyl carbons resonate in the bottom right. A clear FA−Ara cross peak at (148, 108) ppm is observed, confirming theposition of FA in the GAX side chain.GlcA is present as a minor substituent at position O2 of the
xylan backbone. We observed a carbonyl cross peak at (72.6,177.5) ppm, which can be assigned to GlcA C5/2−C6correlation (Figure 7c). The GlcA signals of the grass PCWare also observed in the 2D INADEQUATE spectrum. These
Figure 6. Assignment of arabinose signals and structures in Brachypodium PCW from the 2D J-INADEQUATE spectrum. (a) C4−C5 region of the2D spectrum. (b) C2, C3, C4 region of the 2D spectrum. (c) C1−C2 region of the 2D spectrum. Spectral areas of t-Ara (pink), 5-Ara (cyan), 3-Ara(yellow), and 2-Ara (light blue) are shaded. Superscripts track the divergence and convergence of cross peaks. For example, A3c/d/f means the C3peak of arabinose c, d, and f cannot be resolved. (d) Chemical structures of nine possible arabinose linkages that can occur in GAX, pectins, andAGPs.
Biochemistry Article
dx.doi.org/10.1021/bi500231b | Biochemistry 2014, 53, 2840−28542846

GlcA peaks are readily distinguished from the 171 and 175 ppmGalA C6 peaks of the Arabidopsis PCW, which result fromCOOCH3 and COOH.22 The lack of these GalA signals in theBrachypodium sample is consistent with the absence of the 53.5ppm methyl ester peak and indicates the low abundance ofpectins in the grass PCWs.In addition to GAX, the 2D J-INADEQUATE spectrum also
resolved six different cellulose spin systems (Figure S4 of theSupporting Information). Cellulose is more rigid than GAX, asshown by the fact that its intensities are higher than those ofthe Xn, GlcA, and Ara signals in the 2D 13C DQF correlationspectrum (Figure S5 of the Supporting Information).Compared to the Brachypodium spectrum, the Arabidopsis 2DDQF spectrum has much lower Ara and Xn intensities,consistent with a lack of GAX in the dicot PCW. On the other
hand, the Gal C1−C2 cross peak at (101, 69) ppm is weaker inthe Brachypodium spectrum, confirming that pectin concen-trations are lower in the grass PCW.None of these 2D spectra showed any signal near (86, 69)
ppm, which are the expected frequencies of the C3−C4 crosspeak for 3-Glc.51,57−59 Thus, MLG is below the detection limitin the 2-week-old grass PCW.
GAX−Cellulose Intermolecular Contact from 2D 13CPDSD Spectra. To determine if cellulose and GAX havespatial contact on the nanometer scale, we measured 2D13C−13C PDSD spectra with mixing times from 30 ms to 3.0 s(Figure 8 and Figure S5 of the Supporting Information). At 30ms, intraresidue cross peaks such as the Xn C1 correlations at102 ppm and the Ara C1 correlations at 108 ppm are observed.When the mixing time increased to 1.5 s, multiple
Table 3. Assigned 13C Chemical Shifts of Brachypodium Primary CW Polysaccharides from 2D J-INADEQUATE Spectraa
site assignment C1 C2 C3 C4 C5 C6 notes
ia 105.0 72.9 75.8 89.2 72.9 65.2ib 105.0 72.5 75.6 88.8 72.5 65.1ic (w) 105.0 72.5 75.4 88.1 76.0 NDsa 105.0 72.5 75.6 84.7 75.7 62.9sb 105.0 72.5 75.6 84.7 75.9 62.0sc 105.0 72.5 75.5 83.9 74.0 61.8 overlap with Glc of XyGGlcA (w) GlcA in GAX 98.6 72.4 78.3 ND 72.6 177.5Xna (w) 2,4-Xyl with GlcA
attached to O2102.4 78.6 ND ND ND These peaks are absent in Arabidopsis CW.
Xnb (w) 102.2 77.6 73.7 77.4 63.8 C3 chemical shift from Vignon et al.64
Xnc t-Xyl of GAX 102.4 73.9 76.7 70.2 66.0 These peaks are absent in Arabidopsis CW. Consistent withHollmann et al.50
Xnd 3,4-Xyl with Ara O3 102.4 73.9 76.7 74.6 63.6 These peaks are absent in Arabidopsis CW. Consistent withRoubroeks et al.57
Xne 4-Xyl of GAX 102.4 73.7 75.0 77.4 63.8 These peaks overlap with other Xn peaks and were obtained fromRoubroeks et al.57
x t-Xyl of XyG 99.6 72.5 74.2 70.4 62.6 α-Xyl C1 differs from β-Xyl in GAX by 2−3 ppm.Aa1 (w) 2,5-Ara 107.1 89.8 76.8 78.6 70.7Aa2 (w) 68.8Ab (w) 107.3 87.8 72.6 ND NDAd t-Ara of GAX 109.2 82.1 78.2 85.7 62.4 These peaks are absent in Arabidopsis CW.Ac1 t-Ara 110.0 82.2 77.7 84.9 62.3 Consistent with Dick-Perez et al.6
Af1 108.4 81.7Ac2 5-Ara 110.0 82.2 77.8 83.2 67.9 C5 chemical shifts consistent with Tan et al.52
Af2 108.4 81.7Ac2′ 5-Ara 110.0 82.2 77.8 83.0 64.0Af2′ 108.4 81.7Af3 (w) 5-Ara 108.4 81.7 77.8 82.5 67.5Ac3 (w) 110.0 82.2Ae1 (w) 3,5-Ara 109.6 80.8 85.3 83.3 62.3 C3 chemical shifts consistent with Hromadkova et al.68 and Tan et
al.52Ae2 (w) 83.6Ag1 (w) 108.9 80.8 85.3 83.3 62.3Ag2 (w) 83.6Ah 108.4 80.2 ND ND NDR (w) 100.8 79.1 ND ND 69.2 17.8 C5−C6 peaks from the 30 ms PDSD spectrumGala 105.0 72.5 74.4 78.4 75.3 61.7 from Dick-Perez et al.6
Galb 103.4 74.0 76.4 73.8 74.8 61.7 from t-Gal (L) of Dick-Perez et al.6
Galc 103.9 71.9 73.8 69.5 75.8 61.8 present in both Arabidopsis and Brachypodium CWsUnk (w) unknown pectin 104.0 70.9 81.0 69.3 ND present in WT and XG mutant Arabidopsis CW.6 Lower intensities
in depectinated CW.21
GalA/Man 100.2 69.3 ND C1 and C2 shifts consistent with Dick-Perez et al.6 and Jarvis etal.6999.6 69.0
101.3 69.8aThe downfield chemical shifts that reflect the linkages of arabinoses are shown in bold. Unless specifically noted, most assignments are de novobased on the connectivity patterns in the 2D spectra. Weak signals are denoted (w). ND means not determined. Tentatively assigned 13C chemicalshifts are italicized and underlined.
Biochemistry Article
dx.doi.org/10.1021/bi500231b | Biochemistry 2014, 53, 2840−28542847

intermolecular GAX−cellulose cross peaks were detected, forexample, between XnC1 and iC4 at (102, 89) ppm, betweenAC1 and iC4 at (108, 89) ppm, and between FA and celluloseat (89, 56) ppm. Thus, both GAX backbone and side chains arein molecular contact with the cellulose microfibrils. The 1Dcross sections illustrate some of these cellulose−GAX crosspeaks more clearly (Figure 8c).To further verify the cellulose−GAX interactions, we
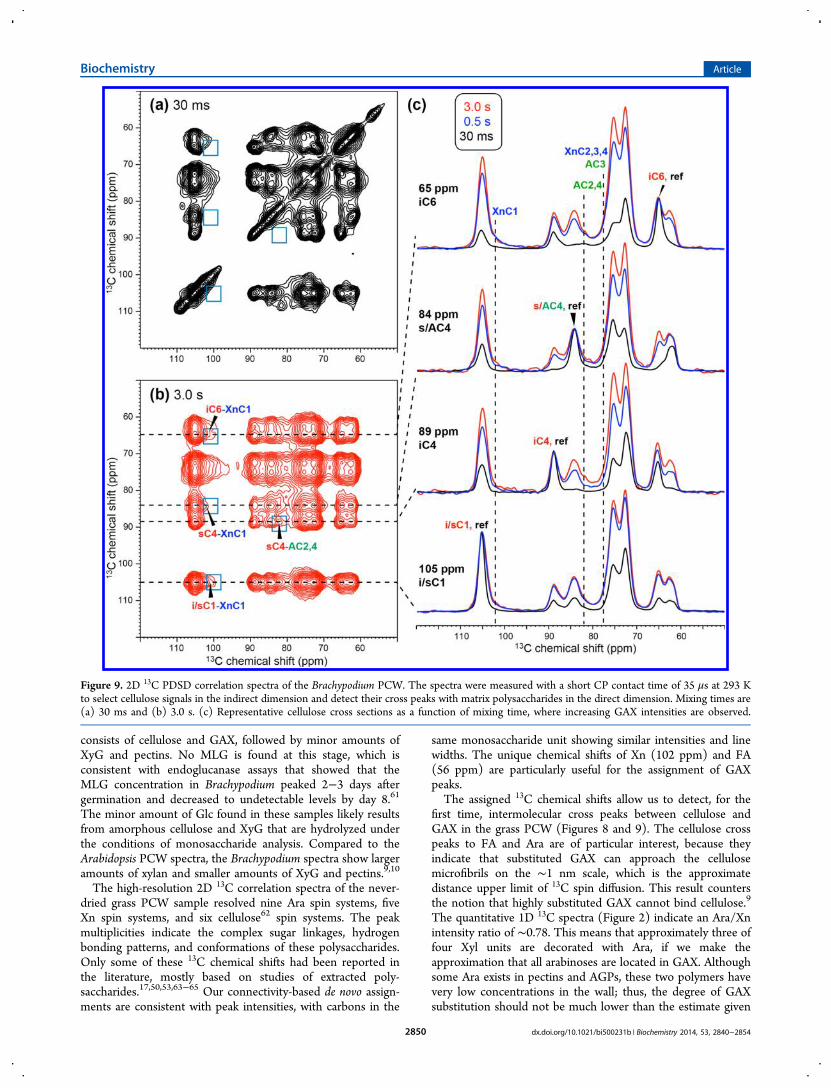
measured an edited 2D correlation spectrum in which thecellulose signals are selectively detected in the indirectdimension by using a short CP contact time while allpolysaccharides’ signals are detected in the direct dimensionafter a mixing time. The resulting 2D spectra (Figure 9) showunambiguous cellulose−Xn and cellulose−Ara cross peaks aftersamples have been mixed for 3.0 s. However, theseintermolecular cross peaks are weak, indicating that only asmall fraction of cellulose is in close contact with GAX. Indeed,the cellulose cross sections have intensity patterns quitedifferent from the GAX cross sections after samples havebeen mixed for 1.5 s (Figure 8c), indicating that the twopolysaccharides are not homogeneously mixed on the 1 nmscale that is relevant for 13C spin diffusion. This is notsurprising, because the 3−5 nm diameter of the cellulosemicrofibril presents a significant spin diffusion barrier to thesurrounding matrix polysaccharides.22 In comparison, all GAXcross sections have similar intensity patterns, indicating that 13Cmagnetization is equilibrated between the xylan backbone andthe Ara and FA side chains.Polysaccharide Mobilities in the Brachypodium
Primary Cell Wall. To investigate polysaccharide mobilitiesin the Brachypodium PCW, we measured 13C−1H bond orderparameters (SCH) and 13C T1 and 1H T1ρ relaxation times.Order parameters provide information about the motionalamplitudes, while relaxation times reflect motional rates. The
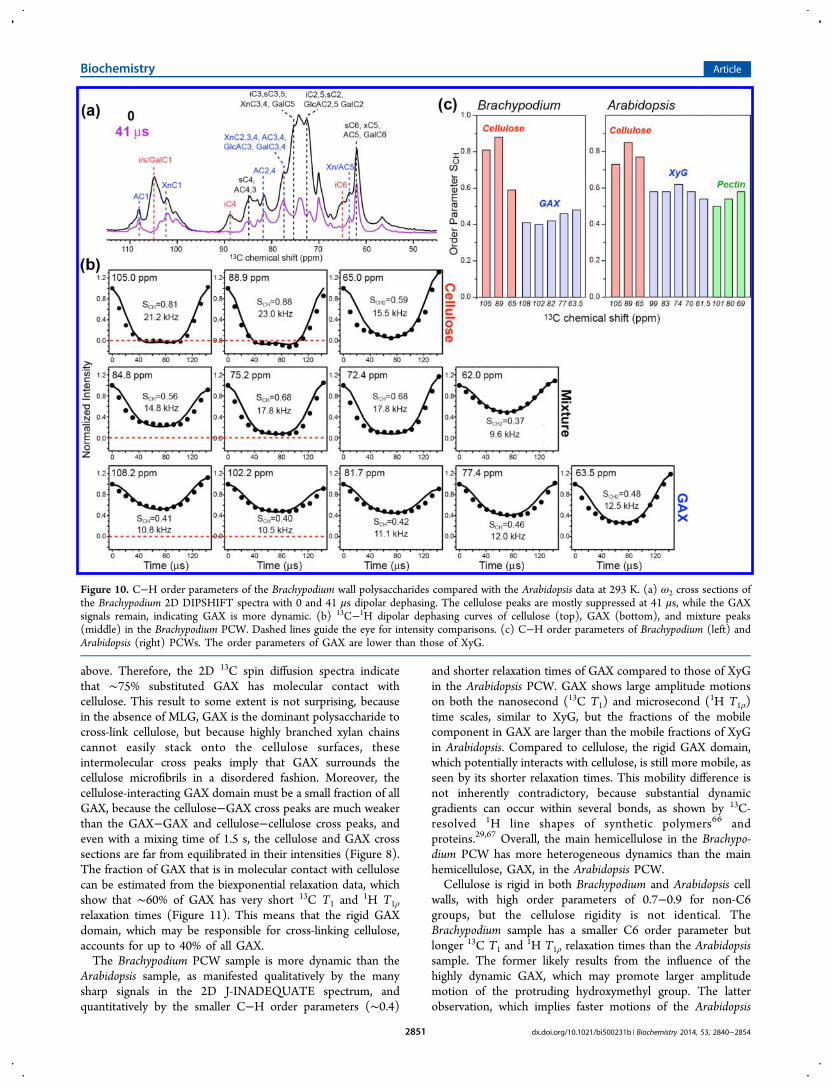
C−H order parameters were measured using the 2D DIP-SHIFT experiment,35 which yields time-dependent intensitydecays indicative of the dipolar coupling strength. The matrixpolysaccharides and cellulose show different dipolar decay rates,which allow their signals to be better resolved at chosen dipolardephasing times. For example, with 41 μs dipolar dephasing,the 105 ppm peak of cellulose and Gal C1 was completelysuppressed while the Ara (108 ppm) and Xn (102 ppm) C1signals remain (Figure 10a). In the time domain dipolar crosssections (Figure 10b), cellulose exhibits much deeper intensitydecays than GAX, indicating stronger dipolar couplings orhigher order parameters. The cellulose SCH values are 0.7−0.9,similar to the values of the Arabidopsis PCW sample (Figure10c), and correspond to root-mean-square (rms) amplitudes of15−26°.40 GAX exhibits much smaller SCH values of ∼0.4,indicating larger motional amplitudes. Interestingly, the GAXorder parameters are noticeably smaller than the XyG orderparameters in the Arabidopsis PCW and also smaller than thepectin SCH values, indicating that GAX in the grass PCW ismore mobile than most matrix polysaccharides in the dicotPCW.The 13C T1 and
1H T1ρ relaxation times are shown in Figure11. Most 13C sites exhibit double-exponential T1 decays (FigureS6 of the Supporting Information), with a short T1 componentand a long T1 component of <0.5 and >3 s, respectively. Thelong T1 component is longer for cellulose (4−5 s) than forGAX (2−4 s). In addition, GAX contains a higher populationof the faster-relaxing component while cellulose is dominatedby the long T1 component. These results are consistent withthe order parameter data in indicating that GAX is much moremobile than cellulose on the nanosecond time scale. Because13C T1 data contain spin diffusion effects, to obtain more site-specific relaxation times and to probe motion on a slower timescale, we measured the 1H T1ρ values using a Lee−Goldburg
Figure 7. Assignment of GAX side chain signals from a 2D 13C PDSD correlation spectrum measured at 253 K with a mixing time of 30 ms. (a)Aromatic region showing numerous FA signals. The 1H-rich and 1H-poor carbons are annotated in blue and red, respectively. Assignments are partlybased on literature chemical shifts.65 (b) Chemical structure of FA. (c) Assignment of a GlcA peak in the Brachypodium PCW (black) and GalAsignals in the Arabidopsis PCW (red).
Biochemistry Article
dx.doi.org/10.1021/bi500231b | Biochemistry 2014, 53, 2840−28542848

spin-lock experiment.6,40 Similar to the 13C T1 data, GAXexhibits much shorter 1H T1ρ values than cellulose, indicatingfaster motions. The short and long T1ρ components aresimilarly populated in GAX, while the long T1 componentdominates (∼80%) in cellulose. Taken together, these dataindicate that GAX undergoes faster motion than cellulose onboth the nanosecond and microsecond time scales.Comparing the Brachypodium and Arabidopsis samples, we
find the relaxation times of GAX and XyG are similar but thefractions of the dynamic components are higher in GAX than inXyG. Cellulose in the two cell walls exhibits subtle differences:the slow-relaxing components in Brachypodium have longerrelaxation times than in Arabidopsis. This result, together withthe larger amplitude dynamics of GAX, suggests that cellulose−
GAX interactions in the grass PCW are weaker than thecellulose−XyG interactions in the dicot PCW.
■ DISCUSSIONBrachypodium has recently been proposed as a model plant forgrasses,10 but structural characterization of the BrachypodiumPCW has been scarce.60 The study presented here establishesbenchmark polysaccharide 13C chemical shifts for the PCW ofthis model grass. The samples analyzed here are never dried;thus, the polysaccharide interactions and mobilities closelyresemble those under the native condition. At 2 weeks of age,the roots and leaves have very similar quantitative 13C spectra,indicating similar compositions of the CWs. Monosaccharidecomposition and linkage analyses (Tables 1 and 2) and 13CSSNMR spectra indicate that the Brachypodium PCW mainly
Figure 8. 2D 13C PDSD spectra of the Brachypodium PCW with mixing times of (a) 30 ms and (b) 1.5 s. The spectra were measured at 253 K. (c)1D cross sections from the 30 ms (red) and 1.5 s (black) 2D spectra. Several cellulose cross peaks to Xn, Ara, and FA in GAX cross peaks areobserved by 1.5 s.
Biochemistry Article
dx.doi.org/10.1021/bi500231b | Biochemistry 2014, 53, 2840−28542849
consists of cellulose and GAX, followed by minor amounts ofXyG and pectins. No MLG is found at this stage, which isconsistent with endoglucanase assays that showed that theMLG concentration in Brachypodium peaked 2−3 days aftergermination and decreased to undetectable levels by day 8.61
The minor amount of Glc found in these samples likely resultsfrom amorphous cellulose and XyG that are hydrolyzed underthe conditions of monosaccharide analysis. Compared to theArabidopsis PCW spectra, the Brachypodium spectra show largeramounts of xylan and smaller amounts of XyG and pectins.9,10
The high-resolution 2D 13C correlation spectra of the never-dried grass PCW sample resolved nine Ara spin systems, fiveXn spin systems, and six cellulose62 spin systems. The peakmultiplicities indicate the complex sugar linkages, hydrogenbonding patterns, and conformations of these polysaccharides.Only some of these 13C chemical shifts had been reported inthe literature, mostly based on studies of extracted poly-saccharides.17,50,53,63−65 Our connectivity-based de novo assign-ments are consistent with peak intensities, with carbons in the
same monosaccharide unit showing similar intensities and linewidths. The unique chemical shifts of Xn (102 ppm) and FA(56 ppm) are particularly useful for the assignment of GAXpeaks.The assigned 13C chemical shifts allow us to detect, for the
first time, intermolecular cross peaks between cellulose andGAX in the grass PCW (Figures 8 and 9). The cellulose crosspeaks to FA and Ara are of particular interest, because theyindicate that substituted GAX can approach the cellulosemicrofibrils on the ∼1 nm scale, which is the approximatedistance upper limit of 13C spin diffusion. This result countersthe notion that highly substituted GAX cannot bind cellulose.9
The quantitative 1D 13C spectra (Figure 2) indicate an Ara/Xnintensity ratio of ∼0.78. This means that approximately three offour Xyl units are decorated with Ara, if we make theapproximation that all arabinoses are located in GAX. Althoughsome Ara exists in pectins and AGPs, these two polymers havevery low concentrations in the wall; thus, the degree of GAXsubstitution should not be much lower than the estimate given
Figure 9. 2D 13C PDSD correlation spectra of the Brachypodium PCW. The spectra were measured with a short CP contact time of 35 μs at 293 Kto select cellulose signals in the indirect dimension and detect their cross peaks with matrix polysaccharides in the direct dimension. Mixing times are(a) 30 ms and (b) 3.0 s. (c) Representative cellulose cross sections as a function of mixing time, where increasing GAX intensities are observed.
Biochemistry Article
dx.doi.org/10.1021/bi500231b | Biochemistry 2014, 53, 2840−28542850
above. Therefore, the 2D 13C spin diffusion spectra indicatethat ∼75% substituted GAX has molecular contact withcellulose. This result to some extent is not surprising, becausein the absence of MLG, GAX is the dominant polysaccharide tocross-link cellulose, but because highly branched xylan chainscannot easily stack onto the cellulose surfaces, theseintermolecular cross peaks imply that GAX surrounds thecellulose microfibrils in a disordered fashion. Moreover, thecellulose-interacting GAX domain must be a small fraction of allGAX, because the cellulose−GAX cross peaks are much weakerthan the GAX−GAX and cellulose−cellulose cross peaks, andeven with a mixing time of 1.5 s, the cellulose and GAX crosssections are far from equilibrated in their intensities (Figure 8).The fraction of GAX that is in molecular contact with cellulosecan be estimated from the biexponential relaxation data, whichshow that ∼60% of GAX has very short 13C T1 and 1H T1ρ
relaxation times (Figure 11). This means that the rigid GAXdomain, which may be responsible for cross-linking cellulose,accounts for up to 40% of all GAX.The Brachypodium PCW sample is more dynamic than the
Arabidopsis sample, as manifested qualitatively by the manysharp signals in the 2D J-INADEQUATE spectrum, andquantitatively by the smaller C−H order parameters (∼0.4)
and shorter relaxation times of GAX compared to those of XyGin the Arabidopsis PCW. GAX shows large amplitude motionson both the nanosecond (13C T1) and microsecond (1H T1ρ)time scales, similar to XyG, but the fractions of the mobilecomponent in GAX are larger than the mobile fractions of XyGin Arabidopsis. Compared to cellulose, the rigid GAX domain,which potentially interacts with cellulose, is still more mobile, asseen by its shorter relaxation times. This mobility difference isnot inherently contradictory, because substantial dynamicgradients can occur within several bonds, as shown by 13C-resolved 1H line shapes of synthetic polymers66 andproteins.29,67 Overall, the main hemicellulose in the Brachypo-dium PCW has more heterogeneous dynamics than the mainhemicellulose, GAX, in the Arabidopsis PCW.Cellulose is rigid in both Brachypodium and Arabidopsis cell
walls, with high order parameters of 0.7−0.9 for non-C6groups, but the cellulose rigidity is not identical. TheBrachypodium sample has a smaller C6 order parameter butlonger 13C T1 and
1H T1ρ relaxation times than the Arabidopsissample. The former likely results from the influence of thehighly dynamic GAX, which may promote larger amplitudemotion of the protruding hydroxymethyl group. The latterobservation, which implies faster motions of the Arabidopsis
Figure 10. C−H order parameters of the Brachypodium wall polysaccharides compared with the Arabidopsis data at 293 K. (a) ω2 cross sections ofthe Brachypodium 2D DIPSHIFT spectra with 0 and 41 μs dipolar dephasing. The cellulose peaks are mostly suppressed at 41 μs, while the GAXsignals remain, indicating GAX is more dynamic. (b) 13C−1H dipolar dephasing curves of cellulose (top), GAX (bottom), and mixture peaks(middle) in the Brachypodium PCW. Dashed lines guide the eye for intensity comparisons. (c) C−H order parameters of Brachypodium (left) andArabidopsis (right) PCWs. The order parameters of GAX are lower than those of XyG.
Biochemistry Article
dx.doi.org/10.1021/bi500231b | Biochemistry 2014, 53, 2840−28542851

cellulose, is not fully understood. In general, the nanosecondmotions that induce T1 relaxation are fast torsional fluctuations,while the microsecond motions that induce T1ρ relaxation arelikely collective motions of several sugar units. We hypothesizethat the slightly faster motions of the dicot cellulose may becaused by the highly dynamic pectins, which are now known tointeract with cellulose.6,22
In conclusion, this study provides the first comprehensive setof 13C chemical shifts of the polysaccharides in the near-nativeBrachypodium PCW. At 2 weeks of age, the cell wall containscellulose and GAX as the major polysaccharides, while pectins,XyG, and structural proteins are present at concentrationsmuch lower than those in the Arabidopsis PCW at the samedevelopmental stage. The GAX in the grass PCW is ∼75%substituted, and a small portion of this highly branched GAXcontacts cellulose on the nanometer scale based on 2Dcorrelation spectra. Bond order parameters and relaxation timesindicate that GAX is heterogeneously dynamic: a dominantdynamic domain, which may fill the interfibrillar space, coexistswith a minor rigid domain, which may be responsible for cross-linking the cellulose microfibrils. Thus, in the grass PCW, GAXtakes on the dual structural and dynamical characteristics ofXyG and pectins in the dicot PCW. A large number ofarabinose structures and linkage patterns are observed,indicating that this monosaccharide acts as a versatile buildingblock in the grass PCW.
■ ASSOCIATED CONTENT
*S Supporting InformationAdditional NMR spectra and tables. This material is availablefree of charge via the Internet at http://pubs.acs.org.
■ AUTHOR INFORMATIONCorresponding Author*E-mail: [email protected]. Telephone: (515) 294-3521. Fax:(515) 294-0105.
FundingThis work was supported by the U.S. Department of Energy(DOE), Office of Basic Energy Sciences, Division of MaterialsSciences and Engineering, under Contract DE-AC02-07CH11358 (to M.H.) and by National Science FoundationGrant 1121163 (to O.A.Z.). Linkage composition wasperformed at CCRC Analytical services supported by theDOE-funded Center for Plant and Microbial ComplexCarbohydrates under Contract DE-FG02-93ER-20097.
NotesThe authors declare no competing financial interest.
■ ABBREVIATIONSAGP, arabinogalactan protein; Ara or A, arabinan; FA, ferulicacid; GalA, galacturonic acid; G, glucose in xyloglucan; GlcA,glucuronic acid; GAX, glucuronoarabinoxylan; HGA, homo-galacturonan; i, interior crystalline cellulose; MLG, mixedlinkage glucan; s, surface amorphous cellulose; Rha or R,rhamnose; XyG, xyloglucan; Xyl, xylose; x, xylose in xyloglucan;Xn, xylose in glucuronoarabinoxylan; CP, cross-polarization;DP, direct polarization; MAS, magic-angle spinning; PCW,primary cell wall.
■ REFERENCES(1) Ragauskas, A. J., Williams, C. K., Davison, B. H., Britovsek, G.,Cairney, J., Eckert, C. A., Frederick, W. J., Hallett, J. P., Leak, D. J.,Liotta, C. L., Mielenz, J. R., Murphy, R., Templer, R., and Tschaplinski,
Figure 11. Relaxation times of grass and dicot wall polysaccharides. (a) 13C T1 relaxation times of Brachypodium (left) and Arabidopsis (right) PCWs.The long and short T1 components are indicated in red and green, respectively. (b) Fractions of the two T1 components. The polysaccharide signalsare categorized as cellulose, hemicellulose, and pectin peaks. Dashed lines guide the eyes for the differences between the two CWs. (c) Site-specific1H T1ρ relaxation times. (d) Fractions of the two T1ρ components.
Biochemistry Article
dx.doi.org/10.1021/bi500231b | Biochemistry 2014, 53, 2840−28542852
T. (2006) The path forward for biofuels and biomaterials. Science 311,484−489.(2) Service, R. F. (2007) Cellulosic ethanol: Biofuel researchersprepare to reap a new harvest. Science 315, 1488−1491.(3) McCann, M. C., and Carpita, N. C. (2008) Designing thedeconstruction of plant cell walls. Curr. Opin. Plant Biol. 11, 314−320.(4) Initiative, I. B. (2010) Genome sequencing and analysis of themodel grass Brachypodium distachyon. Nature 463, 763−768.(5) Carpita, N. C., and Gibeaut, D. M. (1993) Structural models ofprimary cell walls in flowering plants: Consistency of molecularstructure with the physical properties of the walls during growth. PlantJ. 3, 1−30.(6) Dick-Perez, M., Zhang, Y., Hayes, J., Salazar, A., Zabotina, O. A.,and Hong, M. (2011) Structure and interactions of plant cell-wallpolysaccharides by two- and three-dimensional magic-angle-spinningsolid-state NMR. Biochemistry 50, 989−1000.(7) Buanafina, M. M. D. (2009) Feruloylation in Grasses: Currentand Future Perspectives. Mol. Plant 2, 861−872.(8) Carpita, N. C. (1984) Cell-Wall Development in MaizeColeoptiles. Plant Physiol. 76, 205−212.(9) Carpita, N. C. (1996) Structure and biogenesis of the cell walls ofgrasses. Annu. Rev. Plant Physiol. Plant Mol. Biol. 47, 445−476.(10) Vogel, J. (2008) Unique aspects of the grass cell wall. Curr.Opin. Plant Biol. 11, 301−307.(11) Nishiyama, Y., Langan, P., and Chanzy, H. (2002) Crystalstructure and hydrogen-bonding system in cellulose 1β fromsynchrotron X-ray and neutron fiber diffraction. J. Am. Chem. Soc.124, 9074−9082.(12) Nishiyama, Y., Sugiyama, J., Chanzy, H., and Langan, P. (2003)Crystal structure and hydrogen bonding system in cellulose 1α, fromsynchrotron X-ray and neutron fiber diffraction. J. Am. Chem. Soc. 125,14300−14306.(13) Ding, S. Y., Liu, Y. S., Zeng, Y. N., Himmel, M. E., Baker, J. O.,and Bayer, E. A. (2012) How Does Plant Cell Wall NanoscaleArchitecture Correlate with Enzymatic Digestibility? Science 338,1055−1060.(14) Marga, F., Grandbois, M., Cosgrove, D. J., and Baskin, T. I.(2005) Cell wall extension results in the coordinate separation ofparallel microfibrils: Evidence from scanning electron microscopy andatomic force microscopy. Plant J. 43, 181−190.(15) Zhang, T., Mahgsoudy-Louyeh, S., Tittmann, B., and Cosgrove,D. (2013) Visualization of the nanoscale pattern of recently-depositedcellulose microfibrils and matrix materials in never-dried primary wallsof the onion epidermis. Cellulose, 1−10.(16) Lu, F., and Ralph, J. (2003) Non-degradative dissolution andacetylation of ball-milled plant cell walls: High-resolution solution-state NMR. Plant J. 35, 535−544.(17) Cheng, K., Sorek, H., Zimmermann, H., Wemmer, D. E., andPauly, M. (2013) Solution-state 2D NMR spectroscopy of plant cellwalls enabled by a dimethylsulfoxide-d6/1-ethyl-3-methylimidazoliumacetate solvent. Anal. Chem. 85, 3213−3221.(18) Atalla, R. H., and VanderHart, D. L. (1984) Native Cellulose: AComposite of Two Distinct Crystalline Forms. Science 223, 283−285.(19) Vietor, R. J., Newman, R. H., Ha, M. A., Apperley, D. C., andJarvis, M. C. (2002) Conformational features of crystal-surfacecellulose from higher plants. Plant J. 30, 721−731.(20) Jarvis, M. (2003) Chemistry: Cellulose stacks up. Nature 426,611−612.(21) Dick-Perez, M., Wang, T., Salazar, A., Zabotina, O. A., andHong, M. (2012) Multidimensional solid-state NMR studies of thestructure and dynamics of pectic polysaccharides in uniformly 13C-labeled Arabidopsis primary cell walls. Magn. Reson. Chem. 50, 539−550.(22) Wang, T., Zabotina, O., and Hong, M. (2012) Pectin-celluloseinteractions in the Arabidopsis primary cell wall from two-dimensionalmagic-angle-spinning solid-state nuclear magnetic resonance. Bio-chemistry 51, 9846−9856.(23) Wang, T., Park, Y. B., Caporini, M. A., Rosay, M., Zhong, L.,Cosgrove, D. J., and Hong, M. (2013) Sensitivity-enhanced solid-state
NMR detection of expansin’s target in plant cell walls. Proc. Natl. Acad.Sci. U.S.A. 110, 16444−16449.(24) Sloneker, J. H. (1971) Determination of cellulose and apparenthemicellulose in plant tissue by gas-liquid chromatography. Anal.Biochem. 43, 539−546.(25) Carpita, N. C. (1983) Hemicellulosic Polymers of Cell-Walls ofZea Coleoptiles. Plant Physiol. 72, 515−521.(26) Carpita, N. C., Defernez, M., Findlay, K., Wells, B., Shoue, D. A.,Catchpole, G., Wilson, R. H., and McCann, M. C. (2001) Cell wallarchitecture of the elongating maize coleoptile. Plant Physiol. 127,551−565.(27) Whitney, S. E., Gothard, M. G., Mitchell, J. T., and Gidley, M. J.(1999) Roles of cellulose and xyloglucan in determining themechanical properties of primary plant cell walls. Plant Physiol. 121,657−664.(28) Whitney, S. E. C., Brigham, J. E., Darke, A. H., Reid, J. S. G., andGidley, M. J. (1995) In-Vitro Assembly of Cellulose/XyloglucanNetworks: Ultrastructural and Molecular Aspects. Plant J. 8, 491−504.(29) Hong, M., and Griffin, R. G. (1998) Resonance Assignment forSolid Peptides by Dipolar-Mediated 13C/15N Correlation Solid-StateNMR. J. Am. Chem. Soc. 120, 7113−7114.(30) Rienstra, C. M., Hohwy, M., Hong, M., and Griffin, R. G. (2000)2D and 3D 15N-13C-13C NMR chemical shift correlation spectroscopyof solids: Assignment of MAS spectra of peptides. J. Am. Chem. Soc.122, 10979−10990.(31) Bax, A., Freeman, R., and Kempsell, S. P. (1980) Natural-abundance 13C-13C coupling observed via double-quantum coherence.J. Am. Chem. Soc. 102, 4849−4851.(32) Lesage, A., Auger, C., Caldarelli, S., and Emsley, L. (1997)Determination of through-bond carbon-carbon connectivities in solid-state NMR using the INADEQUATE experiment. J. Am. Chem. Soc.119, 7867−7868.(33) Hohwy, M., Jakobsen, H. J., Eden, M., Levitt, M. H., andNielsen, N. C. (1998) Broadband dipolar recoupling in the nuclearmagnetic resonance of rotating solids: A compensated C7 pulsesequence. J. Chem. Phys. 108, 2686−2694.(34) Takegoshi, K., Nakamura, S., and Terao, T. (2001) C-13-H-1dipolar-assisted rotational resonance in magic-angle spinning NMR.Chem. Phys. Lett. 344, 631−637.(35) Munowitz, M. G., Griffin, R. G., Bodenhausen, G., and Huang,T. H. (1981) Two-dimensional rotational spin-echo NMR in solids:Correlation of chemical shift and dipolar interactions. J. Am. Chem. Soc.103, 2529−2533.(36) Hong, M., Gross, J. D., Rienstra, C. M., Griffin, R. G.,Kumashiro, K. K., and Schmidt-Rohr, K. (1997) CouplingAmplification in 2D MAS NMR and Its Application to TorsionAngle Determination in Peptides. J. Magn. Reson. 129, 85−92.(37) Bielecki, A., Kolbert, A. C., and Levitt, M. H. (1989) Frequency-switched pulse sequences: Homonuclear decoupling and dilute spinNMR in solids. Chem. Phys. Lett. 155, 341−346.(38) Rienstra, C. M., Tucker-Kellogg, L., Jaroniec, C. P., Hohwy, M.,Reif, B., McMahon, M. T., Tidor, B., Lozano-Perez, T., and Griffin, R.G. (2002) De novo determination of peptide structure with solid-statemagic-angle spinning NMR spectroscopy. Proc. Natl. Acad. Sci. U.S.A.99, 10260−10265.(39) Hong, M., Yao, X. L., Jakes, K., and Huster, D. (2002)Investigation of molecular motions by Lee-Goldburg cross-polarizationNMR spectroscopy. J. Phys. Chem. B 106, 7355−7364.(40) Huster, D., Xiao, L., and Hong, M. (2001) Solid-state NMRinvestigation of the dynamics of the soluble and membrane-boundcolicin Ia channel-forming domain. Biochemistry 40, 7662−7674.(41) van Rossum, B. J., de Groot, C. P., Ladizhansky, V., Vega, S., andde Groot, H. J. M. (2000) A method for measuring heteronuclear (H-1-C-13) distances in high speed MAS NMR. J. Am. Chem. Soc. 122,3465−3472.(42) York, W. S., Darvill, A. G., McNeil, M., Stevenson, T. T., andAlbersheim, P. (1985) Isolation and characterization of plant cell wallsand cell-wall components. Methods Enzymol. 118, 3−40.
Biochemistry Article
dx.doi.org/10.1021/bi500231b | Biochemistry 2014, 53, 2840−28542853
(43) Ciucanu, I., and Kerek, F. (1984) A simple and rapid method forthe permethylation of carbohydrates. Carbohydr. Res. 131, 209−217.(44) Seifert, G. J., and Roberts, K. (2007) The biology ofarabinogalactan proteins. Annu. Rev. Plant Biol. 58, 137−161.(45) Fincher, G. B., Stone, B. A., and Clarke, A. E. (1983)Arabinogalactan-Proteins: Structure, Biosynthesis, and Function. Annu.Rev. Plant Physiol. Plant Mol. Biol. 34, 47−70.(46) Showalter, A. M. (1993) Structure and Function of Plant-CellWall Proteins. Plant Cell 5, 9−23.(47) Buckeridge, M. S., Rayon, C., Urbanowicz, B., Tine, M. A. S.,and Carpita, N. C. (2004) Mixed linkage (1→ 3),(1 → 4)-β-D-glucansof grasses. Cereal Chem. 81, 115−127.(48) Burton, R. A., and Fincher, G. B. (2009) (1,3;1,4)-β-D-Glucansin cell walls of the poaceae, lower plants, and fungi: A tale of twolinkages. Mol. Plant 2, 873−882.(49) Hong, M. (1999) Solid-state dipolar INADEQUATE NMRspectroscopy with a large double-quantum spectral width. J. Magn.Reson. 136, 86−91.(50) Hollmann, J., Elbegzaya, N., Pawelzik, E., and Lindhauer, M. G.(2009) Isolation and characterization of glucuronoarabinoxylans fromwheat bran obtained by classical and ultrasound-assisted extractionmethods. Qual. Assur. Saf. Crops Foods 1, 231−239.(51) Roubroeks, J. P., Andersson, R., and Aman, P. (2000) Structuralfeatures of (1 → 3),(1 → 4)-β-D-glucan and arabinoxylan fractionsisolated from rye bran. Carbohydr. Polym. 42, 3−11.(52) Tan, L., Varnai, P., Lamport, D. T., Yuan, C., Xu, J., Qiu, F., andKieliszewski, M. J. (2010) Plant O-hydroxyproline arabinogalactans arecomposed of repeating trigalactosyl subunits with short bifurcated sidechains. J. Biol. Chem. 285, 24575−24583.(53) Habibi, Y., Mahrouz, M., and Vignon, M. R. (2005) Arabinan-rich polysaccharides isolated and characterized from the endosperm ofthe seed of Opuntia ficus-indica prickly pear fruits. Carbohydr. Polym.60, 319−329.(54) Buchanan, B. B., Gruissem, W., and Jones, R. L. (2000)Biochemistry and Molecular Biology of Plants, American Society of PlantPhysiologists, Rockville, MD.(55) Kabel, M. A., de Waard, P., Schols, H. A., and Voragen, A. G.(2003) Location of O-acetyl substituents in xylo-oligosaccharidesobtained from hydrothermally treated Eucalyptus wood. Carbohydr.Res. 338, 69−77.(56) Gille, S., and Pauly, M. (2012) O-acetylation of plant cell wallpolysaccharides. Front. Plant Sci. 3, 12.(57) Roubroeks, J. P., Andersson, R., Mastromauro, D. I.,Christensen, B. E., and Aman, P. (2001) Molecular weight, structureand shape of oat (1 → 3),(l → 4)-β-D-glucan fractions obtained byenzymatic degradation with (1 → 4)-β-D-glucan 4-glucanohydrolasefrom Trichoderma reesei. Carbohydr. Polym. 46, 275−285.(58) Bowles, R. K., Morgan, K. R., Furneaux, R. H., and Coles, G. D.(1996) C-13 CP/MAS NMR study of the interaction of bile acids withbarley β-D-glucan. Carbohydr. Polym. 29, 7−10.(59) Wood, P. J., Weisz, J., and Blackwell, B. A. (1994) StructuralStudies of (1→3),(1→4)-β-D-Glucans by 13C-Nuclear Magnetic-Resonance Spectroscopy and by Rapid Analysis of Cellulose-LikeRegions Using High-Performance Anion-Exchange Chromatographyof Oligosaccharides Released by Lichenase. Cereal Chem. 71, 301−307.(60) Rancour, D. M., Marita, J. M., and Hatfield, R. D. (2012) Cellwall composition throughout development for the model grassBrachypodium distachyon. Front. Plant Sci. 3, 266.(61) Christensen, U., Alonso-Simon, A., Scheller, H. V., Willats, W.G. T., and Harholt, J. (2010) Characterization of the primary cell wllsof seedlings of Brachypodium distachyon: A potential model plant fortemperate grasses. Phytochemistry 71, 62−69.(62) Harris, D. M., Corbin, K., Wang, T., Gutierrez, R., Bertolo, A. L.,Petti, C., Smilgies, D. M., Estevez, J. M., Bonetta, D., Urbanowicz, B.R., Ehrhardt, D. W., Somerville, C. R., Rose, J. K., Hong, M., andDebolt, S. (2012) Cellulose microfibril crystallinity is reduced bymutating C-terminal transmembrane region residues CESA1A903Vand CESA3T942I of cellulose synthase. Proc. Natl. Acad. Sci. U.S.A.109, 4098−4103.
(63) Dourado, F., Cardoso, S. M., Silva, A. M. S., Gama, F. M., andCoimbra, M. A. (2006) NMR structural elucidation of the arabinanfrom Prunus dulcis immunobiological active pectic polysaccharides.Carbohydr. Polym. 66, 27−33.(64) Vignon, M. R., and Gey, C. (1998) Isolation, H-1 and C-13NMR studies of (4-O-methyl-D-glucurono)-D-xylans from luffa fruitfibres, jute bast fibres and mucilage of quince tree seeds. Carbohydr.Res. 307, 107−111.(65) Bunzel, M., Ralph, J., Funk, C., and Steinhart, H. (2005)Structural elucidation of new ferulic acid-containing phenolic dimersand trimers isolated from maize bran. Tetrahedron Lett. 46, 5845−5850.(66) Schmidt-Rohr, K., and Spiess, H. W. (1994) MultidimensionalSolid-State NMR and Polymers, Academic Press, San Diego.(67) Park, Y. B., and Cosgrove, D. J. (2012) A revised architecture ofprimary cell walls based on biomechanical changes induced bysubstrate-specific endoglucanases. Plant Physiol. 158, 1933−1943.(68) Hromadkova, Z., Ebringerova, A., and Valachovic, P. (2002)Ultrasound-assisted extraction of water-soluble polysaccharides fromthe roots of valerian (Valeriana officinalis L.). Ultrason. Sonochem. 9,37−44.(69) Jarvis, M. C. (1990) The C-13-Nmr Spectrum of (1→4)-β-Deuterium-Mannans in Intact Endosperm Tissue of the Date (Phoenixdactylifera). Carbohydr. Res. 197, 276−280.
Biochemistry Article
dx.doi.org/10.1021/bi500231b | Biochemistry 2014, 53, 2840−28542854


![Monitoring Polysaccharide Dynamics in the Plant Cell Wall1[OPEN] · Update on Plant Cell Wall Dynamics Monitoring Polysaccharide Dynamics in the Plant Cell Wall1[OPEN] Catalin Voiniciuc,](https://img.pdfslide.us/doc/110x75/5e57dc422f31c166d63f94c4/monitoring-polysaccharide-dynamics-in-the-plant-cell-wall1open-update-on-plant.jpg)