Embed Size (px)
Citation preview

STRUCTURE AND DESIGN G G Schierle, PhD, FAIA Digital Review with Selections from the Following Chapters:
Part I: Background -Chapter 1: Historic Evolution
-Chapter 2: Loads Part II: Mechanics -Chapter 4: Statics -Chapter 5: Strength Stiffness Stability -Chapter 6: Bending -Chapter 7: Buckling Part III: Design Methods -Chapter 9: Lateral Force Design -Chapter 10: Conceptual Design Part IV: Horizontal Systems -Chapter 11: Horizontal Systems Bending Resistant -Chapter 12: Horizontal Systems Axial Resistant -Chapter 13: Horizontal Systems Form-Resistant -Chapter 14: Horizontal Systems Tensile Resistant Part V: Vertical Systems -Chapter 15: General Background -Chapter 16: Vertical Systems Shear Resistant Part VI: Material -Chapter 23: Concrete -Chapter 24: Fabric and Cables
G G SchierleG G Schierle STRUCTURE AND DESIGN


62 MECHANICS Statics
1 Simple beam with point loads Assume: P = 1.2k R = 5 P / 2 = 5 x 1.2 / 2 R = 3 k 2 Beam with overhang and point loads Assume: P = 2k � M b = 0 � + 12 Ra - 2x16 - 2x12 - 2x8 - 2x4 = 0 Ra = (32 + 24 + 16 + 8) / 12 Ra = 6.67 k � Ma = 0 � + -12 Rb - 2x4 + 2x4 + 2x8 + 2x12 = 0 Rb = (2 x 8 + 2 x 12) / 12 Rb = 3.33 k Check � V = 0 �+ 6.67 + 3.33 – 5 x 2 � V = 0 3 Beam with uniform load and point load (wall) Assume: w = 100 plf, P = 800# � M c = 0� + 16 Ra – 100x16x8 – 800x12 = 0 Ra = (100x16x8 + 800x12) / 16 Ra = 1,400 # � Ma = 0 � + -16 Rc + 100x16x8 + 800 x 4 +800 x16 = 0 Rc = (100x16x8 + 800x4 +800 x16) / 16 Rc = 1800 # Check � V = 0 � + 1400+1800-100x16-800-800 � V = 0

67 MECHANICS Statics
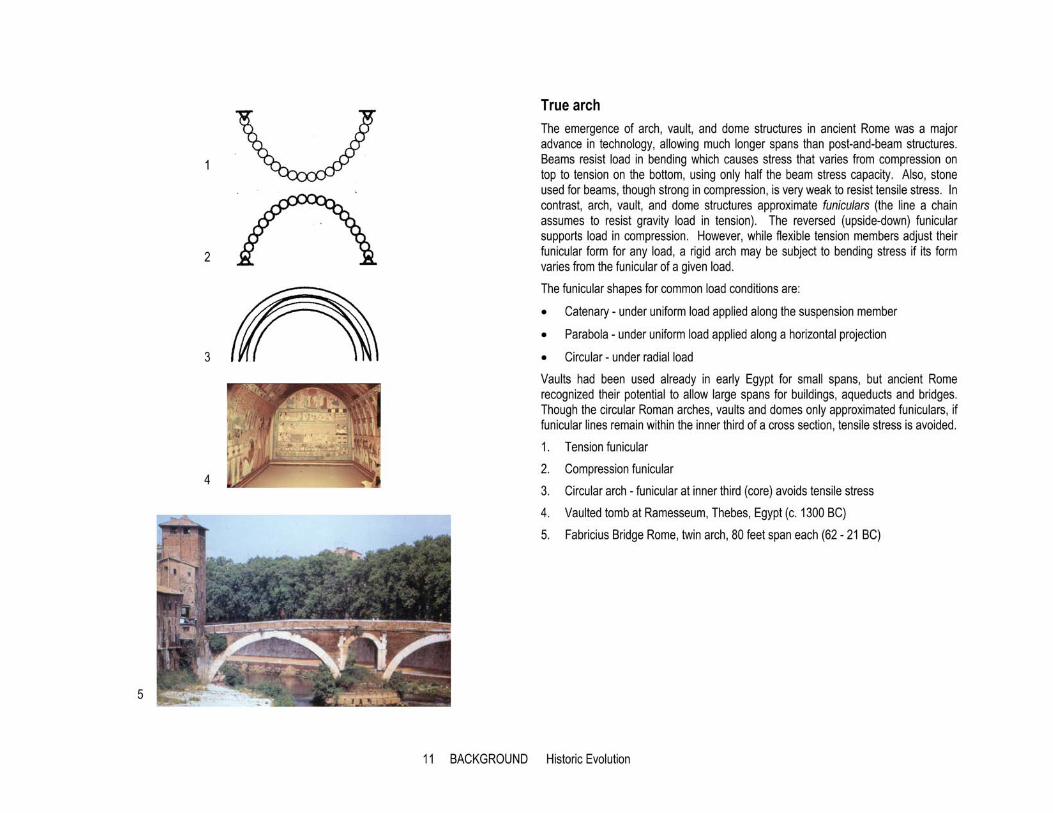
Vector Analysis First used by Leonardo da Vinci, graphic vector analysis is a powerful method to analyze and visualize the flow of forces through a structure. However, the use of this method is restricted to statically determinate systems. In addition to forces, vectors may represent displacement, velocity, etc. Though only two-dimensional forces are described here, vectors may represent forces in three-dimensional space as well. Vectors are defined by magnitude, line of action, and direction, represented by a straight line with an arrow and defined as follows: Magnitude is the vector length in a force scale, like 1” =10 k or 1 cm=50 kN Line of Action is the vector slope and location in space Direction is defined by an arrow pointing in the direction of action 1 Two force vectors P1 and P2 acting on a body pull in a certain direction. The
resultant R is a force with the same results as P1 and P2 combined, pulling in the same general direction. The resultant is found by drawing a force parallelogram [A] or a force triangle [B]. Lines in the vector triangle must be parallel to corresponding lines in the vector plan [A]. The line of action of the resultant is at the intersection of P1 / P2 in the vector plan [A]. Since most structures must be at rest it is more useful to find the equilibriant E that puts a set of forces in equilibrium [C]. The equilibriant is equal in magnitude but opposite in direction to the resultant. The equilibriant closes a force triangle with all vectors connected head-to-tail. The line of action of the equilibriant is also at the intersection of P1/P2 in the vector plan [A].
2 The equilibriant of three forces [D] is found, combining interim resultant R1-2 of forces P1 and P2 with P3 [E]. This process may be repeated for any number of forces. The interim resultants help to clarify the process but are not required [F]. The line of action of the equilibriant is located at the intersection of all forces in the vector plan [D]. Finding the equilibriant for any number of forces may be stated as follows: The equilibriant closes a force polygon with all forces connected head-to-tail and puts them in equilibrium in the force plan.
3 The equilibriant of forces without a common cross-point [G] is found in stages: First the interim resultant R1-2 of P1 and P2 is found [H] and located at the intersection of P1/P2 in the vector plan [G]. P3 is then combined with R1-2 to find the equilibriant for all three forces, located at the intersection of R1-2 with P3 in the vector plan. The process is repeated for any number of forces.

68 MECHANICS Statics
Vector components Vector components have the same effect on a body as the initial vector. Thus components relate to a vector as two vectors relate to a resultant or equilibriant. 1 The component forces C1 and C2 in two cables supporting a load P are found
by drawing a force triangle [B] with corresponding lines parallel to the those in the vector plan [A].
2 Forces in more than two cables supporting a load P are indeterminate [C] and cannot be found by graphic vector method since there are infinite number of solutions [D]. A problem with more than two unknown force components requires consideration of relative cable stiffness (cross-section area, length, and stiffness). Hence we can state:
Only two components can be found by graphic vector method 3 This example demonstrates graphic vector analysis: Forces are drawn on a
vector plan with line of action and direction [E]. The magnitude may be written on each vector or the vector may be drawn at a force scale. A force polygon [F] is drawn next at a force scale, such as 1” = 1k. For good accuracy, the force scale should be as large as space permits. The line of action of the equilibriant (or resultant) is then transposed into the vector plan at the intersection of all force vectors [E].

69 MECHANICS Statics
Truss Analysis Graphic truss analysis (Bow’s Notation) is a method to find bar forces using graphic vectors as in the following steps: 1 Truss diagram 2 Force polygon for loads, reactions, and the first joint polygon 3 Truss with completed tension and compression arrows 4 Completed force polygon for left half of truss 5 Tabulated bar forces (+ = tension - = compression) Steps � Draw a truss scaled as large as possible (1) and compute the reactions as for
beams (by moment method for asymmetrical trusses). � Letter the spaces between loads, reactions, and truss bars. Name bars by
adjacent letters: bar BH between B and H, etc. � Draw a force polygon for external loads and reactions in a force scale, such as
1”=10 pounds (2). Use a large scale for accuracy. A closed polygon with head-to-tail arrows implies equilibrium. Offset the reactions to the right for clarity.
� Draw polygons for each joint to find forces in connected bars. Closed polygons with head-to-tail arrows are in equilibrium. Start with left joint ABHG. Draw a vector parallel to bar BH through B in the polygon. H is along BH. Draw a vector parallel to bar HG through G to find H at intersection BH-HG.
� Measure the bar forces as vector length in the polygon. � Find bar tension and compression. Start with direction of load AB and follow
polygon ABHGA with head-to-tail arrows. Transpose arrows to respective bars in the truss next to the joint. Arrows pushing toward the joint are in compression; arrows pulling away are in tension. Since the arrows reverse for adjacent joints, draw them only on the truss but not on the polygon.
� Draw equilibrium arrows on opposite bar ends; then proceed to the next joint with two or less unknown bar forces (3). Draw polygons for all joints (4), starting with known loads or bars (for symmetrical trusses half analysis is needed)
� Tabulate bar forces (5)
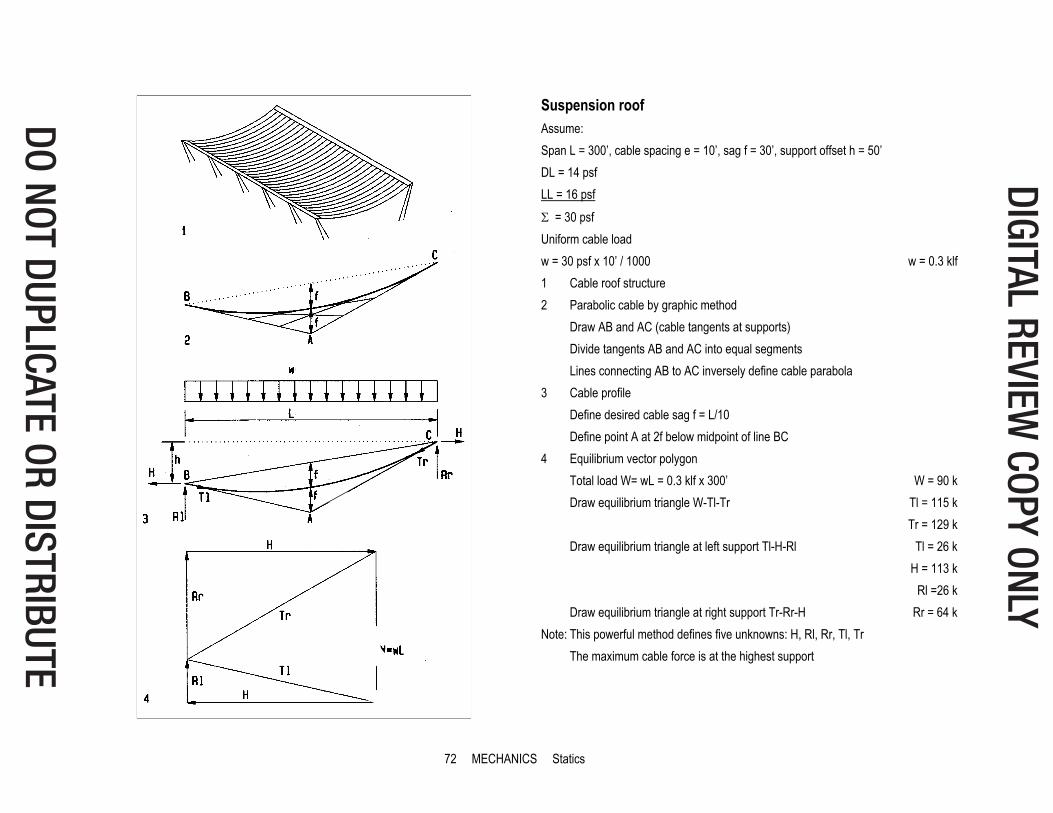
72 MECHANICS Statics
Suspension roof Assume: Span L = 300’, cable spacing e = 10’, sag f = 30’, support offset h = 50’ DL = 14 psf LL = 16 psf � = 30 psf Uniform cable load w = 30 psf x 10’ / 1000 w = 0.3 klf 1 Cable roof structure 2 Parabolic cable by graphic method Draw AB and AC (cable tangents at supports) Divide tangents AB and AC into equal segments Lines connecting AB to AC inversely define cable parabola 3 Cable profile Define desired cable sag f = L/10 Define point A at 2f below midpoint of line BC 4 Equilibrium vector polygon Total load W= wL = 0.3 klf x 300’ W = 90 k Draw equilibrium triangle W-Tl-Tr Tl = 115 k Tr = 129 k Draw equilibrium triangle at left support Tl-H-Rl Tl = 26 k H = 113 k Rl =26 k Draw equilibrium triangle at right support Tr-Rr-H Rr = 64 k Note: This powerful method defines five unknowns: H, Rl, Rr, Tl, Tr The maximum cable force is at the highest support
80 MECHANICS Strength Stiffness Stability
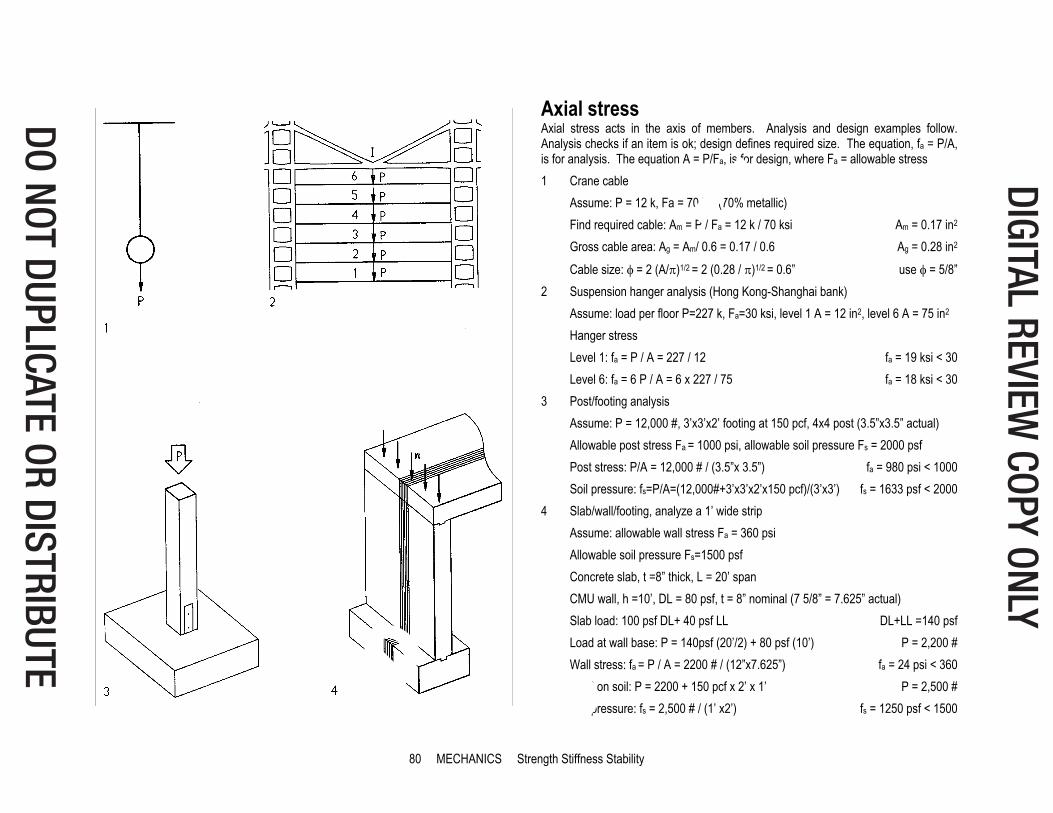
Axial stress Axial stress acts in the axis of members. Analysis and design examples follow. Analysis checks if an item is ok; design defines required size. The equation, fa = P/A, is for analysis. The equation A = P/Fa, is for design, where Fa = allowable stress 1 Crane cable Assume: P = 12 k, Fa = 70 ksi (70% metallic) Find required cable: Am = P / Fa = 12 k / 70 ksi Am = 0.17 in2 Gross cable area: Ag = Am/ 0.6 = 0.17 / 0.6 Ag = 0.28 in2 Cable size: � = 2 (A/�)1/2 = 2 (0.28 / �)1/2 = 0.6” use � = 5/8” 2 Suspension hanger analysis (Hong Kong-Shanghai bank) Assume: load per floor P=227 k, Fa=30 ksi, level 1 A = 12 in2, level 6 A = 75 in2 Hanger stress Level 1: fa = P / A = 227 / 12 fa = 19 ksi < 30 Level 6: fa = 6 P / A = 6 x 227 / 75 fa = 18 ksi < 30 3 Post/footing analysis Assume: P = 12,000 #, 3’x3’x2’ footing at 150 pcf, 4x4 post (3.5”x3.5” actual) Allowable post stress Fa = 1000 psi, allowable soil pressure Fs = 2000 psf Post stress: P/A = 12,000 # / (3.5”x 3.5”) fa = 980 psi < 1000 Soil pressure: fs=P/A=(12,000#+3’x3’x2’x150 pcf)/(3’x3’) fs = 1633 psf < 2000 4 Slab/wall/footing, analyze a 1’ wide strip Assume: allowable wall stress Fa = 360 psi Allowable soil pressure Fs=1500 psf Concrete slab, t =8” thick, L = 20’ span CMU wall, h =10’, DL = 80 psf, t = 8” nominal (7 5/8” = 7.625” actual) Slab load: 100 psf DL+ 40 psf LL DL+LL =140 psf Load at wall base: P = 140psf (20’/2) + 80 psf (10’) P = 2,200 # Wall stress: fa = P / A = 2200 # / (12”x7.625”) fa = 24 psi < 360 Load on soil: P = 2200 + 150 pcf x 2’ x 1’ P = 2,500 # Soil pressure: fs = 2,500 # / (1’ x2’) fs = 1250 psf < 1500
81 MECHANICS Strength Stiffness Stability
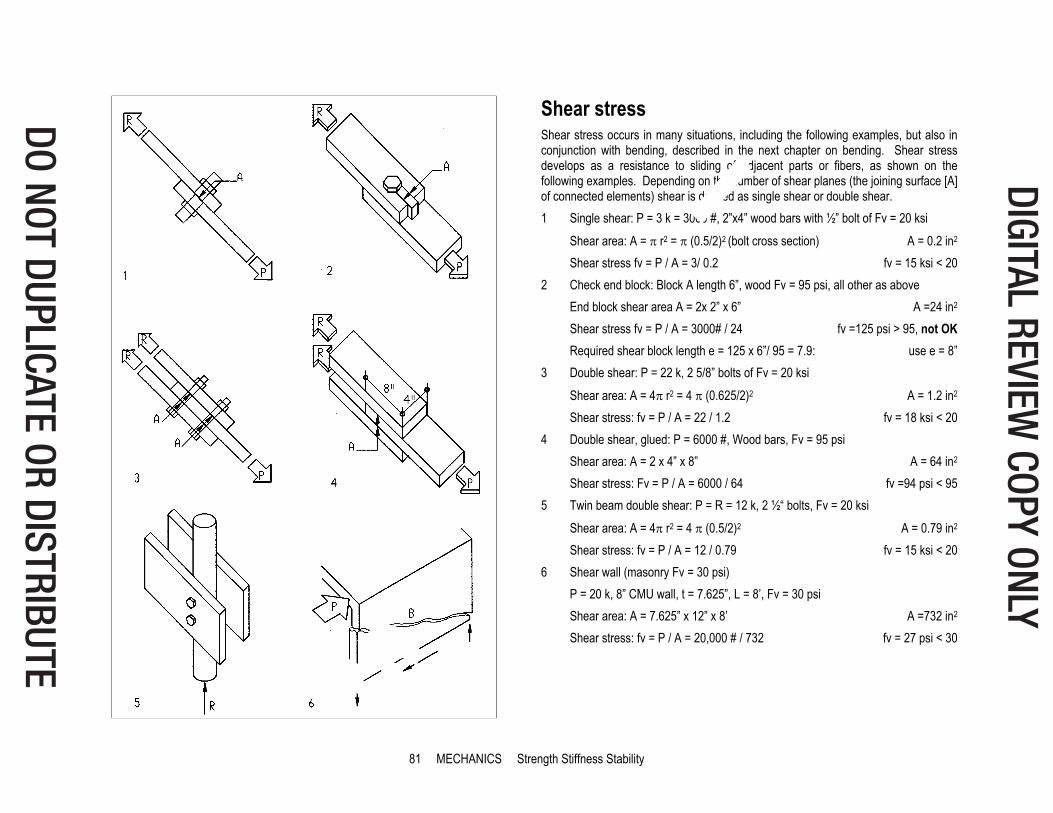
Shear stress Shear stress occurs in many situations, including the following examples, but also in conjunction with bending, described in the next chapter on bending. Shear stress develops as a resistance to sliding of adjacent parts or fibers, as shown on the following examples. Depending on the number of shear planes (the joining surface [A] of connected elements) shear is defined as single shear or double shear. 1 Single shear: P = 3 k = 3000 #, 2”x4” wood bars with ½” bolt of Fv = 20 ksi Shear area: A = � r2 = � (0.5/2)2 (bolt cross section) A = 0.2 in2 Shear stress fv = P / A = 3/ 0.2 fv = 15 ksi < 20 2 Check end block: Block A length 6”, wood Fv = 95 psi, all other as above End block shear area A = 2x 2” x 6” A =24 in2 Shear stress fv = P / A = 3000# / 24 fv =125 psi > 95, not OK Required shear block length e = 125 x 6”/ 95 = 7.9: use e = 8” 3 Double shear: P = 22 k, 2 5/8” bolts of Fv = 20 ksi Shear area: A = 4� r2 = 4 � (0.625/2)2 A = 1.2 in2 Shear stress: fv = P / A = 22 / 1.2 fv = 18 ksi < 20 4 Double shear, glued: P = 6000 #, Wood bars, Fv = 95 psi Shear area: A = 2 x 4” x 8” A = 64 in2 Shear stress: Fv = P / A = 6000 / 64 fv =94 psi < 95 5 Twin beam double shear: P = R = 12 k, 2 ½“ bolts, Fv = 20 ksi Shear area: A = 4� r2 = 4 � (0.5/2)2 A = 0.79 in2 Shear stress: fv = P / A = 12 / 0.79 fv = 15 ksi < 20 6 Shear wall (masonry Fv = 30 psi) P = 20 k, 8” CMU wall, t = 7.625”, L = 8’, Fv = 30 psi Shear area: A = 7.625” x 12” x 8’ A =732 in2 Shear stress: fv = P / A = 20,000 # / 732 fv = 27 psi < 30
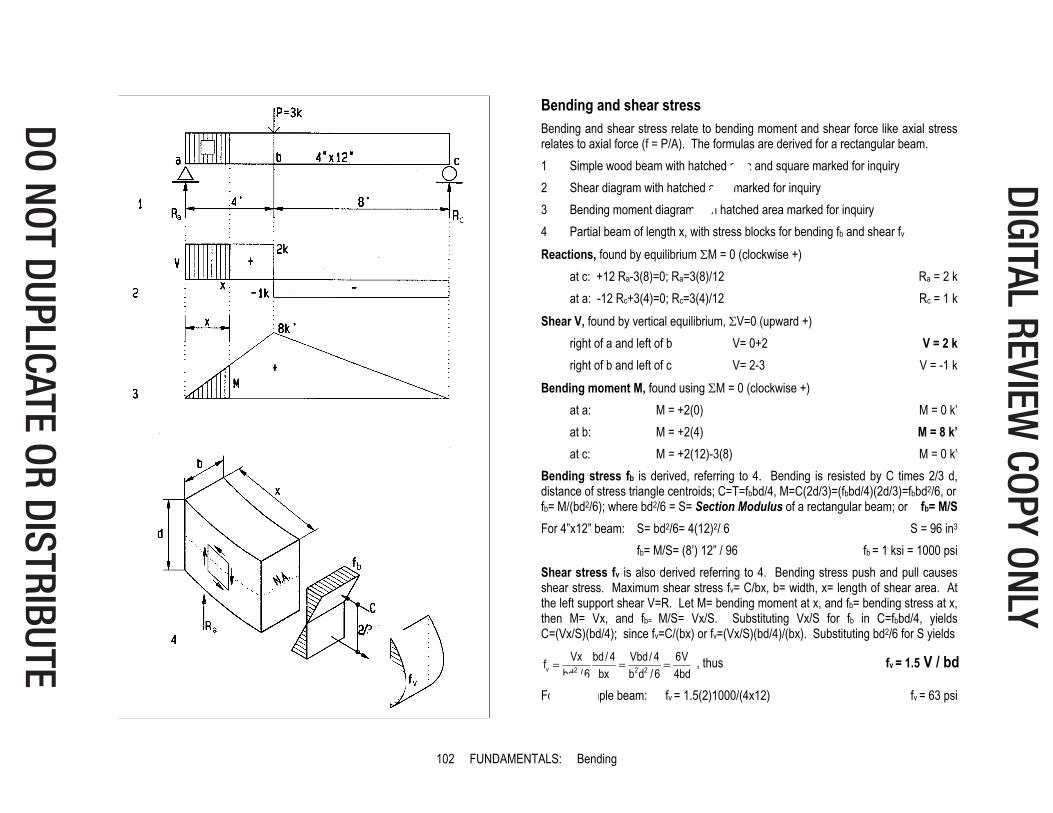
102 FUNDAMENTALS: Bending
Bending and shear stress Bending and shear stress relate to bending moment and shear force like axial stress relates to axial force (f = P/A). The formulas are derived for a rectangular beam. 1 Simple wood beam with hatched area and square marked for inquiry 2 Shear diagram with hatched area marked for inquiry 3 Bending moment diagram with hatched area marked for inquiry 4 Partial beam of length x, with stress blocks for bending fb and shear fv Reactions, found by equilibrium �M = 0 (clockwise +) at c: +12 Ra-3(8)=0; Ra=3(8)/12 Ra = 2 k at a: -12 Rc+3(4)=0; Rc=3(4)/12 Rc = 1 k Shear V, found by vertical equilibrium, �V=0 (upward +) right of a and left of b V= 0+2 V = 2 k right of b and left of c V= 2-3 V = -1 k Bending moment M, found using �M = 0 (clockwise +) at a: M = +2(0) M = 0 k’ at b: M = +2(4) M = 8 k’ at c: M = +2(12)-3(8) M = 0 k’ Bending stress fb is derived, referring to 4. Bending is resisted by C times 2/3 d, distance of stress triangle centroids; C=T=fbbd/4, M=C(2d/3)=(fbbd/4)(2d/3)=fbbd2/6, or fb= M/(bd2/6); where bd2/6 = S= Section Modulus of a rectangular beam; or fb= M/S For 4”x12” beam: S= bd2/6= 4(12)2/ 6 S = 96 in3 fb= M/S= (8’) 12” / 96 fb = 1 ksi = 1000 psi Shear stress fv is also derived referring to 4. Bending stress push and pull causes shear stress. Maximum shear stress fv= C/bx, b= width, x= length of shear area. At the left support shear V=R. Let M= bending moment at x, and fb= bending stress at x, then M= Vx, and fb= M/S= Vx/S. Substituting Vx/S for fb in C=fbbd/4, yields C=(Vx/S)(bd/4); since fv=C/(bx) or fv=(Vx/S)(bd/4)/(bx). Substituting bd2/6 for S yields
v 2 2 2Vx bd / 4 Vbd / 4 6Vf
bd / 6 bx b d / 6 4bd� � � , thus fv = 1.5 V / bd
For the sample beam: fv = 1.5(2)1000/(4x12) fv = 63 psi

106 FUNDAMENTALS: Bending
Design example The area method is used to demonstrate wood beam design and analysis. Design defines beam size, analysis verifies compliance with allowable stress / strain. V Shear diagram. M Bending diagram. � Deflection diagram. I Inflection points (change from + to - bending). Reactions R= 400plf (24) / 2 R = 4800 lbs Shear Va = 0 lbs Vbl = 0 -400(5) Vbl = -2000 lbs Vbr = -2000 + 4800 Vbr = +2800 lbs Vcl = +2800 - 400(14) Vc l= -2800 lbs Vcr = -2800 + 4800 Vcr = +2000 lbs Vd = +2000 - 400(5) Vd = 0 lbs, ok Moment Ma = 0 Mb = 0 -2000 (5)/2 Mb = -5000 lb-ft Mb-c = -5000+ 2800 (7)/2 Mb-c = +4800 lb-ft Mc = +4800 - 2800 (7)/2 Mc = -5000 lb-ft Md = - 5000+ 2000 (5)/2 Md = 0, ok Try 4x10 beam (4x10 nominal = 3.5” x 9.25”) S= (3.5) 9.252 / 6 S = 50 in3 Bending stress (convert lb-ft to lb-in) f b = M / S = 5000 lb-ft (12”) / 50 in3 f b = 1200 psi < 1450, OK Shear stress f v = 1.5V/bd =1.5(2800)/[3.5(9.25)] f v = 130 psi > 95. NOT OK Try 6x10 beam: f v = 1.5V/bd=1.5 (2800) / (5.5x9.25) f v= 83 psi < 95, OK Note: Increased width is OK for shear, but increased depth is better for bending
107 FUNDAMENTALS: Bending
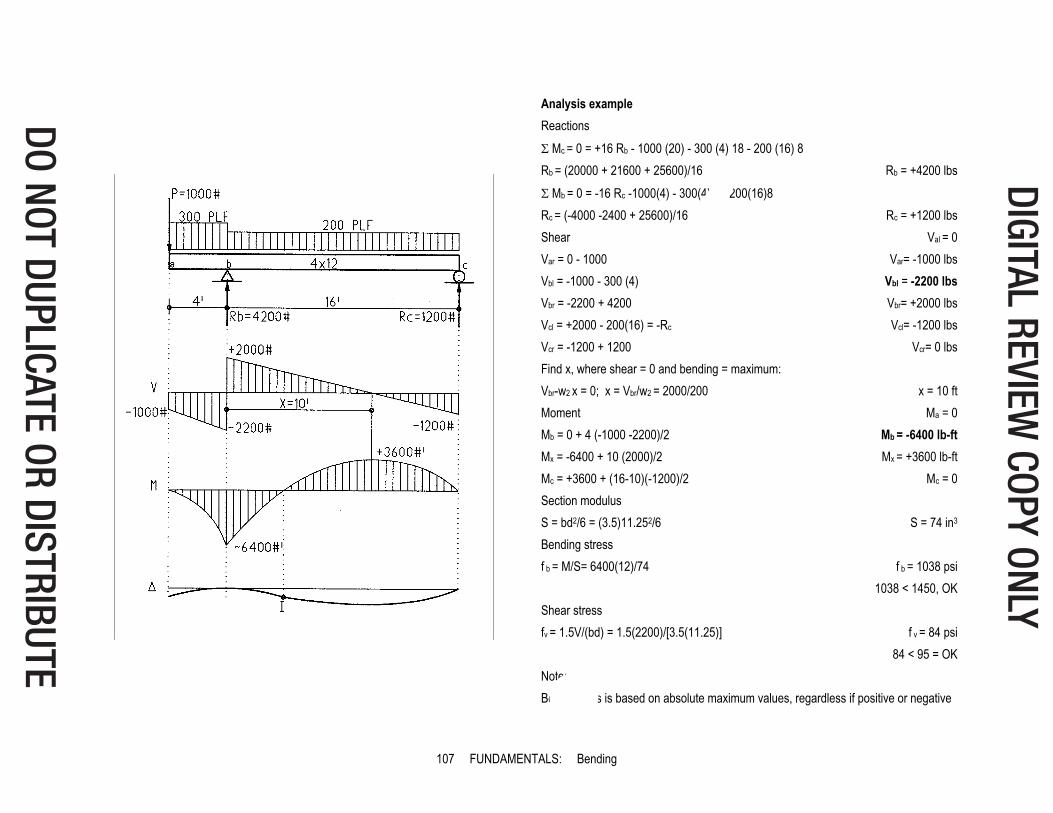
Analysis example Reactions � Mc = 0 = +16 Rb - 1000 (20) - 300 (4) 18 - 200 (16) 8 Rb = (20000 + 21600 + 25600)/16 Rb = +4200 lbs � Mb = 0 = -16 Rc -1000(4) - 300(4)2 + 200(16)8 Rc = (-4000 -2400 + 25600)/16 Rc = +1200 lbs Shear Val = 0 Var = 0 - 1000 Var= -1000 lbs Vbl = -1000 - 300 (4) Vbl = -2200 lbs Vbr = -2200 + 4200 Vbr= +2000 lbs Vcl = +2000 - 200(16) = -Rc Vcl= -1200 lbs Vcr = -1200 + 1200 Vcr= 0 lbs Find x, where shear = 0 and bending = maximum: Vbr-w2 x = 0; x = Vbr/w2 = 2000/200 x = 10 ft Moment Ma = 0 Mb = 0 + 4 (-1000 -2200)/2 Mb = -6400 lb-ft Mx = -6400 + 10 (2000)/2 Mx = +3600 lb-ft Mc = +3600 + (16-10)(-1200)/2 Mc = 0 Section modulus S = bd2/6 = (3.5)11.252/6 S = 74 in3 Bending stress f b = M/S= 6400(12)/74 f b = 1038 psi 1038 < 1450, OK Shear stress fv = 1.5V/(bd) = 1.5(2200)/[3.5(11.25)] f v = 84 psi 84 < 95 = OK Note: Beam stress is based on absolute maximum values, regardless if positive or negative
108 FUNDAMENTALS: Bending
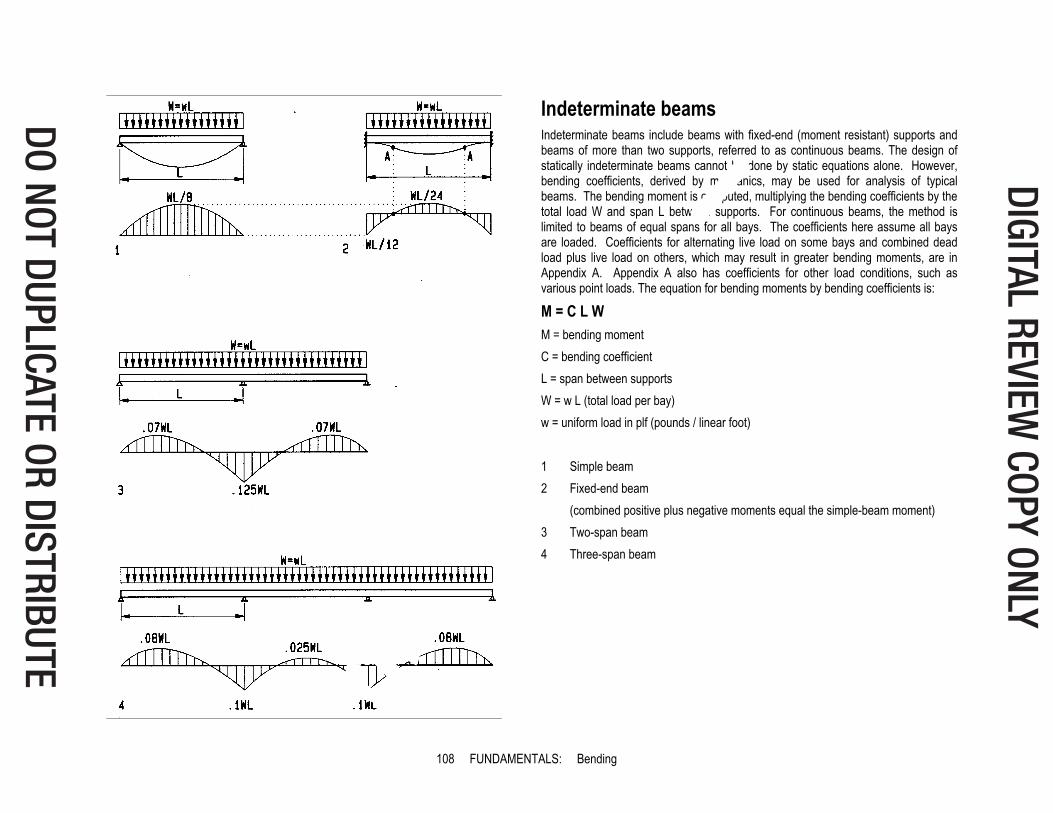
Indeterminate beams Indeterminate beams include beams with fixed-end (moment resistant) supports and beams of more than two supports, referred to as continuous beams. The design of statically indeterminate beams cannot be done by static equations alone. However, bending coefficients, derived by mechanics, may be used for analysis of typical beams. The bending moment is computed, multiplying the bending coefficients by the total load W and span L between supports. For continuous beams, the method is limited to beams of equal spans for all bays. The coefficients here assume all bays are loaded. Coefficients for alternating live load on some bays and combined dead load plus live load on others, which may result in greater bending moments, are in Appendix A. Appendix A also has coefficients for other load conditions, such as various point loads. The equation for bending moments by bending coefficients is:
M = C L W M = bending moment C = bending coefficient L = span between supports W = w L (total load per bay) w = uniform load in plf (pounds / linear foot) 1 Simple beam 2 Fixed-end beam (combined positive plus negative moments equal the simple-beam moment) 3 Two-span beam 4 Three-span beam

125 MECHANICS Buckling
Euler formula The Euler formula, named after the 18th century Swiss mathematician who developed it, defines critical load Pcr at which a compression member buckles as:
Pcr = �2 E I / L2 E = Elastic modulus I = Moment of inertia L = Length Since f = P/A, critical buckling stress is : Fcr = �2 E I/ (A L2) (A = cross section area) Buckling increases with slenderness, defined by the slenderness ration KL/r K = support factor defined below under Slenderness ratio
r = radius of gyration, a shape factor, r I / A�
Thus, critical buckling stress without factor of safety is 2
cr 2EF
(KL / r)�
�
The slenderness ratio KL/r consists of three zones: Zone 1: Short column, compression governs Zone 2: Intermediate column, inelastic buckling Zone 3: Slender column, elastic buckling
Slenderness ratio Buckling increases with slenderness KL/r, where K is the support type. The effective length KL is the actual length times K (KL = K L). For posts with two pins K =1. Fixed supports cause inflection points with effective length the distance between inflection points. Recommended K’ are conservative since fixed supports are not perfectly rigid. Support type: Theoretical K Recommended K’ A Pin supports: K = 1 K’ = 1 B One fixed support: K =0.7 K’ = 0.8 C Both fixed supports: K = 0.5 K’ =0.65 D Cantilever support: K = 2 K’ = 2.1 E Column of a rigid frame: K = 1 K’ = 1.2 - 1.5
KL/r
1.2-1.5
126 MECHANICS Buckling
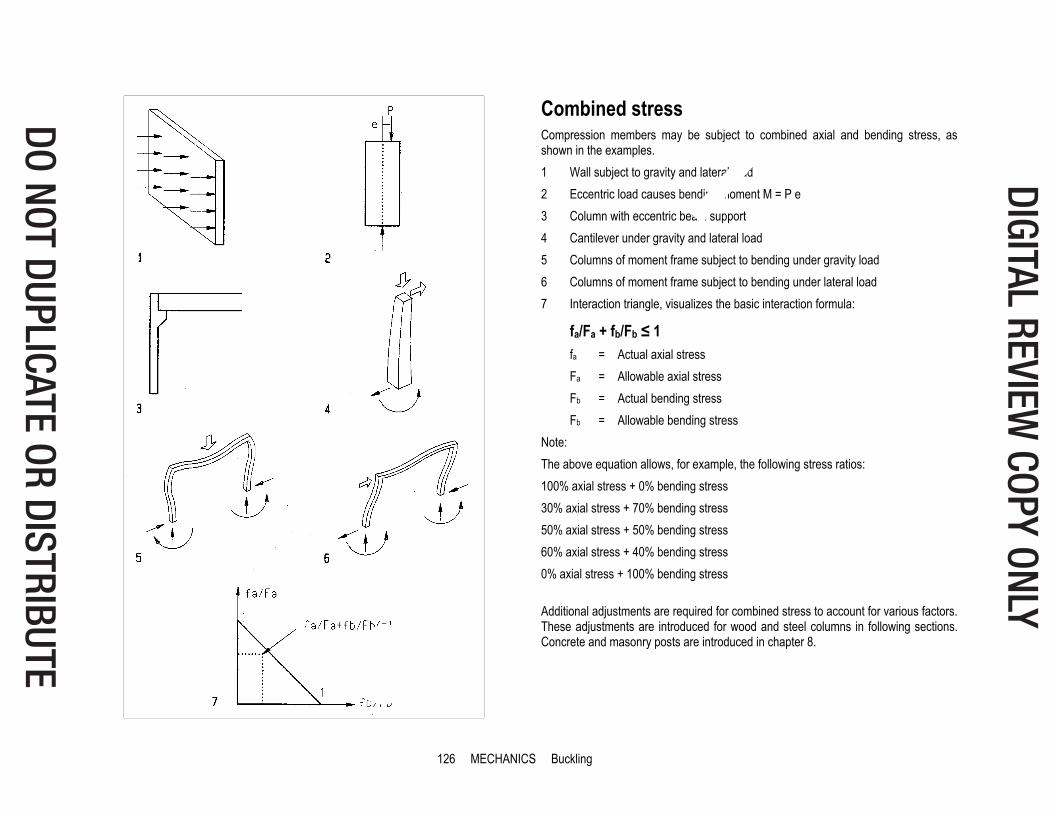
Combined stress
Compression members may be subject to combined axial and bending stress, as shown in the examples. 1 Wall subject to gravity and lateral load 2 Eccentric load causes bending moment M = P e 3 Column with eccentric beam support 4 Cantilever under gravity and lateral load 5 Columns of moment frame subject to bending under gravity load 6 Columns of moment frame subject to bending under lateral load 7 Interaction triangle, visualizes the basic interaction formula:
fa/Fa + fb/Fb � 1 fa = Actual axial stress Fa = Allowable axial stress Fb = Actual bending stress Fb = Allowable bending stress Note: The above equation allows, for example, the following stress ratios: 100% axial stress + 0% bending stress 30% axial stress + 70% bending stress 50% axial stress + 50% bending stress 60% axial stress + 40% bending stress 0% axial stress + 100% bending stress Additional adjustments are required for combined stress to account for various factors. These adjustments are introduced for wood and steel columns in following sections. Concrete and masonry posts are introduced in chapter 8.

134 MECHANICS Buckling
Steel buckling Empirical tests demonstrate that steel buckling has 2 modes of failure: � Inelastic buckling (KL/r < Cc) � Elastic buckling (KL/r > Cc) Based on empirical tests, the Cc transition occurs at about Fy/2 (1/2 yield stress) and may be derived based on Euler’s formula for K = 1 as follows:
��
2
a 2EF
(L / r) at �
�2
y2
F E2 (L / r)
�� �
2
cy
L 2 E Cr F
solving for Cc 2
cy
2 ECF�
�
Also based on empirical tests, allowable buckling stress Fa is defined as follows:
Inelastic buckling: �� �
� ��
2
y2c
a
(KL / r)1 F2C
FF.S.
F.S. = factor of safety, computed as: � � �2
3c c
5 3(KL / r) (KL / r)F.S.3 8C 8C
Elastic buckling: ��
2
a 212 EF23 (KL / r)
Slenderness ratio For steel columns the K-factor for slenderness ratio KL/r is important, since moment joints are very common. Therefore the K-factors are illustrated again at left and tabulated below. The recommended K’-factors are more conservative since moment joints are not perfectly rigid. Support type: theoretical K Recommended K’ A Pin supports: K = 1.0 K’ = 1.0 B One fixed support: K = 0.7 K’ = 0.8 C Both fixed supports: K = 0.5 K’ = 0.65 D Cantilever support: K = 2.0 K’ = 2.1 E Column of a rigid frame: K = 1.0 K’ = 1.2 - 1.5
KL/r
1.2-1.5
Cc = 107 for Fy= 50 ksi Cc = 126 for Fy= 36 ksi
2
y2c
a
(KL/r)1 F2C
FF.S.
�� �
� ��
2
a 212 EF23 (KL / r)
��

135 MECHANICS Buckling
Allowable stress Allowable stress is defined in two zones. Inelastic buckling is defined by compressive strength, elastic buckling by the elastic modulus which is constant for all steel grades. Hence elastic buckling is equal for all grades, and higher strength provides no benefit.
Analysis steps � Determine K-factor for given supports � Define slenderness KL / r � Define allowable stress Fa � Define allowable load P = Fa A Example: Allowable post load Assume: W14x82 post, Fy = 50 ksi (Cc = 107), L = 12’, A = 24.1 in2, ry = 2.48 in Slenderness KL/r = 12’(12”) / 2.48 KL/r = 58 58 < 107 KL/r < Cc Use inelastic formula Factor of safety
� � �2
3c c
3(KL / r) (KL / r)5F.S.3 8C 8C
= � �2
3
3(58) (58)53 8(107) 8(107)
F.S. = 1.87
Allowable stress
�� �
� ��
2
y2c
a
(KL / r)1 F2C
FF.S.
= �� �
� �
2
2
581 502(107)
1.87 Fa = 22.8 ksi
Allowable load P =Fa A = 22.8 (24.1) P =550 k Graph method The graph at left simplifies analysis and design of steel columns. At KL/r = 58 Fa = 23 ksi Allowable load P = Fa A = 23 (24.1) P = 554 k Note: Difference <1% (550 vs. 554) justifies the graph method for schematic design.

163 DESIGN METHODS Lateral Force Design
Kz graph Wind pressure Besides wind tunnel test, ASCE 7 provides two methods to define wind pressure: Method 1 – Simplified Design (limited to mean roof height h � 60 ft [18 m]) Method 2 – Analytical Procedure (briefly described below) P = qG Cp – qi(GCpi) (ASCE 7 6.5.12..2.1, min p = 10 psf [480 Pa]) Q = velocity pressure (defined below) G = gust factor (ASCE 7, 6.5.8) G = 0.85 (for rigid structures > 1 Hz, usually < 10 stories) G = 1.5 to 2.0 (for fabric structures, depending on form, etc.) Cp = Pressure coefficient (ASCE 7 figures and tables) Cp = 0.8 (windward walls, varies with height z) Cp = 0.2 to - 0.5 (leeward wall - constant - based on height h) Cp = 1.3 to + 0.4 (roofs) GCpi = Internal pressure (based on highest opening, ASCE 7 Fig. 6-5) GCpi = ± 0.18 (enclosed buildings) q = 0.00256 I Kz Kz t Kd V2 (Velocity pressure in psf) q = 0.613 I Kz Kz t Kd V2 (SI units: velocity pressure in Pa, V in m/s) V = wind speed in mph (IBC Fig. 1609 wind speed map or local data) I = Importance factor (IBC table 1604.5) I = 1.15 (hospitals, police and fire stations, etc.) I = 1 (most other structures) KZt = Topography factor (ASCE 7 Fig. 6.4) KZt = 1 (for regular flat topography, assumed in graphs) Kd = Directionality factor (ASCE 7 Table 6-4, kd = 0.85 for buildings) KZ = Exposure factor (ASCE 7 Table 6-3, see graph at left) B = Exposure B (inner city, protected by other buildings or trees) C = Exposure C (open area, unprotected buildings) D = Exposure D (near ocean or large lakes)

173 DESIGN METHODS Lateral Force Design
1 2 3
Seismic design steps 1 USGS map with seismic factors SS for low rise structures 2 USGS map with seismic factors S1 for high rise structures 3 Graph with CS factors based on USGS seismic factors SS (top line) Get SS and S1 factors from USGS web site: http://earthquake.usgs.gov/research/hazmaps/design/datasets/2003-ZipCode-MCEdata-SsS1.txt
Zip code State Type Latitude Longitude SS S1 90089 CA Area 34 -118 184 64 Define site class by a geologist or assume default site class D (IBC table 1615.1.1) Base shear V = CS W (lateral force at base of structure W = Dead load (+25% storage live load+ 20% flat roof snow load > 30 psf) W = w A (w = dead load in psf, A = total floor area of building) CS = seismic coefficient (see graph [3] - SS factors at top line) CS = I SDS / R (for T < TS) CS = I SD1 / (TR) (for T > TS) I = Importance factor (see IBC table 1604.5) R = R-factor (see IBC table 1617.6.2) SDS = 1.84 Fa SS (SS=1.84= 184% from USGS web site for zip code 90089) SD1 = 0.64 Fv S1 (S1= 0.64= 64% from USGS web site for zip code 90089) TS = SDS/SD1 (for SDS and SD1 see graphs on following pages) Fa and Fv are defined in IBC tables 1615.1.2(1) and 1615.1.2(2) respectively CS varies with SS, S1, and type of structure (see graphs at following pages)
Common Cs factors Cs ~ 3% for tall steel frame structures Cs ~ 15% for low-rise wood structures Cs ~ 30% for some low-rise masonry structures
Common dead loads w w = 15 to 25 psf for wood structures w = 70 to 100 psf for steel structures w = 150 to 200 psf for concrete structures
0.000.050.100.150.200.250.300.350.400.450.50
AB
CD
E
Cs for site class A-E for 0.2 sec mapped spectral accelerations Ss (top line)
Cs factors for light framing with wood panels (R=6, I=1)
A 0.02 0.03 0.05 0.06 0.08 0.10 0.13 0.19 0.25 0.32 0.38B 0.02 0.04 0.06 0.08 0.10 0.12 0.16 0.24 0.32 0.40 0.48C 0.02 0.05 0.07 0.08 0.10 0.12 0.16 0.24 0.32 0.40 0.48D 0.03 0.06 0.07 0.09 0.10 0.12 0.16 0.24 0.32 0.40 0.48E 0.05 0.07 0.07 0.07 0.09 0.11 0.14 0.21 0.29 0.36 0.43
0.25 0.5 0.75 1 1.25 1.5 2 3 4 5 6
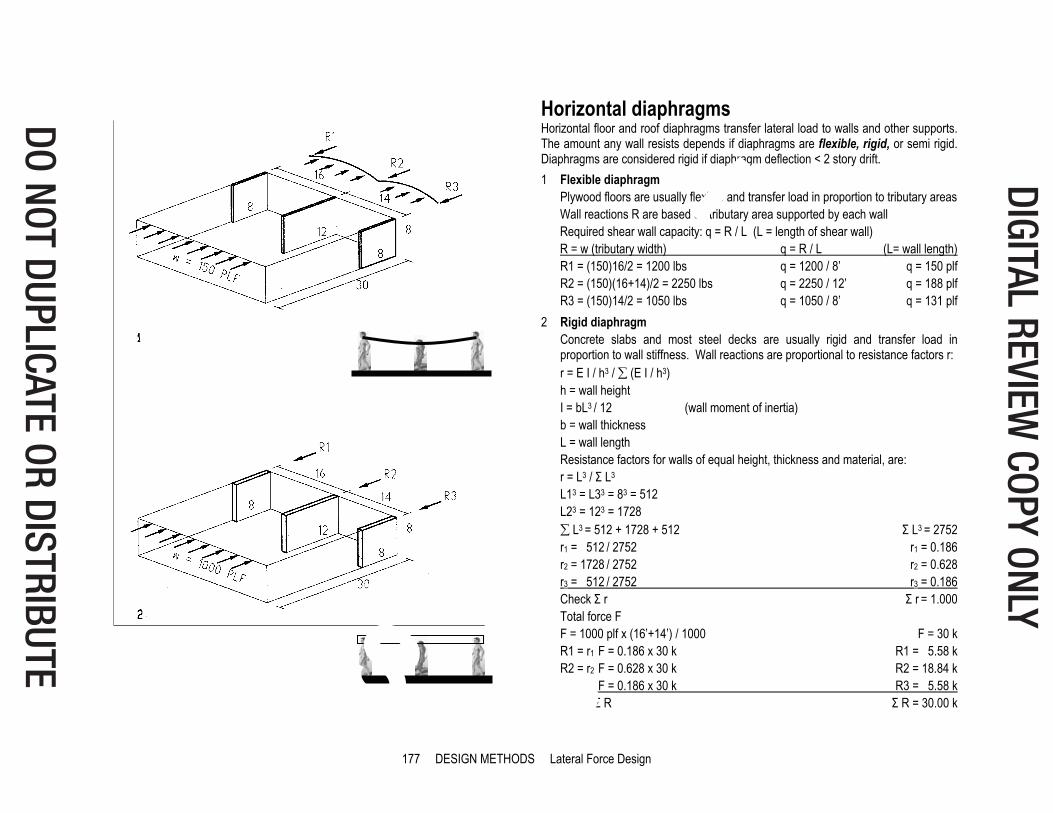
177 DESIGN METHODS Lateral Force Design
Horizontal diaphragms Horizontal floor and roof diaphragms transfer lateral load to walls and other supports. The amount any wall resists depends if diaphragms are flexible, rigid, or semi rigid. Diaphragms are considered rigid if diaphragm deflection < 2 story drift. 1 Flexible diaphragm
Plywood floors are usually flexible and transfer load in proportion to tributary areas Wall reactions R are based on tributary area supported by each wall Required shear wall capacity: q = R / L (L = length of shear wall) R = w (tributary width) q = R / L (L= wall length) R1 = (150)16/2 = 1200 lbs q = 1200 / 8’ q = 150 plf R2 = (150)(16+14)/2 = 2250 lbs q = 2250 / 12’ q = 188 plf R3 = (150)14/2 = 1050 lbs q = 1050 / 8’ q = 131 plf 2 Rigid diaphragm
Concrete slabs and most steel decks are usually rigid and transfer load in proportion to wall stiffness. Wall reactions are proportional to resistance factors r:
r = E I / h3 / � (E I / h3) h = wall height
I = bL3 / 12 (wall moment of inertia) b = wall thickness
L = wall length Resistance factors for walls of equal height, thickness and material, are:
r = L3 / � L3 L13 = L33 = 83 = 512 L23 = 123 = 1728 � L3 = 512 + 1728 + 512 � L3 = 2752 r1 = 512 / 2752 r1 = 0.186 r2 = 1728 / 2752 r2 = 0.628 r3 = 512 / 2752 r3 = 0.186
Check � r � r = 1.000 Total force F F = 1000 plf x (16’+14’) / 1000 F = 30 k
R1 = r1 F = 0.186 x 30 k R1 = 5.58 k R2 = r2 F = 0.628 x 30 k R2 = 18.84 k R3 = r3 F = 0.186 x 30 k R3 = 5.58 k Check � R � R = 30.00 k

189 DESIGN METHODS Conceptual Design
Global moment and shear Global moments may be used to design beam, truss, cable and arch structures; they all resist global moments by a force couple F with a lever arm d: M = F d; hence F = M / d The force F is expressed as T (tension) and C (compression) for beam or truss and H (horizontal reaction) for suspension cable or arch. These forces are always defined by the global moment and lever arm of the resisting couple. For uniform load and simple support, the maximum global moment M and shear V are computed as: M = w L2 / 8 V = w L / 2 w = uniform gravity load L = span For other load or support conditions appropriate formulas must be used. Beams resist the global moment by a force couple, with lever arm 2/3 the beam depth resisted by top compression C and bottom tension T. fb = M / S S = section modulus Trusses resist the global moment by a force couple of truss depth d as lever arm, with compression C in top chord and tension T in bottom chord. Global shear is resisted by vertical and / or diagonal web bars. The maximum moment at mid-span causes maximum chord forces. Maximum support shear causes maximum web bar forces. C = T = M / d Suspension cables resist the global moment by horizontal reaction with sag f as lever arm. The horizontal reaction H, vertical reaction R, and maximum cable tension T form an equilibrium vector triangle; hence the maximum cable tension is:
� �2 2T H R H = M / f, R = w L /2 Arches resist the global moment like a cable, but in compression instead of tension:
� �2 2C H R H = M/d, R = w L /2
However, unlike cables, arches don’t adjust their form for changing loads; hence, they assume bending under non-uniform load as the product of funicular force and lever arm between funicular line and arch form (bending stress is substituted by conservative axial stress for approximate schematic design).
191 DESIGN METHODS Conceptual Design
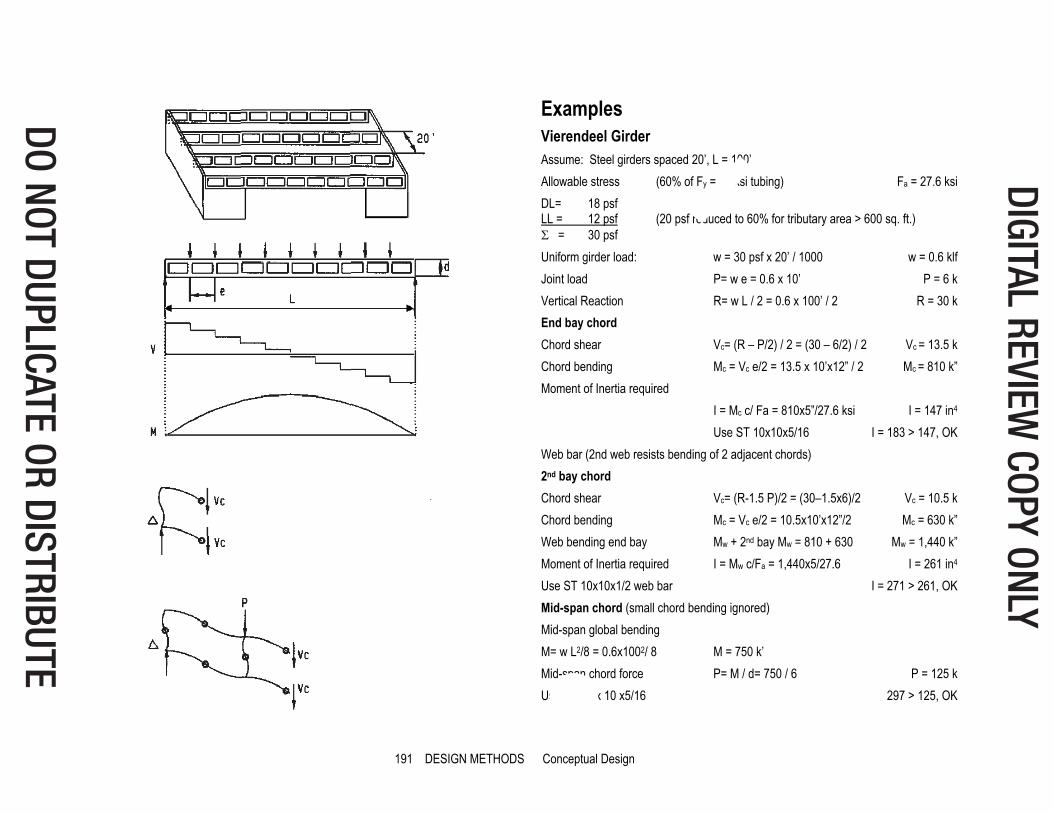
Examples
Vierendeel Girder Assume: Steel girders spaced 20’, L = 100’ Allowable stress (60% of Fy = 46 ksi tubing) Fa = 27.6 ksi DL= 18 psf LL = 12 psf (20 psf reduced to 60% for tributary area > 600 sq. ft.) � = 30 psf Uniform girder load: w = 30 psf x 20’ / 1000 w = 0.6 klf Joint load P= w e = 0.6 x 10’ P = 6 k Vertical Reaction R= w L / 2 = 0.6 x 100’ / 2 R = 30 k End bay chord Chord shear Vc= (R – P/2) / 2 = (30 – 6/2) / 2 Vc = 13.5 k Chord bending Mc = Vc e/2 = 13.5 x 10’x12” / 2 Mc = 810 k” Moment of Inertia required I = Mc c/ Fa = 810x5”/27.6 ksi I = 147 in4 Use ST 10x10x5/16 I = 183 > 147, OK Web bar (2nd web resists bending of 2 adjacent chords) 2nd bay chord Chord shear Vc= (R-1.5 P)/2 = (30–1.5x6)/2 Vc = 10.5 k Chord bending Mc = Vc e/2 = 10.5x10’x12”/2 Mc = 630 k” Web bending end bay Mw + 2nd bay Mw = 810 + 630 Mw = 1,440 k” Moment of Inertia required I = Mw c/Fa = 1,440x5/27.6 I = 261 in4 Use ST 10x10x1/2 web bar I = 271 > 261, OK Mid-span chord (small chord bending ignored) Mid-span global bending M= w L2/8 = 0.6x1002/ 8 M = 750 k’ Mid-span chord force P= M / d= 750 / 6 P = 125 k Use ST 10 x 10 x5/16 297 > 125, OK

192 DESIGN METHODS Conceptual Design
Wood Arch Assume: Three-hinge glue-lam arches spaced 16’ (Available glue-lam dimensions: ¾” lams; 31/8”, 51/8”, 6¾”, 8¾” and10 ¾” wide) Allowable buckling stress (from case studies) Fc’ = 200 psi LL = 12 psf (reduced to 60% of 20 psf for tributary area > 600 sq. ft.) DL = 18 psf (estimate) � = 30 psf Uniform load: w = 30 psf x 16’ / 1000 w = 0.48 klf Global moment: M = w L2 / 8 = 0.48 x 1002 / 8 M = 600 k’ Horizontal reaction: H = M / d = 600 / 20 H = 30 k Vertical reaction: R = w L / 2 = 0.48 x 100’ / 2 R = 24 k Arch compression: C = (H2 + R2)1/2 = (30 2 + 24 2 )1/2 C = 38 k Cross section area required: A = C / Fc’ = 38 / 0.2 ksi A = 190 in2
Glue-lam depth (try 5 1/8” wide glue-lam) t = A / width = 190 / 5.125 = 37; use 50 lams of ¾” t = 37.5” Check slenderness ratioL / t = 100’ x 12” / 37.5” L/t = 32, OK Note:Arch slenderness of L/t = 32 is OK (the 5 1/8” arch width is braced against buckling by the roof diaphragm). Wind bracing at end bays may consist of diagonal steel rods in combination with compression struts. The lateral thrust of arches may be resisted by concrete piers tied together by grade beams to resist the lateral arch thrust. Final design must consider non-uniform load (snow on half the arch) resulting in combined axial and bending stress; the bending moment is axial force times lever arm between funicular pressure line and arch center. The funicular line may be found graphically. Graphic method � Draw a vector of the computed vertical reaction � Draw equilibrium vectors parallel to arch support tangent � Equilibrium vectors give arch force and horizontal reaction
193 DESIGN METHODS Conceptual Design
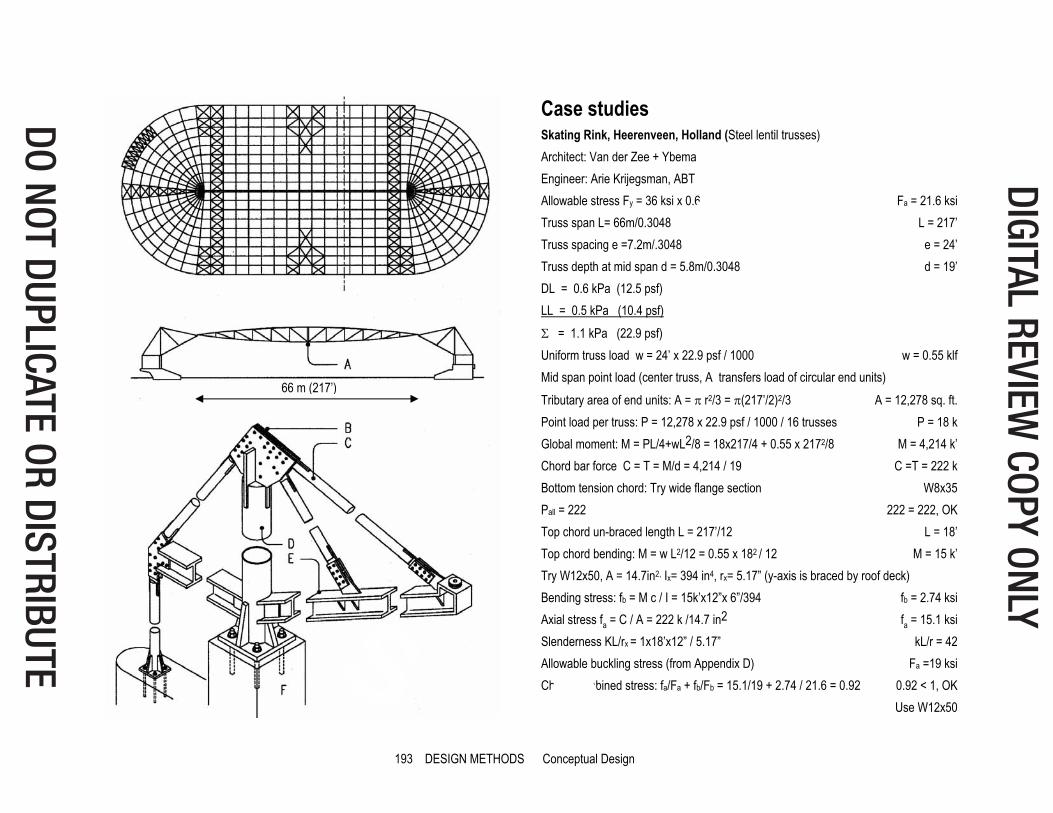
Case studies
Skating Rink, Heerenveen, Holland (Steel lentil trusses) Architect: Van der Zee + Ybema Engineer: Arie Krijegsman, ABT Allowable stress Fy = 36 ksi x 0.6 Fa = 21.6 ksi Truss span L= 66m/0.3048 L = 217’ Truss spacing e =7.2m/.3048 e = 24’ Truss depth at mid span d = 5.8m/0.3048 d = 19’ DL = 0.6 kPa (12.5 psf) LL = 0.5 kPa (10.4 psf) � = 1.1 kPa (22.9 psf) Uniform truss load w = 24’ x 22.9 psf / 1000 w = 0.55 klf Mid span point load (center truss, A transfers load of circular end units) Tributary area of end units: A = � r2/3 = �(217’/2)2/3 A = 12,278 sq. ft. Point load per truss: P = 12,278 x 22.9 psf / 1000 / 16 trusses P = 18 k Global moment: M = PL/4+wL2/8 = 18x217/4 + 0.55 x 2172/8 M = 4,214 k’ Chord bar force C = T = M/d = 4,214 / 19 C =T = 222 k Bottom tension chord: Try wide flange section W8x35 Pall = 222 222 = 222, OK Top chord un-braced length L = 217’/12 L = 18’ Top chord bending: M = w L2/12 = 0.55 x 182 / 12 M = 15 k’ Try W12x50, A = 14.7in2, Ix= 394 in4, rx= 5.17” (y-axis is braced by roof deck) Bending stress: fb = M c / I = 15k’x12”x 6”/394 fb = 2.74 ksi Axial stress fa = C / A = 222 k /14.7 in2 fa = 15.1 ksi Slenderness KL/rx = 1x18’x12” / 5.17” kL/r = 42 Allowable buckling stress (from Appendix D) Fa =19 ksi Check combined stress: fa/Fa + fb/Fb = 15.1/19 + 2.74 / 21.6 = 0.92 0.92 < 1, OK Use W12x50
66 m (217’)

194 DESIGN METHODS Conceptual Design
1 2
3
Exhibit Hall 26 Hanover Architect: Thomas Herzog Engineer: Schlaich Bergermann 1 Axon 2 Cross section 3 Vector diagram Given: Steel suspender bands 30x400 mm (1.2x16”), spaced 5.5 m (18’) LL = 0.5 kN/m2(10 psf) DL = 1.2 kN/m2(25 psf) � = 1.7 kN/m2(35 psf) Uniform load: w = 1.7 kN/m2 x 5.5 m w = 9.35 kN/m Global moment: M = w L2 / 8 = 9.35 x 642 / 8 M = 4787 kN-m Horizontal reaction: H = M / f = 4787 / 7 H = 684 kN Max vertical reaction: R/H = (2f+h/2) / (L/2), hence R = H (2f+h/2) / (L/2) = 684 (2x7+13/2) / (64/2) 438 kN Max suspender tension: T = (H2 + R2)1/2 = (684 2 + 438 2 )1/2 T = 812 kN Suspender stress: f = T / A = 1000x812 / (30x400) f = 67.7 MPa US unit equivalent: f = 67.7 kPa x 0.145 f = 9.8 ksi 9.8 < 22 ksi, OK Graphic method � Draw a vector of the total vertical load � Equilibrium vectors parallel to support tangents give cable forces � Equilibrium vectors at supports give H and R reactions. Note: The unequal support height is a structural disadvantage since the horizontal reactions of adjacent bays don’t balance, but it provides lighting and ventilation. The roof consists of prefab wood panels filled with gravel to resist wind uplift. Curtain wall mullions at the roof edge are pre-stressed between roof and footing to prevent buckling under roof deflection. In width direction the roof is slightly convex for drainage, which also gives the interior roof line a pleasing spatial form.

205 DESIGN METHODS Conceptual Design
V = 122 k
Braced frame (Design ground floor and fourth floor)
Eight story braced frame: high strength steel, Fy = 50 ksi Fa = Fb = 30 ksi Gravity load Column Beam DL 70 psf 70 psf LL 50x0.4 = 20 psf 50x0.6 = 30 psf Total DL+LL 90 psf 100 psf Average wind pressure P = 30 psf
Beam load: w = 100 psf x 30’/1000 w = 3 klf Column load (per foot on beam): w = 90 psf x 30’/1000 w = 2.7 klf Base shear: V = 30 psf x 45 x 90’/1000 V = 122 k Overturn moment: Lever arm (to floor level for braced frame) L = (8x12’-6’)/2+6’ L = 51’ M0 = V L = 122 k x51’ M0 = 6,222 k’
Column and brace axial forces Post Plateral = M0/30’ Pgravity = n w Atributary � P a & d P = 0 P = 8x2.7x15 = 324 k 324 k b & c P = 6,222 k’/30’ = 207 k P = 8x2.7x30 = 648 k 855 k Brace See vectors (tension & compression, design for compression) 78 k
Post and brace design (K = 1 for pin joints)
Post Force P KL length (K=1) Use Pallowable vs. P a & d 324 k 12’ W14x61 410 > 324 b & c 855 k 12’ W14x120 919 > 855 Brace 78 k L = (122+152)1/2 = 20’ TS6x6x5/16 93 > 78
Beam design Bending moment: M = wL2/8 = 3 klf x 302/8 M = 338 k’ Section Modulus: S = M/Fb = 12” x 338 k’ / 30 ksi S = 135 in3 Use W18x76 146 > 135 Deflection � = (5/384) W L3/ (E I) � = (5/384) (3x30) (30x12)3/ (30,000x1330) � = 1.37” Allowable � = L/240 = (30’x12”)/240 = 1.5 1.5 > 1.37, ok Note: ignore support of inner beam since lateral and gravity load may act jointly
Gravity tributary width = 30’
Wind tributary width = 45’
51’

215 DESIGN METHODS Conceptual Design
Moment frame (with joint numbers and member names)
Load diagram (uniform beam load, lateral point load)
Hexagonal grid shell dome
Computer aided design Advances in software have made structural design and analysis by computer widely available. The theory and algorithm of structural design programs is beyond the scope of this book. However, a brief introduction clarifies their potential and use.
Structure programs generate and solve a stiffness matrix of the structure. Based on the degree of freedom of joints, the output provides stress and strain. A two-dimensional truss with pin joints has two degrees of freedom and thus two unknowns per joint, X and Y-displacement. A three-D truss has three unknowns per joint. Two-D frames have four unknowns, X, Y-displacement and X, Y-rotation, but three-D frames have six unknowns per joint, X, Y, Z-displacement and X, Y, Z-rotation.
In some programs, the input is defined by joints, or members connecting the joints and loads. Joints of three-D structures are defined by X, Y, Z-coordinates, joint type (pin or moment joint), and degree of freedom, regarding X, Y Z-displacement and X, Y, Z-rotation. Joints attached to the ground are also defined. Members are defined by properties, cross section area, moment of inertia, and modulus of elasticity. Some members may have end release at one or both ends, to allow pin joints of braces to connect to moment joints of beam to column, for example. End releases are simulated by a pin adjacent to the moment joint. The geometry of a structure may be defined in the analysis program or imported as a DFX file from a CAD program. Loads are defined as distributed or point load. Gravity load is usually assigned as uniform beam load. Lateral wind or seismic loads are usually assigned as point loads at each level.
Output includes force, stress, and deformation of members, joint displacement and rotation, as well as support reactions. Output may be in tables and/or graphic display. Graphic display provides better intuitive understanding and is more convenient to use.
Some programs simulate non-linear material and/or non-linear geometric behavior. Non-linear material may include plastic design of steel with non-linear stress/strain relation. Non-linear geometric analysis is for structures with large deformations, like cable or membrane structures. Non-linear analysis usually involves an iterative algorithm that converges after several iterations to a defined accuracy. Some programs include prestress elements for form-finding for membrane structures. Some programs provide dynamic 4-D analysis. Programs with advanced features provide greater versatility and accuracy but may be more complex to use.
Multiframe-4D used for the demonstrations features 2-D and 3-D static and 4-D dynamic analysis. Multiframe is very user friendly, intuitive, and good for architecture students. The program has tables with steel sections for the US and several other countries. The program features US and SI units.

216 DESIGN METHODS Conceptual Design
Output display Output includes member force, stress, deformation, joint displacement and rotation, as well as support reactions, all as numeric tables and color graphs. Clicking any member or joint provides detailed information. Force and stress include axial, bending, shear, as well as combined axial and bending stress. Based on the output, members may be resized in proportion to stress or strain. Animation allows correlation of deformation visualization with force or stress patterns. . Bending stress Axial stress Shear stress Deflection with colored stress (also available in animation mode)
217 DESIGN METHODS Conceptual Design
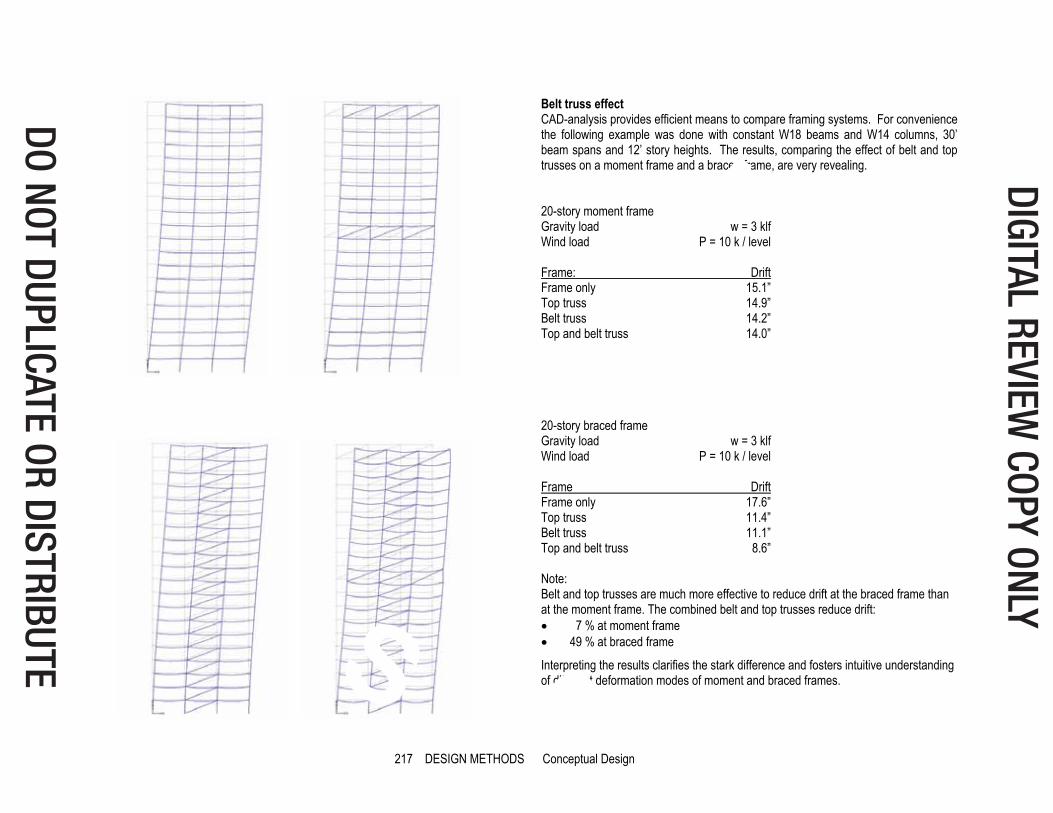
Belt truss effect CAD-analysis provides efficient means to compare framing systems. For convenience the following example was done with constant W18 beams and W14 columns, 30’ beam spans and 12’ story heights. The results, comparing the effect of belt and top trusses on a moment frame and a braced frame, are very revealing. 20-story moment frame Gravity load w = 3 klf Wind load P = 10 k / level Frame: Drift Frame only 15.1” Top truss 14.9” Belt truss 14.2” Top and belt truss 14.0” 20-story braced frame Gravity load w = 3 klf Wind load P = 10 k / level Frame Drift Frame only 17.6” Top truss 11.4” Belt truss 11.1” Top and belt truss 8.6” Note: Belt and top trusses are much more effective to reduce drift at the braced frame than at the moment frame. The combined belt and top trusses reduce drift: � 7 % at moment frame � 49 % at braced frame
Interpreting the results clarifies the stark difference and fosters intuitive understanding of different deformation modes of moment and braced frames.
221 HORIZONTAL SYSTEMS Bending Resistant
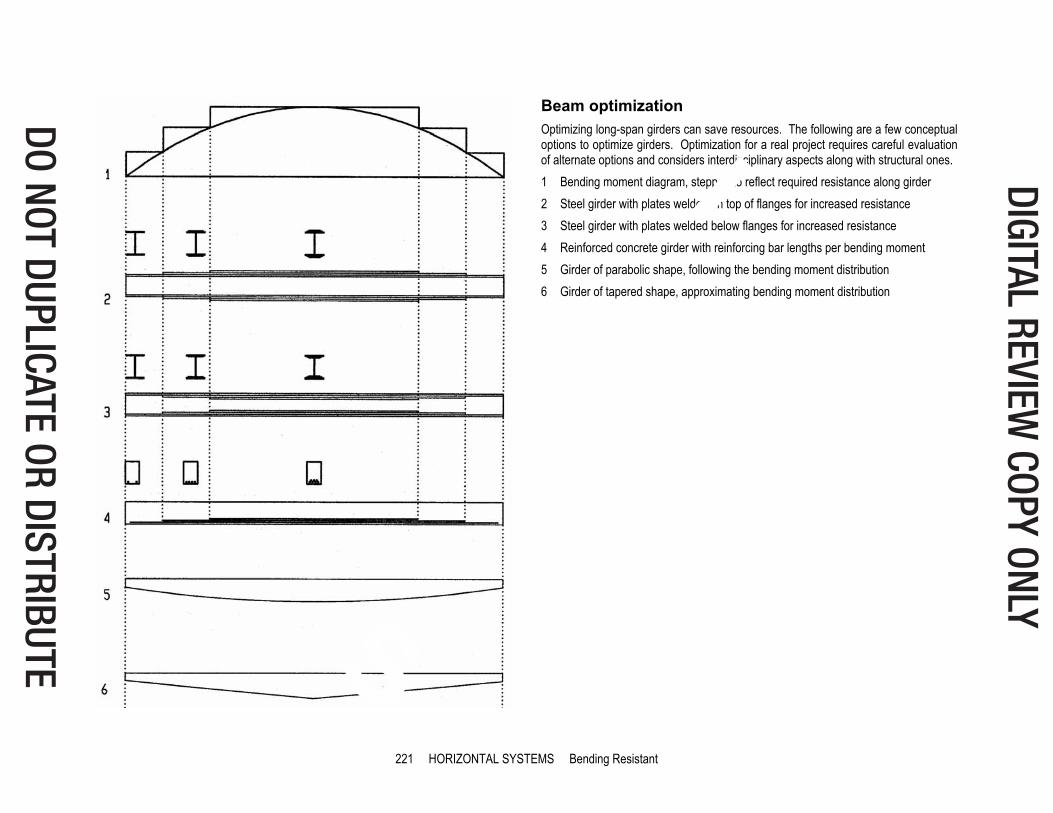
Beam optimization Optimizing long-span girders can save resources. The following are a few conceptual options to optimize girders. Optimization for a real project requires careful evaluation of alternate options and considers interdisciplinary aspects along with structural ones. 1 Bending moment diagram, stepped to reflect required resistance along girder 2 Steel girder with plates welded on top of flanges for increased resistance 3 Steel girder with plates welded below flanges for increased resistance 4 Reinforced concrete girder with reinforcing bar lengths per bending moment 5 Girder of parabolic shape, following the bending moment distribution 6 Girder of tapered shape, approximating bending moment distribution
222 HORIZONTAL SYSTEMS Bending Resistant
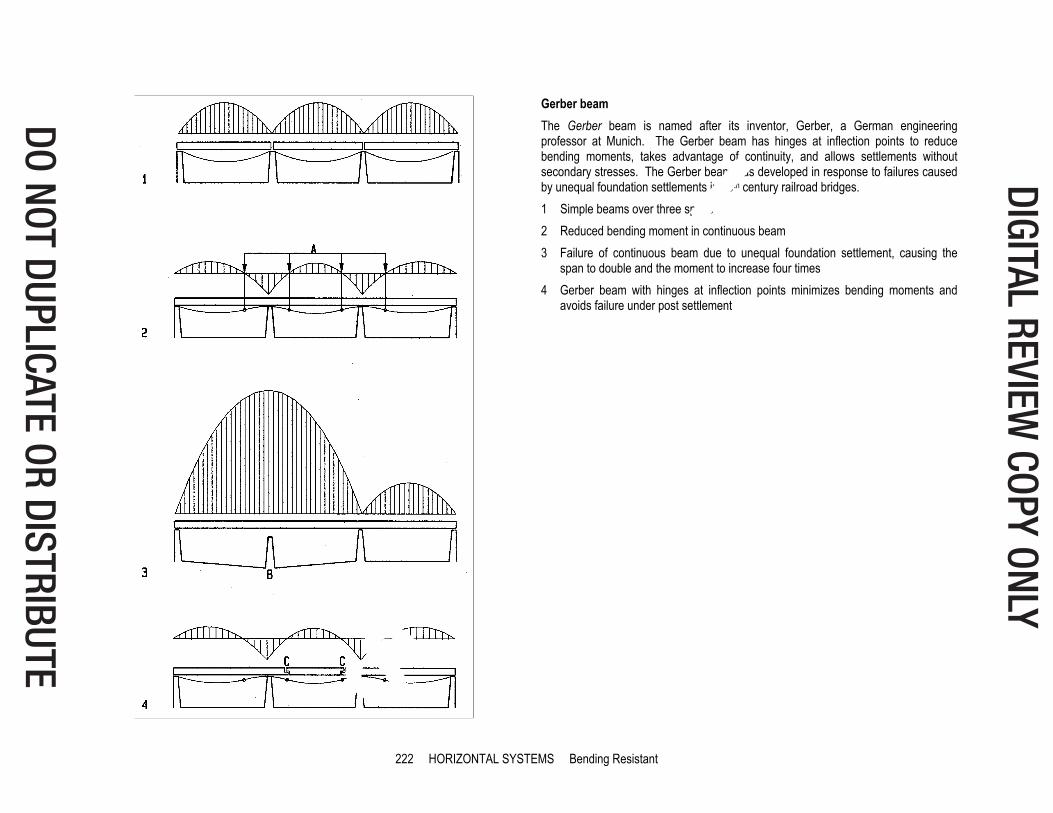
Gerber beam The Gerber beam is named after its inventor, Gerber, a German engineering professor at Munich. The Gerber beam has hinges at inflection points to reduce bending moments, takes advantage of continuity, and allows settlements without secondary stresses. The Gerber beam was developed in response to failures caused by unequal foundation settlements in 19th century railroad bridges. 1 Simple beams over three spans 2 Reduced bending moment in continuous beam 3 Failure of continuous beam due to unequal foundation settlement, causing the
span to double and the moment to increase four times 4 Gerber beam with hinges at inflection points minimizes bending moments and
avoids failure under post settlement

257 HORIZONTAL SYSTEMS Axial Resistant
Prismatic modules Space trusses can have many configurations and base modules. Prismatic modules have equal top and bottom layers and vertical boundaries. The best module choice depends on plan layout as well as economic and structural considerations. Triangular modules fit triangular and hexagonal plans and provide diaphragm shear resistance. 1 Square modules with diagonal braces in vertical panels 2 Triangular modules with diagonal braces 3 Triangular modules with k-braces
Offset modules Offset modules have matching top and bottom layouts, offset in one or both directions and connected by diagonal web bars. Modules offset in one direction have two sloping boundaries; those offset in two directions have four sloping boundaries. 1 Modules of triangular section, with diagonal braces in sloping panels 2 Tetrahedral and semi-octahedral modules forming offset square grids 3 Tetrahedral and octahedral modules forming offset equilateral triangle grids
267 HORIZONTAL SYSTEMS Axial Resistant
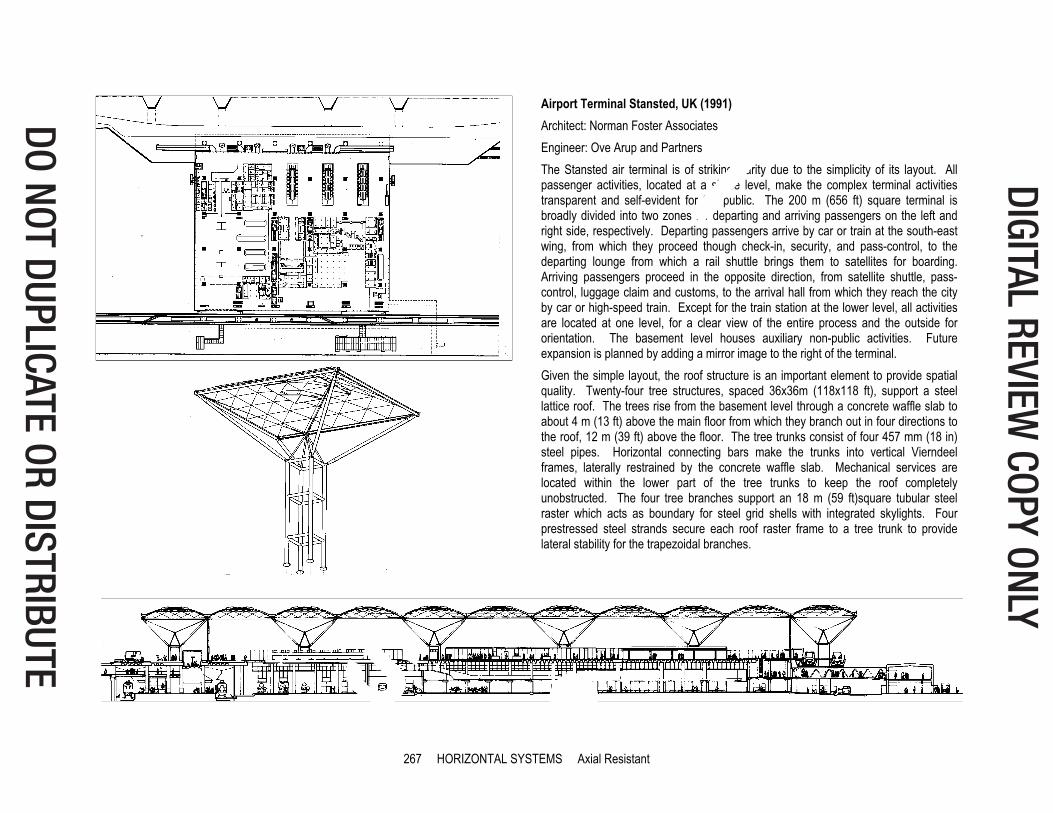
Airport Terminal Stansted, UK (1991) Architect: Norman Foster Associates Engineer: Ove Arup and Partners The Stansted air terminal is of striking clarity due to the simplicity of its layout. All passenger activities, located at a single level, make the complex terminal activities transparent and self-evident for the public. The 200 m (656 ft) square terminal is broadly divided into two zones for departing and arriving passengers on the left and right side, respectively. Departing passengers arrive by car or train at the south-east wing, from which they proceed though check-in, security, and pass-control, to the departing lounge from which a rail shuttle brings them to satellites for boarding. Arriving passengers proceed in the opposite direction, from satellite shuttle, pass-control, luggage claim and customs, to the arrival hall from which they reach the city by car or high-speed train. Except for the train station at the lower level, all activities are located at one level, for a clear view of the entire process and the outside for orientation. The basement level houses auxiliary non-public activities. Future expansion is planned by adding a mirror image to the right of the terminal. Given the simple layout, the roof structure is an important element to provide spatial quality. Twenty-four tree structures, spaced 36x36m (118x118 ft), support a steel lattice roof. The trees rise from the basement level through a concrete waffle slab to about 4 m (13 ft) above the main floor from which they branch out in four directions to the roof, 12 m (39 ft) above the floor. The tree trunks consist of four 457 mm (18 in) steel pipes. Horizontal connecting bars make the trunks into vertical Vierndeel frames, laterally restrained by the concrete waffle slab. Mechanical services are located within the lower part of the tree trunks to keep the roof completely unobstructed. The four tree branches support an 18 m (59 ft)square tubular steel raster which acts as boundary for steel grid shells with integrated skylights. Four prestressed steel strands secure each roof raster frame to a tree trunk to provide lateral stability for the trapezoidal branches.

273 HORIZONTAL SYSTEMS Form Resistant
Load and form The correlation between load and form is visualized, comparing the funicular lines of uniform and asymmetric loads on a cable and arch. Under any load a suspended cable assumes the form of the bending moment of a beam of equal load and support, which is also the inverse funicular pressure line of an arch under identical load. Following the funicular curve eliminates bending in arches because the horizontal reaction force multiplied by the arch depth as lever-arm generates a resisting moment as substitute for the beam bending moment. As the lever-arm increases with arch depth or cable sag, so does the resisting capacity. The shape and forces of the funicular line can be found by polar vectors. Starting with load and reaction vectors, the polygon is drawn, assuming support tangent slopes which are defined by arch depth or cable sag. The polar vectors connecting the intersection of the support tangents and the load vectors create a polar polygon. Slope and length of each vector represent slope and magnitude of the respective link on the funicular line. For asymmetric load the reactions must be found prior to graphing the polygon. They can be computed by moment equilibrium or graphic method. Uniform load, distributed horizontally, results in a symmetric polygon and parabolic funicular line for both cable and arch. Asymmetric load results in asymmetric polygons and funicular lines. Deviation of the funicular line from a rigid arch generates arch bending. This bending moment is the product of the arch force at any given point and the internal lever-arm e. The lever-arm e is the distance between the arch centerline and the funicular line representing the natural force flow. 1 Polar polygon of parabolic cable 2 Parabolic funicular cable under uniform load 3 Polar polygon of parabolic funicular arch 4 Parabolic funicular arch under uniform load 5 Polar polygon of asymmetrically loaded cable 6 Funicular cable under asymmetric load 7 Polar polygon of asymmetrically loaded arch 8 Funicular arch under asymmetric load 9 Global moment of horizontal couple M = H d 10 Arch bending moment M = F e, caused by offset of arch from funicular line

295 HORIZONTAL SYSTEMS Form Resistant
US Pavilion Expo 67 Montreal (1967) Architect: Buckminster Fuller and Shoji Sadao The 250 foot (76 m) diameter by 200 foot (61 m) high dome roughly presents a three-quarter sphere, whereas geodesic domes before 1967 were hemispherical. The dome consists of steel pipes and 1,900 acrylic panels. To keep the indoor temperature acceptable, the design included mobile triangular panels that would move over the inner surface following the sun. Although brilliant on paper, this feature was too advanced for its time and never worked properly. Instead, valves in the centre of acrylic panels provided ventilation.

301 HORIZONTAL SYSTEMS Form Resistant
St. Mary’s Cathedral, Tokyo (1964) Architect: Kenzo Tange Engineer: Yoshikatsu Tsuboi St. Mary’s cathedral replaced the old cathedral, built in 1889 and destroyed in 1945 The new edifice is the result of an invited design competition won by Kenzo Tange in 1961. It is designed for a seating capacity of 1,500. Rising from a rhomboidal plan of 3650 m2 (39285 ft2), four HP shells transform into a cruciform roof, 39.4 m (129 ft) high, visually separated by skylights with a concrete cross at the central intersection of all four shells. The skylights are merged with vertical glass bands on four corners. The symbolic cross form is in synergetic relation with the anticlastic shell geometry and creates a space of serene spirituality and stately exterior. Rectangular low-rise housing tracts on two sides contrast with the sweeping shell forms. The cathedral steps up from entrance halls with baptistery and crypts, to lateral isles, flanking the main nave. The skylight bands provide natural lighting and reinforce spatial identities. The HP shells over the main nave feature exposed concrete. The shells are clad with stainless steel for a lasting radiant finish. 1 Section/elevation 2 Roof plan A Main nave B Lateral isles C Entries Photo courtesy Max Groenendijk

314 HORIZONTAL SYSTEMS Tensile Resistant
Millau viaduct (2004) Architect: Norman Foster Engineer: Michel Virlogeux and Ove Arup The Millau viaduct is the tallest vehicular bridge in the world, connecting Paris with the south of France via the A-75 highway through the Grand Massive, the same mountain range bridged by Eiffel’s Garabit railroad viaduct. The Millau Viaduct consists of eight spans supported by seven concrete pylons. The viaduct is 2,460 m (2,625 yd) long, 32 m (105 ft) wide, and 4.2 m (14 ft) deep. The six center spans are 342 m (122 ft) and the two end spans are only 204 m (669 ft). The roadway slopes 3% from north to south and is slightly curved at 20,000 m (21,872 yd) radius. Each direction has two lanes of traffic and one safety lane. The pylons range in height from 77 to 246 m (253 to 807 ft) from ground to deck and taper in longitudinal section from 24.5 m (80 ft) at the base to 11 m (36 ft) at the deck. Measured from ground to the very top, the tallest pylon is 345 m (1132 ft) high, slightly taller than the Eiffel tower in Paris. Propped bridge This propped bridge in southern France features a thin road bed, supported by a single tension rod and triangular struts. The triangular struts provide some rotational stability. The rod tension is resisted by road bed compression, thus providing an internally stabilized system without need to resist lateral thrust at the bridge supports.

323 HORIZONTAL SYSTEMS Tensile Resistant
Recycling hall, Vienna (1981) Architect: L. M. Lang Engineer: Natterer and Diettrich This recycling center features a tent-like wood structure of 170 m (560 ft) diameter and 67 m (220 ft) height, supported by a central concrete mast. The suspended wood roof consists of 48 radial laminated ribs that span from outer concrete pylons with wood compression ring to the mast top. The ribs carry uniform roof load in tension but asymmetrical loads may cause bending stress in the radial ribs that are designed as semi-rigid tension bands with some bending resistance capacity. Diagonal boards form the roofing membrane and add shear resistance to the assembly of ribs and ring beams. The cylindrical concrete support mast cantilevers from a central foundation. It was designed to resist asymmetrical erection loads and to contribute to lateral wind load resistance. The peripheral pylons are triangular concrete walls with metal brackets to secure the radial ribs. 1 Cross section 2 Roof plan 3 Top of central support mast 4 Tension rib base support A Radial laminated wood tension rib, 20x80-110 cm (7.8x32-43 in) B Laminated wood ring beams, 12x39 cm (5x15 in) C Wood joists D Steel tension ring E Steel anchor bracket
353 VERTICAL SYSTEMS General Background
PART V
VERTICAL SYSTEMS Vertical structures are presented in four categories, considering primary resistance to load: shear, bending, axial, and suspended (tensile). Although most structures combine several categories, one usually dominates. For example, axially stressed braced frames may also have moment resistant joints, yet the bracing resist most lateral load.
15
VERTICAL SYSTEMS General Background Vertical structures have been a challenge since the famed tower of Babylon. Motivations to build tall structures include: a desire to reach toward heaven or see the world from above; the prestige of being tallest; and high land costs. The tallest church tower in Ulm, Germany exemplifies the spiritual motivation. The Eiffel tower allows seeing Paris from above. The towers of the Italian hill-town San Gimignano and contemporary corporate office buildings express power and wealth; the latter are also motivated by high land cost. Height limitations by traditional building materials like wood and masonry were overcome by new materials like steel and prestressed concrete. The Eiffel tower in Paris marks the beginning of tall steel towers. Prestressed concrete towers were pioneered in 1955 by Fritz Leonhard with a television tower in Stuttgart.

392 VERTICAL SYSTEMS Bending Resistant
CBS Tower New York (1961-65) Architect: Eero Saarinnen Engineer: Paul Weidlinger The 38-story CBS tower is a stark vertical extrusion of the rectangular floor plan. Columns forming a framed tube are expressed as triangular extrusions on the upper floors and diamond shapes on the ground floor. The triangular columns include niches for mechanical ducts and pipes. The niches decrease from top to bottom with decreasing duct sizes that run down from the mechanical top floor. This results in increasing net column size that coincides with increasing load as it accumulates from top down. Concrete floors span between the walls of a central core and the framed tube, providing a column-free donut-shape floor area for flexible use. The four sides facing the core feature one-way rib slabs; the four corners have two-way waffle slabs, designed to make the transition from one direction to the other. Clad in black granite, the closely spaced triangular posts express a stark verticality, perforated with windows on all but the top and ground floors. The top mechanical floor has ventilation louvers instead of windows; the ground floors have taller windows and doors. The articulation of top and bottom of the façade emphasizes the most prominent part of the building, a strategy often used for the design of tall buildings. Floor plan: 155x125 feet (47x38 m) Height: 494 feet (151 m) Typical story height: 12 feet (3.66 m) Floor-to-ceiling height: 8.75 feet (2.67 m) Height/width ratio 3.9 A Column profile at top floor B Column profile at lower floors C Column profile at ground floor

404 VERTICAL SYSTEMS Axial Resistant
1 First Wisconsin Center MIlwaukee (1973) Architect/Engineer: SOM
The 40-story tower rises 601 feet (183 m) above a two-story base. The structure combines a framed tube with braced core and belt/outrigger trusses at the 15th and top levels that tie exterior posts to one another and the braced core. The belt/outrigger trusses reduce lateral drift about 30 percent. Although the belt trusses would have been more effective at mid-height, the selected height was an aesthetic decision, to accentuate the verticality of the building. The belt truss at the base does not reduce drift but transfers column load. The column spacing of 20 feet (6 m) is unusually wide for a framed tube. Floor plan: 200x80 feet (61x24 m) Height: 40 stories, 601 feet (183 m) Typical story height: 12’-10” (3.9 m) Height/width ratio 7.5 2 Olympic Hotel de Las Artes, Barcelona (1992) Architect/Engineer: SOM The 44-story hotel de Las Artes of 36 m square plan and 154 m height features a unique steel structure pulled 1.5 m away from the building skin for fire protection without conventional sprayed-on fire proofing, based on a fire simulation study. This allowed clear expression of the steel structure with all its crisp details. The structure consists of three bays in both directions. The two outer bays are braced with X-braces extending over four stories. Four-story high top and belt trusses reduce maximum lateral drift on top to 1/3 from 643 mm to only 218 mm. The hotel with panoramic views of the sea and the city has 482 rooms which include 44 executive suites and 27 duplex luxury apartments of one, two or three bedrooms. The building was built as part of the urban transformation plan to create a village for the 1992 Olympic Games. Floor plan: 36 m x 36 m (119’x119 ft) Height: 40 stories, 139 m (456 ft) Typical story height: 3 m (9.8 ft) Height/width ratio 3.86
406 VERTICAL SYSTEMS Axial Resistant
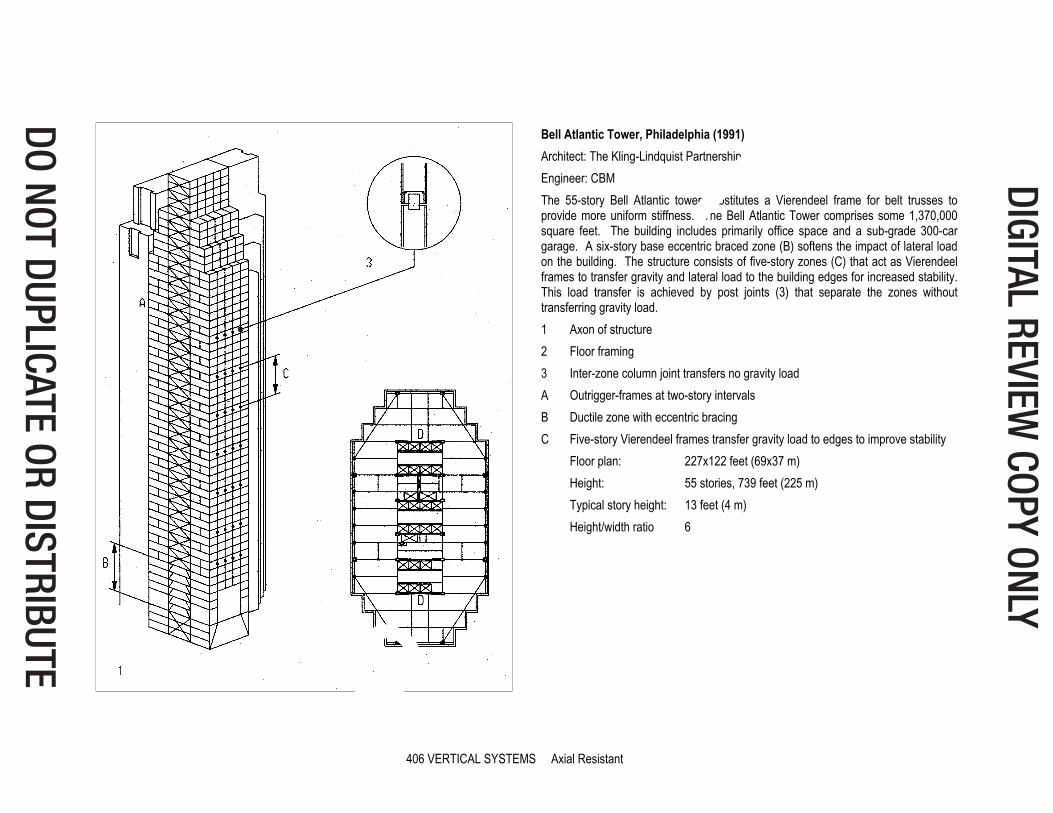
Bell Atlantic Tower, Philadelphia (1991) Architect: The Kling-Lindquist Partnership Engineer: CBM The 55-story Bell Atlantic tower substitutes a Vierendeel frame for belt trusses to provide more uniform stiffness. The Bell Atlantic Tower comprises some 1,370,000 square feet. The building includes primarily office space and a sub-grade 300-car garage. A six-story base eccentric braced zone (B) softens the impact of lateral load on the building. The structure consists of five-story zones (C) that act as Vierendeel frames to transfer gravity and lateral load to the building edges for increased stability. This load transfer is achieved by post joints (3) that separate the zones without transferring gravity load. 1 Axon of structure 2 Floor framing 3 Inter-zone column joint transfers no gravity load A Outrigger-frames at two-story intervals B Ductile zone with eccentric bracing C Five-story Vierendeel frames transfer gravity load to edges to improve stability Floor plan: 227x122 feet (69x37 m) Height: 55 stories, 739 feet (225 m) Typical story height: 13 feet (4 m) Height/width ratio 6

537 MATERIAL Concrete
Prestressed concrete Prestress avoids cracks, reduces depth and dead weight, or increases the span. Comparison with a non-prestressed beam clarifies this effect. In a simply supported non-prestressed beam, the bottom rebars elongate in tension and concrete cracks. In prestressed concrete, tendons (high-strength strands) replace re-bars. The tendons are pulled against concrete to compress it before service load is applied. Service load increases the tension in tendons and replaces concrete tension by reduced compression. Avoiding tensile stress in concrete avoids cracks that may cause corrosion in rebars due to moisture. Prestress tendons can emulate the bending moment form to balance service load and reduce deflection. Combined with higher strength concrete, this allows longer span or reduced beam depth. Pre-tensioning and post-tensioning are two methods to prestress concrete. They are based on patents by Doehring (1886) and Jackson (1888); yet both were unsuccessful due to insufficient stress that dissipated by creep. Doehring stressed wires before casting the concrete, and Jackson used turnbuckles to stress iron rods after the concrete had cured. Subsequent experiments by others led to the first successful empirical work by Wettstein in 1921 and the first theoretical study by French engineer Eugene Freyssinet during 1920, followed by his practical development. In 1961 the US engineer T Y Lin pioneered prestress tendons that follow the bending diagram to balance bending due to load. Lin’s method controls deflections for any desired load, usually dead load and about half the live load. By his method, before live load is applied a beam (or slab) bows upward. Under full load, it deflects and under partial live load it remains flat. Diagram 5 illustrates this concept for a simple beam. 1 Simply supported beam without prestress, cracked at the tensile zone 2 Prestress beam with concentric tendon deflects under service load 3 Prestress beam with eccentric tendon pushes up without service load 4 Same beam as 3 above with service load bending moment balanced 5 Prestress beam with parabolic tendon to balance bending moment A Bending stress: top concrete compression and bottom steel tension B Prestress uniform due to concentric tendon C Prestress with greater compression near tendon at bottom D Prestress of eccentric tendon: bottom compression and top tension E Service load stress: top compression and bottom tension F Combined stress of prestress plus service load stress G Combined stress with uniform distribution due to balanced moments
540 MATERIAL Concrete
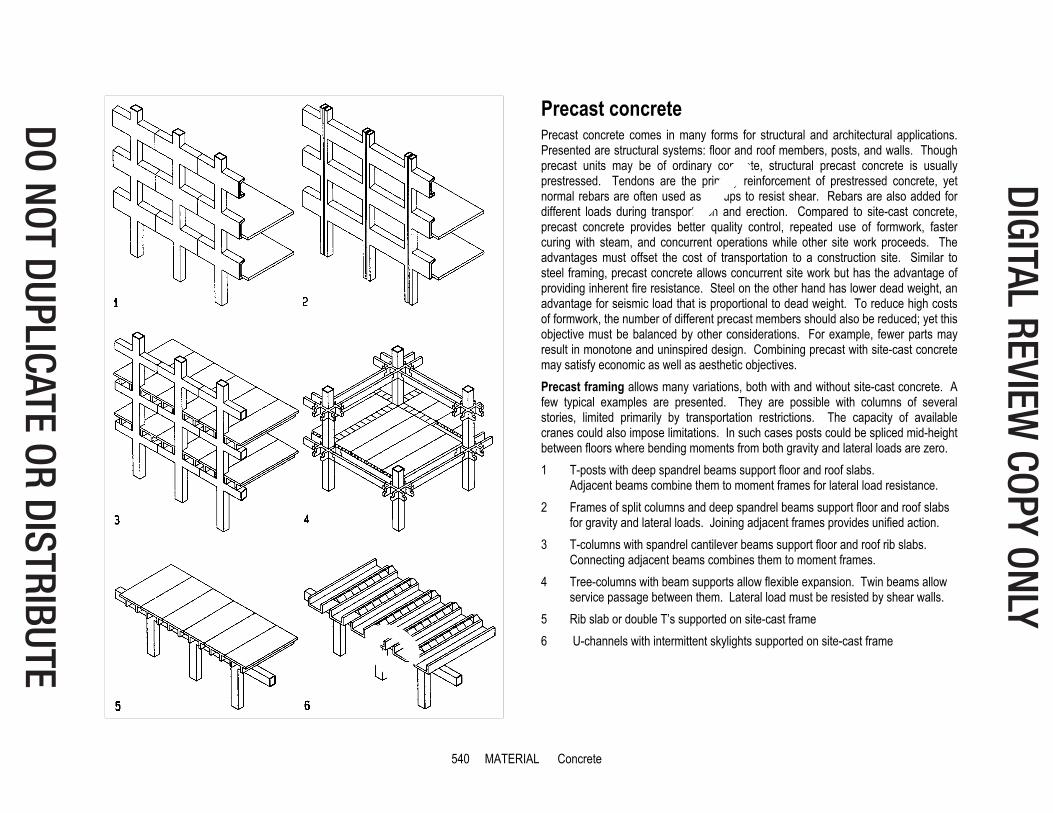
Precast concrete Precast concrete comes in many forms for structural and architectural applications. Presented are structural systems: floor and roof members, posts, and walls. Though precast units may be of ordinary concrete, structural precast concrete is usually prestressed. Tendons are the primary reinforcement of prestressed concrete, yet normal rebars are often used as stirrups to resist shear. Rebars are also added for different loads during transportation and erection. Compared to site-cast concrete, precast concrete provides better quality control, repeated use of formwork, faster curing with steam, and concurrent operations while other site work proceeds. The advantages must offset the cost of transportation to a construction site. Similar to steel framing, precast concrete allows concurrent site work but has the advantage of providing inherent fire resistance. Steel on the other hand has lower dead weight, an advantage for seismic load that is proportional to dead weight. To reduce high costs of formwork, the number of different precast members should also be reduced; yet this objective must be balanced by other considerations. For example, fewer parts may result in monotone and uninspired design. Combining precast with site-cast concrete may satisfy economic as well as aesthetic objectives. Precast framing allows many variations, both with and without site-cast concrete. A few typical examples are presented. They are possible with columns of several stories, limited primarily by transportation restrictions. The capacity of available cranes could also impose limitations. In such cases posts could be spliced mid-height between floors where bending moments from both gravity and lateral loads are zero. 1 T-posts with deep spandrel beams support floor and roof slabs. Adjacent beams combine them to moment frames for lateral load resistance. 2 Frames of split columns and deep spandrel beams support floor and roof slabs
for gravity and lateral loads. Joining adjacent frames provides unified action. 3 T-columns with spandrel cantilever beams support floor and roof rib slabs. Connecting adjacent beams combines them to moment frames. 4 Tree-columns with beam supports allow flexible expansion. Twin beams allow
service passage between them. Lateral load must be resisted by shear walls. 5 Rib slab or double T’s supported on site-cast frame 6 U-channels with intermittent skylights supported on site-cast frame

553 MATERIAL Cable and Fabric
Fabric Type
Makeup Common use Tensile strength
Coated fabric*
Polyester fabric PVC coating
Permanent + mobile Internal + external
40 to 200 kN/m 228 to 1142 lb/in
Coated fabric*
Glass fiber fabric PTFE coating
Permanent Internal + external
20 to 160 kN/m 114 to 914 lb/in
Coated fabric
Glass fiber fabric Silicone coating
Permanent Internal + external
20 to 100 kN/m 114 to 571 lb/in
Laminated fabric*
Fine mesh fabric Laminated with PTFE film
Permanent Internal + external
50 to 100 kN/m 286 to 571 lb/in
Foil
PVC foil Permanent internal Temporary external
6 to 40 kN/m 34 to 228 lb/in
Foil*
Flouropolymer foil ETFE
Permanent Internal + external
6 to 12 kN/m 34 to 69 lb/in
Coated or uncoated fabric*
PTFE fabric (good qualities for sustainability)
Permanent + mobile Internal + external
40 to 100 kN/m 228 to 571 lb/in
Coated or uncoated fabric*
Flouropolymer fabric
Permanent + mobile Internal + external
8 to 20 kN/m 46 to 114 lb/in
* Self-cleaning properties SI-to-US unit conversion: 1 kN/m = 5.71 lb/in
Allowable fabric stress (tensile strength / 4) Tensile braking strength Allowable stress
400 pli 100 pli 600 pli 150 pli 800 pli 200 pli
Fire rating ++ incombustible + low flammability 0 none
UV light resistance ++ very good + good
Translucency
Durability
+
+ 0 to 25 % 15 to 20 years
++
++ 4 to 22 % > 25 years
++
++ 10 to 20 % > 20 years
++
++ 35 to 55 % > 25 years
0
+ Up to 90 % 15 to 20 years internally
++
++ Up to 96 % > 25 years
++
++ 15 to 40 % > 25 years
++
++ Up to 90 % > 25 years
Maximum fabric span* Tensile strength Maximum span 500 lb/in 60 ft 1000 lb/in 120 ft * Assuming: Live load = 20 psf, 956 Pa (wind or snow) Safety factor = 4 Fabric span/sag ratio = 10

554 MATERIAL Cable and Fabric
Cables Cables are of two basic types, strand and wire rope, and many variations thereof. Strands have a minimum of six wires twisted helically around a central wire. Strands have greater stiffness and are used for cable stayed and suspension structures. Wire ropes consist of six strands twisted helically around a central strand. They are used where flexibility is desired, such as for elevator cables. Metallic area, the net wire area without air space between wires, defines the cable strength. Relative to the gross cross section area, the metallic area is about 70% for strands and 60% for wire ropes. For extra flexibility, some wire ropes have central cores of plastic or other fibers which further reduce the metallic area. 1 Strand (70% metallic) Good stiffness, low flexibility E = 22,000 to 24,000 ksi 2 Wire rope (60% metallic) (good flexibility, low stiffness) E = 12,000 to 20,000 ksi
Cable fittings Cable fittings for strands and wire ropes may be of two basic types: adjustable and fixed. Adjustable fittings allow length adjustment and pre-stressing by shortening. The amount of adjustment varies from a few inches to about four feet. 3 Bridge Socket (adjustable) 4 Open Socket (non-adjustable) 5 Wedged Socket (adjustable) 6 Anchor Stud (adjustable) A Support elements B Socket / stud C Strand or wire rope