Embed Size (px)
Citation preview
Licentiate DissertationStructural
Mechanics
STRUCTURAL RETROFITTINGOF REINFORCED CONCRETE BEAMS USING CARBON FIBRE REINFORCED POLYMER
YASMEEN TALEB OBAIDAT Report TV
SM-3070
YASM
EEN TA
LEB OBA
IDA
T STRU
CTU
RA
L RETR
OFITTIN
G O
F REIN
FOR
CED
CO
NC
RETE B
EAM
S USIN
G C
AR
BO
N FIB
RE R
EINFO
RC
ED PO
LYM
ER
3070HO_2.indd 1 2010-04-30 13:40:18

Detta är en tom sida!
Copyright © 2010 by Structural Mechanics, LTH, Sweden.Printed by Wallin & Dalholm Digital AB, Lund, Sweden, May, 2010 (Pl).
For information, address:
Division of Structural Mechanics, LTH, Lund University, Box 118, SE-221 00 Lund, Sweden.Homepage: http://www.byggmek.lth.se
Structural MechanicsDepartment of Construction Sciences
ISRN LUTVDG/TVSM--10/3070--SE (1-76)ISSN 0281-6679
STRUCTURAL RETROFITTING
OF REINFORCED CONCRETE BEAMS
USING CARBON FIBRE REINFORCED
POLYMER
YASMEEN TALEB OBAIDAT

Denna sida skall vara tom!
Abstract
This thesis details experimental work and finite element simulations of reinforced concrete
beams retrofitted with carbon fibre reinforced polymer (CFRP). The objectives of this study
were to investigate the behaviour of retrofitted beams experimentally, develop a finite
element model describing the beams, verifying the finite element model against the
experimental results and finally investigating the influence of different parameters on the
behaviour of the retrofitted beams.
The experimental tests were performed to investigate the behaviour of beams designed in
such a way that either flexural or shear failure will be expected. The beams were loaded in
four-point bending until cracks developed. The beams were then unloaded and retrofitted
with CFRP. Finally the beams were loaded until failure. The ABAQUS program was used to
develop finite element models for simulation of the behaviour of beams. The concrete was
modelled using a plastic damage model and two models, a perfect bond model and a cohesive
model, were evaluated for the concrete-CFRP interface. From the analyses the load-
deflection relationships until failure, failure modes and crack patterns were obtained and
compared to the experimental results. The FEM results agreed well with the experiments
when using the cohesive model regarding failure mode and load capacity while the perfect
bond model was not able to represent the debonding failure mode. The results showed that
when the length of CFRP increases the load capacity of the beam increases both for shear and
flexural retrofitting. FEM results also showed that the width and stiffness of CFRP affect the
failure mode of retrofitted beams. The maximum load increases with increased width.
Increased CFRP stiffness increases the maximum load only up to a certain value of the
stiffness, and thereafter it decreases the maximum load.


Acknowledgements
The financial support provided by the Erasmus Mundus External Cooperation Window Lot 3
is greatly acknowledged.
My most grateful appreciation goes to Professor Ola Dahlblom for his knowledgeable
insight and motivating words.
I also feel so lucky and blessed to have Dr. Susanne Heyden as my co-advisor. To me, she
is a role model for living and working.
A special thanks to Dr. Kent Persson for his assistance in using the finite element software
(ABAQUS). I would also like to thank everyone from Structural Mechanics.
Finally, I would especially like to thank my parents, brothers, sisters and close friends for
their love, vote of confidence and support throughout this time. I would also like to share this
moment of happiness with my father and mother.
Yasmeen Taleb Obaidat
Lund in May 2010

Contents
1 Introduction 1
1.1 Background.................................................................................... 1
1.2 Aim and Scope............................................................................... 1
2 Retrofitting of Reinforced Concrete Beams 3
2.1 FRP Material................................................................................... 3
2.2 Application in Retrofitting.............................................................. 4
3 Related Research 7
3.1 Experimental Work......................................................................... 7
3.2 Modelling Work.............................................................................. 9
3.3 Discussion....................................................................................... 10
4 Summary of the Papers 11
5 Conclusions and Future Work 13
5.1 Conclusions..................................................................................... 13
5.2 Future Work.................................................................................... 14
References 15
Appended Papers
Paper A
Retrofitting of Reinforced Concrete Beams using Composite
Laminates.
17
Paper B
The Effect of CFRP and CFRP/Concrete Interface Models when
Modelling Retrofitted RC Beams with FEM.
37
Paper C
Nonlinear FE Modelling of Shear Behaviour in RC Beam Retrofitted
with CFRP.
47
Paper D
FEM Study on the Effect of CFRP Stiffness and Width on Retrofitted
Reinforced Concrete Beam Behaviour.
57

1
1 Introduction
1.1 Background
Reinforced concrete structures often have to face modification and improvement of their
performance during their service life. The main contributing factors are change in their use,
new design standards, deterioration due to corrosion in the steel caused by exposure to an
aggressive environment and accident events such as earthquakes.
In such circumstances there are two possible solutions: replacement or retrofitting. Full
structure replacement might have determinate disadvantages such as high costs for material
and labour, a stronger environmental impact and inconvenience due to interruption of the
function of the structure e.g. traffic problems. When possible, it is often better to repair or
upgrade the structure by retrofitting.
In the last decade, the development of strong epoxy glue has led to a technique which has
great potential in the field of upgrading structures. Basically the technique involves gluing
steel plates or fibre reinforced polymer (FRP) plates to the surface of the concrete. The plates
then act compositely with the concrete and help to carry the loads.
FRP can be convenient compared to steel for a number of reasons. These materials have
higher ultimate strength and lower density than steel. The installation is easier and temporary
support until the adhesive gains its strength is not required due to the low weight. They can be
formed on site into complicated shapes and can also be easily cut to length on site.
This work is a study of the behaviour of concrete beams retrofitted with carbon FRP
(CFRP), using experiments and finite element modelling.
1.2 Aim and Scope
The overall aim of the present study is to investigate and improve the understanding of the
behaviour of reinforced concrete beams retrofitted with CFRP. Experimental tests were
performed to investigate the behaviour of beams designed in such a way that either flexural or
shear failure will be expected. The beams were loaded in four-point bending until cracks
developed. The beams were then unloaded and retrofitted with CFRP. Finally the beams were
loaded until failure. The ABAQUS program was used to develop finite element models for
simulation of the behaviour of beams. From the analyses the load-deflection relationships
until failure, failure modes and crack patterns were obtained and compared to the
experimental results. The models were then used to study how different parameters affect
retrofitted beam behaviour and investigate how CFRP should be applied in order to get
maximum increase of load capacity.


3
2 Retrofitting of Reinforced Concrete Beams
2.1 FRP Material
Fibre reinforced polymer (FRP) composites consist of high strength fibres embedded in a
matrix of polymer resin as shown in Figure 1.
Figure 1: A schematic diagram showing a typical unidirectional FRP plate.
Fibres typically used in FRP are glass, carbon and aramid. Typical values for properties of
the fibres are given in Table 1. These fibres are all linear elastic up to failure, with no
significant yielding compared to steel. The primary functions of the matrix in a composite are
to transfer stress between the fibres, to provide a barrier against the environment and to
protect the surface of the fibres from mechanical abrasion. Typical properties for epoxy are
given in Table 1.
The mechanical properties of composites are dependent on the fibre properties, matrix
properties, fibre-matrix bond properties, fibre amount and fibre orientation. A composite with
all fibres in one direction is designated as unidirectional. If the fibres are woven, or oriented
in many directions, the composite is bi- or multidirectional. Since it is mainly the fibres that
provide stiffness and strength composites are often anisotropic with high stiffness in the fibre
direction(s). In strengthening applications, unidirectional composites are predominantly used,
Figure 1. The approximate stiffness and strength of a unidirectional CFRP with a 65% volume
fraction of carbon fibre is given in Table 1. As a comparison the corresponding properties for
steel are also given.
Adhesives are used to attach the composites to other surfaces such as concrete. The most
common adhesives are acrylics, epoxies and urethanes. Epoxies provide high bond strength
with high temperature resistance, whereas acrylics provide moderate temperature resistance
with good strength and rapid curing. Several considerations are involved in applying
adhesives effectively. Careful surface preparation such as removing the cement paste,
grinding the surface by using a disc sander, removing the dust generated by surface grinding
using an air blower and carful curing are critical to bond performance.
Matrix
Fibre
4
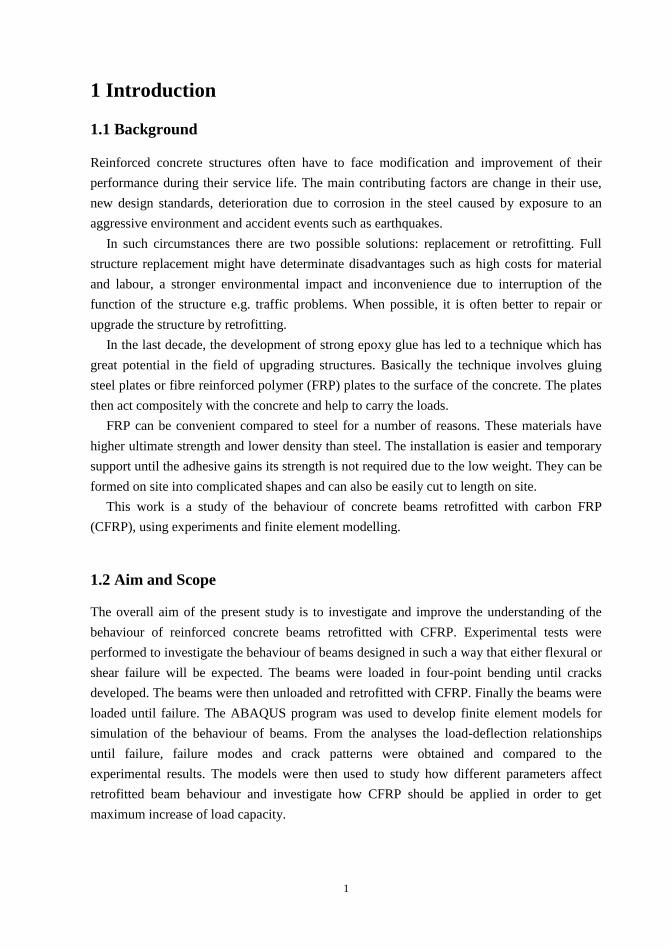
Table 1. Typical strength and stiffness values for materials used in retrofitting, [1].
Material Tensile strength
(MPa)
Modulus of elasticity
(GPa)
Density
(kg/m3)
Modulus of elasticity to
density ratio (Mm2/s
2)
Carbon 2200-5600 240-830 1800-2200 130-380
Aramid 2400-3600 130-160 1400-1500 90-110
Glass 3400-4800 70-90 2200-2500 31-33
Epoxy 60 2.5 1100-1400 1.8-2.3
CFRP 1500-3700 160-540 1400-1700 110-320
Steel 280-1900 190-210 7900 24-27
2.2 Application in Retrofitting
For structural applications, FRP is mainly used in two areas. The first area involves the use of
FRP bars instead of steel reinforcing bars or pre-stressing strands in concrete structures. The
other application, which is the focus of this thesis, is to strengthen structurally deficient
structural members with external application of FRP.
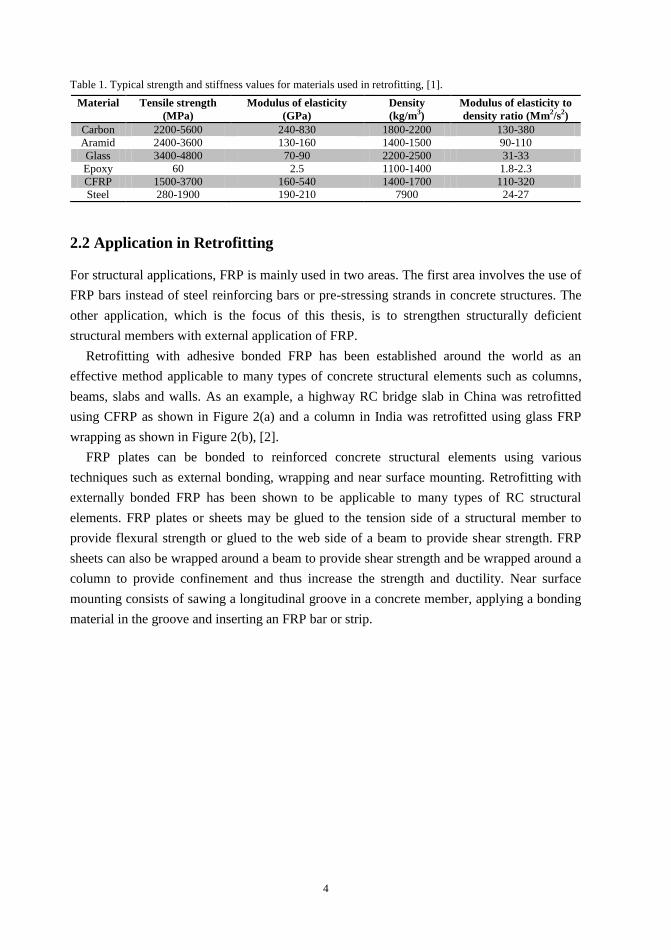
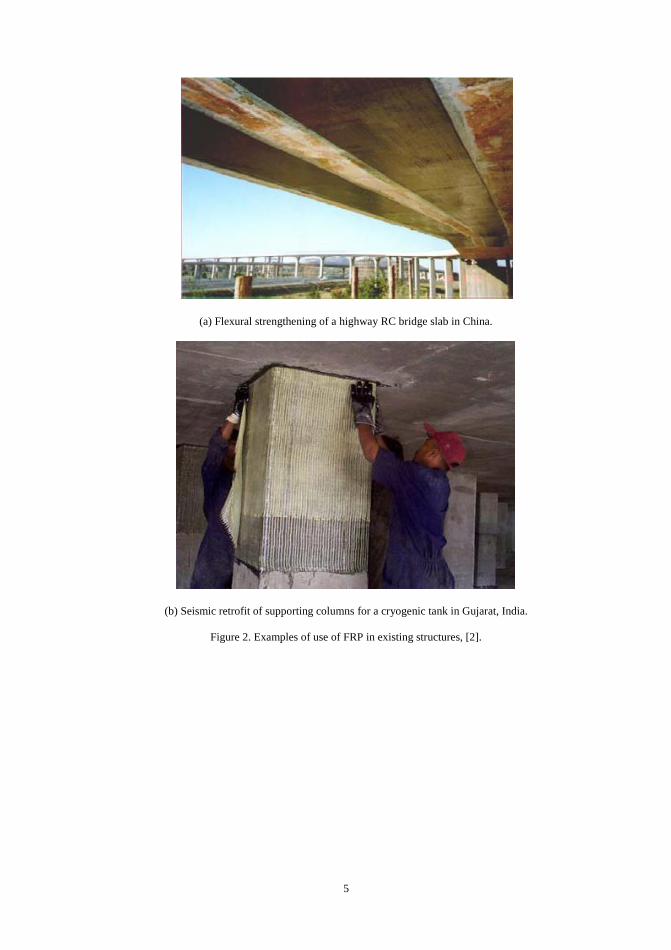
Retrofitting with adhesive bonded FRP has been established around the world as an
effective method applicable to many types of concrete structural elements such as columns,
beams, slabs and walls. As an example, a highway RC bridge slab in China was retrofitted
using CFRP as shown in Figure 2(a) and a column in India was retrofitted using glass FRP
wrapping as shown in Figure 2(b), [2].
FRP plates can be bonded to reinforced concrete structural elements using various
techniques such as external bonding, wrapping and near surface mounting. Retrofitting with
externally bonded FRP has been shown to be applicable to many types of RC structural
elements. FRP plates or sheets may be glued to the tension side of a structural member to
provide flexural strength or glued to the web side of a beam to provide shear strength. FRP
sheets can also be wrapped around a beam to provide shear strength and be wrapped around a
column to provide confinement and thus increase the strength and ductility. Near surface
mounting consists of sawing a longitudinal groove in a concrete member, applying a bonding
material in the groove and inserting an FRP bar or strip.
5
(a) Flexural strengthening of a highway RC bridge slab in China.
(b) Seismic retrofit of supporting columns for a cryogenic tank in Gujarat, India.
Figure 2. Examples of use of FRP in existing structures, [2].


7
3 Related Research
3.1 Experimental Work
Investigation of the behaviour of FRP retrofitted reinforced concrete structures has in the last
decade become a very important research field. In terms of experimental application several
studies were performed to study the behaviour of retrofitted beams and how various
parameters influence the behaviour.
The effect of number of layers of CFRP on the behaviour of a strengthened RC beam was
investigated by Toutanji et al. [3]. They tested simply supported beams with different
numbers of CFRP layers. The specimens were subjected to a four-point bending test. The
results showed that the load carrying capacity increases with an increased number of layers of
carbon fibre sheets.
Investigation of the effect of internal reinforcement ratio on the behaviour of strengthened
beams has been performed by Esfahani et al. [4]. Specimens with different internal steel ratio
were strengthened in flexure by CFRP sheets. The authors reported that the flexural strength
and stiffness of the strengthened beams increased compared to the control specimens. With a
large reinforcing ratio, they also found that failure of the strengthened beams occurred in
either interfacial debonding induced by a flexural shear crack or interfacial debonding
induced by a flexural crack.
A test programme on retrofitted beams with shear deficiencies was done by Khalifa et al.
[5]. The experimental results indicated that the contribution of externally bonded CFRP to the
shear capacity of continuous RC beams is significant.
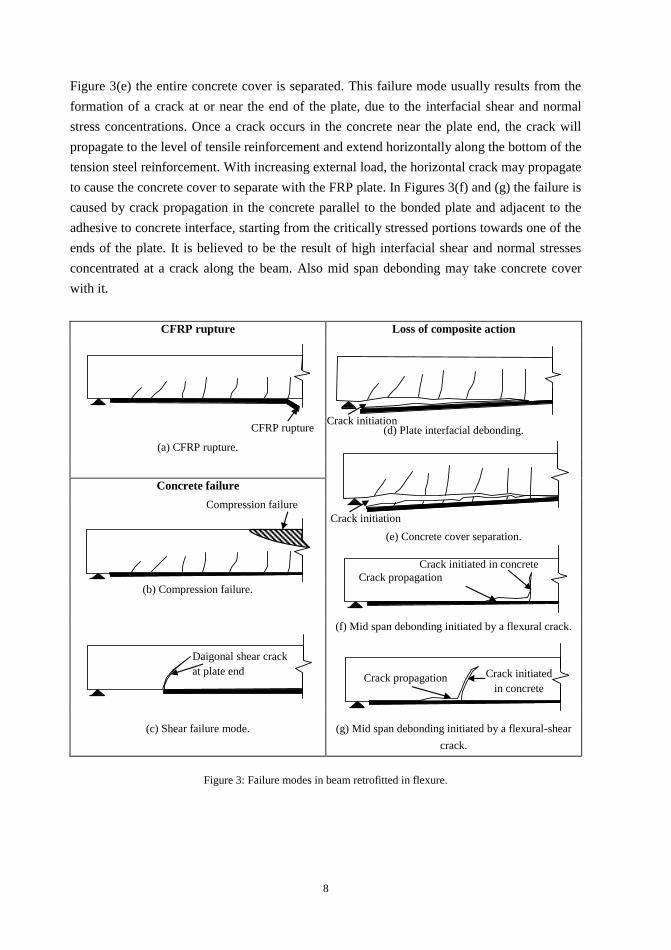
There are three main categories of failure in concrete structures retrofitted with FRP that
have been observed experimentally, Esfahani et al. [4], Ashour et al. [6], Garden and
Hollaway, [7], Smith and Teng, [8]. The first and second type consist of failure modes where
the composite action between concrete and FRP is maintained. Typically, in the first failure
mode, the steel reinforcement yields, followed by rupture of CFRP as shown in Figure 3(a). In
the second type there is failure in the concrete. This type occurs either due to crushing of
concrete before or after yielding of tensile steel without any damage to the FRP laminate,
Figure 3(b), or due to an inclined shear crack at the end of the plate, Figure 3(c). In the third
type, the failure modes involving loss of composite action are included. The most recognized
failure modes within this group are debonding modes. In such a case, the external
reinforcement plates no longer contribute to the beam strength, leading to a brittle failure if no
stress redistribution from the laminate to the interior steel reinforcement occurs. Figures 3(d)-
(g) show failure modes of the third type for RC beams retrofitted with FRP. In Figure 3(d),
the failure starts at the end of the plate due to the stress concentration and ends up with
debonding propagation inwards. Stresses at this location are essentially shear stress but due to
small but non-zero bending stiffness of the laminate, normal stress can arise. For the case in
8
Figure 3(e) the entire concrete cover is separated. This failure mode usually results from the
formation of a crack at or near the end of the plate, due to the interfacial shear and normal
stress concentrations. Once a crack occurs in the concrete near the plate end, the crack will
propagate to the level of tensile reinforcement and extend horizontally along the bottom of the
tension steel reinforcement. With increasing external load, the horizontal crack may propagate
to cause the concrete cover to separate with the FRP plate. In Figures 3(f) and (g) the failure is
caused by crack propagation in the concrete parallel to the bonded plate and adjacent to the
adhesive to concrete interface, starting from the critically stressed portions towards one of the
ends of the plate. It is believed to be the result of high interfacial shear and normal stresses
concentrated at a crack along the beam. Also mid span debonding may take concrete cover
with it.
CFRP rupture Loss of composite action
(a) CFRP rupture.
(d) Plate interfacial debonding.
Concrete failure
(e) Concrete cover separation.
(b) Compression failure.
(f) Mid span debonding initiated by a flexural crack.
(c) Shear failure mode.
(g) Mid span debonding initiated by a flexural-shear
crack.
Figure 3: Failure modes in beam retrofitted in flexure.
Crack propagation
Crack initiated in concrete
CFRP rupture
Compression failure
Crack initiated
in concrete
Crack propagation
Horizantlly
Crack initiation
Crack initiation
Daigonal shear crack
at plate end
9
3.2 Modelling Work
Many models currently exist for reinforced concrete retrofitted with CFRP. Several different
approaches have been considered. Some models use simple material models and are restricted
to 2D and others use nonlinear elasticity or plasticity models to capture the more complicated
effects and predict the behaviour of retrofitted reinforced concrete in a general sense. Each
approach has its strengths, complexity level, and complications.
A 2D model was developed by Supaviriyakit et al. [9] for analyses of RC beams
strengthened with externally bonded FRP plates. The RC element considered the effect of
crack and reinforcing steel as being smeared over the entire element. Perfect compatibility
between cracked concrete and reinforcing steel was assumed. The FRP plate was modelled as
an elastic brittle element. As the epoxy is usually stronger than the concrete, perfect bond
between FRP and concrete was assumed.
The orthotropic properties of FRP were taken into consideration by Hu et al. [10] in
modelling the behaviour of a retrofitted beam. They assumed perfect bond between the CFRP
plate and concrete.
The effect of anchorage length of near surface mounted reinforcement (NSMR) was
studied by Lundqvist et al. [11]. They conducted numerical analyses of three different CFRP
strengthening techniques to find a critical anchorage length, where a longer anchorage length
does not contribute to the load bearing capacity. They assumed perfect bond between the plate
and concrete. The results showed that a critical anchorage length exists for plates and sheets
as well as for NSMR.
Bond is a critical parameter in strengthening systems as it provides the shear transfer
between concrete and FRP necessary for composite action. Lim et al. [12] presented a
numerical model to simulate the interface fracture behaviour of concrete strengthened with
external composite plates. They adapted the fictitious crack model, [13] with a nonlinear
fracture mechanics concept to describe the constitutive relationship at the element level. They
found that the interface material properties had significant influence on the interface stress
distributions. Furthermore, Camata et al. [14], investigated RC members strengthened in
flexure by FRP plates. The model considers the actual crack patterns observed in the test
using a smeared and interface crack model. The results show that debonding and concrete
cover splitting failure mode always occur by crack propagation inside the concrete. A FE
analysis was performed by Neale et al. [15], to simulate the nonlinear behaviour of shear
strengthened beams and two-way slabs. A plasticity–based concrete constitutive model was
used. An elastic–plastic response was assumed for the steel and the CFRP was modelled as
linear elastic until failure. A bond slip model was incorporated to the analysis to simulate the
FRP concrete interface.
10
3.3 Discussion
Even though extensive work has been done on the use of CFRP laminates in retrofitting there
is a need for further refinement of models and further parameter studies. From the above
literature review, it can be concluded that the interface zone has been modelled with linear or
in 2D with non-linear models. The present study comprises a 3D cohesive model which is
believed to better reflect the behaviour of retrofitted beams.
In practical use of retrofitting, the structure is often damaged at the time of retrofitting. To
take account of this, the beams in the experimental study as well as in the simulations were
pre-cracked before retrofitting. This has not been done before in connection with retrofitting
in shear or investigation of influence of CFRP length.
Researchers have reported on different failure modes. It is important to understand under
what circumstances a certain failure mode will occur. To contribute to this understanding, a
parametric study of the influence of CFRP stiffness and width is included in this simulation
work.
11
4 Summary of the Papers
Paper A Obaidat, Y.T., Heyden, S., Dahlblom, O., Abu-Farsakh, G., and Abdel-Jawad,
Y.: Retrofitting of reinforced concrete beams using composite laminates.
Submitted to Construction & Building Materials, 2010.
Summary: This paper presents the results of an experimental study to
investigate the behaviour of structurally damaged full-scale reinforced
concrete beams retrofitted with CFRP laminates in shear or in flexure. The
main variables considered were the internal reinforcement ratio, position of
retrofitting and the length of CFRP. The experimental results, generally,
indicate that beams retrofitted in shear and flexure by using CFRP laminates
are structurally efficient and are restored to stiffness and strength values
nearly equal to or greater than those of the control beams. It was found that
the efficiency of the strengthening technique by CFRP in flexure varied
depending on the length. The main failure mode in the experimental work was
plate debonding in retrofitted beams.
Paper B Obaidat,Y.T., Heyden, S. and Dahlblom, O.: The Effect of CFRP and CFRP/
Concrete Interface Models when Modelling Retrofitted RC Beams with FEM.
Published in Composite Structures, 2010; 92: 1391–1398.
Summary: This paper presents a finite element analysis which is validated
against laboratory tests of eight beams. All beams had the same rectangular
cross-section geometry and were loaded under four point bending, but differed
in the length of the carbon fibre reinforced plastic (CFRP) plate. The
commercial numerical analysis tool Abaqus was used, and different material
models were evaluated with respect to their ability to describe the behaviour of
the beams. Linear elastic isotropic and orthotropic models were used for the
CFRP and a perfect bond model and a cohesive bond model was used for the
concrete–CFRP interface. A plastic damage model was used for the concrete.
The analyses results show good agreement with the experimental data
regarding load–displacement response, crack pattern and debonding failure
mode when the cohesive bond model is used. The perfect bond model failed to
capture the softening behaviour of the beams. There is no significant difference
between the elastic isotropic and orthotropic models for the CFRP.
12
Paper C Obaidat,Y.T., Dahlblom, O. and Heyden, S.: Nonlinear FE modelling of shear
behaviour in RC beam retrofitted with CFRP. Computational Modelling of
Concrete Structures conference (EURO-C 2010), 2010.
Summary: To examine numerically the behaviour of beams retrofitted in shear
and the effects of length and orientation of CFRP in the beams, in this paper a
nonlinear 3-D numerical model has been developed using the ABAQUS finite
element program. Two models were used to represent the interface between
CFRP and concrete, a perfect bond model and a cohesive model. Validation of
the model was performed using data obtained from an experimental study. The
results showed that the cohesive model is able to simulate the composite
behaviour of reinforced concrete beams retrofitted by CFRP in shear correctly.
The model is then used to examine the influence of length and orientation of
CFRP. It is shown that the length of CFRP and the orientation strongly
influence on the behaviour of the retrofitted beams.
Paper D Obaidat,Y.T., Heyden, S. and Dahlblom, O.: FEM Study on the Effect of
CFRP Stiffness and Width on Retrofitted Reinforced Concrete Beam
Behaviour. Submitted to Composite Structures, 2010.
Summary: The finite element program ABAQUS was used to study the effect
of different parameters on the behaviour of an RC beam retrofitted with carbon
fibre reinforced polymer (CFRP). These parameters were the stiffness and
width of the CFRP. A linear elastic isotropic model was used for the CFRP and
a cohesive bond model was used for the concrete–CFRP interface. A plastic
damage model was used for the concrete. The material models were validated
against experimental work and the results showed good agreement between
experimental data and numerical results. Observations indicate that the CFRP
width to beam width ratio and CFRP stiffness influence the type of failure
mode of a beam retrofitted with CFRP. For small width and for large value of
stiffness debonding will occur before steel yielding due to stress concentration
at the end of the plate. For small values of stiffness rupture of CFRP will occur.
It was found that when the stiffness of CFRP increases the maximum load
increases until a certain value of stiffness, then the maximum load decreases
again. Simulations also show that the external load at steel yielding and the
maximum load increase with the CFRP width.
13
5 Conclusions and Future Work
5.1 Conclusions
The finite element method is a useful tool for improving the understanding of the behaviour of
reinforced concrete beams retrofitted with CFRP. Experimental tests are needed to provide
input data to the model and for the purpose of verification of simulation results. When the
model has been validated it can be used for parameter studies to clarify the influence of
various parameters.
The plastic damage model used for concrete and the elastic-perfectly plastic model used
for steel proved to be able to model the reinforced concrete, as was shown by comparing
simulations to tests of control beams. A uni-axial CFRP is essentially an orthotropic material,
but simulations showed that for cases where the principal stress direction coincides with the
fibre direction, an isotropic model could be used with good accuracy.
Since debonding plays an important role as a limiting phenomenon for retrofitted beams, a
perfect bond model is not suitable for the CFRP-concrete interface, at least not if the intention
is to study the fracture behaviour. The cohesive bond model, on the other hand, can capture
the debonding and simulations using this model showed good agreement with experiments
concerning stiffness, maximum load, crack patterns and failure mode.
Experiments and simulations showed that retrofitting can increase load capacity and
stiffness and the effect is larger for retrofitting in flexure than in shear. On the other hand,
simulations showed that an increase in the amount of CFRP will in some cases decrease the
maximum load. This means that understanding of the behaviour of a retrofitted structure is
very important since an unsuitable arrangement of CFRP can actually make the situation
worse.
Experiments and simulations showed that it is important to provide a sufficient anchorage
length outside the region of maximum stress to obtain full effect from the retrofitting. For
retrofitting in shear, it was also shown that the best effect is obtained it the fibre direction of
the CFRP coincides with the principal tensile stress direction.
Simulations showed that several different failure modes can occur, depending on the
geometry and stiffness properties of the CFRP. Many of the failure modes involve debonding,
associated with a stress concentration in the concrete-CFRP interface zone. An important
criterion when designing the CFRP arrangement is thus to avoid stress concentrations as far as
is possible. A high stiffness and low width of the CFRP will give a pronounced stress
concentration at the plate end. This should definitely be avoided since it will cause debonding
before steel yielding and failure will occur at low load.
14
A wider CFRP plate will (for constant stiffness) always give a higher maximum load,
while increased CFRP stiffness will increase the maximum load only up to a certain value of
the stiffness, and thereafter it will decrease the maximum load.
5.2 Future Work
Since debonding is such an important phenomenon when retrofitting with CFRP is concerned,
more attention should be given to the behaviour of the concrete-CFRP bond. More
experimental data on the micro-level is needed to provide the information needed for further
developing the material model used for the interface. Another interesting area when it comes
to developing the model is usage of the extended finite element method (XFEM) to represent
the cracks in the concrete.
A parametric study in this work took into consideration the effect of varying the stiffness
properties and geometry of the CFRP on the type of failure and stress concentrations. It would
also be interesting to study the effect of beam stiffness properties and geometry on the
behaviour of a beam, stress concentrations and type of failure.
This study showed that there is a stress concentration at the end of the plate causing
debonding failure. It would be interesting to study different approaches to avoid this
phenomenon. Examples are tapering at end of plate and external CFRP wrapping (stirrup) for
reducing the stress concentration at the end of the plate.
Previous experimental programmes have shown that the CFRP plate retrofitting system
enhances the capacity of deficient concrete beams. There are, however, many environmental
factors involved during the life span of a retrofitted structure that needs more attention. They
include seasonal temperature variation, degradation of material properties, creep and so on.
The durability of CFRP reinforced beams under these conditions should be investigated.
15
References
[1] Piggott, M.: Load bearing fibre composites, 2nd Edition. Kluwer Academic Publishers,
Boston/ Dordrecht/ London. 2002.
[2] Karbhari, M.: FRP International. The Official Newsletter of the International Institute
for FRP in Construction. 2004; 1(2).
[3] Toutanji, H., Zhao, L., and Zhang, Y.: Flexural behavior of reinforced concrete beams
externally strengthened with CFRP sheets bonded with an inorganic matrix.
Engineering Structures. 2006; 28: 557-566.
[4] Esfahani, M., Kianoush, M., and Tajari, A.: Flexural behaviour of reinforced concrete
beams strengthened by CFRP sheets. Engineering structures. 2007, 29: 2428-2444.
[5] Khalifa, A., Tumialan, G., Nanni, A. and Belarbi, A.: Shear Strengthening of
Continuous RC Beams using Externally Bonded CFRP Sheet. American Concrete
Institute, Proc., 4th International Symposium on FRP for Reinforcement of Concrete
Structures (FRPRCS4), Baltimore, MD, Nov. 1999: 995-1008.
[6] Ashour AF, El-Refaie S.A., and Garrity, S.W.: Flexural strengthening of RC continuous
beams using CFRP laminates. Cement & Concrete Composites. 2004; 26:765-775.
[7] Garden, H.N., and Hollaway, L.C.: An Experimental Study of the Influence of Plate
End Anchorage of Carbon Fiber Composite Plates used to Strengthen Reinforced
Concrete Beams. Composite Structures. 1998, 42, 2, 175-88.
[8] Smith, S.T., and Teng, J.G.: FRP-Strengthened RC Beams I: Review of Debonding
Strength Models. Engineering Structures. 2002, 24, 4, 385-95.
[9] Supaviriyakit, T., Pornpongsaroj, P., and Pimanamas, A.: Finite Element Analysis of
FRP Strengthened RC Beam. Songklanakarin J.Sci.Technol. 2004, 26(4): 497-507.
[10] Hu, H.-T., Lin, F.-M., & Jan, Y.-Y.: Nonlinear finite element analysis of reinforced
concrete beams strengthened by fiber–reinforced plastics. Cement and concrete
composite. 2006, 28: 102-114.
[11] Lundquist, J., Nordin, H., Täljsten, B., and Olofsson, T.: Numerical analyis of concrete
beams sterengthened with CFRP- A Study of anchorage lengths. In: FRP in
Construction, Proceeding of The International Symposium of Bond Behaviour of FRP in
Structures. 2005; 247-254.
[12] Lim, Y., Shin, S., and Kim, M.: A study on the effect of externally bonded composite
plate-concrete interface. Composite Structures. 2008, 82:403-412.
[13] Hillerborg, A., Modéer, M., and Petersson, P.E.: Analysis of crack formation and crack
growth in concrete by means of fracture mechanics and finite elements. Cement
Concrete. 1976, 6: 773–782.
16
[14] Camata, G., Spacone, E., and Zarnic, R.: Experimental and nonlinear finite element
studies of RC beams strengthened with FRP plates. Composites: Part B. 2007, 38: 277-
288.
[15] Neale, K., Ebead, U., Abdel Baky, H., Elsayed, W., and Godat, A.: Modelling of
debonding phenomena in FRP-strengthened concrete beams and slabs. Proceeding of
the international symposium on bond behaviour of FRP in structures (BBFS). 2005.
17
Paper A
Retrofitting Of Reinforced Concrete Beams
Using Composite Laminates
Yasmeen Taleb Obaidat, Susanne Heyden, Ola Dahlblom,
Ghazi Abu-Farsakh and Yahia Abdel-Jawad
Submitted to Construction & Building Materials
A

19
Retrofitting of Reinforced Concrete Beams using Composite Laminates
Yasmeen Taleb Obaidata,
, Susanne Heydena, Ola Dahlblom
a, Ghazi Abu- Farsakh
b and Yahia
Abdel-Jawadb
a Division of Structural Mechanics, Lund University, Lund, Sweden
b Jordan University of Science and Technology, Irbid, Jordan
Abstract:
This paper presents the results of an experimental study to investigate the behaviour of
structurally damaged full-scale reinforced concrete beams retrofitted with CFRP laminates
in shear or in flexure. The main variables considered were the internal reinforcement ratio,
position of retrofitting and the length of CFRP. The experimental results, generally, indicate
that beams retrofitted in shear and flexure by using CFRP laminates are structurally
efficient and are restored to stiffness and strength values nearly equal to or greater than
those of the control beams. It was found that the efficiency of the strengthening technique by
CFRP in flexure varied depending on the length. The main failure mode in the experimental
work was plate debonding in retrofitted beams.
Keywords: Carbon Fibre Reinforced Plastic (CFRP), Strengthening, Retrofitting,
Laminate, Reinforced Concrete Beam, Flexure, Debonding.
1. Introduction:
There are many existing structures, which do not fulfill specified requirements. This may
for example be due to upgrading of the design standards, increased loading, corrosion of
the reinforcement bars, construction errors or accidents such as earthquakes. To remedy
for insufficient capacity the structures need to be replaced or retrofitted.
Different types of strengthening materials are available in the market. Examples of
these are ferrocement, steel plates and fibre reinforced polymer (FRP) laminate.
Retrofitting of reinforced concrete (RC) structures by bonding external steel and FRP
plates or sheets is an effective method for improving structural performance under both
service and ultimate load conditions. It is both environmentally and economically
preferable to repair or strengthen structures rather than to replace them totally. With the
Corresponding author.
E-mail address: [email protected]
20
development of structurally effective adhesives, there have been marked increases in
strengthening using steel plates and FRP laminates. FRP has become increasingly attractive
compared to steel plates due to its advantageous low weight, high stiffness and strength to
weight ratio, corrosion resistance, lower maintenance costs and faster installation time.
Earlier research has demonstrated that the addition of carbon fibre reinforced polymer
(CFRP) laminate to reinforced concrete beams can increase stiffness and maximum load of
the beams. In a study by Toutanj et al. [1] beams retrofitted with CFRP laminates showed an
increased maximum load up to 170 % as compared to control beams. Another study by
Kachlakev and McCurry [2] shows an increase of 150 % when beams were strengthened in
both flexure and shear with CFRP and glass FRP laminates respectively. Other studies have
also been conducted by David et al. [3], Shahawy et al. [4], Khalifa and Nanni [5], Shehata et
al. [6], Khalifa et al. [7] in an attempt to quantify the flexural and shear strengthening
enhancements offered by the externally bonded CFRP laminates. Ferreira et al. [8] showed
that when a beam is strengthened with CFRP sheets the stiffness increase and the tension
cracking is delayed to higher loads, and Karunasena et al. [9] showed that an externally
bonded composite, of either CFRP or GFRP materials, improved the moment capacity of
deteriorated concrete beams.
In spite of many studies of the behaviour of retrofitted beams, the effect of the length of
CFRP on the behaviour of pre-cracked beams retrofitted by CFRP in flexure and the
behaviour of retrofitted beams in shear after preloading have not been explored. This study
examined experimentally the flexural and the shear behaviours of RC-beams retrofitted or
strengthened with CFRP laminates. To accomplish this, laboratory testing was conducted on
full-size beams. The main variables in this study are the reinforcement steel ratio and CFRP
length.
2. Material and methods
The experimental work undertaken in this study consisted of four point bending tests of
twelve simply supported RC beams. In addition, material tests were carried out to determine
the mechanical properties of the concrete, reinforcement steel and CFRP which were used in
constructing the beams.
2.1 Materials
An ordinary strength concrete mix was prepared using Ordinary Portland cement (Type I).
The aggregate used consisted of coarse limestone, crushed limestone and silica sand. The
gradation of coarse and fine particles met the ASTM specification (C136) [10].
21
The concrete mix was designed according to ACI method 211 [11], to have slump 50 mm
and 28 days cylinder compressive strength of 30 MPa. The maximum aggregate size was 10
mm and the free water cement ratio was 0.55. The concrete mix is shown in Table 1.
Table 1 Concrete mix proportions, kg per m
3 concrete.
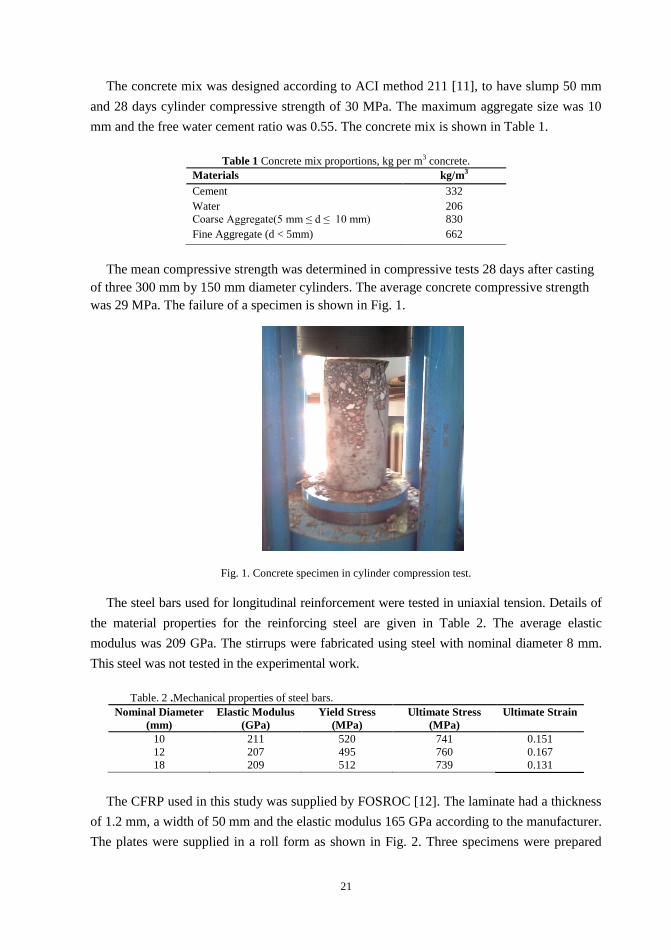
The mean compressive strength was determined in compressive tests 28 days after casting
of three 300 mm by 150 mm diameter cylinders. The average concrete compressive strength
was 29 MPa. The failure of a specimen is shown in Fig. 1.
Fig. 1. Concrete specimen in cylinder compression test.
The steel bars used for longitudinal reinforcement were tested in uniaxial tension. Details of
the material properties for the reinforcing steel are given in Table 2. The average elastic
modulus was 209 GPa. The stirrups were fabricated using steel with nominal diameter 8 mm.
This steel was not tested in the experimental work.
Table. 2 .Mechanical properties of steel bars.
Nominal Diameter
(mm)
Elastic Modulus
(GPa)
Yield Stress
(MPa)
Ultimate Stress
(MPa)
Ultimate Strain
10 211 520 741 0.151
12 207 495 760 0.167
18 209 512 739 0.131
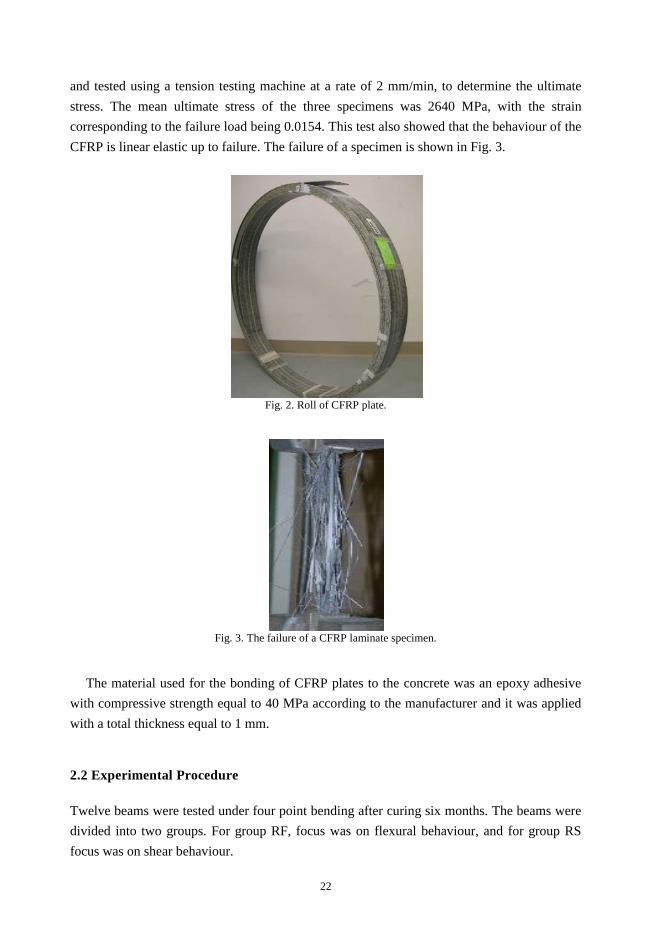
The CFRP used in this study was supplied by FOSROC [12]. The laminate had a thickness
of 1.2 mm, a width of 50 mm and the elastic modulus 165 GPa according to the manufacturer.
The plates were supplied in a roll form as shown in Fig. 2. Three specimens were prepared
Materials kg/m3
Cement 332
Water 206
Coarse Aggregate(5 mm ≤ d ≤ 10 mm) 830
Fine Aggregate (d < 5mm) 662
22
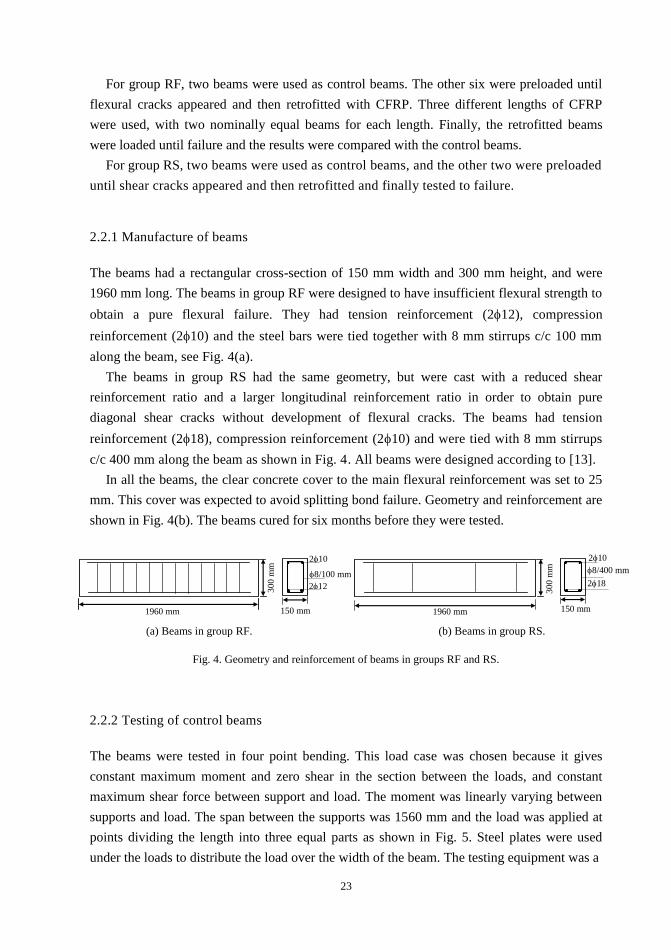
and tested using a tension testing machine at a rate of 2 mm/min, to determine the ultimate
stress. The mean ultimate stress of the three specimens was 2640 MPa, with the strain
corresponding to the failure load being 0.0154. This test also showed that the behaviour of the
CFRP is linear elastic up to failure. The failure of a specimen is shown in Fig. 3.
Fig. 2. Roll of CFRP plate.
Fig. 3. The failure of a CFRP laminate specimen.
The material used for the bonding of CFRP plates to the concrete was an epoxy adhesive
with compressive strength equal to 40 MPa according to the manufacturer and it was applied
with a total thickness equal to 1 mm.
2.2 Experimental Procedure
Twelve beams were tested under four point bending after curing six months. The beams were
divided into two groups. For group RF, focus was on flexural behaviour, and for group RS
focus was on shear behaviour.
23
For group RF, two beams were used as control beams. The other six were preloaded until
flexural cracks appeared and then retrofitted with CFRP. Three different lengths of CFRP
were used, with two nominally equal beams for each length. Finally, the retrofitted beams
were loaded until failure and the results were compared with the control beams.
For group RS, two beams were used as control beams, and the other two were preloaded
until shear cracks appeared and then retrofitted and finally tested to failure.
2.2.1 Manufacture of beams
The beams had a rectangular cross-section of 150 mm width and 300 mm height, and were
1960 mm long. The beams in group RF were designed to have insufficient flexural strength to
obtain a pure flexural failure. They had tension reinforcement (212), compression
reinforcement (210) and the steel bars were tied together with 8 mm stirrups c/c 100 mm
along the beam, see Fig. 4(a).
The beams in group RS had the same geometry, but were cast with a reduced shear
reinforcement ratio and a larger longitudinal reinforcement ratio in order to obtain pure
diagonal shear cracks without development of flexural cracks. The beams had tension
reinforcement (218), compression reinforcement (210) and were tied with 8 mm stirrups
c/c 400 mm along the beam as shown in Fig. 4. All beams were designed according to [13].
In all the beams, the clear concrete cover to the main flexural reinforcement was set to 25
mm. This cover was expected to avoid splitting bond failure. Geometry and reinforcement are
shown in Fig. 4(b). The beams cured for six months before they were tested.
(a) Beams in group RF. (b) Beams in group RS.
Fig. 4. Geometry and reinforcement of beams in groups RF and RS.
2.2.2 Testing of control beams
The beams were tested in four point bending. This load case was chosen because it gives
constant maximum moment and zero shear in the section between the loads, and constant
maximum shear force between support and load. The moment was linearly varying between
supports and load. The span between the supports was 1560 mm and the load was applied at
points dividing the length into three equal parts as shown in Fig. 5. Steel plates were used
under the loads to distribute the load over the width of the beam. The testing equipment was a
210
300
mm
150 mm
212 8/100 mm
1960 mm
300
mm
1960 mm 150 mm
210
218 8/400 mm
24
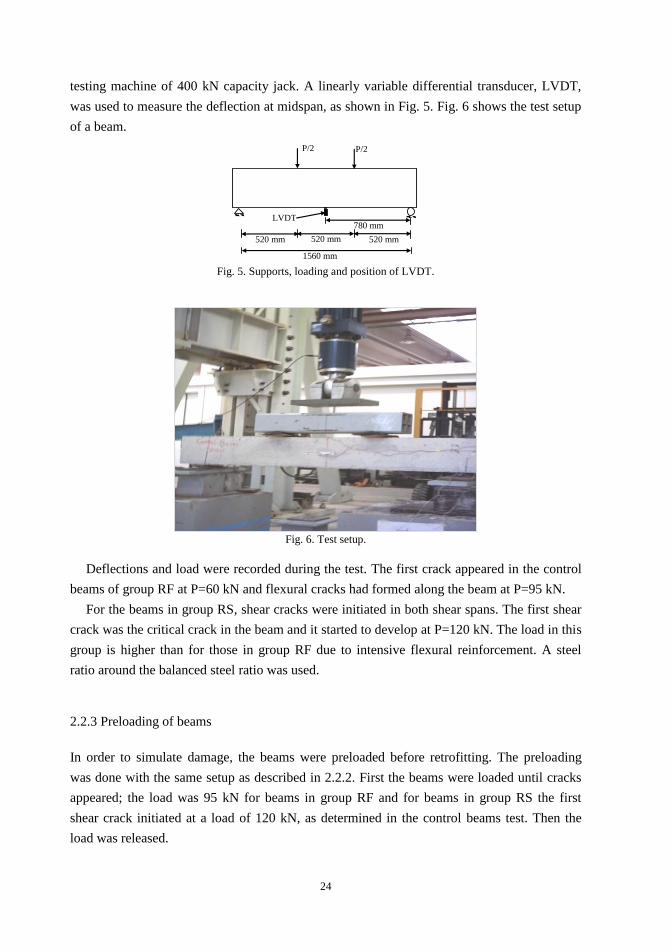
testing machine of 400 kN capacity jack. A linearly variable differential transducer, LVDT,
was used to measure the deflection at midspan, as shown in Fig. 5. Fig. 6 shows the test setup
of a beam.
Fig. 5. Supports, loading and position of LVDT.
Fig. 6. Test setup.
Deflections and load were recorded during the test. The first crack appeared in the control
beams of group RF at P=60 kN and flexural cracks had formed along the beam at P=95 kN.
For the beams in group RS, shear cracks were initiated in both shear spans. The first shear
crack was the critical crack in the beam and it started to develop at P=120 kN. The load in this
group is higher than for those in group RF due to intensive flexural reinforcement. A steel
ratio around the balanced steel ratio was used.
2.2.3 Preloading of beams
In order to simulate damage, the beams were preloaded before retrofitting. The preloading
was done with the same setup as described in 2.2.2. First the beams were loaded until cracks
appeared; the load was 95 kN for beams in group RF and for beams in group RS the first
shear crack initiated at a load of 120 kN, as determined in the control beams test. Then the
load was released.
1560 mm
P/2 P/2
LVDT 780 mm
520 mm 520 mm 520 mm
25
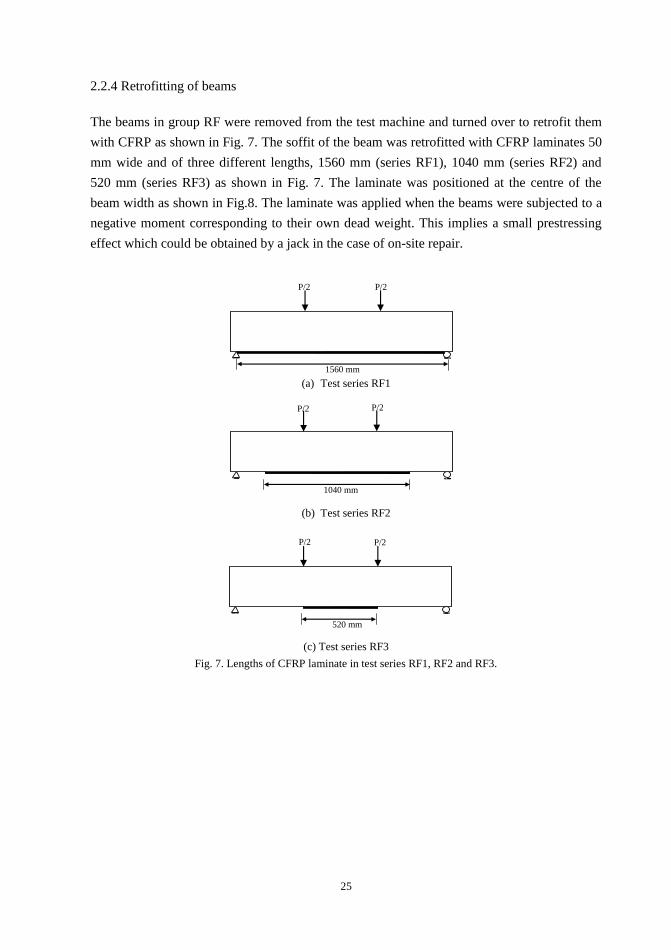
2.2.4 Retrofitting of beams
The beams in group RF were removed from the test machine and turned over to retrofit them
with CFRP as shown in Fig. 7. The soffit of the beam was retrofitted with CFRP laminates 50
mm wide and of three different lengths, 1560 mm (series RF1), 1040 mm (series RF2) and
520 mm (series RF3) as shown in Fig. 7. The laminate was positioned at the centre of the
beam width as shown in Fig.8. The laminate was applied when the beams were subjected to a
negative moment corresponding to their own dead weight. This implies a small prestressing
effect which could be obtained by a jack in the case of on-site repair.
(a) Test series RF1
(b) Test series RF2
(c) Test series RF3
Fig. 7. Lengths of CFRP laminate in test series RF1, RF2 and RF3.
1560 mm
P/2 P/2
1040 mm
P/2 P/2
P/2 P/2
520 mm
26
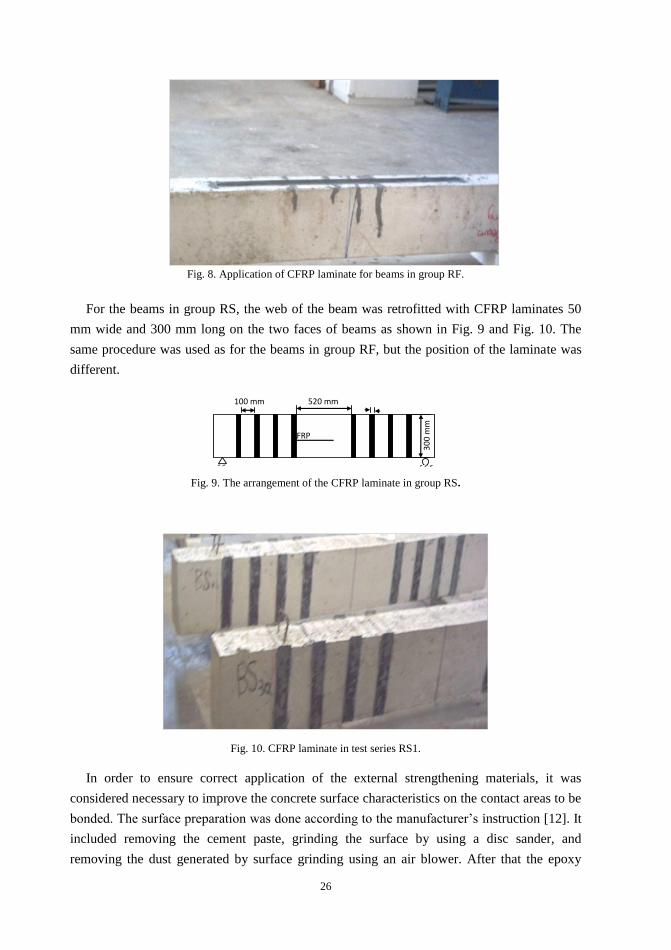
Fig. 8. Application of CFRP laminate for beams in group RF.
For the beams in group RS, the web of the beam was retrofitted with CFRP laminates 50
mm wide and 300 mm long on the two faces of beams as shown in Fig. 9 and Fig. 10. The
same procedure was used as for the beams in group RF, but the position of the laminate was
different.
Fig. 9. The arrangement of the CFRP laminate in group RS.
Fig. 10. CFRP laminate in test series RS1.
In order to ensure correct application of the external strengthening materials, it was
considered necessary to improve the concrete surface characteristics on the contact areas to be
bonded. The surface preparation was done according to the manufacturer’s instruction [12]. It
included removing the cement paste, grinding the surface by using a disc sander, and
removing the dust generated by surface grinding using an air blower. After that the epoxy
520 mm
30
0 m
m
CFRP
100 mm
27
adhesive was applied to both the CFRP and the concrete surface. Finally the CFRP plates
were applied to the beams.
2.2.5 Testing of retrofitted beams
After 7 days curing at ambient temperature the beams were retested under four point
bending until failure occurred. The tests were performed using the same setup as
described in section 2.2.2.
3. Results
3.1 Beams in group RF
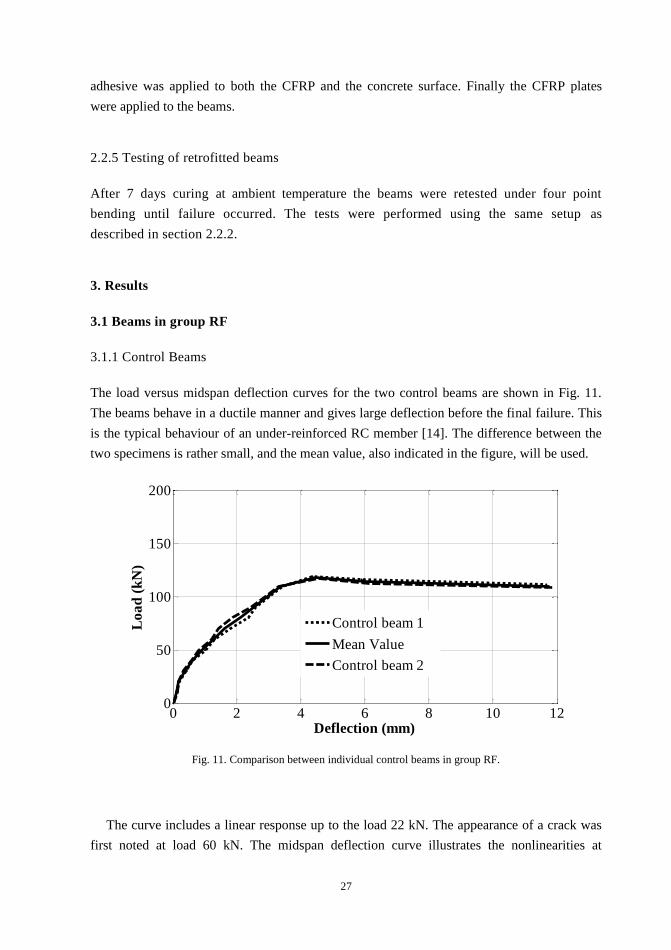
3.1.1 Control Beams
The load versus midspan deflection curves for the two control beams are shown in Fig. 11.
The beams behave in a ductile manner and gives large deflection before the final failure. This
is the typical behaviour of an under-reinforced RC member [14]. The difference between the
two specimens is rather small, and the mean value, also indicated in the figure, will be used.
Fig. 11. Comparison between individual control beams in group RF.
The curve includes a linear response up to the load 22 kN. The appearance of a crack was
first noted at load 60 kN. The midspan deflection curve illustrates the nonlinearities at
0 2 4 6 8 10 120
50
100
150
200
Deflection (mm)
Lo
ad
(k
N)
Control beam 1
Mean Value
Control beam 2
28
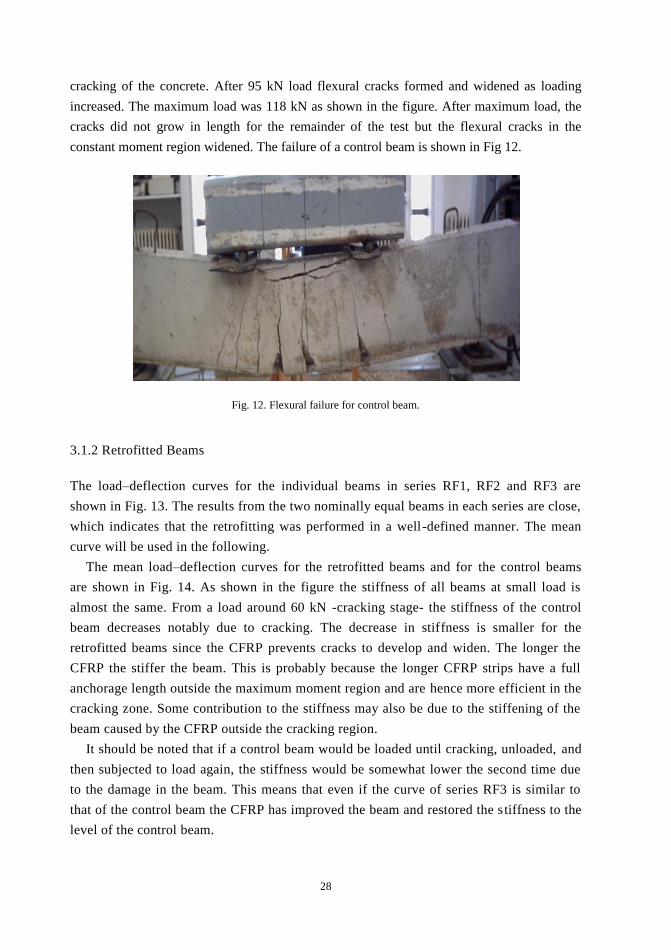
cracking of the concrete. After 95 kN load flexural cracks formed and widened as loading
increased. The maximum load was 118 kN as shown in the figure. After maximum load, the
cracks did not grow in length for the remainder of the test but the flexural cracks in the
constant moment region widened. The failure of a control beam is shown in Fig 12.
Fig. 12. Flexural failure for control beam.
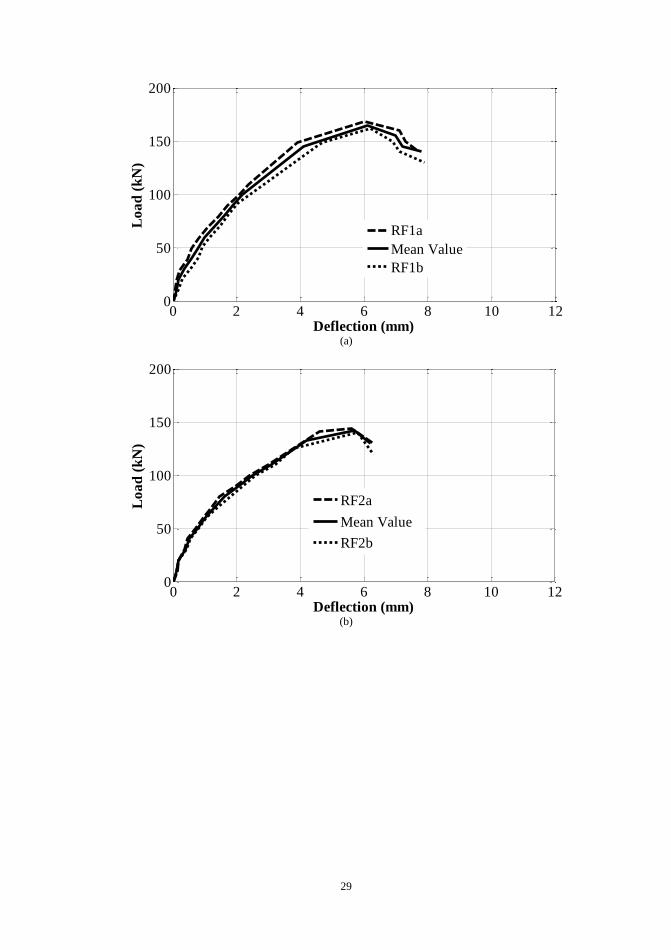
3.1.2 Retrofitted Beams
The load–deflection curves for the individual beams in series RF1, RF2 and RF3 are
shown in Fig. 13. The results from the two nominally equal beams in each series are close,
which indicates that the retrofitting was performed in a well-defined manner. The mean
curve will be used in the following.
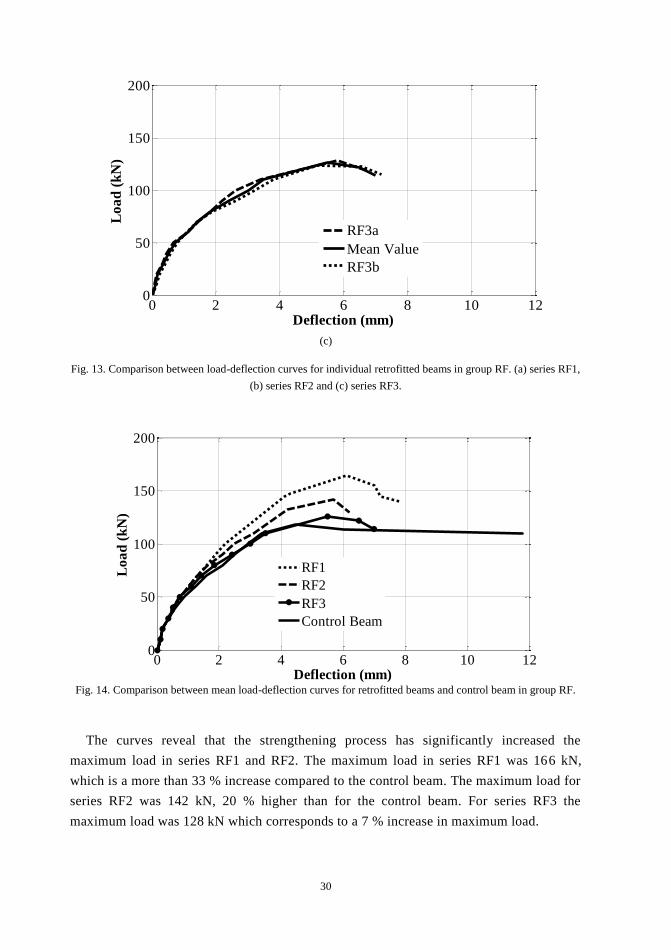
The mean load–deflection curves for the retrofitted beams and for the control beams
are shown in Fig. 14. As shown in the figure the stiffness of all beams at small load is
almost the same. From a load around 60 kN -cracking stage- the stiffness of the control
beam decreases notably due to cracking. The decrease in stiffness is smaller for the
retrofitted beams since the CFRP prevents cracks to develop and widen. The longer the
CFRP the stiffer the beam. This is probably because the longer CFRP strips have a full
anchorage length outside the maximum moment region and are hence more efficient in the
cracking zone. Some contribution to the stiffness may also be due to the stiffening of the
beam caused by the CFRP outside the cracking region.
It should be noted that if a control beam would be loaded until cracking, unloaded, and
then subjected to load again, the stiffness would be somewhat lower the second time due
to the damage in the beam. This means that even if the curve of series RF3 is similar to
that of the control beam the CFRP has improved the beam and restored the s tiffness to the
level of the control beam.
29
(a)
(b)
0 2 4 6 8 10 120
50
100
150
200
Deflection (mm)
Lo
ad
(k
N)
RF1a
Mean Value
RF1b
0 2 4 6 8 10 120
50
100
150
200
Deflection (mm)
Lo
ad
(k
N)
RF2a
Mean Value
RF2b
30
(c)
Fig. 13. Comparison between load-deflection curves for individual retrofitted beams in group RF. (a) series RF1,
(b) series RF2 and (c) series RF3.
Fig. 14. Comparison between mean load-deflection curves for retrofitted beams and control beam in group RF.
The curves reveal that the strengthening process has significantly increased the
maximum load in series RF1 and RF2. The maximum load in series RF1 was 166 kN,
which is a more than 33 % increase compared to the control beam. The maximum load for
series RF2 was 142 kN, 20 % higher than for the control beam. For series RF3 the
maximum load was 128 kN which corresponds to a 7 % increase in maximum load.
0 2 4 6 8 10 120
50
100
150
200
Deflection (mm)
Lo
ad
(k
N)
RF3a
Mean Value
RF3b
0 2 4 6 8 10 120
50
100
150
200
Deflection (mm)
Lo
ad
(k
N)
RF1
RF2
RF3
Control Beam
31
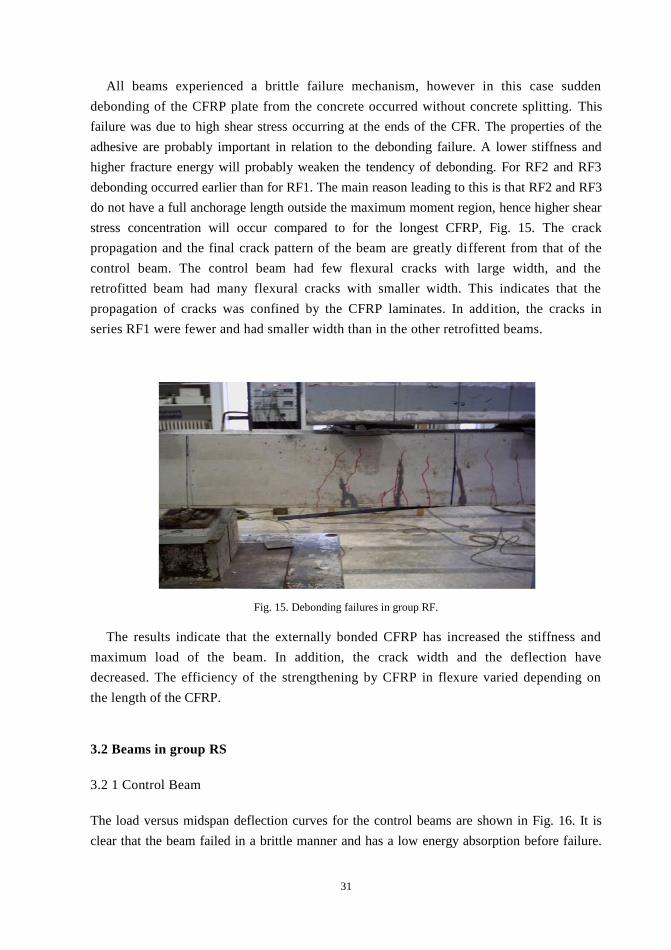
All beams experienced a brittle failure mechanism, however in this case sudden
debonding of the CFRP plate from the concrete occurred without concrete splitting. This
failure was due to high shear stress occurring at the ends of the CFR. The properties of the
adhesive are probably important in relation to the debonding failure. A lower stiffness and
higher fracture energy will probably weaken the tendency of debonding. For RF2 and RF3
debonding occurred earlier than for RF1. The main reason leading to this is that RF2 and RF3
do not have a full anchorage length outside the maximum moment region, hence higher shear
stress concentration will occur compared to for the longest CFRP, Fig. 15. The crack
propagation and the final crack pattern of the beam are greatly different from that of the
control beam. The control beam had few flexural cracks with large width, and the
retrofitted beam had many flexural cracks with smaller width. This indicates that the
propagation of cracks was confined by the CFRP laminates. In addition, the cracks in
series RF1 were fewer and had smaller width than in the other retrofitted beams.
Fig. 15. Debonding failures in group RF.
The results indicate that the externally bonded CFRP has increased the stiffness and
maximum load of the beam. In addition, the crack width and the deflection have
decreased. The efficiency of the strengthening by CFRP in flexure varied depending on
the length of the CFRP.
3.2 Beams in group RS
3.2 1 Control Beam
The load versus midspan deflection curves for the control beams are shown in Fig. 16. It is
clear that the beam failed in a brittle manner and has a low energy absorption before failure.
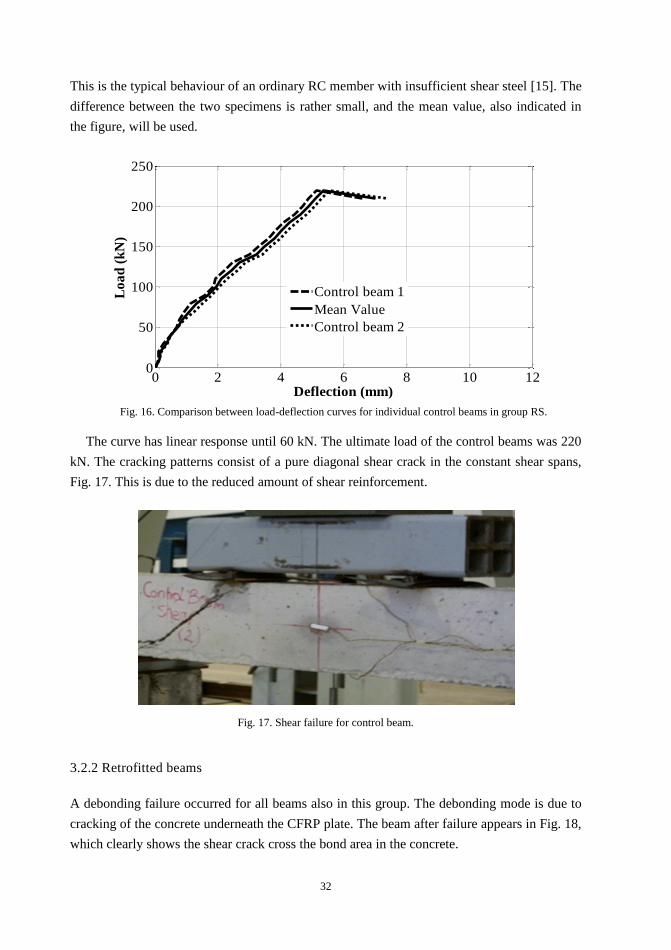
32
This is the typical behaviour of an ordinary RC member with insufficient shear steel [15]. The
difference between the two specimens is rather small, and the mean value, also indicated in
the figure, will be used.
Fig. 16. Comparison between load-deflection curves for individual control beams in group RS.
The curve has linear response until 60 kN. The ultimate load of the control beams was 220
kN. The cracking patterns consist of a pure diagonal shear crack in the constant shear spans,
Fig. 17. This is due to the reduced amount of shear reinforcement.
Fig. 17. Shear failure for control beam.
3.2.2 Retrofitted beams
A debonding failure occurred for all beams also in this group. The debonding mode is due to
cracking of the concrete underneath the CFRP plate. The beam after failure appears in Fig. 18,
which clearly shows the shear crack cross the bond area in the concrete.
0 2 4 6 8 10 120
50
100
150
200
250
Deflection (mm)
Lo
ad
(k
N)
Control beam 1
Mean Value
Control beam 2
33
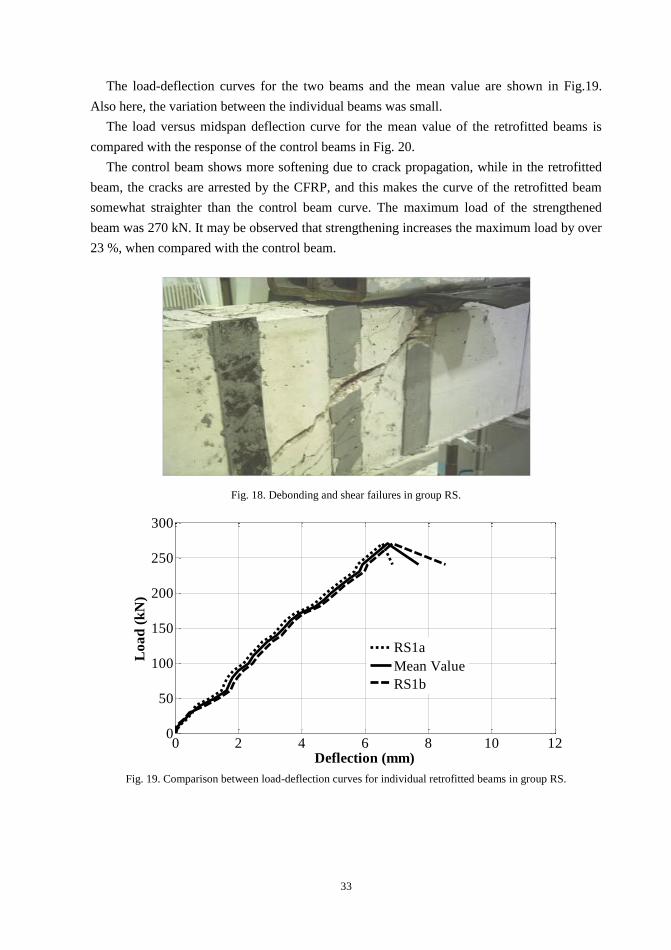
The load-deflection curves for the two beams and the mean value are shown in Fig.19.
Also here, the variation between the individual beams was small.
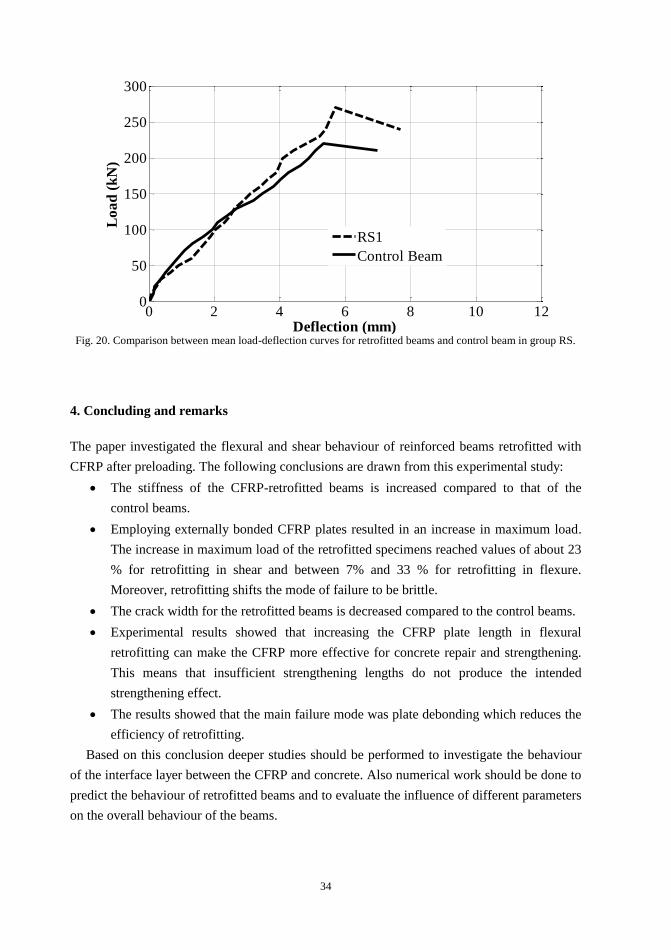
The load versus midspan deflection curve for the mean value of the retrofitted beams is
compared with the response of the control beams in Fig. 20.
The control beam shows more softening due to crack propagation, while in the retrofitted
beam, the cracks are arrested by the CFRP, and this makes the curve of the retrofitted beam
somewhat straighter than the control beam curve. The maximum load of the strengthened
beam was 270 kN. It may be observed that strengthening increases the maximum load by over
23 %, when compared with the control beam.
Fig. 18. Debonding and shear failures in group RS.
Fig. 19. Comparison between load-deflection curves for individual retrofitted beams in group RS.
0 2 4 6 8 10 120
50
100
150
200
250
300
Deflection (mm)
Lo
ad
(k
N)
RS1a
Mean Value
RS1b
34
Fig. 20. Comparison between mean load-deflection curves for retrofitted beams and control beam in group RS.
4. Concluding and remarks
The paper investigated the flexural and shear behaviour of reinforced beams retrofitted with
CFRP after preloading. The following conclusions are drawn from this experimental study:
The stiffness of the CFRP-retrofitted beams is increased compared to that of the
control beams.
Employing externally bonded CFRP plates resulted in an increase in maximum load.
The increase in maximum load of the retrofitted specimens reached values of about 23
% for retrofitting in shear and between 7% and 33 % for retrofitting in flexure.
Moreover, retrofitting shifts the mode of failure to be brittle.
The crack width for the retrofitted beams is decreased compared to the control beams.
Experimental results showed that increasing the CFRP plate length in flexural
retrofitting can make the CFRP more effective for concrete repair and strengthening.
This means that insufficient strengthening lengths do not produce the intended
strengthening effect.
The results showed that the main failure mode was plate debonding which reduces the
efficiency of retrofitting.
Based on this conclusion deeper studies should be performed to investigate the behaviour
of the interface layer between the CFRP and concrete. Also numerical work should be done to
predict the behaviour of retrofitted beams and to evaluate the influence of different parameters
on the overall behaviour of the beams.
0 2 4 6 8 10 120
50
100
150
200
250
300
Deflection (mm)
Lo
ad
(k
N)
RS1
Control Beam
35
5. References
[1] Toutanji, H., Zhao, L., and Zhang, Y., "Flexural behaviour of reinforced concrete
beams externally strengthened with CFRP sheets bonded with an inorganic matrix".
Engineering Structures March 2006; 28: 557-566.
[2] Kachlakev D., McCurry D.D. "Behavior of full-scale reinforced concrete beams
retrofitted for shear and flexural with FRP laminates", Composites 2000; 31: 445-452.
[3] David, E, Djelal, C, and Buyle-Bodin, F. "Repair And Strengthening Of Reinforced
Concrete Beams Using Composite Materials", 2nd
Int. PhD Symposium in Civil
Engineering 1998 Budapest.
[4] Shahawy M. A., Arockiasamy T M., Beitelmant T., and Sowrirajan R. "Reinforced
concrete rectangular beams strengthened with CFRP laminates", Composites: 1996; 27:
225-233.
[5] Khalifa A, Nanni A . "Rehabilitation of rectangular simply supported RC beams with
shear deficiencies using CFRP composites". Construction and Building Materials 2002;
16:135-146.
[6] Shehata, A.E.M, Cerqueira, E.C.,Pinto, C.T.M., and Coppe, "Strengthening of R.C
beams in flexure and shear using CFRP laminate.", Fiber-reinforced Plastic for
Reinforced Concrete Structure 2001; 1: 97-106.
[7] Khalifa, A., Tumialan, G., Nanni, A. and Belarbi, A., "Shear Strengthening of
Continuous RC Beams Using Externally Bonded CFRP Sheets,", American Concrete
Institute, Proc., 4th International Symposium on FRP for Reinforcement of Concrete
Structures (FRPRCS4), Baltimore, MD, Nov. 1999: 995-1008.
[8] Ferreira, A. J. M. "On the shear-deformation theories for the analysis of concrete shells
reinforced with external composite laminates", Strength of Materials 2003; 35(2): 128-
135
[9] Karunasena, W., Hardeo, P., Bosnich, G. Rehabilitation of concrete beams by externally
bonding fiber composite reinforcement. In Composite Systems: Macrocomposites,
Microcomposites, Nanocomposites, Proceedings of the ACUN-4, International
Composites Conference, 4th, Sydney, Australia July 21-25, 2002; 222-226.
[10] ASTM C136. Method of seive analysis of fine and coarse aggregate, ASTM
International.
[11] ACI Comitte 211.1-91. Standard practice for selecting proportion for normal, heavy
weight and mass concrete. ACI Manual of Concrete Practice. Part 1, 1996.
[12] http: \\ www.fosroc.com. 2009, Dec, 16.
[13] ACI Comittee 318. Building Code Requirements for Structural Concrete and
Commentary (ACI 318-99). American Concrete Institute Detroit, MI, 1999.
[14] Nilson, H., Darwin, D., and Dolan, C.W. Design of Concrete structures, 13th edition..
McGraw Hill Higher Education, 2004.

36
[15] Nielsen, M. P.: Limit analysis and concrete plasticity, second edition, CRC press, 1999.
[16] Obaidat,Y. Retrofitting of reinforced concrete beams using composite laminates, Master
Thesis, Jordan University of Science and Technology. 2007.
37
Paper B
The effect of CFRP and CFRP/ concrete
interface models when modelling retrofitted RC
beams with FEM.
Yasmeen Taleb Obaidat, Susanne Heyden and Ola Dahlblom
Published in Composite Structures, 2010; 92: 1391–1398.
B

Composite Structures 92 (2010) 1391–1398
Contents lists available at ScienceDirect
Composite Structures
The effect of CFRP and CFRP/concrete interface models when modellingretrofitted RC beams with FEM
Yasmeen Taleb Obaidat *, Susanne Heyden, Ola Dahlblom
journal homepage: www.elsevier .com/locate /compstruct
d Univers
P)
Division of Structural Mechanics, Lun
a r t i c l e i n f o
Article history:Available online 14 November 2009
Keywords:Carbon fibre reinforced plastic (CFRStrengtheningLaminateCohesive model
Reinforced concrete beamFinite element analysis (FEA)0263-8223/$ - see front matter � 2009 Elsevdoi:10.1016/j.compstruct.2009.11.008
* Corresponding author.E-mail address: Yasmeen.Obaidat@byggm
ity, Lund, Sweden
a b s t r a c t
Concrete structures retrofitted with fibre reinforced plastic (FRP) applications have become widespreadin the last decade due to the economic benefit from it. This paper presents a finite element analysis whichis validated against laboratory tests of eight beams. All beams had the same rectangular cross-sectiongeometry and were loaded under four point bending, but differed in the length of the carbon fibre rein-forced plastic (CFRP) plate. The commercial numerical analysis tool Abaqus was used, and different mate-rial models were evaluated with respect to their ability to describe the behaviour of the beams. Linearelastic isotropic and orthotropic models were used for the CFRP and a perfect bond model and a cohesivebond model was used for the concrete–CFRP interface. A plastic damage model was used for the concrete.The analyses results show good agreement with the experimental data regarding load–displacementresponse, crack pattern and debonding failure mode when the cohesive bond model is used. The perfectbond model failed to capture the softening behaviour of the beams. There is no significant difference
between the elastic isotropic and orthotropic models for the CFRP.� 2009 Elsevier Ltd. All rights reserved.
rr-rgtei-r-e
-l-r-r
n],
rsh
1. Introduction
Upgrading of reinforced concrete structures may be required fomany different reasons. The concrete may have become structually inadequate for example, due to deterioration of materials, pooinitial design and/or construction, lack of maintenance, upgradinof design loads or accident events such as earthquakes. In recenyears, the development of strong epoxy glue has led to a techniquwhich has great potential in the field of upgrading structures. Bascally the technique involves gluing steel or FRP plates to the suface of the concrete. The plates then act compositely with thconcrete and help to carry the loads.
The use of FRP to repair and rehabilitate damaged steel and concrete structures has become increasingly attractive due to the welknown good mechanical properties of this material, with particulareference to its very high strength to density ratio. Other advantages are corrosion resistance, reduced maintenance costs and fasteinstallation time compared to conventional materials.
The application of CFRP as external reinforcement to strengtheconcrete beams has received much attention from researchers [1–5but only very few studies have focused on structural membestrengthened after preloading [6,7]. The behaviour of structures whic
ier Ltd. All rights reserved.
ek.lth.se (Y.T. Obaidat).
39
have been preloaded until cracking initiates deserves more attention,since this corresponds to the real-life use of CFRP retrofitting.
Researchers have observed new types of failures that can re-duce the performance of CFRP when used in retrofitting struc-tures [8]. These failures are often brittle, and includedebonding of concrete layers, delamination of CFRP and shearcollapse. Brittle debonding has particularly been observed atlaminate ends, due to high concentration of shear stresses at dis-continuities, where shear cracks in the concrete are likely to de-velop [9]. Thus, it is necessary to study and understand thebehaviour of CFRP strengthened reinforced concrete members,including those failures.
Several researchers have simulated the behaviour of the con-crete–CFRP interface through using a very fine mesh to simulatethe adhesive layer defined as a linear elastic material [10]. How-ever, they have not used any failure criterion for the adhesive layer.Most researchers who have studied the behaviour of retrofittedstructures have, however, not considered the effect of the interfa-cial behaviour at all [11–13].
In this paper, we use the finite element method to model thebehaviour of beams strengthened with CFRP. For validation, thestudy was carried out using a series of beams that had beenexperimentally tested for flexural behaviour and reported byObaidat [14]. Two different models for the CFRP and two differ-ent models for the concrete–CFRP interface are investigated. Themodels are used for analysing beams with different lengths ofCFRP applied.
meq
toco
rc
(a) Retrofitted beam RB1
(b) Retrofitted beam RB2
(c) Retrofitted beam RB3
1560 mm
P/2P/2
1040 mm
P/2P/2
P/2P/2
520 mm
Fig. 2. Length of CFRP laminates in test series RB1, RB2 and RB3.
0 2 4 6 8 10 120
50
100
150
200
Deflection (mm)
Loa
d (k
N)
RB1RB2RB3Control Beam
Fig. 3. Load versus mid-span deflection for un-strengthened and strengthenedbeams.
ructures 92 (2010) 1391–1398
2. Experimental work
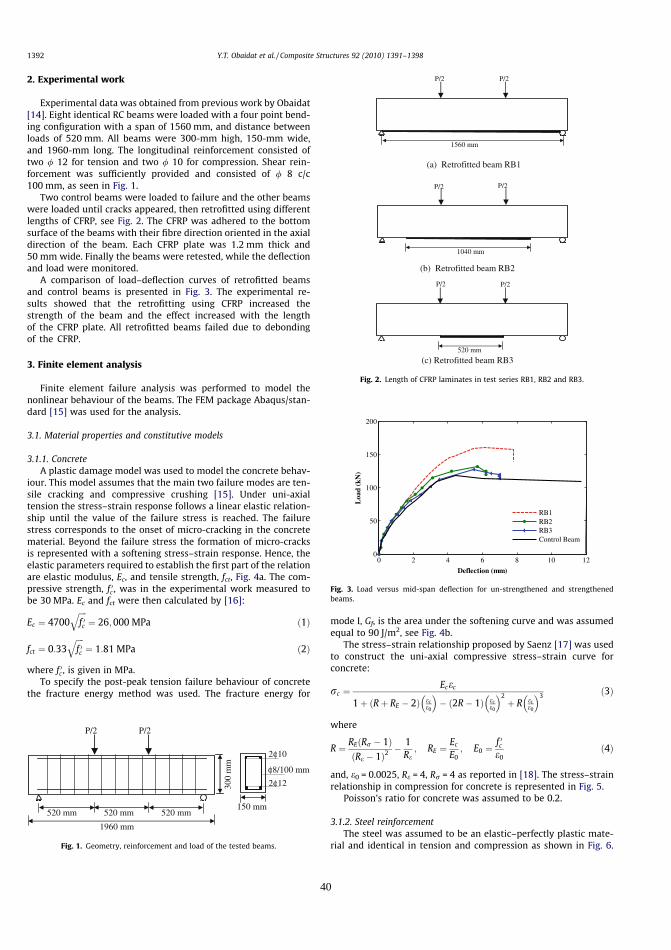
Experimental data was obtained from previous work by Obaidat[14]. Eight identical RC beams were loaded with a four point bend-ing configuration with a span of 1560 mm, and distance betweenloads of 520 mm. All beams were 300-mm high, 150-mm wide,and 1960-mm long. The longitudinal reinforcement consisted oftwo / 12 for tension and two / 10 for compression. Shear rein-forcement was sufficiently provided and consisted of / 8 c/c100 mm, as seen in Fig. 1.
Two control beams were loaded to failure and the other beamswere loaded until cracks appeared, then retrofitted using differentlengths of CFRP, see Fig. 2. The CFRP was adhered to the bottomsurface of the beams with their fibre direction oriented in the axialdirection of the beam. Each CFRP plate was 1.2 mm thick and50 mm wide. Finally the beams were retested, while the deflectionand load were monitored.
A comparison of load–deflection curves of retrofitted beamsand control beams is presented in Fig. 3. The experimental re-sults showed that the retrofitting using CFRP increased thestrength of the beam and the effect increased with the lengthof the CFRP plate. All retrofitted beams failed due to debondingof the CFRP.
3. Finite element analysis
Finite element failure analysis was performed to model thenonlinear behaviour of the beams. The FEM package Abaqus/stan-dard [15] was used for the analysis.
3.1. Material properties and constitutive models
3.1.1. ConcreteA plastic damage model was used to model the concrete behav-
iour. This model assumes that the main two failure modes are ten-sile cracking and compressive crushing [15]. Under uni-axialtension the stress–strain response follows a linear elastic relation-ship until the value of the failure stress is reached. The failurestress corresponds to the onset of micro-cracking in the concretematerial. Beyond the failure stress the formation of micro-cracksis represented with a softening stress–strain response. Hence, theelastic parameters required to establish the first part of the relationare elastic modulus, Ec, and tensile strength, fct, Fig. 4a. The com-pressive strength, f 0c , was in the experimental work measured tobe 30 MPa. Ec and fct were then calculated by [16]:
Ec ¼ 4700ffiffiffiffif 0c
q¼ 26;000 MPa ð1Þ
fct ¼ 0:33ffiffiffiffif 0c
q¼ 1:81 MPa ð2Þ
where f 0c , is given in MPa.To specify the post-peak tension failure behaviour of concrete
the fracture energy method was used. The fracture energy for
1392 Y.T. Obaidat et al. / Composite St
w
R
anre
3.1
ria
P/2P/2
300
mm
1960 mm
150 mm
2φ10
2φ12
φ8/100 mm
520 mm 520 mm 520 mm
Fig. 1. Geometry, reinforcement and load of the tested beams.
40
ode I, Gf, is the area under the softening curve and was assumedual to 90 J/m2, see Fig. 4b.The stress–strain relationship proposed by Saenz [17] was usedconstruct the uni-axial compressive stress–strain curve for
ncrete:
¼ Ecec
1þ Rþ RE � 2ð Þ ece0
� �� ð2R� 1Þ ec
e0
� �2þ R ec
e0
� �3 ð3Þ
here
¼ REðRr � 1ÞðRe � 1Þ2
� 1Re; RE ¼
Ec
E0; E0 ¼
f 0ce0
ð4Þ
d, e0 = 0.0025, Re = 4, Rr = 4 as reported in [18]. The stress–strainlationship in compression for concrete is represented in Fig. 5.
Poisson’s ratio for concrete was assumed to be 0.2.
.2. Steel reinforcementThe steel was assumed to be an elastic–perfectly plastic mate-l and identical in tension and compression as shown in Fig. 6.
eaAes
nic-eyiser.ical-
(a) Stress-strain relationship up to ultimate load. (b) Post-peak stress deformation relationship.
2
1.5
1
0.5
00.00010.00005 ε
σt, MPa
1.81
0.44
σt, MPa
δ, mm0.03 0.1
Gf
Fig. 4. Concrete under uni-axial tension.
τ
0ε
35
30
25
20
15
10
5
00.0025 0.005 0.01 0.015 0.02 0.025 0.03
σc, MPa
for c
Y.T. Obaidat et al. / Composite Structures 92 (2010) 1391–1398 1393
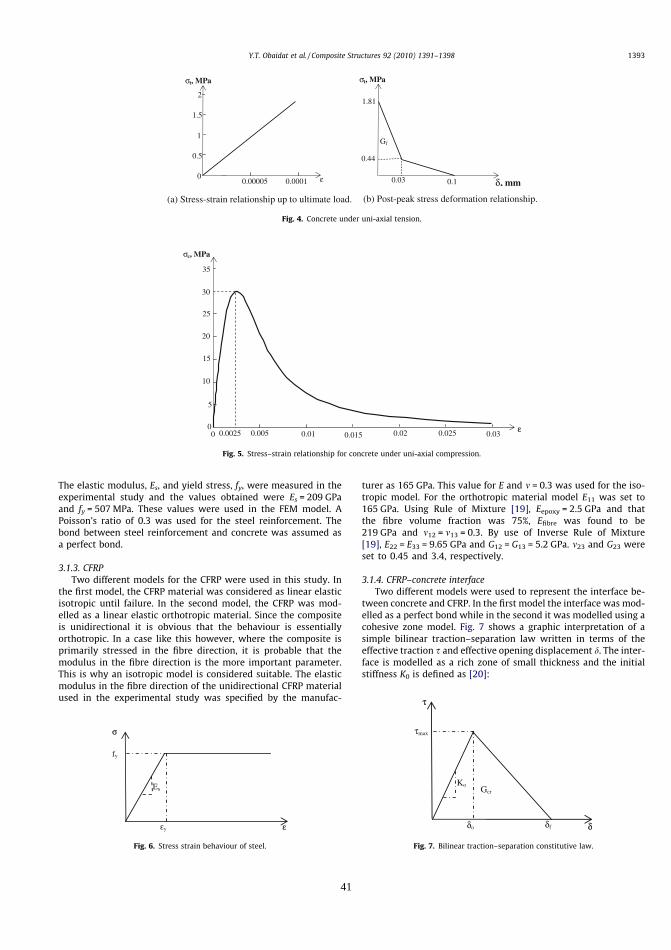
The elastic modulus, Es, and yield stress, fy, were measured in thexperimental study and the values obtained were Es = 209 GPand fy = 507 MPa. These values were used in the FEM model.Poisson’s ratio of 0.3 was used for the steel reinforcement. Thbond between steel reinforcement and concrete was assumed aa perfect bond.
3.1.3. CFRPTwo different models for the CFRP were used in this study. I
the first model, the CFRP material was considered as linear elastisotropic until failure. In the second model, the CFRP was modelled as a linear elastic orthotropic material. Since the compositis unidirectional it is obvious that the behaviour is essentiallorthotropic. In a case like this however, where the compositeprimarily stressed in the fibre direction, it is probable that thmodulus in the fibre direction is the more important parameteThis is why an isotropic model is considered suitable. The elastmodulus in the fibre direction of the unidirectional CFRP materiused in the experimental study was specified by the manufac
Fig. 5. Stress–strain relationship
Es
fy
εy
σ
ε
Fig. 6. Stress strain behaviour of steel.
41
turer as 165 GPa. This value for E and m = 0.3 was used for the iso-tropic model. For the orthotropic material model E11 was set to165 GPa. Using Rule of Mixture [19], Eepoxy = 2.5 GPa and thatthe fibre volume fraction was 75%, Efibre was found to be219 GPa and m12 = m13 = 0.3. By use of Inverse Rule of Mixture[19], E22 = E33 = 9.65 GPa and G12 = G13 = 5.2 GPa. m23 and G23 wereset to 0.45 and 3.4, respectively.
3.1.4. CFRP–concrete interfaceTwo different models were used to represent the interface be-
tween concrete and CFRP. In the first model the interface was mod-elled as a perfect bond while in the second it was modelled using acohesive zone model. Fig. 7 shows a graphic interpretation of asimple bilinear traction–separation law written in terms of theeffective traction s and effective opening displacement d. The inter-face is modelled as a rich zone of small thickness and the initialstiffness K0 is defined as [20]:
oncrete under uni-axial compression.
Gcr
τmax
δo δf δ
Ko
Fig. 7. Bilinear traction–separation constitutive law.
po1:
remthtulapui.e
GCn
wtejudiGC
n
3.2
foanurusarTheloppael
foPeCFm
bybotobyco1an
ructu
K0 ¼1
tiGiþ tc
Gc
ð5Þ
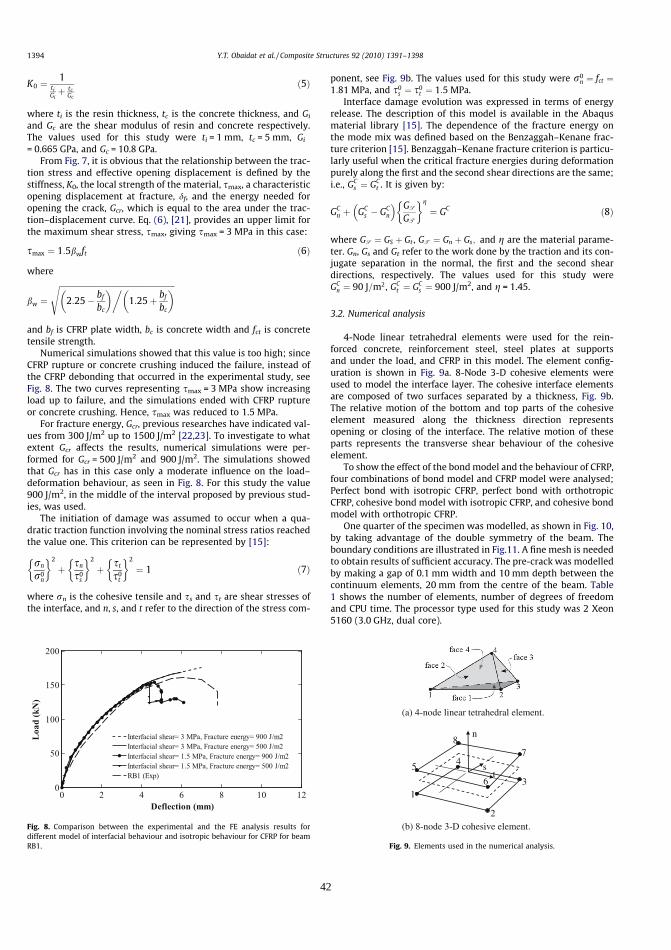
where ti is the resin thickness, tc is the concrete thickness, and Gi
and Gc are the shear modulus of resin and concrete respectively.The values used for this study were ti = 1 mm, tc = 5 mm, Gi
= 0.665 GPa, and Gc = 10.8 GPa.From Fig. 7, it is obvious that the relationship between the trac-
tion stress and effective opening displacement is defined by thestiffness, K0, the local strength of the material, smax, a characteristicopening displacement at fracture, df, and the energy needed foropening the crack, Gcr, which is equal to the area under the trac-tion–displacement curve. Eq. (6), [21], provides an upper limit forthe maximum shear stress, smax, giving smax = 3 MPa in this case:
smax ¼ 1:5bwft ð6Þ
where
bw ¼
ffiffiffiffiffiffiffiffiffiffiffiffiffiffiffiffiffiffiffiffiffiffiffiffiffiffiffiffiffiffiffiffiffiffiffiffiffiffiffiffiffiffiffiffiffiffiffiffiffiffiffiffiffiffiffiffiffiffiffi2:25� bf
bc
� �1:25þ bf
bc
� ��s
and bf is CFRP plate width, bc is concrete width and fct is concretetensile strength.
Numerical simulations showed that this value is too high; sinceCFRP rupture or concrete crushing induced the failure, instead ofthe CFRP debonding that occurred in the experimental study, seeFig. 8. The two curves representing smax = 3 MPa show increasingload up to failure, and the simulations ended with CFRP ruptureor concrete crushing. Hence, smax was reduced to 1.5 MPa.
For fracture energy, Gcr, previous researches have indicated val-ues from 300 J/m2 up to 1500 J/m2 [22,23]. To investigate to whatextent Gcr affects the results, numerical simulations were per-formed for Gcr = 500 J/m2 and 900 J/m2. The simulations showedthat Gcr has in this case only a moderate influence on the load–deformation behaviour, as seen in Fig. 8. For this study the value900 J/m2, in the middle of the interval proposed by previous stud-ies, was used.
The initiation of damage was assumed to occur when a qua-dratic traction function involving the nominal stress ratios reachedthe value one. This criterion can be represented by [15]:
rn
r0n
� 2
þ sn
s0s
� 2
þ st
s0t
� 2
¼ 1 ð7Þ
where rn is the cohesive tensile and ss and st are shear stresses ofthe interface, and n, s, and t refer to the direction of the stress com-
1394 Y.T. Obaidat et al. / Composite St
51
0 2 4 6 8 10 120
50
100
150
200
Deflection (mm)
Load
(kN
)
Interfacial shear= 3 MPa, Fracture energy= 900 J/m2Interfacial shear= 3 MPa, Fracture energy= 500 J/m2Interfacial shear= 1.5 MPa, Fracture energy= 900 J/m2Interfacial shear= 1.5 MPa, Fracture energy= 500 J/m2RB1 (Exp)
Fig. 8. Comparison between the experimental and the FE analysis results fordifferent model of interfacial behaviour and isotropic behaviour for CFRP for beamRB1.
42
nent, see Fig. 9b. The values used for this study were r0n ¼ fct ¼
81 MPa, and s0s ¼ s0
t ¼ 1:5 MPa.Interface damage evolution was expressed in terms of energy
lease. The description of this model is available in the Abaqusaterial library [15]. The dependence of the fracture energy one mode mix was defined based on the Benzaggah–Kenane frac-re criterion [15]. Benzaggah–Kenane fracture criterion is particu-rly useful when the critical fracture energies during deformationrely along the first and the second shear directions are the same;., GC
s ¼ GCt . It is given by:
þ GCs � GC
n
� � GS
GT
� g
¼ GC ð8Þ
here GS ¼ GS þ Gt , GT ¼ Gn þ Gs; and g are the material parame-r. Gn, Gs and Gt refer to the work done by the traction and its con-gate separation in the normal, the first and the second shearrections, respectively. The values used for this study were¼ 90 J=m2, GC
t ¼ GCs ¼ 900 J/m2, and g = 1.45.
. Numerical analysis
4-Node linear tetrahedral elements were used for the rein-rced concrete, reinforcement steel, steel plates at supportsd under the load, and CFRP in this model. The element config-ation is shown in Fig. 9a. 8-Node 3-D cohesive elements wereed to model the interface layer. The cohesive interface elementse composed of two surfaces separated by a thickness, Fig. 9b.e relative motion of the bottom and top parts of the cohesive
ement measured along the thickness direction representsening or closing of the interface. The relative motion of theserts represents the transverse shear behaviour of the cohesive
ement.To show the effect of the bond model and the behaviour of CFRP,
ur combinations of bond model and CFRP model were analysed;rfect bond with isotropic CFRP, perfect bond with orthotropicRP, cohesive bond model with isotropic CFRP, and cohesive bondodel with orthotropic CFRP.One quarter of the specimen was modelled, as shown in Fig. 10,taking advantage of the double symmetry of the beam. The
undary conditions are illustrated in Fig.11. A fine mesh is neededobtain results of sufficient accuracy. The pre-crack was modelledmaking a gap of 0.1 mm width and 10 mm depth between the
ntinuum elements, 20 mm from the centre of the beam. Tableshows the number of elements, number of degrees of freedomd CPU time. The processor type used for this study was 2 Xeon60 (3.0 GHz, dual core).
res 92 (2010) 1391–1398
(b) 8-node 3-D cohesive element.
87
3
2
1
5 4
n
s
6t
(a) 4-node linear tetrahedral element.
Fig. 9. Elements used in the numerical analysis.
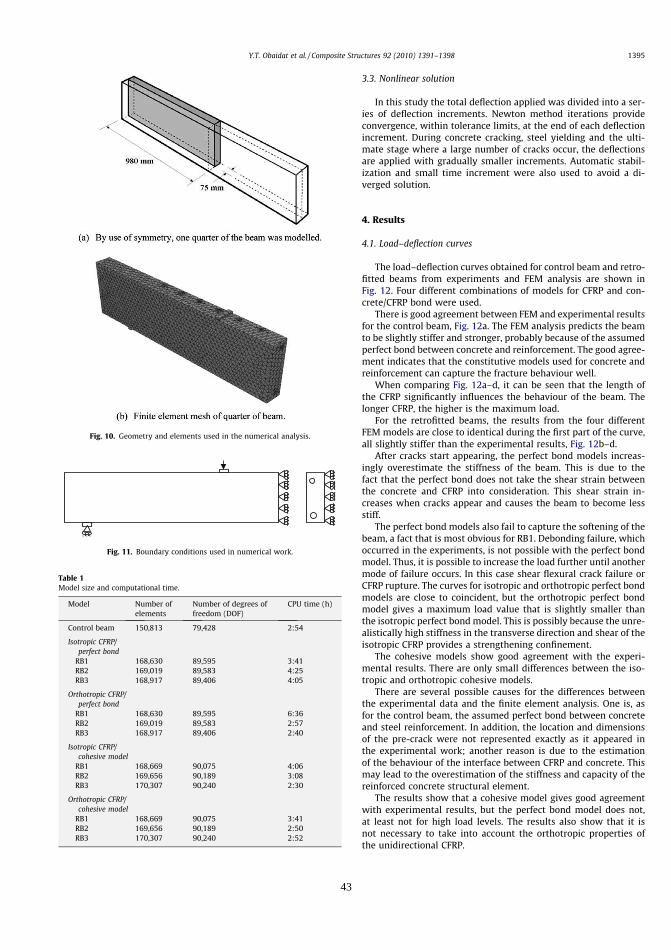
Fig. 10. Geometry and elements used in the numerical analysis.
Fig. 11. Boundary conditions used in numerical work.
Table 1Model size and computational time.
Model Number ofelements
Number of degrees offreedom (DOF)
CPU time (h)
Control beam 150,813 79,428 2:54
Isotropic CFRP/perfect bond
RB1 168,630 89,595 3:41RB2 169,019 89,583 4:25RB3 168,917 89,406 4:05
Orthotropic CFRP/perfect bond
RB1 168,630 89,595 6:36RB2 169,019 89,583 2:57RB3 168,917 89,406 2:40
Isotropic CFRP/cohesive model
RB1 168,669 90,075 4:06RB2 169,656 90,189 3:08RB3 170,307 90,240 2:30
Orthotropic CFRP/cohesive model
RB1 168,669 90,075 3:41RB2 169,656 90,189 2:50RB3 170,307 90,240 2:52
Y.T. Obaidat et al. / Composite S
43
3.3. Nonlinear solution
In this study the total deflection applied was divided into a ser-ies of deflection increments. Newton method iterations provide
tructures 92 (2010) 1391–1398 1395
convergence, within tolerance limits, at the end of each deflectionincrement. During concrete cracking, steel yielding and the ulti-
mate stage where a large number of cracks occur, the deflectionsare applied with gradually smaller increments. Automatic stabil-ization and small time increment were also used to avoid a di-verged solution.4. Results
4.1. Load–deflection curves
The load–deflection curves obtained for control beam and retro-fitted beams from experiments and FEM analysis are shown inFig. 12. Four different combinations of models for CFRP and con-crete/CFRP bond were used.
There is good agreement between FEM and experimental resultsfor the control beam, Fig. 12a. The FEM analysis predicts the beamto be slightly stiffer and stronger, probably because of the assumedperfect bond between concrete and reinforcement. The good agree-ment indicates that the constitutive models used for concrete andreinforcement can capture the fracture behaviour well.
When comparing Fig. 12a–d, it can be seen that the length ofthe CFRP significantly influences the behaviour of the beam. Thelonger CFRP, the higher is the maximum load.
For the retrofitted beams, the results from the four differentFEM models are close to identical during the first part of the curve,all slightly stiffer than the experimental results, Fig. 12b–d.
After cracks start appearing, the perfect bond models increas-ingly overestimate the stiffness of the beam. This is due to thefact that the perfect bond does not take the shear strain betweenthe concrete and CFRP into consideration. This shear strain in-creases when cracks appear and causes the beam to become lessstiff.
The perfect bond models also fail to capture the softening of thebeam, a fact that is most obvious for RB1. Debonding failure, whichoccurred in the experiments, is not possible with the perfect bondmodel. Thus, it is possible to increase the load further until anothermode of failure occurs. In this case shear flexural crack failure orCFRP rupture. The curves for isotropic and orthotropic perfect bondmodels are close to coincident, but the orthotropic perfect bondmodel gives a maximum load value that is slightly smaller thanthe isotropic perfect bond model. This is possibly because the unre-alistically high stiffness in the transverse direction and shear of theisotropic CFRP provides a strengthening confinement.
The cohesive models show good agreement with the experi-mental results. There are only small differences between the iso-tropic and orthotropic cohesive models.
There are several possible causes for the differences betweenthe experimental data and the finite element analysis. One is, asfor the control beam, the assumed perfect bond between concreteand steel reinforcement. In addition, the location and dimensionsof the pre-crack were not represented exactly as it appeared inthe experimental work; another reason is due to the estimationof the behaviour of the interface between CFRP and concrete. Thismay lead to the overestimation of the stiffness and capacity of thereinforced concrete structural element.
The results show that a cohesive model gives good agreementwith experimental results, but the perfect bond model does not,at least not for high load levels. The results also show that it isnot necessary to take into account the orthotropic properties ofthe unidirectional CFRP.
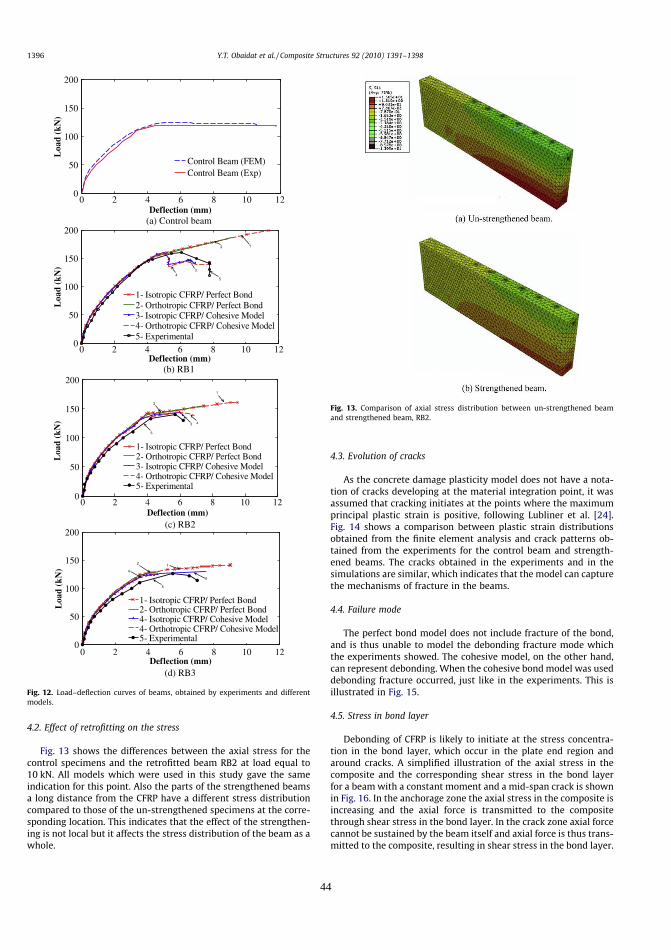
4.2. Effect of retrofitting on the stress
4.3
tioasprFiobtaensimth
4.4
anthcadeill
4.5
tioarcofoininthcam
(a) Control beam
(b) RB1
(c) RB2
(d) RB3
0 2 4 6 8 10 120
50
100
150
200
Deflection (mm)
Loa
d (k
N)
Control Beam (FEM)Control Beam (Exp)
0 2 4 6 8 10 120
50
100
150
200
Deflection (mm)
Loa
d (k
N)
1- Isotropic CFRP/ Perfect Bond2- Orthotropic CFRP/ Perfect Bond3- Isotropic CFRP/ Cohesive Model4- Orthotropic CFRP/ Cohesive Model5- Experimental
1
43
2
5
0 2 4 6 8 10 120
50
100
150
200
Deflection (mm)
Loa
d (k
N)
1- Isotropic CFRP/ Perfect Bond2- Orthotropic CFRP/ Perfect Bond3- Isotropic CFRP/ Cohesive Model4- Orthotropic CFRP/ Cohesive Model5- Experimental
5
1
2
43
0 2 4 6 8 10 120
50
100
150
200
Deflection (mm)
Loa
d (k
N)
1- Isotropic CFRP/ Perfect Bond2- Orthotropic CFRP/ Perfect Bond4- Isotropic CFRP/ Cohesive Model4- Orthotropic CFRP/ Cohesive Model5- Experimental
5
3
4
2 1
Fig. 12. Load–deflection curves of beams, obtained by experiments and differentmodels.
Fig. 13. Comparison of axial stress distribution between un-strengthened beamand strengthened beam, RB2.
1396 Y.T. Obaidat et al. / Composite Structures 92 (2010) 1391–1398
4
Fig. 13 shows the differences between the axial stress for thecontrol specimens and the retrofitted beam RB2 at load equal to10 kN. All models which were used in this study gave the sameindication for this point. Also the parts of the strengthened beamsa long distance from the CFRP have a different stress distributioncompared to those of the un-strengthened specimens at the corre-sponding location. This indicates that the effect of the strengthen-ing is not local but it affects the stress distribution of the beam as awhole.
4
. Evolution of cracks
As the concrete damage plasticity model does not have a nota-n of cracks developing at the material integration point, it was
sumed that cracking initiates at the points where the maximumincipal plastic strain is positive, following Lubliner et al. [24].g. 14 shows a comparison between plastic strain distributionstained from the finite element analysis and crack patterns ob-ined from the experiments for the control beam and strength-ed beams. The cracks obtained in the experiments and in the
ulations are similar, which indicates that the model can capturee mechanisms of fracture in the beams.
. Failure mode
The perfect bond model does not include fracture of the bond,d is thus unable to model the debonding fracture mode whiche experiments showed. The cohesive model, on the other hand,n represent debonding. When the cohesive bond model was usedbonding fracture occurred, just like in the experiments. This isustrated in Fig. 15.
. Stress in bond layer
Debonding of CFRP is likely to initiate at the stress concentra-n in the bond layer, which occur in the plate end region and
ound cracks. A simplified illustration of the axial stress in themposite and the corresponding shear stress in the bond layerr a beam with a constant moment and a mid-span crack is shownFig. 16. In the anchorage zone the axial stress in the composite iscreasing and the axial force is transmitted to the compositerough shear stress in the bond layer. In the crack zone axial forcennot be sustained by the beam itself and axial force is thus trans-itted to the composite, resulting in shear stress in the bond layer.
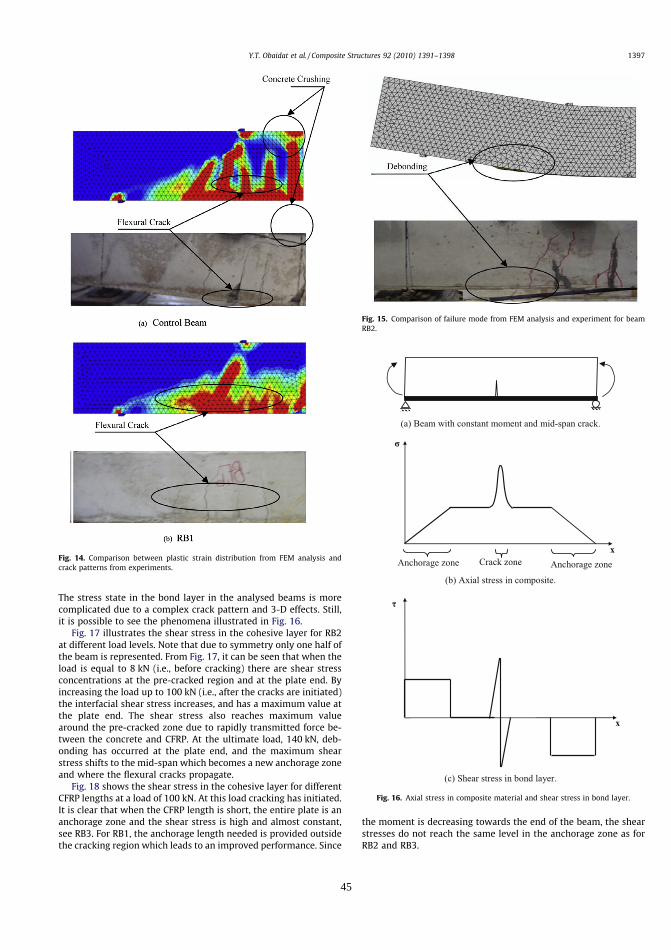
ell,
2fesy)te--re
td.nt,ee
the moment is decreasing towards the end of the beam, the shearstresses do not reach the same level in the anchorage zone as forRB2 and RB3.
Fig. 14. Comparison between plastic strain distribution from FEM analysis andcrack patterns from experiments.
Fig. 15. Comparison of failure mode from FEM analysis and experiment for beamRB2.
Fig. 16. Axial stress in composite material and shear stress in bond layer.
Y.T. Obaidat et al. / Composite Structures 92 (2010) 1391–1398 1397
45
The stress state in the bond layer in the analysed beams is morcomplicated due to a complex crack pattern and 3-D effects. Stiit is possible to see the phenomena illustrated in Fig. 16.
Fig. 17 illustrates the shear stress in the cohesive layer for RBat different load levels. Note that due to symmetry only one half othe beam is represented. From Fig. 17, it can be seen that when thload is equal to 8 kN (i.e., before cracking) there are shear stresconcentrations at the pre-cracked region and at the plate end. Bincreasing the load up to 100 kN (i.e., after the cracks are initiatedthe interfacial shear stress increases, and has a maximum value athe plate end. The shear stress also reaches maximum valuaround the pre-cracked zone due to rapidly transmitted force between the concrete and CFRP. At the ultimate load, 140 kN, debonding has occurred at the plate end, and the maximum sheastress shifts to the mid-span which becomes a new anchorage zonand where the flexural cracks propagate.
Fig. 18 shows the shear stress in the cohesive layer for differenCFRP lengths at a load of 100 kN. At this load cracking has initiateIt is clear that when the CFRP length is short, the entire plate is aanchorage zone and the shear stress is high and almost constansee RB3. For RB1, the anchorage length needed is provided outsidthe cracking region which leads to an improved performance. Sinc

Re
[1
[2
[3
[4
[5
[6
[7
[8
[9
[10
[11
[12
[13
[14
[15
[16
[17
[18
[19
[20
[21
[22
[23
[24
0100200300400500-1.5
-1
-0.5
0
0.5
1
1.5
Distance from midspan (mm)
Inte
rfac
ial s
hear
str
ess
(MP
a)
140 kN100 kN8 kN
Precrack
Fig. 17. Shear stress of the interface layer at different loads for beam RB2.
0200400600800-1.5
-1
-0.5
0
0.5
1
1.5
Distance from midspan (mm)
Inte
rfac
ial s
hear
str
ess
(MP
a)
RB3RB2RB1
Precrack
Fig. 18. Shear stress of the interface layer for different beams at 100 kN.
1398 Y.T. Obaidat et al. / Composite Structu
5. Conclusions
A finite element model was developed to analyse beams retro-fitted with CFRP. The finite element results show good agreementwith the experimental results. Elastic orthotropic and isotropicbehaviours were used to represent the CFRP behaviour; also acohesive model was used to address the interfacial behaviour be-tween CFRP and concrete. The following conclusions can be drawnfrom this study:
� The behaviour of the retrofitted beams is significantly influ-enced by the length of CFRP. This is clear in experimentalresults as well as in numerical analysis. The ultimate loadincreases with the length of the CFRP.
� The perfect bond model failed to capture the softening ofthe beams.
� No significant differences were observed when differentassumptions were used for CFRP with the cohesive bondmodel.
46
� The cohesive model proved able to represent the bondbehaviour between CFRP and concrete. The predicted ulti-mate loads and the debonding failure mode were in excel-lent correlation with the experimental work.
ferences
] Kachlakev D, Mccurry DD. Behavior of full-scale reinforced concrete beamsretrofitted for shear and flexural with FRP laminates. Compos J2000;31:445–52.
] Valivonis J, Skuturna T. Cracking and strength of reinforced concrete structuresin flexure strengthened with carbon fibre laminates. Civ Eng Manage J2006;13(4):317–33.
] Yeong-soo S, Chadon L. Flexural behavior of reinforced concrete beamsstrengthened with carbon fiber-reinforced polymer laminates at differentlevels of sustaining load. ACI Struct J 2003;100:231–40.
] Aram MR, Gzaderski C, Motavalli M. Debonding failure modes of flexural FRP-strengthened RC beam. Compos Part B 2008;39:826–41.
] Ashour AF, El-Refaie SA, Garrity SW. Flexural strengthening of RC continuousbeams using CFRP laminates. Cement Concr Compos 2004;26:765–75.
] Ai-hui Z, Wei-Liang J, Gui-bing L. Behaviour of preloaded RC beamsstrengthened with CFRP laminates. J Zhejiang Univ Sci A 2006:436–44.
] Wenwei W, Guo L. Experimental study of RC beams strengthened with CFRPsheets under sustaining loads. Wuhan Univ Technol – Mater Sci Ed J2006;21(3).
] Esfahani M, Kianoush M, Tajari A. Flexural behaviour of reinforced concretebeams strengthened by CFRP sheets. Eng Struct 2007;29:2428–44.
] Teng JG, Smith ST, Yao J, Chen JF. Intermediate crack-introduced debonding inbeams and slabs. Construct Build Mater J 2003;17(6–7):447–62.
] Ebead U, Marzouk H. Tension–stiffening model for FRP strengthened RCconcrete two-way slab. Mater Struct 2004:193–200.
] Hu H-T, Lin F-M, Jan Y-Y. Nonlinear finite element analysis of reinforcedconcrete beams strengthened by fibre-reinforced plastic. Compos Struct J2004;63:271–81.
] Lundquist J, Nordin H, Täljsten B, Olafsson T. Numerical analysis of concretebeams strengthened with CFRP – a study of anchorage lengths. In: FRP inconstruction, Proceeding of the international symposium of bond behaviour ofFRP in structures; 2005. p. 247–54.
] Santhakumar R, Chandrasekaran E. Analysis of retrofitted reinforced concreteshear beams using carbon fibre composite. Electron J Struct Eng 2004;4:66–74.
] Obaidat Y. Retrofitting of reinforced concrete beams using compositelaminates. Master Thesis, Jordan University of Science and Technology; 2007.
] Hibbitt, Karlsson, and Sorensen, Inc. ABAQUS Theory manual, User manual andExample Manual, Version 6.7. Providence, RI; 2000.
] ACI Committee 318. Building code requirements for structural concrete andcommentary (ACI 318-99). Detroit (MI): American Concrete Institute; 1999.
] Saenz, LP. Discussion of ‘‘Equation for the stress-strain curve of concrete” byDesayi P, Krishnan S. ACI Journal 1964;61:1229–35.
] Hu H-T, Schnobrich WC. Constitutive modelling of concrete by usingnonassociated plasticity. J Mater Civil Eng (ASCE) 1989;1(4):199–216.
] Piggott M. Load bearing fibre composites. 2nd ed. Boston/Dordrecht/London: Kluwer Academic Publishers; 2002.
] Guo ZG, Cao SY, Sun WM, Lin XY. Experimental study on bond stress-slipbehaviour between FRP sheets and concrete. In: FRP in construction,proceedings of the international symposium on bond behaviour of FRP instructures; 2005. p. 77–84.
] Lu XZ, Ten JG, Ye LP, Jaing JJ. Bond-slip models for FRP sheets/plates bonded toconcrete. Eng Struct 2005;24(5):920–37.
] JCI. Technical report on continuos fibre reinforced concrete. JCI TC952 oncontinuos reinforced concrete; 1998. p. 116–24.
] JCI. Technical report on retrofit technology for concrete structures. Technicalcommittee on retrofitting technology for concrete structures; 2003. p. 79–97.
] Lubliner J, Oliver J, Oller S, Oñate E. A plastic-damage model for concrete. Int JSolids Struct 1989;25:299–329.
res 92 (2010) 1391–1398
47
Paper C
Nonlinear FE modelling of shear behaviour in
RC beam retrofitted with CFRP
Yasmeen Taleb Obaidat, Ola Dahlblom and Susanne Heyden
Published in proceedings of Computational Modelling of Concrete Structures
(EURO-C 2010), Austria, 2010
C

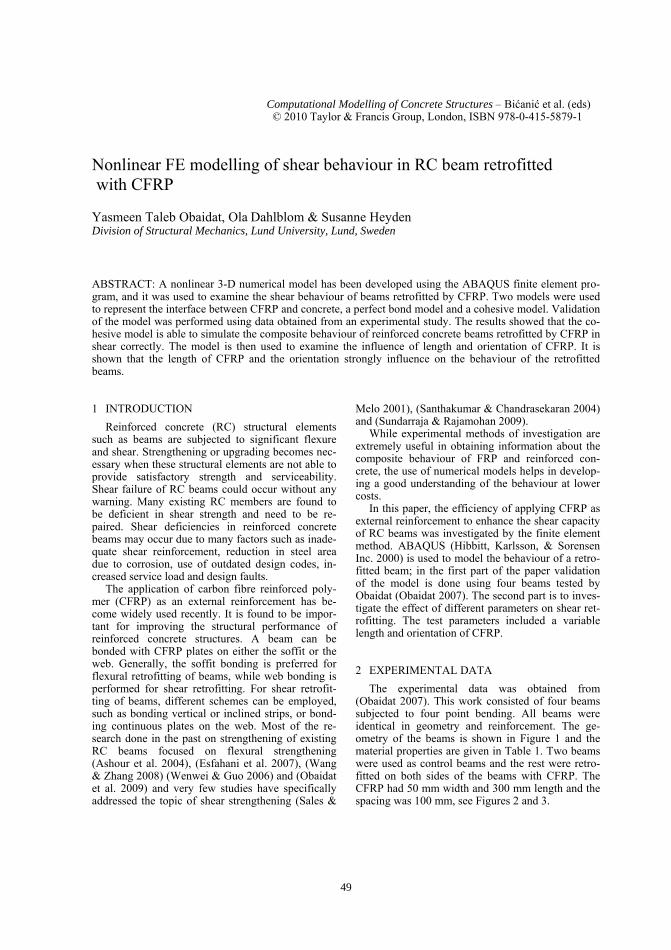
1 INTRODUCTION Reinforced concrete (RC) structural elements
such as beams are subjected to significant flexure and shear. Strengthening or upgrading becomes nec-essary when these structural elements are not able to provide satisfactory strength and serviceability. Shear failure of RC beams could occur without any warning. Many existing RC members are found to be deficient in shear strength and need to be re-paired. Shear deficiencies in reinforced concrete beams may occur due to many factors such as inade-quate shear reinforcement, reduction in steel area due to corrosion, use of outdated design codes, in-creased service load and design faults.
The application of carbon fibre reinforced poly-mer (CFRP) as an external reinforcement has be-come widely used recently. It is found to be impor-tant for improving the structural performance of reinforced concrete structures. A beam can be bonded with CFRP plates on either the soffit or the web. Generally, the soffit bonding is preferred for flexural retrofitting of beams, while web bonding is performed for shear retrofitting. For shear retrofit-ting of beams, different schemes can be employed, such as bonding vertical or inclined strips, or bond-ing continuous plates on the web. Most of the re-search done in the past on strengthening of existing RC beams focused on flexural strengthening (Ashour et al. 2004), (Esfahani et al. 2007), (Wang & Zhang 2008) (Wenwei & Guo 2006) and (Obaidat et al. 2009) and very few studies have specifically addressed the topic of shear strengthening (Sales &
Melo 2001), (Santhakumar & Chandrasekaran 2004) and (Sundarraja & Rajamohan 2009).
While experimental methods of investigation are extremely useful in obtaining information about the composite behaviour of FRP and reinforced con-crete, the use of numerical models helps in develop-ing a good understanding of the behaviour at lower costs.
In this paper, the efficiency of applying CFRP as external reinforcement to enhance the shear capacity of RC beams was investigated by the finite element method. ABAQUS (Hibbitt, Karlsson, & Sorensen Inc. 2000) is used to model the behaviour of a retro-fitted beam; in the first part of the paper validation of the model is done using four beams tested by Obaidat (Obaidat 2007). The second part is to inves-tigate the effect of different parameters on shear ret-rofitting. The test parameters included a variable length and orientation of CFRP.
2 EXPERIMENTAL DATA The experimental data was obtained from
(Obaidat 2007). This work consisted of four beams subjected to four point bending. All beams were identical in geometry and reinforcement. The ge-ometry of the beams is shown in Figure 1 and the material properties are given in Table 1. Two beams were used as control beams and the rest were retro-fitted on both sides of the beams with CFRP. The CFRP had 50 mm width and 300 mm length and the spacing was 100 mm, see Figures 2 and 3.
Nonlinear FE modelling of shear behaviour in RC beam retrofitted with CFRP Yasmeen Taleb Obaidat, Ola Dahlblom & Susanne Heyden Division of Structural Mechanics, Lund University, Lund, Sweden
ABSTRACT: A nonlinear 3-D numerical model has been developed using the ABAQUS finite element pro-gram, and it was used to examine the shear behaviour of beams retrofitted by CFRP. Two models were used to represent the interface between CFRP and concrete, a perfect bond model and a cohesive model. Validation of the model was performed using data obtained from an experimental study. The results showed that the co-hesive model is able to simulate the composite behaviour of reinforced concrete beams retrofitted by CFRP in shear correctly. The model is then used to examine the influence of length and orientation of CFRP. It is shown that the length of CFRP and the orientation strongly influence on the behaviour of the retrofitted beams.
Computational Modelling of Concrete Structures – Bićanić et al. (eds) © 2010 Taylor & Francis Group, London, ISBN 978-0-415-5879-1
49

Figure 1. Geometry, arrangement of reinforcement and load of the tested beams.
Figure 2. The arrangement of the CFRP laminate in retrofitted beams.
Figure 3. Installation CFRP in experimental work. Table.1. Mechanical properties of materials used. Steel fy 507 MPa Es 210 GPa ν 0.3 Concrete f ′ 30 MPa CFRP Ef 165 GPa
ff 2 GPa
3 NUMERICAL SIMULATIONS
3.1 Studied bodies In order to study how the length and orientation
of CFRP affect the shear behaviour of retrofitted beams, numerical simulations were conducted for the cases shown in Figure 4. Three different lengths of CFRP were used in the simulations. The orienta-tion of the CFRP was also varied keeping the amount of CFRP as in 90º by using 35 mm width of CFRP. Two different models for the concrete-CFRP interface were evaluated in the validation.
(a) RB 90/300.
(b) RB 90/200.
(c) RB 90/100.
(d) RB 45/300.
(e) RB 45/200.
(f) RB 45/100. Figure 4. Studied CFRP configurations.
3.2 Material Models
3.2.1 Concrete A plastic damage model was used to represent the
behaviour of concrete. The model assumes that the two main failure mechanisms are tensile cracking and compressive crushing of the concrete material.
The softening curve of concrete under tension is shown in Figure 5, where fct is the tensile strength, and Gf is the fracture energy of concrete, (Hillerborg 1985). The tensile strength of concrete can be ob-tained from Equation 1 (ACI Comitte 318. 1999), and the fracture energy was assumed equal to 90 J/m2.
f 0.35 f ′ 1.81 MPa 1
P/2P/2
300
mm
1960 mm
150 mm
2ϕ10
2ϕ18ϕ8/400 mm
520mm 520mm 520mm
520 mm
300
mm
CFRP
100 mm 50 mm
520 mm
300
mm
CFRP
100 mm 50 mm
520 mm
200
mm
CFRP
100 mm 50 mm
CFRP
50 mm 520 mm 100 mm
100
mm
20
0 m
m
CFRP
100 mm
420 mm
100
mm
CFRP 100 mm
420 mm
300
mm
CFRP
100 mm
420 mm
50
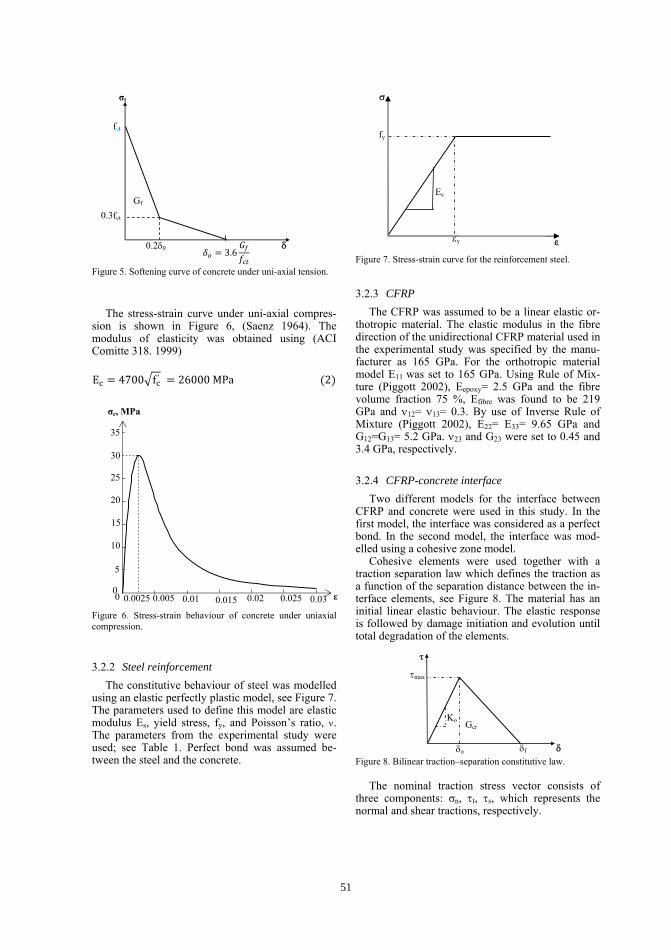
Figure 5. Softening curve of concrete under uni-axial tension.
The stress-strain curve under uni-axial compres-
sion is shown in Figure 6, (Saenz 1964). The modulus of elasticity was obtained using (ACI Comitte 318. 1999)
E 4700 f ′ 26000 MPa 2
Figure 6. Stress-strain behaviour of concrete under uniaxial compression.
3.2.2 Steel reinforcement The constitutive behaviour of steel was modelled
using an elastic perfectly plastic model, see Figure 7. The parameters used to define this model are elastic modulus Es, yield stress, fy, and Poisson’s ratio, ν. The parameters from the experimental study were used; see Table 1. Perfect bond was assumed be-tween the steel and the concrete.
Figure 7. Stress-strain curve for the reinforcement steel.
3.2.3 CFRP The CFRP was assumed to be a linear elastic or-
thotropic material. The elastic modulus in the fibre direction of the unidirectional CFRP material used in the experimental study was specified by the manu-facturer as 165 GPa. For the orthotropic material model E11 was set to 165 GPa. Using Rule of Mix-ture (Piggott 2002), Eepoxy= 2.5 GPa and the fibre volume fraction 75 %, Efibre was found to be 219 GPa and ν12= ν13= 0.3. By use of Inverse Rule of Mixture (Piggott 2002), E22= E33= 9.65 GPa and G12=G13= 5.2 GPa. ν23 and G23 were set to 0.45 and 3.4 GPa, respectively.
3.2.4 CFRP-concrete interface Two different models for the interface between
CFRP and concrete were used in this study. In the first model, the interface was considered as a perfect bond. In the second model, the interface was mod-elled using a cohesive zone model.
Cohesive elements were used together with a traction separation law which defines the traction as a function of the separation distance between the in-terface elements, see Figure 8. The material has an initial linear elastic behaviour. The elastic response is followed by damage initiation and evolution until total degradation of the elements.
Figure 8. Bilinear traction–separation constitutive law.
The nominal traction stress vector consists of
three components: σn, τt, τs, which represents the normal and shear tractions, respectively.
Gcr
τmax
δo δf δ
τ
Ko
σc, MPa
0 ε
35
30
25
20
15
10
5
0 0.0025 0.005 0.01 0.015 0.02 0.025 0.03
σ
fy
Es
εy ε
0.3fct
0.2δ0
fct
Gf
δ
σt
3.6
51
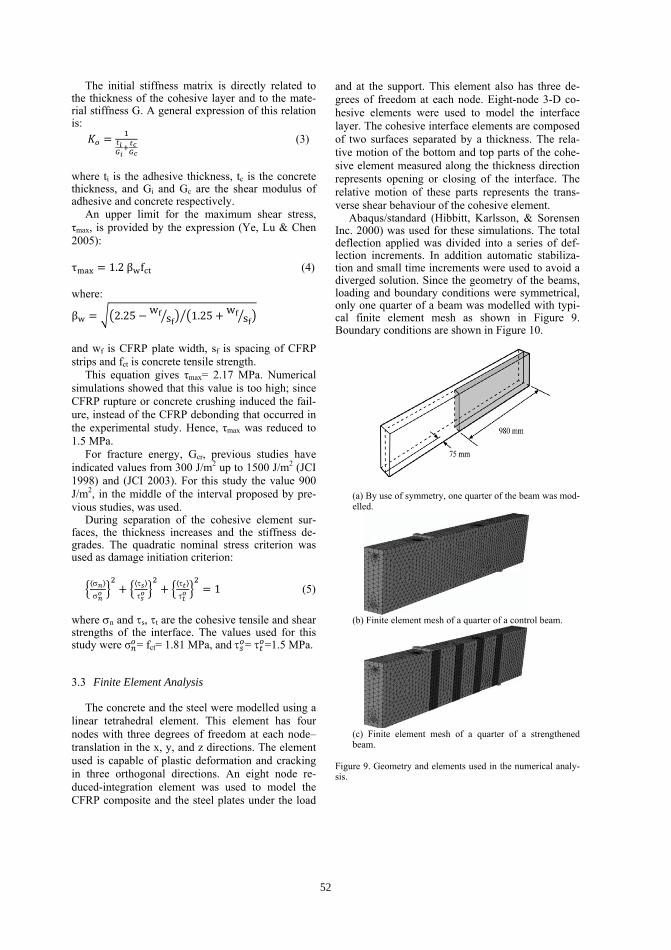
The initial stiffness matrix is directly related to the thickness of the cohesive layer and to the mate-rial stiffness G. A general expression of this relation is:
(3)
where ti is the adhesive thickness, tc is the concrete thickness, and Gi and Gc are the shear modulus of adhesive and concrete respectively.
An upper limit for the maximum shear stress, τmax, is provided by the expression (Ye, Lu & Chen 2005):
τ 1.2 β f (4) where:
β 2.25 ws 1.25 w
s
and wf is CFRP plate width, sf is spacing of CFRP strips and fct is concrete tensile strength.
This equation gives τmax= 2.17 MPa. Numerical simulations showed that this value is too high; since CFRP rupture or concrete crushing induced the fail-ure, instead of the CFRP debonding that occurred in the experimental study. Hence, τmax was reduced to 1.5 MPa.
For fracture energy, Gcr, previous studies have indicated values from 300 J/m2 up to 1500 J/m2 (JCI 1998) and (JCI 2003). For this study the value 900 J/m2, in the middle of the interval proposed by pre-vious studies, was used.
During separation of the cohesive element sur-faces, the thickness increases and the stiffness de-grades. The quadratic nominal stress criterion was used as damage initiation criterion:
σ
σ
τ
τ
τ
τ1 (5)
where σn and τs, τt are the cohesive tensile and shear strengths of the interface. The values used for this study were σ = fct= 1.81 MPa, and τ = τ =1.5 MPa.
3.3 Finite Element Analysis
The concrete and the steel were modelled using a linear tetrahedral element. This element has four nodes with three degrees of freedom at each node–translation in the x, y, and z directions. The element used is capable of plastic deformation and cracking in three orthogonal directions. An eight node re-duced-integration element was used to model the CFRP composite and the steel plates under the load
and at the support. This element also has three de-grees of freedom at each node. Eight-node 3-D co-hesive elements were used to model the interface layer. The cohesive interface elements are composed of two surfaces separated by a thickness. The rela-tive motion of the bottom and top parts of the cohe-sive element measured along the thickness direction represents opening or closing of the interface. The relative motion of these parts represents the trans-verse shear behaviour of the cohesive element.
Abaqus/standard (Hibbitt, Karlsson, & Sorensen Inc. 2000) was used for these simulations. The total deflection applied was divided into a series of def-lection increments. In addition automatic stabiliza-tion and small time increments were used to avoid a diverged solution. Since the geometry of the beams, loading and boundary conditions were symmetrical, only one quarter of a beam was modelled with typi-cal finite element mesh as shown in Figure 9. Boundary conditions are shown in Figure 10.
(a) By use of symmetry, one quarter of the beam was mod-elled.
(b) Finite element mesh of a quarter of a control beam.
(c) Finite element mesh of a quarter of a strengthened beam.
Figure 9. Geometry and elements used in the numerical analy-sis.
52
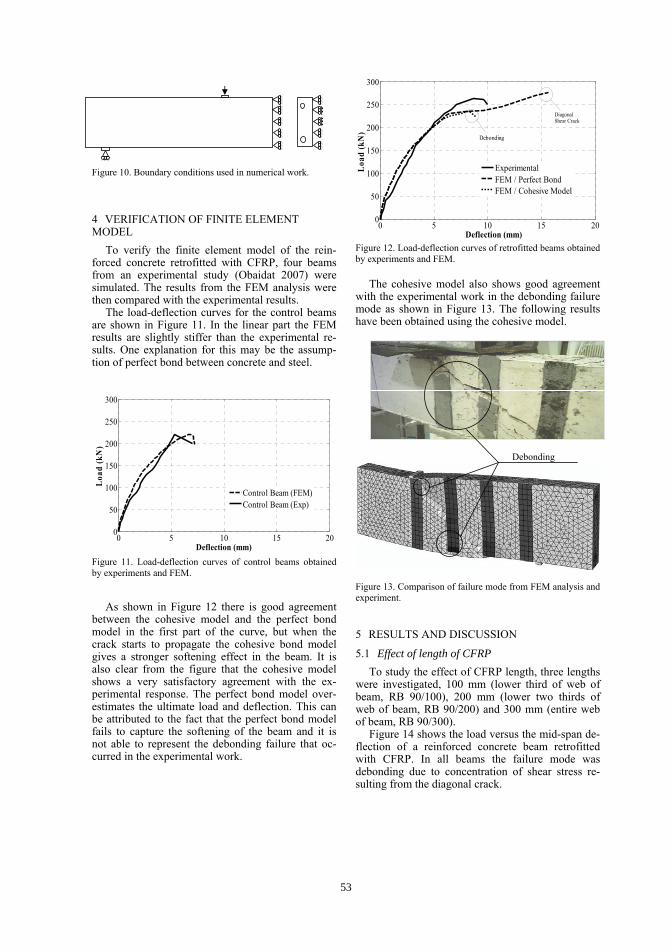
Figure 10. Boundary conditions used in numerical work.
4 VERIFICATION OF FINITE ELEMENT MODEL
To verify the finite element model of the rein-forced concrete retrofitted with CFRP, four beams from an experimental study (Obaidat 2007) were simulated. The results from the FEM analysis were then compared with the experimental results.
The load-deflection curves for the control beams are shown in Figure 11. In the linear part the FEM results are slightly stiffer than the experimental re-sults. One explanation for this may be the assump-tion of perfect bond between concrete and steel.
Figure 11. Load-deflection curves of control beams obtained by experiments and FEM.
As shown in Figure 12 there is good agreement between the cohesive model and the perfect bond model in the first part of the curve, but when the crack starts to propagate the cohesive bond model gives a stronger softening effect in the beam. It is also clear from the figure that the cohesive model shows a very satisfactory agreement with the ex-perimental response. The perfect bond model over-estimates the ultimate load and deflection. This can be attributed to the fact that the perfect bond model fails to capture the softening of the beam and it is not able to represent the debonding failure that oc-curred in the experimental work.
Figure 12. Load-deflection curves of retrofitted beams obtained by experiments and FEM.
The cohesive model also shows good agreement with the experimental work in the debonding failure mode as shown in Figure 13. The following results have been obtained using the cohesive model.
Figure 13. Comparison of failure mode from FEM analysis and experiment.
5 RESULTS AND DISCUSSION
5.1 Effect of length of CFRP To study the effect of CFRP length, three lengths
were investigated, 100 mm (lower third of web of beam, RB 90/100), 200 mm (lower two thirds of web of beam, RB 90/200) and 300 mm (entire web of beam, RB 90/300).
Figure 14 shows the load versus the mid-span de-flection of a reinforced concrete beam retrofitted with CFRP. In all beams the failure mode was debonding due to concentration of shear stress re-sulting from the diagonal crack.
0 5 10 15 200
50
100
150
200
250
300
Deflection (mm)
Loa
d (k
N)
Control Beam (FEM)Control Beam (Exp)
0 5 10 15 200
50
100
150
200
250
300
Deflection (mm)
Loa
d (k
N)
ExperimentalFEM / Perfect BondFEM / Cohesive Model
DiagonalShear Crack
Debonding
Debonding
53
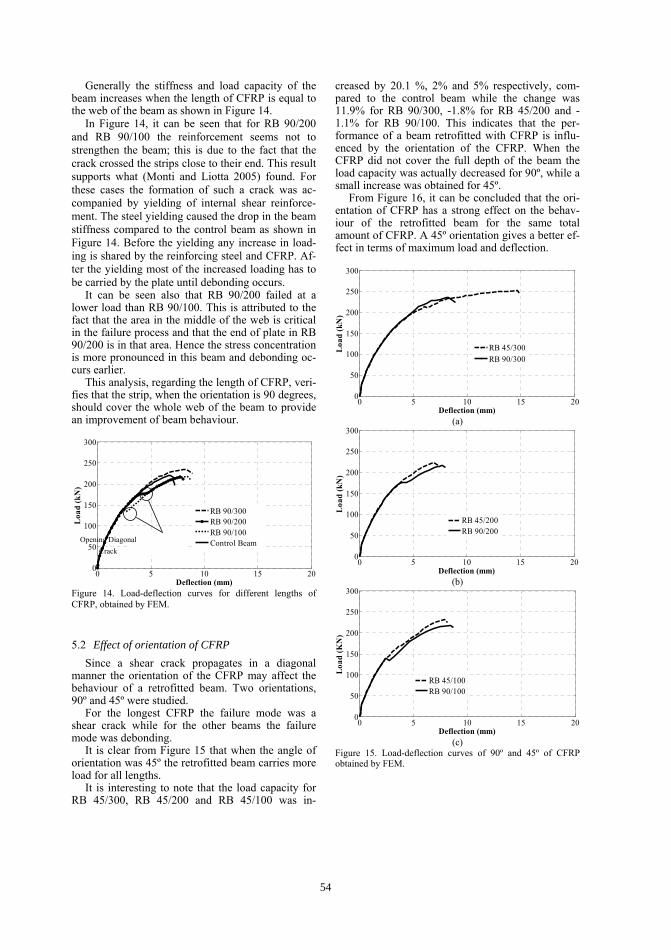
Generally the stiffness and load capacity of the beam increases when the length of CFRP is equal to the web of the beam as shown in Figure 14.
In Figure 14, it can be seen that for RB 90/200 and RB 90/100 the reinforcement seems not to strengthen the beam; this is due to the fact that the crack crossed the strips close to their end. This result supports what (Monti and Liotta 2005) found. For these cases the formation of such a crack was ac-companied by yielding of internal shear reinforce-ment. The steel yielding caused the drop in the beam stiffness compared to the control beam as shown in Figure 14. Before the yielding any increase in load-ing is shared by the reinforcing steel and CFRP. Af-ter the yielding most of the increased loading has to be carried by the plate until debonding occurs.
It can be seen also that RB 90/200 failed at a lower load than RB 90/100. This is attributed to the fact that the area in the middle of the web is critical in the failure process and that the end of plate in RB 90/200 is in that area. Hence the stress concentration is more pronounced in this beam and debonding oc-curs earlier.
This analysis, regarding the length of CFRP, veri-fies that the strip, when the orientation is 90 degrees, should cover the whole web of the beam to provide an improvement of beam behaviour.
Figure 14. Load-deflection curves for different lengths of CFRP, obtained by FEM.
5.2 Effect of orientation of CFRP Since a shear crack propagates in a diagonal
manner the orientation of the CFRP may affect the behaviour of a retrofitted beam. Two orientations, 90º and 45º were studied.
For the longest CFRP the failure mode was a shear crack while for the other beams the failure mode was debonding.
It is clear from Figure 15 that when the angle of orientation was 45º the retrofitted beam carries more load for all lengths.
It is interesting to note that the load capacity for RB 45/300, RB 45/200 and RB 45/100 was in-
creased by 20.1 %, 2% and 5% respectively, com-pared to the control beam while the change was 11.9% for RB 90/300, -1.8% for RB 45/200 and -1.1% for RB 90/100. This indicates that the per-formance of a beam retrofitted with CFRP is influ-enced by the orientation of the CFRP. When the CFRP did not cover the full depth of the beam the load capacity was actually decreased for 90º, while a small increase was obtained for 45º.
From Figure 16, it can be concluded that the ori-entation of CFRP has a strong effect on the behav-iour of the retrofitted beam for the same total amount of CFRP. A 45º orientation gives a better ef-fect in terms of maximum load and deflection.
(a)
(b)
(c)
Figure 15. Load-deflection curves of 90º and 45º of CFRP obtained by FEM.
0 5 10 15 200
50
100
150
200
250
300
Deflection (mm)
Loa
d (k
N)
RB 90/300RB 90/200RB 90/100Control Beam
0 5 10 15 200
50
100
150
200
250
300
Deflection (mm)
Loa
d (k
N)
RB 45/300RB 90/300
0 5 10 15 200
50
100
150
200
250
300
Deflection (mm)
Loa
d (k
N)
RB 45/200RB 90/200
0 5 10 15 200
50
100
150
200
250
300
Deflection (mm)
Loa
d (K
N)
RB 45/100RB 90/100
Opening Diagonal Crack
54
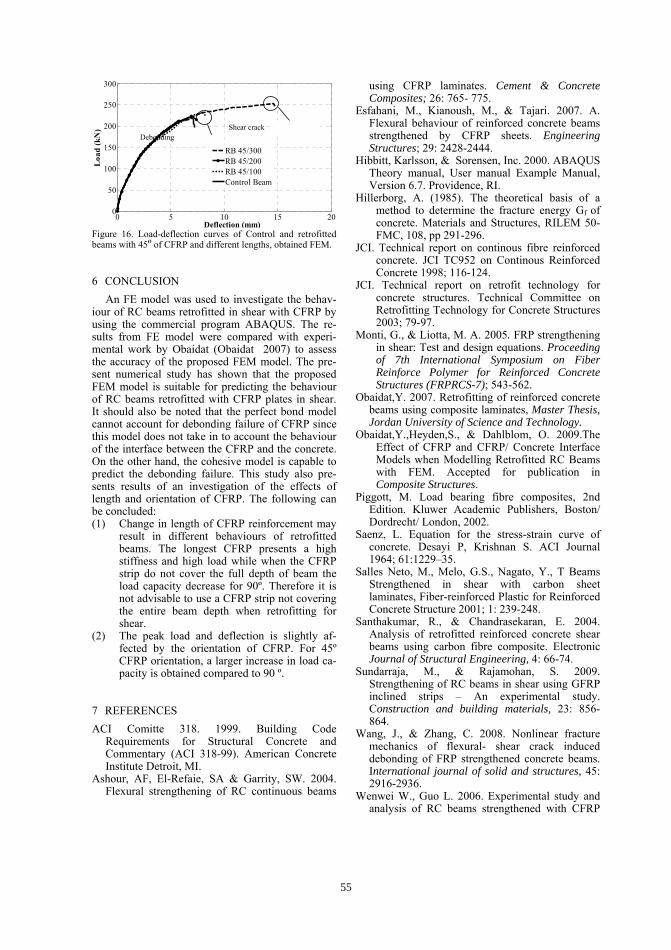
Figure 16. Load-deflection curves of Control and retrofitted beams with 45º of CFRP and different lengths, obtained FEM.
6 CONCLUSION An FE model was used to investigate the behav-
iour of RC beams retrofitted in shear with CFRP by using the commercial program ABAQUS. The re-sults from FE model were compared with experi-mental work by Obaidat (Obaidat 2007) to assess the accuracy of the proposed FEM model. The pre-sent numerical study has shown that the proposed FEM model is suitable for predicting the behaviour of RC beams retrofitted with CFRP plates in shear. It should also be noted that the perfect bond model cannot account for debonding failure of CFRP since this model does not take in to account the behaviour of the interface between the CFRP and the concrete. On the other hand, the cohesive model is capable to predict the debonding failure. This study also pre-sents results of an investigation of the effects of length and orientation of CFRP. The following can be concluded: (1) Change in length of CFRP reinforcement may
result in different behaviours of retrofitted beams. The longest CFRP presents a high stiffness and high load while when the CFRP strip do not cover the full depth of beam the load capacity decrease for 90º. Therefore it is not advisable to use a CFRP strip not covering the entire beam depth when retrofitting for shear.
(2) The peak load and deflection is slightly af-fected by the orientation of CFRP. For 45º CFRP orientation, a larger increase in load ca-pacity is obtained compared to 90 º.
7 REFERENCES ACI Comitte 318. 1999. Building Code
Requirements for Structural Concrete and Commentary (ACI 318-99). American Concrete Institute Detroit, MI.
Ashour, AF, El-Refaie, SA & Garrity, SW. 2004. Flexural strengthening of RC continuous beams
using CFRP laminates. Cement & Concrete Composites; 26: 765- 775.
Esfahani, M., Kianoush, M., & Tajari. 2007. A. Flexural behaviour of reinforced concrete beams strengthened by CFRP sheets. Engineering Structures; 29: 2428-2444.
Hibbitt, Karlsson, & Sorensen, Inc. 2000. ABAQUS Theory manual, User manual Example Manual, Version 6.7. Providence, RI.
Hillerborg, A. (1985). The theoretical basis of a method to determine the fracture energy Gf of concrete. Materials and Structures, RILEM 50-FMC, 108, pp 291-296.
JCI. Technical report on continous fibre reinforced concrete. JCI TC952 on Continous Reinforced Concrete 1998; 116-124.
JCI. Technical report on retrofit technology for concrete structures. Technical Committee on Retrofitting Technology for Concrete Structures 2003; 79-97.
Monti, G., & Liotta, M. A. 2005. FRP strengthening in shear: Test and design equations. Proceeding of 7th International Symposium on Fiber Reinforce Polymer for Reinforced Concrete Structures (FRPRCS-7); 543-562.
Obaidat,Y. 2007. Retrofitting of reinforced concrete beams using composite laminates, Master Thesis, Jordan University of Science and Technology.
Obaidat,Y.,Heyden,S., & Dahlblom, O. 2009.The Effect of CFRP and CFRP/ Concrete Interface Models when Modelling Retrofitted RC Beams with FEM. Accepted for publication in Composite Structures.
Piggott, M. Load bearing fibre composites, 2nd Edition. Kluwer Academic Publishers, Boston/ Dordrecht/ London, 2002.
Saenz, L. Equation for the stress-strain curve of concrete. Desayi P, Krishnan S. ACI Journal 1964; 61:1229–35.
Salles Neto, M., Melo, G.S., Nagato, Y., T Beams Strengthened in shear with carbon sheet laminates, Fiber-reinforced Plastic for Reinforced Concrete Structure 2001; 1: 239-248.
Santhakumar, R., & Chandrasekaran, E. 2004. Analysis of retrofitted reinforced concrete shear beams using carbon fibre composite. Electronic Journal of Structural Engineering, 4: 66-74.
Sundarraja, M., & Rajamohan, S. 2009. Strengthening of RC beams in shear using GFRP inclined strips – An experimental study. Construction and building materials, 23: 856-864.
Wang, J., & Zhang, C. 2008. Nonlinear fracture mechanics of flexural- shear crack induced debonding of FRP strengthened concrete beams. International journal of solid and structures, 45: 2916-2936.
Wenwei W., Guo L. 2006. Experimental study and analysis of RC beams strengthened with CFRP
0 5 10 15 200
50
100
150
200
250
300
Deflection (mm)
Loa
d (k
N)
RB 45/300RB 45/200RB 45/100Control Beam
DebondingShear crack
55

laminates under sustaining load. International Journal of Solids and Structures 2006; 43: 1372–1387.
Ye, L. P., Lu, X. Z, and Chen, J. F. Design proposals for the debonding strengths of FRP strengthened RC beams in the chinese design code. Proceeding of International Symposium on Bond Behaviour of FRP in Structures (BBFS 2005); 45-54.
56
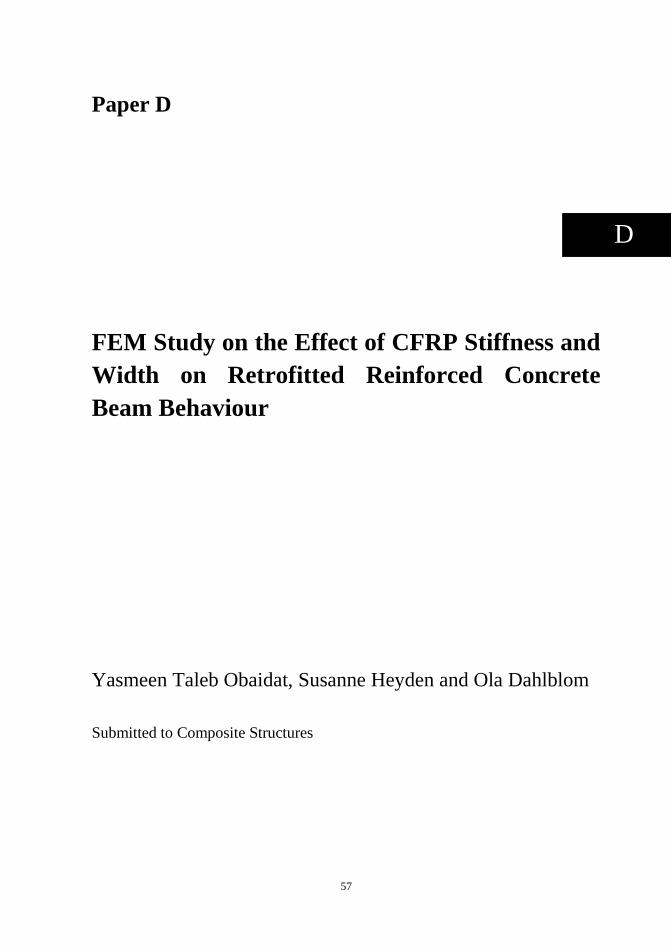
57
Paper D
FEM Study on the Effect of CFRP Stiffness and
Width on Retrofitted Reinforced Concrete
Beam Behaviour
Yasmeen Taleb Obaidat, Susanne Heyden and Ola Dahlblom
Submitted to Composite Structures
D


59
FEM Study on the Effect of CFRP Stiffness and Width on Retrofitted Reinforced
Concrete Beam Behaviour
Yasmeen Taleb Obaidat, Susanne Heyden and Ola Dahlblom
Division of Structural Mechanics, Lund University, Lund, Sweden
Abstract
The finite element program ABAQUS was used to study the effect of different parameters on
the behaviour of an RC beam retrofitted with carbon fibre reinforced polymer (CFRP). These
parameters were the stiffness and width of the CFRP. A linear elastic isotropic model was
used for the CFRP and a cohesive bond model was used for the concrete–CFRP interface. A
plastic damage model was used for the concrete. The material models were validated against
experimental work and the results showed good agreement between experimental data and
numerical results. Observations indicate that the CFRP width to beam width ratio and CFRP
stiffness influence the type of failure mode of a beam retrofitted with CFRP. For small width
and for large value of stiffness debonding will occur before steel yielding due to stress
concentration at the end of the plate. For small values of stiffness, rupture of CFRP will
occur. It was found that when the stiffness of CFRP increases the maximum load increases
until a certain value of stiffness, then the maximum load decreases again. Simulations also
show that the external load at steel yielding and the maximum load increase with the CFRP
width.
Keywords: Carbon fibre reinforced polymer (CFRP), FEM (finite element method),
Retrofitting, Reinforced concrete beam, Debonding.
1. Introduction
Upgrading of reinforced concrete structures may be required for many different reasons. The
concrete may have become structurally inadequate, for example due to deterioration of
materials, poor initial design and/or construction, lack of maintenance, upgrading of design
loads or accident events such as earthquakes.
Retrofitting of concrete structures with externally bonded reinforcement is generally done
by using either steel plates or fibre reinforced polymer (FRP) laminates. FRP can be
convenient compared to steel for a number of reasons. They are lighter than the equivalent
Corresponding author.
E-mail address: [email protected]
60
steel plates. They can be formed on site into complicated shapes and they can also be easily
cut to length on site. The installation is easier and temporary support until the adhesive gains
its strength is not required due to the light weight of FRP. Earlier research has demonstrated
that the addition of FRP laminate to reinforced concrete beams can increase stiffness and
maximum load and reduce crack widths [1], [2], [3] and [4] and the technique is often used
for upgrading concrete structures.
Nonlinear finite element analysis can be used to study the behaviour of retrofitted
structures. This reduces the time and cost needed for experimental work. Many researchers
have simulated the behaviour of retrofitted reinforced structures by using the finite element
method. Several different approaches have been considered. Some models use nonlinear
elasticity or plasticity models to capture the more complicated effects and predict the
behaviour of reinforced concrete retrofitted by FRP in a general sense, [5], [6], [7], [8] and
[9]. An important issue is the influence of the properties of the interface between the carbon
fibre reinforced polymer (CFRP) and the concrete. This was modelled in [10]. In this paper
the model developed in [10] was used for a parametric study.
The lack of design standards is disadvantageous to external strengthening of structures
with CFRP. Developing rational design guidelines requires a fundamental understanding of
the performance of structures strengthened with CFRP. The aim of this paper is to contribute
to the understanding of the influence of CFRP width and stiffness on the performance of a
strengthened beam.
2. Full Scale Experiment
Reinforced beams that were previously tested, Obaidat [11], were used to validate the FE
procedure discussed in the following sections. Fig. 1 shows the tested beams. A summary of
the properties of materials as reported by Obaidat [11] is shown in Table. 1. Two control
beams were loaded to failure. Two other beams were loaded until cracks appeared, then
retrofitted with unidirectional CFRP laminates attached to the bottom and finally loaded to
failure. The fibres were oriented along the length of the beam. The laminates were 1560 mm
long, 50 mm wide and 1.2 mm thick.
Fig. 1. Geometry, arrangement of reinforcement and load of the tested beams.
P/2 P/2
300
mm
1960 mm
150 mm
210
212 8/100 mm
520mm 520mm 520mm
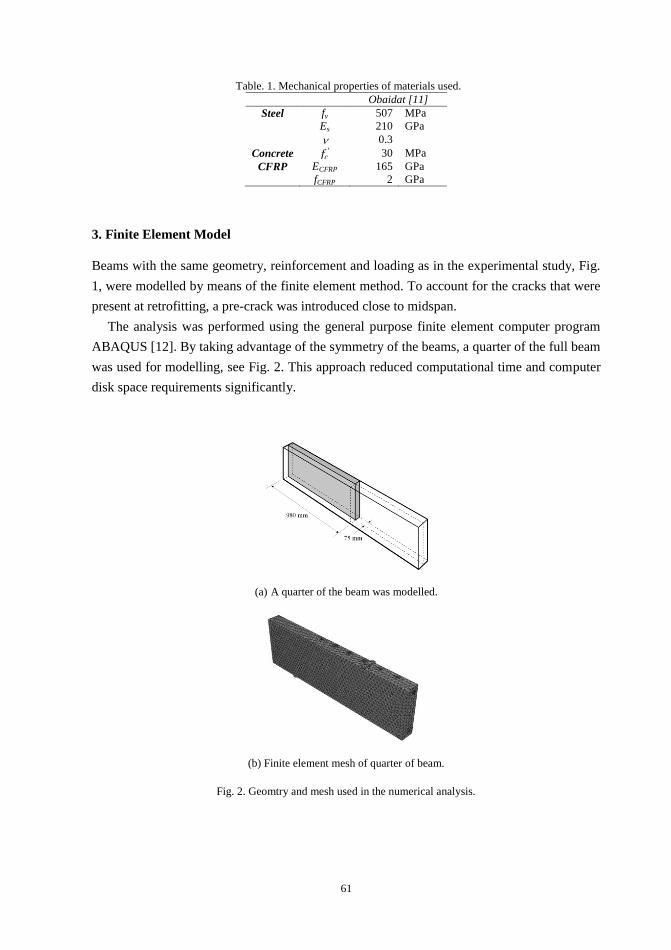
61
Table. 1. Mechanical properties of materials used.
Obaidat [11]
Steel fy 507 MPa
Es 210 GPa
0.3
Concrete 𝑓𝑐′ 30 MPa
CFRP ECFRP 165 GPa
fCFRP 2 GPa
3. Finite Element Model
Beams with the same geometry, reinforcement and loading as in the experimental study, Fig.
1, were modelled by means of the finite element method. To account for the cracks that were
present at retrofitting, a pre-crack was introduced close to midspan.
The analysis was performed using the general purpose finite element computer program
ABAQUS [12]. By taking advantage of the symmetry of the beams, a quarter of the full beam
was used for modelling, see Fig. 2. This approach reduced computational time and computer
disk space requirements significantly.
(a) A quarter of the beam was modelled.
(b) Finite element mesh of quarter of beam.
Fig. 2. Geomtry and mesh used in the numerical analysis.
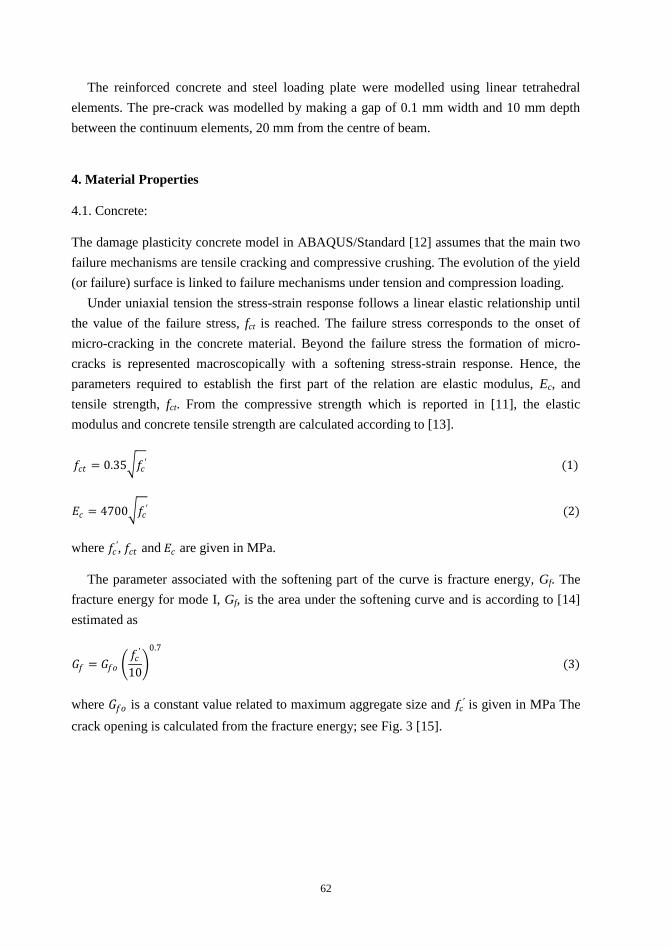
62
The reinforced concrete and steel loading plate were modelled using linear tetrahedral
elements. The pre-crack was modelled by making a gap of 0.1 mm width and 10 mm depth
between the continuum elements, 20 mm from the centre of beam.
4. Material Properties
4.1. Concrete:
The damage plasticity concrete model in ABAQUS/Standard [12] assumes that the main two
failure mechanisms are tensile cracking and compressive crushing. The evolution of the yield
(or failure) surface is linked to failure mechanisms under tension and compression loading.
Under uniaxial tension the stress-strain response follows a linear elastic relationship until
the value of the failure stress, fct is reached. The failure stress corresponds to the onset of
micro-cracking in the concrete material. Beyond the failure stress the formation of micro-
cracks is represented macroscopically with a softening stress-strain response. Hence, the
parameters required to establish the first part of the relation are elastic modulus, Ec, and
tensile strength, fct. From the compressive strength which is reported in [11], the elastic
modulus and concrete tensile strength are calculated according to [13].
𝑓𝑐𝑡 = 0.35 𝑓𝑐′ (1)
𝐸𝑐 = 4700 𝑓𝑐′ (2)
where 𝑓𝑐′, 𝑓𝑐𝑡 and 𝐸𝑐 are given in MPa.
The parameter associated with the softening part of the curve is fracture energy, Gf. The
fracture energy for mode I, Gf, is the area under the softening curve and is according to [14]
estimated as
𝐺𝑓 = 𝐺𝑓𝑜 𝑓𝑐
′
10
0.7
(3)
where 𝐺𝑓𝑜 is a constant value related to maximum aggregate size and 𝑓𝑐′ is given in MPa The
crack opening is calculated from the fracture energy; see Fig. 3 [15].
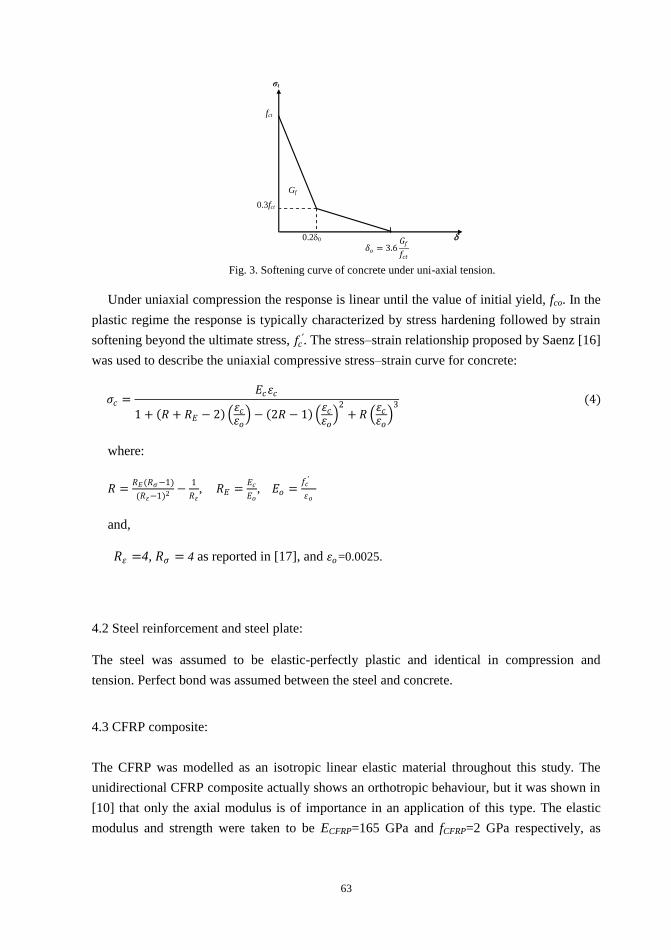
63
Fig. 3. Softening curve of concrete under uni-axial tension.
Under uniaxial compression the response is linear until the value of initial yield, fco. In the
plastic regime the response is typically characterized by stress hardening followed by strain
softening beyond the ultimate stress, 𝑓𝑐′. The stress–strain relationship proposed by Saenz [16]
was used to describe the uniaxial compressive stress–strain curve for concrete:
𝜎𝑐 =𝐸𝑐휀𝑐
1 + 𝑅 + 𝑅𝐸 − 2 휀𝑐휀𝑜 − 2𝑅 − 1
휀𝑐휀𝑜
2+ 𝑅
휀𝑐휀𝑜
3 (4)
where:
𝑅 =𝑅𝐸(𝑅𝜎−1)
(𝑅휀−1)2 −1
𝑅휀, 𝑅𝐸 =
𝐸𝑐
𝐸𝑜, 𝐸𝑜 =
𝑓𝑐′
휀𝑜
and,
𝑅휀 =4, 𝑅𝜎 = 4 as reported in [17], and 휀𝑜=0.0025.
4.2 Steel reinforcement and steel plate:
The steel was assumed to be elastic-perfectly plastic and identical in compression and
tension. Perfect bond was assumed between the steel and concrete.
4.3 CFRP composite:
The CFRP was modelled as an isotropic linear elastic material throughout this study. The
unidirectional CFRP composite actually shows an orthotropic behaviour, but it was shown in
[10] that only the axial modulus is of importance in an application of this type. The elastic
modulus and strength were taken to be ECFRP=165 GPa and fCFRP=2 GPa respectively, as
0.3fct
𝛿𝑜 = 3.6𝐺𝑓
𝑓𝑐𝑡
0.20
fct
Gf
σt
64
found in the experimental study. The Poisson ratio of the CFRP composite was assumed to be
CFRP=0.30.
4.4. Interface Layer
Since Obaidat [10] found that a cohesive model is able to describe the failure mode and load
capacity accurately, this was used to represent the interface between the concrete and CFRP
in this study.
Cohesive elements were used together with a traction separation law which defines the
traction function of the separation distance between interface elements [18], Fig. 4. The
material has an initial linear elastic behaviour. The elastic response is followed by damage
initiation and evolution until total degradation of the elements.
Fig. 4. Bilinear traction – separation constitutive law.
The behaviour of the interface prior to initiation of damage is described as linear-elastic.
The nominal traction vector consists of three components in three-dimensional problems: σn,
t, s, which represent the normal and shear tractions, respectively.
The stiffness is determined according to
𝐾𝑜 =1
𝑡𝑖 𝐺𝑖 +𝑡𝑐 𝐺𝑐 (5)
where ti is the adhesive thickness, tc is the effective thickness of concrete whose deformation
forms part of the interfacial slip and was taken as 5 mm, and Gi= 0.667 GPa and Gc=10.8
GPa are the shear modulus of adhesive and concrete respectively.
The quadratic nominal stress criterion was used as damage initiation criterion
𝑛
𝑛𝑜
2
+ 𝑠
𝑠𝑜
2
+ 𝑡
𝑡𝑜
2
= 1 (6)
where n,s and t are the cohesive tensile and shear stresses of the interface, and the
subscript refers to the direction of the stress component. The values used for this study were
Gcr
max
o f
Ko
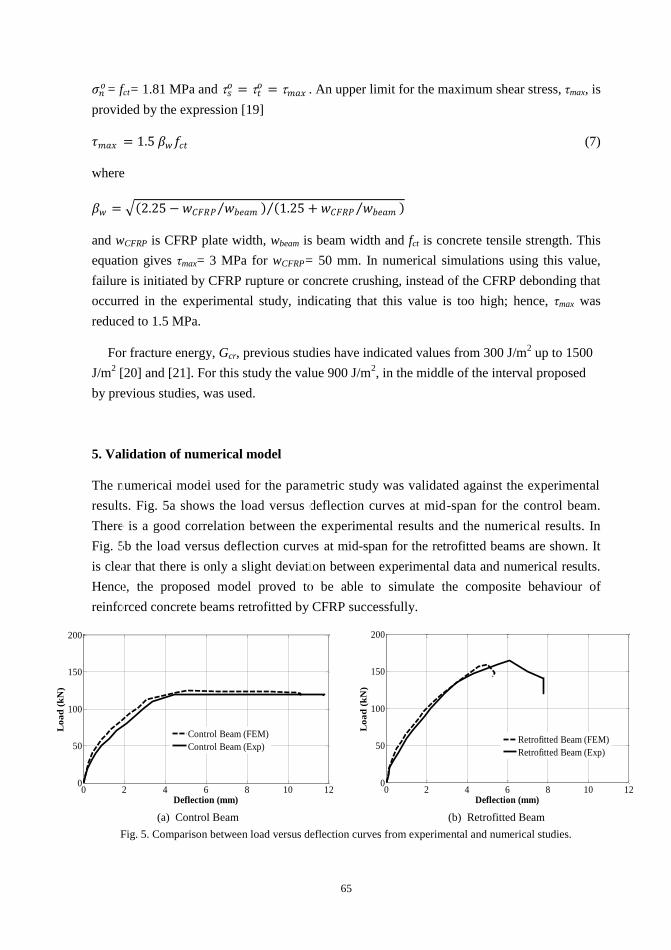
65
𝜎𝑛𝑜= fct= 1.81 MPa and 𝑠
𝑜 = 𝑡𝑜 = 𝑚𝑎𝑥 . An upper limit for the maximum shear stress, τmax, is
provided by the expression [19]
𝜏𝑚𝑎𝑥 = 1.5 𝛽𝑤𝑓𝑐𝑡 (7)
where
𝛽𝑤 = 2.25 − 𝑤𝐶𝐹𝑅𝑃 𝑤𝑏𝑒𝑎𝑚 1.25 + 𝑤𝐶𝐹𝑅𝑃 𝑤𝑏𝑒𝑎𝑚
and wCFRP is CFRP plate width, wbeam is beam width and fct is concrete tensile strength. This
equation gives τmax= 3 MPa for wCFRP= 50 mm. In numerical simulations using this value,
failure is initiated by CFRP rupture or concrete crushing, instead of the CFRP debonding that
occurred in the experimental study, indicating that this value is too high; hence, τmax was
reduced to 1.5 MPa.
For fracture energy, Gcr, previous studies have indicated values from 300 J/m2 up to 1500
J/m2 [20] and [21]. For this study the value 900 J/m
2, in the middle of the interval proposed
by previous studies, was used.
5. Validation of numerical model
The numerical model used for the parametric study was validated against the experimental
results. Fig. 5a shows the load versus deflection curves at mid-span for the control beam.
There is a good correlation between the experimental results and the numerical results. In
Fig. 5b the load versus deflection curves at mid-span for the retrofitted beams are shown. It
is clear that there is only a slight deviation between experimental data and numerical results.
Hence, the proposed model proved to be able to simulate the composite behaviour of
reinforced concrete beams retrofitted by CFRP successfully.
(a) Control Beam (b) Retrofitted Beam
Fig. 5. Comparison between load versus deflection curves from experimental and numerical studies.
0 2 4 6 8 10 120
50
100
150
200
Deflection (mm)
Lo
ad
(k
N)
Control Beam (FEM)
Control Beam (Exp)
0 2 4 6 8 10 120
50
100
150
200
Deflection (mm)
Lo
ad
(k
N)
Retrofitted Beam (FEM)
Retrofitted Beam (Exp)

66
6. Parametric Study
In order to study the effects of different parameters on a beam retrofitted with CFRP,
numerical simulations were conducted. The most obvious parameter to vary is the total
amount of external reinforcement, which is here quantified by the stiffness
𝐾 = 𝐸𝐶𝐹𝑅𝑃 ∙ 𝑤𝐶𝐹𝑅𝑃 ∙ 𝑡𝐶𝐹𝑅𝑃 (8)
where ECFRP is elastic modulus of CFRP, wCFRP is CFRP width and tCFRP is CFRP thickness.
The value of the stiffness used in the experimental study is denoted Ko and has the numerical
value
𝐾𝑜 = 165 ∙ 103 N mm2 ∙ 50mm ∙ 1.2 mm = 9900 N (9)
The series of different stiffnesses used to study the effect of varying stiffness, K, on
retrofitted beams were: 0.25Ko, 0.5Ko, Ko, 2Ko, 4Ko and 8Ko. The values for the stiffness K
used in the parametric study are shown on the vertical axis in Fig. 6.
Since there are three-dimensional effects present, the width of CFRP is also expected to be
important. The width ratio, defined as
𝜇 =𝑤𝐶𝐹𝑅𝑃
𝑤𝑏𝑒𝑎𝑚 (10)
where wbeam is the beam width, was used as a measure for this. In the experimental study a
width ratio of 𝜇 =50
150=
1
3 was used, and the values of µ used in the parameter study are
shown on the horizontal axis in Fig. 6.
For varying the width ratio with constant stiffness, the thickness was chosen to adjust with
the width, since simulation results show the same behaviour when adjusting either elastic
modulus or thickness of CFRP to keep the stiffness, K, constant.
The dots in Fig. 6 indicate the points for which the load-deflection behaviour of the beam
was simulated. For presenting the results, different groups were selected to study the effect of
different parameters. In Group 1 the effect of varying width ratio with constant stiffness was
examined. In Group 2 the effect of varying CFRP width was studied and Group 3 deals with
the effect of varying thickness.
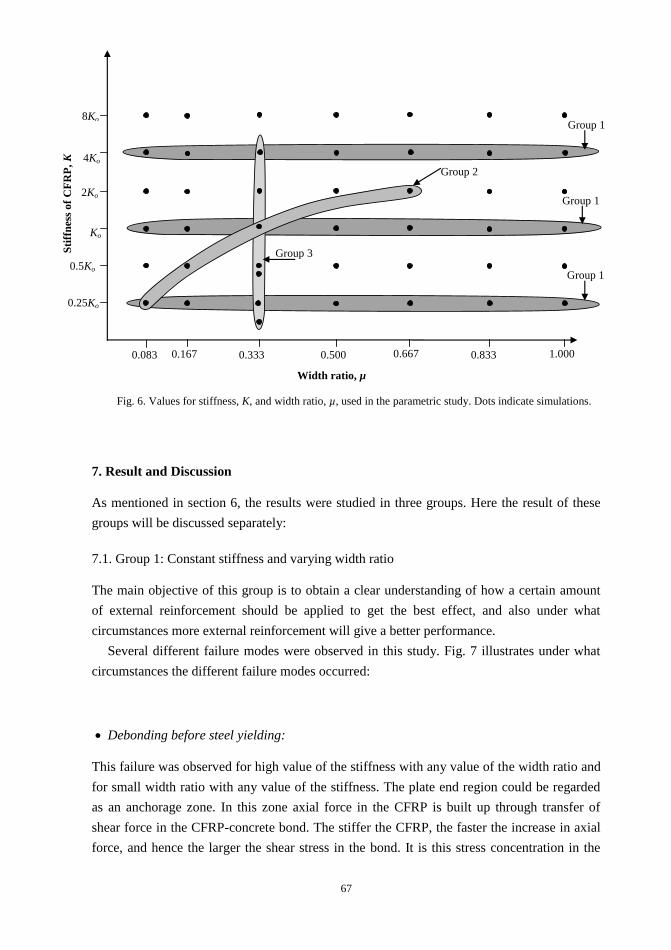
67
Fig. 6. Values for stiffness, K, and width ratio, µ, used in the parametric study. Dots indicate simulations.
7. Result and Discussion
As mentioned in section 6, the results were studied in three groups. Here the result of these
groups will be discussed separately:
7.1. Group 1: Constant stiffness and varying width ratio
The main objective of this group is to obtain a clear understanding of how a certain amount
of external reinforcement should be applied to get the best effect, and also under what
circumstances more external reinforcement will give a better performance.
Several different failure modes were observed in this study. Fig. 7 illustrates under what
circumstances the different failure modes occurred:
Debonding before steel yielding:
This failure was observed for high value of the stiffness with any value of the width ratio and
for small width ratio with any value of the stiffness. The plate end region could be regarded
as an anchorage zone. In this zone axial force in the CFRP is built up through transfer of
shear force in the CFRP-concrete bond. The stiffer the CFRP, the faster the increase in axial
force, and hence the larger the shear stress in the bond. It is this stress concentration in the
Group 3
Group 2
Group 1
Group 1
Group 1
0.25Ko
0.5Ko
2Ko
8Ko
0.083 0.500 0.667 0.833 1.000
Width ratio, µ
0.167 0.333
Ko
4Ko
Sti
ffn
ess
of
CF
RP
, K
68
plate end region that causes the debonding when the CFRP stiffness is high. The smaller the
width ratio, the smaller is the bond area available to take part in the transfer of shear force.
This is why this fracture mode tends to be limiting for small width ratios. As discussed in
connection to Fig. 12, the stress transfer is somewhat higher for a higher width ratio, but this
is a secondary effect.
Debonding at the plate end after steel yielding:
This failure was observed for medium width ratios and medium stiffness. For these cases,
where the CFRP stiffness is not so high and the width ratio is not so small, a larger build up
of force is allowed in the CFRP before debonding occurs. This means that the bending
moment can be increased to the extent that steel yielding occurs. At further load increase,
however, debonding will occur in the plate end region.
Debonding at flexural crack after steel yielding:
This failure was observed for high width ratios and medium stiffness. In this case, debonding
due to stress concentration in the plate end region is not a limiting phenomenon. Also in this
case the bending moment can be increased to the extent that steel yielding occurs. At further
load increase, there is debonding but in this case it starts from maximum moment region and
propagates towards the plate end. This is the result of high interfacial shear stresses at a
flexural crack in the maximum moment region.
Debonding with concrete splitting:
This failure was observed when using high width ratio with medium stiffness (lower stiffness
than for the previous case). After steel yielding, a flexural shear crack will develop in the
concrete. The crack will propagate to the level of the tensile reinforcement and extend
horizontally along the bottom of the tension steel reinforcement. With increasing external
load, the horizontal crack propagates to cause parts of the concrete cover to split with the
CFRP plate.
CFRP rupture:
This failure was observed for small stiffness with large width ratio. After steel yielding is
initiated, the force carried by the steel cannot increase anymore. Hence further increase in
bending moment will result in large force in the CFRP which leads to CFRP rupture in the
mid-span region.

69
Fig. 7. Failure modes of the retrofitted beams. Data points are indicated with dots.
As is clear in Fig. 7, the width ratio and stiffness have a significant impact on the failure
mode of the retrofitted beam.
The maximum load ratio is denoted and defined as:
𝛼 =Maximum load, retrofitted beam
Maximum load, control beam
Fig. 8a illustrates as a function of the width ratio, µ, for stiffness values K=Ko, 0.5Ko and
0.25Ko, and Fig. 8b shows the corresponding values for stiffness values K=Ko, 2Ko, 4Ko and
8Ko.
For small stiffness values, Fig. 8a, the maximum load ratio, 𝛼, increases with the width
ratio due to increase in the contact area between the concrete and CFRP. This allows the
interfacial stress to distribute over a larger area, which means a less pronounced stress
concentration and higher load before failure. When the failure mode shifts to CFRP rupture,
which is for high width ratios, there is no further increase in the maximum load ratio. This is
because at an increase in external load after steel yielding all additional axial load will be
carried by the CFRP. A small CFRP stiffness means a small CFRP cross section area which
in turn means a small ultimate load. This means that when CFRP rupture is the limiting
phenomenon no positive effect is obtained from increasing the width ratio. For large width
ratios the maximum load ratio increases with increased stiffness while the opposite occurs
Sti
ffn
ess
of
CF
RP
, K
0.083 0.500 0.667 0.833 0.167 0.333
Width ratio, µ
1.000
0.25Ko
0.5Ko
Ko
2Ko
4Ko
8Ko
Debonding before steel yielding.
Debonding at the plate end
after steel yielding.
Debonding with concrete splitting
CFRP rupture.
Debonding at flexural crack
after steel yielding.
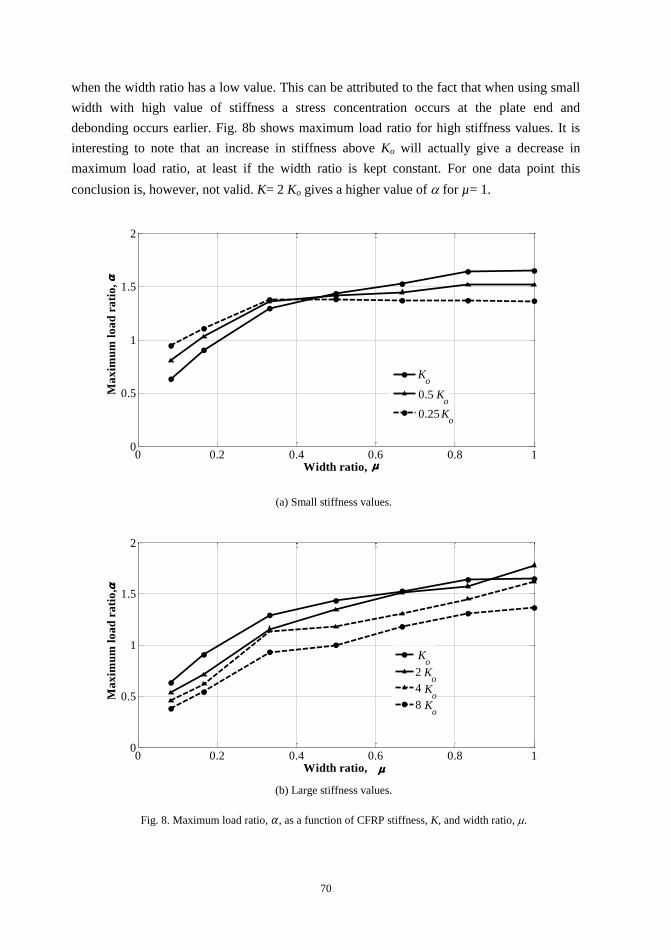
70
when the width ratio has a low value. This can be attributed to the fact that when using small
width with high value of stiffness a stress concentration occurs at the plate end and
debonding occurs earlier. Fig. 8b shows maximum load ratio for high stiffness values. It is
interesting to note that an increase in stiffness above Ko will actually give a decrease in
maximum load ratio, at least if the width ratio is kept constant. For one data point this
conclusion is, however, not valid. K= 2 Ko gives a higher value of for µ= 1.
(a) Small stiffness values.
(b) Large stiffness values.
Fig. 8. Maximum load ratio, 𝛼, as a function of CFRP stiffness, K, and width ratio, .
0 0.2 0.4 0.6 0.8 10
0.5
1
1.5
2
Ma
xim
um
lo
ad
ra
tio
,
Width ratio,
0.5
0.25
Ko
Ko
Ko
0 0.2 0.4 0.6 0.8 10
0.5
1
1.5
2
Width ratio,
Ma
xim
um
lo
ad
ra
tio
,
2
4
8
Ko
Ko
Ko
Ko
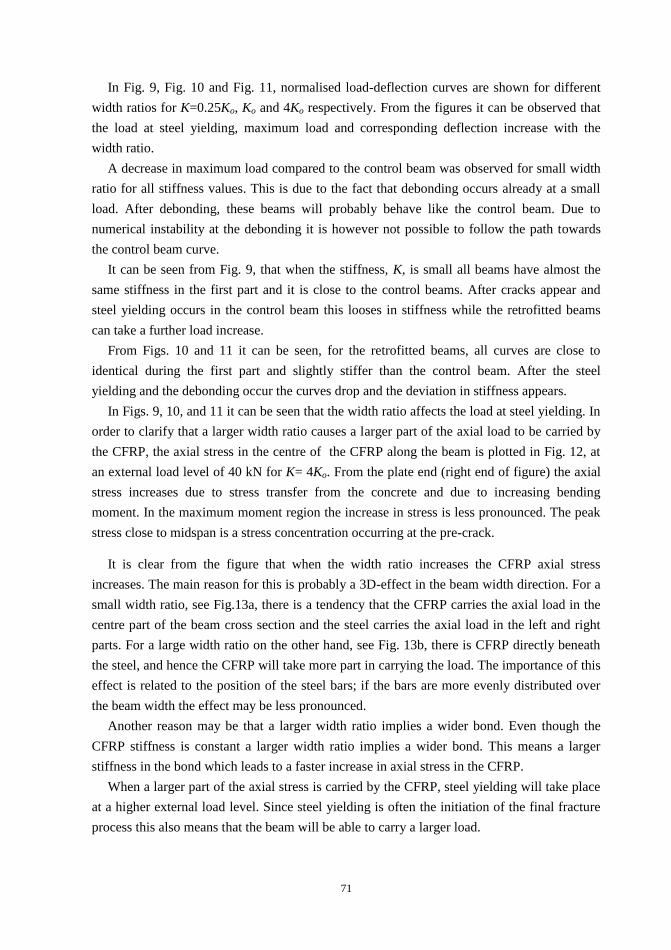
71
In Fig. 9, Fig. 10 and Fig. 11, normalised load-deflection curves are shown for different
width ratios for K=0.25Ko, Ko and 4Ko respectively. From the figures it can be observed that
the load at steel yielding, maximum load and corresponding deflection increase with the
width ratio.
A decrease in maximum load compared to the control beam was observed for small width
ratio for all stiffness values. This is due to the fact that debonding occurs already at a small
load. After debonding, these beams will probably behave like the control beam. Due to
numerical instability at the debonding it is however not possible to follow the path towards
the control beam curve.
It can be seen from Fig. 9, that when the stiffness, K, is small all beams have almost the
same stiffness in the first part and it is close to the control beams. After cracks appear and
steel yielding occurs in the control beam this looses in stiffness while the retrofitted beams
can take a further load increase.
From Figs. 10 and 11 it can be seen, for the retrofitted beams, all curves are close to
identical during the first part and slightly stiffer than the control beam. After the steel
yielding and the debonding occur the curves drop and the deviation in stiffness appears.
In Figs. 9, 10, and 11 it can be seen that the width ratio affects the load at steel yielding. In
order to clarify that a larger width ratio causes a larger part of the axial load to be carried by
the CFRP, the axial stress in the centre of the CFRP along the beam is plotted in Fig. 12, at
an external load level of 40 kN for K= 4Ko. From the plate end (right end of figure) the axial
stress increases due to stress transfer from the concrete and due to increasing bending
moment. In the maximum moment region the increase in stress is less pronounced. The peak
stress close to midspan is a stress concentration occurring at the pre-crack.
It is clear from the figure that when the width ratio increases the CFRP axial stress
increases. The main reason for this is probably a 3D-effect in the beam width direction. For a
small width ratio, see Fig.13a, there is a tendency that the CFRP carries the axial load in the
centre part of the beam cross section and the steel carries the axial load in the left and right
parts. For a large width ratio on the other hand, see Fig. 13b, there is CFRP directly beneath
the steel, and hence the CFRP will take more part in carrying the load. The importance of this
effect is related to the position of the steel bars; if the bars are more evenly distributed over
the beam width the effect may be less pronounced.
Another reason may be that a larger width ratio implies a wider bond. Even though the
CFRP stiffness is constant a larger width ratio implies a wider bond. This means a larger
stiffness in the bond which leads to a faster increase in axial stress in the CFRP.
When a larger part of the axial stress is carried by the CFRP, steel yielding will take place
at a higher external load level. Since steel yielding is often the initiation of the final fracture
process this also means that the beam will be able to carry a larger load.
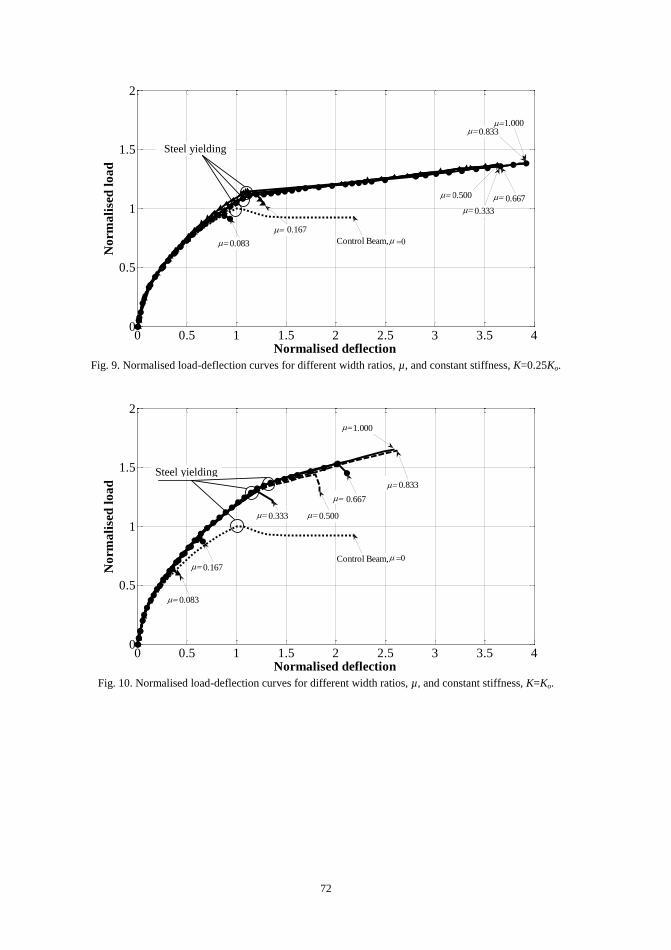
72
Fig. 9. Normalised load-deflection curves for different width ratios, µ, and constant stiffness, K=0.25Ko.
Fig. 10. Normalised load-deflection curves for different width ratios, µ, and constant stiffness, K=Ko.
0 0.5 1 1.5 2 2.5 3 3.5 40
0.5
1
1.5
2
Normalised deflection
No
rma
lise
d l
oa
d
Lo
ad
(k
N)
Lo
ad
(k
N)
Lo
ad
(k
N)
Lo
ad
(k
N)
Lo
ad
(k
N)
0.083
0.6670.500
0.333
1.0000.833
Control Beam,
0.167
0 0.5 1 1.5 2 2.5 3 3.5 40
0.5
1
1.5
2
Normalised deflection
No
rma
lise
d l
oa
d
Control Beam,
0.833
0.667
0.083
0.167
0.333
0.500
1.000
Steel yielding
Steel yielding
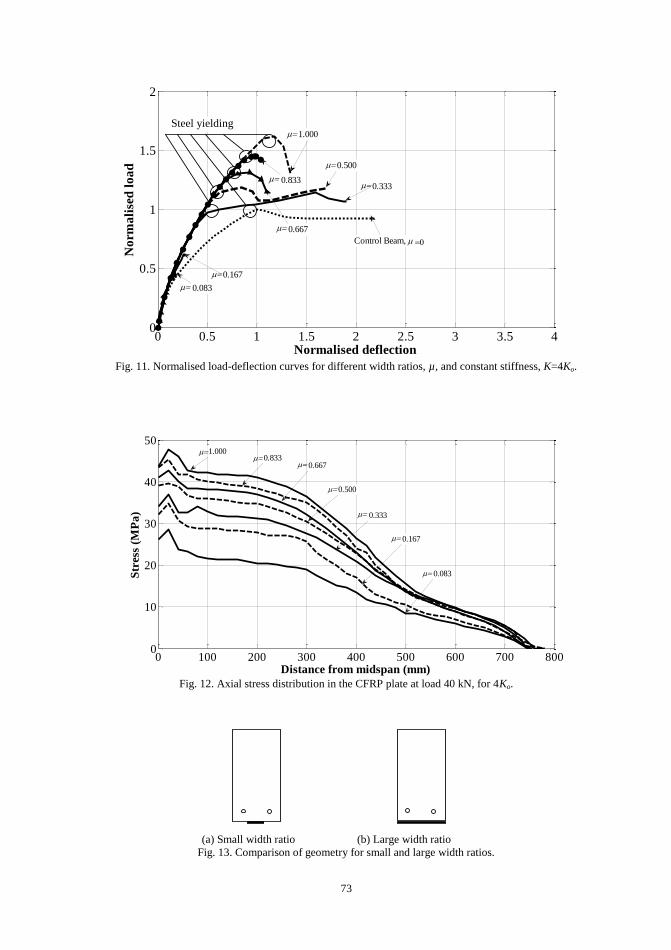
73
Fig. 11. Normalised load-deflection curves for different width ratios, µ, and constant stiffness, K=4Ko.
Fig. 12. Axial stress distribution in the CFRP plate at load 40 kN, for 4Ko.
(a) Small width ratio (b) Large width ratio
Fig. 13. Comparison of geometry for small and large width ratios.
0 0.5 1 1.5 2 2.5 3 3.5 40
0.5
1
1.5
2
Normalised deflection
No
rma
lise
d l
oa
d
Control Beam,
1.000
0.833
0.083
0.667
0.167
0.333
0.500
0 100 200 300 400 500 600 700 8000
10
20
30
40
50
Distance from midspan (mm)
Str
ess
(MP
a)
0.8331.000
0.667
0.500
0.333
0.167
0.083
Steel yielding
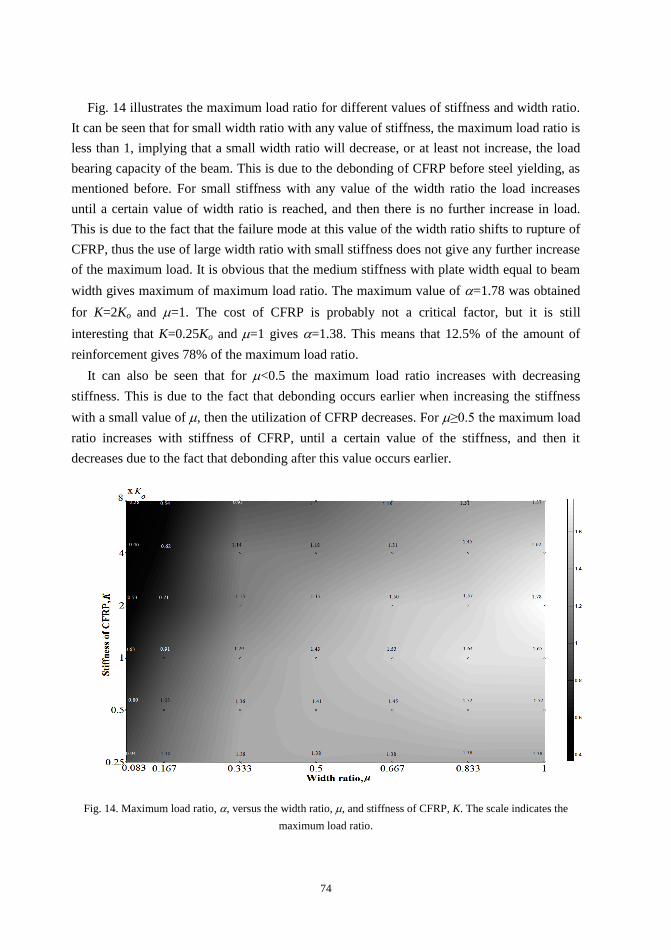
74
Fig. 14 illustrates the maximum load ratio for different values of stiffness and width ratio.
It can be seen that for small width ratio with any value of stiffness, the maximum load ratio is
less than 1, implying that a small width ratio will decrease, or at least not increase, the load
bearing capacity of the beam. This is due to the debonding of CFRP before steel yielding, as
mentioned before. For small stiffness with any value of the width ratio the load increases
until a certain value of width ratio is reached, and then there is no further increase in load.
This is due to the fact that the failure mode at this value of the width ratio shifts to rupture of
CFRP, thus the use of large width ratio with small stiffness does not give any further increase
of the maximum load. It is obvious that the medium stiffness with plate width equal to beam
width gives maximum of maximum load ratio. The maximum value of =1.78 was obtained
for K=2Ko and =1. The cost of CFRP is probably not a critical factor, but it is still
interesting that K=0.25Ko and =1 gives =1.38. This means that 12.5% of the amount of
reinforcement gives 78% of the maximum load ratio.
It can also be seen that for <0.5 the maximum load ratio increases with decreasing
stiffness. This is due to the fact that debonding occurs earlier when increasing the stiffness
with a small value of , then the utilization of CFRP decreases. For ≥0.5 the maximum load
ratio increases with stiffness of CFRP, until a certain value of the stiffness, and then it
decreases due to the fact that debonding after this value occurs earlier.
Fig. 14. Maximum load ratio, , versus the width ratio, , and stiffness of CFRP, K. The scale indicates the
maximum load ratio.
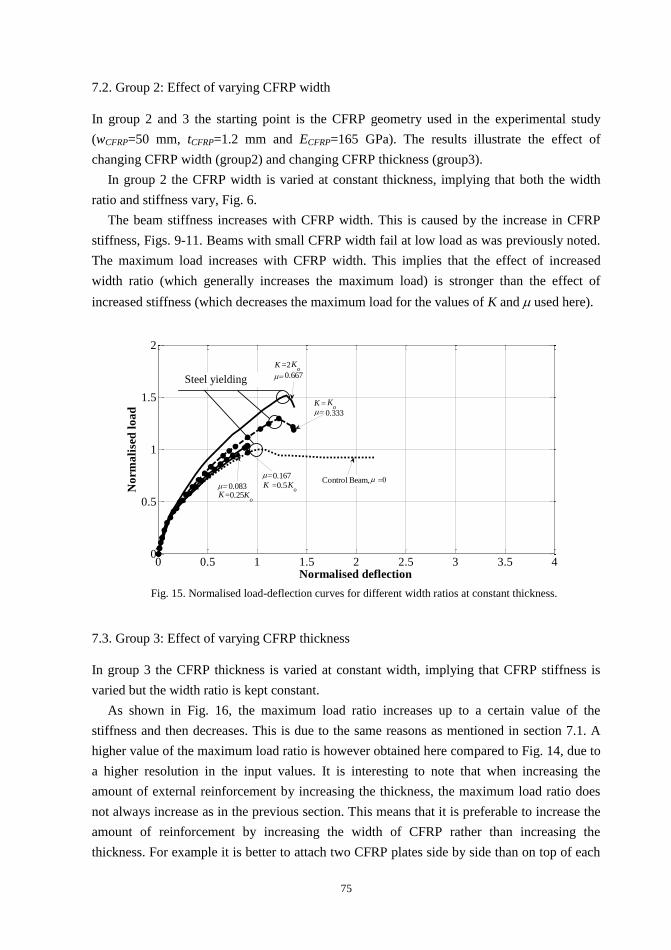
75
7.2. Group 2: Effect of varying CFRP width
In group 2 and 3 the starting point is the CFRP geometry used in the experimental study
(wCFRP=50 mm, tCFRP=1.2 mm and ECFRP=165 GPa). The results illustrate the effect of
changing CFRP width (group2) and changing CFRP thickness (group3).
In group 2 the CFRP width is varied at constant thickness, implying that both the width
ratio and stiffness vary, Fig. 6.
The beam stiffness increases with CFRP width. This is caused by the increase in CFRP
stiffness, Figs. 9-11. Beams with small CFRP width fail at low load as was previously noted.
The maximum load increases with CFRP width. This implies that the effect of increased
width ratio (which generally increases the maximum load) is stronger than the effect of
increased stiffness (which decreases the maximum load for the values of K and used here).
Fig. 15. Normalised load-deflection curves for different width ratios at constant thickness.
7.3. Group 3: Effect of varying CFRP thickness
In group 3 the CFRP thickness is varied at constant width, implying that CFRP stiffness is
varied but the width ratio is kept constant.
As shown in Fig. 16, the maximum load ratio increases up to a certain value of the
stiffness and then decreases. This is due to the same reasons as mentioned in section 7.1. A
higher value of the maximum load ratio is however obtained here compared to Fig. 14, due to
a higher resolution in the input values. It is interesting to note that when increasing the
amount of external reinforcement by increasing the thickness, the maximum load ratio does
not always increase as in the previous section. This means that it is preferable to increase the
amount of reinforcement by increasing the width of CFRP rather than increasing the
thickness. For example it is better to attach two CFRP plates side by side than on top of each
0 0.5 1 1.5 2 2.5 3 3.5 40
0.5
1
1.5
2
Normalised deflection
No
rma
lise
d l
oa
d
0.167
0.083Control Beam,
0.667
K
=
Ko
=2
0.333
K =0.5Ko
Ko
=0.25K
K K
o
Steel yielding
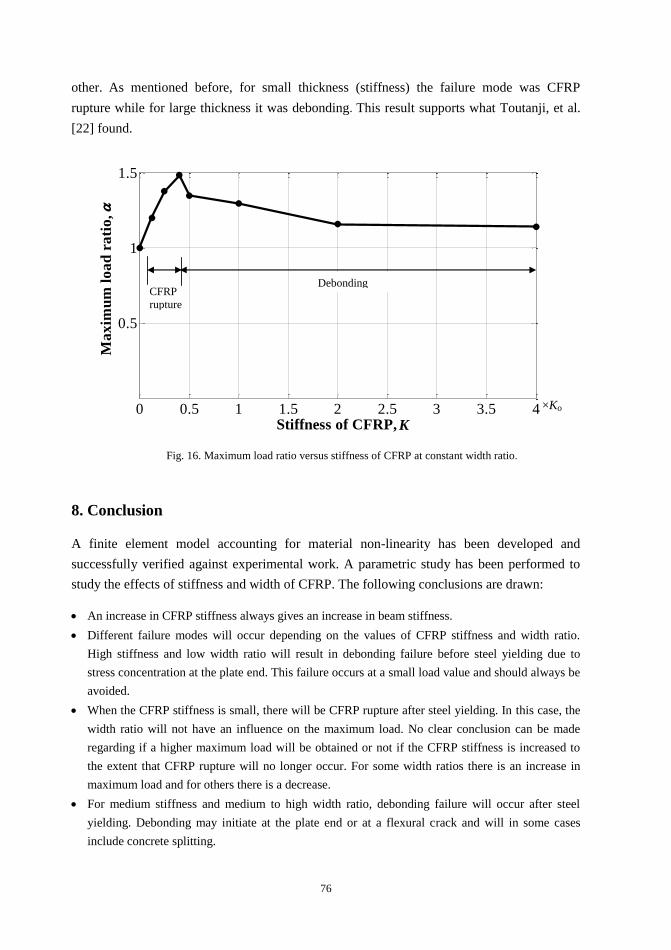
76
other. As mentioned before, for small thickness (stiffness) the failure mode was CFRP
rupture while for large thickness it was debonding. This result supports what Toutanji, et al.
[22] found.
Fig. 16. Maximum load ratio versus stiffness of CFRP at constant width ratio.
8. Conclusion
A finite element model accounting for material non-linearity has been developed and
successfully verified against experimental work. A parametric study has been performed to
study the effects of stiffness and width of CFRP. The following conclusions are drawn:
An increase in CFRP stiffness always gives an increase in beam stiffness.
Different failure modes will occur depending on the values of CFRP stiffness and width ratio.
High stiffness and low width ratio will result in debonding failure before steel yielding due to
stress concentration at the plate end. This failure occurs at a small load value and should always be
avoided.
When the CFRP stiffness is small, there will be CFRP rupture after steel yielding. In this case, the
width ratio will not have an influence on the maximum load. No clear conclusion can be made
regarding if a higher maximum load will be obtained or not if the CFRP stiffness is increased to
the extent that CFRP rupture will no longer occur. For some width ratios there is an increase in
maximum load and for others there is a decrease.
For medium stiffness and medium to high width ratio, debonding failure will occur after steel
yielding. Debonding may initiate at the plate end or at a flexural crack and will in some cases
include concrete splitting.
0 0.5 1 1.5 2 2.5 3 3.5 4
0.5
1
1.5
Stiffness of CFRP,
Ma
xim
um
lo
ad
ra
tio
,
K
×Ko
CFRP
rupture
Debonding
77
Maximum load ratio increases with increasing CFRP stiffness until a certain value of the
stiffness, thereafter the maximum load ratio decreases with increasing CFRP stiffness. The
higher the width ratio, the higher is the optimal CFRP stiffness.
Except when CFRP rupture is the limiting phenomenon, a higher width ratio will always give a
higher maximum load ratio. One reason for this is that a high width ratio will decrease stress
concentrations which otherwise may limit the load bearing capacity. Another reason is that a high
width ratio will lead to that a larger part of the axial load is carried by the CFRP, which means that
steel yielding will occur at a higher external load.
The best maximum load ratio obtained in this study was 1.78, and it was reached for a
CFRP stiffness of 2Ko and a width ratio of 1.
9. References
1. Ai-hui, Z., Wei-Liang, J., & Gui-bing, L. Behaviour of preloaded RC beams strengthened
with CFRP laminates. Journal of Zhejiang University Science A 2006; 436-444.
2. Ashour, AF., El-Refaie, S.A., and Garrity, SW. Flexural strengthening of RC continuous
beams using CFRP laminates. Cement & Concrete Composites 2004; 26: 765- 775.
3. Esfahani, M., Kianoush, M., & Tajari, A. Flexural behaviour of reinforced concrete beams
strengthened by CFRP sheets. Engineering Structures 2007; 29: 2428-2444.
4. Pham, H., & Al- Mahaidi, R. Experimental investigation into flextural retrofitting of
reinforced concrete bridge beams using FRP compoistes. Composite Structures 2004; 66:
617-625.
5. Camata, G., Spacone, E., & Zarnic, R. Experimental and nonlinear finite element studies of
RC beams strengthened with FRP plates. Composites: Part B 2007; 38: 277-288.
6. Coronado, C. A., & Lopez, M. M. Sensitivity analysis of reinforced concrete beams
strengthened with FRP laminates. Cement and Concrete Composites 2006; 28: 102-114.
7. Ebead, U., & Marzouk, H. Tension - stiffening model for FRP strengthend RC concrete
two-way slab. Materials and Structures 2004; 193-200.
8. Lundquist, J., Nordin, H., Täljsten, B., & Olafsson, T. Numerical analyis of concrete
beams sterengthened with CFRP- A Study of anchorage lengths. In: FRP in Construction,
Proceeding of The International Symposium of Bond Behaviour of FRP in Structures.
2005; 247-254.
9. Pannirselvam, N., Raghunath, P., & Suguna, K. Strength Modeling of Reinforced Concrete
Beam with Externally Bonded Fibre Reinforcement Polymer Reinforcement. American J.
of Engineering and Applied Science 2008; 1(3): 192-199.
10. Obaidat,Y., Heyden, S., & Dahlblom, O. The Effect of CFRP and CFRP/Concrete
Interface Models when Modelling Retrofitted RC Beams with FEM. Composite
Structures, 2010; 92: 1391–1398.
78
11. Obaidat,Y. Retrofitting of reinforced concrete beams using composite laminates, Master
Thesis, Jordan University of Science and Technology. 2007.
12. Hibbitt, Karlsson, Sorensen, & Inc. ABAQUS Theory manual, User manual, Example
Manual, Version 6.7. Providence, RI, 2000.
13. ACI Comitte 318. Building Code Requirements for Structural Concrete and Commentary
(ACI 318-99). American Concrete Institute, Detroit, MI, 1999..
14. Beton, C. E.-I. CEB-FIP Model Code 1990 (CEB-FIP MC90). Bulletin D'Information ,
No.215, Lausanne, 1993.
15. Hillerborg, A. The theoretical basis of a method to determine the fracture energy Gf of
concrete. Materials and Structures, RILEM 50-FMC, 1985; 108, pp 291-296.
16. Saenz, L. Discussion equation for the stress - strain curve of concrete. By Desayi P,
Krishnan S. ACI J 1964; 61:1229–35.
17. Hu H.-T., Schnobrich W.C. Constitutive modelling of concrete by using nonassociated
plasticity. J Mater Civil Eng (ASCE) 1989;1(4):199–216.
18. Camanho, P. P., and C. G. Davila. Mixed-Mode Decohesion Finite Elements for the
Simulation of Delamination in Composite Materials. NASA/TM-2002–211737, 2002; 1-
37.
19. Lu, X. Z., Ten, J. G., Ye, L. P. and Jaing, J. J. Bond-slip models for FRP sheets/plates
bonded to concrete. Engineering Structures 2005; 24 (5): 920-937.
20. JCI. Technical report on continous fibre reinforced concrete. JCI TC952 on Continous
Reinforced Concrete 1998; 116-124.
21. JCI. Technical report on retrofit technology for concrete structures. Technical Committee
on Retrofitting Technology for Concrete Structures 2003; 79-97.
22. Toutanji, H., Zhao, L., and Zhang, Y. Flexural behavior of reinforced concrete beams
externally strengthened with CFRP sheets bonded with an inorganic matrix. Engineering
Structures March 2006; 28: 557-566.