Embed Size (px)
Citation preview
1
Seismic Retrofitting of a Building using the EC8-3
Paulo Marques Baptista de Carvalho nº56562
Abstract - The document assess and retrofits
two reinforced concrete structure buildings in a
seismic event, using the EC8-3, leading to a
reinforcement of the structure as a whole and a
local retrofit. The methodology used in the
structural assessment is displacement based.
Key words - Seismic, EC8-3, structure,
assessment, retrofit, concrete.
1. Introduction
The standard EN1998-3 or EC8-3 [1] proposes a
methodology to assess the capacity of an
existing building to perform well in a seismic
event. This document studies the particular case
of a building with a structure of reinforced
concrete. The EC8-3 uses a displacement based
approach to assess the structural behaviour,
which evaluate the capacity of the members of
the structures sustain the displacements induced
by an earthquake.
2. Seismic assessment of a concrete
structure
A. Displacement based design
The displacement based design is an approach
towards the design of structures, which focuses
in the displacements that a structure can
withstand rather than the sections resistance
from a lateral loading. This is more suited for a
seismic design because the seismic action is a
displacement imposed to the structure
foundation, which leads to by P-Δ effects,
instead of lateral forces that mobilizes the
section resistance. A displacement based
approach checks the member capacity
deformation, by other means, the capacity of
still carrying the vertical loads in a deformed
configuration.
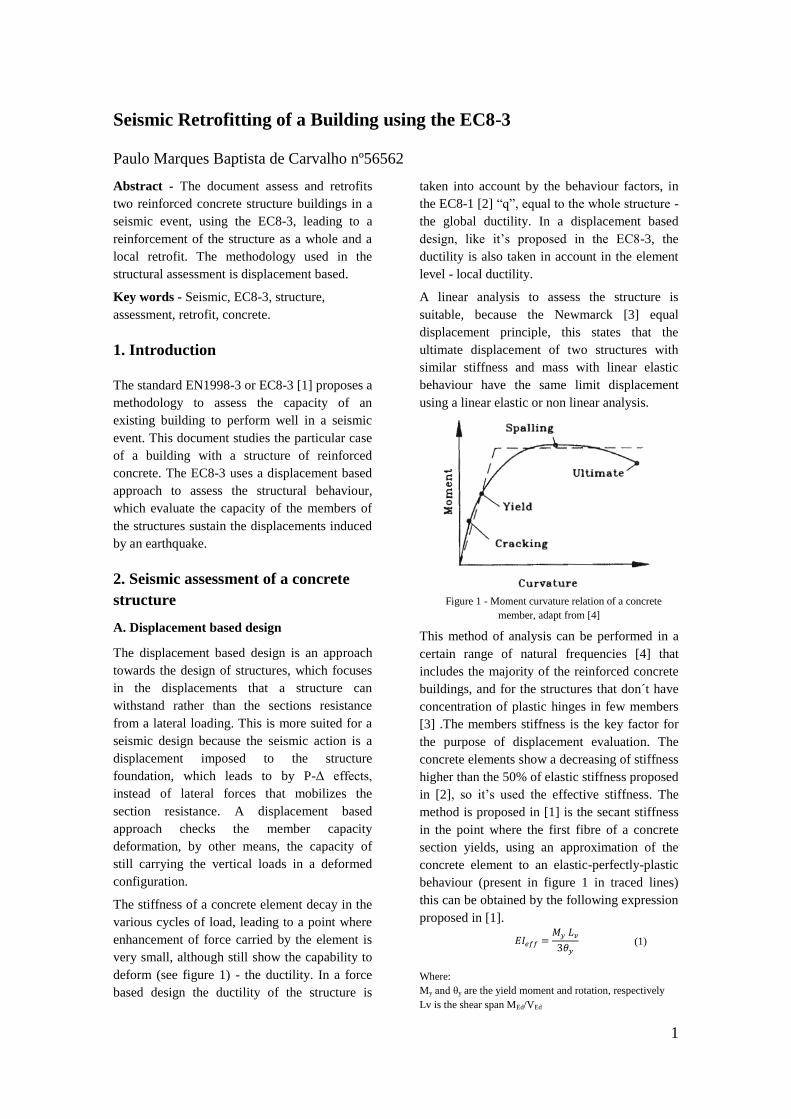
The stiffness of a concrete element decay in the
various cycles of load, leading to a point where
enhancement of force carried by the element is
very small, although still show the capability to
deform (see figure 1) - the ductility. In a force
based design the ductility of the structure is
taken into account by the behaviour factors, in
the EC8-1 [2] “q”, equal to the whole structure -
the global ductility. In a displacement based
design, like it’s proposed in the EC8-3, the
ductility is also taken in account in the element
level - local ductility.
A linear analysis to assess the structure is
suitable, because the Newmarck [3] equal
displacement principle, this states that the
ultimate displacement of two structures with
similar stiffness and mass with linear elastic
behaviour have the same limit displacement
using a linear elastic or non linear analysis.
Figure 1 - Moment curvature relation of a concrete
member, adapt from [4]
This method of analysis can be performed in a
certain range of natural frequencies [4] that
includes the majority of the reinforced concrete
buildings, and for the structures that don´t have
concentration of plastic hinges in few members
[3] .The members stiffness is the key factor for
the purpose of displacement evaluation. The
concrete elements show a decreasing of stiffness
higher than the 50% of elastic stiffness proposed
in [2], so it’s used the effective stiffness. The
method is proposed in [1] is the secant stiffness
in the point where the first fibre of a concrete
section yields, using an approximation of the
concrete element to an elastic-perfectly-plastic
behaviour (present in figure 1 in traced lines)
this can be obtained by the following expression
proposed in [1].
(1)
Where:
My and θy are the yield moment and rotation, respectively
Lv is the shear span MEd/VEd
2
B. Assessment of concrete structures by EC8-
3
The EC8-3 sets for Portugal the limit state (LS)
named Significant Damage (SD) to fulfil; this
state corresponds to a probability of exceedance
of 10% in 50 years or a return period of 475
years. In other countries can be checked a lower
limit state named Near Collapse (NC) with a
higher return period. It´s presented other LS
with a higher level of protection, the limit state
of Damage Limitation (DL) with a return period
of 225 years, which corresponds to a probability
of exceedance of 20% in 50 years.
The seismic ground acceleration is the same
presented in [2], including the foundations type
soil, and with two types of earthquake indicated
in the national annex, the type 1 and type 2,
with an equal division of the country by zones.
The standard [1] indicates a series of data to
collect from the structure members and the
minimum tests of the materials. This divides in
three types of information to collect: geometry
of the members of the structure, details that
consists in the amount of reinforcement and its
details and the materials mechanic properties.
This data leads to three levels of information
named Knowledge Levels (KL) that correspond
to a confidence factor (CF) used like a safety
factor. The KL1, KL2 and KL3 leads to a CF of
1,35, 1,20 and 1,00 respectively. The
information to retrieve to indentify and reach
the KLs is presented in 3.3 and 3.4 of [1].
The prerequisites to the use of each type of
structural analysis are the same presented in [2],
but if the inspection leads to a KL1 the analysis
needs to be linear, by lateral loads or using a
modal response spectrum. To use a linear
analysis is needed to fulfil another condition,
which is the formation plastic hinges spread
evenly throughout the structure. This is
checked, for each section, by the parameter ρi
present in the expression (2) that relates the
demand (Di) with the capacity (Ci) of the section
using the flexure moments.
(2)
(3)
The capacities values need to be calculated
excluding the possibility of plastic hinge
formations in the column or beams and vice-
versa. In the whole structure, for each element,
the relation express in (3) must be smaller than
the value 2 to 3, varying by country.
The EC8-3 in the annex A proposes a set of
expressions, suitable to evaluate the rotations
capacities and shear resistance of the elements.
The expression (4) used to predict the ultimate
rotation capacities was made and calibrated
based in various tests to columns, beams and
walls [5]. In this expressions ω ω´ are the
mechanical percentages of longitudinal
reinforcement in tension and compression,
respectively, υ axial force normalized to the
section resistance. The parameter ρsx and ρd are
the steel ratio of transverse reinforcement and
diagonal reinforcement respectively, α is a
factor considering the confinement given by
expression (A2) of [1] and γel is the safety factor
with the value 1,5 for primary elements and 1,0
for secondary ones. The average mechanical
properties of the materials divided by the
corresponding CF are presented by fc for the
concrete and fyw for the steel in stirrups.
(4)
The elastic part of the rotation of an element is
presented in the expression (5) and like (4) was
calibrated by tests [5]. The first member of this
expression takes in to account the possibility of
the shear cracking prior to the moment of yield,
the second it’s inherent to the shape of the
element, and the third considers the anchorage
tension in the longitudinal steel bars.
For
columns
and
beams
(5a)
For walls
(5b)
The yield curvature in (5) is represented by Øy,
av is equal to 1 if shear cracking occurs before
the section reaches the yield moment, or else is
0. The parameters z and h are respectively the
3
length or the internal lever arm and the depth of
the section. The medium yield stress is
represented by fy and dbl is the medium
diameter, both from the longitudinal
reinforcement.
The limits state of severe damage (SD)
demanded by the rotations should be inferior to
3/4 of the ultimate rotation. For the state of
damage limitation (LD) the elements should
remain elastic.
The shear resistance of a section is decresed in
its plastic phase [5] and based in testing the
EC8-3 gives the following expression (6) to the
shear resistance. The web concrete crushing
resistance through shear in all walls elements or
in columns with a relation Lv to height less or
equal to 2,0 is taken equal to the value given by
(7). In expressions (6) and (7) x is the depth of
the compression zone, N the axial force (only in
compression else zero) and Ac the area of the
section, μΔpl
equal to , ρtot the
total longitudinal reinforcement ratio, Vw the
transverse reinforcement shear resistance
contribution and bw the web width. The safety
factor is equal to 1,15 to primary elements and
1,0 for secondary ones.
1−0,05min(5; ∆ 0,16 0,5;100 1−0,16
5; + (6)
1,8 0,15; 1+0,25 1,75;100 1−0,2
2;
(7)
The assessment of the beam column joint is
made like a fragile mechanism and is checked
like in the design of new buildings presented in
[2], for structures of high ductility (DCH) [1].
3. Assessment and retrofitting of a
building using the EC8-3
The practical assessment of a structure will be
made in two similar buildings, which leads to
two retrofitting strategies, a reinforcement of a
structure as a whole, and a local retrofitting one.
The structure in analysis is an office building
located in the town of Faro in Portugal. The
structure has 6 floors above ground without
basements, with a height between floors of
2,8m. The thickness of the slab floors is 0,18m,
with the exceptions of the zones near the stairs
which have 0,22m (see figure 2). The concrete
used in the structure was a B25 (actual C20/25),
and the steel used in reinforcement an A400.
The foundation is made by footings connected
by foundation beams.
Assessment of building A
The first structure to be assess is the building A
which was designed using the standards in use
in the 1960´s in Portugal, for the actions it was
used the Regulamento de Solicitações em Edi
fícios e Pontes (RSEP) [6] and for the design of
the concrete elements the Regulamento de
Estruturas de Betão Armado (REBA) [7]. The
detailing of the structure was made considering
low seismic actions comparing with the actual
practice, with the vertical loads prevailing in
comparison with the lateral loads. The survey
and the testing of the materials, geometry and
the details of the elements of the structure leads
to a KL2, with a confidence factor of 1,2. The
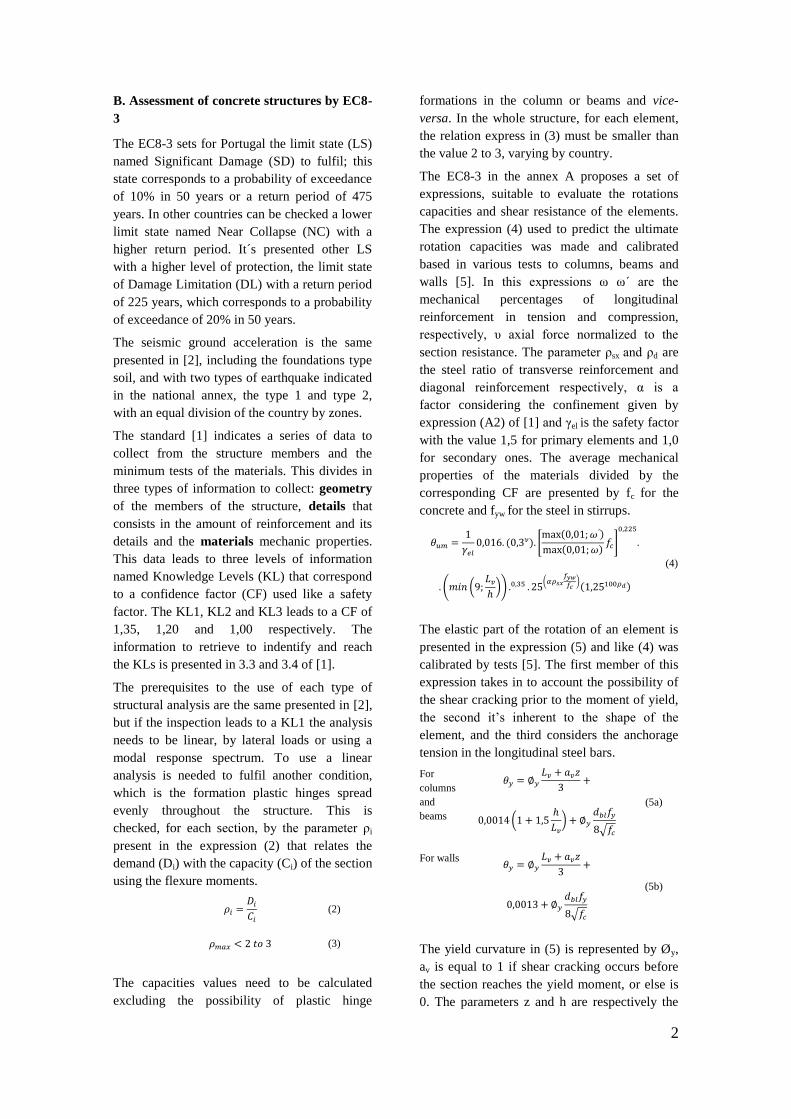
location of the vertical elements and the beams
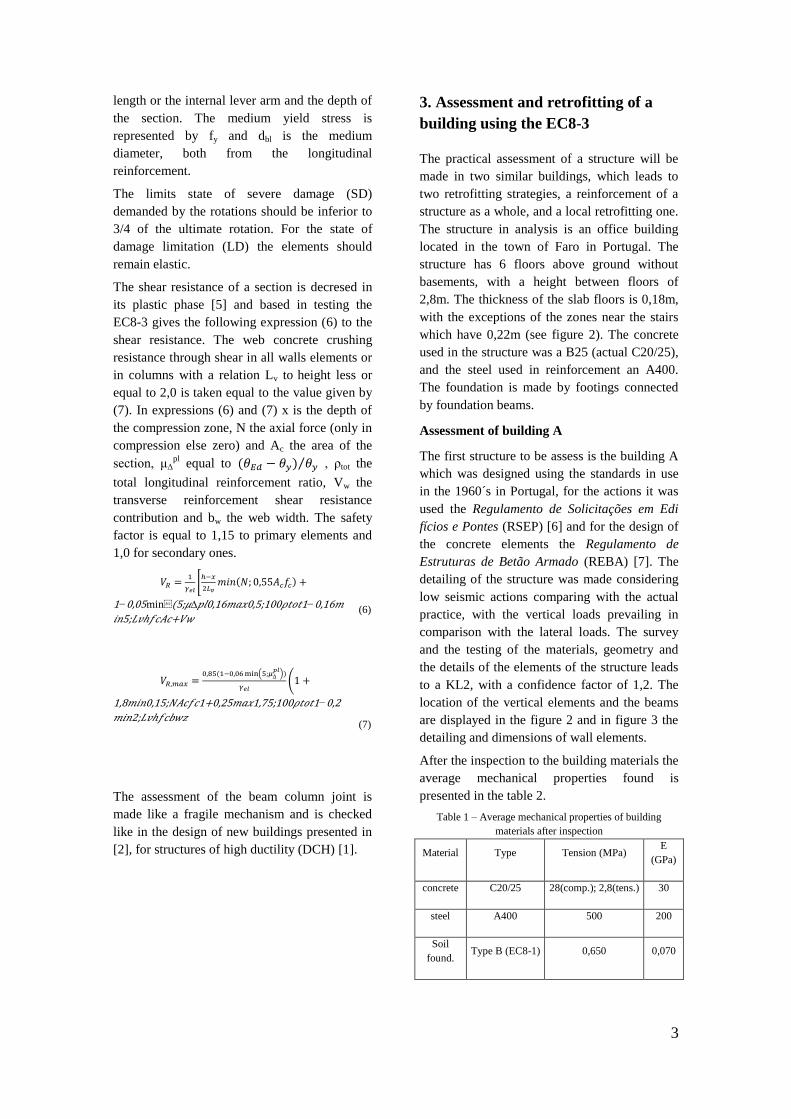
are displayed in the figure 2 and in figure 3 the
detailing and dimensions of wall elements.
After the inspection to the building materials the
average mechanical properties found is
presented in the table 2.
Table 1 – Average mechanical properties of building
materials after inspection
Material Type Tension (MPa) E
(GPa)
concrete C20/25 28(comp.); 2,8(tens.) 30
steel A400 500 200
Soil
found. Type B (EC8-1) 0,650 0,070
4
Figure 2 – Location of the vertical elements and beams in the type floor of building A
Figure 3 – Dimensions and details of wall elements NC and
PA
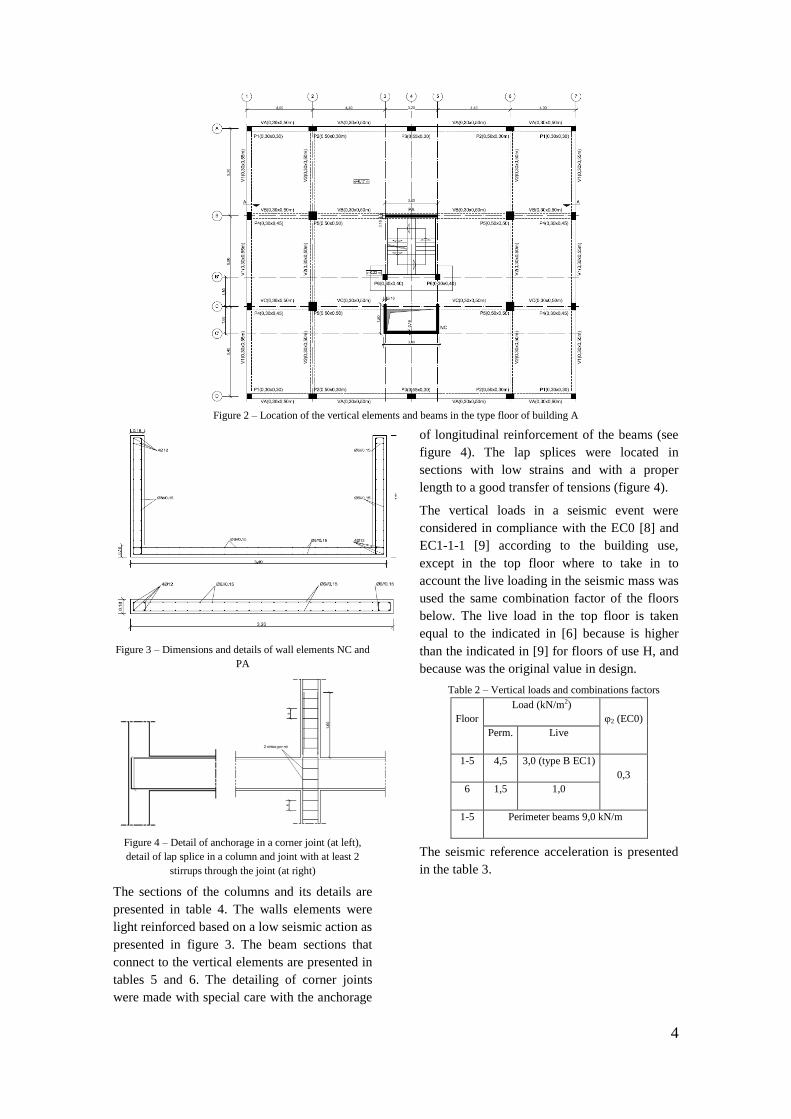
Figure 4 – Detail of anchorage in a corner joint (at left),
detail of lap splice in a column and joint with at least 2
stirrups through the joint (at right)
The sections of the columns and its details are
presented in table 4. The walls elements were
light reinforced based on a low seismic action as
presented in figure 3. The beam sections that
connect to the vertical elements are presented in
tables 5 and 6. The detailing of corner joints
were made with special care with the anchorage
of longitudinal reinforcement of the beams (see
figure 4). The lap splices were located in
sections with low strains and with a proper
length to a good transfer of tensions (figure 4).
The vertical loads in a seismic event were
considered in compliance with the EC0 [8] and
EC1-1-1 [9] according to the building use,
except in the top floor where to take in to
account the live loading in the seismic mass was
used the same combination factor of the floors
below. The live load in the top floor is taken
equal to the indicated in [6] because is higher
than the indicated in [9] for floors of use H, and
because was the original value in design.
Table 2 – Vertical loads and combinations factors
Floor
Load (kN/m2)
φ2 (EC0)
Perm. Live
1-5 4,5 3,0 (type B EC1)
0,3
6 1,5 1,0
1-5 Perimeter beams 9,0 kN/m
The seismic reference acceleration is presented
in the table 3.
5
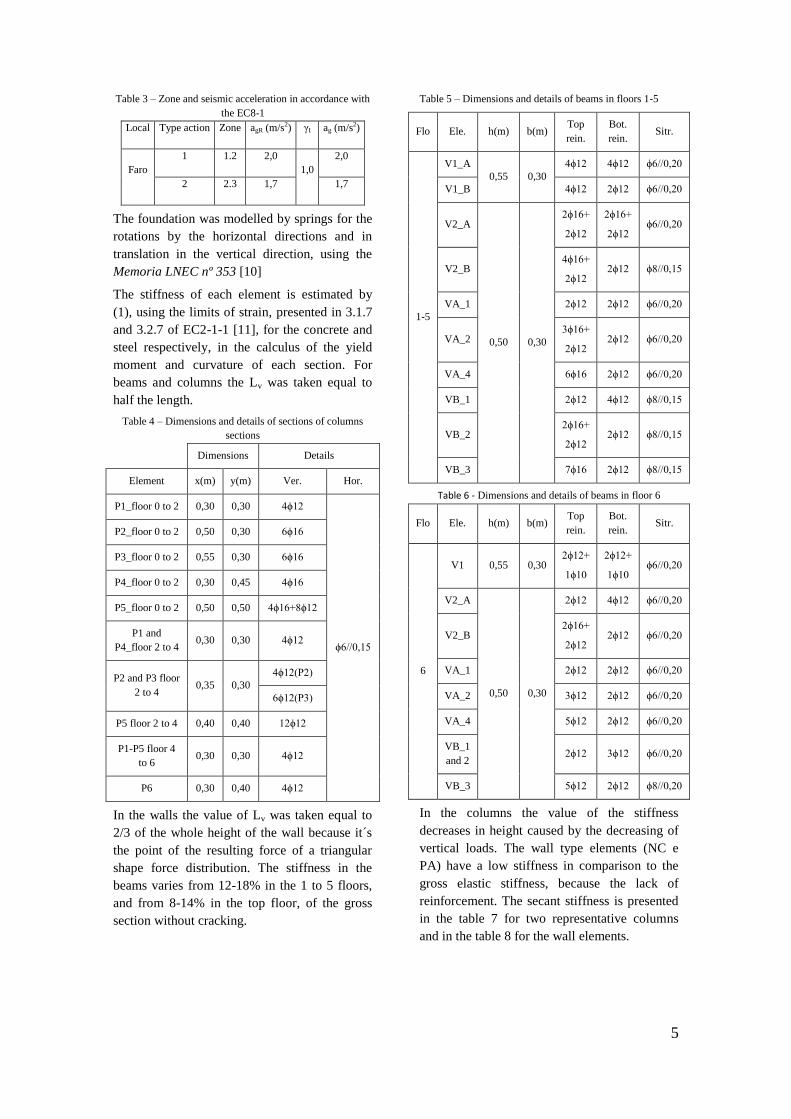
Table 3 – Zone and seismic acceleration in accordance with
the EC8-1
Local Type action Zone agR (m/s2) γI ag (m/s2)
Faro
1 1.2 2,0
1,0
2,0
2 2.3 1,7 1,7
The foundation was modelled by springs for the
rotations by the horizontal directions and in
translation in the vertical direction, using the
Memoria LNEC nº 353 [10]
The stiffness of each element is estimated by
(1), using the limits of strain, presented in 3.1.7
and 3.2.7 of EC2-1-1 [11], for the concrete and
steel respectively, in the calculus of the yield
moment and curvature of each section. For
beams and columns the Lv was taken equal to
half the length.
Table 4 – Dimensions and details of sections of columns
sections
Dimensions Details
Element x(m) y(m) Ver. Hor.
P1_floor 0 to 2 0,30 0,30 4ϕ12
ϕ6//0,15
P2_floor 0 to 2 0,50 0,30 6ϕ16
P3_floor 0 to 2 0,55 0,30 6ϕ16
P4_floor 0 to 2 0,30 0,45 4ϕ16
P5_floor 0 to 2 0,50 0,50 4ϕ16+8ϕ12
P1 and
P4_floor 2 to 4 0,30 0,30 4ϕ12
P2 and P3 floor
2 to 4 0,35 0,30
4ϕ12(P2)
6ϕ12(P3)
P5 floor 2 to 4 0,40 0,40 12ϕ12
P1-P5 floor 4
to 6 0,30 0,30 4ϕ12
P6 0,30 0,40 4ϕ12
In the walls the value of Lv was taken equal to
2/3 of the whole height of the wall because it´s
the point of the resulting force of a triangular
shape force distribution. The stiffness in the
beams varies from 12-18% in the 1 to 5 floors,
and from 8-14% in the top floor, of the gross
section without cracking.
Table 5 – Dimensions and details of beams in floors 1-5
Flo Ele. h(m) b(m) Top
rein.
Bot.
rein. Sitr.
1-5
V1_A
0,55 0,30
4ϕ12 4ϕ12 ϕ6//0,20
V1_B 4ϕ12 2ϕ12 ϕ6//0,20
V2_A
0,50 0,30
2ϕ16+
2ϕ12
2ϕ16+
2ϕ12 ϕ6//0,20
V2_B 4ϕ16+
2ϕ12 2ϕ12 ϕ8//0,15
VA_1 2ϕ12 2ϕ12 ϕ6//0,20
VA_2 3ϕ16+
2ϕ12 2ϕ12 ϕ6//0,20
VA_4 6ϕ16 2ϕ12 ϕ6//0,20
VB_1 2ϕ12 4ϕ12 ϕ8//0,15
VB_2 2ϕ16+
2ϕ12 2ϕ12 ϕ8//0,15
VB_3 7ϕ16 2ϕ12 ϕ8//0,15
Table 6 - Dimensions and details of beams in floor 6
Flo Ele. h(m) b(m) Top
rein.
Bot.
rein. Sitr.
6
V1 0,55 0,30 2ϕ12+
1ϕ10
2ϕ12+
1ϕ10 ϕ6//0,20
V2_A
0,50 0,30
2ϕ12 4ϕ12 ϕ6//0,20
V2_B 2ϕ16+
2ϕ12 2ϕ12 ϕ6//0,20
VA_1 2ϕ12 2ϕ12 ϕ6//0,20
VA_2 3ϕ12 2ϕ12 ϕ6//0,20
VA_4 5ϕ12 2ϕ12 ϕ6//0,20
VB_1
and 2 2ϕ12 3ϕ12 ϕ6//0,20
VB_3 5ϕ12 2ϕ12 ϕ8//0,20
In the columns the value of the stiffness
decreases in height caused by the decreasing of
vertical loads. The wall type elements (NC e
PA) have a low stiffness in comparison to the
gross elastic stiffness, because the lack of
reinforcement. The secant stiffness is presented
in the table 7 for two representative columns
and in the table 8 for the wall elements.
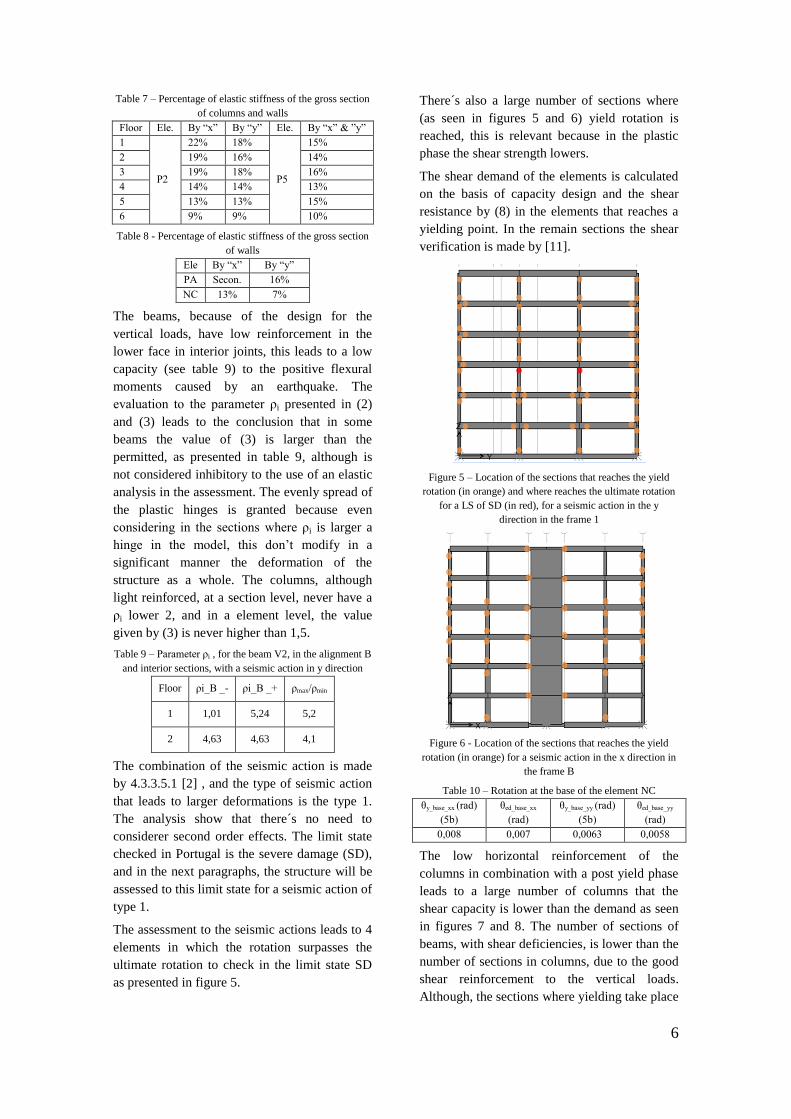
6
Table 7 – Percentage of elastic stiffness of the gross section
of columns and walls
Floor Ele. By “x” By “y” Ele. By “x” & ”y”
1
P2
22% 18%
P5
15%
2 19% 16% 14%
3 19% 18% 16%
4 14% 14% 13%
5 13% 13% 15%
6 9% 9% 10%
Table 8 - Percentage of elastic stiffness of the gross section
of walls
Ele By “x” By “y”
PA Secon. 16%
NC 13% 7%
The beams, because of the design for the
vertical loads, have low reinforcement in the
lower face in interior joints, this leads to a low
capacity (see table 9) to the positive flexural
moments caused by an earthquake. The
evaluation to the parameter ρi presented in (2)
and (3) leads to the conclusion that in some
beams the value of (3) is larger than the
permitted, as presented in table 9, although is
not considered inhibitory to the use of an elastic
analysis in the assessment. The evenly spread of
the plastic hinges is granted because even
considering in the sections where ρi is larger a
hinge in the model, this don’t modify in a
significant manner the deformation of the
structure as a whole. The columns, although
light reinforced, at a section level, never have a
ρi lower 2, and in a element level, the value
given by (3) is never higher than 1,5.
Table 9 – Parameter ρi , for the beam V2, in the alignment B
and interior sections, with a seismic action in y direction
Floor ρi_B _- ρi_B _+ ρmax/ρmin
1 1,01 5,24 5,2
2 4,63 4,63 4,1
The combination of the seismic action is made
by 4.3.3.5.1 [2] , and the type of seismic action
that leads to larger deformations is the type 1.
The analysis show that there´s no need to
considerer second order effects. The limit state
checked in Portugal is the severe damage (SD),
and in the next paragraphs, the structure will be
assessed to this limit state for a seismic action of
type 1.
The assessment to the seismic actions leads to 4
elements in which the rotation surpasses the
ultimate rotation to check in the limit state SD
as presented in figure 5.
There´s also a large number of sections where
(as seen in figures 5 and 6) yield rotation is
reached, this is relevant because in the plastic
phase the shear strength lowers.
The shear demand of the elements is calculated
on the basis of capacity design and the shear
resistance by (8) in the elements that reaches a
yielding point. In the remain sections the shear
verification is made by [11].
Figure 5 – Location of the sections that reaches the yield
rotation (in orange) and where reaches the ultimate rotation
for a LS of SD (in red), for a seismic action in the y
direction in the frame 1
Figure 6 - Location of the sections that reaches the yield
rotation (in orange) for a seismic action in the x direction in
the frame B
Table 10 – Rotation at the base of the element NC
θy_base_xx (rad)
(5b)
θed_base_xx
(rad)
θy_base_yy (rad)
(5b)
θed_base_yy
(rad)
0,008 0,007 0,0063 0,0058
The low horizontal reinforcement of the
columns in combination with a post yield phase
leads to a large number of columns that the
shear capacity is lower than the demand as seen
in figures 7 and 8. The number of sections of
beams, with shear deficiencies, is lower than the
number of sections in columns, due to the good
shear reinforcement to the vertical loads.
Although, the sections where yielding take place
7
have shear resistance problems in particular the
sections that connect to the elements PA and
NC which have large deformations.
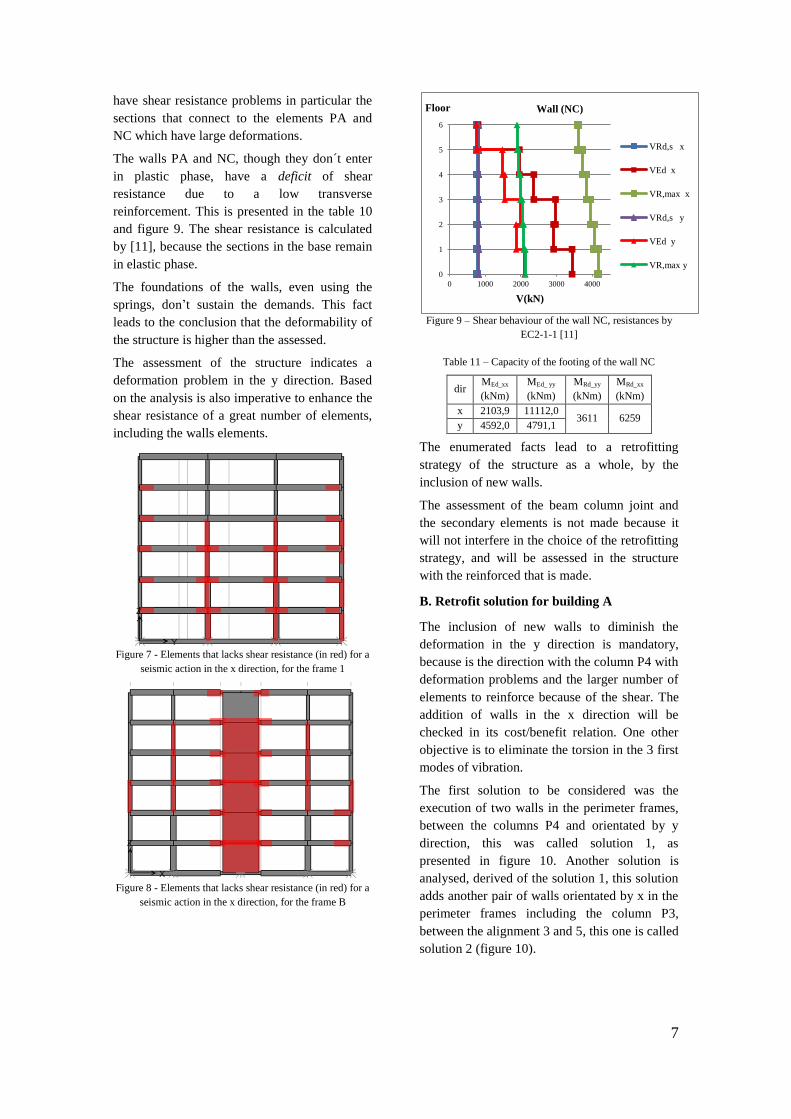
The walls PA and NC, though they don´t enter
in plastic phase, have a deficit of shear
resistance due to a low transverse
reinforcement. This is presented in the table 10
and figure 9. The shear resistance is calculated
by [11], because the sections in the base remain
in elastic phase.
The foundations of the walls, even using the
springs, don’t sustain the demands. This fact
leads to the conclusion that the deformability of
the structure is higher than the assessed.
The assessment of the structure indicates a
deformation problem in the y direction. Based
on the analysis is also imperative to enhance the
shear resistance of a great number of elements,
including the walls elements.
Figure 7 - Elements that lacks shear resistance (in red) for a
seismic action in the x direction, for the frame 1
Figure 8 - Elements that lacks shear resistance (in red) for a
seismic action in the x direction, for the frame B
Figure 9 – Shear behaviour of the wall NC, resistances by
EC2-1-1 [11]
Table 11 – Capacity of the footing of the wall NC
dir MEd_xx
(kNm)
MEd_ yy
(kNm)
MRd_yy
(kNm)
MRd_xx
(kNm)
x 2103,9 11112,0 3611 6259
y 4592,0 4791,1
The enumerated facts lead to a retrofitting
strategy of the structure as a whole, by the
inclusion of new walls.
The assessment of the beam column joint and
the secondary elements is not made because it
will not interfere in the choice of the retrofitting
strategy, and will be assessed in the structure
with the reinforced that is made.
B. Retrofit solution for building A
The inclusion of new walls to diminish the
deformation in the y direction is mandatory,
because is the direction with the column P4 with
deformation problems and the larger number of
elements to reinforce because of the shear. The
addition of walls in the x direction will be
checked in its cost/benefit relation. One other
objective is to eliminate the torsion in the 3 first
modes of vibration.
The first solution to be considered was the
execution of two walls in the perimeter frames,
between the columns P4 and orientated by y
direction, this was called solution 1, as
presented in figure 10. Another solution is
analysed, derived of the solution 1, this solution
adds another pair of walls orientated by x in the
perimeter frames including the column P3,
between the alignment 3 and 5, this one is called
solution 2 (figure 10).
0
1
2
3
4
5
6
0 1000 2000 3000 4000
Floor
V(kN)
Wall (NC)
VRd,s x
VEd x
VR,max x
VRd,s y
VEd y
VR,max y
8
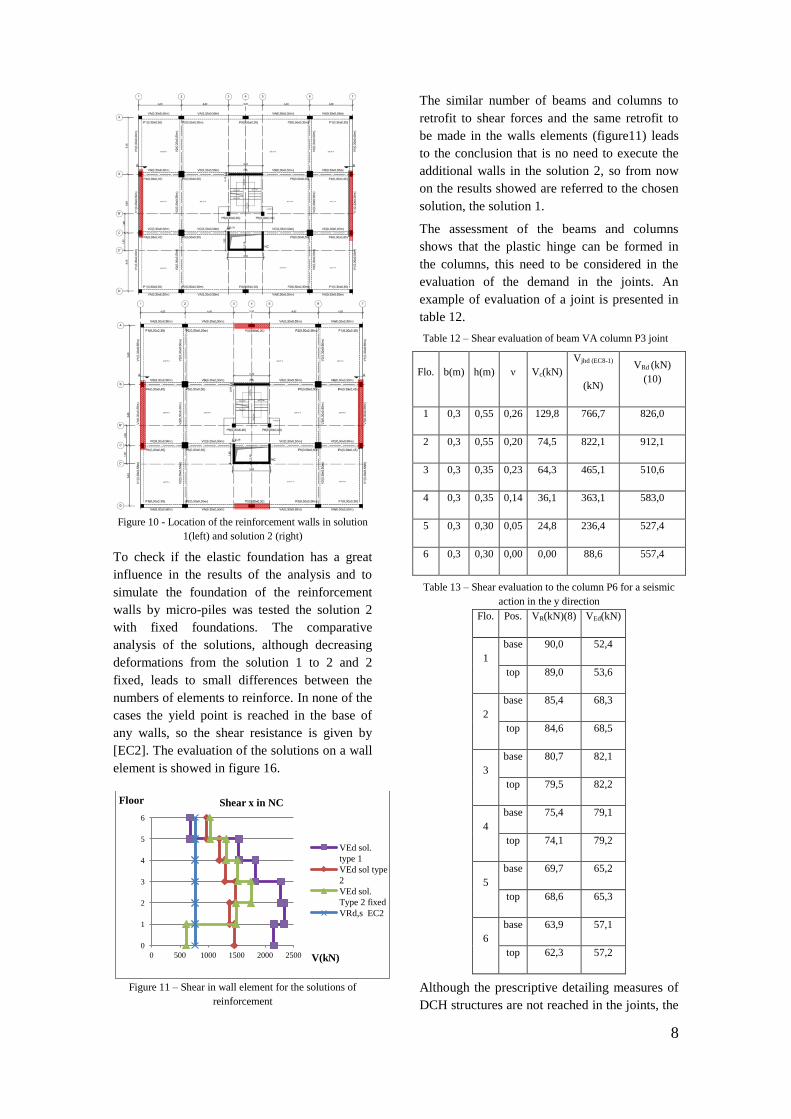
Figure 10 - Location of the reinforcement walls in solution
1(left) and solution 2 (right)
To check if the elastic foundation has a great
influence in the results of the analysis and to
simulate the foundation of the reinforcement
walls by micro-piles was tested the solution 2
with fixed foundations. The comparative
analysis of the solutions, although decreasing
deformations from the solution 1 to 2 and 2
fixed, leads to small differences between the
numbers of elements to reinforce. In none of the
cases the yield point is reached in the base of
any walls, so the shear resistance is given by
[EC2]. The evaluation of the solutions on a wall
element is showed in figure 16.
Figure 11 – Shear in wall element for the solutions of
reinforcement
The similar number of beams and columns to
retrofit to shear forces and the same retrofit to
be made in the walls elements (figure11) leads
to the conclusion that is no need to execute the
additional walls in the solution 2, so from now
on the results showed are referred to the chosen
solution, the solution 1.
The assessment of the beams and columns
shows that the plastic hinge can be formed in
the columns, this need to be considered in the
evaluation of the demand in the joints. An
example of evaluation of a joint is presented in
table 12.
Table 12 – Shear evaluation of beam VA column P3 joint
Flo. b(m) h(m) ν Vc(kN)
Vjhd (EC8-1)
(kN)
VRd (kN)
(10)
1 0,3 0,55 0,26 129,8 766,7 826,0
2 0,3 0,55 0,20 74,5 822,1 912,1
3 0,3 0,35 0,23 64,3 465,1 510,6
4 0,3 0,35 0,14 36,1 363,1 583,0
5 0,3 0,30 0,05 24,8 236,4 527,4
6 0,3 0,30 0,00 0,00 88,6 557,4
Table 13 – Shear evaluation to the column P6 for a seismic
action in the y direction
Flo. Pos. VR(kN)(8) VEd(kN)
1
base 90,0 52,4
top 89,0 53,6
2
base 85,4 68,3
top 84,6 68,5
3
base 80,7 82,1
top 79,5 82,2
4
base 75,4 79,1
top 74,1 79,2
5
base 69,7 65,2
top 68,6 65,3
6
base 63,9 57,1
top 62,3 57,2
Although the prescriptive detailing measures of
DCH structures are not reached in the joints, the
0
1
2
3
4
5
6
0 500 1000 1500 2000 2500
Floor
V(kN)
Shear x in NC
VEd sol.
type 1
VEd sol type
2
VEd sol.
Type 2 fixed
VRd,s EC2
9
main mechanism for a good behaviour of a
joint, the crushing the concrete in diagonal, is
verified.
The secondary elements considered were the
columns P3 in both directions and the column
P3 and wall PA in y direction. This type of
elements has only problems in shear resistance
and in only one element, the column P6, showed
in table 13.
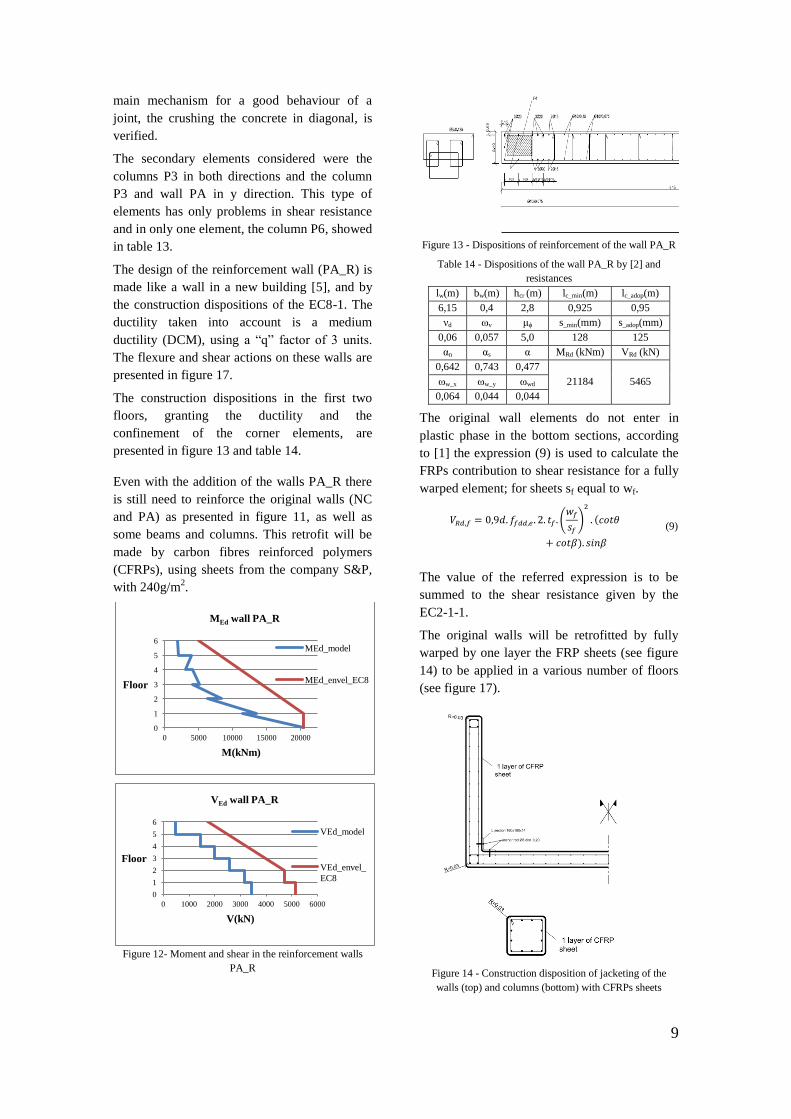
The design of the reinforcement wall (PA_R) is
made like a wall in a new building [5], and by
the construction dispositions of the EC8-1. The
ductility taken into account is a medium
ductility (DCM), using a “q” factor of 3 units.
The flexure and shear actions on these walls are
presented in figure 17.
The construction dispositions in the first two
floors, granting the ductility and the
confinement of the corner elements, are
presented in figure 13 and table 14.
Even with the addition of the walls PA_R there
is still need to reinforce the original walls (NC
and PA) as presented in figure 11, as well as
some beams and columns. This retrofit will be
made by carbon fibres reinforced polymers
(CFRPs), using sheets from the company S&P,
with 240g/m2.
Figure 12- Moment and shear in the reinforcement walls
PA_R
Figure 13 - Dispositions of reinforcement of the wall PA_R
Table 14 - Dispositions of the wall PA_R by [2] and
resistances
lw(m) bw(m) hcr (m) lc_min(m) lc_adop(m)
6,15 0,4 2,8 0,925 0,95
νd ωv μϕ s_min(mm) s_adop(mm)
0,06 0,057 5,0 128 125
αn αs α MRd (kNm) VRd (kN)
0,642 0,743 0,477
21184 5465 ωw_x ωw_y ωwd
0,064 0,044 0,044
The original wall elements do not enter in
plastic phase in the bottom sections, according
to [1] the expression (9) is used to calculate the
FRPs contribution to shear resistance for a fully
warped element; for sheets sf equal to wf.
(9)
The value of the referred expression is to be
summed to the shear resistance given by the
EC2-1-1.
The original walls will be retrofitted by fully
warped by one layer the FRP sheets (see figure
14) to be applied in a various number of floors
(see figure 17).
Figure 14 - Construction disposition of jacketing of the
walls (top) and columns (bottom) with CFRPs sheets
0
1
2
3
4
5
6
0 5000 10000 15000 20000
Floor
M(kNm)
MEd wall PA_R
MEd_model
MEd_envel_EC8
0
1
2
3
4
5
6
0 1000 2000 3000 4000 5000 6000
Floor
V(kN)
VEd wall PA_R
VEd_model
VEd_envel_
EC8
10
Table 15 – Shear resistance of the CFRP per layer of sheet
in walls
Ele. θ (º) β(º) R(cm)
ffdd
(MPa)
ffdd,e,W
(MPa)
VRd,f
(kN)
PA
22 90 3,0
1270 1514 2425
NC_dir x 1269 1515 2581
NC_dir y 1281 1498 1333
The columns with lack of shear resistance to
shear demands will also be fully warped by
FRPs sheets (figure 17), but in this case the
elements reaches the yield rotation, so the
contribution to the shear resistance is calculated
through the expression (10) proposed in [1]. The
enhancement of shear resistance by the FRP is
to be added to the transverse reinforcement
value (Vw) in the expression (6). These values
are presented in table 16.
(9)
Table 16 - Shear resistance of the CFRP per layer of sheet in
columns
Ele. bw(m) d (m) fu (N/mm2) Vw,f(kN)
P1 flo.0-1 0,300 0,265
4500
74,9
P2 flo.2-4 0,300 0,315 89,0
P2 flo.2-4 0,500 0,465 74,9
P5 flo.0-1 0,500 0,465 131,4
P5 flo.2-4 0,400 0,365 103,1
P6 flo.2-4 0,300 0,365 103,1
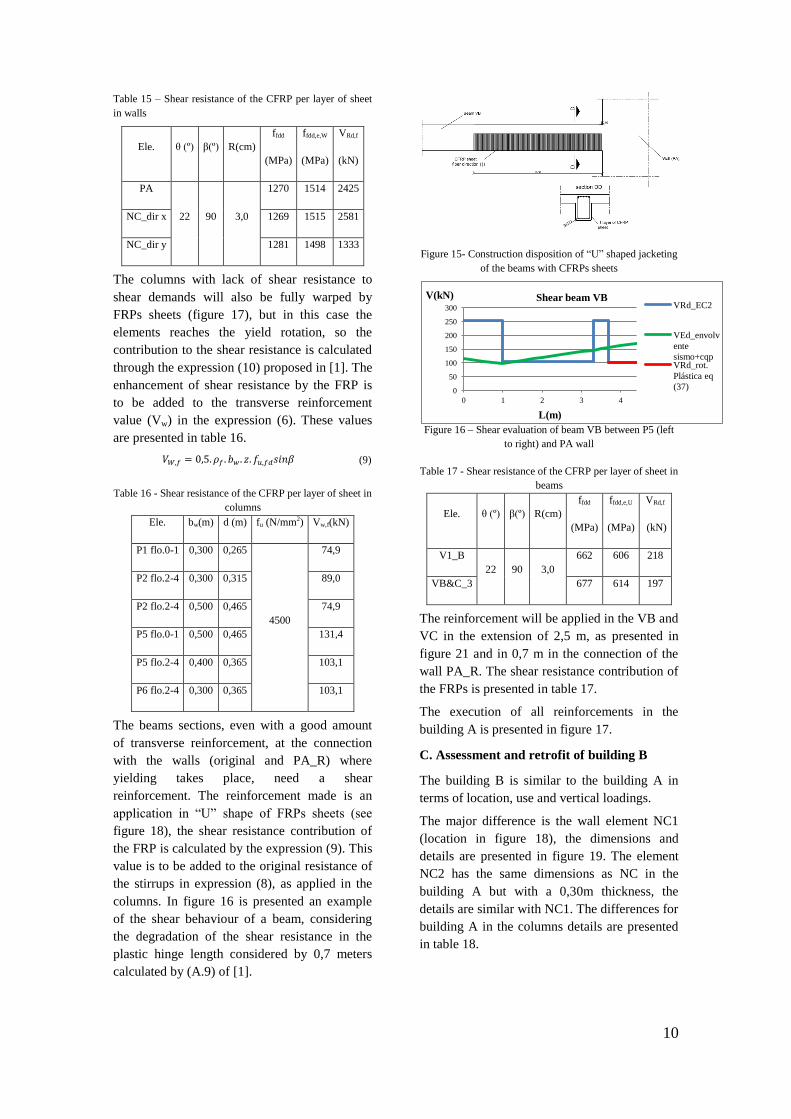
The beams sections, even with a good amount
of transverse reinforcement, at the connection
with the walls (original and PA_R) where
yielding takes place, need a shear
reinforcement. The reinforcement made is an
application in “U” shape of FRPs sheets (see
figure 18), the shear resistance contribution of
the FRP is calculated by the expression (9). This
value is to be added to the original resistance of
the stirrups in expression (8), as applied in the
columns. In figure 16 is presented an example
of the shear behaviour of a beam, considering
the degradation of the shear resistance in the
plastic hinge length considered by 0,7 meters
calculated by (A.9) of [1].
Figure 15- Construction disposition of “U” shaped jacketing
of the beams with CFRPs sheets
Figure 16 – Shear evaluation of beam VB between P5 (left
to right) and PA wall
Table 17 - Shear resistance of the CFRP per layer of sheet in
beams
Ele. θ (º) β(º) R(cm)
ffdd
(MPa)
ffdd,e,U
(MPa)
VRd,f
(kN)
V1_B
22 90 3,0
662 606 218
VB&C_3 677 614 197
The reinforcement will be applied in the VB and
VC in the extension of 2,5 m, as presented in
figure 21 and in 0,7 m in the connection of the
wall PA_R. The shear resistance contribution of
the FRPs is presented in table 17.
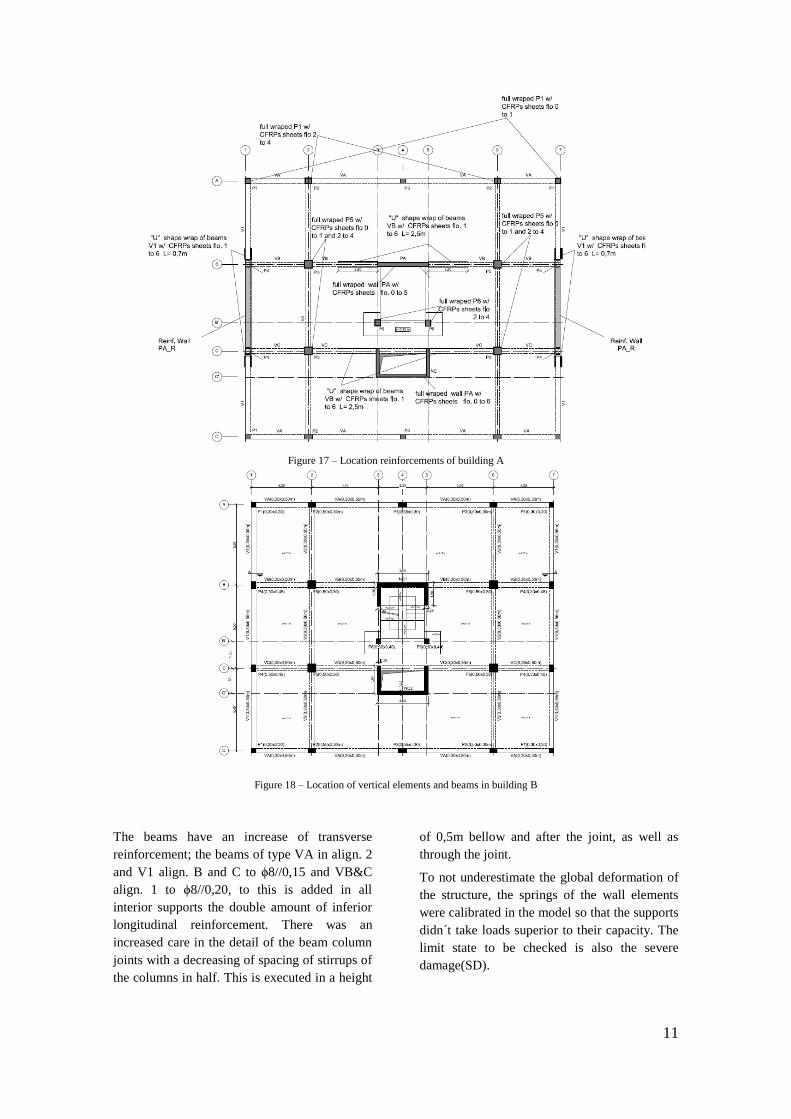
The execution of all reinforcements in the
building A is presented in figure 17.
C. Assessment and retrofit of building B
The building B is similar to the building A in
terms of location, use and vertical loadings.
The major difference is the wall element NC1
(location in figure 18), the dimensions and
details are presented in figure 19. The element
NC2 has the same dimensions as NC in the
building A but with a 0,30m thickness, the
details are similar with NC1. The differences for
building A in the columns details are presented
in table 18.
0
50
100
150
200
250
300
0 1 2 3 4
V(kN)
L(m)
Shear beam VB VRd_EC2
VEd_envolv
ente
sismo+cqp VRd_rot.
Plástica eq
(37)
11
Figure 17 – Location reinforcements of building A
Figure 18 – Location of vertical elements and beams in building B
The beams have an increase of transverse
reinforcement; the beams of type VA in align. 2
and V1 align. B and C to ϕ8//0,15 and VB&C
align. 1 to ϕ8//0,20, to this is added in all
interior supports the double amount of inferior
longitudinal reinforcement. There was an
increased care in the detail of the beam column
joints with a decreasing of spacing of stirrups of
the columns in half. This is executed in a height
of 0,5m bellow and after the joint, as well as
through the joint.
To not underestimate the global deformation of
the structure, the springs of the wall elements
were calibrated in the model so that the supports
didn´t take loads superior to their capacity. The
limit state to be checked is also the severe
damage(SD).
12
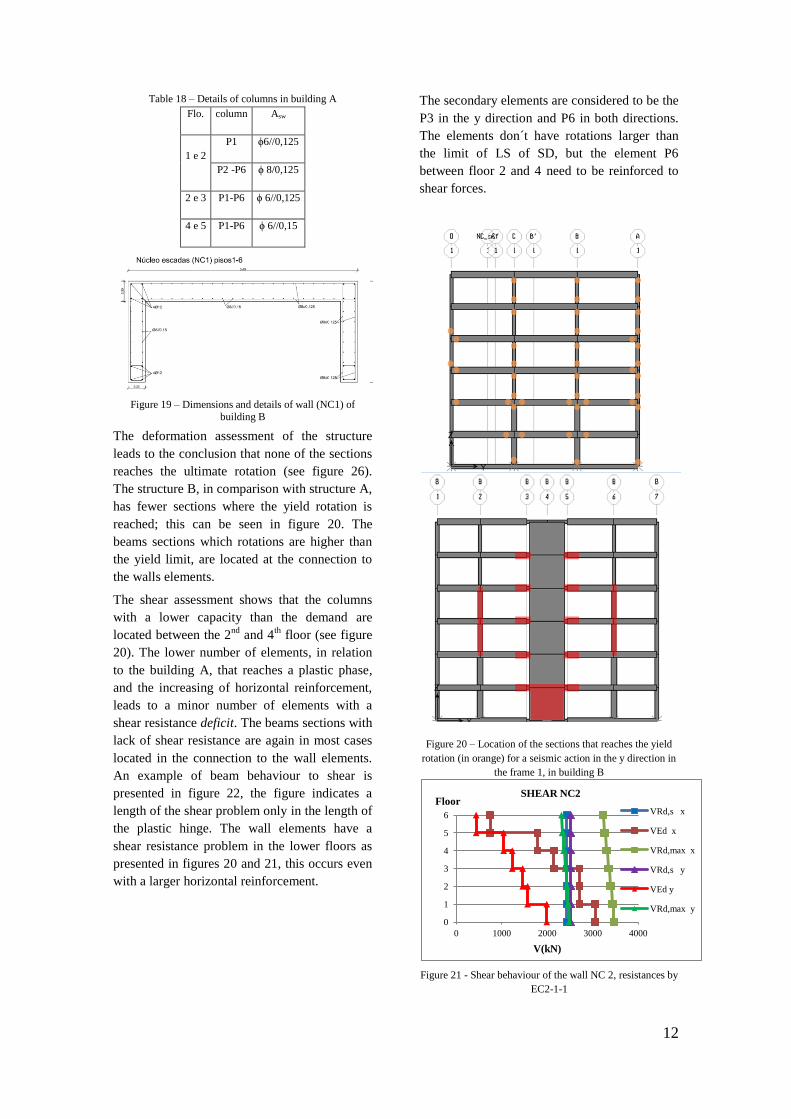
Table 18 – Details of columns in building A
Flo. column Asw
1 e 2
P1 ϕ6//0,125
P2 -P6 ϕ 8/0,125
2 e 3 P1-P6 ϕ 6//0,125
4 e 5 P1-P6 ϕ 6//0,15
Figure 19 – Dimensions and details of wall (NC1) of
building B
The deformation assessment of the structure
leads to the conclusion that none of the sections
reaches the ultimate rotation (see figure 26).
The structure B, in comparison with structure A,
has fewer sections where the yield rotation is
reached; this can be seen in figure 20. The
beams sections which rotations are higher than
the yield limit, are located at the connection to
the walls elements.
The shear assessment shows that the columns
with a lower capacity than the demand are
located between the 2nd
and 4th
floor (see figure
20). The lower number of elements, in relation
to the building A, that reaches a plastic phase,
and the increasing of horizontal reinforcement,
leads to a minor number of elements with a
shear resistance deficit. The beams sections with
lack of shear resistance are again in most cases
located in the connection to the wall elements.
An example of beam behaviour to shear is
presented in figure 22, the figure indicates a
length of the shear problem only in the length of
the plastic hinge. The wall elements have a
shear resistance problem in the lower floors as
presented in figures 20 and 21, this occurs even
with a larger horizontal reinforcement.
The secondary elements are considered to be the
P3 in the y direction and P6 in both directions.
The elements don´t have rotations larger than
the limit of LS of SD, but the element P6
between floor 2 and 4 need to be reinforced to
shear forces.
Figure 20 – Location of the sections that reaches the yield
rotation (in orange) for a seismic action in the y direction in
the frame 1, in building B
Figure 21 - Shear behaviour of the wall NC 2, resistances by
EC2-1-1
0
1
2
3
4
5
6
0 1000 2000 3000 4000
Floor
V(kN)
SHEAR NC2
VRd,s x
VEd x
VRd,max x
VRd,s y
VEd y
VRd,max y
13
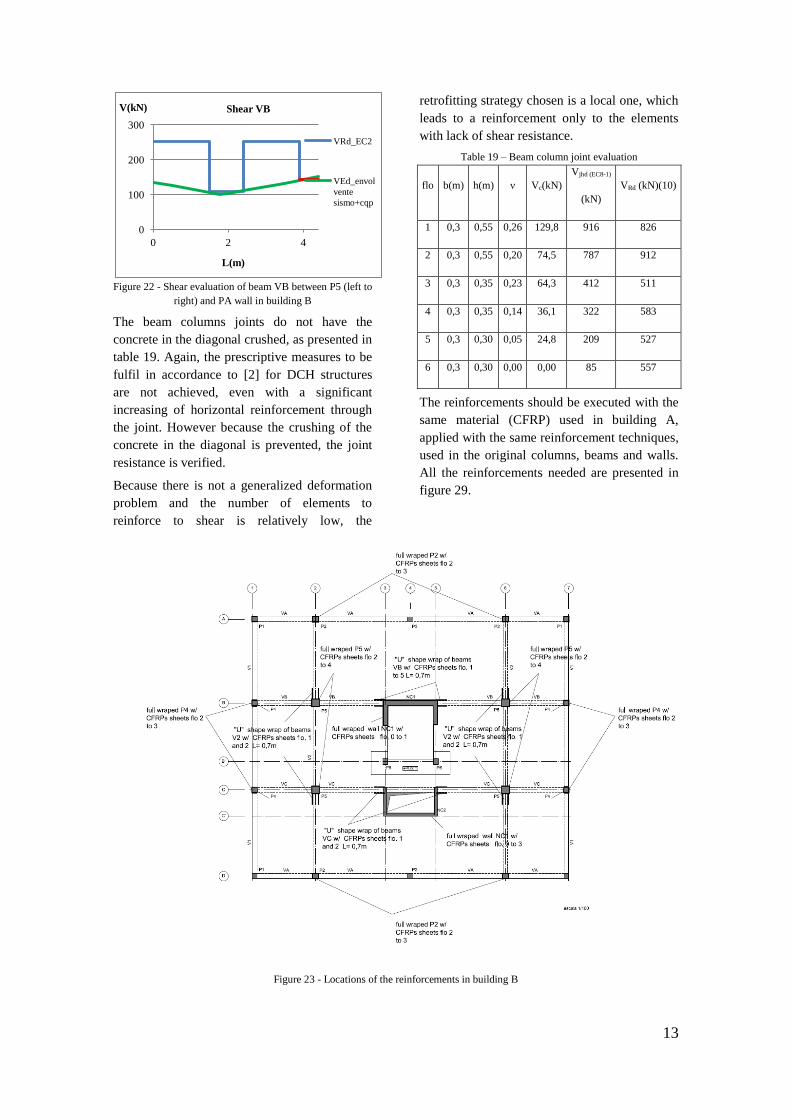
Figure 22 - Shear evaluation of beam VB between P5 (left to
right) and PA wall in building B
The beam columns joints do not have the
concrete in the diagonal crushed, as presented in
table 19. Again, the prescriptive measures to be
fulfil in accordance to [2] for DCH structures
are not achieved, even with a significant
increasing of horizontal reinforcement through
the joint. However because the crushing of the
concrete in the diagonal is prevented, the joint
resistance is verified.
Because there is not a generalized deformation
problem and the number of elements to
reinforce to shear is relatively low, the
retrofitting strategy chosen is a local one, which
leads to a reinforcement only to the elements
with lack of shear resistance.
Table 19 – Beam column joint evaluation
flo b(m) h(m) ν Vc(kN)
Vjhd (EC8-1)
(kN)
VRd (kN)(10)
1 0,3 0,55 0,26 129,8 916 826
2 0,3 0,55 0,20 74,5 787 912
3 0,3 0,35 0,23 64,3 412 511
4 0,3 0,35 0,14 36,1 322 583
5 0,3 0,30 0,05 24,8 209 527
6 0,3 0,30 0,00 0,00 85 557
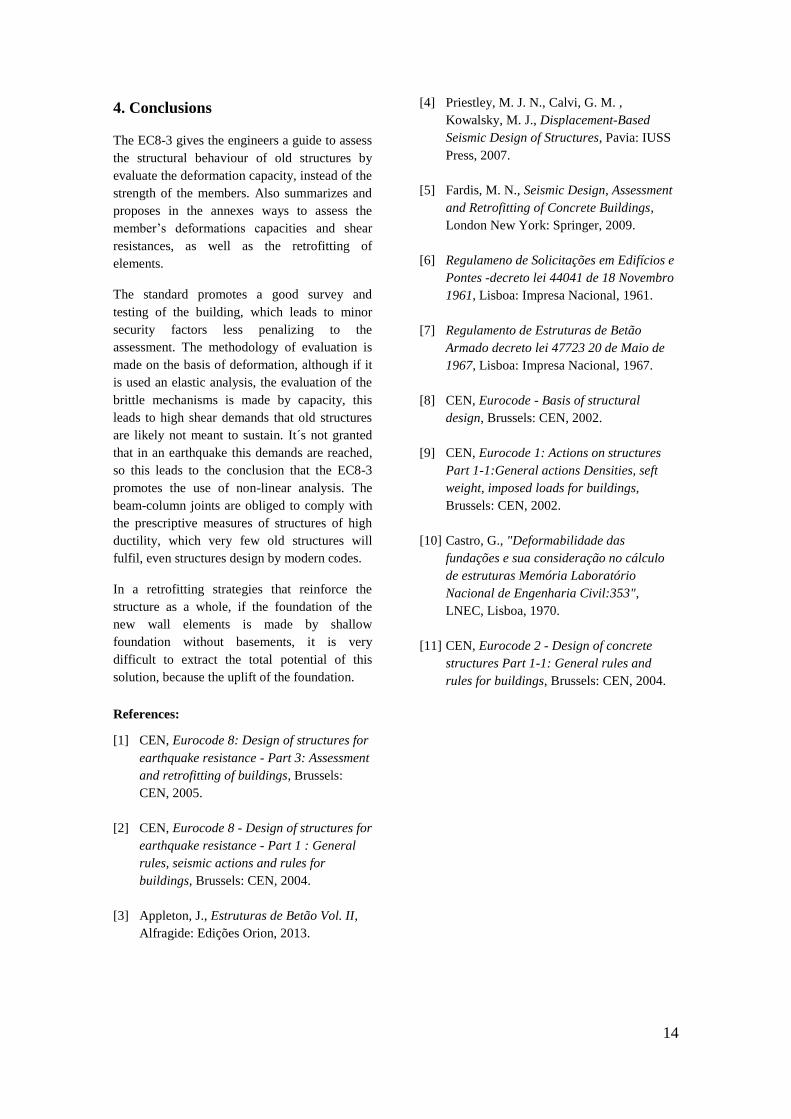
The reinforcements should be executed with the
same material (CFRP) used in building A,
applied with the same reinforcement techniques,
used in the original columns, beams and walls.
All the reinforcements needed are presented in
figure 29.
Figure 23 - Locations of the reinforcements in building B
0
100
200
300
0 2 4
V(kN)
L(m)
Shear VB
VRd_EC2
VEd_envol
vente
sismo+cqp
14
4. Conclusions
The EC8-3 gives the engineers a guide to assess
the structural behaviour of old structures by
evaluate the deformation capacity, instead of the
strength of the members. Also summarizes and
proposes in the annexes ways to assess the
member’s deformations capacities and shear
resistances, as well as the retrofitting of
elements.
The standard promotes a good survey and
testing of the building, which leads to minor
security factors less penalizing to the
assessment. The methodology of evaluation is
made on the basis of deformation, although if it
is used an elastic analysis, the evaluation of the
brittle mechanisms is made by capacity, this
leads to high shear demands that old structures
are likely not meant to sustain. It´s not granted
that in an earthquake this demands are reached,
so this leads to the conclusion that the EC8-3
promotes the use of non-linear analysis. The
beam-column joints are obliged to comply with
the prescriptive measures of structures of high
ductility, which very few old structures will
fulfil, even structures design by modern codes.
In a retrofitting strategies that reinforce the
structure as a whole, if the foundation of the
new wall elements is made by shallow
foundation without basements, it is very
difficult to extract the total potential of this
solution, because the uplift of the foundation.
References:
[1] CEN, Eurocode 8: Design of structures for
earthquake resistance - Part 3: Assessment
and retrofitting of buildings, Brussels:
CEN, 2005.
[2] CEN, Eurocode 8 - Design of structures for
earthquake resistance - Part 1 : General
rules, seismic actions and rules for
buildings, Brussels: CEN, 2004.
[3] Appleton, J., Estruturas de Betão Vol. II,
Alfragide: Edições Orion, 2013.
[4] Priestley, M. J. N., Calvi, G. M. ,
Kowalsky, M. J., Displacement-Based
Seismic Design of Structures, Pavia: IUSS
Press, 2007.
[5] Fardis, M. N., Seismic Design, Assessment
and Retrofitting of Concrete Buildings,
London New York: Springer, 2009.
[6] Regulameno de Solicitações em Edifícios e
Pontes -decreto lei 44041 de 18 Novembro
1961, Lisboa: Impresa Nacional, 1961.
[7] Regulamento de Estruturas de Betão
Armado decreto lei 47723 20 de Maio de
1967, Lisboa: Impresa Nacional, 1967.
[8] CEN, Eurocode - Basis of structural
design, Brussels: CEN, 2002.
[9] CEN, Eurocode 1: Actions on structures
Part 1-1:General actions Densities, seft
weight, imposed loads for buildings,
Brussels: CEN, 2002.
[10] Castro, G., "Deformabilidade das
fundações e sua consideração no cálculo
de estruturas Memória Laboratório
Nacional de Engenharia Civil:353",
LNEC, Lisboa, 1970.
[11] CEN, Eurocode 2 - Design of concrete
structures Part 1-1: General rules and
rules for buildings, Brussels: CEN, 2004.