Embed Size (px)
Citation preview

Structural Natural Fibres
Structure and tensile theory of paper—6 Lectures
Last revision: November 1, 2006
Lecturer: Dr. W.W. Sampson ’phone: 0161-306-3898Office: PSB/D3 email: [email protected]
1 Introduction
Over the course of these lectures we will consider the structure of paper as a stochastic fibrousmaterial and the way that the constituent fibres interact to determine the load-elongationbehaviour of the sheet and its ultimate failure load. Unlike many materials, paper is verymuch defined by its manufacturing process, as evidenced by the definition of paper given in1978 by the British Paper and Board Industry Federation,
“Paper is a sheet or continuous web of material formed by the deposition of veg-etable, mineral, animal or synthetic fibres or their mixtures with or without theaddition of other substances, from suspension in a liquid, vapour or gas, in sucha way that the fibres are intermeshed and bonded together.”
Quite properly, this definition is all-encompassing, but typically we would be expect paperto be formed from an aqueous suspension of wood-pulp fibres, often with a significant frac-tion of powdered minerals, known as fillers, such as CaCO3 or clay, and for some specialitygrades perhaps some fraction of synthetic fibres also. The important thing to take from thedefinition above however, is that the deposition of fibres from a suspension, i.e. the methodof manufacture, defines the material.
We will not consider the methods by which fibres are extracted from plants, by notethat fibres from different species have different morphologies and papermakers select these asappropriate for the grades they are manufacturing. Note also that in the UK, around 70 % ofthe fibrous raw materials used to manufacture paper an board products are from recoveredwaste paper and the remainder is mainly virgin fibre from managed forests; a small fractionof non-wood fibres, such as cotton, hemp, straw, etc., are also used for specialist grades.Before reaching the papermachine, fibres are typically subjected to mechanical work, knownas refining to impart flexibility and to generate particulate fibre fragments so as to increase
1

Structural Natural Fibres 2
the density of the sheet and hence its strength. We will consider the influence of density onstrength when we discuss the tensile theory of paper later in this course.
Figure 1 gives a schematic of the most straightforward design of papermachine, witha Fourdrinier forming section. Many other designs of papermachine are in use, but theprinciples of the forming process remain unaltered and the difference between machines areessentially differences in engineering and not in the physics of forming. Typically, a Four-drinier former is around 5 m wide, though modern machines are rarely built with a widthless than about 9 m. The process is one of water removal and in its simplest terms the stagesare as follows:
• A suspension of fibres, and other additives, with a solids content of typically less than1 % is delivered from the headbox in the form of a jet of height typically less than 1 cm.
• The forming section consists of a continuous high-specification woven textile, known asthe wire, which moves over a series of supporting elements which provide also the forcesfor removal of water from the suspension. Initially, water removal is by gravity and then,as the resistance to dewatering increases with increasing thickness of the evolving sheet,increasingly high vacuum is applied until the end of the forming section. Importantly,the structure is effectively set during the forming process and the subsequent stagesof manufacture can be considered to have a secondary influence only. On leaving theforming section, the sheet has a solids content of around 20 % and little more watercan be efficiently removed by application of vacuum.
• On leaving the forming section, the sheet passes to the press section. At this stage,there are no bonds between the fibres and the web is supported during transfer betweensections by a high specification textile called a felt which has a nonwoven surface.Pressing takes place between the nips of rolls and the web is in contact with feltsone or both sides during the process. On leaving the press section, the web has beensignificantly densified and fibres are in intimate contact with each other where theyinterest. On leaving the press section, the sheet has a solids content of around 40 %and little more water can be removed by application of pressure.
• The final stage of water removal from the web is carried out using heated cylinders.The sheet is held against the cylinder using a textile known as a dryer fabric, and thisis typically woven. The cylinders are heated by steam which condenses on the insideof the cylinder releasing latent heat which is transferred to the wet web, evaporatingthe water from the sheet. The web is under tension in the direction of manufactureduring drying, but shrinks to some extent in the perpendicular direction. Hydrogenbonds between fibres are formed during the drying process and the sheet is reeled upwith a moisture content of 2 or 3 %.
1.1 Other stochastic fibrous materials
We will concentrate on the properties of paper as the most common stochastic fibrous mater-ial used in society and industry, but there are a larger family of materials that exhibit similar

Structural Natural Fibres 3
Forming section Press section Dryer section Reel-up
Headbox (<1% solids)
Gravity dewatering Vacuum dewatering
Increasing vacuum
To press section(~ 20 % solids)
Figure 1: Schematic of a paper machine with a Fourdrinier forming section
structural characteristics and hence materials properties. Micrographs of five stochastic fi-brous materials, including paper, are shown in Figure 2. The carbon fibre network on thetop left of Figure 2 is used in fuel cell applications and provides the backbone of the electro-magnetic shielding used in stealth aerospace technologies; the glass fibre network on the topright is of the type used in laboratory filter applications; the network on the bottom rightis a nonwoven geotextile used in civil engineering in, for example, reinforcement of bankedmotorway verges, etc.; in the centre of the bottom row is a thin laboratory-formed papersheet; on the left of the bottom row is an electrospun polymer network. This final exampleis the focus of considerable research activity globally, and in the School of Materials, sincesuch materials have considerable potential for application as scaffolds for cell culture in tissueengineering.
Although the micrographs in Figure 2 are manifestly different from each other, it is equallyevident that they exhibit strikingly similar structural characteristics. We will not dwell uponthese in great detail here, but should bear in mind when considering theoretical analyses offibrous materials that the theory is derived for the general class of materials and hence shouldbe applicable to them all.

Structural Natural Fibres 4
250 µm
Figure 2: Micrographs of five stochastic fibrous materials. Clockwise from top left: Nonwoven carbon fibremat, glass fibre filter, nonwoven geotextile, thin paper sheet, electrospun polymer network.
2 Sheet structure
2.1 Orders of magnitude
Initially, we shall consider paper as a stochastic network of fibres only. The contribution ofparticulate fibre fragments and fillers to the structure will be considered later in the course. Ifwe make some simplifying assumptions about the geometry of our fibres, then it is relativelysimple to make an estimate of the number of fibres per unit time during forming, or per unitarea in the sheet, that are involved in our stochastic system.
Let us consider a 9 m wide twin-wire papermachine running at 1600 m min−1 making45 g m−2 newsprint. The production from this machine is,
Production = (9 m)× (1600 m min−1)× (45 g m−2)= 10.8 kg s−1
≈ 930 T day−1
Now, the fibre coarseness is the mass per unit length of a fibre; we denote it, δ (kg m−1)

Structural Natural Fibres 5
and note that the equivalent measure in textiles technology is denier. Many commercial fibreanalysers report coarseness as a standard output and we expect wood pulp fibres to havecoarseness in the range 1.5× 10⁻⁷ kg m−1 ≤ δ ≤ 3.5× 10⁻⁷ kg m−1.
The length of fibres varies significantly between species. We denote the fibre length, λ (m)and expect that in a typical paper making system, the average length of fibres is around 1or 2 mm. Given the coarseness and the length of a fibre we may readily compute its massas their product. So, for our newsprint example, let us assume that we have fibres all oflength λ = 1.5 mm and of coarseness δ = 2 × 10⁻⁷ kg m−1. The expected mass of one fibreis therefore,
mfib = λ δ (1)= (1.5 mm)× (2× 10⁻⁷ kg m−1)= 3× 10⁻¹⁰ kg
This generates a useful figure to bear in mind for future approximate calculations: the massof one fibre is around 0.3 µg.
Knowing the mass of one fibre and the production from our machine, we may estimatethe number of fibres being delivered from the slice of our headbox each second. It is givenby,
Rate of delivery =Production
mfib
= 3.6× 10¹⁰ fibres s−1
This is a big number – estimates of the number of stars in the Milky Way have an upper limitof about 1011 – and has been arrived at through estimation of parameters. Nevertheless, wemay be confident from the treatment give above that we deliver in excess of ten thousandmillion fibres each second.
The time taken to set the sheet structure, i.e. the time taken to form a structure wherethe motion of fibres relative to each other is negligible, is of order 100 ms for a modern twin-wire former. So in our example, each 100 ms we organise 3.6 × 10⁹ fibres into a structureof area 24 m2. We can use this figure to estimate the number of fibres per unit area in oursheet though if we did so, then we would arrive at the result by a rather circuitous route.Instead we shall introduce an expression that we will return to. Denote the mean grammageof a sheet, β (g m−2); the expected number of fibres in a square area of side x (m) is
nfib =β x2
λ δ. (2)
so using our example above, the number of fibres in a square centimetre is,
nfib =(45 g m−2)× 1 cm2
3× 10⁻¹⁰ kg= 15000

Structural Natural Fibres 6
Ratio of under-crossings to over-crossings
Freq
uen
cy
Freq
uen
cy
Ratio of under-crossings to over-crossings
Felted Structure Layered Structure
Figure 3: Comparison of felted and layered structures as models of paper.
2.2 z-directional structure
A typical sheet of newsprint may be 60 µm thick and the mean fibre length in such a sheetis of order 1 mm. We can expect therefore that fibres are lying essentially in the plane ofthe sheet. What is not clear from this observation is whether a fibre with part of its lengthat say, the bottom of the sheet, can penetrate the sheet thickness and have part of its lengthon top of the sheet or not, i.e. whether the structure is felted or layered.
This subject was studied by Radvan, Dodson and Skold [1] who incorporated a few percentof black dyed fibres in the furnish of several paper grades. By transparentising the non-dyedfibres with a resin of refractive index close to that of cellulose they were able to examineonly the dyed fibres in the network. Selecting one fibre at a time, they counted the numberof other dyed fibres which crossed above and below the chosen fibre. The concept is bestunderstood by reference to Figure 3.
If the structure was felted, as on the left of Figure 3, then it would be expected that theratio of under-crossings to over-crossings would have a narrow distribution; fibres towards thetop, middle and bottom of the sheet having a similar number of under- and over-crossingsdue to the ‘tangled’ nature of the network. For a layered structure on the other hand, asillustrated on the right of Figure 3, the expectation is that fibres towards the top of the sheetwill have more under-crossings than over-crossings, the opposite will be observed for fibrestowards the bottom of the sheet, and towards the middle of the sheet the ratio should beclose to 1, i.e. a layered structure will have a broad distribution of the ratio of over-crossingsto under-crossings.
For all the samples studied by Radvan, Dodson and Skold, the distribution was sufficientlywide to confirm that paper has an essentially layered structure. The result is consistent withsheet forming being predominantly a filtration process.

Structural Natural Fibres 7
Fibre orientation
By virtue of its being a continuous process to form a web, commercial papermaking results insignificant anisotropy in the mechanical properties of the sheet. Much of this anisotropy arisesfrom the fact that during drying the web is under tension in the direction of manufacture,referred to as the machine direction (MD) and is able to shrink in the perpendicular direction,known as the cross-machine direction (CD). An additional contribution to the mechanicalanisotropy is structural anisotropy which takes the form of a preferential orientation of fibresin the machine direction. This arises because fibres, being objects of significant aspect ratio,will tend to align themselves in the direction of the flow of the jet leaving the headbox.The concentration of fibres in the jet is sufficiently high that isolated fibres are rare andinstead fibres exist as a network in suspension. Accordingly, the potential for fibres to orientthemselves with the direction of manufacture is diminished by the mutual restraint fibresplace upon each other through their points of contact.
Several functions have been used to describe the fibre orientation distribution in paper andnonwoven textiles. The simplest of these is adequate to describe most commercial samplesand is called the 1-parameter Cosine distribution. It is given by
f(θ) =1π− ε cos(2 θ) (3)
where θ is the angle of the fibre axis to the machine direction and 0 ≤ ε ≤ 1/π is a freeparameter called the eccentricity which characterises the extent of orientation. Equation (3) isplotted in Figure 4 for the applicable range of ε; for most machine made papers 0.1 ≤ ε ≤ 0.2.
Equation (3) is an example of what is known in statistics as a probability density functionand can be used to calculate the fraction of fibres that are oriented within a given range ofangles. This is important, Equation (3) does not tell us the probability that a fibre hasorientation θ, since the probability of orientation at any given angle is infinitesimal. Theprobability that an fibre lies with a range of orientations, θ ±∆θ is
P (θ ±∆θ) =∫ θ+∆θ
θ−∆θf(θ) .dθ (4)
=[θ
π− ε
2sin(2 θ)
]θ+∆θ
θ−∆θ
=[θ + ∆θ
π− ε
2sin (2 (θ + ∆θ))
]−[θ −∆θ
π− ε
2sin (2 (θ −∆θ))
]Recalling the trigonometric identity, sin(A + B) = sin(A) cos(B) + cos(A) sin(B) and sim-plifying yields,
P (θ ±∆θ) = 2∆θ
π− ε cos(2 θ) sin(2 ∆θ) , (5)
Note that when ε = 0, the distribution of fibre orientations is uniform and we have,
P (θ ±∆θ) = 2∆θ
π,

Structural Natural Fibres 8
ε = 0 ε = 0.1 ε = 0.2 ε = 0.3
MD
Figure 4: Theoretical fibre orientation distributions, according to the 1-parameter cosine distribution asgiven by Equations (3).
which is sensible.Consider now a network with eccentricity ε = 0.2. The fraction of fibres lying within
±10◦ of the machine direction is given by Equation (5) with ∆θ = 10◦ = π18 and θ = 90◦ = π
2 .So we have
P (MD± 10◦) =2π
π
18− 0.2 cos(π) sin(π/9)
=19− 0.2 (−1) (sin(π/9))
= 0.180 (3 sig. figs.) (6).
It is interesting also to consider the fraction of fibres lying within ±45◦ of the principaldirections. Here we have ∆θ = π
4 and
P (θ ± π
4) =
12− ε cos(2 θ)
So we have
P (MD± π
4) =
12
+ ε
P (CD± π
4) =
12− ε
making interpretation of the eccentricity parameter ε somewhat more intuitive.

Structural Natural Fibres 9
3 Measuring tensile strength
Here we consider two generic procedures for measuring the tensile strength of paper undercontrolled conditions. The first, the long span tensile test, is designed to measure the failureload and extension of a strip sampled from the sheet when strained between jaws with anappreciable and finite separation. The second, the zero-span tensile test, measures the failureload of a strip sampled from the sheet when strained between jaws with a reproducibly smallseparation. When we consider the tensile theory of Page [3] we shall see that combination ofthe results of these tests allows separation of the tensile strength of the sheet, as measuredby the long-span test, into the contributions of the fibre strength and bond strength. Forrefer to the following Tappi Test Methods:
• T494 om-88. Tensile breaking properties of paper and paperboard (using constant rateof elongation apparatus).
• T231 cm-96. Zero-span breaking strength of pulp (dry zero-span tensile).
As with all paper testing, samples should be conditioned for 24 hours in an atmosphere oftemperature 25◦ ± 1◦C and of relative humidity 50 % ± 2 %.
Chapter 2 of Niskanen’s book [2] gives a good account of the properties of fibres and ofthe bonds between them; Chapter 5 describes tensile properties.
3.1 Long-span tensile
The principle of the long-span tensile test is the application of a strain to a strip of paperresulting in the development of a load in the strip until the strip fails. This is achieved byclamping the strip to be tested between the jaws of a Universal Testing Machine; the jawsof one of our testers are shown in Figure 5. For the testing of machine-made papers theseparation between the jaws is 18 cm; for laboratory formed samples the separation is 10 cm.On most modern instruments the jaws operate pneumatically thereby giving a reproducibleclamping force and minimising this source of error. Throughout the test, the instrument iscontrolled by a computer which records the separation of the jaws as the sample is extendedand the load developed in the sample via a load-cell connected to one of the jaws. Thestandard rate of loading is 25 ± 5 mmmin−1 and the sample is extended at this rate untilfailure occurs.
The use of a standard rate of loading is important since the load-elongation response of asample is highly dependent on this rate. This is illustrated by the early work of Rance whoin 1944 reported on a simple experiment where four different loads were applied to nominallyidentical strips of paper and the time taken for the strips to fail was recorded. The resultsare summarised in Table 1.
Now, the data in Table 1 tell us that the failure load of the samples was anything be-tween 4 and 10 N depending on the rate of loading; Rance noted however that each samplefailed at about the same extension. This provides additional information on the nature ofpaper as a material. For elastic materials, the deformation of a sample under load is almost

Structural Natural Fibres 10
Figure 5: Jaws of Universal Testing Machine. Left: Front view; Right side view. The jaws clamp the paperstrip and are operated pneumatically to give a reproducible clamping force.
Load Time to failure(N)100 4 seconds90 11 minutes80 14 hours40 220 days
Table 1: Time taken for strips of paper to fail under different loads

Structural Natural Fibres 11
0 0.5 1.0 1.5 2.0 2.5 3.0 3.5 4.0
20
40
60
80
Elongation, ∆l (mm)
CD
MDLoa
d,F
(N)
Figure 6: Typical Load-elongation curves for machine made papers.
instantaneous and proportional to the load applied. Rance’s experiment tells us that thestrain developed in paper is not proportional to the applied load and exhibits some timedependence.
The non-linear elastic behaviour of paper under load is illustrated in Figure 6 whichshows a schematic of typical load-elongation curves. The curve labelled ‘MD’ represents theresponse expected for ‘machine-direction’ strips, i.e. those cut with their major axis in thedirection of paper manufacture; similarly, the curve labelled ‘CD’ represents the responseexpected for ‘cross-direction’ strips, i.e. those cut with their major axis perpendicular to thedirection of paper manufacture.
The highest point on each curve in Figure 6 can be read from the ordinate and representsthe failure load of the sample, Ff ail; the point furthest to the right can be read from theabscissa and represents the extension at failure, ∆lf ail. Since our test is carried out at aconstant rate of elongation, the abscissa could also represent a scaled time and the curve canbe considered to represent the rate of evolution of load in the sample. The initial region ofeach curve is approximately linear and represents what is essentially elastic deformation ofthe sample at small strains.
For most materials, we report tensile strength and elastic moduli in terms of the stress,defined as load per unit sample cross-sectional area. The thickness of paper is difficultto define since it is non-uniform and paper is a compressible material. Also, the effect ofcompressing a paper sample in the absence of water will be to decrease its thickness withoutaffecting its load-elongation response. Such a decrease in thickness would decrease also thecross-sectional area of the sample and hence increase the calculated stress. Clearly suchan increase is not a real effect and it turns out that rather than weighting forces by thecross-sectional area it it more appropriate to weight them by sample width and grammage.Accordingly, the quantities typically reported from tensile testing are:

Structural Natural Fibres 12
• Tensile Strength.Failure load, Ff ail (N) divided by sample width, w (m).Units: N m−1.
T =Ff ail
w
• Failure Strain.Elongation at break, ∆lf ail divided by initial sample length, l.Units: dimensionless.
εfail =∆lf ail
l
• Tensile Index1.Tensile strength, T (N m−1) divided by grammage, β (g m−2).Units: N m g−1 is widely used; the correct SI unit kN m kg−1 is numerically equal.
T =Tβ
• Specific Elastic Modulus.The gradient of the initial ‘linear’ region of the load-elongation curve, ∆F
∆l (N m−1) mul-tiplied by initial sample length, l (m) and divided by the product of grammage, β (g m−2)and sample width, w (m).Units: N m g−1 or kN m kg−1.
Esp =∆F
∆l
l
w β
• Tensile Energy Absorption.The work done in failing the sample, Wf ail is given by the area under the load-elongationcurve. Dividing this by the initial sample area gives the Tensile Energy Absorption,TEA.Units: J m−2 is preferred since it uses familiar units of work. N m−1 is also correct andnumerically equivalent.
TEA =Wf ail
l w
When a strip of paper is subjected to a load, as well as being strained in the direction ofloading, there is some narrowing of the dimension perpendicular to the direction of loading.These deformations are characterised by the Poisson’s ratio. Whilst it is unlikely to bequoted in the product specification for a paper grade, the Poisson’s ratio is defined here forcompleteness and is used in the derivation of the models presented in the following units.
1The archaic term for grammage corrected tensile strength is ‘Breaking Length’ and has units of km; itis the length of paper that will break under its own weight and is given by the Tensile Index divided by theacceleration due to gravity.

Structural Natural Fibres 13
• Poisson’s RatioThe Poisson’s ratio, ν is defined by the ratio of the lateral strain to the longditudinalstrain such that
ν =(
∆w
w
)÷(
∆l
l
)=
l
w
∆w
∆l
where ∆w is the change in sample width. For isotropic laboratory handsheets, Poisson’sratio may be determined analytically and is equal to −1
3 .
3.1.1 Mechanical Anisotropy
The differences in machine and cross-machine tensile behaviour illustrated in Figure 6 areattributable to two mechanisms, as discussed in Section 2.2:
• Preferential orientation of fibres in the machine direction as a consequence of the hy-drodynamics of the forming section,
• cross directional shrinkage of the web coupled with drying under tension in the dryersection of the papermachine.
Tensile strength increases with the proportion of fibres lying in the direction of straining andwith drying under tension. Also, intuition leads us to expect that a sample with exhibit agreater elongation under strain if it has previously shrunk in the direction of straining andthis is the case. Note also that strips cut at angles between the machine and cross-directions,will exhibit intermediate behaviours. Machine made papers are therefore said to exhibitanisotropic tensile behaviours; since the fibre orientation distribution in laboratory formedsheets is essentially uniform, and the sheets are dried under uniform restraint, their in-planetensile behaviour is isotropic.
The extent of anisotropy in the sheet depends on the forming and drying conditions, andpapermakers seek to vary it depending on the grade they are producing. With this in mind,and denoting the machine and cross directions with the subscripts MD and CD respectively,we may state the following rules of thumb:
Tf ail,MD ≈ 2 Tf ail,CD
Esp,MD ≈ 2 Esp,CD
εf ail,MD ≈ 12
εf ail,CD
Note also that in the elastic region, unlike most elastic materials, paper exhibits differentmoduli when under compression than when in extension. The Poisson’s ratio, ν for machine-made papers takes values between 0.1 and 0.5 depending on the degree of anisotropy.

Structural Natural Fibres 14
3.2 Short-span tensile
The short-span, or zero-span test differs from the long-span only in the separation of the jawswhich is nominally zero but is typically a few microns. Such a short distance between thejaws is intended to fulfil the experimental design objective that any fibre gripped by one pairof jaws is gripped also by the other pair. As such, the zero-span test is considered to give ameasure of the fibre strength only and the contribution of bonding to the failure behaviourmay be considered negligible. Typically, only the load at failure of the sample is recordedand, whilst the test may be carried out using a universal testing machine, the use of dedicatedequipment such as the ‘Pulmac zero-span tester’ is widespread.
Results from zero-span testing are usually reported as the Zero-span Tensile Strength andZero-span Tensile Index and these are calculated in the same way as for the long-span test.
3.3 Effect of papermaking variables
The tensile properties of paper and board products are widely quoted in product specifica-tions. They are influenced by fibre type and by processes such as refining and wet-pressingthat affect sheet density and by the amount of restraint in the dryer section of the paper-machine; secondary influences are the uniformity of the sheet and finishing processes such ascalendering.
For full details of the influence of papermaking processes on the tensile behaviour of paper,see Chapter 5 of Niskanen [2]. The main effects are summarised below.
Refining. This is mechnaical work arried out by passing a fibre suspension through a narrowgap between rotating barred plates. The effects on fibres may be summarised by the4 F’s:
• Fibre length is reduced by a tensile mode snapping of the fibres as they passbetween bars.
• Fines are generated as fragments becoming separated from the ends and surfacesof fibres.
• Fibrillation results externally as the composite cell wall structure is opened andinternally as a result of cell wall delamination.
• Flexibility is increased, primarily as a result of internal fibrillation.
The primary influence of refining is to increase sheet density and inter-fibre bondingthrough the combined contribution of the factors given above. The consequences ofrefining for tensile behaviour are summarised below
• Tensile Strength and Tensile Index increase with increasing density until theeffects of fibre shortening are such that there is a plateau and a small decrease.
• Failure Strain increases.
• Specific Elastic Modulus increases approximately linearly with increasing den-sity.

Structural Natural Fibres 15
• Tensile Energy Absorption is dependent on the shape of the load elongationcurve and increases with increasing density.
Typically the greatest changes in tensile behaviours are observed during the early stagesof refining.
Pressing. The consolidation of the web during wet-pressing increases the contact area be-tween fibres and hence increases density and bonding. The consequences of wet-pressingfor tensile behaviour are broadly the same as for refining.
Drying stresses. The tensile behaviour of fibres, and hence that of the sheet, is affected bythe amount of restraint imposed on the web during drying. The effects are summarisedbelow.
• Tensile Strength and Tensile Index are greater for sheets dried under restraintthan for sheets allowed to shrink freely during drying.
• Failure Strain is less for sheets dried under restraint than for sheets allowed toshrink freely.
• Specific Elastic Modulus is greater for sheets dried under restraint than forsheets allowed to shrink freely.
In the dryer section of the paper machine, the sheet is under tension, and thereforesubject to restrained drying, in the machine-direction and shrinks in the cross-direction.The extent of this shrinkage is dependent on several machine and furnish parametersand exhibits a profile across the machine width such that it is significantly higher at theedges than towards the middle. This restraint and shrinkage in the dryer section hasa major contribution to the relative magnitudes of machine- and cross-direction tensileproperties.

Structural Natural Fibres 16
4 The Page Equation
Here we consider the tensile theory derived by Page [3]. This is an attempt to describe thetensile failure of paper in terms of fibre and bonding properties. To aid understanding thetheory, it may be helpful to cut a strip of bathroom tissue and a strip of standard office gradepaper of width about 1 cm. Pull each strip between your hands until it snaps and examinethe region of failure. You should be able to see individual fibres that have been pulled outof the sheet and these should be more abundant in the tissue sample which has less bondingthan a typical office grade.
4.1 The Theory
Previous theories of tensile strength had assumed that failure was always initiated by bondfailure because the tensile strength of fibres (≈ 12 g) is greater than the shear strengthof bonds in regions of inter-fibre contact (≈ 1 g). However, studies of the rupture zoneafter a tensile failure shows that fibres are broken as well as being pulled out. Also, strongcorrelations have been found between fibre strength and sheet strength for papers formedfrom a range of wood species. Microscopical studies suggest that, in well bonded sheets,fibres contact about 20-40 other fibres per mm of their length. So we have the expectationthat both bonds and fibres are implicated in the ultimate failure strength of paper.
4.1.1 First Premise
During straining, bonds fail. The load is then borne by progressively fewer fibres until fibreslying in the direction of the strain reach their rupture strain resulting in catastrophic failureof the sheet.
Assumption: The structure of the sheet is sufficiently uniform that the number of fibrescrossing the rupture zone is the same as for any other line.
Denoting the Tensile Index assuming that no bonds are broken as, Zc (kN m kg−1), the tensileindex of the network may be expressed in terms of this and the fraction of fibres broken alongthe rupture zone. We have therefore,
T =nf
nf + npZc , (7)
where nf = number of fibres crossing rupture zone that fail, np = number of fibres crossingrupture zone that pull out.
For a random fibre network the relationship between zero-span Tensile Index, Z and Zc
is given by:
Zc = (1− ν2) Z , (8)

Structural Natural Fibres 17
0 20 40 60 80 100 1200
0.2
0.4
0.6
0.8
1.0
Tensile Index (kN m kg−1)
nf/(n
f+
np)
Figure 7: Plot of fraction of broken fibres against tensile index from data of van den Akker et al.
where ν is the Poisson’s ratio and has value −13 for paper. Thus,
T =89
nf
nf + npZ (9)
so we expect
T ∝ nf
nf + np(10)
and
nf = 0, T = 0
and whennf
nf + np= 1, T =
89
Z.
Van den Akker et al. [4] incorporated a few percent of dyed fibres in paper and counted nf
and np at the failure zone for sheets with different degrees of bonding. Page plotted this dataagainst breaking length and found a linear relationship, as predicted by Equation (9); thesedata are replotted in Figure 7. Note also that when nf
nf+np= 1, Z ≈ 115 kN m kg−1 which is
reasonable.
4.1.2 Second Premise
Here, the number of fibres failing at rupture are related to the number of fibres pulled out.
Assumption:np
nfis a function of the mean fibre strength and the mean force to pull out a
fibre, i.e.

Structural Natural Fibres 18
np
nf= F (Φ,Ψ) (11)
where Φ is the mean fibre strength (N) and Ψ is the mean force to pull out a fibre (N).
Now, np
nfis dimensionless so we expect
F (Φ,Ψ) = f
(ΦΨ
)(12)
and we require
when Φ >> Ψ, f
(ΦΨ
)→∞
Φ << Ψ, f
(ΦΨ
)→ 0
Φ = Ψ, f
(ΦΨ
)→ 1.
the simplest function which satisfies these conditions is
f
(ΦΨ
)=
ΦΨ
. (13)
So from Equation (9) we have,
1T
=98
(1 +
np
nf
)1Z
(14)
=98
(1 +
ΦΨ
)1Z
(15)
Expressions for Φ and Ψ
The mean force to pull a fibre out of a network will be given by the product of the shearbond strength per unit area, b (N m−2) and the area of the fibre that must be de-bonded toallow the fibre to be pulled out. Assuming that bonding is uniformly distributed along thelength of a fibre, the maximum fibre length pulled out is half a fibre length; on average it isone quarter of a fibre length. The fraction of the fibre area in the whole sheet that is bondedis called the relative bonded area and denoted, RBA.
The mean force to pull out a fibre, Ψ is therefore given by,
Ψ = b Pλ
4RBA (16)
where P is the fibre perimeter (m) and λ is the mean fibre length (m).

Structural Natural Fibres 19
Page uses a relationship from the literature, given by van den Akker et al. [4] to relatefibre strength to zero-span and this is given as,
Φ =83A ρZ , (17)
where A is the fibre cross-sectional area (m2) and ρ is the fibre density (kg m−3).
Final expressions
Substitution of Equations (16) and (17) in (15) yields on simplification:
1T
=9
8 Z+
12 A ρ
b P λ RBA, (18)
and Equation (18) is the expression commonly referred to as the Page Equation. We observethat for fibres of uniform cross-section, A ρ λ is the mass of one fibre so A ρ is mass per unitlength of a fibre. This property is known as the fibre coarseness, δ so we have,
1T
=9
8 Z+
12 δ
b P λ RBA. (19)
Also, for cylinders the diameter is given by four times the ratio of the cross-sectional area tothe perimeter, i.e.
dcyl = 4A
P
and this shape factor is widely used to give an equivalent diameter, deq for objects of irregularcross-section2. So we have:
1T
=9
8 Z+
3 deq ρ
b λ RBA. (20)
A widely used version of the model is the ‘Simplified Page Equation’:
1T
=1Z
+1B
. (21)
Here B has units kN m kg−1and is the contribution of bonding to the tensile strength of thenetwork. We observe that the model is therefore one of fibre and bond strengths contributingin series to the tensile strength of a network.
2In fluid mechanics the ratio of the cross-sectional area of a channel to its perimeter is known as thehydraulic radius.

Structural Natural Fibres 20
0 0.2 0.4 0.6 0.8 1.0 1.2 1.4 1.60
0.01
0.02
0.03
1/λ (mm−1)
1/T
(N−
1m−
1g)
0 0.1 0.2 0.3 0.4 0.5 0.60
0.01
0.02
0.03
0.04
1/λ (mm−1)1/
T(N
−1m−
1g)
Figure 8: Effect of mean fibre length on tensile index. Left: data of Arlov. Right: data of Watson andDadswell; key: Open boxes – unbeaten; solid boxes 18 mins PFI; open diamonds – 36 mins PFI; soliddiamonds – 72 mins PFI;
4.1.3 Verification
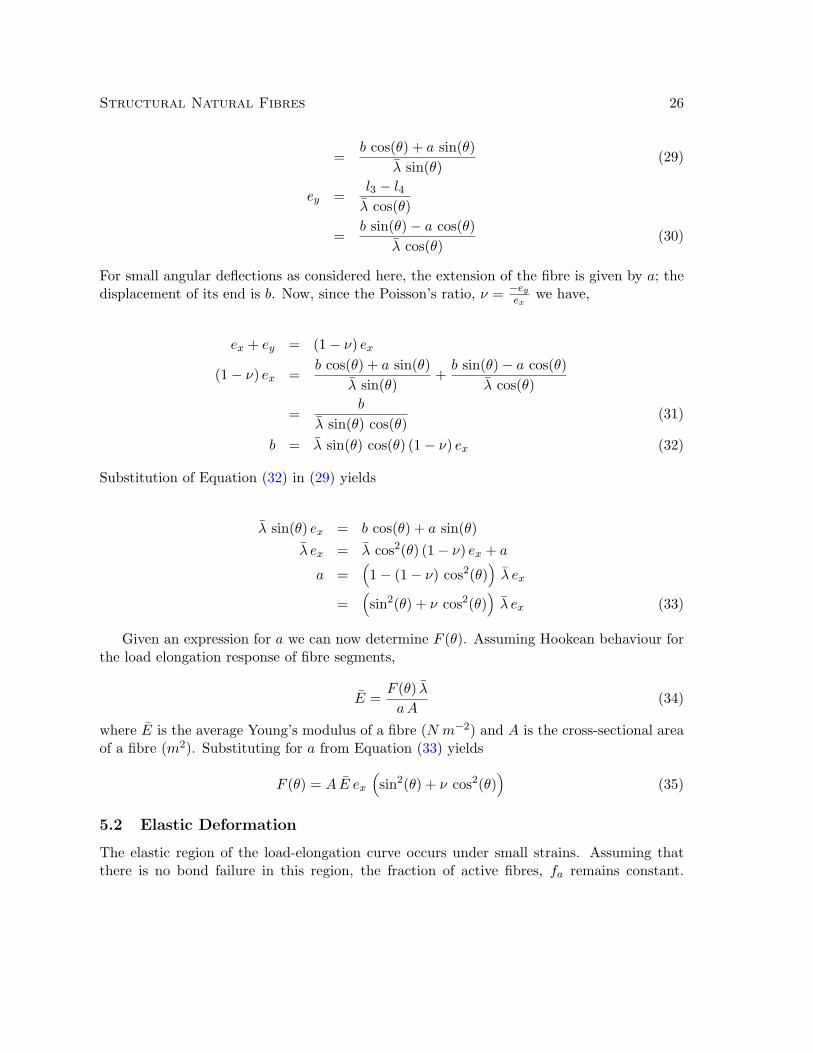
In order that the validity of Equations (18 - 20) could be tested, Page used experimentalresults from the literature that investigated the effect of changing one variable on the tensileproperties of paper; references to the articles containing the data are given in the originalpaper [3]. The use of established data that has already been subject to peer review to verifyany model is good practice since there is no question that the experiments have been designedto yield the predicted results.
• Fibre Length
Arlov beat pulp in a PFI mill, fractionated it and made sheets from the longest frac-tion. Wet sheets were cut into narrow strips, disintegrated and fractionated.Sheets were formed from each of the fractions. Thus, fibre length was variedwithout changing any other parameters. Equations (18 - 20) predict that a plotof 1
T against 1λ
will be linear with a positive slope and will have intercept at 1λ
= 0equal to 9
8Z . The data of Arlov are plotted in this way in Figure 8 and exhhibit agood linear relationship with r2 = 0.991; the intercept gives Z = 116 kN m kg−1.
Watson & Dadswell cut chips into different lengths before pulping and then beat3
pulped samples in a PFI mill. For a given beating time, each sample exhibiteda linear relationship with overall r2 = 0.941; data are shown in Figure 8. Im-portantly, the data exhbit, to a first approximation, a common intercept withZ = 121 kN m kg−1. The reduction in gradient with beating is consistent with anincrease in RBA.
3Beating is the batchwise equivalent process to refining and is often used in laboratory studies.

Structural Natural Fibres 21
0 2 4 6 8 100
0.01
0.02
0.03
0.04
0.05
1/RBA
1/T
(N−
1m−
1g)
Figure 9: Effect of RBA on tensile index from data of Ingmanson and Thode.
• RBA
Ingmanson & Thode estimated RBA by plotting tensile strength against light scat-tering coefficient4. Extrapolation to T = 0 gives the light scattering coefficient ofa totally unbonded sheet, S0.
RBA =S0 − S
S0(22)
Pulp was beaten in a pebble mill to retain fibre length. A plot of 1T against 1
RBA
is shown in Figure 9 and is linear with r2 = 0.951; the effect of wet pressing onthe relationship was negligible, suggesting that for the pulp studied there was nochange in the shear bond strength per unit area, b with beating. The intercept at
1RBA
= 0 gives Z = 120 kN m kg−1 in agreement with an independently measuredvalue.
• Fibre Strength
Page & Seth much later [5] altered fibre strength by exposing sheets to H Cl vapour.Plots of 1
T against 98 Z were linear with unit gradient. The intercept was affected
by fibre curl and beating, i.e. the second term on the right hand side of the PageEquation.
4The light scattering coefficient is the limiting fraction of light scattered backwards per unit grammage asgrammage tends to zero. It is calculated using the Kubelka-Munk theory from measurements of the diffusereflectance of paper sheets

Structural Natural Fibres 22
4.1.4 Summary
The Page Equation provides a useful and useable relationship between some basic fibre prop-erties and sheet strength. It is often applied in the simplified form and provides a usefulmeans of separating the influence of fibre strength and bonding on the breaking strength ofa sheet. No account is made however of anisotropy, the rate of loading or the shape of theload-elongation curve.

Structural Natural Fibres 23
5 Kallmes, Bernier and Perez Theory
The tensile theory presented by Kallmes, Bernier and Perez [6] is a development of thatpresented in a previous publication where tensile properties of the sheet had been calculatedfrom fibre and sheet properties. As with the tensile theory of Page [3] discussed in the lasttwo units, certain empirical constants were difficult to measure reliably. This work sought tosimplify the original theory and minimise the number of parameters requiring experimentalmeasurement. The objective was to deliver a theory which would allow identification of thecauses of changes in the tensile properties of a sheet. We shall not consider all aspects of thetheory but will examine about two-thirds of the work presented in the original series of fourarticles.
5.1 Theory
Assumptions: Strain is assumed to be uniform throughout the sample; this correspondsto an assumption that the in-plane distribution of mass, or formation is uniform. Load isconsidered to be the independent variable and is developed in response to a strain.
5.1.1 Load developed in the sheet
Prior to rupture, the loads in all fibres in the sheet must be in equilibrium with each other.Consider a line drawn perpendicular to the direction of straining, x. At any point duringstraining, the measured load is the sum of the loads developed in the direction of strainingalong this line. Let the load developed in a single fibre segment oriented at angle θ to theperpendicular be F (θ); the component of this load in the x-direction, i.e. in the direction ofstraining, is,
F (θ) sin(θ) .
If the number of fibres per unit width with given orientation θ to a given line perpendicularto the strain is N(θ) then the load per unit width developed in response to a strain in thex-direction, ex is given by,
T =∫
F (θ) sin(θ) N(θ) .dθ . (23)
5.1.2 Number of fibres and their orientation
We can calculate the probability that a fibre of length, λ and orientation θ intersects a lineof length w in a sample of area A. For the fibre to intersect a given line, its centre must liewithin ±λ
2 sin(θ) of that line, i.e. within an area w λ sin(θ). Hence, the probability of a fibreof average length λ intersecting the line is,
Pr(int) =w λ sin(θ)
A. (24)

Structural Natural Fibres 24
w
λ/2
λ
λ
θ
Figure 10: Illustration of probability that a fibre of length λ with orientation θ to a line of width w willintersect that line. To intersect the line, the fibre centre must be within an area w λ sin(θ). The fibre onthe right has its centre, marked with a spot, outside this area and does not intersect the line; the fibre onthe left has its centre within this area and intersects the line.
The expected number of fibres in a given area, n is given by the mass of that area divided bythe expected mass of one fibre. The mass of a given area is given by the product of the areaand the sheet grammage; recall that the coarseness, δ of a fibre is defined as its mass per unitlength, so the mass of a fibre is given by the product of this and its length. Accordingly,
n =βAδ λ
(25)
Now, if f(θ) is a probability density function describing fibre orientation, then,
N(θ) =λ sin(θ)A
n f(θ) , (26)
=β
δsin(θ) f(θ) . (27)
Note that the right hand side of Equation (26) has been divided by the sample width, wbecause N(θ) is the number of fibres per unit width with orientation θ.
In earlier lectures, we discussed the use of the 1-parameter Cosine distribution, as givenby Equation (3), to model the fibre orientation distribution:
f(θ) =1π− ε cos(2 θ)

Structural Natural Fibres 25
BA
b
a
l1
l2
l4
l3y
x
Oθ
Figure 11: Schematic for determination of the strain within a fibre. Fibre OA is subjected to strain in thex-direction and has strained position OB.
Combining Equations (23, 27) and (3) yields,
T =∫
β
δF (θ) sin2(θ)
(1π− cos(2 θ)
).dθ . (28)
5.1.3 Strain within a fibre
To evaluate F (θ) we must consider the load-elongation behaviour of a fibre within the networkunder a given strain. Here we consider a single fibre, oriented at angle θ to the perpendicularin a sheet subjected to a strain, ex. Figure 11 shows such a fibre, of length λ represented bythe line, OA. On application of a given strain in the x-direction, the fibre has position OB.We assume that angular displacement of the fibre, AOB is small such that the angle of OBto the horizontal may be considered to be θ.
From trigonometry, the strains in the x and y directions are given by,
ex =l1 + l2
λ sin(θ)
Structural Natural Fibres 26
=b cos(θ) + a sin(θ)
λ sin(θ)(29)
ey =l3 − l4
λ cos(θ)
=b sin(θ)− a cos(θ)
λ cos(θ)(30)
For small angular deflections as considered here, the extension of the fibre is given by a; thedisplacement of its end is b. Now, since the Poisson’s ratio, ν = −ey
exwe have,
ex + ey = (1− ν) ex
(1− ν) ex =b cos(θ) + a sin(θ)
λ sin(θ)+
b sin(θ)− a cos(θ)λ cos(θ)
=b
λ sin(θ) cos(θ)(31)
b = λ sin(θ) cos(θ) (1− ν) ex (32)
Substitution of Equation (32) in (29) yields
λ sin(θ) ex = b cos(θ) + a sin(θ)λ ex = λ cos2(θ) (1− ν) ex + a
a =(1− (1− ν) cos2(θ)
)λ ex
=(sin2(θ) + ν cos2(θ)
)λ ex (33)
Given an expression for a we can now determine F (θ). Assuming Hookean behaviour forthe load elongation response of fibre segments,
E =F (θ) λ
aA(34)
where E is the average Young’s modulus of a fibre (N m−2) and A is the cross-sectional areaof a fibre (m2). Substituting for a from Equation (33) yields
F (θ) = A E ex
(sin2(θ) + ν cos2(θ)
)(35)
5.2 Elastic Deformation
The elastic region of the load-elongation curve occurs under small strains. Assuming thatthere is no bond failure in this region, the fraction of active fibres, fa remains constant.

Structural Natural Fibres 27
Substituting Equation (35) in (28) yields
T =∫
β
δA E ex fa
(sin2(θ) + ν cos2(θ)
)sin2(θ)
(1π− ε cos(2 θ)
).dθ , (36)
=β
δA E ex fa
∫ (sin2(θ) + ν cos2(θ)
)sin2(θ)
(1π− ε cos(2 θ)
).dθ , (37)
Integration for 0 ≤ θ ≤ π yields
T =β
δE A ex fa
(38− ν
8± π
4ε
). (38)
where the coefficient of ε is +ve in the MD and -ve in the CD. Note that δA is, by definition,
the fibre density, ρf ib, so
T =β
ρfibE ex fa
(38− ν
8± π
4ε
). (39)
The specific elastic modulus of the sheet, Esp (kN m kg−1) can be calculated by differen-tiating Equation (39) with respect to the strain, ex and dividing by the mean grammage:
Esp =1β
dTdex
=1
ρfib, E fa
(38− ν
8∓ π
4ε
)(40)
and we expect ν = −13 so,
Esp =E
ρf ibfa
(13∓ π
4ε
)(41)
Since the density of fibres can be considered approximately constant and equal to that ofcellulose, Equation (41) states that the specific elastic modulus is dependent on three variablesonly:
• The mean Young’s modulus of fibres, E,
• The fraction of active fibres, fa,
• The eccentricity of the network, ε.
It is interesting to note that the expression includes no term for RBA, yet it is well establishedthat sheet modulus increases with RBA. Kallmes, Bernier and Perez argue that the effect isaccommodated in Equation (41) by parameters E and fa which, for example, both increasewith processes such as refining and wet pressing. Hence, Esp and RBA are interdependentbut Esp is not a function of RBA.

Structural Natural Fibres 28
5.3 Summary
The theory of Kallmes, Bernier and Perez is evidently more complicated than that of Page.Whereas Page’s theory tells us only about the failure strength of the sheet, that of Kallmes etal. provides insights into the load-elongation behaviour of the network. Arguably this is moreimportant as it is rare for us to seek to use a material in circumstances that would lead toits failure – deformation during use is a more realistic scenario.
References
[1] B. Radvan, C.T.J. Dodson and C.G. Skold. Detection and cause of the layered structureof paper. In Consolidation of the Paper Web (ed. F. Bolam), Trans IIIrd Fund. Res.Symp., Cambridge, 1965. pp189-215. BPBMA, 1966.
[2] K. Niskanen. Paper Physics. Fapet/Tappi, Atlanta, 1998.
[3] D.H. Page. A theory for the tensile strength of paper. Tappi J. 52(4):674-681, 1969.
[4] J.A. Van den Akker, A.L. Lathrop, M.H. Voelker and L.R. Dearth. Importance of fibrestrength to sheet strength. Tappi J. 41(8):416-425, 1958.
[5] D.H. Page and R. Seth. Tappi J. 71(10):182, 1988.
[6] O. Kallmes, G. Bernier and M. Perez. A mechanistic theory for the load elongationproperties of paper. Pap. Tech. & Ind. 18(7,8,9,10), 1977.