Embed Size (px)
Citation preview
LE
EFFECT OF RECYCLED TYRE STEEL FIBRES ON
STRUCTURAL PERFORMANCE AND IMPACT
RESISTANCE OF RUBBERIZED CONCRETE
NDAYAMBAJE Jean Claude
MASTER OF SCIENCE IN CIVIL ENGINEERING
(structures)
PAN-AFRICAN UNIVERSITY, INSTITUTE FOR BASIC
SCIENCE, TECHNOLOGY AND INNOVATION
April 2018
Pan-African University Institute for Basic Science, Technology and Innovation
ii
DECLARATION
I declare that this Thesis is my original work and has not been presented for award of
a degree in any other university.
Signature ………………………………… Date …………………………
NDAYAMBAJE Jean Claude
CE300-0002/16
This thesis has been submitted for examination with the approval of university
supervisors
Signature ………………………………… Date …………………………
Prof. Richard Ocharo Onchiri
Technical University of Mombasa, Mombasa, Kenya
Signature ………………………………… Date …………………………
Prof. Walter Odhiambo Oyawa
Commission for University Education, Nairobi, Kenya
Pan-African University Institute for Basic Science, Technology and Innovation
iii
DEDICATION
To PAUSTI Administrations
JKUAT Administration
To my Supervisors
To my family
To my colleagues
To my friends

Pan-African University Institute for Basic Science, Technology and Innovation
iv
ACKNOWLEDGEMENT
My first acknowledgement is addressed to the almighty God, for all he has done for
me, keeping me healthy during my education and the time for this research project. I
would Particularly like to express my sincere appreciation to my supervisors Prof.
Walter Odhiambo Oyawa, Prof. Richard Onchiri and Prof. Stanley M. Shitote for
their advices on the achievement of this research project. I also give thanks to my
classmates for their moral support, motivations, and inspiration.
Pan-African University Institute for Basic Science, Technology and Innovation
v
ABSTRACT
The disposal of waste tyres continues to raise an environmental concern on the world.
The dumping of used tyres is a serious environmental problem mostly in urban areas
of Kenya and other urbanized areas of African countries. Many researches have been
done on the use of waste tyre rubbers in concrete, but most of the tyre rubbers are only
being used for production of non-structural Concrete, as filling materials, which in turn
reduce its potential use in Civil Engineering Construction industry. The major cause,
is the reduction in mechanical strengths of rubber concrete which makes it unsuitable
for structural component subjected to heavy static or dynamic forces. In this research,
Recycled tyre steel fibres(RTSF) were used to investigate their effect on structural
performance of rubber concrete.
Crumb Rubber ranging of (0.15mm-2.36mm) was used for partial replacement of
natural fine aggregates by 5,10,12.5,15 and 20% volume to evaluate the effect of
Crumb Rubber volume on concrete mechanical properties. For investigating the effect
of the recycled tyre steel fibres on rubber concrete, a resulted optimum value of 12.5%
Crumb Rubber volume was mixed with different percentages of RTSF by 0.3,0.6, 0.9
and 1.2% of mass of the concrete with the fibres having different lengths which are
60,40 and 20mm. Three different mix groups: (CR0, CR5, CR10, CR12.5, CR15,
CR20); (CR12.5-V0.3L60, CR12.5-V0.6L60, CR12.5-V0.9L60, CR12.5-V1.2L60);
and (R12.5-V1.2L60, CR12.5-V1.2L40, CR12.5-V1.2L20) were casted and tested at
7 and 28 days of curing. The first group were tested to assess the effect of Crumb
Rubber volume on compressive and tensile strength of concrete. The second group
were tested to evaluate the effect of RTSF content on properties of Rubberized
concrete. The third group were casted and tested to investigate the effect of the RTSF
aspect ratio on properties of rubberized concrete.
The results showed that, at 12.5% of rubber content, Compressive, tensile and flexural
strength reduced by 21.51, 17.44 and 17.4% respectively at 28 days; and Flexural
toughness and Impact strength increased by 5.9 and 58.82% respectively at 28 days.
The addition of RTSF volume up 1.2%, the compressive, tensile and flexural strength
of Recycled tyre steel fibre reinforced rubber concrete(RTSFRC) reduced by 10.38,
0.27 and 4.3% respectively at 28 days; and flexural toughness and Impact strength
increased by 258.75% and 741.18% respectively compared to plain concrete at 28
days. The results further indicated that, the increase in aspect ratio of RTSF resulted in
increase of mechanical properties, toughness and impact resistance, but limitation
should be put to avoid balling effect of RTSF caused by higher value of aspect ratio,
in this regard 60mm fibre length was adopted as the maximum. The interesting results
confirm the promising application of recycled tyre steel fibres and crumb rubber in
construction industry.
Pan-African University Institute for Basic Science, Technology and Innovation
vi
TABLE OF CONTENT
DECLARATION ........................................................................................................ ii
DEDICATION ........................................................................................................... iii
ACKNOWLEDGEMENT ........................................................................................ iv
ABSTRACT ................................................................................................................ v
TABLE OF CONTENT ............................................................................................ vi
LIST OF TABLES .................................................................................................... xi
LIST OF FIGURES ................................................................................................. xii
LIST OF ABBREVIATIONS AND ACRONYMS ............................................... xv
LIST OF APPENDICES ........................................................................................ xvii
PUBLICATIONS .................................................................................................. xviii
CHAPTER ONE: INTRODUCTION ...................................................................... 1
1.3.1 General objective: .................................................................................. 5
1.3.2 Specific Objectives:................................................................................ 5
Pan-African University Institute for Basic Science, Technology and Innovation
vii
1.4.1 Research question ................................................................................... 6
1.4.2 Research hypothesis ............................................................................... 6
CHAPTER TWO: A REVIEW ON FIBRE REINFORCED RUBBER
CONCRETE ............................................................................................................... 9
2.2.1. Waste Tyre properties ............................................................................ 9
2.2.2. Properties of Rubberized concrete ....................................................... 13
2.3.1. Introduction .......................................................................................... 18
2.3.2. Different types of fibres ....................................................................... 20
2.3.3. Fibre- matrix bond ................................................................................ 21
2.3.4. Properties of fibre reinforced concrete ................................................. 24
2.3.5. Factors affecting properties of fibre reinforced concrete ..................... 26
2.3.6. Measurement of properties of fibre reinforced concrete ...................... 29
2.3.7. Advantages and Disadvantages of Fibre reinforced concrete .............. 37
Pan-African University Institute for Basic Science, Technology and Innovation
viii
2.4.1. Generalization ...................................................................................... 38
2.4.2. Fundamental of steel fibres .................................................................. 39
2.4.3. Mix Design for Steel Fibre Reinforced Concrete................................. 41
2.4.4. Properties of Freshly Mixed SFRC ...................................................... 42
2.4.5. Mechanical properties of Steel Fibre Reinforced Concrete ................. 43
2.4.6. Application of steel fibre reinforced concrete ...................................... 46
2.5.1. Method of Recovering of waste tyre steel cord.................................... 48
2.5.2. Property of recycled tyre cord .............................................................. 50
2.5.3. Application of Recycled tyre fibre in concrete .................................... 51
CHAPTER THREE: MATERIALS AND METHOD .......................................... 58
3.2.1. Cement ................................................................................................. 59
3.2.2. Aggregates ............................................................................................ 60
3.2.3. Water .................................................................................................... 61
3.2.4. Chemical admixtures ............................................................................ 62
Pan-African University Institute for Basic Science, Technology and Innovation
ix
3.2.5. Recycled Tyre steel fibres. ................................................................... 62
3.5.1. Slump test ............................................................................................. 67
3.5.2. Compressive and split tensile strength test .......................................... 68
3.5.3. Flexural strength and toughness tests ................................................... 68
3.5.4. Impact resistance .................................................................................. 71
CHAPTER FOUR: RESULTS AND DISCUSSION ............................................ 73
4.1.1. Workability........................................................................................... 73
4.2.1. Compressive strength ........................................................................... 76
4.2.2. Split Tensile strength ............................................................................ 79
4.2.3. Flexural strength ................................................................................... 84
4.2.4. Flexural Toughness .............................................................................. 89
4.2.5. Impact resistance .................................................................................. 96
CHAPTER FIVE: CONCLUSION AND RECOMMENDATION ................... 102
Pan-African University Institute for Basic Science, Technology and Innovation
x
5.2.1. Recommendation for the current study .............................................. 104
5.2.2. Recommendation for further study .................................................... 105
APPENDICES ........................................................................................................ 113
Pan-African University Institute for Basic Science, Technology and Innovation
xi
LIST OF TABLES
Table 2. 1.Comparison of material composition of passenger car and truck tyres .... 10
Table 2. 2.Material Composition of the post –Consumer tyre Materials ................... 11
Table 2. 3.Pull out strength for different fibre matrices ............................................. 23
Table 2. 4.Effect of Fibre aspect ratio on Toughness and strength ........................... 28
Figure 3. 1.Test Setup for Four Bending beam test -ASTM C1018 .......................... 70
Figure 3. 2.Setup impact equipment test -ASTM-31 ................................................. 72
Table 4. 1.Results on Toughness Indexes and Residual strengths ............................. 93
Table 4. 2.Results on Impact resistance of the mix group II and III .......................... 97
Pan-African University Institute for Basic Science, Technology and Innovation
xii
LIST OF FIGURES
Figure 2. 1.Types of Fibres (James Patrick Maina Mwangi, 1985) ........................... 21
Figure 2. 2.Behaviour of Fibre Reinforced Concrete under Tensile Load ................. 23
Figure 2. 3.Toughness and Flexural strength measurement of FRC .......................... 31
Figure 2. 4.Load-deflection Curve for fibre reinforced concrete under flexural
bending test .................................................................................................... 32
Figure 2. 5.Flexural toughness by JSCE-4 Standard Test Method ............................ 34
Figure 2. 6.Plan view of drop weight method impact test equipment ........................ 36
Figure 2. 7.Section view of drop weight method impact test equipment ................... 37
Figure 2. 8.Different steel fibre Geometries .............................................................. 40
Figure 2. 9. Tyre Steel cord from pyrolysis Figure 2. 10.Tyre steel cord from
shredding ........................................................................................................ 50
Figure 2. 11.Properties of Steel cord from from pyrolysis (Tremat, 2003) ............... 51
Figure 3. 1.Test Setup for Four Bending beam test -ASTM C1018 .......................... 70
Figure 3. 2.Setup impact equipment test -ASTM-31 ................................................. 72
Figure 4. 1.Comparison of slump values of concrete mix Group I. ........................... 75
Figure 4. 2.Comparison of slump values of Concrete Mix Group II. ........................ 75
Figure 4. 3.Comparison of slump values of Concrete mix group III. ........................ 76
Figure 4. 4.Comparison on compressive strength of Concrete mixes of Group I ...... 77
Figure 4. 5.Comparison on compressive strength of Concrete mixes of Group II .... 78
Pan-African University Institute for Basic Science, Technology and Innovation
xiii
Figure 4. 6.Comparison on compressive strength of Concrete mixes of Group III ... 79
Figure 4. 7.Comparison on Split tensile strength of Concrete mixes of Group I ....... 81
Figure 4. 8.Comparison on Split tensile strength of Concrete mixes of Group II ..... 82
Figure 4. 9.Comparison on Split tensile strength of Concrete mixes of Group III .... 82
Figure 4. 10.Comparison on decrease in Compressive and Split tensile strength of
concrete mix of Group II ................................................................................ 84
Figure 4. 11.Comparison on Flexural strength of concrete mixes Group II .............. 88
Figure 4. 12.Comparison on Flexural strength of concrete mixes Group III ............. 88
Figure 4. 13.Comparison on effect of RTSF volume on toughness of rubber concrete
........................................................................................................................ 91
Figure 4. 14.Comparison on effect of RTSF length on toughness of rubber concrete
........................................................................................................................ 91
Figure 4. 15.Comparison on effect of RTSF content on toughness Index of rubber
concrete .......................................................................................................... 93
Figure 4. 16. Comparison on effect of RTSF length on toughness Index of rubber
concrete .......................................................................................................... 94
Figure 4. 17 .Comparison on effect of RTSF content on Residual strength factors of
rubber concrete ............................................................................................... 95
Figure 4. 18. Comparison on effect of RTSF length on Residual strength factors of
rubber concrete ............................................................................................... 96
Pan-African University Institute for Basic Science, Technology and Innovation
xiv
Figure 4. 19.Load-deflection Curves.......................................................................... 86
Figure 4. 20.Comparison on effect of RTSF volume on number of blows rubber
concrete .......................................................................................................... 99
Figure 4. 21.Comparison on effect of RTSF length on number of blows rubber
concrete ........................................................................................................ 100
Figure 4. 22.Comparison on effect of RTSF volume on Toughness of rubber concrete
...................................................................................................................... 100
Figure 4. 23.Comparison on effect of RTSF length on Toughness of rubber concrete
...................................................................................................................... 101
Pan-African University Institute for Basic Science, Technology and Innovation
xv
LIST OF ABBREVIATIONS AND ACRONYMS
ACI American concrete Institute
AR Alkali Resistant
ASTM American Standard Testing Method
BS British standard
BSI British Standard Institute
ES European Standard
FC First Crack
FRC Fibre Reinforced Concrete
GFRC Glass Fibre Reinforced Concrete
GGBS Ground Granulated Blast Slag
HRWR High Range Water Reducer
ISF Industrial Steel Fibre
ISFRC Industrial Steel Fibre Reinforced Concrete
J Joule
JKUAT Jomo Kenyatta University of Agriculture and Technology
JSCE Japan Society of Civil engineers
KN Kilo Newton
LVDT Linear Variable Differential Transformer
MPa Mega pascal
MSF Manufactured steel Fibre
NEMA National Environmental Management Authority
Pan-African University Institute for Basic Science, Technology and Innovation
xvi
PAUSTI Pan African University Institute for Basic Science
Technology and Innovation
PFA Pulverized Fuel ash
PPC Portland Pozzolana cement
PPF Polypropylene Steel Fibre
PRSF Pyrolyzed recycled Steel Fibre
RSF Recycled Steel Fibre
RTPF Recycled Tyre Polymer Fibre
RTSF Recycled Tyre Steel Fibre
RTSFRC Recycled Tyre Steel Fibre Reinforced Rubber Concrete
SCRC Self-Consolidated Rubberized Concrete
SEM Scanning Electron Microscopy
SFCR Steel Fibre Reinforced concrete
SNFRC Synthetic Steel Fibre reinforced Concrete
SRSF Shredded Recycled Steel Fibre
UTM Universal testing Machine
Pan-African University Institute for Basic Science, Technology and Innovation
xvii
LIST OF APPENDICES
APPENDIX 1.SIEVE ANALYSIS RESULTS ....................................................... 114
APPENDIX 2.MIX DESIGN DATA SHEET ........................................................ 117
APPENDIX 3.SPECIFICATION OF VIRGIN TYRE STEEL CORD .................. 119
APPENDIX 4.COMPRESSIVE STRENGTH TEST RESULTS ........................... 121
APPENDIX 5.SPLIT TENSILE STRENGTH TEST RESULTS .......................... 125
APPENDIX 6.FLEXURAL STRENGTH TEST RESULTS ................................. 128
APPENDIX 7. FLEXURAL TOUGHNESS TEST RESULTS ............................. 130
APPENDIX 8.IMPACT RESISTANCE RESULTS .............................................. 130
APPENDIX 9.PRESENTATION OF TEST PHOTOGRAPHS ............................ 132
Pan-African University Institute for Basic Science, Technology and Innovation
xviii
PUBLICATIONS
1. “Combined Effect of Recycled Tyre Steel Fibre and Crumb Rubber on Flexural
Toughness of Concrete “published in International Journal of Innovative
Science and Modern Engineering (IJISME):
http://ijisme.org/download/volume-5-issue-1/
2. “Cumulative effect of Recycled Tyre Steel Fibre and crumb rubber on impact
resistance of concrete” Published in European International Journal of Science
and Technology (EIJST): http://eijst.org.uk/
Pan-African University Institute for Basic Science, Technology and Innovation
1
CHAPTER ONE: INTRODUCTION
Background to the study
The overall global development has required Construction of great numbers of roads
and the increase of population has raised the vehicular density from last few decades.
For a Country like Kenya, an increase of roads construction is still necessary for
national integration, industrial development as well as socio-economic development.
Due to improvement in living standards of the people, the use of vehicles has increased
over a last few years, giving rise in the vehicular density on roads. As vehicles are
frequently used the wear and tear of their tyres is obvious. Due to wear and tear of
tyres the life of tyre reduces and at last it becomes useless (Scrap tyres). The disposal
of these used tyres has become a serious problem. These waste tyres are disposed
mostly by either burning or by dumping. Disposal by burning causes air pollution and
dumping causes valuable land to be wasted for stacking up the tyres. So, it is required
to dispose them safely and economically (NOOR, 2014).
It has been reported that, the most commonly potential environmental impacts
associated with tyre storage are: compounds leaching from the tyres and contaminating
soil, groundwater and surface water, uncontrolled open air burning of tyres which
releases pyro lytic oils and other compounds into the soil and groundwater as well as
large plumes of black smoke and other contaminants into the air. In addition to this,
water used to extinguish tyre fires is likely to become contaminated with tyre
compounds. Tyre piles may become breeding grounds for insects, rodents and other
Pan-African University Institute for Basic Science, Technology and Innovation
2
animals. Mosquitoes are a concern in tropical and subtropical countries because they
are capable of transmitting diseases to humans (BMZ, 2014).
Many Countries of EU and USA have been aware of this problem and many researches
have been done on the use of tyre rubbers in civil engineering application. Tyre rubbers
were used to partially replace normal aggregates and the resulted Rubber concrete
showed advantages and disadvantages. The most disadvantages are the significant
decrease of mechanical properties of the concrete which are important properties of
concrete for structural application purpose. The reason for this decrease was reported
to be the weak bond between rubber aggregates and cement paste, and low modulus of
elasticity of rubber particles compared to conventional aggregate particles. Different
inorganic compounds such as NaOH, H2SO4, Anhydrous ethanol were used to treat
the Rubber aggregates surface to increase the bond between Rubber aggregates and
cement matrix but, the resulted strengths were still much lower than those of normal
concrete which still hinders the use of this rubber concrete in civil engineering
applications (NOOR, 2014)
Based on many researches it was proven that industrial steel fibres increase the
strengths and other properties of concretes. In 1,500,000,000 tons of waste tyres that
are produced in world each year, 360, 000,000 tones are steel fibres/wire which are
mostly deposed in land fill (Angelakopoulos, 2008), (Martinez Juan Danial, 2013).
Material recovery from used tyres is undertaken either mechanically or thermal
degradation process. The former reduces tyres to steel fibres and granulated rubbers
and the latter process breaks down the tyres into steels, char, and liquids and gases.
Pan-African University Institute for Basic Science, Technology and Innovation
3
The recovered steel fibres (RSF) are currently either used as scrap feed in steel
manufacturing or end up being deposed into landfill (Pilakoutas K. N., 2004)
Recently, researchers have developed methodology to extract used tyre steel cord and
use in Concrete. The concrete obtained by adding randomly distributed of steel fibres
showed a satisfactory improvement of fragile concrete matrix in terms of toughness
and post-crack behaviour, ductility, impact energy resistance and flexural strength (
ACI committee 544.R5-10, 2010) (Carpenteri.A,Bringheti.R, 2010).In addition to that
, it was proven that mechanical behaviour of concrete reinforced with fibres extracted
from waste tyres is comparable to that of conventional steel fibre reinforced concrete.
As consequence, Recycled tyre steel fibre reinforced rubber concrete (RTSFRC)
appears to be a promising candidate for both structural and non-structural concrete
(Alieo M, 2008).
Concrete with the above mentioned enhanced properties is preferred in construction of
airport runaway pavements, Industrial flooring, bridges, military buildings, hydraulic
structures, earthquake resisting structures and heavy machinery foundations, where
dynamic loading is enormous. Under dynamic loading, plain concrete exhibits
excessive cracking and undergoes brittle failure mode with a relatively low impact
energy absorption capacity. Fibre reinforced concrete is best candidate for concrete
structures resisting impact loads and limiting initiation and propagation of plastic
shrinkage cracks which usually affect durability of concrete structures ( ACI
committee 544.R5-10, 2010).
Pan-African University Institute for Basic Science, Technology and Innovation
4
This research studies the effect on structural performance of Rubber concrete
reinforced with Recycled tyre steel cord extracted from waste tyres. The increase in
mechanical properties of Rubber Concrete will increase potential use of waste tyre
rubber in civil structural constructions, solving the disposal problem of waste tyres and
same way saving the cost.
Problem statement
At present the disposal of waste tyres is becoming a major waste management problem
in the world. It is estimated that 1.5 million tons of used tyres are produced annually,
and out of these tons of waste tyres only 4% is being used for civil engineering
application. It was reported by NEMA in 2012 that Kenya generates almost over 2
million waste tyres with majority of them being disposed hazardously in the
environment, GIZ, (2012). Concrete is the most widely used as structural material in
the world, due to its easy preparation and low cost. For this reason, many researches
have been done on the use of waste tyre rubber as an aggregate in production of
rubberized concrete as one of safe and effective disposal of waste tyres. Based on many
researches, Rubber concrete exhibits a decrease in mechanical properties due to weak
bond between rubber aggregates and cement paste, as well as low modulus of elasticity
of rubber particles.
To improve bond property of Rubber aggregate, rubber surface was treated with
inorganic compounds; though an increase in strength was observed on rubber concrete
with treated rubber aggregates, still the strengths were much lower than that of normal
concrete, as result, tyre rubber is still being used as filling material. As structural
Pan-African University Institute for Basic Science, Technology and Innovation
5
concrete is widely used in Civil engineering industry, the decrease in strengths has
reduced the potential use of rubber concrete in civil engineering application. Recycled
tyre steel fibre has been tested and showed good property as that of industrial steel
fibres. For this reason, an attempt is to be made on the use of recycled tyre steel fibre
(RTSF) as reinforcement to improve Structural performance of Rubberized concrete.
Industrial Steel Fibre Reinforced concrete (ISFRC) has shown Improved ductility,
impact resistance, toughness, crack control and energy absorption capacity. Once the
inclusion of RTSF improve structural performance of rubber concrete, it will
ultimately induce the potential use of waste tyre in structural construction industry
which will be environmentally beneficial and technically sound.
Objectives of the research
1.3.1 General objective:
To investigate effect on structural performance, Flexural toughness and impact
resistance of rubberized concrete by incorporating Recycled tyre steel cords as
reinforcement.
1.3.2 Specific Objectives:
1. To evaluate the effect of recycled tyre steel fibres on Compressive, tensile and
Flexural strengths of rubberized concrete
2. To determine the impact of combined Crumb Rubber and recycled tyre steel
fibres on Flexural toughness of concrete
3. To assess cumulative effect of the recycled tyre steel fibres and Crumb Rubber
on impact resistance of concrete
Pan-African University Institute for Basic Science, Technology and Innovation
6
Research questions and hypothesis
1.4.1 Research question
1. Do recycled tyre steel fibres affect Compressive, tensile and Flexural strengths
of Rubberized concrete?
2. Do combined recycled tyre steel fibre and Crumb Rubber in concrete affect
the flexural toughness of concrete?
3. Do recycled tyre steel fibre and Crumb Rubber in concrete affect the impact
resistance of concrete?
1.4.2 Research hypothesis
1. H01: Recycled steel fibres do not affect compressive, tensile and Flexural
strength of Rubber concrete
2. H02: Combined Recycled tyre steel fibre and Crumb Rubber in concrete do not
affect flexural toughness of concrete
3. H03: adding Recycled tyre steel fibre and Crumb Rubber in concrete do not
affect impact resistance of concrete
Research justification
As reported in many researches, waste tyres will continue to be increasing as roads
increase. Country like Kenya will face the problem of waste tyre disposal as million
tons of waste tyres are produced at increasing rate each year and yet there is no defined
safe environmental management of waste tyres (NOOR, 2014). Using waste Tyre
Rubber as an aggregate material and recycled tyre steel fibres as reinforcement in
concrete will significantly reduce a great amount of waste tyres which affects
Pan-African University Institute for Basic Science, Technology and Innovation
7
environment causing atmospheric contamination. The efforts of using waste tyre in
concrete production will not only be beneficial to the government in reduction of
providing land for disposal, but also will contribute to the growth of economy in
various sectors especially in construction industry.
Since rubber concrete was reported to have good properties such as impact resistance,
good ductility index, and energy absorption capacity; Once the mechanical properties
of rubber concrete are improved by using recycled tyre steel fibres, RTSFRC will be
beneficial for the design of concrete pavement subjected to dynamic forces, Concrete
structures susceptible to earthquake loads, heavy machinery foundations to minimize
damage caused by vibration and also design of industrial floors to reduce damage due
to abrasion forces.
Scope of the study
The Proposed research is limited to the determination of effect on combination of
Recycled tyre steel fibre and Crumb Rubber on Compressive, Tensile and flexural
strengths, Flexural Toughness and Impact energy of Concrete, by incorporating waste
tyre steel cord as reinforcement and Crumb rubber as an aggregate. Crumb Rubber of
size of (0.15mm-2.36mm) from Rubber company and recycled tyre steel cord from
Pyrolysis plant (acqualine distributor company) were used in this research.
Experimental tests were conducted in JKAUT structural and Materials laboratory.
Pan-African University Institute for Basic Science, Technology and Innovation
8
Organisation of the thesis
This Thesis is structured into 5 main chapters, each chapter is divided in number of
sections and further subsections. Chapter One describes, the background to the study,
Objectives of the research and its significance inclusive of the methodology.
In Chapter Two, a comprehensive review on the use of steel fibre reinforced concrete
is discussed. The type of application and design consideration of Rubber concrete is
addressed in this chapter. The types and, properties and current application of fibres
are also described. Recycled tyre steel fibre recycling, its properties and area of
applications have been given more focus in this chapter.
Chapter Three deals with Materials and Methods used for the current study. Properties
of Materials used, mix proportioning of the materials, Mixing, casting and curing
procedures have been broadly covered in this chapter. All the procedures performed to
conduct different tests are also explained in detail in this chapter.
Chapter Four focuses on the results, analysis, discussion and presentation of the test
results. The results are presented in different forms such as Graph and tables. Graphs
have been used to show a possible relationship of the variables considered in this
research. Tables have also employed in the presentation of the results to statistically
analyse the data collected during experimentation.
Chapter Five focus on conclusions drawn and recommendation given to further
researchers from the current study. At the end of this chapter, a section of references
is followed, and other important data are given in the appendix of this thesis book.
Pan-African University Institute for Basic Science, Technology and Innovation
9
CHAPTER TWO: A REVIEW ON FIBRE REINFORCED RUBBER
CONCRETE
2.1.Introduction
Rubberized concrete is a special concrete made by incorporating Tyre Crumb Rubber,
replacing either fully or partially the normal aggregates, having the same dimension of
the replaced aggregate. Fibres are added randomly in a concrete matrix to produce a
composite material named Fibre reinforced concrete(FRC). When steel fibres are
added to rubber concrete matrix they produce a composite material which is Steel fibre
reinforced Rubber concrete (SFRC) (M.A.AielloF.Leuzzi, 2010)
2.2.Use of waste tyre rubber in concrete
2.2.1. Waste Tyre properties
The RMA (Rubber Manufacturers Association) defines a scrap tyre as a tyre that can
no longer serve its original intended purpose. According to the Waste Tyre Working
group comprising key stakeholders such as NEMA, Kenya Revenue Authority, cement
manufacturers, tyre manufacturers, and dealers, Kenya generates over 1,000,000 scrap
tyres annually.
a. Physical Properties of tyres
Tyres consist of a rubber compound usually reinforced with steel and textile.
Depending on their size and utilisation, tyres vary in design, construction and total
weight. The weight of a used passenger car tyre in Europe is about 6.5 kg and that of
Pan-African University Institute for Basic Science, Technology and Innovation
10
a truck tyre is about 53 kg.2 Passenger car and truck tyres make up approximately 85%
of the total tyres manufactured globally.
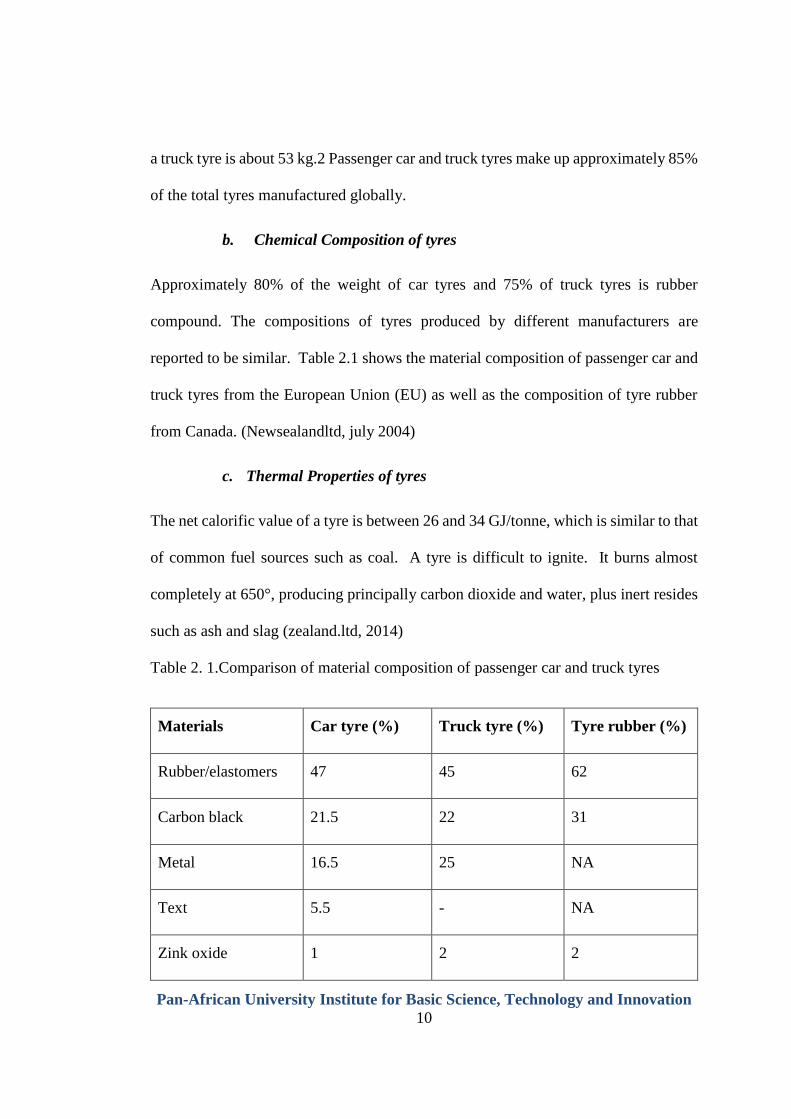
b. Chemical Composition of tyres
Approximately 80% of the weight of car tyres and 75% of truck tyres is rubber
compound. The compositions of tyres produced by different manufacturers are
reported to be similar. Table 2.1 shows the material composition of passenger car and
truck tyres from the European Union (EU) as well as the composition of tyre rubber
from Canada. (Newsealandltd, july 2004)
c. Thermal Properties of tyres
The net calorific value of a tyre is between 26 and 34 GJ/tonne, which is similar to that
of common fuel sources such as coal. A tyre is difficult to ignite. It burns almost
completely at 650°, producing principally carbon dioxide and water, plus inert resides
such as ash and slag (zealand.ltd, 2014)
Table 2. 1.Comparison of material composition of passenger car and truck tyres
Materials Car tyre (%) Truck tyre (%) Tyre rubber (%)
Rubber/elastomers 47 45 62
Carbon black 21.5 22 31
Metal 16.5 25 NA
Text 5.5 - NA
Zink oxide 1 2 2
Pan-African University Institute for Basic Science, Technology and Innovation
11
Sulphur 1 1 1
Additives 7.5 5 4
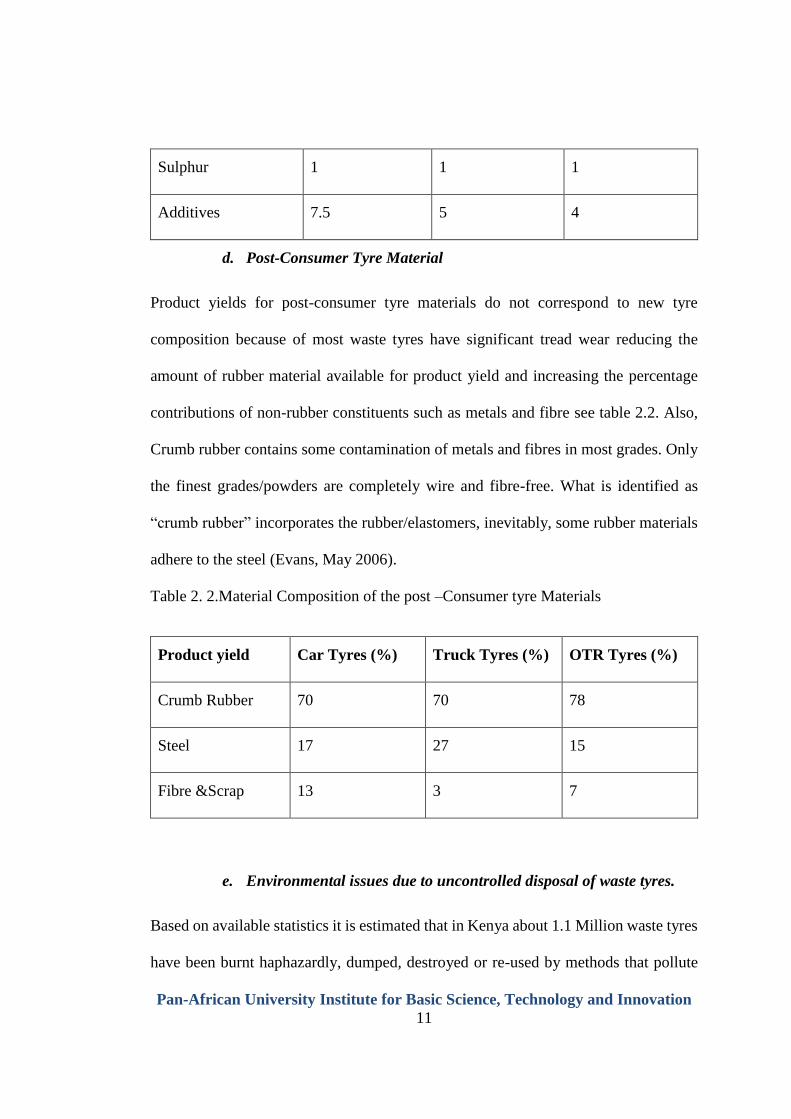
d. Post-Consumer Tyre Material
Product yields for post-consumer tyre materials do not correspond to new tyre
composition because of most waste tyres have significant tread wear reducing the
amount of rubber material available for product yield and increasing the percentage
contributions of non-rubber constituents such as metals and fibre see table 2.2. Also,
Crumb rubber contains some contamination of metals and fibres in most grades. Only
the finest grades/powders are completely wire and fibre-free. What is identified as
“crumb rubber” incorporates the rubber/elastomers, inevitably, some rubber materials
adhere to the steel (Evans, May 2006).
Table 2. 2.Material Composition of the post –Consumer tyre Materials
Product yield Car Tyres (%) Truck Tyres (%) OTR Tyres (%)
Crumb Rubber 70 70 78
Steel 17 27 15
Fibre &Scrap 13 3 7
e. Environmental issues due to uncontrolled disposal of waste tyres.
Based on available statistics it is estimated that in Kenya about 1.1 Million waste tyres
have been burnt haphazardly, dumped, destroyed or re-used by methods that pollute
Pan-African University Institute for Basic Science, Technology and Innovation
12
air, soils and ground water in 2010. The Kenyan Environmental Management and
Coordination Regulations for waste management have already been enacted in 2006,
but they do not specifically address the treatment and disposal of waste tyres. There
are indeed no such established and certified methods across East Africa. In cement
production waste tyre chips, can be co-processed as an alternative fuel resource (AFR)
replacing fossil fuel in an environmentally sound manner. However, without the
regulatory framework to engage in such practices, approval will not be given by the
authorities. Besides, many thousand people are engaged in recycling activities - most
of them in the informal sector, picking, processing and trading recyclables from waste,
not least of which are old rubber tyres. A minor percentage is used for producing shoes,
ropes and other materials, but to a much bigger extent the tyres are burnt to separate
the steel from the rubber, which is then sold to scrap traders. Those incomes generating
interests cannot be left aside when trying to resolve the issue (BMZ, 2014)
f. Benefit of using Waste tyres rubber in structural concrete
The use of recycled tyre rubber in concrete promotes the development of eco-friendly
constructions and encourages the concept of sustainable Construction materials, which
is receiving greater attention nowadays. In addition to that, low density of rubber
aggregate compared to a normal aggregate can substantially contribute to the
development of semi-lightweight and lightweight concrete, which helps to reach a
more economical design. Based on the report of different researches, inclusion of
rubber aggregate in concrete results in improved ductility, strain energy capacity,
impact resistance, deformation capacity and Energy absorption of concrete, however,
Pan-African University Institute for Basic Science, Technology and Innovation
13
mechanical properties reduce as the rubber aggregate content increase., which was
reported to be caused by lower modulus of rubber aggregate compared to conventional
ones and Poor adhesion between rubber aggregate and cement paste. Though different
researches have been done to improve mechanical properties of rubber concrete by
using treatment on rubber particles such as polyvinyl alcohol, sodium hydroxide, and
sulphur compounds. However insignificant improvement was observed. Researches
are still being conducted on how to improve mechanical properties of rubber
aggregates. ( American Concrete Institute, 2016)
2.2.2. Properties of Rubberized concrete
Prashant et al (2014) Conducted a research on the use of Waste Tyre Crumb Rubber
in concrete as Partial Replacement to Fine Aggregate. The replacement was done by
the mass of fine. The Crumb rubber was having size ranging between 600 µm-
1.18mm. The waste tyre Crumb rubber was immersed into NaoH solution for 20 min
and then dried before using in the concrete mix. NaoH treatment to the surface of
rubber particle was to enhance the adhesion between the rubber particles and cement
paste. Compressive, Tensile and Flexural strength tests were conducted on Concrete
cube (150X150x150mm), Cylinders (150mm and 300mm height) and Concrete beam
(150x150x700mm) respectively. The researchers observed from results that, for
higher rubber content workability of concrete increases. They further added that for
0.5 and 1% replacement of Crumb rubber to normal sand in concrete, it has no effect
on Compressive, Split tensile and Flexural strength of concrete. But at 2% replacement
Pan-African University Institute for Basic Science, Technology and Innovation
14
of Normal sand by Crumb rubber, they observed a decrease in compressive, Split
tensile and flexural strength by 20.32 and 4.86% and 19.07% respectively. They
concluded that, the workability of concrete increase with increase in Crumb rubber
content, but Compressive, split tensile and Flexural strength decreases with the
increase in Crumb rubber content. (Chavan, 2014)
Osama Youssef (2017) experimentally studied the effect of crumb rubber on
mechanical performance of concrete. The researcher considered two different cases,
when the Rubber concrete are unconfined and confined with Fibre reinforced
polymers(FRP). 10 ,20 ,30 ,40 and 50% volume replacement of normal sand by Rubber
crumb were added in concrete mixes. In the results, author stated that, at 10, 20, 30, 40
and 50%, the compressive and tensile strength reduced by 21.3 ,37.9 ,54.3 ,62.5 and
66.4%, and 15 ,40.1 ,44.1 ,48,9 and 58.5% respectively at 28 days in case of
unconfined rubber concrete. They further stated that, Modulus of elasticity decreases
by 4.8 ,16.4 ,30.1 ,34.8 and 51.5% as the rubber percentages replaces normal sand
respectively. In the conclusion, the author said that, using Rubber in concrete nearly
has a slight effect on concrete unit weight, only 6.9% reduction on unit weight was
observed when 50% rubber content was used. They also added that, Compressive, split
tensile and Flexural strengths reduced linearly at 7 and 28 days as the rubber increase
in concrete (Osama Youssf,Reza Hassanli, Julie E.Mills, 2017).
Yazdi M.A (2015) made a review on Application of Waste Tyre in Concrete. The study
was to summarize the achievement of different researchers in improvement of
mechanical properties of on plain rubber concrete, by treatment of rubber aggregates,
Pan-African University Institute for Basic Science, Technology and Innovation
15
by varying the size and amount of rubber in concrete, using Cementous materials and
examining the macrostructure behaviour of rubberized concrete. In their findings, the
authors reported that, increasing energy absorption is one of the benefits of using waste
rubbers in concrete. Tyre rubber particle pull-out and internal tyre rubber micro
cracking are two toughening mechanisms for energy consumption in the rubber-
concrete matrix that cannot be observed in ordinary concrete. The researcher
mentioned that, the mechanical strength reduces significantly with increase in amount
of rubber content, for untreated rubber, the optimum amount of rubber should be
between 20-30% volume. They also stated that, some researchers relate the strength
reduction of the rubberized concrete with increasing rubber content for two reasons:
First, initiated cracks around of the rubber particles due to the softy property of rubber
particles that accelerate the failure of the rubber aggregates and cement matrix.
Secondly, because of the lack of bond strength and adhesion between the rubber
particles and cement paste, and that soft nature of rubber may behave as voids in the
concrete matrix (M. A. Yazdi, 2015).
Pelisser, F et al (2011), studied the morphology and porosity of the interface
characteristic of between the rubber particles and the cement- matrix by scanning
electron microscopy (SEM). Authors, concluded that, incorporating of rubber particles
in concrete leads to the presence of large gaps in the interface between rubber and
cement matrix. However, reduction in porosity was observed when the rubber
treatment by sodium hydroxide and 15% silica fume was added. They claimed that this
reduction is attributed to the high concentration of NAOH in the area, which is
probably due to the hydrophilic effect of the treatment with sodium hydroxide.
Pan-African University Institute for Basic Science, Technology and Innovation
16
Moreover, the presence of silica fume can contribute to better adherence and reduction
of the weakness points. Other researchers have added that, mechanical properties
reduction is rubber concrete is caused by the easily rise of rubber particles to the
surface of concrete which creates uneven internal stress concentration due to un even
distribution of the rubber and leads to weak interfaces and internal crack
creation(Pelisser, F., et al, 2011). Reda Taha et al. (2008), made a thorough observation
of microcracking system in the concrete rubber particle vicinity, which weakens the
bond between tyre rubber particles and the cement matrix, and results proved that the
soft property of tyre particles produce tensile strains on tyre rubber/ cement matrix
surfaces and create microcracking in cement paste vicinity. He examined the effect of
treatment of rubber aggregate with Anhydrous Ethanol on contact angle between
rubber and cement paste. They concluded that, contact angle reduces as in the treated
rubber concrete compared to untreated one (Reda Taha, M.M., et al., 2008).
Huang et al. (2015) Reported that, reducing rubber aggregate size means reducing
stress and strain concentration. Crumb rubber filled concrete has more strengths than
rubber chip-filled concrete. They further reported that, higher rubber content and
smaller rubber particle size decreased compressive strength and modulus of elasticity
of concrete, while the ultimate strain capacity increased with increase in rubber content
with smaller rubber particle size. They added that, the number, length and size of
cracks in concrete decreases with increase in rubber aggregate content. Workability
and Permeability of concrete are more affected by rubber content than density and
strength. The researcher concluded that, with treated and untreated rubber aggregate,
Pan-African University Institute for Basic Science, Technology and Innovation
17
the optimum rubber in concrete should be between 20-30% to maintain the strength
and stiffness of rubberized concrete.
Osama Youssef (2017), conducted an experimental study on impact energy resistance
of concrete containing high Crumb rubber content. They examined the performance of
the rubber concretes when the concretes were uncoated and coated with different layers
of Fibre reinforced polymers(FRP). Different percentages volume replacement of
normal sand by Rubber crumb were added in concrete. The test was conducted
according to ACI 544. rubber concrete discs of (150x50mm) with 25mm notches
located at the end of specimens were used for this study. A steel ball of 65.5mm and
1.045kg was placed at the centre of the specimens and a 65.8x162.3mm steel cylinder
with 4.5kg was the released repeatedly from a vertical height of 200mm through a
hallow tube of diameter of 67mm.The results indicated that at 10 ,20 ,30,40 and 50%
volume replacement of normal sand by Rubber crumb, the impact energy resistance
increased by 1.55,1.91,2.14,3.14 and 3.52 times plain concrete respectively. The
Researcher concluded that, the higher the rubber content, the higher to resist blows and
hence the tendency to absorb more impact energy, which a characteristic of a material
with improved ductility and toughness properties (Osama Youssf,Reza Hassanli, Julie
E.Mills, 2017).
Ahamed Tareq Naoman (2015) studied Impact energy of concrete combined with
Crumb rubber and hooked end steel fibre. Low velocity drop weight impact test was
conducted to concrete beams of (500x100x100mm). Crumb rubber of 1-2 mm size
were replaced 17.5% and 20% of conventional sands and 0.5% fraction volume of
Pan-African University Institute for Basic Science, Technology and Innovation
18
hooked end steel were added to the rubber concretes. In the results, they reported that,
Compressive strength decreased at both Normal concrete and Fibre reinforced concrete
incorporated with Crumb rubber, though there was a little improvement for the rubber
concrete reinforced with steel fibre. Impact energy was highly improved with increase
in Crumb rubber at 17.5 and 20% volume, Impact energy increased by 133 and 155%
respectively. The researcher concluded that, both first crack and ultimate failure impact
energy increase with the increase in crumb rubber. (Ahmed.Tareq.N, 2015)
Guo et al (2014) Conducted a research on the effect of rubber aggregate on ductility of
concrete, reported that an appropriate rubber content increases ductility of concrete
and added that higher volume of rubber aggregate may lead to negative effect on
ductility. Grdic et al (2014) conducted a research on effect of rubber aggregate on
ductility index of concrete with partially replacing normal sand by rubber sand at levels
of 10 ,20 and 30% volume. They reported that ductility index increased with increase
in rubber content .at 10,20 and 30% rubber content, the ductility indexes were 25
,81.25, and 93.75% increment respectively.
2.3.Fibre reinforced concrete
2.3.1. Introduction
Fibre reinforced concrete (FRC) is a composite material made primarily of hydraulic
cements, aggregates and discrete reinforcing steel fibres. The reinforcement is in the
form of thin, short and distributed randomly throughout the concrete member. Fibres
are commercially available and manufactured from steel, plastic, glass, organic
polymer (synthetic fibres). Naturally occurring asbestos fibres and vegetable fibres,
Pan-African University Institute for Basic Science, Technology and Innovation
19
such as sisal and jute, are also used for reinforcement. Generally, the ratio of length to
diameter (i.e. aspect ratio) of fibres is in the range of 20 to 100 with any of the several
cross-sections that are sufficiently small to be easily and randomly dispersed in fresh
concrete mix using conventional mixing procedure. (ACI 544.1R, 1996)
Fibres as reinforcing materials in concrete, is supposed to induce an increase in
strength in concrete matrix as its name defines. For a fibre to be effective in a concrete
matrix, it should have the following properties: Its tensile strength should be at least 2
to 3 times that of concrete, Bond strength with concrete should be of the same or higher
in magnitude than the tensile strength of matrix, The elastic modulus in tension has to
be significantly higher than that of concrete , and the poison’s ratio and coefficient of
thermal expansion should preferably be of the same order as that of concrete matrix
(Jagadish K.S., 2007).
Brittle materials are considered to have no significant post-cracking ductility. Fibrous
composites have been and are being developed to provide improved mechanical
properties to otherwise brittle materials. When subjected to tension, these unreinforced
brittle matrices initially deform elastically. The elastic response is followed by
microcracking, localized macrocracking, and finally fractures. Introduction of fibres
into the concrete results in post-elastic property changes that range from subtle to
substantial, depending upon several factors, including matrix strength, fibre type, fibre
modulus, fibre aspect ratio, fibre strength, fibre surface bonding characteristics, fibre
content, fibre orientation, and aggregate size effects. For many practical applications,
the matrix first-crack strength is not increased. In these cases, the most significant
Pan-African University Institute for Basic Science, Technology and Innovation
20
enhancement from the fibres is the post-cracking composite response. This is most
commonly evaluated and controlled through toughness testing (ACI 544.1R, 1996)
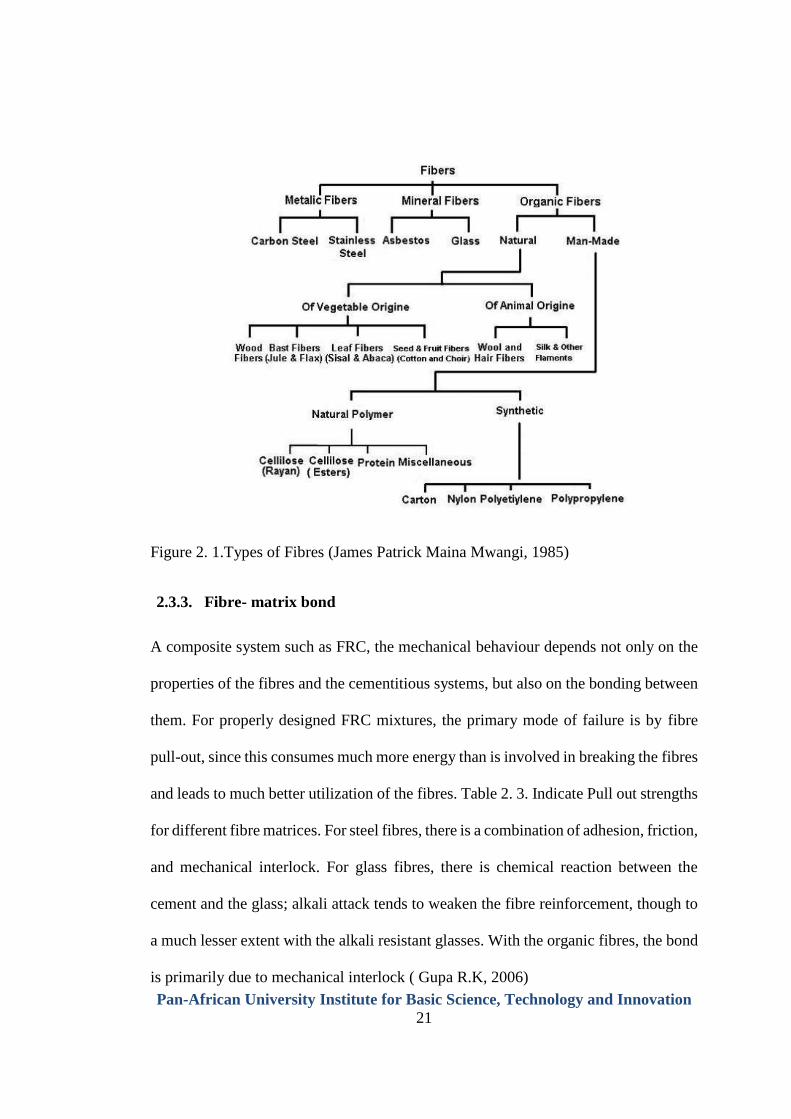
2.3.2. Different types of fibres
There are two main methods to categorize fibres based on their modulus of elasticity
or their origin. In the view of modulus of elasticity, fibres can be classified into two
basic categories, namely, those having a higher elastic modulus than concrete mix
(called hard intrusion) and those with lower elastic modulus than the concrete mix
(called soft intrusion). Steel, carbon and glass have higher elastic modulus than cement
mortar matrix, and polypropylene and vegetable fibres are classified as the low elastic
modulus fibres. Figure2. 1. Shows schematically different Types of Fibres. High
elastic modulus fibres simultaneously can improve both flexural and impact resistance;
whereas, low elastic modulus fibres can improve the impact resistance of concrete but
do not contribute much to its flexural strength. According to the origin of fibres, they
are classified in three categories of metallic fibres (such as steel, carbon steel, and
stainless steel), mineral fibres (such as asbestos and glass fibres), and organic fibres.
Organic fibres can be further divided into natural and man-made fibres. Natural fibres
can be classified into vegetable origin or sisal (such as wood fibres and leaf fibres),
and animal origin (such as hair fibres and silk). Man-made fibres can also be divided
into two groups as natural polymer (such as cellulose and protein fibres), and synthetic
fibres (such as nylon and polypropylene). (Johnston, 1982)
Pan-African University Institute for Basic Science, Technology and Innovation
21
Figure 2. 1.Types of Fibres (James Patrick Maina Mwangi, 1985)
2.3.3. Fibre- matrix bond
A composite system such as FRC, the mechanical behaviour depends not only on the
properties of the fibres and the cementitious systems, but also on the bonding between
them. For properly designed FRC mixtures, the primary mode of failure is by fibre
pull-out, since this consumes much more energy than is involved in breaking the fibres
and leads to much better utilization of the fibres. Table 2. 3. Indicate Pull out strengths
for different fibre matrices. For steel fibres, there is a combination of adhesion, friction,
and mechanical interlock. For glass fibres, there is chemical reaction between the
cement and the glass; alkali attack tends to weaken the fibre reinforcement, though to
a much lesser extent with the alkali resistant glasses. With the organic fibres, the bond
is primarily due to mechanical interlock ( Gupa R.K, 2006)
Pan-African University Institute for Basic Science, Technology and Innovation
22
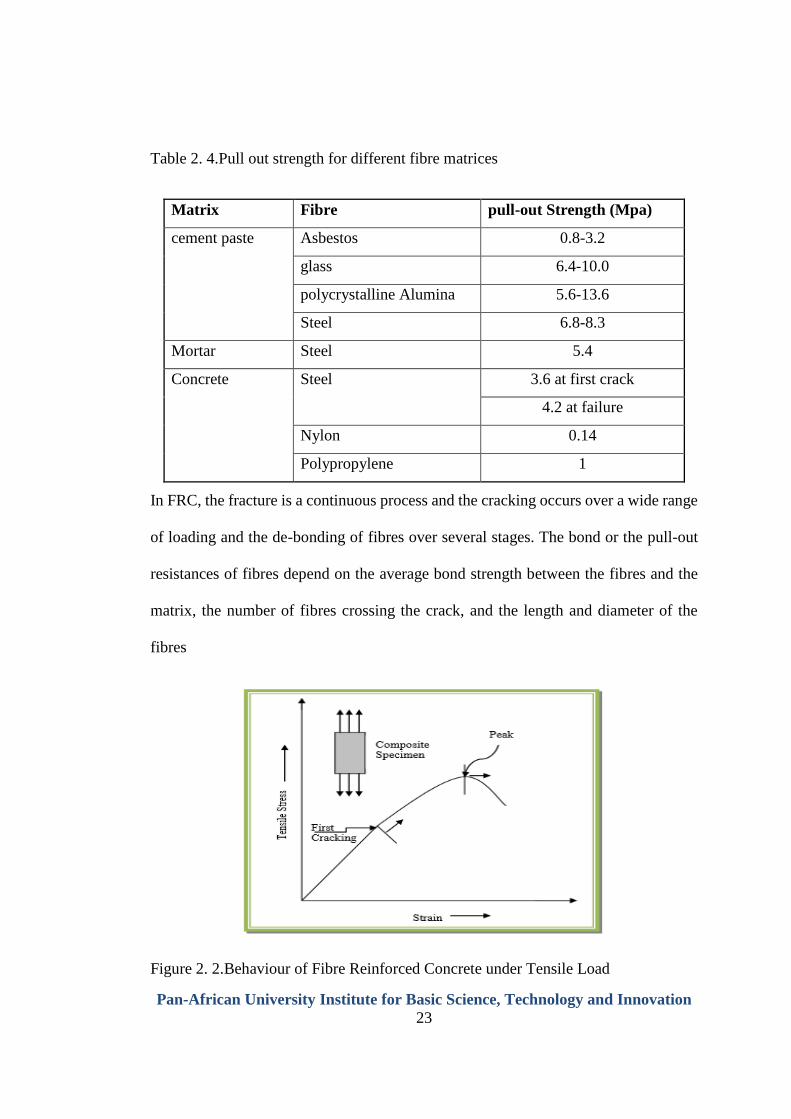
The tensile cracking strain of cement matrix (less than 1/50) is very much lower than
the yield or ultimate strain of steel fibres, as a result, when a fibre reinforced composite
is loaded, the matrix will crack long before the fibres can be fractured. Once the matrix
is cracked the composite continues to carry increasing tensile stress as can be seen on
figure 2.2.; when the peak stress and strain of the composite are greater than those of
the matrix alone and during the inelastic range between first cracking and the peak,
multiple cracking of matrix occurs. Until the initial cracking of the matrix, it is
reasonable to assume that both the fibres and the matrix behave elastically and there is
no slippage between the fibres and the matrix. After the first cracking of the matrix,
the composite will carry increasing loads only if the pull-out resistance of fibres at the
first crack is greater than the load at first cracking, since in the post cracking stage, the
failure of the composite is generally by fibre-pull-out rather than fibre-yielding or
fracture. Table 2.3 shows typical pull-out strengths for a number of different fibres in
various matrices ( Gupa R.K, 2006)
Pan-African University Institute for Basic Science, Technology and Innovation
23
Table 2. 4.Pull out strength for different fibre matrices
Matrix Fibre pull-out Strength (Mpa)
cement paste Asbestos 0.8-3.2
glass 6.4-10.0
polycrystalline Alumina 5.6-13.6
Steel 6.8-8.3
Mortar Steel 5.4
Concrete Steel 3.6 at first crack
4.2 at failure
Nylon 0.14
Polypropylene 1
In FRC, the fracture is a continuous process and the cracking occurs over a wide range
of loading and the de-bonding of fibres over several stages. The bond or the pull-out
resistances of fibres depend on the average bond strength between the fibres and the
matrix, the number of fibres crossing the crack, and the length and diameter of the
fibres
Figure 2. 2.Behaviour of Fibre Reinforced Concrete under Tensile Load
Pan-African University Institute for Basic Science, Technology and Innovation
24
2.3.4. Properties of fibre reinforced concrete
a. Strength
It cannot be emphasized too strongly that, at the fibre volumes used in normal
commercial application, the role of fibre is not to increase strength, though modest
strength increases may occur. If what is desired is a strength increase, it is clearly much
easier (and much cheaper) simply to redesign the plain concrete mix, primarily by
reducing the w/c ratio. Similarly, fibres have no significant effects on either the shear
strength or the torsional strength of concrete. They also have no particularity on the
elastic modulus (Sidney Mindess, 2003)
b. Toughness
The principal role of the fibres is to bridge across the cracks that develop in concrete
as it is loaded (or as it dries). If the fibre has sufficient strength and stiffness, and if
they can achieve sufficient bond with the matrix, they will tend to keep the crack
widths small and will permit the FRC to withstand significant stresses over a relatively
large strain capacity in the post-cracking “ductility.” In other words, they increase the
toughness of the FRC (Sidney Mindess, 2003)
c. Impact resistance
The impact resistance of plain concrete, which is quite low, can be increased
dramatically (by more than an order of magnitude) by the addition of fibres. Steel and
carbon fibres are more effective in this regard than synthetic fibres, but all types of
fibres increase both the fracture energy and generally the peak loads under impact.
Related to impact resistance, it is generally found that fibre additions also improve
Pan-African University Institute for Basic Science, Technology and Innovation
25
both the abrasion resistance and the resistance of concrete to cavitation damage
(Sidney Mindess, 2003)
d. Fatigue
The flexural fatigue strength of plain concrete (out to 2 million cycles of loading) is
about 55% of the static strength, for all types of loading. A properly designed FRC,
however, will display fatigue strengths of from 65% to 90% of the static load. This
improvement is due largely to the effectiveness of the fibres in “tying” the cracks
together, and thus inhibiting crack extension during the loading cycle (Sidney Mindess,
2003)
e. Creep and shrinkage
Up to fibre volumes of about 1%, fibre additions have little or no effect on either the
creep characteristics or the drying shrinkage of concrete, though they tend to reduce
the crack widths significantly during shrinkage. However, fibres can be very effective
in reducing the plastic shrinkage. Indeed, this is one of the principal uses of
polypropylene fibres in modern FRC technology (Sidney Mindess, 2003)
f. Durability
Durability is as important as strength in determining the suitability of concrete for any
specific application. Generally, durable concrete should be dense and impermeable. It
has been found that well-made FRCs are slightly less permeable than plain concrete,
though the decrease is not large enough to have a significant effect on the overall
durability of the concrete. Synthetic fibres are not subject to corrosion. Steel fibres
Pan-African University Institute for Basic Science, Technology and Innovation
26
may, of course, rust. However, it has been found that for good quality FRC, this rusting
is confined to the “skin” of the concrete; fibres in the interior of the concrete are
protected by the alkaline environment. Thus, even with steel fibres, corrosion leads
only to cosmetic effects. If this is a problem in a specific application, stainless steel
may be used though at a considerable increase in cost.
Ordinary E-glass will be attacked by the alkaline environment, and even FRC made
with alkali-resistant glass show some degradation in properties of over time. Natural
organic fibres are likely to suffer from alkaline, bacterial, or fungus degradation and
require special treatment if they are to be used widely in FRC (Sidney Mindess, 2003)
(ACI 544.1R, 1996)
2.3.5. Factors affecting properties of fibre reinforced concrete
Fibre reinforced concrete is the composite material containing fibres in the cement
matrix in an orderly manner or randomly distributed manner. Its properties would
obviously, depend upon the efficient transfer of stress between matrix and the fibres,
which is largely dependent on the type of fibre, fibre geometry, fibre content,
orientation and distribution of the fibres, mixing and compaction techniques of
concrete, and size and shape of the aggregate. These factors are briefly discussed in
the following sections.
a. Relative fibre matrix stiffness
Pan-African University Institute for Basic Science, Technology and Innovation
27
The modulus of elasticity of matrix in most cases is lower than that of fibre for efficient
stress transfer. Low modulus of fibres such as nylons and polypropylene are, therefore,
unlikely to give strength improvement, but they help in the absorption of large energy
and, therefore, impart greater degree of toughness and resistance to impact. High
modulus fibres such as steel, glass and carbon impart strength and stiffness to the
composite. Interfacial bond between the matrix and the fibres also determine the
effectiveness of stress transfer, from the matrix to the fibre. A good bond is essential
for improving tensile strength of the composite. The interfacial bond could be
improved by larger area of contact, improving the frictional properties and degree of
gripping and by treating the steel fibres with sodium hydroxide or acetone (Sidney
Mindess, 2003)
b. Volume of fibres
The strength of the composite largely depends on the quantity of fibres used in it.
Increases in volume of Fibres resulted in increase in toughness and strength. It has
been reported that the use of higher percentage of fibres is likely to cause segregation
and harshness of concrete and mortar.
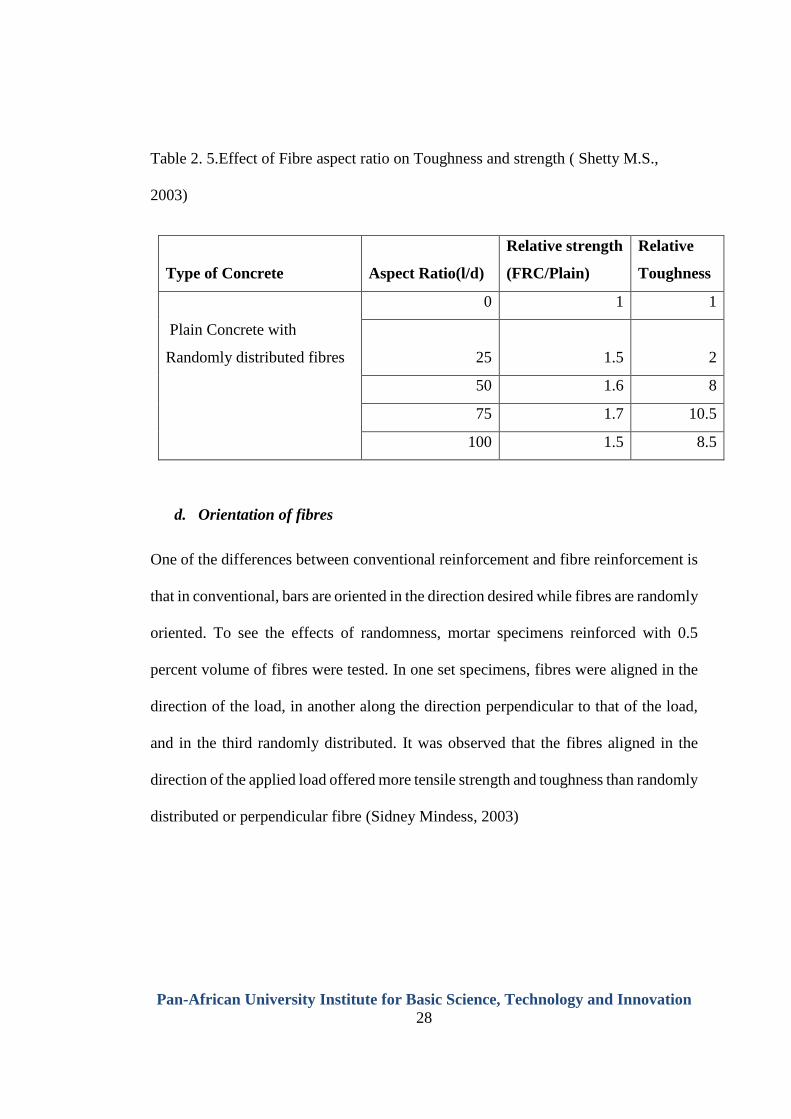
c. Aspect ratio of the fibre
Another important factor which influences the properties and behaviour of the
composite is the aspect ratio of the fibre. It has been reported that up to an aspect ratio
of 75, increase in the aspect ratio increases the ultimate strength of the concrete
linearly. Beyond 75, relative strength and toughness is reduced. Table 2.4 indicates the
effects of aspect ratio on strength and toughness of FRC (Sidney Mindess, 2003)
Pan-African University Institute for Basic Science, Technology and Innovation
28
Table 2. 5.Effect of Fibre aspect ratio on Toughness and strength ( Shetty M.S.,
2003)
Type of Concrete Aspect Ratio(l/d)
Relative strength
(FRC/Plain)
Relative
Toughness
0 1 1
Plain Concrete with
Randomly distributed fibres 25 1.5 2
50 1.6 8
75 1.7 10.5
100 1.5 8.5
d. Orientation of fibres
One of the differences between conventional reinforcement and fibre reinforcement is
that in conventional, bars are oriented in the direction desired while fibres are randomly
oriented. To see the effects of randomness, mortar specimens reinforced with 0.5
percent volume of fibres were tested. In one set specimens, fibres were aligned in the
direction of the load, in another along the direction perpendicular to that of the load,
and in the third randomly distributed. It was observed that the fibres aligned in the
direction of the applied load offered more tensile strength and toughness than randomly
distributed or perpendicular fibre (Sidney Mindess, 2003)
Pan-African University Institute for Basic Science, Technology and Innovation
29
e. Mixing
Mixing of fibre reinforced concrete needs careful conditions to avoid balling of fibres,
segregation, and in general the difficulty of mixing the materials uniformly. Increase
in the aspect ratio, volume percentage and size and quantity of coarse aggregate
intensify the difficulties and balling tendencies. A steel fibre content more than 2
percent by volume and an aspect ratio of more than 100 are difficult to mix. It is
important that the fibres are dispersed uniformly throughout the mix. This can be done
by the addition of fibres before the water is added. When mixing in a laboratory mixer,
introducing the fibres through a wire mesh basket will help even distribution of fibres.
For field use, other suitable methods shall be adopted.
f. Workability and composition of concrete
The use of fibre reinforced concrete (FRC) has passed from experimental small-scale
applications to routine factory and field applications involving the placement of many
hundreds of thousands of cubic meters annually throughout the world. This has created
a need to review existing test methods and develop new methods, where necessary, for
determining the properties of FRC
2.3.6. Measurement of properties of fibre reinforced concrete
Measurement of properties of FRC is very important for practice as well as for research
purpose. Some of these properties are largely matrix dependent and can be measured
using methods originally developed for conventional concrete. On the other hand,
some properties of FRC, like crack control and impact resistance, are quite different
from those of conventional concrete and the effects of fibre inclusion are observed
Pan-African University Institute for Basic Science, Technology and Innovation
30
primarily on these properties. Thus, test methods specifically developed for FRC
should be used to evaluate these properties. Some of these test methods are well
established and are in the form of standard tests while some are still in development.
Since later in the experimental programs measuring the toughness and the impact
resistance is the major task, this section gives an overview of the common test methods
used to evaluate the toughness and impact resistance of FRC, however detailed
information on testing procedures is not provided as it can be found in the references
cited (Sidney Mindess, 2003)
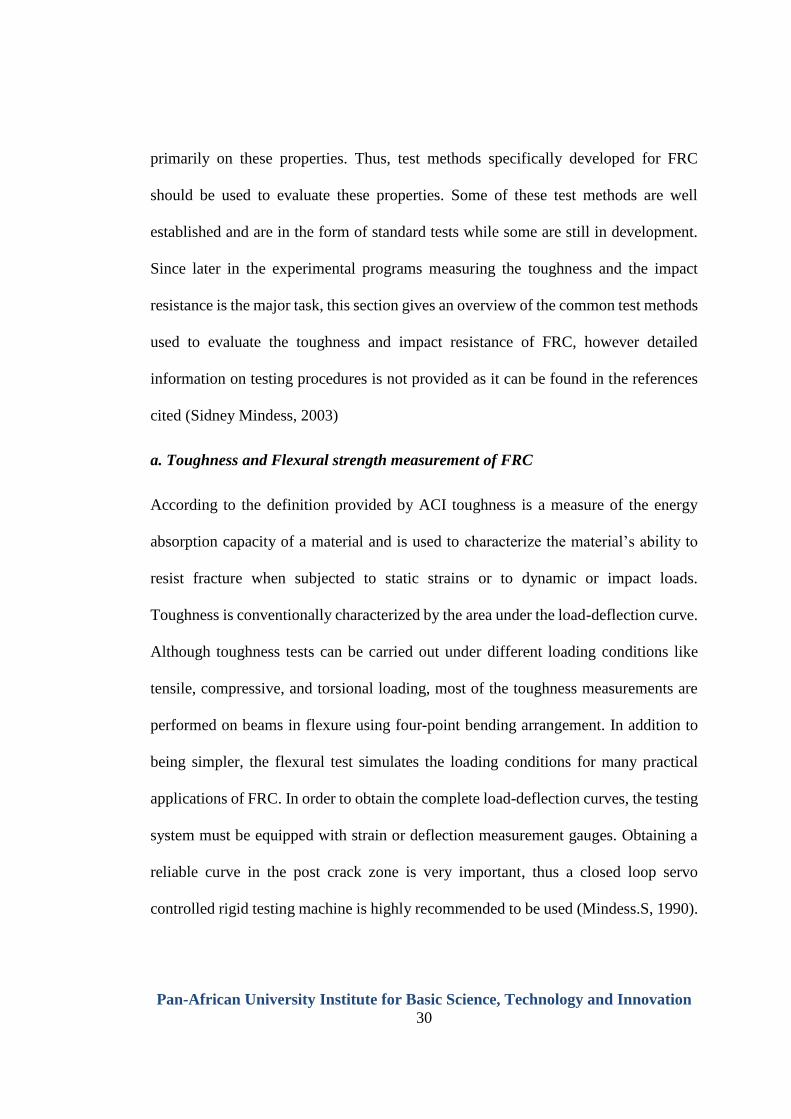
a. Toughness and Flexural strength measurement of FRC
According to the definition provided by ACI toughness is a measure of the energy
absorption capacity of a material and is used to characterize the material’s ability to
resist fracture when subjected to static strains or to dynamic or impact loads.
Toughness is conventionally characterized by the area under the load-deflection curve.
Although toughness tests can be carried out under different loading conditions like
tensile, compressive, and torsional loading, most of the toughness measurements are
performed on beams in flexure using four-point bending arrangement. In addition to
being simpler, the flexural test simulates the loading conditions for many practical
applications of FRC. In order to obtain the complete load-deflection curves, the testing
system must be equipped with strain or deflection measurement gauges. Obtaining a
reliable curve in the post crack zone is very important, thus a closed loop servo
controlled rigid testing machine is highly recommended to be used (Mindess.S, 1990).
Pan-African University Institute for Basic Science, Technology and Innovation
31
Various attempts have been made to quantify load-deflection curves in terms of a
parameter, which would be useful for comparison between different fibres and fibre
contents. An advantageous approach for quantification of load-deflection curves is
using a unitless value termed as the toughness index. The practical application of this
approach began with the introduction of ACI 544 toughness index, which is defined as
the ratio of the amount of energy required to deflect a FRC beam by a prescribed
amount to the energy required to bring the beam to the point of first crack, see Fig. 2.3.
Similar notions were used in the development of the ASTM C 1018 standard. On the
other hand, another commonly used method was developed by Japan Society of Civil
Engineers, which yields absolute toughness. The toughness factor suggested in JSCE
SF-4 standard is an indicator of the average flexural strength. All these test methods
are based on evaluation of the recorded load versus mid-span deflection curve for a
four-point bending test (JSCE) (ACI 544.1R, 1996)
Figure 2. 3.Toughness and Flexural strength measurement of FRC
Pan-African University Institute for Basic Science, Technology and Innovation
32
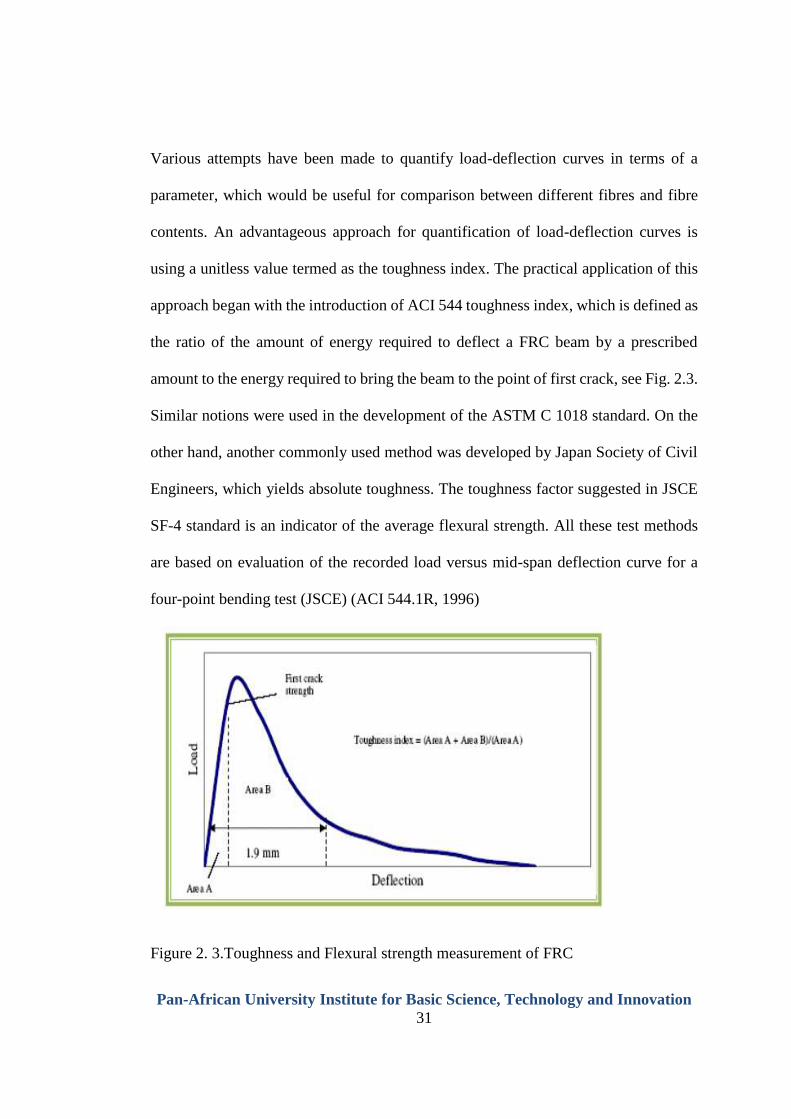
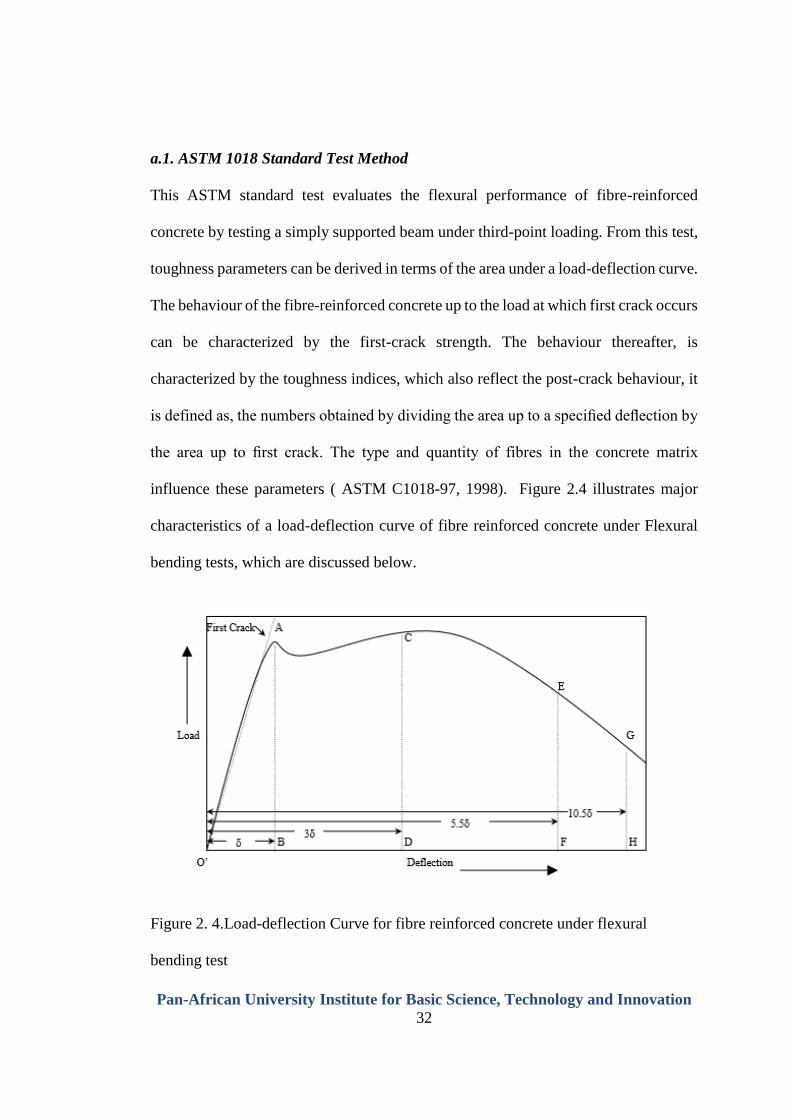
a.1. ASTM 1018 Standard Test Method
This ASTM standard test evaluates the flexural performance of fibre-reinforced
concrete by testing a simply supported beam under third-point loading. From this test,
toughness parameters can be derived in terms of the area under a load-deflection curve.
The behaviour of the fibre-reinforced concrete up to the load at which first crack occurs
can be characterized by the first-crack strength. The behaviour thereafter, is
characterized by the toughness indices, which also reflect the post-crack behaviour, it
is defined as, the numbers obtained by dividing the area up to a specified deflection by
the area up to first crack. The type and quantity of fibres in the concrete matrix
influence these parameters ( ASTM C1018-97, 1998). Figure 2.4 illustrates major
characteristics of a load-deflection curve of fibre reinforced concrete under Flexural
bending tests, which are discussed below.
Figure 2. 4.Load-deflection Curve for fibre reinforced concrete under flexural
bending test
Pan-African University Institute for Basic Science, Technology and Innovation
33
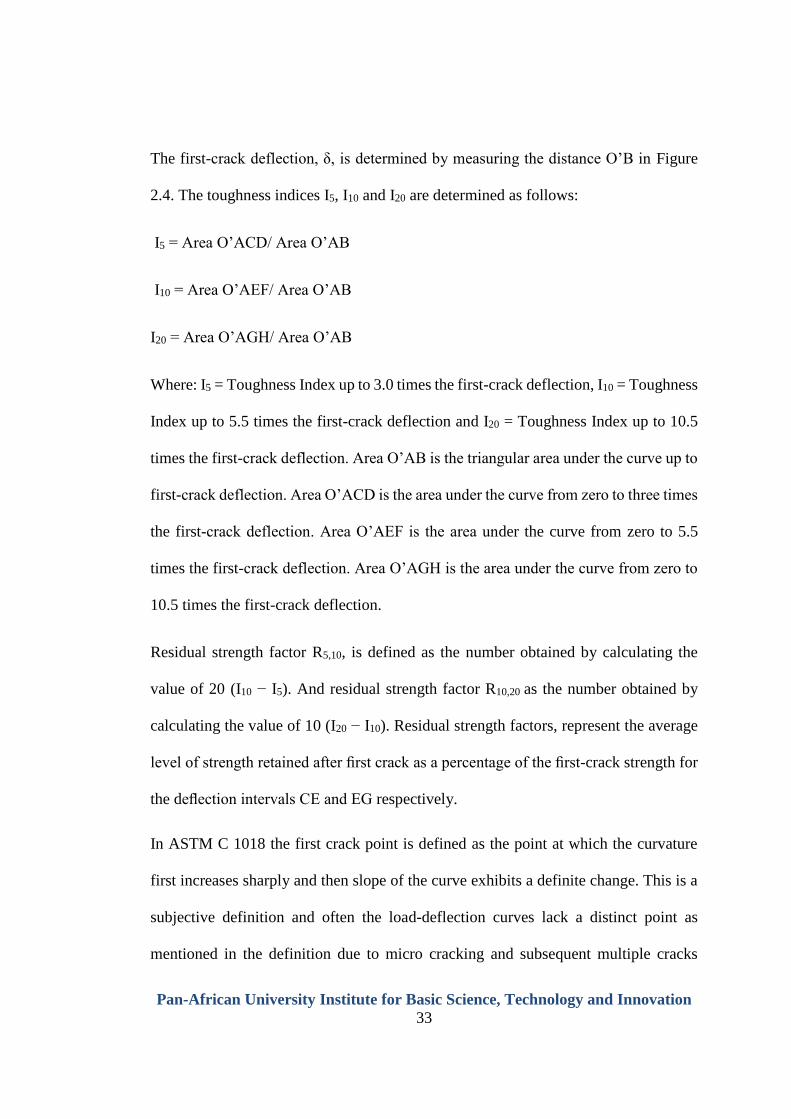
The first-crack deflection, δ, is determined by measuring the distance O’B in Figure
2.4. The toughness indices I5, I10 and I20 are determined as follows:
I5 = Area O’ACD/ Area O’AB
I10 = Area O’AEF/ Area O’AB
I20 = Area O’AGH/ Area O’AB
Where: I5 = Toughness Index up to 3.0 times the first-crack deflection, I10 = Toughness
Index up to 5.5 times the first-crack deflection and I20 = Toughness Index up to 10.5
times the first-crack deflection. Area O’AB is the triangular area under the curve up to
first-crack deflection. Area O’ACD is the area under the curve from zero to three times
the first-crack deflection. Area O’AEF is the area under the curve from zero to 5.5
times the first-crack deflection. Area O’AGH is the area under the curve from zero to
10.5 times the first-crack deflection.
Residual strength factor R5,10, is defined as the number obtained by calculating the
value of 20 (I10 − I5). And residual strength factor R10,20 as the number obtained by
calculating the value of 10 (I20 − I10). Residual strength factors, represent the average
level of strength retained after first crack as a percentage of the first-crack strength for
the deflection intervals CE and EG respectively.
In ASTM C 1018 the first crack point is defined as the point at which the curvature
first increases sharply and then slope of the curve exhibits a definite change. This is a
subjective definition and often the load-deflection curves lack a distinct point as
mentioned in the definition due to micro cracking and subsequent multiple cracks
Pan-African University Institute for Basic Science, Technology and Innovation
34
before the peak load is reached. There is a need for an objective definition of first crack
so that determination of first crack point is not affected by whom the test is performed
and evaluated (ACI 544.1R, 1996) (ASTM, 2004)
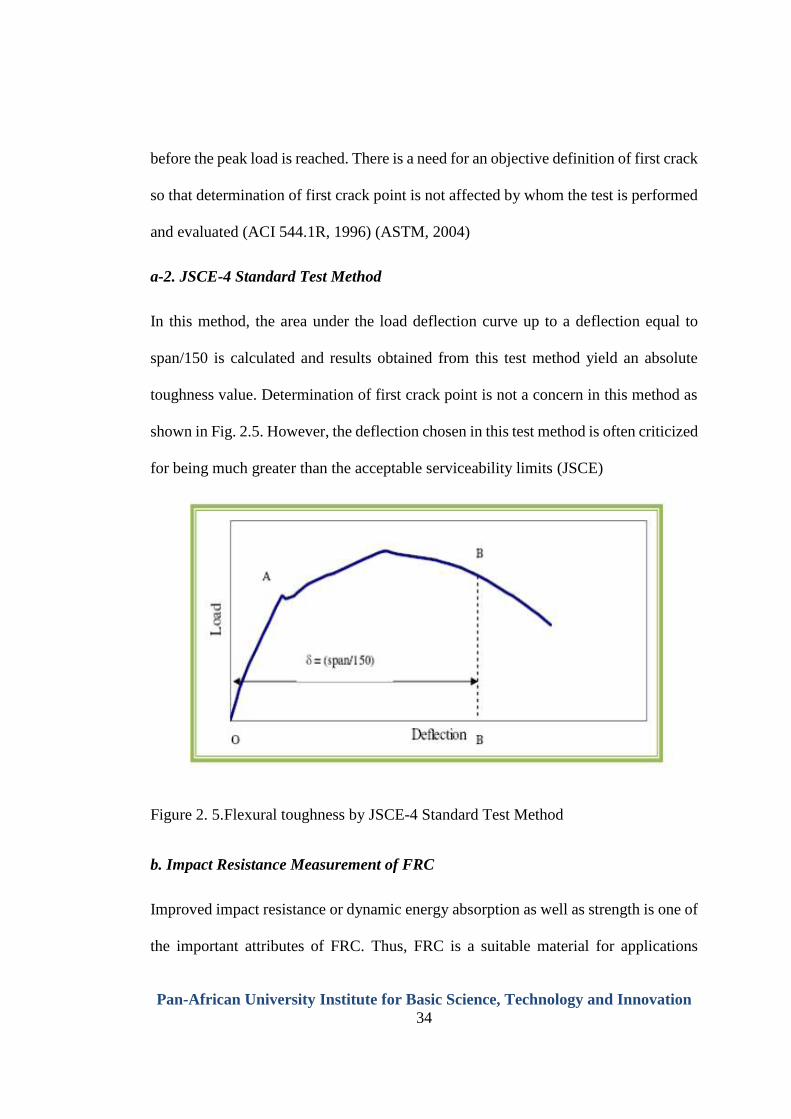
a-2. JSCE-4 Standard Test Method
In this method, the area under the load deflection curve up to a deflection equal to
span/150 is calculated and results obtained from this test method yield an absolute
toughness value. Determination of first crack point is not a concern in this method as
shown in Fig. 2.5. However, the deflection chosen in this test method is often criticized
for being much greater than the acceptable serviceability limits (JSCE)
Figure 2. 5.Flexural toughness by JSCE-4 Standard Test Method
b. Impact Resistance Measurement of FRC
Improved impact resistance or dynamic energy absorption as well as strength is one of
the important attributes of FRC. Thus, FRC is a suitable material for applications
Pan-African University Institute for Basic Science, Technology and Innovation
35
where dynamic loading conditions such as impact loadings are present. Impact
resistance of FRC can be measured by using a number of different test methods
described by ACI committee, which can be broadly listed as follows: Repeated drop
weight test, instrumented impact test, and projectile impact test.
Conventionally, the resistance of material is characterized by a measure of one of the
following criteria: the number of blows in a repeated impact test to achieve a specified
distress level, energy needed to fracture the specimen, and the size of damage,
measured using crater size, perforation, or scab (Mindess.S, 1990)
Results from such tests are useful for ascertaining the relative merits of the different
mixtures as well as for providing answers to specific practical problems. However,
they depend on the specimen geometry, test system compliance, loading configuration,
loading rate, and the prescribed failure criterion. Additional information about the
behaviour of FRC under impact loading can be obtained by performing instrumented
and projectile impact tests. In this manner load-deflection histories and magnitude of
the ultimate strength can be determined. However, these test methods require the use
of highly sophisticated measuring devices, which are rarely available (ACI 544.1R,
1996).To this effect only the simplest of the conventional tests, that is, the repeated
drop weight test is discussed in the next subsection.
b-1. Reaped Drop Weight Test
This is the simplest test for evaluating impact resistance proposed by ACI Committee
544. This test method does not yield quantitative results; rather the test is designed to
obtain the relative Performance of plain concrete and FRC containing different types
Pan-African University Institute for Basic Science, Technology and Innovation
36
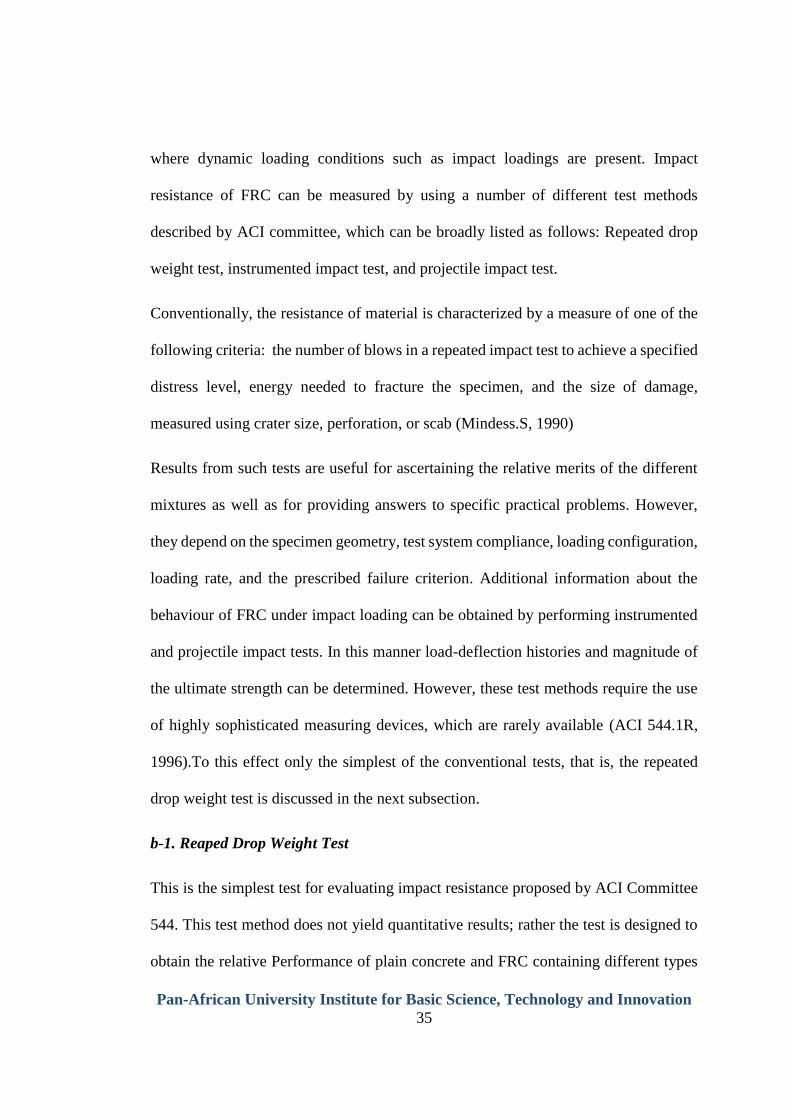
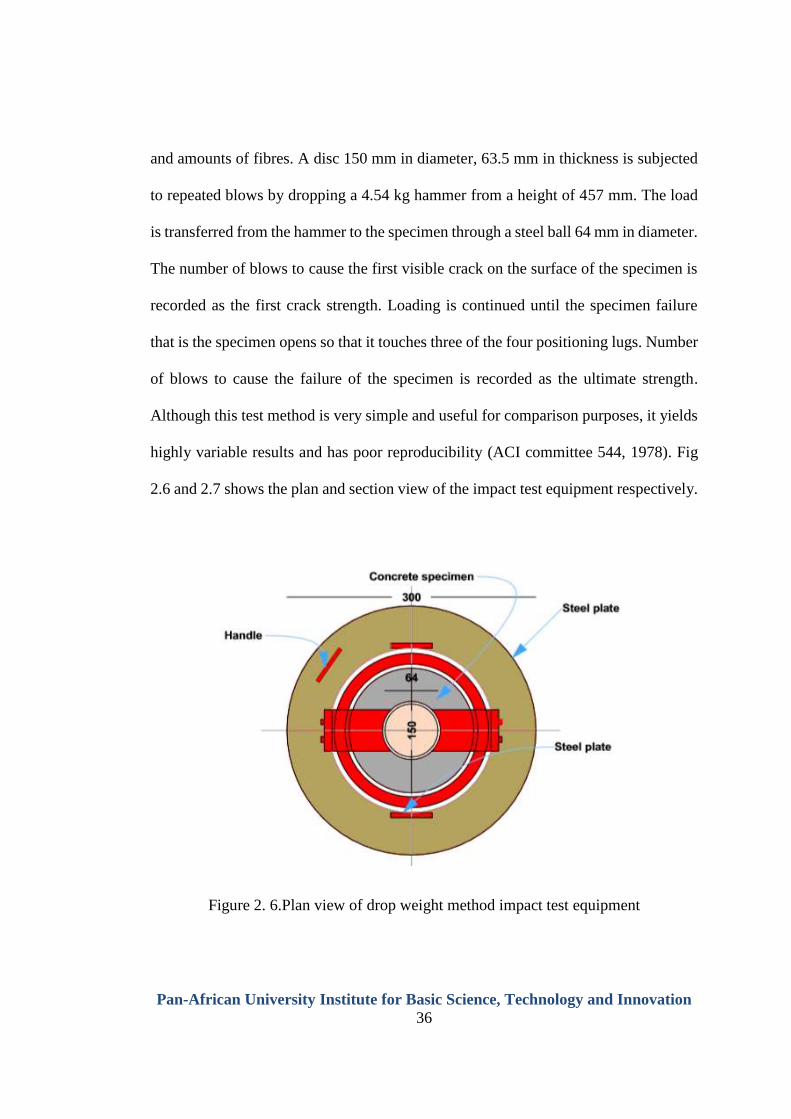
and amounts of fibres. A disc 150 mm in diameter, 63.5 mm in thickness is subjected
to repeated blows by dropping a 4.54 kg hammer from a height of 457 mm. The load
is transferred from the hammer to the specimen through a steel ball 64 mm in diameter.
The number of blows to cause the first visible crack on the surface of the specimen is
recorded as the first crack strength. Loading is continued until the specimen failure
that is the specimen opens so that it touches three of the four positioning lugs. Number
of blows to cause the failure of the specimen is recorded as the ultimate strength.
Although this test method is very simple and useful for comparison purposes, it yields
highly variable results and has poor reproducibility (ACI committee 544, 1978). Fig
2.6 and 2.7 shows the plan and section view of the impact test equipment respectively.
Figure 2. 6.Plan view of drop weight method impact test equipment
Pan-African University Institute for Basic Science, Technology and Innovation
37
Figure 2. 7.Section view of drop weight method impact test equipment
2.3.7. Advantages and Disadvantages of Fibre reinforced concrete
It was reported that the addition of fibres in concrete matrix enhance substantially
many of the engineering properties of the concrete, such as Impact Strength, toughness,
Ductility, Flexural strength, fatigue endurance, deformation Characteristic, tensile
strength, and ability to resist cracking and spalling. However, fibres have no significant
effect on the compressive, shear and torsional strength, elastic modulus and creep
characteristics which leads to saving in Time, cost and materials. The extent of
improvement in reinforced concrete properties will vary based on the concrete matrix
strength characteristics, Types, quantity and orientation of fibres, mixing, compaction
and maximum aggregate size. Measurement of properties of FRC is very essential. As
some of the properties are matrix dependent, they can be measured using test methods
originally developed for conventional concrete. Despite of Excellent mechanical
Pan-African University Institute for Basic Science, Technology and Innovation
38
properties and physical properties of Fibre reinforced concrete, it has some drawbacks.
On SFRC, it was reported that, loose fibres at hardened surface, might be blown into
aircraft engines or tyres, which leads to unsafe operations. Injury also to personnel
being cut by an exposed fibre while working on concrete surface can possibly happen.
(Elasaigh W.A., 2001) (Nasiri, 2009)
2.4.Steel fibre reinforced concrete
2.4.1. Generalization
American concrete institution (ACI 544.IR, 1996) defines SFs as discrete, short lengths
of steel having aspect ratio (ratio of length to diameter) in the range of 20 to 100 with
any of the several cross-sections which are sufficiently small to be easily and randomly
dispersed in fresh concrete mix using conventional mixing procedures. To enhance the
workability and stability of SFRC, superplasticizers (chemical admixtures) may also
be added into the concrete mix.
The behaviour of SFRC can be classified into three groups according to its application,
fibre volume percentage and fibre effectiveness; for instance, SFRC is classified based
on its fibre volume percentage as follows: 1-Very low volume fraction of SF (less than
1% per volume of concrete), which has been used for many years to control plastic
shrinkage and as pavement reinforcement. 2-Moderate volume fraction of SFs (l% to
2% per volume of concrete) which can improve modulus of rupture (MOR), flexural
toughness, impact resistance and other desirable mechanical properties of concrete. 3-
High volume fraction of SFs (more than 2% per volume of concrete) used for special
Pan-African University Institute for Basic Science, Technology and Innovation
39
applications such as impact and blast resistance structure; these include SIFCON
(Slurry Infiltrated Fibre Concrete), SIMCON (Slurry Infiltrated Mat Concrete
In most cases, SFs may act as secondary reinforcement used along with conventional
steel bars or pre-stressing strands as the main reinforcement. In the class of high
volume fraction of SFs (more than 2% per volume of concrete), the SFs have excellent
mechanical properties and can be used without other continuous reinforcement;
however, these composite materials are often suited for highly specialized applications
due to the limitations associated with processing and cost (ACI 544.1R, 1996)
2.4.2. Fundamental of steel fibres
a. Types of steel fibres
Steel fibres are produced in number of ways. Round, straight steel fibres are produced
by cutting or chopping wire, typically wire having a diameter between 0.25 to 1.00
mm. Flat, straight steel fibres having typical cross sections ranging from 0.15 to 0.64
mm thickness by 0.25 to 2.03 mm width are produced by shearing sheet or flattening
wire (Fig 2.8a). Crimped and deformed steel fibres have been produced with both full-
length crimping (Fig. 2.8b) or bent or enlarged at the ends only (Fig. 2.8c, d). Some
fibres have been deformed by bending or flattening to increase mechanical bonding.
Some fibres have been collated into bundles to facilitate handling and mixing. During
mixing, the bundles separate into individual fibres (Fig. 2.8c). Fibres are also produced
from cold drawn wire that has been shaved down to make steel wool. The remaining
wires have a circular segment cross-section and may be crimped to produce deformed
fibres. There are also available steel fibres made by a machining process that produces
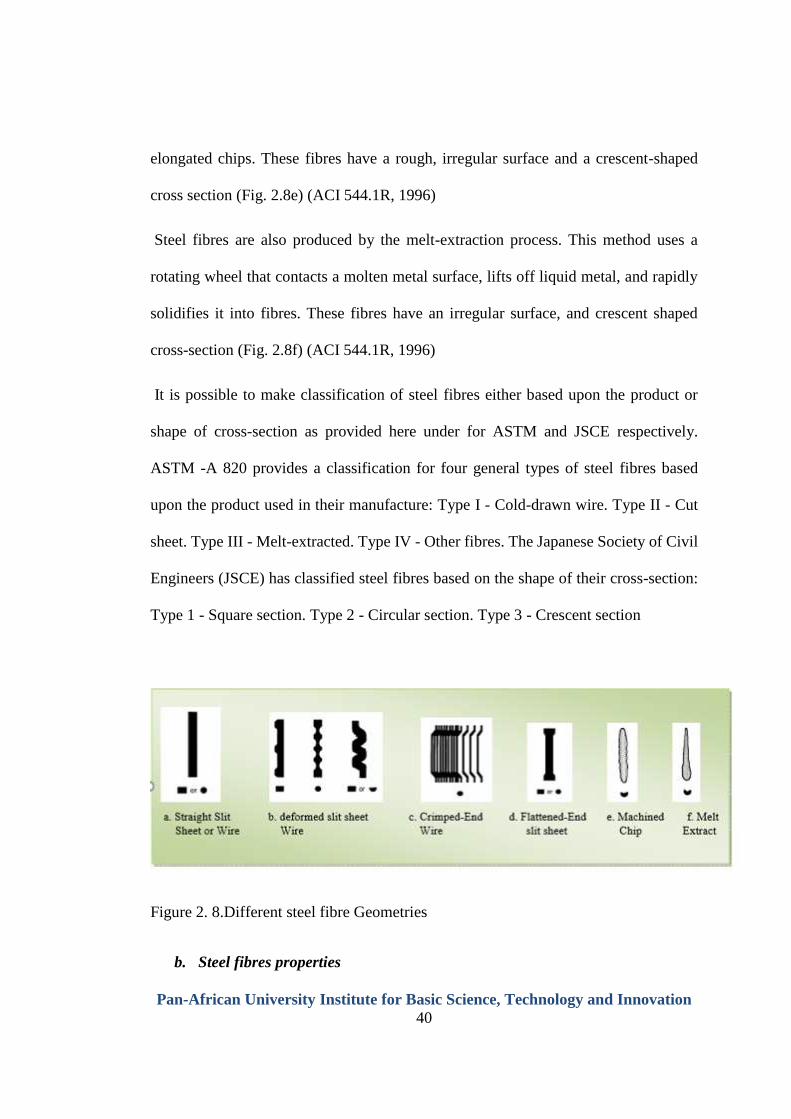
Pan-African University Institute for Basic Science, Technology and Innovation
40
elongated chips. These fibres have a rough, irregular surface and a crescent-shaped
cross section (Fig. 2.8e) (ACI 544.1R, 1996)
Steel fibres are also produced by the melt-extraction process. This method uses a
rotating wheel that contacts a molten metal surface, lifts off liquid metal, and rapidly
solidifies it into fibres. These fibres have an irregular surface, and crescent shaped
cross-section (Fig. 2.8f) (ACI 544.1R, 1996)
It is possible to make classification of steel fibres either based upon the product or
shape of cross-section as provided here under for ASTM and JSCE respectively.
ASTM -A 820 provides a classification for four general types of steel fibres based
upon the product used in their manufacture: Type I - Cold-drawn wire. Type II - Cut
sheet. Type III - Melt-extracted. Type IV - Other fibres. The Japanese Society of Civil
Engineers (JSCE) has classified steel fibres based on the shape of their cross-section:
Type 1 - Square section. Type 2 - Circular section. Type 3 - Crescent section
Figure 2. 8.Different steel fibre Geometries
b. Steel fibres properties
Pan-African University Institute for Basic Science, Technology and Innovation
41
The composition of steel fibres generally includes carbon steel (or low carbon steel,
sometimes with alloying constituents), or stainless steel. Different applications may
require different fibre compositions. The fibre strength, stiffness, and the ability of the
fibres to bond with the concrete are important fibre reinforcement properties. Bond is
dependent on the aspect ratio of the fibre. Typical aspect ratios range from about 20 to
100, while length dimensions range from 6.4 to 76 mm
2.4.3. Mix Design for Steel Fibre Reinforced Concrete
By making certain adjustments to conventional concrete practice, it is possible to
produce SFRC. The primary concern is to introduce sufficient amount of uniformly
distributed fibres in concrete to achieve improvements in mechanical properties,
keeping the concrete workable to permit proper mixing, placing, and finishing.
Compared to conventional concrete, some SFRC mixtures are characterized by higher
cement content, higher fine aggregate content, and decreasing slump with increasing
fibre content. There are various procedures for proportioning of SFRC mixtures
proposed by different researches. To provide better workability of concrete, amount of
paste in the mixture should be increased. This requires higher cement content or
moving the ratio of fine aggregates to coarse aggregates upwards. Alternatively,
pozzolanic admixtures can be used to replace cement. The use of superplasticizers
enhances the workability of the concrete however it does not necessarily provide the
ability to incorporate higher steel fibre content. Regardless of the mix design, in all
cases trial mixes should be prepared to ensure workability and strength properties (ACI
Committee-544)
Pan-African University Institute for Basic Science, Technology and Innovation
42
2.4.4. Properties of Freshly Mixed SFRC
The properties of SFRC in its freshly mixed state are influenced by the aspect ratio of
the fibre, fibre geometry, its volume fraction, Duration of mixing, aggregate size, shape
and roughness, the matrix proportions, and the fibre-matrix interfacial bond
characteristics. For conventionally placed SFRC applications, adequate workability
should be insured to allow placement, consolidation, and finishing with a minimum of
effort, while providing uniform fibre distribution and minimum segregation and
bleeding. For a given mixture, the degree of consolidation influences the strength and
other hardened material properties, as it does for plain concrete.
SFRC may be very stiff in fresh state, however may respond very well to vibration.
The performance of the hardened concrete is enhanced more, as more fibres with a
greater aspect ratio are included in concrete. This is due to the improved fibre-matrix
bond. However, a high aspect ratio reduces the workability of fresh concrete. When
shaken together fibres with aspect ratio greater than 100 tend to interlock in a way to
form a mat from which it is very difficult to dislodge by vibration alone. Movement of
fibres may be prevented by coarse aggregates in the matrix, which often are of larger
size than the average fibre spacing if the fibres were uniformly distributed. This leads
to bunching and greater interaction of fibres between the coarse aggregate particles
and the effect becomes more pronounced as the volume and maximum size of the
aggregate increase (Hannat DJ., 1987)
Pan-African University Institute for Basic Science, Technology and Innovation
43
2.4.5. Mechanical properties of Steel Fibre Reinforced Concrete
The crack-arrest and crack-control mechanism of SFs has three major effects on the
behaviour of SFRC structures (Ocean Heidelberg Cement Group, 1999).
The addition of SFs delays the onset of flexural cracking. The tensile strain at the first
crack can be increased as much as 100 percent and the ultimate strain may be as large
as 20 to 50 times that of plain concrete.
The addition of SFs imparts a well-defined post-cracking behaviour to the structure.
The crack arrest property and the consequence increase in ductility impart a greater
energy absorption capacity (higher toughness) to the structure prior to failure.
a. Compressive Strength
Johnston (1974), and Dixon and Mayfield (1971) found that an addition of up to 1.5%
of SFs by volume increases the compressive strength from 0 to 15%. A gradual slope
in the descending part of the stress-strain curves indicates the improved spalling
resistance, ductility and toughness of SFRC
b. Shear Strength
Previous research has shown that addition of SFs substantially increases the shear
strength of concrete (Noghabai, 2000; Oh et al., 1999; Narayanan and Darwish, 1987;
Barr, 1987). The ultimate shear strength of SFRC containing 1 % by volume of SFs
increases up to 170% compared to RC without SFs (Narayanan and Darwish, 1987).
Traditional transverse shear reinforcement can be completely replaced by addition of
SFs as an effective alternative (Noghabai, 2000; Williamson, 1978).
Pan-African University Institute for Basic Science, Technology and Innovation
44
c. Tensile Strength
Addition of 1.5% by volume of SFs can improve the direct tensile strength of concrete
up to 40% (Williamson, 1974). Those SFs aligned in the direction of the tensile stress
contribute to an appreciable increase in the direct tensile strength of concrete as up to
133% for the addition of 6% by weight of smooth, straight SFs. However, for randomly
distributed fibres, the increase in strength is much smaller, ranging from as low as no
increase in some instances to perhaps 60%, with many investigations indicating
intermediate values. Splitting-tension test of SFRC show similar result. Thus, adding
fibres merely to increase the direct tensile strength is probably not worthwhile.
However, as in compression, steel fibres do lead to major increases in the post-cracking
behaviour or toughness.
d. Impact Resistance
The impact resistance of SFRC against dynamic loads due to the dropped weights or
explosives is 8 to 10 times higher than that of the plain concrete. The test results of the
specimens containing high tensile strength, crimped SFs with the diameter of 0.50mm
indicate an improvement in the concrete toughness under impact loading more than
400 percent. An increase in fatigue strength with increasing the percentage of SFs has
also been noticed.
e. Durability
Corrosion in concrete structures due to the cracks is less severe in the SFRC structures
compared to conventional RC ones (Mangat and Gurusamy, 1987; Williamson and
Morse, 1977; Halvorsen et al., 1976; Aufmuth et al., 1974). Schupack (1985) found
Pan-African University Institute for Basic Science, Technology and Innovation
45
that a well-compacted SFRC has a limited corrosion of fibres close to the surface of
the concrete even when concrete is highly saturated with chloride ions. Turatsinze et
al. (2005) conducted a research to investigate the corrosion of SFRC due to the cracks.
Prismatic SFRC specimens with the dimensions of 100*100*500mm containing
hooked SFs with the dimensions of 60 mm in length and 0.8 mm in diameter were
prepared.
Specimens with vertical cracks were exposed to a marine-like environment for one
year. After one year, the prisms were tested in three-point bending setup with the span
of 200 mm and load -deflection curves were plotted and concluded that only those SFs
crossing the crack within a 2 to 3mm rim from the external faces of the specimens
exhibited extensive corrosion. Besides, no SFs corrosion was observed in narrower
parts of the cracks whilst in the wider parts of the cracks a light corrosion of the fibres
with no reduction in their section was observed. Furthermore, no concrete bursting or
sapling was recorded due to the corrosion of the fibres. The measurement of concrete
electrical resistivity can give an indication of concrete durability (Chen and Hwang,
2001; Woodrow 1980).
f. Flexural Strength and Toughness
Hartman (1987) found that the influence of SFs on the flexural strength of concrete is
much greater than its influence on direct tension or compression. Oh et al. (1999)
reported that the flexural strength of SFRC is increased by about 55% with the addition
of 2% of SFs. Hartman (1999) experimented with 12 different SFRC beams produced
by SFs of Dramix RC-65/35-BN type with two different dosages of 60 kg/m3 and 100
Pan-African University Institute for Basic Science, Technology and Innovation
46
kg/m3, and concluded that the ratio of the measured ultimate load to the theoretical
ultimate load turned out to be greater for those SFRC beams having the dosage of 60
kg/m3
2.4.6. Application of steel fibre reinforced concrete
a. Highway and air-field pavements
SFRC can be used in the construction of new pavements or for the repair of existing
pavements using bonded or un-bounded overlays to the beneath slab. It leads to a
higher flexural strength causing a decrease in the pavement’s thickness required.
Besides, the resistance to impact and repeated loading will be increased. The greater
tensile strain capacity of SFRC leads to a drop in the maximum crack widths than in
plain concrete.
b. Hydraulic Structures
The most important advantage of using SFRC in hydraulic structures is the resistance
of SFRC to cavitation or erosion due to the high velocity of water flow compared to
conventional RC.
c. Fibre Shotcrete
Fibre shotcrete are used in rock slope stabilization, tunnel lining and bridge repair. A
thin coating of plain shotcrete applied monolithically on top of the fibre shotcrete,
maybe used to prevent surface staining due to rusting of SFs. The fibre shotcrete can
be used in the protection of steel structures.
d. Refractory Concrete
Pan-African University Institute for Basic Science, Technology and Innovation
47
Steel-fibre reinforced refractory concretes have been reported to be more durable than
their unreinforced counterpart when exposed to high thermal stress, thermal cyclic,
thermal shock or mechanical abuse. The increased service span is probably due to the
combination of crack control, enhanced toughness, spalling and abrasion resistance
imparted by the SFs.
e. Precast Application
SFRC can be used in the construction of precast products such as manhole covers,
concrete pipes, and machine bases and frames. Improved flexural strength and impact
resistance of SFRC may allow the use of these products in rough handling situations.
f. Structural Applications
Addition of SFs into the conventional RC members has several advantages such as the
followings, thereby increasing the use of steel-fibre-added RC (SFARC) structures
compared to conventional RC members.
1. Addition of SFs can provide an increased impact resistance to conventional
RC members, thereby enhancing the resistance to local damage and spalling.
2. Addition of SFs can inhibit crack growth and crack widening; this may allow
the use of high strength steel bars without having excessive crack width or
deformation at service loads.
3. Addition of SFs increases the ductility of conventionally RC members, and
hence, enhances their stability and integrity under earthquake and blast
loadings.
Pan-African University Institute for Basic Science, Technology and Innovation
48
4. Addition of SFs increases the shear strength of RC members. Therefore,
punching shear strength of slabs will be increased and sudden punching failure
can be transformed into a gradual ductile failure (Gambhir, 1995)
2.5.Recycled waste tyre steel cord in concrete
Recycling steel waste tyre-based fibre to be used as mechanical or chemical
constituents is the most environmentally sound way of disposing the waste tyres.
currently tyre steel cord and bead wires are being used in concrete to produce Recycled
tyre steel reinforced concrete which is environmentally and economically sound.
2.5.1. Method of Recovering of waste tyre steel cord
Tyre shredding and the cryogenic process can be used to mechanically recover RSF
from used tyres. In addition, steel fibres can be recovered by utilising anaerobic
thermal degradation, such as conventional pyrolysis and microwave-induced pyrolysis
of tyres. The amount of extracted steel fibres depends mainly on the type of tyre. Tyres
of light vehicles contain up to 15% steel, whereas truck tyres contain up to 25% steel
( Hylands V. , K. N. and Shulman, 2003)
a. Shredding Process
The shredding process reduces tyres into rubber granules and steel fibres through
several cutting and granulating stages. In the first stage of processing, a complete tyre
is chopped or shredded until it is reduced to pieces ranging in size from about 50 to
150 mm. The rubber pieces, which still contain steel, are then fed into a second
shredder that reduces them to smaller pieces. At the end of this stage, magnets are used
to separate the steel from the rubber. Figure 2.10, indicates a typical image of recovered
Pan-African University Institute for Basic Science, Technology and Innovation
49
steel cords by shredding. The rubber is then fed into a knife or hammer mill, where it
is granulated to approximately 1 to 10 mm in size. The number of grinding cycles
depends on the desired size of the rubber granules. During the granulating process,
magnets are used to remove any remaining steel. The steel extracted after the second
stage of shredding and the final stage of grinding differs in quality. The former contains
large pieces of rubber as well as much of the textile wire in long lengths. The cord is
sometimes undamaged, but much of it is deteriorated into individual wires.
b. Cryogenic Process
The cryogenic process involves the cooling of tyres, and their subsequent brittle
fracturing and reduction to rubber, steel, and textile. In a typical cryogenic process, the
used tyres are initially shredded at ambient temperature, and then transferred to a deep-
freezing tunnel system. Inside the first tunnel section, the fragmented tyres are pre-
cooled by a counter-current of gaseous nitrogen at approximately -120°C. The tyre
pieces are then transferred into the main cooling tunnel, where they are cooled down
below their embrittling temperature and, as a result, they become nearly brittle. At the
next stage, the fragmented tyres are granulated through a series of mills, and are
reduced to rubber, steel fibres, and textile. The steel and textile are separated, whereas
the rubber granules are dried, passed through a steel extraction unit, and finally sieved.
c. Pyrolysis Process
Pyrolysis of tyres is the process where tyres are thermally decomposed, in the absence
of oxygen, to their organic and inorganic components. The process generates gases
(hydrogen, methane and other hydrocarbons), oil, and solid residuals of steel and char,
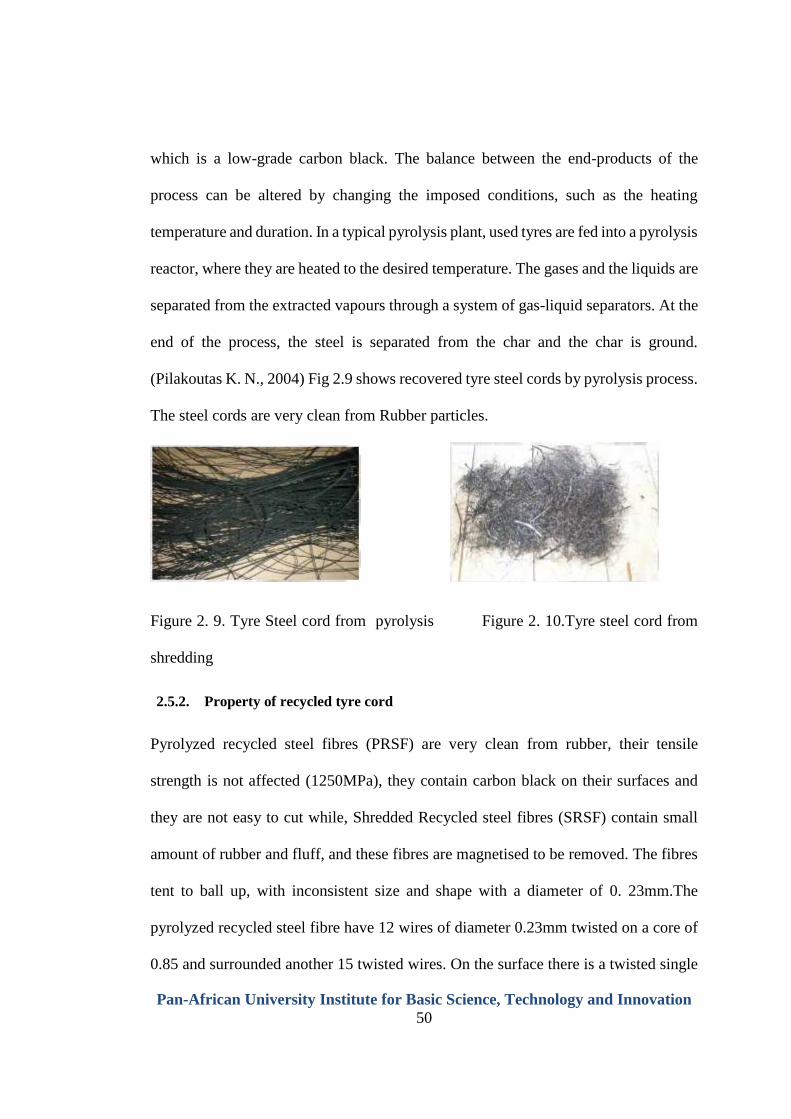
Pan-African University Institute for Basic Science, Technology and Innovation
50
which is a low-grade carbon black. The balance between the end-products of the
process can be altered by changing the imposed conditions, such as the heating
temperature and duration. In a typical pyrolysis plant, used tyres are fed into a pyrolysis
reactor, where they are heated to the desired temperature. The gases and the liquids are
separated from the extracted vapours through a system of gas-liquid separators. At the
end of the process, the steel is separated from the char and the char is ground.
(Pilakoutas K. N., 2004) Fig 2.9 shows recovered tyre steel cords by pyrolysis process.
The steel cords are very clean from Rubber particles.
Figure 2. 9. Tyre Steel cord from pyrolysis Figure 2. 10.Tyre steel cord from
shredding
2.5.2. Property of recycled tyre cord
Pyrolyzed recycled steel fibres (PRSF) are very clean from rubber, their tensile
strength is not affected (1250MPa), they contain carbon black on their surfaces and
they are not easy to cut while, Shredded Recycled steel fibres (SRSF) contain small
amount of rubber and fluff, and these fibres are magnetised to be removed. The fibres
tent to ball up, with inconsistent size and shape with a diameter of 0. 23mm.The
pyrolyzed recycled steel fibre have 12 wires of diameter 0.23mm twisted on a core of
0.85 and surrounded another 15 twisted wires. On the surface there is a twisted single
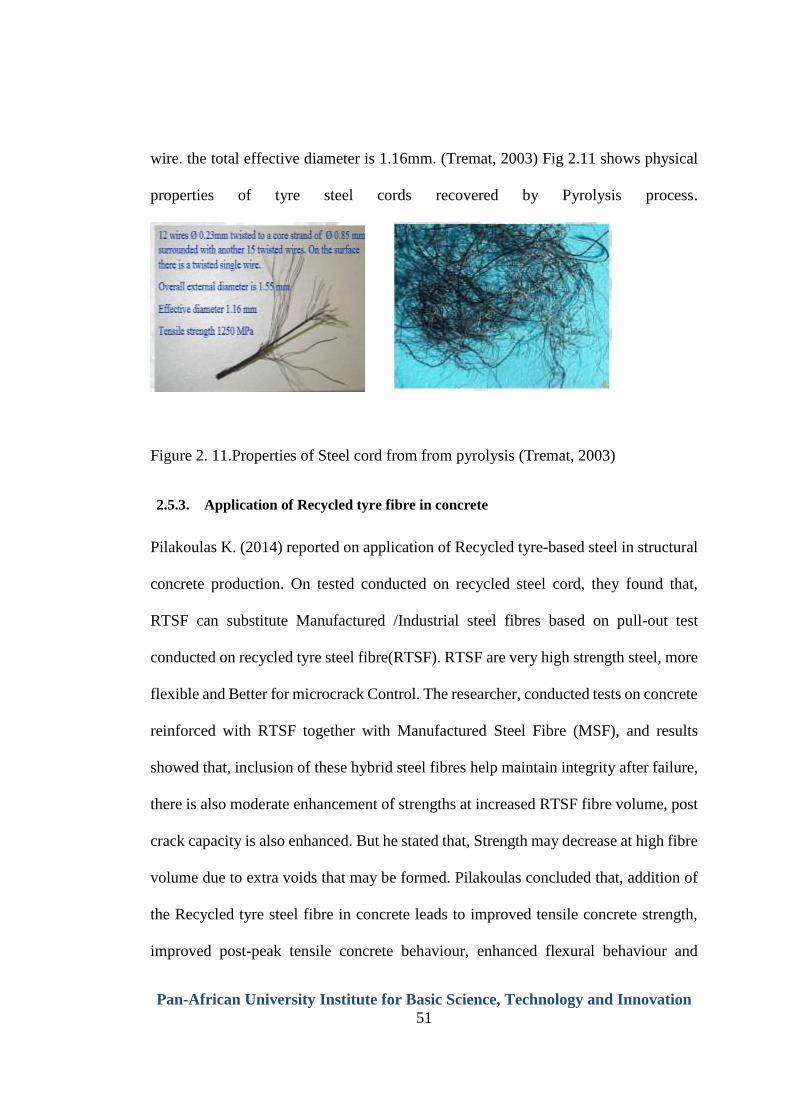
Pan-African University Institute for Basic Science, Technology and Innovation
51
wire. the total effective diameter is 1.16mm. (Tremat, 2003) Fig 2.11 shows physical
properties of tyre steel cords recovered by Pyrolysis process.
Figure 2. 11.Properties of Steel cord from from pyrolysis (Tremat, 2003)
2.5.3. Application of Recycled tyre fibre in concrete
Pilakoulas K. (2014) reported on application of Recycled tyre-based steel in structural
concrete production. On tested conducted on recycled steel cord, they found that,
RTSF can substitute Manufactured /Industrial steel fibres based on pull-out test
conducted on recycled tyre steel fibre(RTSF). RTSF are very high strength steel, more
flexible and Better for microcrack Control. The researcher, conducted tests on concrete
reinforced with RTSF together with Manufactured Steel Fibre (MSF), and results
showed that, inclusion of these hybrid steel fibres help maintain integrity after failure,
there is also moderate enhancement of strengths at increased RTSF fibre volume, post
crack capacity is also enhanced. But he stated that, Strength may decrease at high fibre
volume due to extra voids that may be formed. Pilakoulas concluded that, addition of
the Recycled tyre steel fibre in concrete leads to improved tensile concrete strength,
improved post-peak tensile concrete behaviour, enhanced flexural behaviour and
Pan-African University Institute for Basic Science, Technology and Innovation
52
Crack mouth opening control. He added that, since millions of tones steel used for
fabrication of Industrial steel fibres requires millions of energies accompanied by
releasing of tones of CO2 while for fabrication of RTSF requires 98% less; RTSF
found be economically and environmentally a substitute of Industrial steel fibre.
(Pilakoutas K. , 2014)
Marijana et al (2013) made a reaserch on the use of Recycled tyre fibre from
mechanical shredding of waste tyre in concrete. Four different tyre-based fibre from
mechanical shredding of tyres. Three different types (Industrial steel, Recycled tyre
steel fibres purified and non-purified, and recycled textile fibres) were mixed together
in concrete for various percentage mass. They revealed that the capacity of fibres to
limit propagation of cracks is the basic parameter that extends the structure’s life span
and cuts down maintenance costs simply because the occurrence of cracks on the
concrete surface exposed to weather and other impacts greatly affects life span of
concrete structures. In their findings, the found that, Textile fibre can act as autogenous
and drying shrinkage cracks arrestors limiting crack initiations. Recycles steel fibres
can be used in civil engineering as a less costly alternative to industrial steel fibre.
Studies conducted so far to define possibilities for the use of steel fibres from waste
tyres have revealed several positive features of this material. In fact, recycled fibres
are an economically and environmentally justified alternative to industrial fibres,
especially when used in greater proportions and if mixed with industrial fibres.
Combining Recycled Steel fibre and textile fibres limit propagation of cracks and
increase toughness of the composite compared to ordinary concrete, even in case of
separation and pulling out of the composite. They stated that, if recycled steel fibres
Pan-African University Institute for Basic Science, Technology and Innovation
53
are used in the amount of two per cent of the total mass of the composite, this results
in significant improvement of the resistance to fatigue, ductility and prevent crack
propagation. Cracks. Addition of textile fibre reduces deformation due to shrinkage
and positive influence on durability properties of concrete. They concluded that, tyre-
based fibre can be used as environmentally, economically and functionally alternative
to industrial fibre (Marijana Serdar, 2013).
Fabio P. Figueredo et al (2017) studied the effect of waste tyre fibres in concrete for
structural fire protection in concrete tunnel linings. The fibres were recycled polymer
and recycled steel fibres from mechanical shredding of waste tyres. All these fibres
were of high quality as the manufactured fibre. Recycled Tyre polymer fibre (RTPF)
were tangled to be added immediately in concrete and balling were prevented by
dispersal of RTPF method using plastic string to separate the fibre, all these fibres were
having different length and different diameter due to mechanical shredding process.
Test were conducted on concrete slab with C70 high performance, high-strength and
self-compacting concrete. Before adding and during fire, the slab was subjected to
uniaxial compressive strength. The results showed a good performance of concrete
reinforced with tyre polymer and steel fibre in terms of structurally fire protection.
They concluded that, all specimen with RTSF at a dosage equal to or above to 2 kg
/m3 did not spall, it appeared that, combining RTSF and RTPF was sufficient to
prevent fire induced spalling of concrete, which means maintain integrity of the tunnel
lining structure during fire with subjection to external stresses (Fabio P. figueireho,
2017).
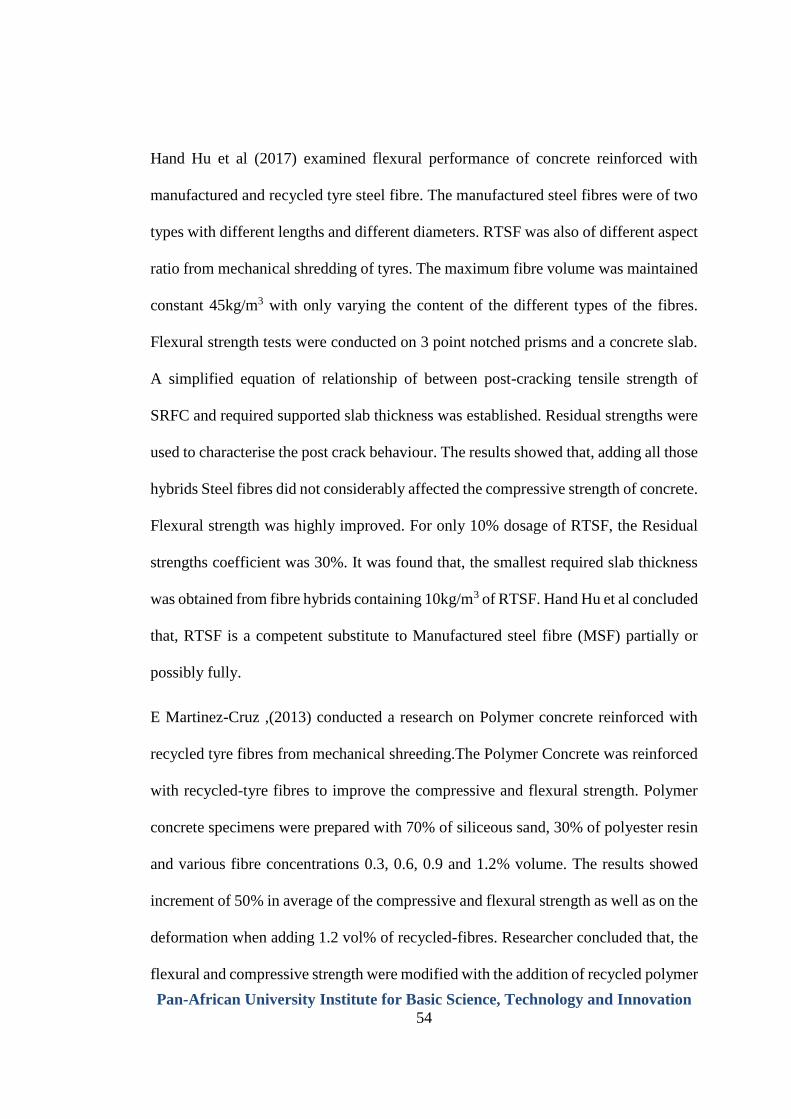
Pan-African University Institute for Basic Science, Technology and Innovation
54
Hand Hu et al (2017) examined flexural performance of concrete reinforced with
manufactured and recycled tyre steel fibre. The manufactured steel fibres were of two
types with different lengths and different diameters. RTSF was also of different aspect
ratio from mechanical shredding of tyres. The maximum fibre volume was maintained
constant 45kg/m3 with only varying the content of the different types of the fibres.
Flexural strength tests were conducted on 3 point notched prisms and a concrete slab.
A simplified equation of relationship of between post-cracking tensile strength of
SRFC and required supported slab thickness was established. Residual strengths were
used to characterise the post crack behaviour. The results showed that, adding all those
hybrids Steel fibres did not considerably affected the compressive strength of concrete.
Flexural strength was highly improved. For only 10% dosage of RTSF, the Residual
strengths coefficient was 30%. It was found that, the smallest required slab thickness
was obtained from fibre hybrids containing 10kg/m3 of RTSF. Hand Hu et al concluded
that, RTSF is a competent substitute to Manufactured steel fibre (MSF) partially or
possibly fully.
E Martinez-Cruz ,(2013) conducted a research on Polymer concrete reinforced with
recycled tyre fibres from mechanical shreeding.The Polymer Concrete was reinforced
with recycled-tyre fibres to improve the compressive and flexural strength. Polymer
concrete specimens were prepared with 70% of siliceous sand, 30% of polyester resin
and various fibre concentrations 0.3, 0.6, 0.9 and 1.2% volume. The results showed
increment of 50% in average of the compressive and flexural strength as well as on the
deformation when adding 1.2 vol% of recycled-fibres. Researcher concluded that, the
flexural and compressive strength were modified with the addition of recycled polymer
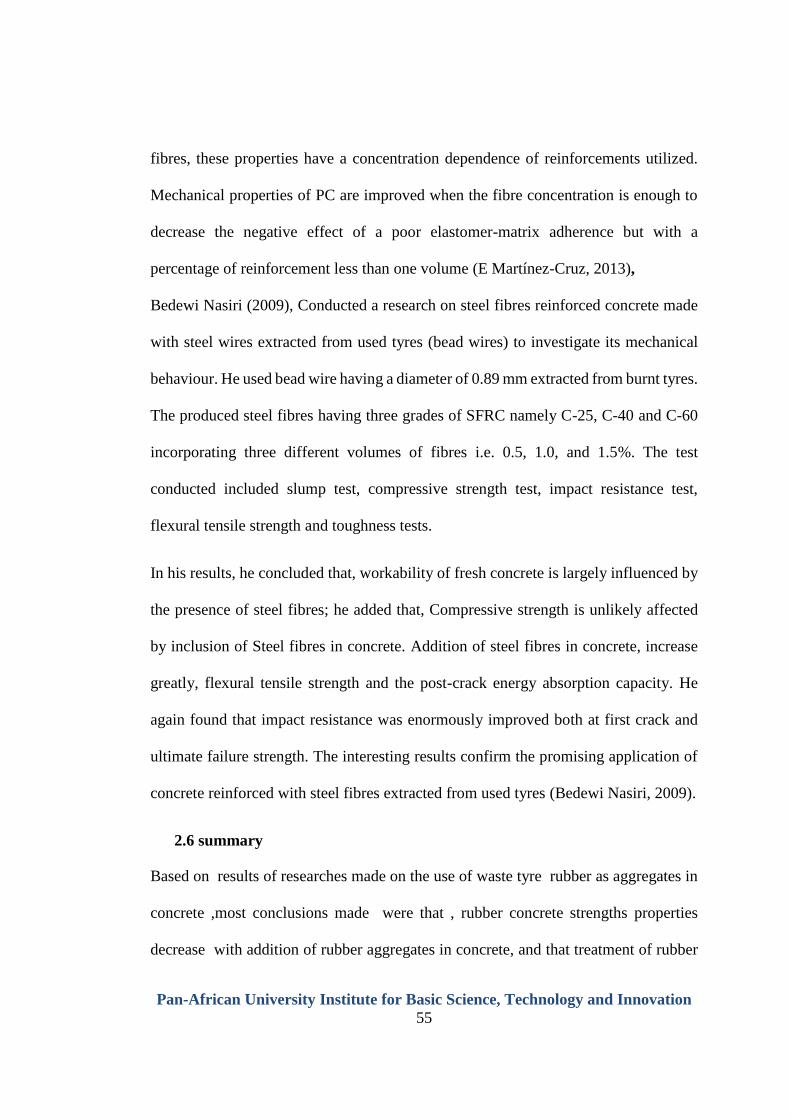
Pan-African University Institute for Basic Science, Technology and Innovation
55
fibres, these properties have a concentration dependence of reinforcements utilized.
Mechanical properties of PC are improved when the fibre concentration is enough to
decrease the negative effect of a poor elastomer-matrix adherence but with a
percentage of reinforcement less than one volume (E Martínez-Cruz, 2013),
Bedewi Nasiri (2009), Conducted a research on steel fibres reinforced concrete made
with steel wires extracted from used tyres (bead wires) to investigate its mechanical
behaviour. He used bead wire having a diameter of 0.89 mm extracted from burnt tyres.
The produced steel fibres having three grades of SFRC namely C-25, C-40 and C-60
incorporating three different volumes of fibres i.e. 0.5, 1.0, and 1.5%. The test
conducted included slump test, compressive strength test, impact resistance test,
flexural tensile strength and toughness tests.
In his results, he concluded that, workability of fresh concrete is largely influenced by
the presence of steel fibres; he added that, Compressive strength is unlikely affected
by inclusion of Steel fibres in concrete. Addition of steel fibres in concrete, increase
greatly, flexural tensile strength and the post-crack energy absorption capacity. He
again found that impact resistance was enormously improved both at first crack and
ultimate failure strength. The interesting results confirm the promising application of
concrete reinforced with steel fibres extracted from used tyres (Bedewi Nasiri, 2009).
2.6 summary
Based on results of researches made on the use of waste tyre rubber as aggregates in
concrete ,most conclusions made were that , rubber concrete strengths properties
decrease with addition of rubber aggregates in concrete, and that treatment of rubber
Pan-African University Institute for Basic Science, Technology and Innovation
56
surface with inorganic compounds have added so little improvement on rubber
concrete strengths, for that reason they recommend to use rubber concrete for
structures where load is not a major design consideration, which hinders the use of
waste tyre rubber in concrete production . As it was reported that industrial steel fibre
improves mechanical properties of concrete, and recycled tyre steel fibres have
demonstrated similar performance in concrete as of industrial steel fibres, mixing
crumb rubber and recycled steel fibre would improve properties of rubber concrete to
be used in structural construction ; it is of this reason, a study was made to assess the
impact of RTSF on structural performance of rubber concrete by adding randomly
distributed recycled tyre steel fibre at different percentages with different aspect ratios
and crumb rubber in concrete. Once positive results are achieved, the rubber concrete
will be introduced as structural material in Civil engineering construction and a as
result, huge amount of waste tyres dumped in environments will be used in concrete
will be friendly disposal of waste tyres.
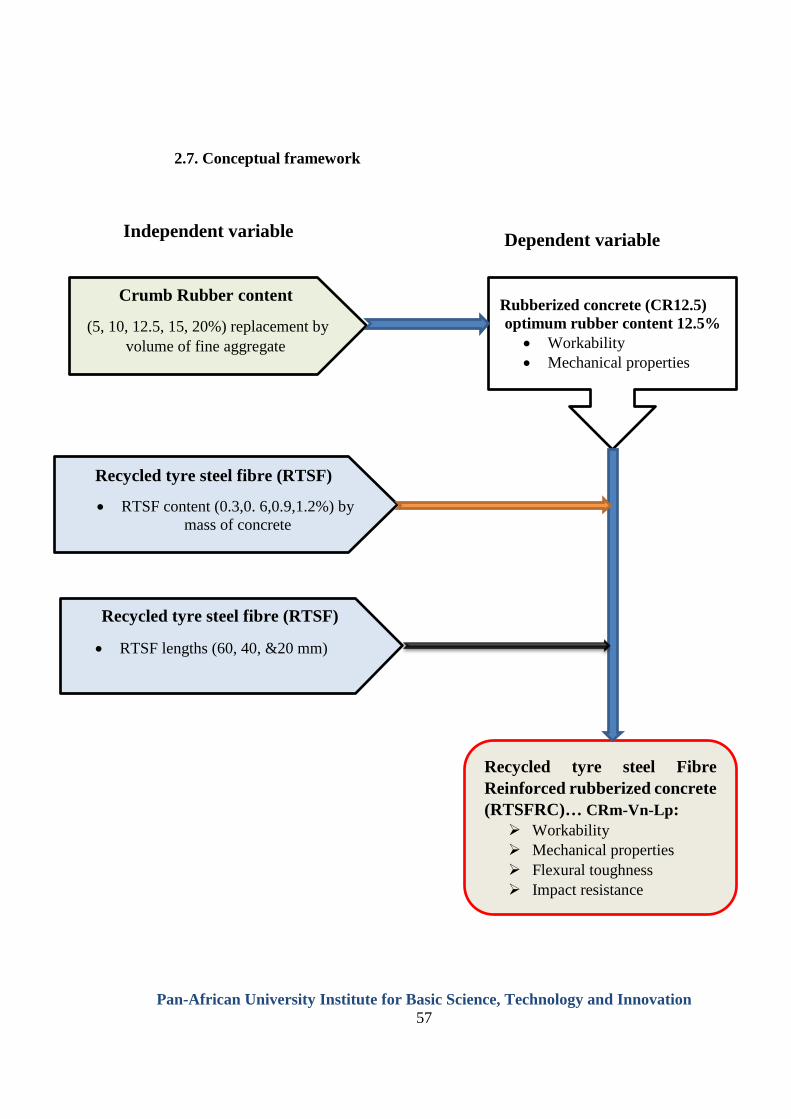
Pan-African University Institute for Basic Science, Technology and Innovation
57
2.7. Conceptual framework
Crumb Rubber content
(5, 10, 12.5, 15, 20%) replacement by
volume of fine aggregate
Rubberized concrete (CR12.5)
optimum rubber content 12.5% • Workability
• Mechanical properties
Recycled tyre steel fibre (RTSF)
• RTSF content (0.3,0. 6,0.9,1.2%) by
mass of concrete
Recycled tyre steel Fibre
Reinforced rubberized concrete
(RTSFRC)… CRm-Vn-Lp:
➢ Workability
➢ Mechanical properties
➢ Flexural toughness
➢ Impact resistance
Independent variable Dependent variable
Recycled tyre steel fibre (RTSF)
• RTSF lengths (60, 40, &20 mm)
Pan-African University Institute for Basic Science, Technology and Innovation
58
CHAPTER THREE: MATERIALS AND METHOD
3.1.Introduction
The general objective of this research study, is to produce steel fibre reinforced
rubberized concrete (SFRRC) made with Crumb Rubber as partial replacement of fine
aggregates and steel cord extracted from waste tyres as steel fibre reinforcement and,
characterising its mechanical properties and Impact energy characteristics
(Compressive, Split tensile, Flexural, Impact strength and toughness and ductility) in
hardened state as well as its properties in fresh state. a granulated waste tyre Crumb
Rubber of max size passing sieve 4.75mm and a steel cord of average diameter 1.15mm
extracted from used tyre by pyrolysis process was used. A concrete grade C-30 was
designed as control for all mixes to measure the relative performances of the different
mixtures.
Five different percentage volume of Crumb Rubber replacement of normal sands by
5,10,12.5,12.5,15 and 20% were mixed and casted to obtain the optimum volume of
rubber to mix with different percentage of recycled tyre steel fibres which are 0.3 ,0.6
,0.9 and 1.2% mass of concrete with 3 different fibre lengths (20mm,40mm and
60mm). Since SFRC properties are influenced by different factors, such steel fibres
geometry, mechanical properties and its bond between the concrete matrix, in this
research, the properties of recycled tyre steel fibre and the properties of other concrete
constituents were studied. Three groups (CR0, CR5, CR10, CR12.5, CR15, CR20);
(CR0, CR12.5, CR12.5-V0.3L60, CR12.5-V0.6L60, CR12.5-V0.9L60, CR12.5-
V1.2L60); and (CR12.5-V1.2L20, CR12.5-V1.2L40, CR12.5-V1.2L60) were casted
Pan-African University Institute for Basic Science, Technology and Innovation
59
and tested . In the first group, 36 cubes and 36 cylinders were casted and tested to
evaluate the effect of rubber content on compressive and tensile strength of concrete
at 7 and 28 days. The second group,24 cubes ,24 cylinders,18 concrete beams and 24
concrete discs were casted and tested for assessing the effect of the recycled steel fibres
on Compressive, tensile strength, flexural toughness and impact resistance of Recycled
steel fibre reinforced rubber concrete respectively. In the third group,12 cubes, 12
cylinders ,6 concrete beams and 8 concrete discs were casted and tested to assess the
influences of the recycled steel fibre lengths on properties of rubberized concrete. For
each mix, 3 specimen of concrete cube (150x150x150mm) and 3 specimen of concrete
cylinders (100x200mm) ,3 specimen of concrete beams(150x150x500mm) and 4
specimens of concrete discs (150x63±0.5mm) were being considered as mean of the
test results. Cubes were used to study compressive strength, cylinders were used to
determine the tensile strength, beams were used to evaluate the flexural toughness and
strength and discs were used to determine the impact resistance.
3.2.Materials properties
3.2.1. Cement
The cement used in the all mixes was a locally manufactured Portland limestone
cement of class 42. 5MPa. The product conforms to the KS EAS 18-1 cement standards
as adopted from the EN-197 specification that is equivalent to the Uganda specification
US 310-1 or US EAS 18-1. The product is classified as a CEM II/A-L 42,5 N Portland
Limestone Cement. The chemical composition, physical and mechanical properties
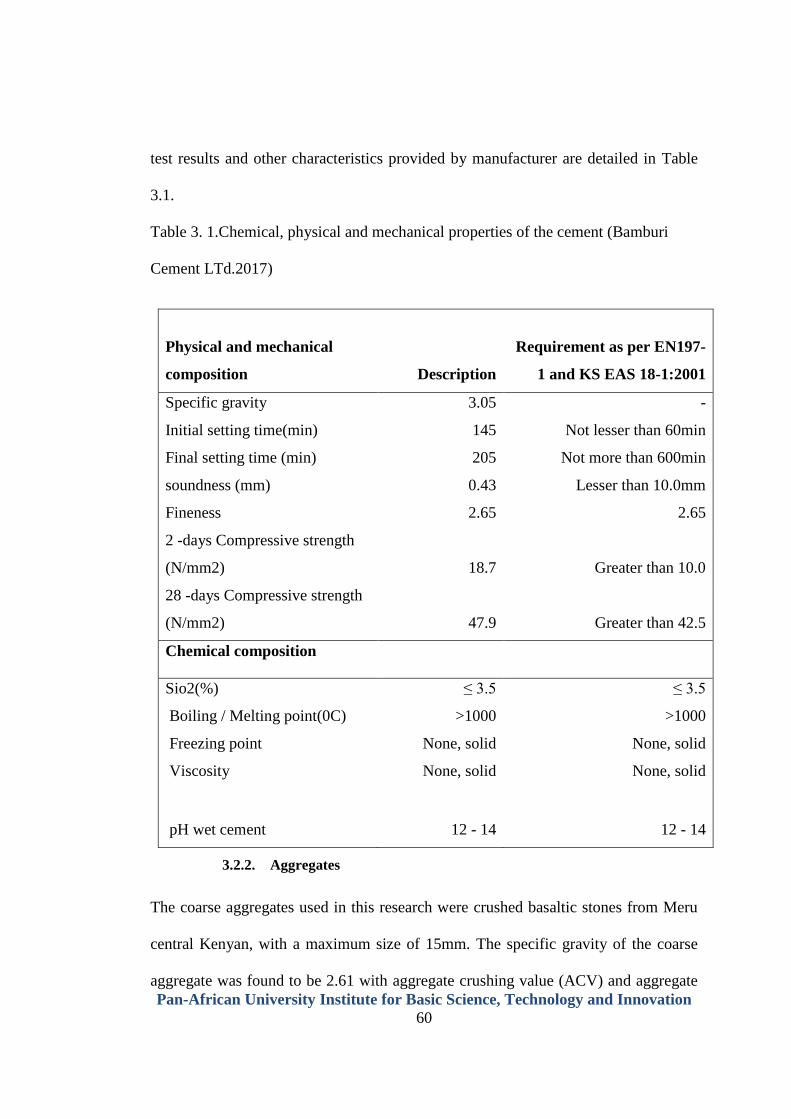
Pan-African University Institute for Basic Science, Technology and Innovation
60
test results and other characteristics provided by manufacturer are detailed in Table
3.1.
Table 3. 1.Chemical, physical and mechanical properties of the cement (Bamburi
Cement LTd.2017)
Physical and mechanical
composition
Description
Requirement as per EN197-
1 and KS EAS 18-1:2001
Specific gravity 3.05 -
Initial setting time(min) 145 Not lesser than 60min
Final setting time (min) 205 Not more than 600min
soundness (mm) 0.43 Lesser than 10.0mm
Fineness 2.65 2.65
2 -days Compressive strength
(N/mm2) 18.7 Greater than 10.0
28 -days Compressive strength
(N/mm2) 47.9 Greater than 42.5
Chemical composition
Sio2(%) ≤ 3.5 ≤ 3.5
Boiling / Melting point(0C) >1000 >1000
Freezing point None, solid None, solid
Viscosity None, solid None, solid
pH wet cement 12 - 14 12 - 14
3.2.2. Aggregates
The coarse aggregates used in this research were crushed basaltic stones from Meru
central Kenyan, with a maximum size of 15mm. The specific gravity of the coarse
aggregate was found to be 2.61 with aggregate crushing value (ACV) and aggregate
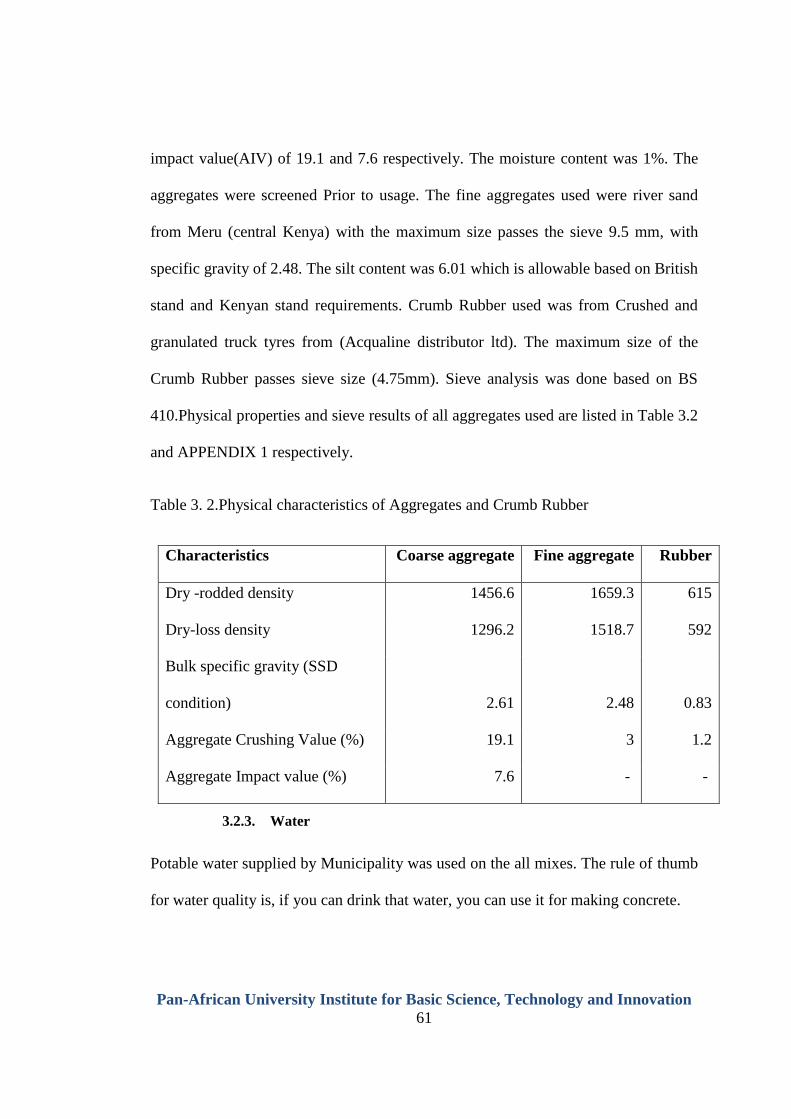
Pan-African University Institute for Basic Science, Technology and Innovation
61
impact value(AIV) of 19.1 and 7.6 respectively. The moisture content was 1%. The
aggregates were screened Prior to usage. The fine aggregates used were river sand
from Meru (central Kenya) with the maximum size passes the sieve 9.5 mm, with
specific gravity of 2.48. The silt content was 6.01 which is allowable based on British
stand and Kenyan stand requirements. Crumb Rubber used was from Crushed and
granulated truck tyres from (Acqualine distributor ltd). The maximum size of the
Crumb Rubber passes sieve size (4.75mm). Sieve analysis was done based on BS
410.Physical properties and sieve results of all aggregates used are listed in Table 3.2
and APPENDIX 1 respectively.
Table 3. 2.Physical characteristics of Aggregates and Crumb Rubber
Characteristics Coarse aggregate Fine aggregate Rubber
Dry -rodded density 1456.6 1659.3 615
Dry-loss density 1296.2 1518.7 592
Bulk specific gravity (SSD
condition) 2.61 2.48 0.83
Aggregate Crushing Value (%) 19.1 3 1.2
Aggregate Impact value (%) 7.6 - -
3.2.3. Water
Potable water supplied by Municipality was used on the all mixes. The rule of thumb
for water quality is, if you can drink that water, you can use it for making concrete.
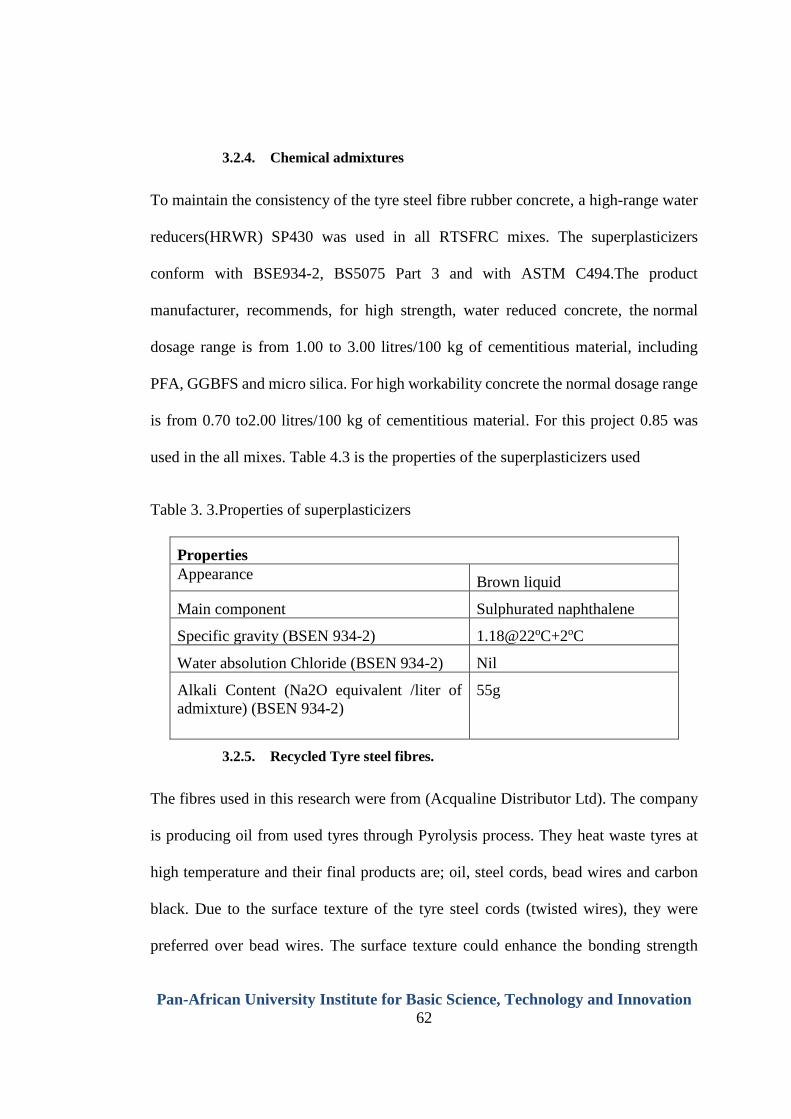
Pan-African University Institute for Basic Science, Technology and Innovation
62
3.2.4. Chemical admixtures
To maintain the consistency of the tyre steel fibre rubber concrete, a high-range water
reducers(HRWR) SP430 was used in all RTSFRC mixes. The superplasticizers
conform with BSE934-2, BS5075 Part 3 and with ASTM C494.The product
manufacturer, recommends, for high strength, water reduced concrete, the normal
dosage range is from 1.00 to 3.00 litres/100 kg of cementitious material, including
PFA, GGBFS and micro silica. For high workability concrete the normal dosage range
is from 0.70 to2.00 litres/100 kg of cementitious material. For this project 0.85 was
used in the all mixes. Table 4.3 is the properties of the superplasticizers used
Table 3. 3.Properties of superplasticizers
Properties
Appearance Brown liquid
Main component Sulphurated naphthalene
Specific gravity (BSEN 934-2) 1.18@22oC+2oC
Water absolution Chloride (BSEN 934-2) Nil
Alkali Content (Na2O equivalent /liter of
admixture) (BSEN 934-2)
55g
3.2.5. Recycled Tyre steel fibres.
The fibres used in this research were from (Acqualine Distributor Ltd). The company
is producing oil from used tyres through Pyrolysis process. They heat waste tyres at
high temperature and their final products are; oil, steel cords, bead wires and carbon
black. Due to the surface texture of the tyre steel cords (twisted wires), they were
preferred over bead wires. The surface texture could enhance the bonding strength
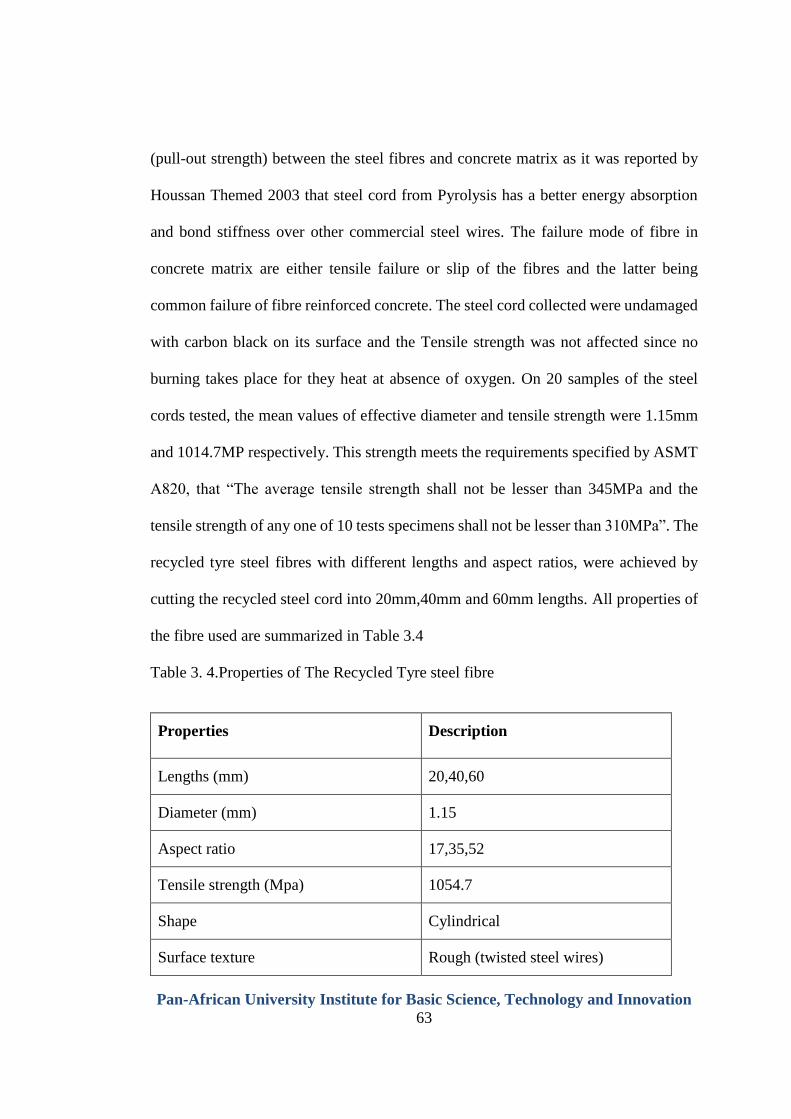
Pan-African University Institute for Basic Science, Technology and Innovation
63
(pull-out strength) between the steel fibres and concrete matrix as it was reported by
Houssan Themed 2003 that steel cord from Pyrolysis has a better energy absorption
and bond stiffness over other commercial steel wires. The failure mode of fibre in
concrete matrix are either tensile failure or slip of the fibres and the latter being
common failure of fibre reinforced concrete. The steel cord collected were undamaged
with carbon black on its surface and the Tensile strength was not affected since no
burning takes place for they heat at absence of oxygen. On 20 samples of the steel
cords tested, the mean values of effective diameter and tensile strength were 1.15mm
and 1014.7MP respectively. This strength meets the requirements specified by ASMT
A820, that “The average tensile strength shall not be lesser than 345MPa and the
tensile strength of any one of 10 tests specimens shall not be lesser than 310MPa”. The
recycled tyre steel fibres with different lengths and aspect ratios, were achieved by
cutting the recycled steel cord into 20mm,40mm and 60mm lengths. All properties of
the fibre used are summarized in Table 3.4
Table 3. 4.Properties of The Recycled Tyre steel fibre
Properties Description
Lengths (mm) 20,40,60
Diameter (mm) 1.15
Aspect ratio 17,35,52
Tensile strength (Mpa) 1054.7
Shape Cylindrical
Surface texture Rough (twisted steel wires)
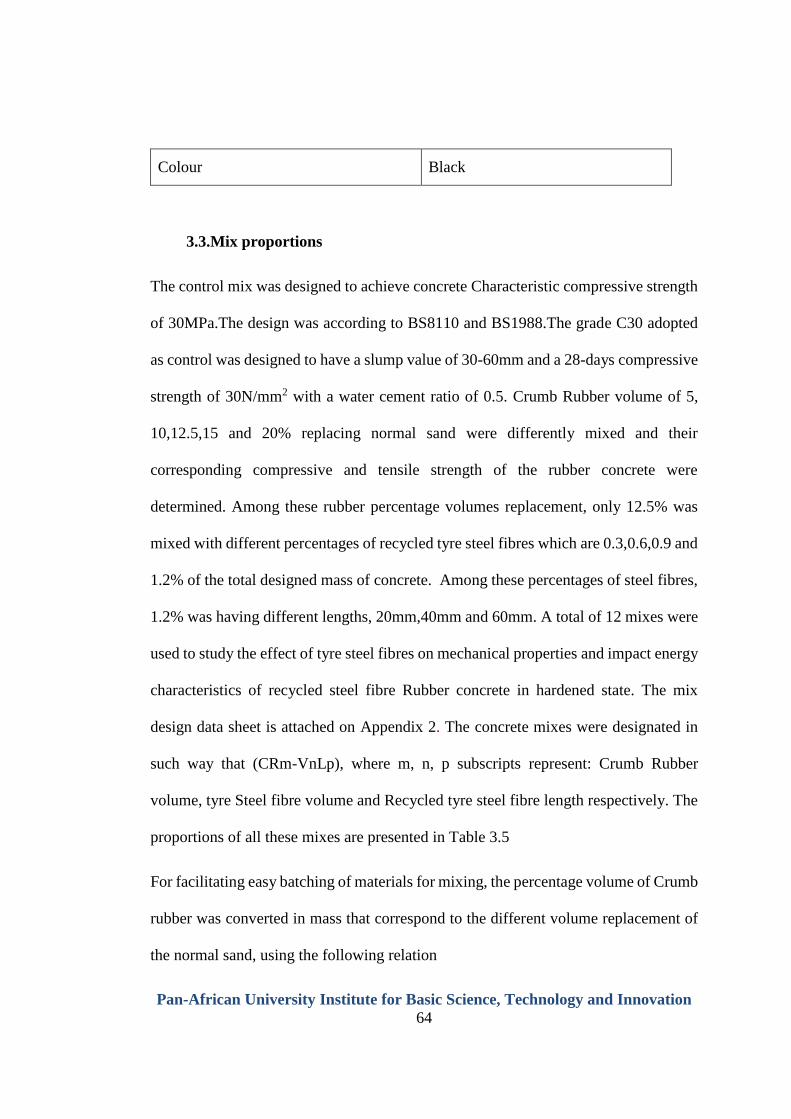
Pan-African University Institute for Basic Science, Technology and Innovation
64
Colour Black
3.3.Mix proportions
The control mix was designed to achieve concrete Characteristic compressive strength
of 30MPa.The design was according to BS8110 and BS1988.The grade C30 adopted
as control was designed to have a slump value of 30-60mm and a 28-days compressive
strength of 30N/mm2 with a water cement ratio of 0.5. Crumb Rubber volume of 5,
10,12.5,15 and 20% replacing normal sand were differently mixed and their
corresponding compressive and tensile strength of the rubber concrete were
determined. Among these rubber percentage volumes replacement, only 12.5% was
mixed with different percentages of recycled tyre steel fibres which are 0.3,0.6,0.9 and
1.2% of the total designed mass of concrete. Among these percentages of steel fibres,
1.2% was having different lengths, 20mm,40mm and 60mm. A total of 12 mixes were
used to study the effect of tyre steel fibres on mechanical properties and impact energy
characteristics of recycled steel fibre Rubber concrete in hardened state. The mix
design data sheet is attached on Appendix 2. The concrete mixes were designated in
such way that (CRm-VnLp), where m, n, p subscripts represent: Crumb Rubber
volume, tyre Steel fibre volume and Recycled tyre steel fibre length respectively. The
proportions of all these mixes are presented in Table 3.5
For facilitating easy batching of materials for mixing, the percentage volume of Crumb
rubber was converted in mass that correspond to the different volume replacement of
the normal sand, using the following relation
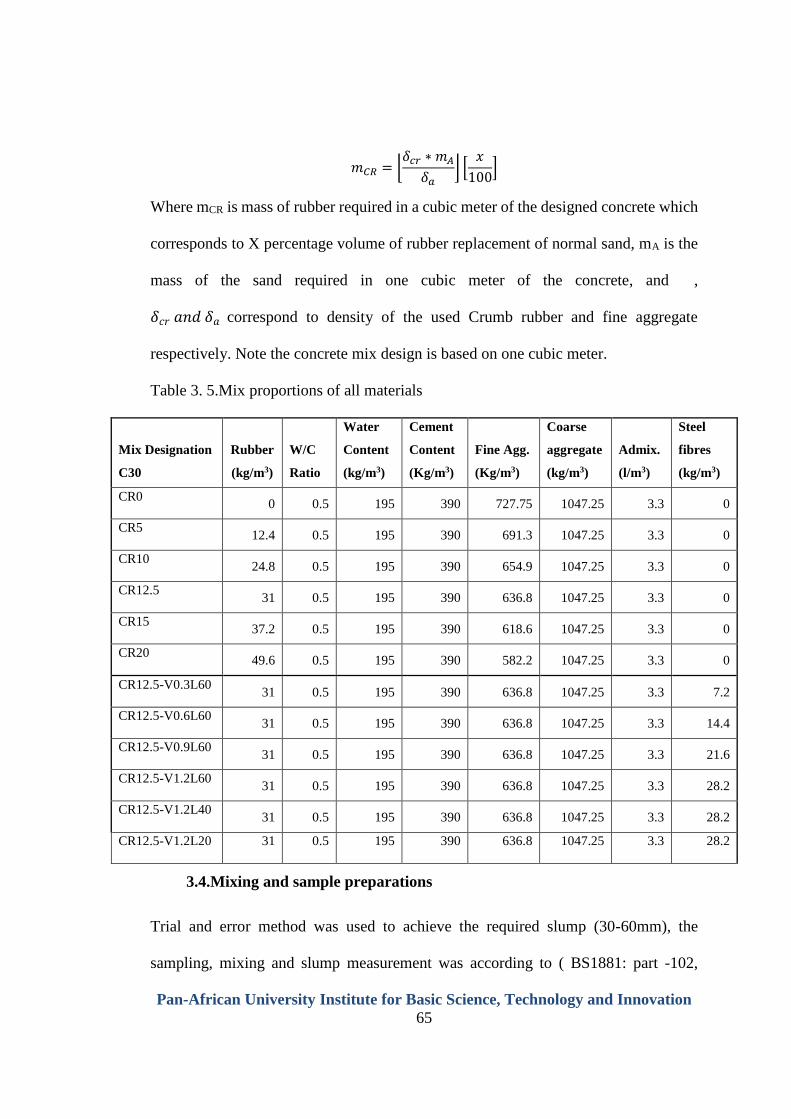
Pan-African University Institute for Basic Science, Technology and Innovation
65
𝑚𝐶𝑅 = ⌊𝛿𝑐𝑟 ∗ 𝑚𝐴
𝛿𝑎⌋ [
𝑥
100]
Where mCR is mass of rubber required in a cubic meter of the designed concrete which
corresponds to X percentage volume of rubber replacement of normal sand, mA is the
mass of the sand required in one cubic meter of the concrete, and ,
𝛿𝑐𝑟 𝑎𝑛𝑑 𝛿𝑎 correspond to density of the used Crumb rubber and fine aggregate
respectively. Note the concrete mix design is based on one cubic meter.
Table 3. 5.Mix proportions of all materials
Mix Designation
C30
Rubber
(kg/m3)
W/C
Ratio
Water
Content
(kg/m3)
Cement
Content
(Kg/m3)
Fine Agg.
(Kg/m3)
Coarse
aggregate
(kg/m3)
Admix.
(l/m3)
Steel
fibres
(kg/m3)
CR0 0 0.5 195 390 727.75 1047.25 3.3 0
CR5 12.4 0.5 195 390 691.3 1047.25 3.3 0
CR10 24.8 0.5 195 390 654.9 1047.25 3.3 0
CR12.5 31 0.5 195 390 636.8 1047.25 3.3 0
CR15 37.2 0.5 195 390 618.6 1047.25 3.3 0
CR20 49.6 0.5 195 390 582.2 1047.25 3.3 0
CR12.5-V0.3L60 31 0.5 195 390 636.8 1047.25 3.3 7.2
CR12.5-V0.6L60 31 0.5 195 390 636.8 1047.25 3.3 14.4
CR12.5-V0.9L60 31 0.5 195 390 636.8 1047.25 3.3 21.6
CR12.5-V1.2L60 31 0.5 195 390 636.8 1047.25 3.3 28.2
CR12.5-V1.2L40 31 0.5 195 390 636.8 1047.25 3.3 28.2
CR12.5-V1.2L20 31 0.5 195 390 636.8 1047.25 3.3 28.2
3.4.Mixing and sample preparations
Trial and error method was used to achieve the required slump (30-60mm), the
sampling, mixing and slump measurement was according to ( BS1881: part -102,
Pan-African University Institute for Basic Science, Technology and Innovation
66
1983),. Initially a half of the required amount of water was added to the aggregates to
bring them to Saturated surface dry. After mixing for with all materials in dry
condition, Recycled tyre steel fibres were added even as form of rainfall and were
distributed evenly at the same time mixing to avoid the balling effect of the steel fibres.
After the composite material is well mixed with rest of the designed water, three slump
tests were measure on one mix and the average was taken as mean of the slumps.
Mould and samples were made according to BS 1881-108, ASTM- C31, C470, and
D1557. All the moulds were wetted with lubrification agent to facilitate demoulding
of the forms. Freshly mixed concrete was poured in three layers each layer being
compacted with vibrator to removed air trapped in the concrete and achieve
homogenous mixing of materials in the entire concrete batch.
72 Concrete cubes of 150x150x150mm and 72 concrete cylinders of 100x200mm were
casted for compressive and split tensile strength respectively at 7 and 28 days of curing.
24 prisms of 150x150x500mm were also casted for flexural strength and toughness
tests at 28 days of curing. Finally ,32 discs of 150 mm diameter and 63±5 mm thickness
was made from cutting of full 8 cylinders for impact resistance test. After casting all
the moulds, they were kept for 24 hours before demoulding and then the specimens
were placed in curing tank(room) to be tested on 7 and 28 days
Pan-African University Institute for Basic Science, Technology and Innovation
67
3.5.Experimental procedures
3.5.1. Slump test
The slump values were measured in accordance with BS 1881–102. The standards
specify a slump cone of height of 300 mm, a bottom diameter of 200 mm and a top
diameter of 100 mm was used for slump measurement. According to BS 1881, based
on the profile of slumped concrete, the slump is termed either true slump, shear slump
or collapse slump. Only true slump is accepted, and if a shear or collapse slump is
achieved, a fresh sample should be taken, and then be tested again. A collapse slump
indicate that the mix is too wet. The cone was filled with freshly mixed concrete in
three layers and each layer was tamped 25 times with a 600 mm-long bullet-nosed
metal rod measuring 16 mm in diameter. At the end of the third stage, the concrete was
struck off flush with the top of the cone. The metal cone was then carefully lifted
vertically upwards, so as not to disturb the concrete cone. The slump of the concrete
was measured by measuring the distance from the top of the slumped concrete to the
level of the top of the slump cone. A mean of 3 slumps test for each mix was used as
the slump value of the mix.
Pan-African University Institute for Basic Science, Technology and Innovation
68
3.5.2. Compressive and split tensile strength test
Compressive strength and split tensile tests were performed in Universal testing
machine (UTM) with nominal capacity of 2000KN. Dimensions and weight of each
samples were measured prior to testing and 7 and 28 compressive and split tensile
strengths were determined according to (BS 1881:part -116, 1987) and (BS 1988: part
-117, 1983) respectively. The loading was maintained constant at the rate of 0.5MPa
/Sec for all tests. The UTM could display, the maximum compressive and split tensile
load, and the corresponding compressive and split tensile strengths. The average of 3
cube compressive and 3 cylinder split tensile strengths were adopted as mean
compressive and tensile strength of the concrete mix respectively at 7 and 28 days.
3.5.3. Flexural strength and toughness tests
Flexural strength and flexural toughness were carried out according to ASTM-C1609
and C1018 respectively. 24 prisms of 150x150x500mm size each were tested for
flexural strength and toughness properties at 28 days. Four points flexural bending test
method were used. The four-bending point bending test set up and specimen geometry
are illustrated on Figure .3.1 and Figure A-8-28. Testing was performed in oil hydraulic
machine with the manual controlling loading rate capability. Linear variable
differential transducers(LVDTs) were used to record vertical displacements
(deflections) and a load cell on central top of the beams was mounted to monitor
loadings and load-deflections data were recorded and displayed on data recording
system (Data logger) prior to plot load -deflection (P-d) curves. Ultimate Flexural
strengths were determined based on the maximum flexural load recorded during the
Pan-African University Institute for Basic Science, Technology and Innovation
69
test using Eq.3.2. Flexural toughness or energy absorption was presented by the area
under load-deflection curves at specified deflection in accordance with JCI-SF4 and
Toughness indices which is calculated as the area under the load-deflection curve
(Figure 2.3) up to 3, 5.5 and 15.5 multiple of first crack deflection divided by the area
up to the first crack strength (proportional limit) as according to ASTM-C1018.
Residual strength factors were determined from Indices values obtained using method
described in section 2.3.6.1.1. Other important parameters of a beam under bending
were deduced from beam bending formula which is given by Eq.3.1.
𝑀
𝐼=
𝜎𝑏
𝑌=
𝐸
𝑅 (3-1)
With:
M = Bending moment resisted by the beam (Nmm)
I=Second Moment of Inertia of the beam (mm4)
𝜎𝑏 = Bending Stress resisted by the beam in N/mm2
𝑌= Distance of the beam fibre from N.A
E=Young’s Modulus or modulus of elasticity (KN/mm2)
R= Radius of curvature
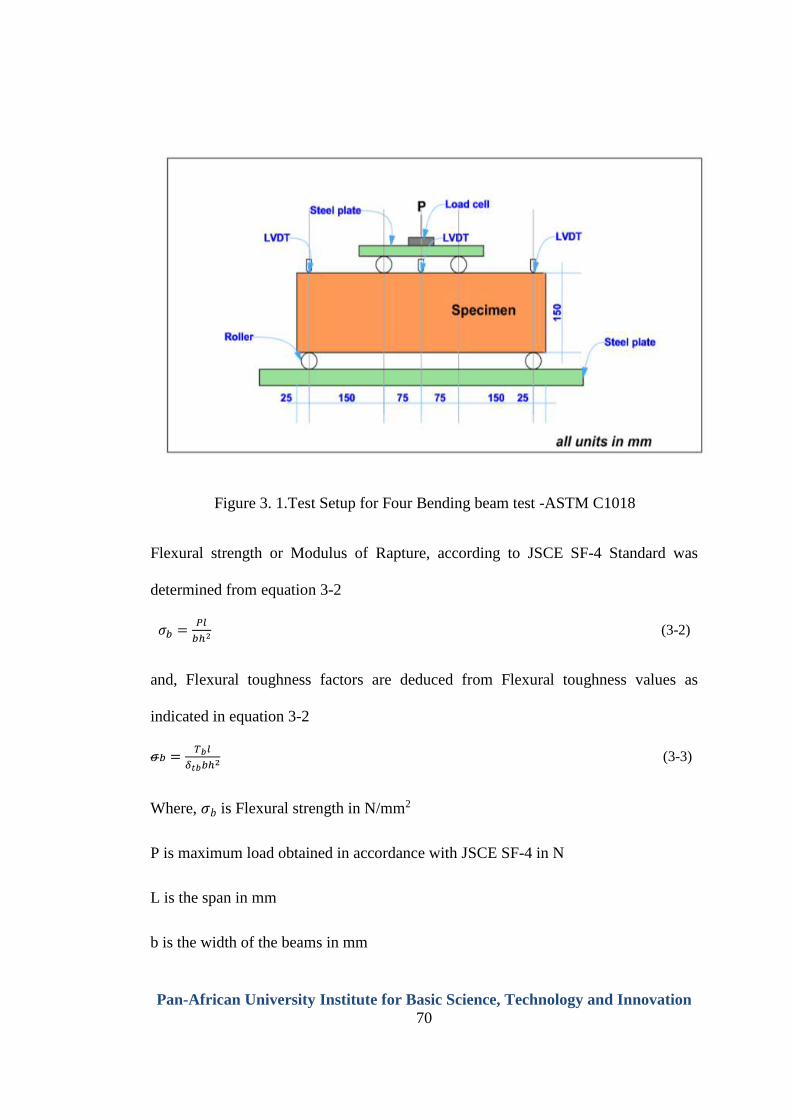
Pan-African University Institute for Basic Science, Technology and Innovation
70
Figure 3. 1.Test Setup for Four Bending beam test -ASTM C1018
Flexural strength or Modulus of Rapture, according to JSCE SF-4 Standard was
determined from equation 3-2
𝜎𝑏 =𝑃𝑙
𝑏ℎ2 (3-2)
and, Flexural toughness factors are deduced from Flexural toughness values as
indicated in equation 3-2
𝜎𝑏 =𝑇𝑏𝑙
𝛿𝑡𝑏𝑏ℎ2 (3-3)
Where, 𝜎𝑏 is Flexural strength in N/mm2
P is maximum load obtained in accordance with JSCE SF-4 in N
L is the span in mm
b is the width of the beams in mm
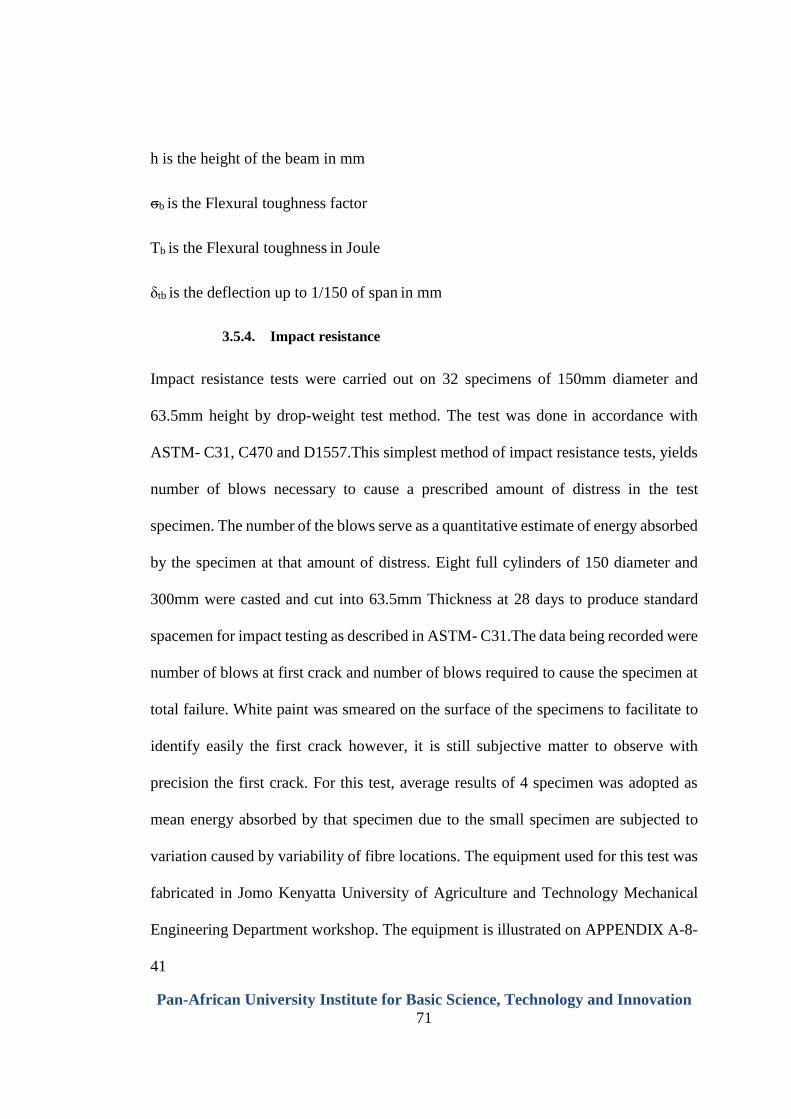
Pan-African University Institute for Basic Science, Technology and Innovation
71
h is the height of the beam in mm
σb is the Flexural toughness factor
Tb is the Flexural toughness in Joule
δtb is the deflection up to 1/150 of span in mm
3.5.4. Impact resistance
Impact resistance tests were carried out on 32 specimens of 150mm diameter and
63.5mm height by drop-weight test method. The test was done in accordance with
ASTM- C31, C470 and D1557.This simplest method of impact resistance tests, yields
number of blows necessary to cause a prescribed amount of distress in the test
specimen. The number of the blows serve as a quantitative estimate of energy absorbed
by the specimen at that amount of distress. Eight full cylinders of 150 diameter and
300mm were casted and cut into 63.5mm Thickness at 28 days to produce standard
spacemen for impact testing as described in ASTM- C31.The data being recorded were
number of blows at first crack and number of blows required to cause the specimen at
total failure. White paint was smeared on the surface of the specimens to facilitate to
identify easily the first crack however, it is still subjective matter to observe with
precision the first crack. For this test, average results of 4 specimen was adopted as
mean energy absorbed by that specimen due to the small specimen are subjected to
variation caused by variability of fibre locations. The equipment used for this test was
fabricated in Jomo Kenyatta University of Agriculture and Technology Mechanical
Engineering Department workshop. The equipment is illustrated on APPENDIX A-8-
41
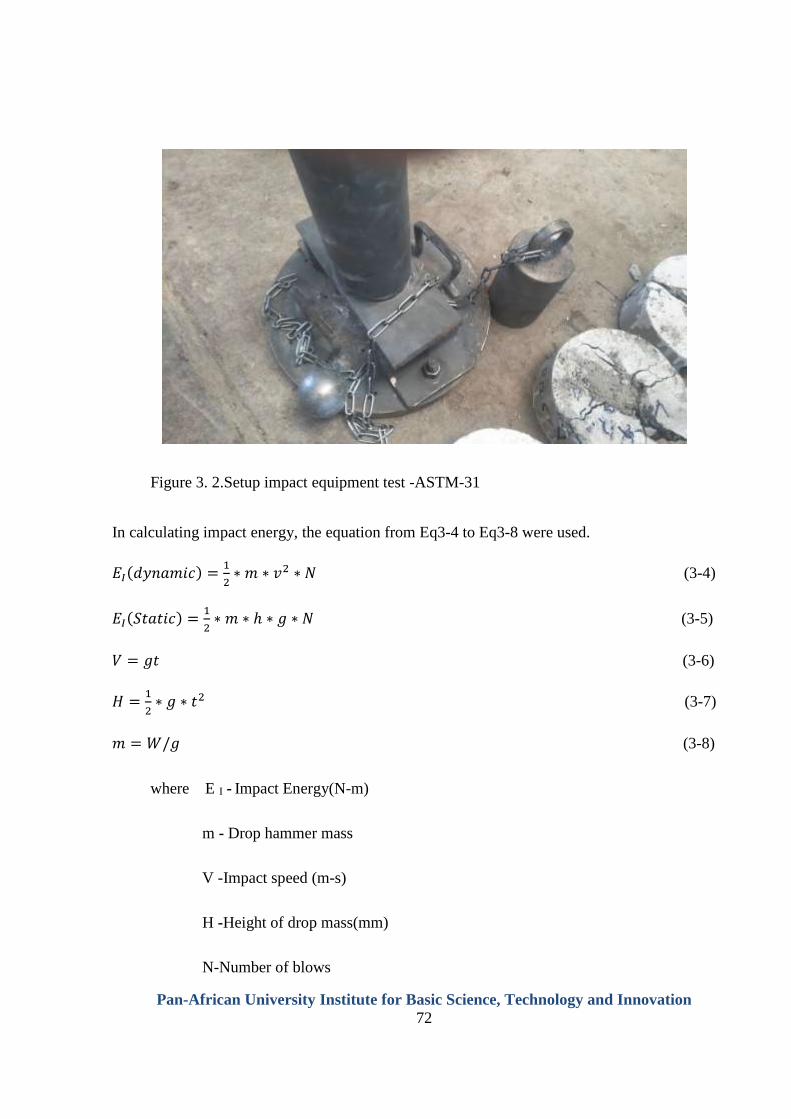
Pan-African University Institute for Basic Science, Technology and Innovation
72
Figure 3. 2.Setup impact equipment test -ASTM-31
In calculating impact energy, the equation from Eq3-4 to Eq3-8 were used.
𝐸𝐼(𝑑𝑦𝑛𝑎𝑚𝑖𝑐) =1
2∗ 𝑚 ∗ 𝑣2 ∗ 𝑁 (3-4)
𝐸𝐼(𝑆𝑡𝑎𝑡𝑖𝑐) =1
2∗ 𝑚 ∗ ℎ ∗ 𝑔 ∗ 𝑁 (3-5)
𝑉 = 𝑔𝑡 (3-6)
𝐻 =1
2∗ 𝑔 ∗ 𝑡2 (3-7)
𝑚 = 𝑊/𝑔 (3-8)
where E I - Impact Energy(N-m)
m - Drop hammer mass
V -Impact speed (m-s)
H -Height of drop mass(mm)
N-Number of blows
Pan-African University Institute for Basic Science, Technology and Innovation
73
CHAPTER FOUR: RESULTS AND DISCUSSION
4.1.Test results on fresh concrete
4.1.1. Workability
Workability of freshly mixed concrete is the ability of concrete or mortar to be mixed,
transported placed, finished and consolidated with ease and minimal loss of
homogeneity. In the existing different methods of testing workability of concrete,
slump test is the cheapest and easiest method. Incorporating steel fibres in concrete
significantly affects the workability of concrete and it is difficult to predict it due to
more fibre properties that affect workability of concrete such as, aspect ratio, volume
fractions and surface texture or shape. For the purpose of this work, only effects of
aspect ratio and volume fractions of recycled tyre steel fibre were investigated.
It is so difficult to predict the workability of tyre steel fibre rubber concrete, due to
different parameters involved in the concrete that can affect workability. For this
reason, in this research, trail mixes method was used. Concrete mixed with higher
recycled tyre steel fibre content appeared to be stiff and unworkable and the concrete
materials bond together and resist to free movement as compared to control with main
reason being the aspect ratio, volume fraction and twisted surface texture of tyre steel
cord. To overcome this movement resistance to flow of RTSFRC, 0.85% mass of
cement of Superplasticizers was added in all mixes so as to improve the workability.
The control was designed to have a slump value of 30-60mm, after adding
superplasticizers it was increased to 79mm.
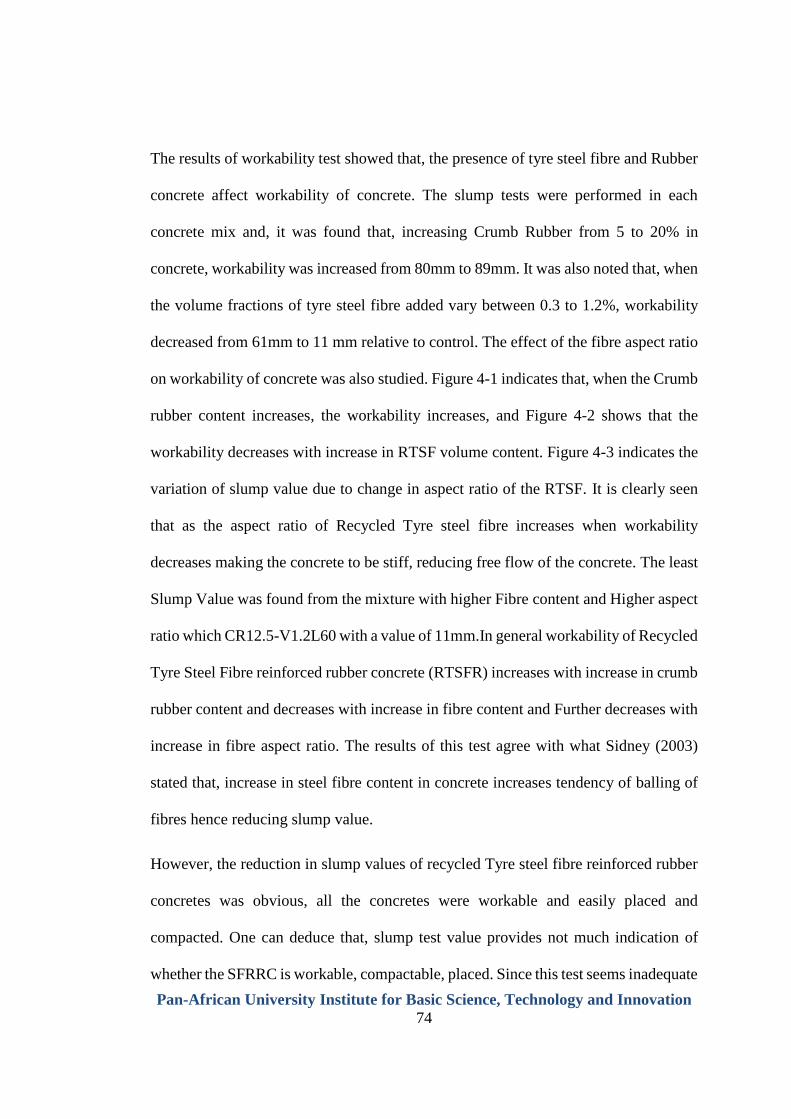
Pan-African University Institute for Basic Science, Technology and Innovation
74
The results of workability test showed that, the presence of tyre steel fibre and Rubber
concrete affect workability of concrete. The slump tests were performed in each
concrete mix and, it was found that, increasing Crumb Rubber from 5 to 20% in
concrete, workability was increased from 80mm to 89mm. It was also noted that, when
the volume fractions of tyre steel fibre added vary between 0.3 to 1.2%, workability
decreased from 61mm to 11 mm relative to control. The effect of the fibre aspect ratio
on workability of concrete was also studied. Figure 4-1 indicates that, when the Crumb
rubber content increases, the workability increases, and Figure 4-2 shows that the
workability decreases with increase in RTSF volume content. Figure 4-3 indicates the
variation of slump value due to change in aspect ratio of the RTSF. It is clearly seen
that as the aspect ratio of Recycled Tyre steel fibre increases when workability
decreases making the concrete to be stiff, reducing free flow of the concrete. The least
Slump Value was found from the mixture with higher Fibre content and Higher aspect
ratio which CR12.5-V1.2L60 with a value of 11mm.In general workability of Recycled
Tyre Steel Fibre reinforced rubber concrete (RTSFR) increases with increase in crumb
rubber content and decreases with increase in fibre content and Further decreases with
increase in fibre aspect ratio. The results of this test agree with what Sidney (2003)
stated that, increase in steel fibre content in concrete increases tendency of balling of
fibres hence reducing slump value.
However, the reduction in slump values of recycled Tyre steel fibre reinforced rubber
concretes was obvious, all the concretes were workable and easily placed and
compacted. One can deduce that, slump test value provides not much indication of
whether the SFRRC is workable, compactable, placed. Since this test seems inadequate
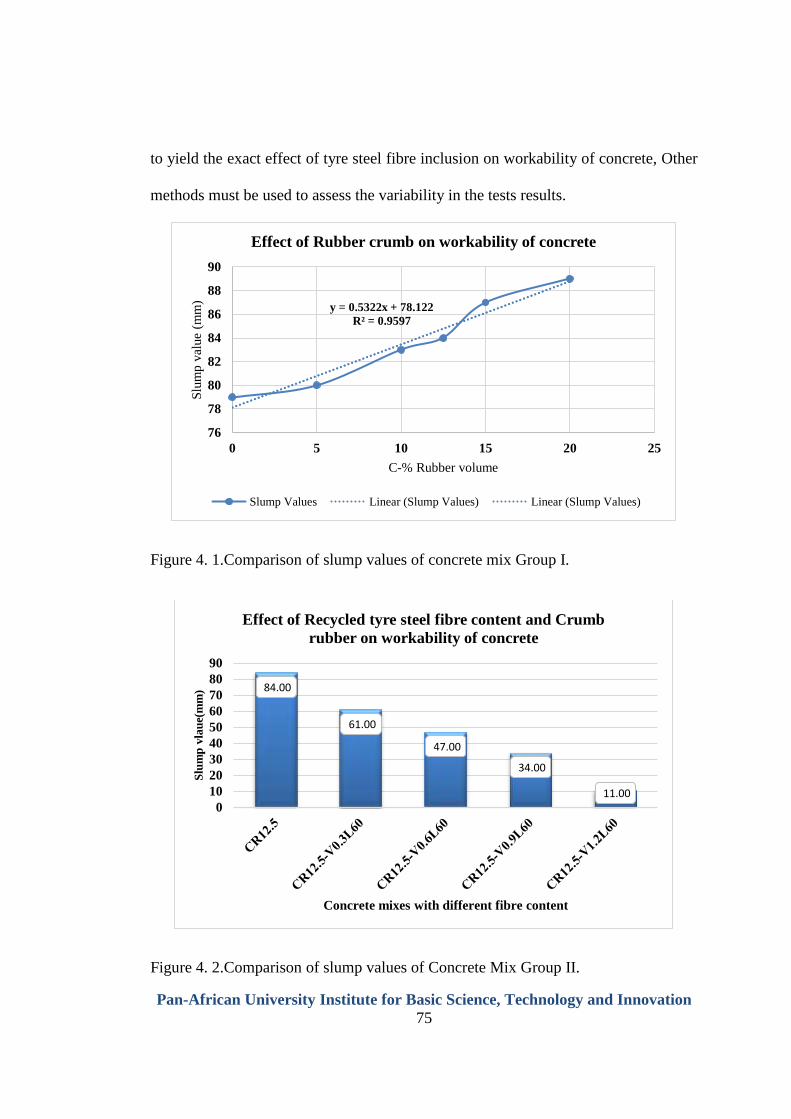
Pan-African University Institute for Basic Science, Technology and Innovation
75
to yield the exact effect of tyre steel fibre inclusion on workability of concrete, Other
methods must be used to assess the variability in the tests results.
Figure 4. 1.Comparison of slump values of concrete mix Group I.
Figure 4. 2.Comparison of slump values of Concrete Mix Group II.
y = 0.5322x + 78.122
R² = 0.9597
76
78
80
82
84
86
88
90
0 5 10 15 20 25
Slu
mp
val
ue
(mm
)
C-% Rubber volume
Effect of Rubber crumb on workability of concrete
Slump Values Linear (Slump Values) Linear (Slump Values)
84.00
61.00
47.00
34.00
11.00 0
10
20
30
40
50
60
70
80
90
Slu
mp
vla
ue(
mm
)
Concrete mixes with different fibre content
Effect of Recycled tyre steel fibre content and Crumb
rubber on workability of concrete
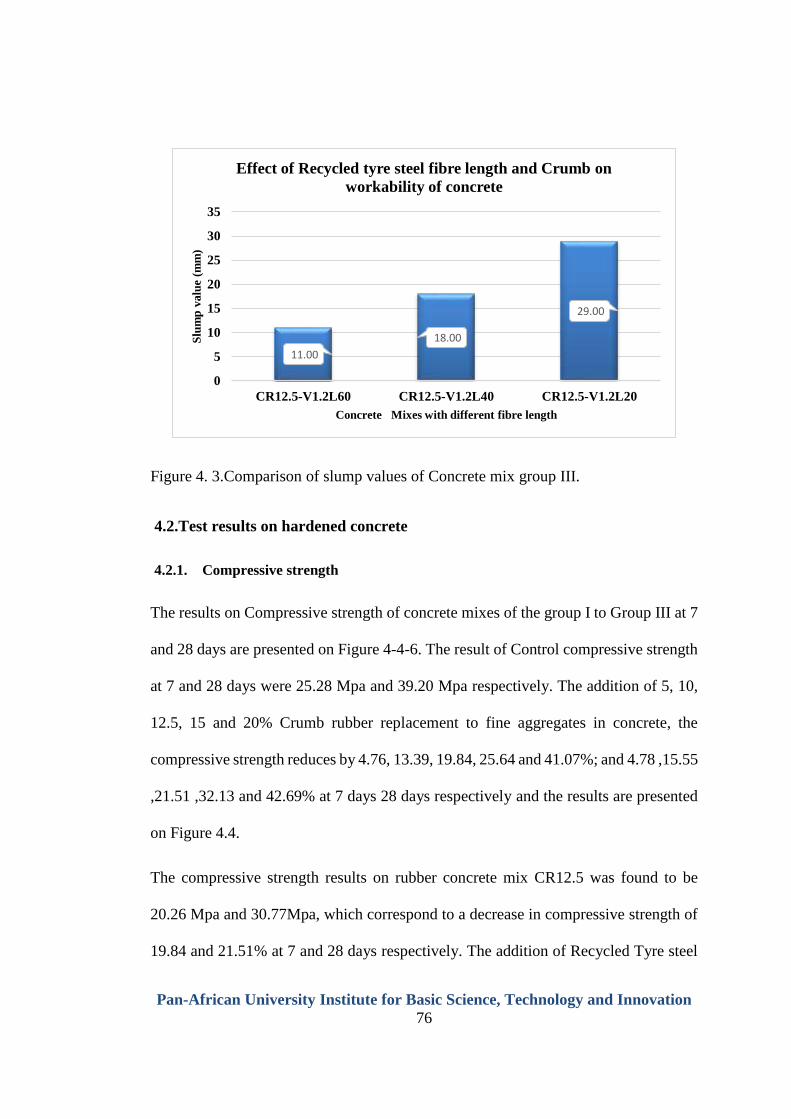
Pan-African University Institute for Basic Science, Technology and Innovation
76
Figure 4. 3.Comparison of slump values of Concrete mix group III.
4.2.Test results on hardened concrete
4.2.1. Compressive strength
The results on Compressive strength of concrete mixes of the group I to Group III at 7
and 28 days are presented on Figure 4-4-6. The result of Control compressive strength
at 7 and 28 days were 25.28 Mpa and 39.20 Mpa respectively. The addition of 5, 10,
12.5, 15 and 20% Crumb rubber replacement to fine aggregates in concrete, the
compressive strength reduces by 4.76, 13.39, 19.84, 25.64 and 41.07%; and 4.78 ,15.55
,21.51 ,32.13 and 42.69% at 7 days 28 days respectively and the results are presented
on Figure 4.4.
The compressive strength results on rubber concrete mix CR12.5 was found to be
20.26 Mpa and 30.77Mpa, which correspond to a decrease in compressive strength of
19.84 and 21.51% at 7 and 28 days respectively. The addition of Recycled Tyre steel
11.00
18.00
29.00
0
5
10
15
20
25
30
35
CR12.5-V1.2L60 CR12.5-V1.2L40 CR12.5-V1.2L20
Slu
mp
valu
e (m
m)
Concrete Mixes with different fibre length
Effect of Recycled tyre steel fibre length and Crumb on
workability of concrete
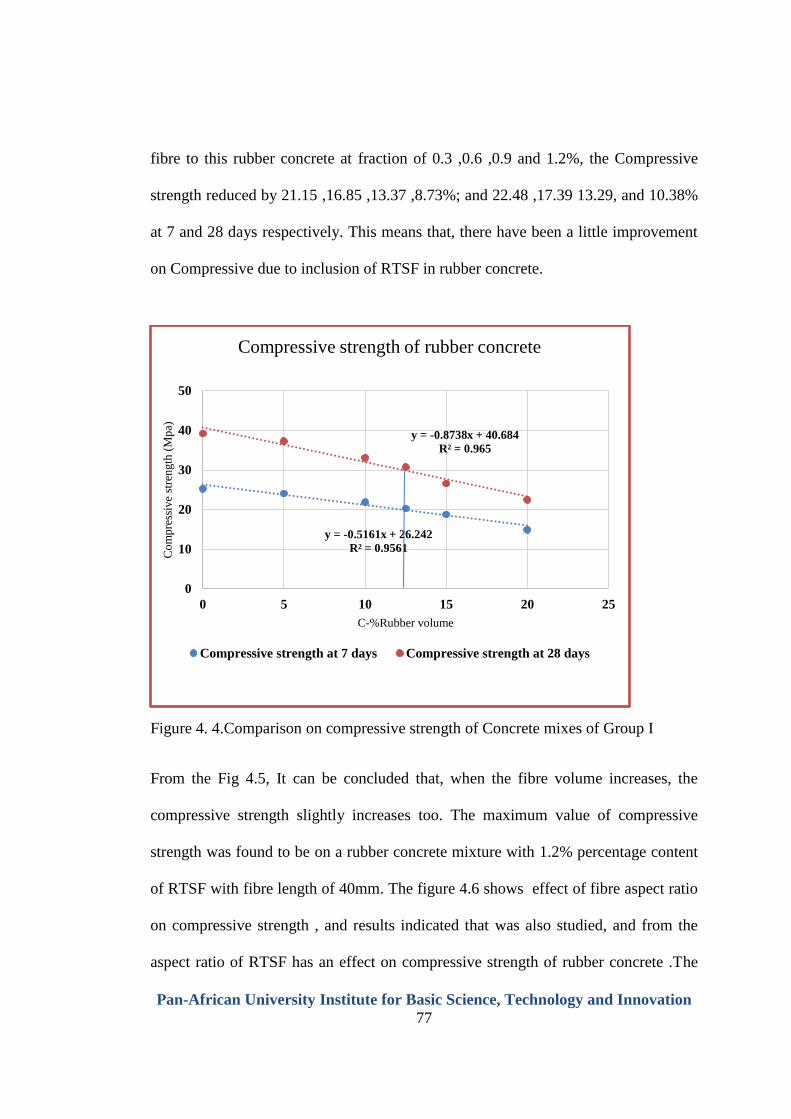
Pan-African University Institute for Basic Science, Technology and Innovation
77
fibre to this rubber concrete at fraction of 0.3 ,0.6 ,0.9 and 1.2%, the Compressive
strength reduced by 21.15 ,16.85 ,13.37 ,8.73%; and 22.48 ,17.39 13.29, and 10.38%
at 7 and 28 days respectively. This means that, there have been a little improvement
on Compressive due to inclusion of RTSF in rubber concrete.
Figure 4. 4.Comparison on compressive strength of Concrete mixes of Group I
From the Fig 4.5, It can be concluded that, when the fibre volume increases, the
compressive strength slightly increases too. The maximum value of compressive
strength was found to be on a rubber concrete mixture with 1.2% percentage content
of RTSF with fibre length of 40mm. The figure 4.6 shows effect of fibre aspect ratio
on compressive strength , and results indicated that was also studied, and from the
aspect ratio of RTSF has an effect on compressive strength of rubber concrete .The
y = -0.5161x + 26.242
R² = 0.9561
y = -0.8738x + 40.684
R² = 0.965
0
10
20
30
40
50
0 5 10 15 20 25
Co
mp
ress
ive
stre
ngth
(M
pa)
C-%Rubber volume
Compressive strength of rubber concrete
Compressive strength at 7 days Compressive strength at 28 days
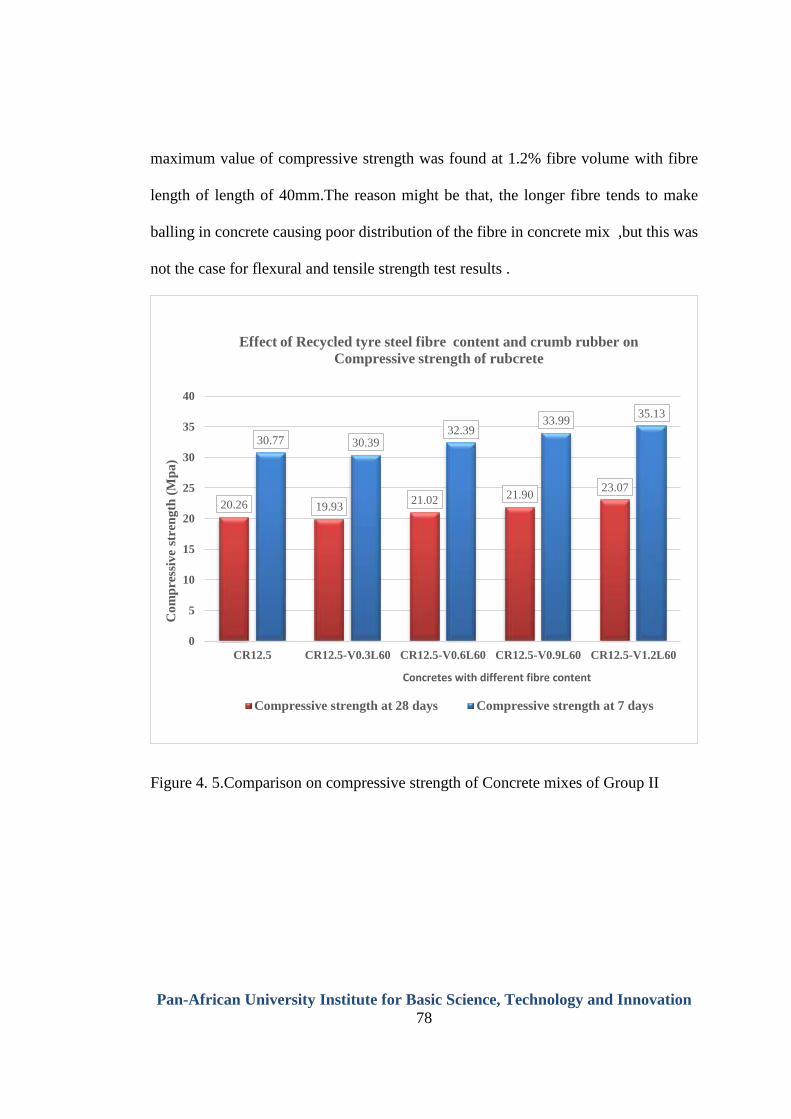
Pan-African University Institute for Basic Science, Technology and Innovation
78
maximum value of compressive strength was found at 1.2% fibre volume with fibre
length of length of 40mm.The reason might be that, the longer fibre tends to make
balling in concrete causing poor distribution of the fibre in concrete mix ,but this was
not the case for flexural and tensile strength test results .
Figure 4. 5.Comparison on compressive strength of Concrete mixes of Group II
20.26 19.9321.02 21.90
23.07
30.77 30.3932.39
33.9935.13
0
5
10
15
20
25
30
35
40
CR12.5 CR12.5-V0.3L60 CR12.5-V0.6L60 CR12.5-V0.9L60 CR12.5-V1.2L60
Co
mp
ress
ive
stre
ng
th (
Mp
a)
Concretes with different fibre content
Effect of Recycled tyre steel fibre content and crumb rubber on
Compressive strength of rubcrete
Compressive strength at 28 days Compressive strength at 7 days
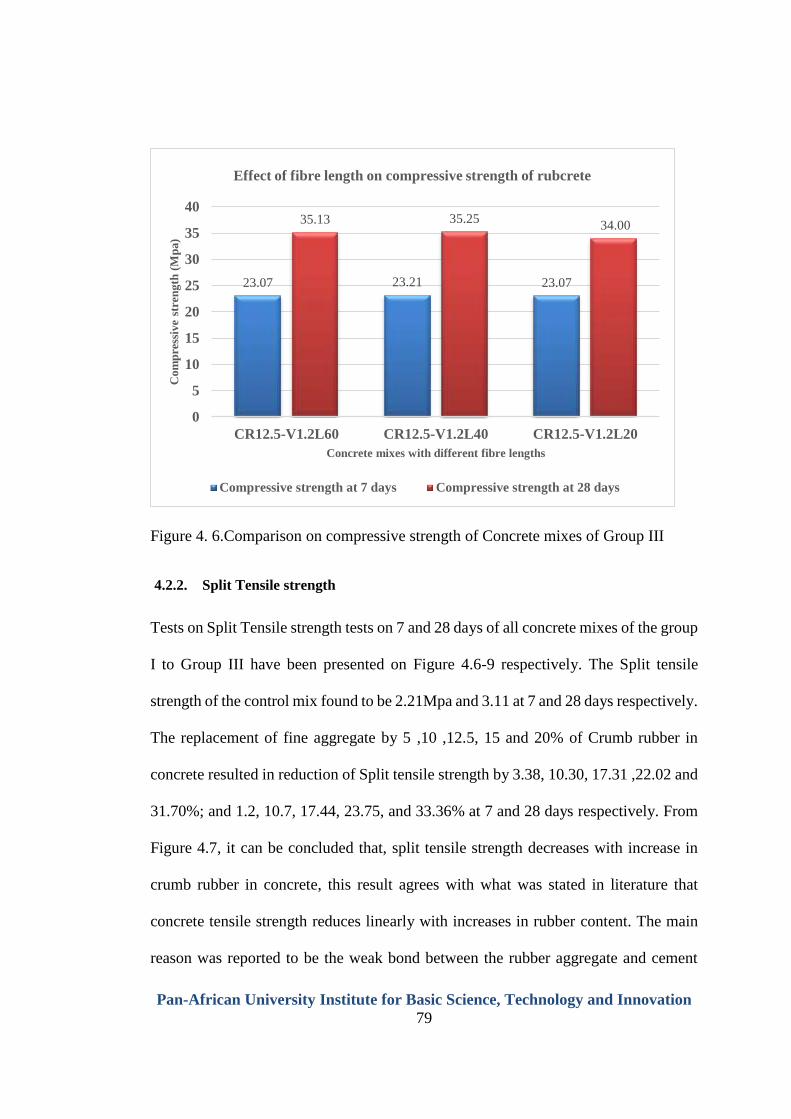
Pan-African University Institute for Basic Science, Technology and Innovation
79
Figure 4. 6.Comparison on compressive strength of Concrete mixes of Group III
4.2.2. Split Tensile strength
Tests on Split Tensile strength tests on 7 and 28 days of all concrete mixes of the group
I to Group III have been presented on Figure 4.6-9 respectively. The Split tensile
strength of the control mix found to be 2.21Mpa and 3.11 at 7 and 28 days respectively.
The replacement of fine aggregate by 5 ,10 ,12.5, 15 and 20% of Crumb rubber in
concrete resulted in reduction of Split tensile strength by 3.38, 10.30, 17.31 ,22.02 and
31.70%; and 1.2, 10.7, 17.44, 23.75, and 33.36% at 7 and 28 days respectively. From
Figure 4.7, it can be concluded that, split tensile strength decreases with increase in
crumb rubber in concrete, this result agrees with what was stated in literature that
concrete tensile strength reduces linearly with increases in rubber content. The main
reason was reported to be the weak bond between the rubber aggregate and cement
23.07 23.21 23.07
35.13 35.2534.00
0
5
10
15
20
25
30
35
40
CR12.5-V1.2L60 CR12.5-V1.2L40 CR12.5-V1.2L20
Com
pre
ssiv
e st
ren
gth
(M
pa)
Concrete mixes with different fibre lengths
Effect of fibre length on compressive strength of rubcrete
Compressive strength at 7 days Compressive strength at 28 days
Pan-African University Institute for Basic Science, Technology and Innovation
80
paste in concrete matrix and the lower modulus of elasticity of crumb rubber compared
to conventional sand.
At 12.5% crumb rubber replacement, the rubber concrete split tensile strength
was1.83Mpa and 2.56Mpa which correspond to reductions of 17.31% and 17.44% at
7 and 28 days respectively. The inclusion of randomly distributed RTSF of different
volume 0.3 ,0.6 ,0.9 ,1.2%, the reductions in split tensile strength were 15.25 ,7.43
,1.17 and 0.30%; and 14.97 ,10.42 ,5.55 and 0.27 at 7 and 28 days respectively. As it
can be seen on Figure 4.8, The split tensile strength increases with increase in Recycled
tyre steel fibre content. This is in accordance with what Williamson 1974 stated, that
steel fibre can increase Split tensile strength up 40% and on the current research, it
increased up to a maximum of 17.17% at 28 days.
Different fibre lengths with a constant fibre volume of 1.2% were added in rubber
concrete, the results showed that RTSF with 60mm length performed better than other
two lengths on split tensile strength of rubber concrete and it is shown on Figure 4.9
of this book. The maximum Split tensile strength was found at 1.2% of fibre volume
with aspect ratio of 52, where the values were 2.20Mpa and 3.10Mpa at 7 and 28 days
respectively. It can be concluded that, the split tensile strength increases with increase
in aspect ratio, though higher value of aspect ratio can affect the strength causing fibre
balling, hence limitation should be put.
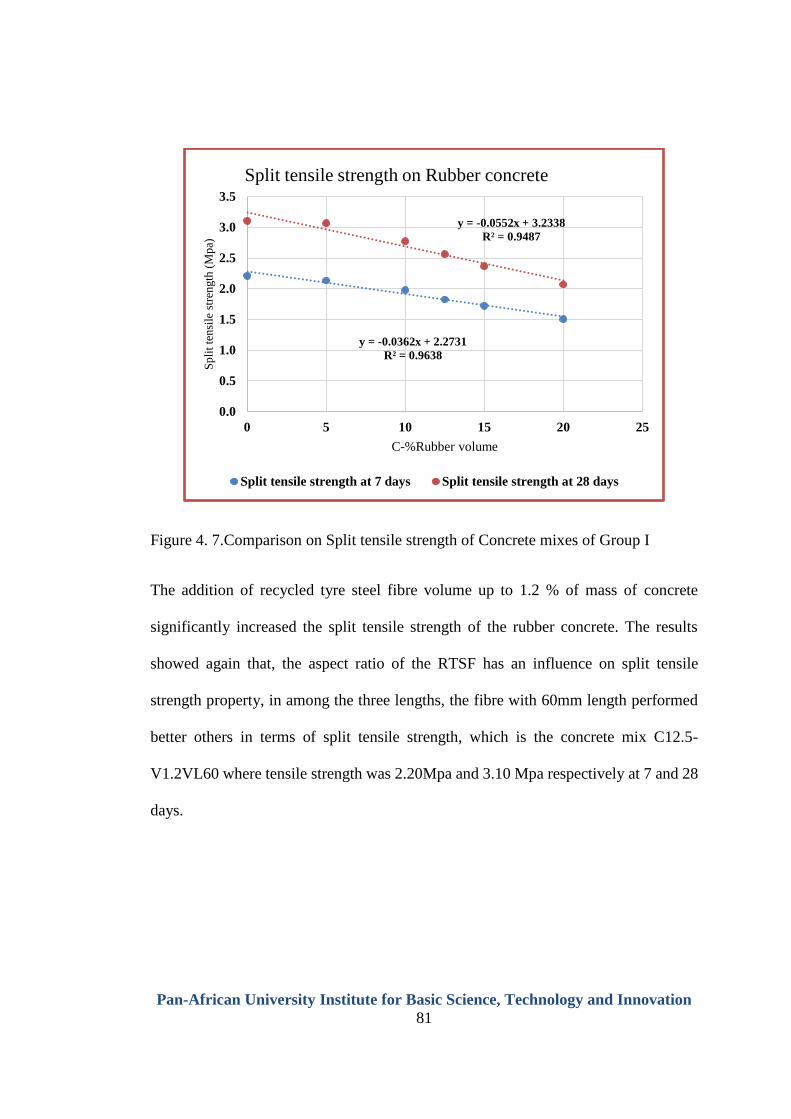
Pan-African University Institute for Basic Science, Technology and Innovation
81
Figure 4. 7.Comparison on Split tensile strength of Concrete mixes of Group I
The addition of recycled tyre steel fibre volume up to 1.2 % of mass of concrete
significantly increased the split tensile strength of the rubber concrete. The results
showed again that, the aspect ratio of the RTSF has an influence on split tensile
strength property, in among the three lengths, the fibre with 60mm length performed
better others in terms of split tensile strength, which is the concrete mix C12.5-
V1.2VL60 where tensile strength was 2.20Mpa and 3.10 Mpa respectively at 7 and 28
days.
y = -0.0362x + 2.2731
R² = 0.9638
y = -0.0552x + 3.2338
R² = 0.9487
0.0
0.5
1.0
1.5
2.0
2.5
3.0
3.5
0 5 10 15 20 25
Sp
lit
ten
sile
str
ength
(M
pa)
C-%Rubber volume
Split tensile strength on Rubber concrete
Split tensile strength at 7 days Split tensile strength at 28 days
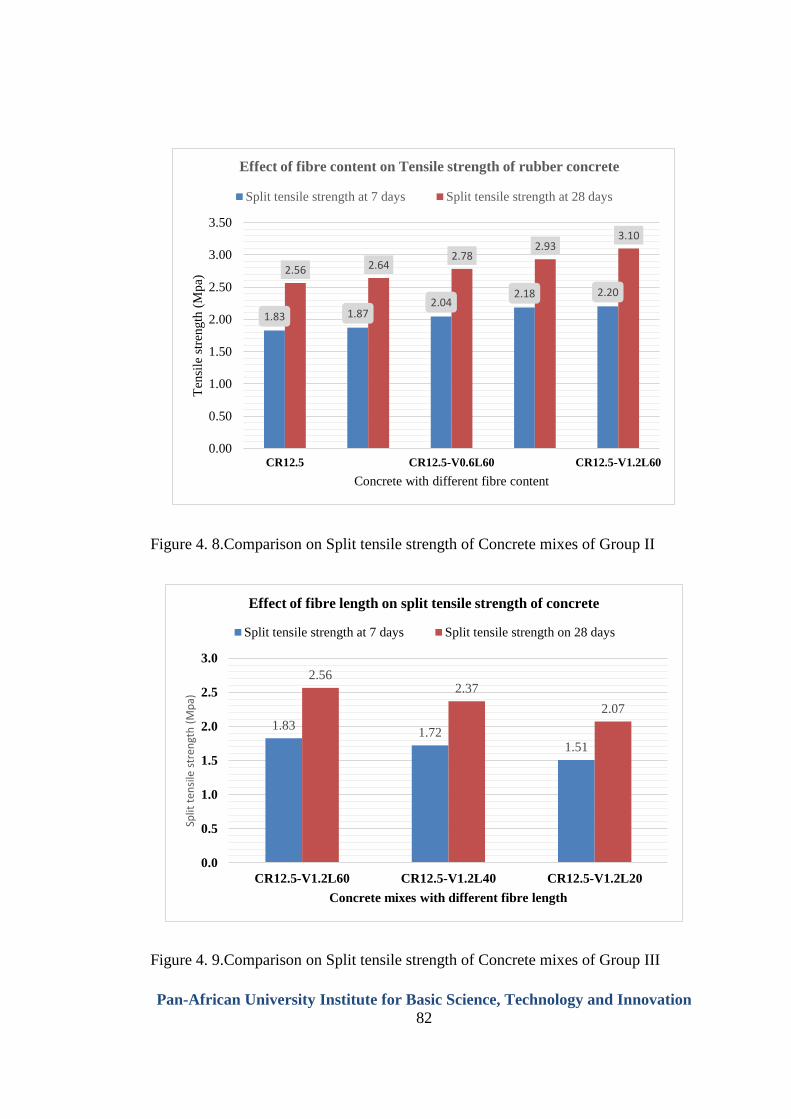
Pan-African University Institute for Basic Science, Technology and Innovation
82
Figure 4. 8.Comparison on Split tensile strength of Concrete mixes of Group II
Figure 4. 9.Comparison on Split tensile strength of Concrete mixes of Group III
1.83 1.872.04
2.18 2.20
2.56 2.642.78
2.933.10
0.00
0.50
1.00
1.50
2.00
2.50
3.00
3.50
CR12.5 CR12.5-V0.6L60 CR12.5-V1.2L60
Ten
sile
str
ength
(M
pa)
Concrete with different fibre content
Effect of fibre content on Tensile strength of rubber concrete
Split tensile strength at 7 days Split tensile strength at 28 days
1.831.72
1.51
2.562.37
2.07
0.0
0.5
1.0
1.5
2.0
2.5
3.0
CR12.5-V1.2L60 CR12.5-V1.2L40 CR12.5-V1.2L20
Split
ten
sile
str
engt
h (
Mp
a)
Concrete mixes with different fibre length
Effect of fibre length on split tensile strength of concrete
Split tensile strength at 7 days Split tensile strength on 28 days
Pan-African University Institute for Basic Science, Technology and Innovation
83
The additional of Recycled tyre steel fibre in rubber concrete slightly enhanced
Compressive and split tensile strength properties of rubber concrete. For addition of
RTSF up to 1.2% volume, the decrease in tensile strength of the mix CR12.5 decreased
from 17.44 to 0.27% of tensile strength which is 17.17% increment. Same applied to
Compressive strength, the addition of RTSF up to 1.2%, the decrease in compressive
strength of CR12.5 mix were from 21.51 to 10.38%, which is 11.13% increment. The
results agree with what was reported that, the addition of steel fibre in concrete matrix
will have minor effect on compressive strength (0 to 15%) increment but, the tensile
strength will have an increment of up to 2.5 times that of unreinforced one (Fousil
Fouad Wafa, 1990).
Generally, based on Figure 4.10, the inclusion of RTSF enhanced split tensile strength
more than compressive strength. The Recycled tyre steel fibre counteracted the
negative effect of 12.5% Crumb rubber content on split tensile strength of concrete.
Though there is a remarkable increase in compressive strength by incorporating
randomly distributed recycled tyre steel fibre in rubber concrete, this increase is so
minor, it can be ignored in design considerations. On the other hand, incorporating of
recycled tyre steel fibre in concrete has a positive effect on mechanical properties of
concrete.
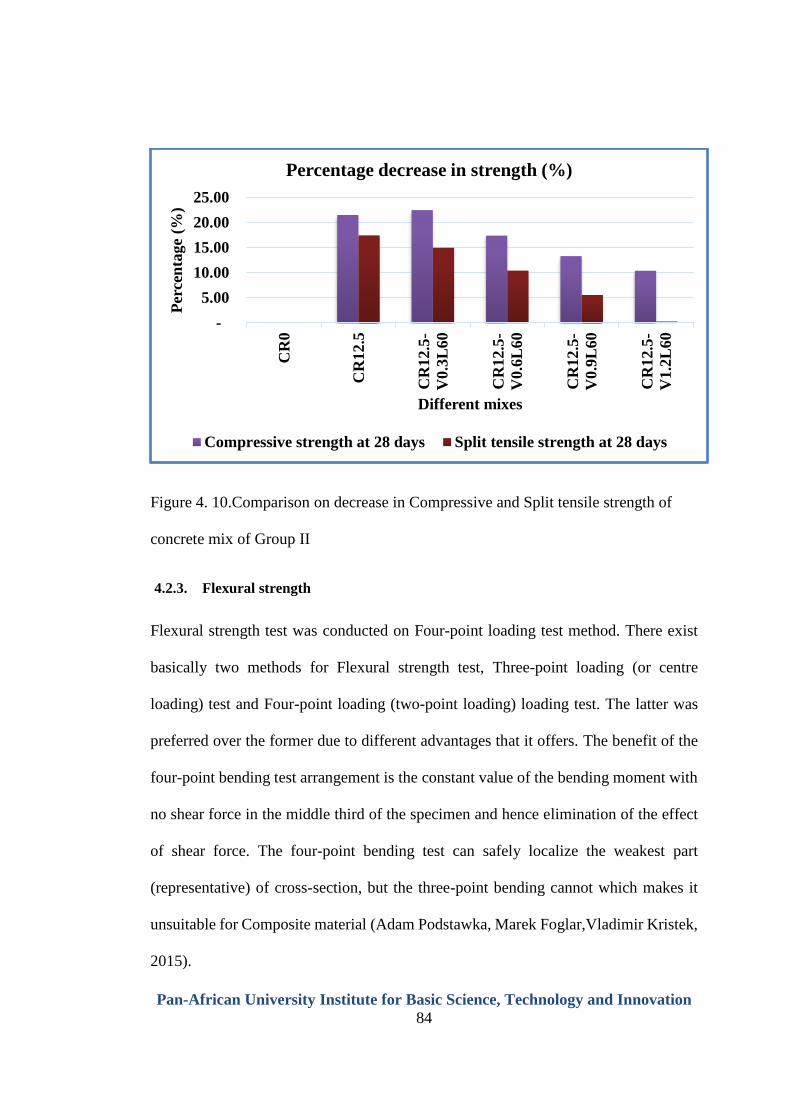
Pan-African University Institute for Basic Science, Technology and Innovation
84
Figure 4. 10.Comparison on decrease in Compressive and Split tensile strength of
concrete mix of Group II
4.2.3. Flexural strength
Flexural strength test was conducted on Four-point loading test method. There exist
basically two methods for Flexural strength test, Three-point loading (or centre
loading) test and Four-point loading (two-point loading) loading test. The latter was
preferred over the former due to different advantages that it offers. The benefit of the
four-point bending test arrangement is the constant value of the bending moment with
no shear force in the middle third of the specimen and hence elimination of the effect
of shear force. The four-point bending test can safely localize the weakest part
(representative) of cross-section, but the three-point bending cannot which makes it
unsuitable for Composite material (Adam Podstawka, Marek Foglar,Vladimir Kristek,
2015).
-
5.00
10.00
15.00
20.00
25.00
CR
0
CR
12.5
CR
12.5
-
V0.3
L60
CR
12.5
-
V0.6
L60
CR
12.5
-
V0.9
L60
CR
12.5
-
V1
.2L
60
Per
cen
tage
(%)
Different mixes
Percentage decrease in strength (%)
Compressive strength at 28 days Split tensile strength at 28 days
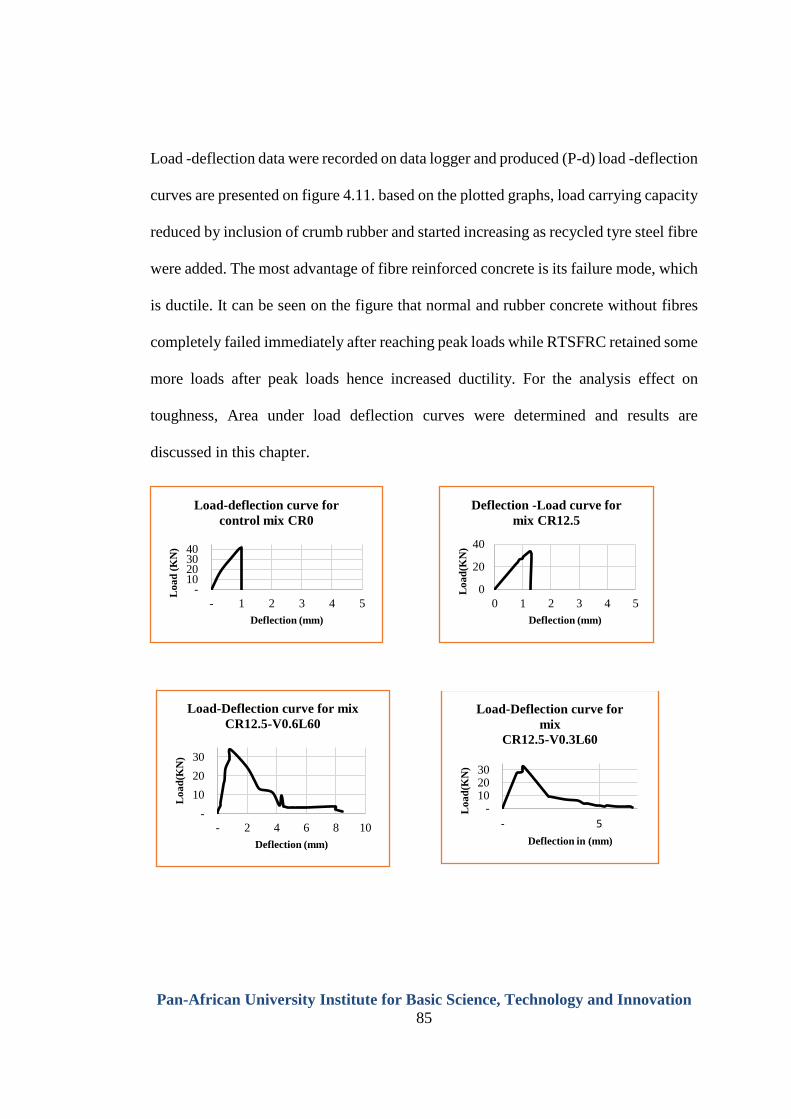
Pan-African University Institute for Basic Science, Technology and Innovation
85
Load -deflection data were recorded on data logger and produced (P-d) load -deflection
curves are presented on figure 4.11. based on the plotted graphs, load carrying capacity
reduced by inclusion of crumb rubber and started increasing as recycled tyre steel fibre
were added. The most advantage of fibre reinforced concrete is its failure mode, which
is ductile. It can be seen on the figure that normal and rubber concrete without fibres
completely failed immediately after reaching peak loads while RTSFRC retained some
more loads after peak loads hence increased ductility. For the analysis effect on
toughness, Area under load deflection curves were determined and results are
discussed in this chapter.
- 10 20 30 40
- 1 2 3 4 5
Lo
ad
(K
N)
Deflection (mm)
Load-deflection curve for
control mix CR0
0
20
40
0 1 2 3 4 5
Lo
ad
(KN
)
Deflection (mm)
Deflection -Load curve for
mix CR12.5
- 10 20 30
- 5
Lo
ad
(KN
)
Deflection in (mm)
Load-Deflection curve for
mix
CR12.5-V0.3L60
-
10
20
30
- 2 4 6 8 10
Lo
ad
(KN
)
Deflection (mm)
Load-Deflection curve for mix
CR12.5-V0.6L60
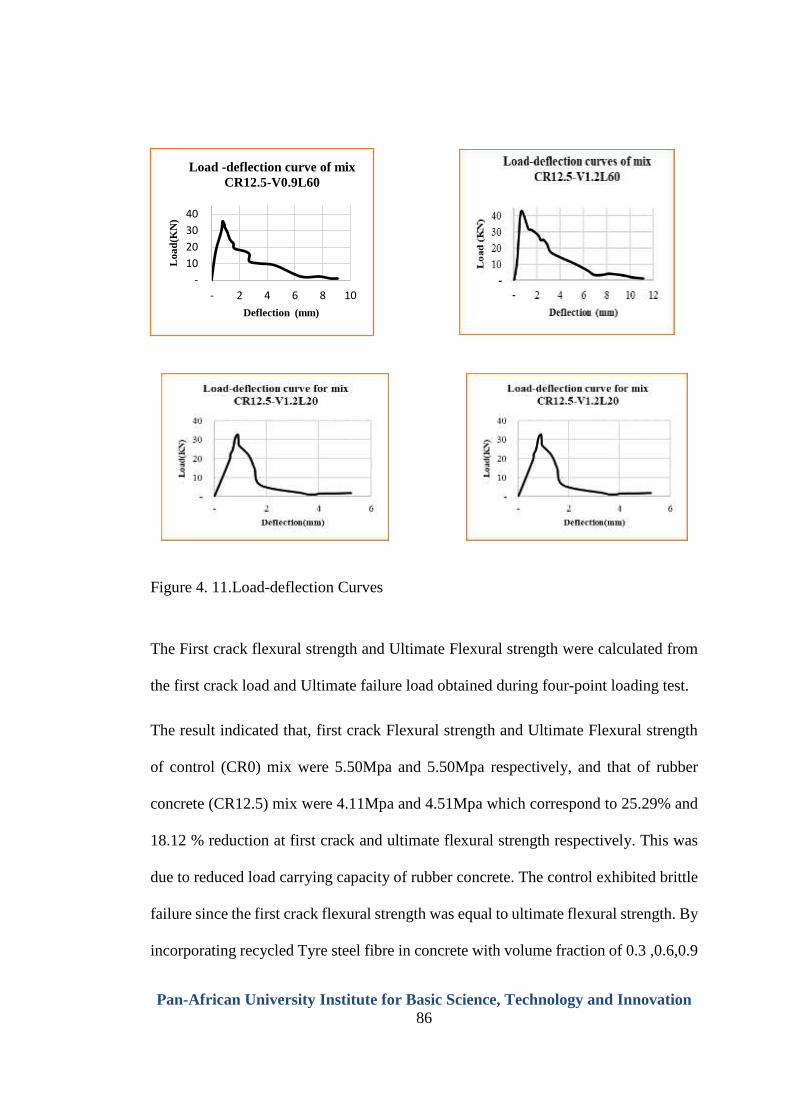
Pan-African University Institute for Basic Science, Technology and Innovation
86
Figure 4. 11.Load-deflection Curves
The First crack flexural strength and Ultimate Flexural strength were calculated from
the first crack load and Ultimate failure load obtained during four-point loading test.
The result indicated that, first crack Flexural strength and Ultimate Flexural strength
of control (CR0) mix were 5.50Mpa and 5.50Mpa respectively, and that of rubber
concrete (CR12.5) mix were 4.11Mpa and 4.51Mpa which correspond to 25.29% and
18.12 % reduction at first crack and ultimate flexural strength respectively. This was
due to reduced load carrying capacity of rubber concrete. The control exhibited brittle
failure since the first crack flexural strength was equal to ultimate flexural strength. By
incorporating recycled Tyre steel fibre in concrete with volume fraction of 0.3 ,0.6,0.9
-
10
20
30
40
- 2 4 6 8 10
Lo
ad
(KN
)
Deflection (mm)
Load -deflection curve of mix
CR12.5-V0.9L60
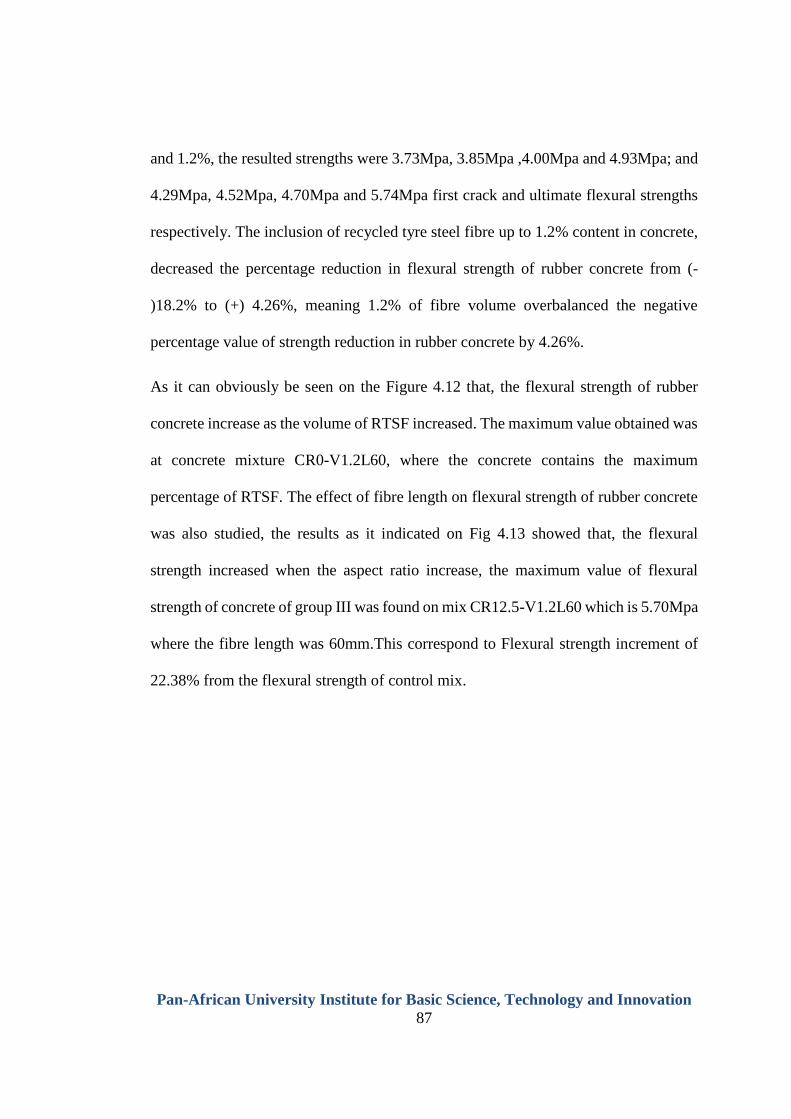
Pan-African University Institute for Basic Science, Technology and Innovation
87
and 1.2%, the resulted strengths were 3.73Mpa, 3.85Mpa ,4.00Mpa and 4.93Mpa; and
4.29Mpa, 4.52Mpa, 4.70Mpa and 5.74Mpa first crack and ultimate flexural strengths
respectively. The inclusion of recycled tyre steel fibre up to 1.2% content in concrete,
decreased the percentage reduction in flexural strength of rubber concrete from (-
)18.2% to (+) 4.26%, meaning 1.2% of fibre volume overbalanced the negative
percentage value of strength reduction in rubber concrete by 4.26%.
As it can obviously be seen on the Figure 4.12 that, the flexural strength of rubber
concrete increase as the volume of RTSF increased. The maximum value obtained was
at concrete mixture CR0-V1.2L60, where the concrete contains the maximum
percentage of RTSF. The effect of fibre length on flexural strength of rubber concrete
was also studied, the results as it indicated on Fig 4.13 showed that, the flexural
strength increased when the aspect ratio increase, the maximum value of flexural
strength of concrete of group III was found on mix CR12.5-V1.2L60 which is 5.70Mpa
where the fibre length was 60mm.This correspond to Flexural strength increment of
22.38% from the flexural strength of control mix.
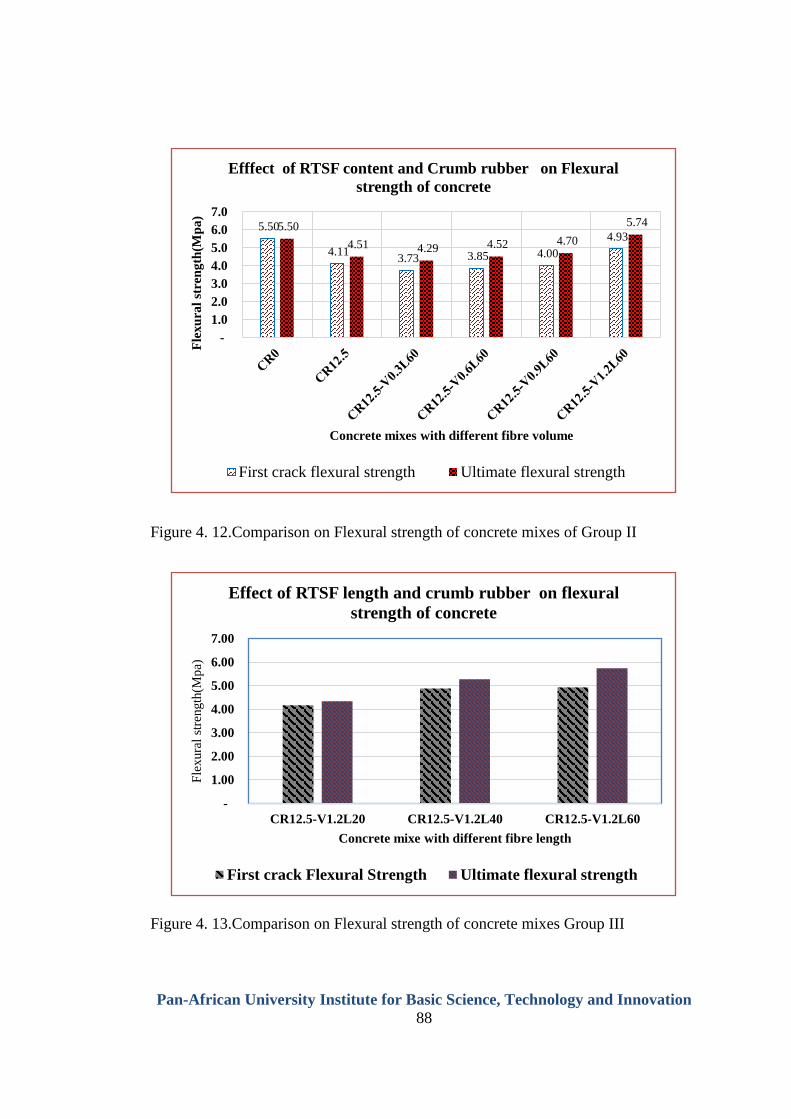
Pan-African University Institute for Basic Science, Technology and Innovation
88
Figure 4. 12.Comparison on Flexural strength of concrete mixes of Group II
Figure 4. 13.Comparison on Flexural strength of concrete mixes Group III
5.50
4.11 3.73 3.85 4.00
4.93 5.50
4.51 4.29 4.52 4.70
5.74
-
1.0
2.0
3.0
4.0
5.0
6.0
7.0
Fle
xu
ral
stre
ng
th(M
pa
)
Concrete mixes with different fibre volume
Efffect of RTSF content and Crumb rubber on Flexural
strength of concrete
First crack flexural strength Ultimate flexural strength
-
1.00
2.00
3.00
4.00
5.00
6.00
7.00
CR12.5-V1.2L20 CR12.5-V1.2L40 CR12.5-V1.2L60
Fle
xura
l st
rength
(Mp
a)
Concrete mixe with different fibre length
Effect of RTSF length and crumb rubber on flexural
strength of concrete
First crack Flexural Strength Ultimate flexural strength
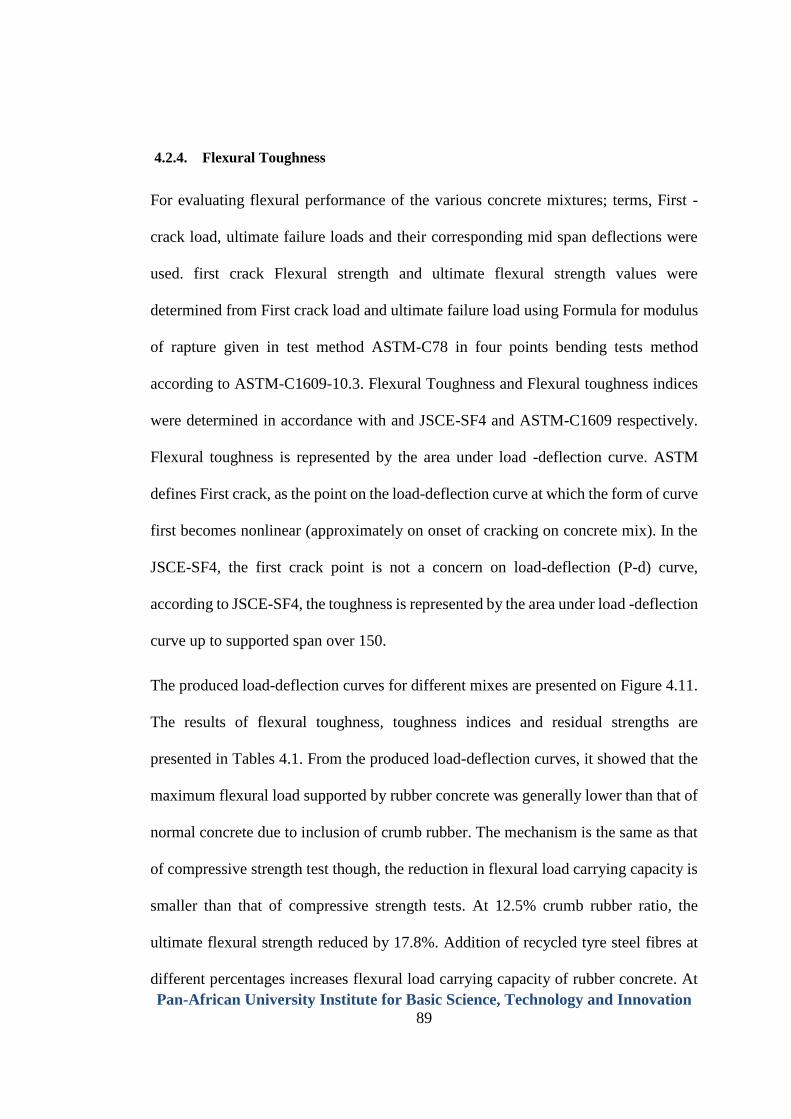
Pan-African University Institute for Basic Science, Technology and Innovation
89
4.2.4. Flexural Toughness
For evaluating flexural performance of the various concrete mixtures; terms, First -
crack load, ultimate failure loads and their corresponding mid span deflections were
used. first crack Flexural strength and ultimate flexural strength values were
determined from First crack load and ultimate failure load using Formula for modulus
of rapture given in test method ASTM-C78 in four points bending tests method
according to ASTM-C1609-10.3. Flexural Toughness and Flexural toughness indices
were determined in accordance with and JSCE-SF4 and ASTM-C1609 respectively.
Flexural toughness is represented by the area under load -deflection curve. ASTM
defines First crack, as the point on the load-deflection curve at which the form of curve
first becomes nonlinear (approximately on onset of cracking on concrete mix). In the
JSCE-SF4, the first crack point is not a concern on load-deflection (P-d) curve,
according to JSCE-SF4, the toughness is represented by the area under load -deflection
curve up to supported span over 150.
The produced load-deflection curves for different mixes are presented on Figure 4.11.
The results of flexural toughness, toughness indices and residual strengths are
presented in Tables 4.1. From the produced load-deflection curves, it showed that the
maximum flexural load supported by rubber concrete was generally lower than that of
normal concrete due to inclusion of crumb rubber. The mechanism is the same as that
of compressive strength test though, the reduction in flexural load carrying capacity is
smaller than that of compressive strength tests. At 12.5% crumb rubber ratio, the
ultimate flexural strength reduced by 17.8%. Addition of recycled tyre steel fibres at
different percentages increases flexural load carrying capacity of rubber concrete. At
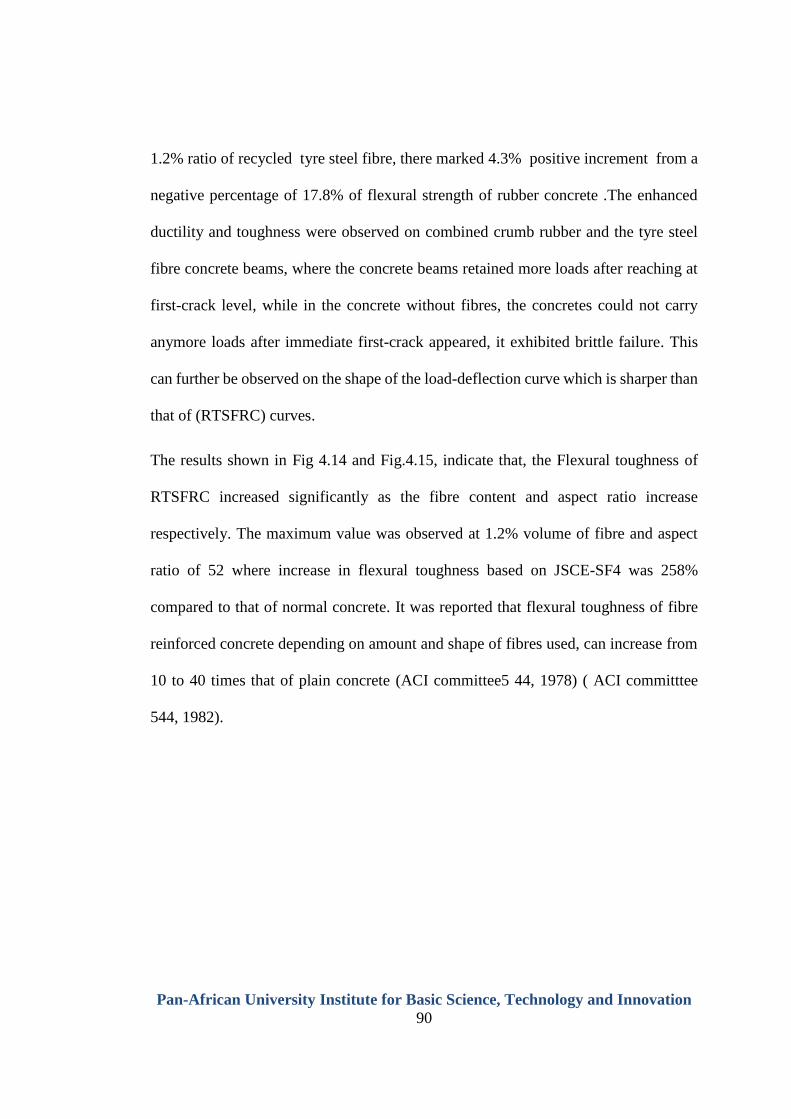
Pan-African University Institute for Basic Science, Technology and Innovation
90
1.2% ratio of recycled tyre steel fibre, there marked 4.3% positive increment from a
negative percentage of 17.8% of flexural strength of rubber concrete .The enhanced
ductility and toughness were observed on combined crumb rubber and the tyre steel
fibre concrete beams, where the concrete beams retained more loads after reaching at
first-crack level, while in the concrete without fibres, the concretes could not carry
anymore loads after immediate first-crack appeared, it exhibited brittle failure. This
can further be observed on the shape of the load-deflection curve which is sharper than
that of (RTSFRC) curves.
The results shown in Fig 4.14 and Fig.4.15, indicate that, the Flexural toughness of
RTSFRC increased significantly as the fibre content and aspect ratio increase
respectively. The maximum value was observed at 1.2% volume of fibre and aspect
ratio of 52 where increase in flexural toughness based on JSCE-SF4 was 258%
compared to that of normal concrete. It was reported that flexural toughness of fibre
reinforced concrete depending on amount and shape of fibres used, can increase from
10 to 40 times that of plain concrete (ACI committee5 44, 1978) ( ACI committtee
544, 1982).
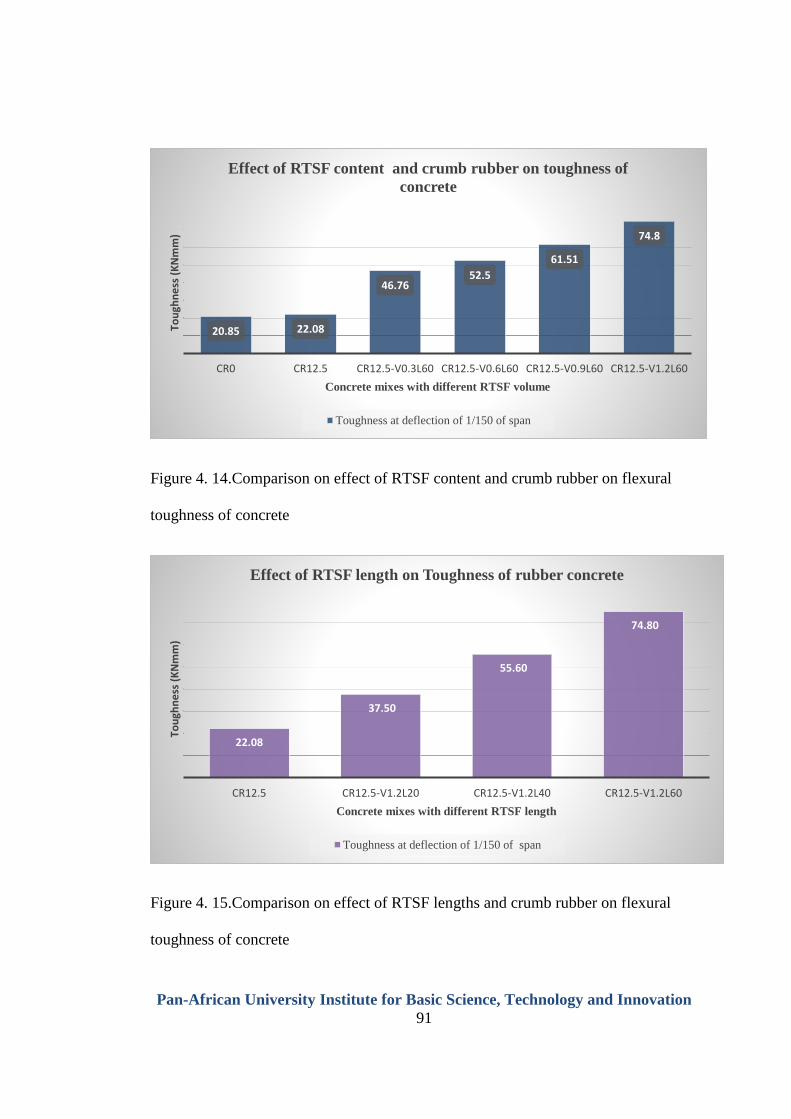
Pan-African University Institute for Basic Science, Technology and Innovation
91
Figure 4. 14.Comparison on effect of RTSF content and crumb rubber on flexural
toughness of concrete
Figure 4. 15.Comparison on effect of RTSF lengths and crumb rubber on flexural
toughness of concrete
20.85 22.08
46.7652.5
61.51
74.8
CR0 CR12.5 CR12.5-V0.3L60 CR12.5-V0.6L60 CR12.5-V0.9L60 CR12.5-V1.2L60
Tou
ghn
ess
(K
Nm
m)
Concrete mixes with different RTSF volume
Effect of RTSF content and crumb rubber on toughness of
concrete
Toughness at deflection of 1/150 of span
22.08
37.50
55.60
74.80
CR12.5 CR12.5-V1.2L20 CR12.5-V1.2L40 CR12.5-V1.2L60
Tou
ghn
ess
(K
Nm
m)
Concrete mixes with different RTSF length
Effect of RTSF length on Toughness of rubber concrete
Toughness at deflection of 1/150 of span
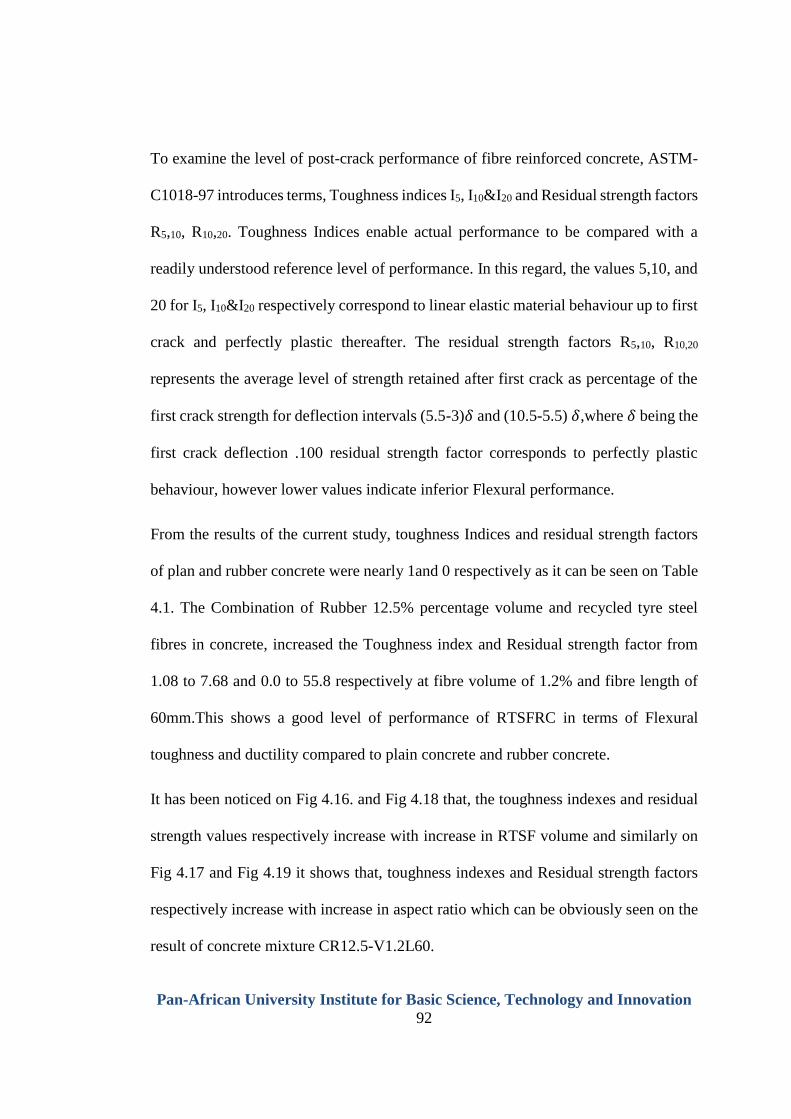
Pan-African University Institute for Basic Science, Technology and Innovation
92
To examine the level of post-crack performance of fibre reinforced concrete, ASTM-
C1018-97 introduces terms, Toughness indices I5, I10&I20 and Residual strength factors
R5,10, R10,20. Toughness Indices enable actual performance to be compared with a
readily understood reference level of performance. In this regard, the values 5,10, and
20 for I5, I10&I20 respectively correspond to linear elastic material behaviour up to first
crack and perfectly plastic thereafter. The residual strength factors R5,10, R10,20
represents the average level of strength retained after first crack as percentage of the
first crack strength for deflection intervals (5.5-3)𝛿 and (10.5-5.5) 𝛿,where 𝛿 being the
first crack deflection .100 residual strength factor corresponds to perfectly plastic
behaviour, however lower values indicate inferior Flexural performance.
From the results of the current study, toughness Indices and residual strength factors
of plan and rubber concrete were nearly 1and 0 respectively as it can be seen on Table
4.1. The Combination of Rubber 12.5% percentage volume and recycled tyre steel
fibres in concrete, increased the Toughness index and Residual strength factor from
1.08 to 7.68 and 0.0 to 55.8 respectively at fibre volume of 1.2% and fibre length of
60mm.This shows a good level of performance of RTSFRC in terms of Flexural
toughness and ductility compared to plain concrete and rubber concrete.
It has been noticed on Fig 4.16. and Fig 4.18 that, the toughness indexes and residual
strength values respectively increase with increase in RTSF volume and similarly on
Fig 4.17 and Fig 4.19 it shows that, toughness indexes and Residual strength factors
respectively increase with increase in aspect ratio which can be obviously seen on the
result of concrete mixture CR12.5-V1.2L60.
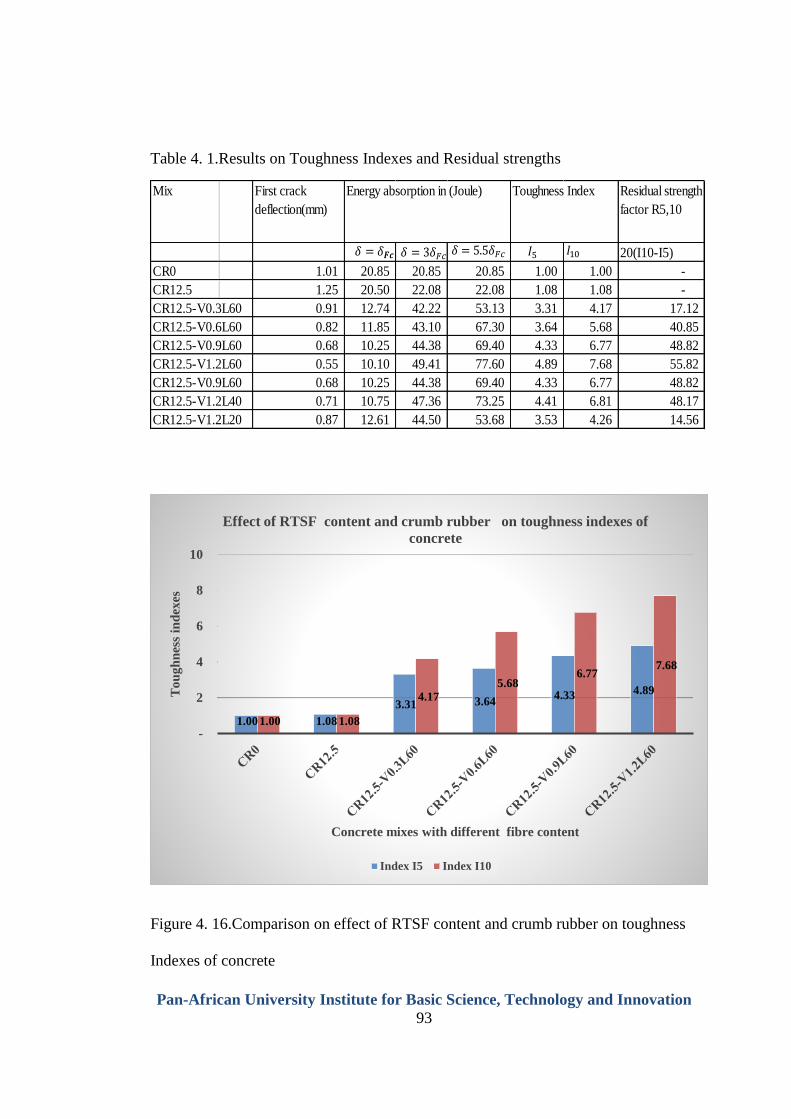
Pan-African University Institute for Basic Science, Technology and Innovation
93
Table 4. 1.Results on Toughness Indexes and Residual strengths
Figure 4. 16.Comparison on effect of RTSF content and crumb rubber on toughness
Indexes of concrete
Mix First crack
deflection(mm)
Energy absorption in (Joule) Toughness Index Residual strength
factor R5,10
20(I10-I5)
CR0 1.01 20.85 20.85 20.85 1.00 1.00 -
CR12.5 1.25 20.50 22.08 22.08 1.08 1.08 -
CR12.5-V0.3L60 0.91 12.74 42.22 53.13 3.31 4.17 17.12
CR12.5-V0.6L60 0.82 11.85 43.10 67.30 3.64 5.68 40.85
CR12.5-V0.9L60 0.68 10.25 44.38 69.40 4.33 6.77 48.82
CR12.5-V1.2L60 0.55 10.10 49.41 77.60 4.89 7.68 55.82
CR12.5-V0.9L60 0.68 10.25 44.38 69.40 4.33 6.77 48.82
CR12.5-V1.2L40 0.71 10.75 47.36 73.25 4.41 6.81 48.17
CR12.5-V1.2L20 0.87 12.61 44.50 53.68 3.53 4.26 14.56
𝛿 = 𝛿 𝛿 = 𝛿 𝑐 1 𝛿 = . 𝛿 𝑐
1.00 1.08
3.31 3.64 4.33 4.89
1.00 1.08
4.17
5.68 6.77
7.68
-
2
4
6
8
10
To
ug
hn
ess
ind
exes
Concrete mixes with different fibre content
Effect of RTSF content and crumb rubber on toughness indexes of
concrete
Index I5 Index I10
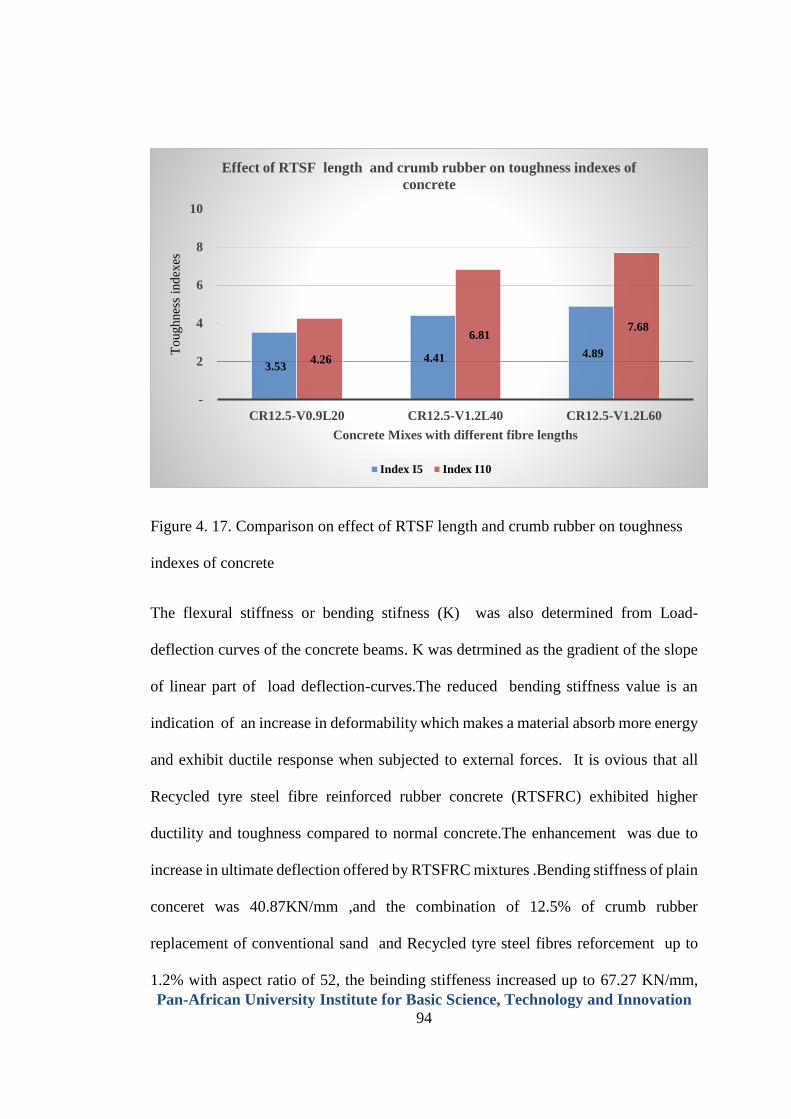
Pan-African University Institute for Basic Science, Technology and Innovation
94
Figure 4. 17. Comparison on effect of RTSF length and crumb rubber on toughness
indexes of concrete
The flexural stiffness or bending stifness (K) was also determined from Load-
deflection curves of the concrete beams. K was detrmined as the gradient of the slope
of linear part of load deflection-curves.The reduced bending stiffness value is an
indication of an increase in deformability which makes a material absorb more energy
and exhibit ductile response when subjected to external forces. It is ovious that all
Recycled tyre steel fibre reinforced rubber concrete (RTSFRC) exhibited higher
ductility and toughness compared to normal concrete.The enhancement was due to
increase in ultimate deflection offered by RTSFRC mixtures .Bending stiffness of plain
conceret was 40.87KN/mm ,and the combination of 12.5% of crumb rubber
replacement of conventional sand and Recycled tyre steel fibres reforcement up to
1.2% with aspect ratio of 52, the beinding stiffeness increased up to 67.27 KN/mm,
3.53 4.41 4.89
4.26
6.81 7.68
-
2
4
6
8
10
CR12.5-V0.9L20 CR12.5-V1.2L40 CR12.5-V1.2L60
To
ughnes
s in
dex
es
Concrete Mixes with different fibre lengths
Effect of RTSF length and crumb rubber on toughness indexes of
concrete
Index I5 Index I10
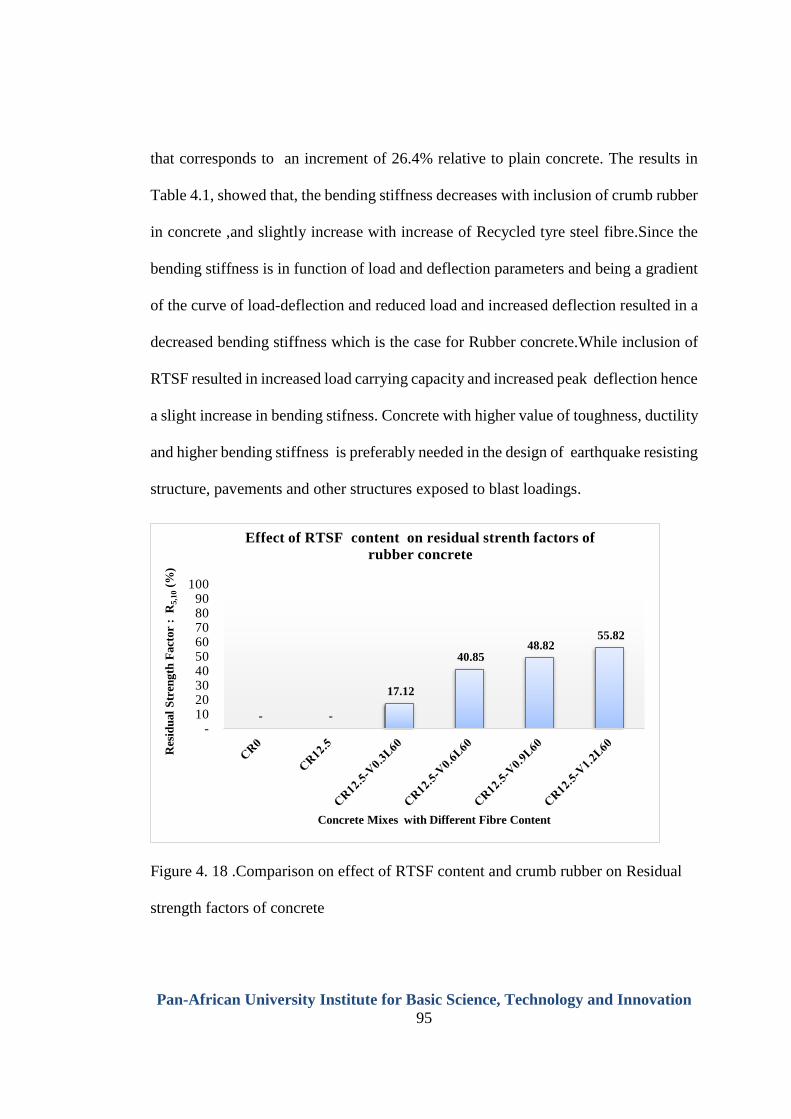
Pan-African University Institute for Basic Science, Technology and Innovation
95
that corresponds to an increment of 26.4% relative to plain concrete. The results in
Table 4.1, showed that, the bending stiffness decreases with inclusion of crumb rubber
in concrete ,and slightly increase with increase of Recycled tyre steel fibre.Since the
bending stiffness is in function of load and deflection parameters and being a gradient
of the curve of load-deflection and reduced load and increased deflection resulted in a
decreased bending stiffness which is the case for Rubber concrete.While inclusion of
RTSF resulted in increased load carrying capacity and increased peak deflection hence
a slight increase in bending stifness. Concrete with higher value of toughness, ductility
and higher bending stiffness is preferably needed in the design of earthquake resisting
structure, pavements and other structures exposed to blast loadings.
Figure 4. 18 .Comparison on effect of RTSF content and crumb rubber on Residual
strength factors of concrete
- -
17.12
40.85 48.82
55.82
-10 20 30 40 50 60 70 80 90
100
Res
idu
al
Str
eng
th F
act
or
: R
5,1
0(%
)
Concrete Mixes with Different Fibre Content
Effect of RTSF content on residual strenth factors of
rubber concrete
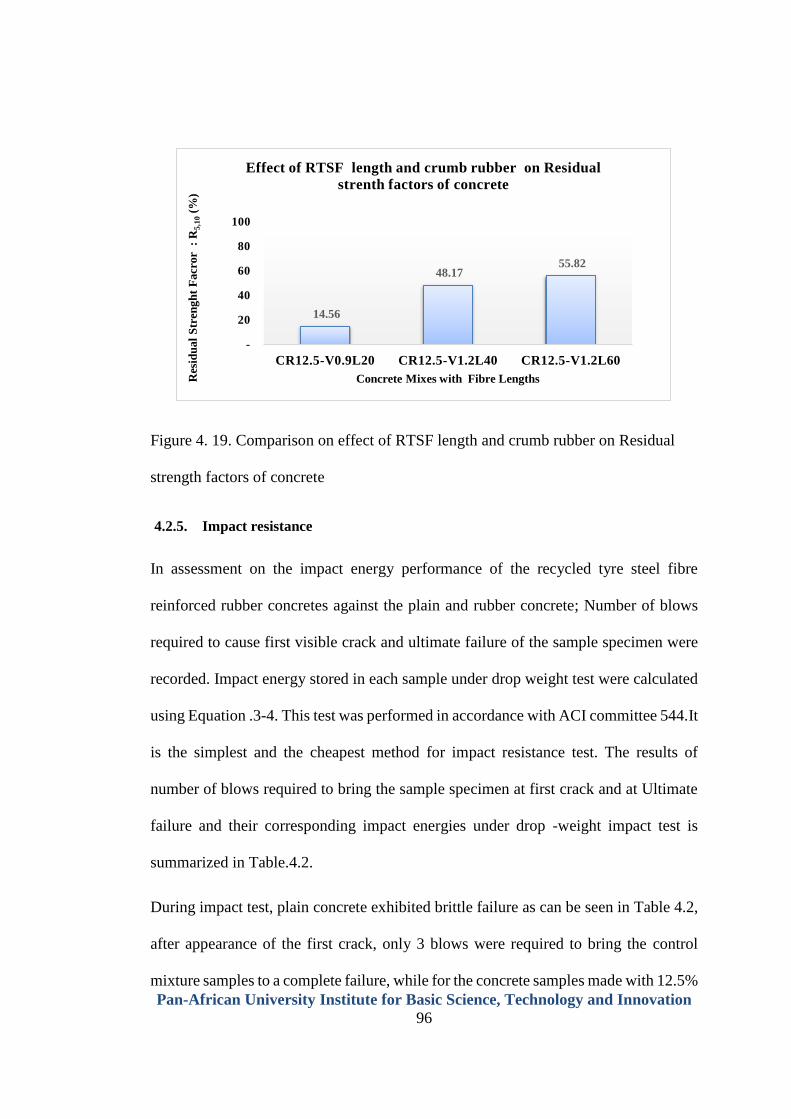
Pan-African University Institute for Basic Science, Technology and Innovation
96
Figure 4. 19. Comparison on effect of RTSF length and crumb rubber on Residual
strength factors of concrete
4.2.5. Impact resistance
In assessment on the impact energy performance of the recycled tyre steel fibre
reinforced rubber concretes against the plain and rubber concrete; Number of blows
required to cause first visible crack and ultimate failure of the sample specimen were
recorded. Impact energy stored in each sample under drop weight test were calculated
using Equation .3-4. This test was performed in accordance with ACI committee 544.It
is the simplest and the cheapest method for impact resistance test. The results of
number of blows required to bring the sample specimen at first crack and at Ultimate
failure and their corresponding impact energies under drop -weight impact test is
summarized in Table.4.2.
During impact test, plain concrete exhibited brittle failure as can be seen in Table 4.2,
after appearance of the first crack, only 3 blows were required to bring the control
mixture samples to a complete failure, while for the concrete samples made with 12.5%
14.56
48.17 55.82
-
20
40
60
80
100
CR12.5-V0.9L20 CR12.5-V1.2L40 CR12.5-V1.2L60
Res
idu
al
Str
eng
ht
Facr
or
: R
5,1
0(%
)
Concrete Mixes with Fibre Lengths
Effect of RTSF length and crumb rubber on Residual
strenth factors of concrete
Pan-African University Institute for Basic Science, Technology and Innovation
97
of rubber volume replacement and 1.2% Recycled tyre steel fibre reinforcement, a
mean of 98 blows were required to bring the sample specimen to a total failure which
is an indication of an increased impact post-crack resistance of Recycled tyre steel
fibre reinforced rubber concrete. For 1.2% recycled tyre steel fibre with 60mm length
in Rubber concrete, ultimate impact energy increased from 58 to 391.18% compared
to rubber concrete without fibre. This indicates that RTSFRC stored much more impact
energy than that of plain concrete and rubber concrete alone after peak impact load.
The results of this test conform with the reported that, Impact energy can increase 5 to
10 times that of plain concrete depending on fibre volume and its aspect ratio (Fousil
Fouad Wafa, 1990). The increased post-crack impact behaviour of RTSFRC composite
materials is attributed to be caused by the recycled tyre steel fibre which act as arrestors
bridging the gapes of cracks and limiting initiation and further propagation of created
cracks. It can be concluded from Figure 4.20 and Figure 4.21 that, the number of blows
required to bring a concrete sample at first visible crack and ultimate failure increases
with increase in RTSF content and further increases with increase in aspect ratio
respectively. Similarly, as it is represented on Figure 4.22 and Figure 4.23, the impact
energy resisted by a concrete sample up to first visible crack and to a complete failure
increases with increase in recycled tyre steel fibre volume and further increases with
increase in aspect ratio.
Table 4. 2.Results on Impact resistance of the mix group II and III
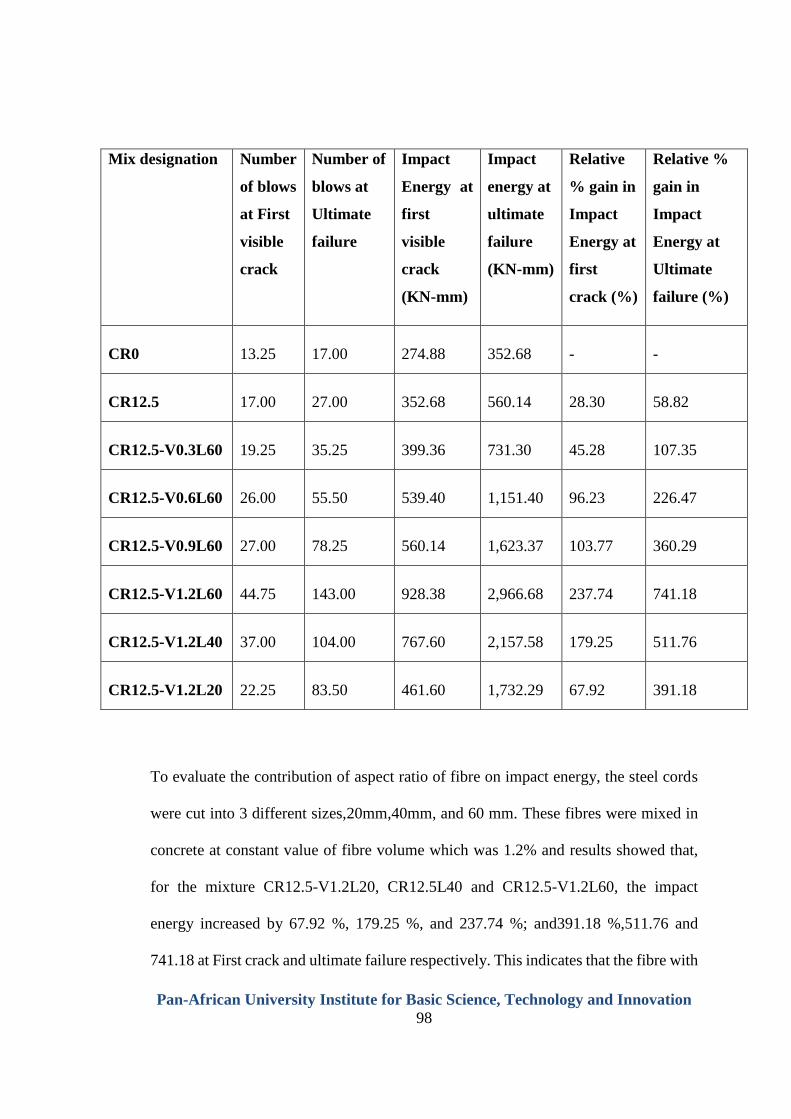
Pan-African University Institute for Basic Science, Technology and Innovation
98
Mix designation Number
of blows
at First
visible
crack
Number of
blows at
Ultimate
failure
Impact
Energy at
first
visible
crack
(KN-mm)
Impact
energy at
ultimate
failure
(KN-mm)
Relative
% gain in
Impact
Energy at
first
crack (%)
Relative %
gain in
Impact
Energy at
Ultimate
failure (%)
CR0
13.25
17.00
274.88
352.68
-
-
CR12.5
17.00
27.00
352.68
560.14
28.30
58.82
CR12.5-V0.3L60
19.25
35.25
399.36
731.30
45.28
107.35
CR12.5-V0.6L60
26.00
55.50
539.40
1,151.40
96.23
226.47
CR12.5-V0.9L60
27.00
78.25
560.14
1,623.37
103.77
360.29
CR12.5-V1.2L60
44.75
143.00
928.38
2,966.68
237.74
741.18
CR12.5-V1.2L40
37.00
104.00
767.60
2,157.58
179.25
511.76
CR12.5-V1.2L20
22.25
83.50
461.60
1,732.29
67.92
391.18
To evaluate the contribution of aspect ratio of fibre on impact energy, the steel cords
were cut into 3 different sizes,20mm,40mm, and 60 mm. These fibres were mixed in
concrete at constant value of fibre volume which was 1.2% and results showed that,
for the mixture CR12.5-V1.2L20, CR12.5L40 and CR12.5-V1.2L60, the impact
energy increased by 67.92 %, 179.25 %, and 237.74 %; and391.18 %,511.76 and
741.18 at First crack and ultimate failure respectively. This indicates that the fibre with
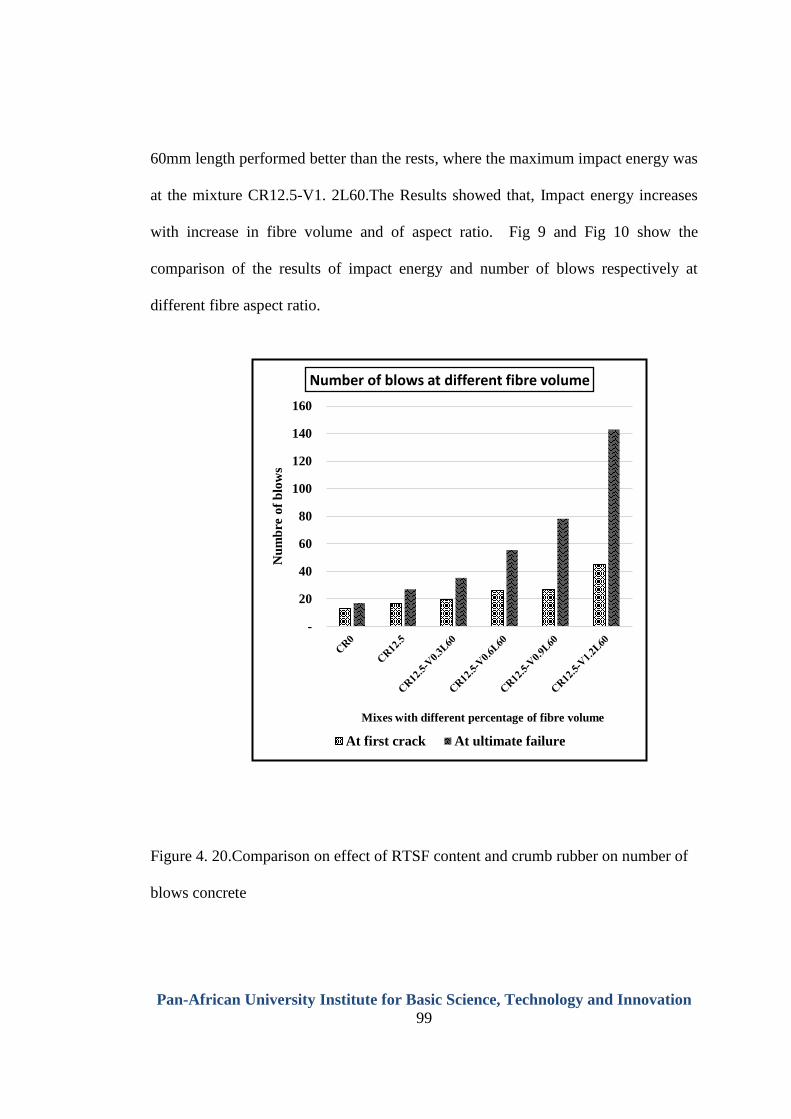
Pan-African University Institute for Basic Science, Technology and Innovation
99
60mm length performed better than the rests, where the maximum impact energy was
at the mixture CR12.5-V1. 2L60.The Results showed that, Impact energy increases
with increase in fibre volume and of aspect ratio. Fig 9 and Fig 10 show the
comparison of the results of impact energy and number of blows respectively at
different fibre aspect ratio.
Figure 4. 20.Comparison on effect of RTSF content and crumb rubber on number of
blows concrete
-
20
40
60
80
100
120
140
160
Nu
mb
re o
f b
low
s
Mixes with different percentage of fibre volume
Number of blows at different fibre volume
At first crack At ultimate failure
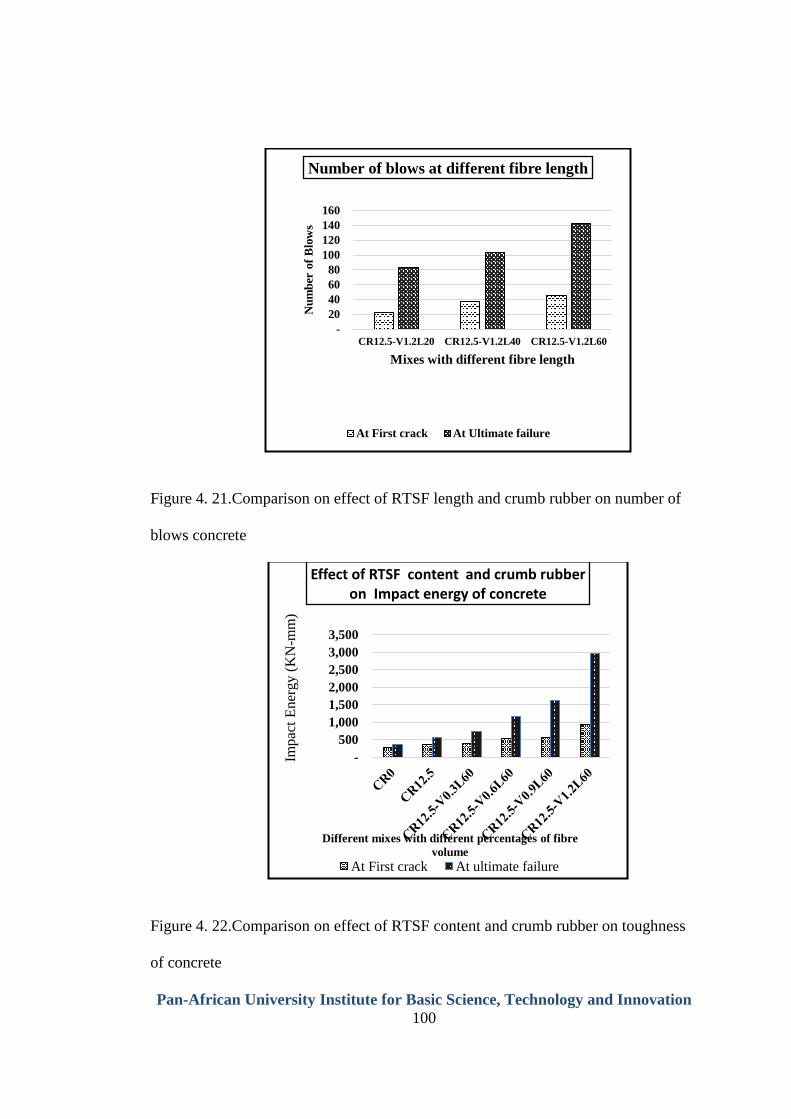
Pan-African University Institute for Basic Science, Technology and Innovation
100
Figure 4. 21.Comparison on effect of RTSF length and crumb rubber on number of
blows concrete
Figure 4. 22.Comparison on effect of RTSF content and crumb rubber on toughness
of concrete
-
20
40
60
80
100
120
140
160
CR12.5-V1.2L20 CR12.5-V1.2L40 CR12.5-V1.2L60
Nu
mb
er o
f B
low
s
Mixes with different fibre length
Number of blows at different fibre length
At First crack At Ultimate failure
-
500
1,000
1,500
2,000
2,500
3,000
3,500
Impac
t E
ner
gy (
KN
-mm
)
Different mixes with different percentages of fibre
volume
Effect of RTSF content and crumb rubber on Impact energy of concrete
At First crack At ultimate failure
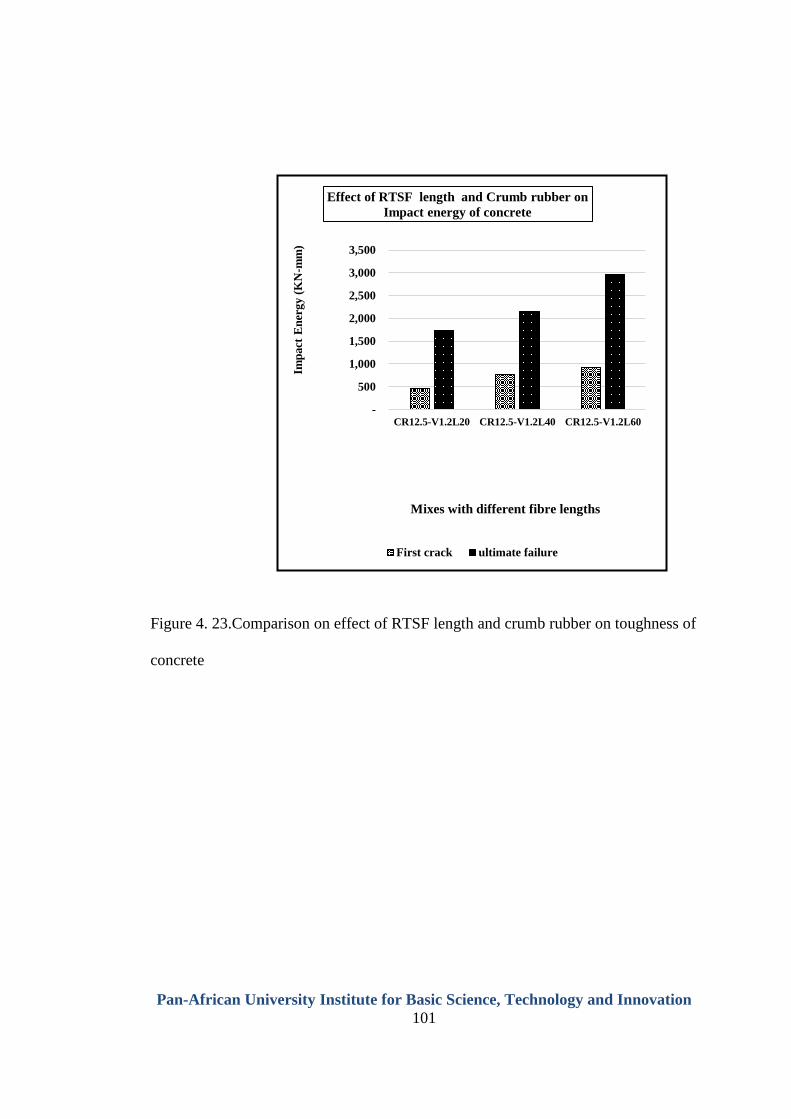
Pan-African University Institute for Basic Science, Technology and Innovation
101
Figure 4. 23.Comparison on effect of RTSF length and crumb rubber on toughness of
concrete
-
500
1,000
1,500
2,000
2,500
3,000
3,500
CR12.5-V1.2L20 CR12.5-V1.2L40 CR12.5-V1.2L60
Imp
act
En
erg
y (
KN
-mm
)
Mixes with different fibre lengths
Effect of RTSF length and Crumb rubber on
Impact energy of concrete
First crack ultimate failure
Pan-African University Institute for Basic Science, Technology and Innovation
102
CHAPTER FIVE: CONCLUSION AND RECOMMENDATION
5.1.Conclusion
This research was limited to experimentally Investigating effect of recycled tyre steel
fibres as reinforcement on mechanical properties, flexural toughness and impact
energy resistance of rubber concrete. Based on results of this study, the following
conclusions have been made:
Workability of concrete increase with increase in crumb rubber replacement of fine
aggregates. The additional of RTSF in rubber concrete reduces workability because,
the composite concrete tends to be stiff and become less practicable. Water reducers
(superplasticisers) as additives are required in RTSFRC to improve the workability. It
was noticed that, when the RTSF volume increase, workability decreases, and it further
decreases with increase in its aspect ratio
The compressive and split tensile strength of concrete reduce with increase in crumb
rubber aggregate in concrete. This reduction is reported to be caused by weak bond
between rubber particles and cement paste, as well as low modulus of elasticity of
rubber compared to conventional aggregates. In this research ,12.5% crumb rubber
volume was taken as optimum rubber volume where the reduction in compressive
strength was nearly not more than 20%. Incorporating of different percentages of
RTSF in CR12.5 mix resulted in a little improved compressive strength where at 1.2%
addition of recycled tyre steel fibre with 40mm length, the compressive strength
reduced by 10.07%, which is almost 9% increment from the rubber concrete
compressive strength. Rubber concrete with 1.2% volume of RTSF and 40mm length
Pan-African University Institute for Basic Science, Technology and Innovation
103
performed better than other RTSFRC mixtures in terms of compressive strength, while
the RTSFRC mixture with fibre length of 60mm performed better than that of 40mm
and 20mm.
Increase in crumb rubber substitutions in concrete reduces flexural load carrying
capacity (peak load), hence reduced flexural strength. The ductility of concrete
increase with increase in crumb rubber. Combining RTSF with crumb rubber resulted
in a significantly increased ductility and toughness of concrete. The RTSFRC mixes
evidenced an enhanced post-crack strength behaviour allowing further deflections after
peak load is reached. Index I10 and residual strength R5,10, of a concrete mixture with
1.2% of RTSF were 7.68 and 55.82 while for the plain concrete were 1 and 0
respectively. Meaning that, the composite material retained furthermore flexural loads
after first crack. The maximum toughness was observed for a mixture CR12.5-
V1.2L60 where, flexural toughness increased by 258.75% compared to plain concrete.
This indicates that, toughness increases with increase in RTSF volume and further
increases with increase in its aspect ratio. However, limitation must be but put on
percentage volume and aspect ratio of RTSF since beyond 1.2% volume, the fresh
composite concrete was almost unworkable and with RTSF length longer than 60mm,
the fibres tend to make balling in concrete matrix.
Brittleness of concrete poses serious impact in a situation where impact loading occurs.
The plain concrete load carrying capacity drops all sudden when peak load is reached.
This is an indicator of a poor post-crack strength material. In drop weight test method
conducted on impact resistance of RTSFRC, the results showed that, substituting
Pan-African University Institute for Basic Science, Technology and Innovation
104
crumb rubber in concrete resulted in an enhanced first-crack impact energy.
Combining RTSF and crumb rubber in concrete showed substantially improved both
first crack and post-crack energy. At addition of 1.2% fibre fractions and 60mm length,
the first crack and ultimate impact energy increased by 237.74% and 741.18%
compared to plain concrete respectively. The Recycled tyre steel fibre reinforced
rubber concrete exhibited a higher ductility and toughness under impact loading. Based
on the results found, both first -crack impact energy and ultimate impact energy
increase with increase in RTSF content and further increase with increase in aspect
ratio.
It is concluded that the behaviour of concrete reinforced with RTSF can be comparable
to that of concrete reinforced with industrially produced steel fibres. The fibres could
therefore be used in different range of applications, such as foundations, impact
barriers, industrial floor slabs for crack control. The results of this study showed a
promising application of recycled tyre steel fibre and crumb rubber in concrete, which
is technically sound and environmentally safe.
5.2.Recommendation
5.2.1. Recommendation for the current study
1. The location of first crack point under flexural bending test has been a
subjective matter, objective procedure has to be developed so that, the results
of this tests do not vary from whom the test has been conducted.
2. High variation on the number of blows of one specimen to the other of the same
mixture on repeated drop weight test was observed in this test. This makes it
Pan-African University Institute for Basic Science, Technology and Innovation
105
difficult to assess the performance and leads to highly variable results, therefore
an instrumented impact test technique should be developed to evaluate impact
resistance.
5.2.2. Recommendation for further study
1. Studies must be made for design of concrete using RTSF to replace minimum
reinforcement required for ground slabs or a pavement to resist shrinkage and
temperature cracks.
2. Investigations on the structural performance of Recycled tyre steel fibre in
Ultra-high-performance concrete have also to be made since steel fibre
structural contribution is affected by concrete strength and pull-out strength
between fibre and concrete matrix.
3. Further studies must be done to have a thorough understanding of structural
behaviour of RTSFRC and specific practical application areas. And, economic
evaluation of the adoption of available Recycled tyre steel fibres and currently
extraction technology should be investigated
Pan-African University Institute for Basic Science, Technology and Innovation
106
REFERENCES
ACI committee 544.R5-10. (2010). Report on Physical property and Durability of
Fibre -reinforced concrete. Country Club Drive Farmington Hills: Journal of
ACI committe .
ACI committtee 544. (1982). State-of-the-art report on fibre reinforced concrete.
detroit: American concrete Institute.
American Concrete Institute. (2016, 1 17). Applicability of Using waste rubber in
structural application. ACI Materials Journal, 14359/51688640. Retrieved
from www.sciencedaily.com/releases/2016/03/160315104840.htm:
American Concrete Institute. (2016). Applicability of using waste rubber in structural
applications. ACI Materials Journal.
ASTM C1018-97. (1998). Standard Test for Flexural Strength of Concrete.
Conshohocken: ASTM.
BS1881: part -102. (1983). Method for determination of Slum value. 1983: British
Standard Institute.
Gupa R.K. (2006). Civil engineering materials and Construction practices. New
Delhi: Jain brothers.
Hylands V. , K. N. and Shulman. (2003). Civil engineering applications of tyre.
Crowthorne: Transport Research Laboratory.
Shetty M.S. (2003). Concrete technology Theory and Practice ,revised edition. New
delhi: S.Chand and Company Ltd.
Pan-African University Institute for Basic Science, Technology and Innovation
107
ACI 544.1R, A. (1996). State-of-the-art report on fibre reinforced Concrete.
Farmington Hills, Michigan: American Concrete Institute.
ACI committee5 44. (1978). Measurement of properties of fiber reinforced concrete.
Journal of American Concrete Insitute, 75(7), 283-289.
ACI Committee-544. (n.d.). Guide for Specifying, Proportioning, Mixing, Placing,
and Finishing Steel Fiber Reinforced Concrete. 544.3R, 4ACI-93.
Adam Podstawka, Marek Foglar,Vladimir Kristek. (2015). Statistical evaluation of
three and four-point bending tests of FRC. 21st International Conference
Engineering Mechanics, 37-43.
Ahmed.Tareq.N, A. B. (2015). Effect of Combination betwween Crumb rubber and
Steel Fibre on Impact energy of Concrete beams. In E. ltd (Ed.), The 5th
International Conference of Euro Asia Civil engineering Forum (EACEF-5)
(pp. 825-831). Penang: Elsevier.Ltd
Alieo M, L. F. (2008). Use of Steel Fibre recovered from Waste tyres as
reinforcement in Concrete :pull-out,Compressive and Flexural strength.
Elsevier Ltd.
Al-Khalayleh, A. N. (2010, october 15). Innovative Application of Scrap-tire Steel
Cords in Concrete Mixes. Jordan Journal of Civil Engineering, (4), 55-61.
Angelakopoulos, H. (2008). Tyre wire in Concrete . Europian Commission Directive
.
Pan-African University Institute for Basic Science, Technology and Innovation
108
ASTM. (2004). Standard test method of flexural toughness of first crack strength of
fibre reinforced concrete . new york: ASTM 1810-12.
Bedewi Nasiri. (2009). Steel fibre reinforced concrete made with fibre extracted from
waste tyres. addis ababa: department of civil engineering ,addis abba
university,.
BMZ, F. M. (2014). Environment -Kenya:Waste tyre Management. Berlin: GIZ.
BS 1881:part -116. (1987). Method for determination of compressive strength of
concrete cubes. Landon: Britsih Standard Institute .
BS 1988: part -117. (1983). Method for detrmination of split tensile strength on
Concrete Cylenders. Landon: British standard Institute .
Carpenteri.A,Bringheti.R. (2010). Fialure Bahaviour of plain and Fibre-reinforced
concrete with different mode of loading. Material and design, 31, 2032-2042.
Chavan, P. A. (2014, june,). Waste Tyre Crumb Rubber Particle as A Partial
Replacement to Fine Aggregate in Concrete. International Journal of
Engineering Research & Technology (3), 1-4.
E Martínez-Cruz, G. M.-B.-L. (2013). Polymer concrete reinforced with recycled-tire
fibers: Mechanical propertie. IOP Conf. Series: Materials Science and
Engineering .
Elasaigh W.A. (2001). A compartive Evaluation of Plain and Steel fibre reinforced
concrete ground slabs. pretoria: university of pretoria.
Pan-African University Institute for Basic Science, Technology and Innovation
109
Emiroglua, M. H. (2007). An Investigation on Its Microstructure of the Concrete
Containing Waste Vehicle Tire. Istanbul : Uluslar ArasÕ KÕUÕlma
KonferansÕ Bildiriler KitabÕ.
Evans, A. a. (May 2006). The composition of Waste tyres. Banbory: The waste &
Resources Action programme.
Fabio P. figueireho, A. H.-s. (2017). Fire Protection of concrete Tunnel linings with
waste tyre fibres. 6th International workshop on Performance ,protection and
Strengthening of Structures Under extreme loding , PROTECT. 210, pp. 472–
478. Canton: Elsevier.Ltd.
Fousil Fouad Wafa. (1990). Properties and Application of fiber Reinforced concrete .
JKUA:Engineering and Science , 49-63.
Gambhir, M. (1995). Concrete Technology. (2nd Eddition). New Delhi: Tata
McGraw-Hill.
Grdic Zran Toplicie, G. R. (2014). Hydro-abrasive resistance and mechanical
prperties of rubberized concrete. GRADEINAR, 66(1), 11-20.
Guo, Y. X. (2014). Fracture behaviour of new steel fibre reinforced recycled
aggregate concrete with crumb rubber. Construction. Building. materials(53),
32-39.
Hannat DJ. (1987). Fibre Cements and Fibre Concrete. Chichester: Wiley.
Pan-African University Institute for Basic Science, Technology and Innovation
110
Ibrahi, S. A. (2014). Mechanical Properties of Recycled Steel Tire Fibres in
Concrete. Teknologi: Faculty of Civil Engineering, Universiti Teknologi
Malaysia.
Jagadish K.S., V. R. (2007). Alternative Building materials ,First edition. New delhi:
New Age Inernational publishers.
Johnston, C. C. (1982). Fibre Reinforced Concrete. Canada: Progress in Concrete
Technology CANMET, Energy, Mines and Resources.
JSCE. (n.d.). Method of Test for flexural toughness and first crack strength of fibre
reinforced concrete.
Kerr, S. (2016). Nairobi: Innovative Technologies for a More Sustainable Future.
Nairobi: nairobiplanninginnovations.
Kotresh K.M, M. G. (2014, april). Study On Waste Tyre Rubber As Concrete
Aggregates. International Journal of Scientific Engineering and Technology,
433-436.
M. A. Yazdi, J. Y. (2015). A Review on Application of Waste Tire in Concrete.
International Journal of Civil, Environmental, Structural, Construction and
Architectural Engineering, 1-6.
M.A.AielloF.Leuzzi. (2010). Waste tyre rubberized concrete: Properties at fresh and
hardened state. ELSEVIER .
Pan-African University Institute for Basic Science, Technology and Innovation
111
Marijana Serdar, A. B. (2013, september). Special purpose concrete products from
waste tyre recyclates. University of Zagreb Faculty of Civil Engineering,
p791-801.
Martinez Juan Danial, N. P. (2013). Waste tyre Pyrolysis. A review .sustain.Energy
Rev, 179-213.
Mindess.S, B. A. (1990). Fibre reinforced cementious composites . landon : Elsevier.
Nasiri, B. (2009). Steel Fiber Reinforced Concrete Made with Fibers Extracted from
used Tyres. Addis Ababa University, Department of Civil Engineering. Addis
Ababa: Addis Ababa University.
Newsealandltd, M. (july 2004). End-of-life tyre management. Newzealand:
Newzealand environmental ministry.
Noghabai, K. (2000). Beams of Fiberous Concrete in Shear and Bending: Experiment
and Model. Journal of Structural Engineering ,ASCE,Vol.126,No.2, pp 243-
251.
NOOR, N. B. (2014). Physical Performance and Durability Evaluation of Rubberized
Concrete. Fukuoka: Kyushu University.
Osama Youssf,Reza Hassanli, Julie E.Mills. (2017). Mechanical performance of
FRP-Confined and Uniconfined Crumb rubber concrete containing high
Crumb rubber. Elsevier:Journal of Building engineering, 115-126.
Pelisser, F., et al. (2011). Concrete made with recycled tire rubber: Effect of alkaline
activation and silica fume addition. Journal of Cleaner, 757-763.
Pan-African University Institute for Basic Science, Technology and Innovation
112
Pilakoutas, K. (2014). Fibre reinforced concrete ;Recycled Tyre Steel Fibre.
Sheffield : Institutions of Structural engineers .
Pilakoutas, K. N. (2004). Reuse of Tyre Steel Fibres as Concrete Reinforcemen.
landon: Proceedings of the ICE: Engineering Sustainability.
Reda Taha, M.M., et al. (2008). Mechanical, fracture, and microstructural
investigations of rubber concrete. . Journal of Materials in Civil Engineering,
640-649.
Sidney Mindess, F. y. (2003). Concrete ,Second edition. New jersey: Prentice hall,.
Sunil N. Shah1, P. D. (2014). Effect of Chipped Rubber Aggregates on Performance
of Concrete. American Journal of Engineering Research (AJER), 93-101.
The Goodyear Tire and Rubber product Company. (2015, 10 1). Reinforcement
Material in Rubber Products. Ohio: NOKIAN TYRES PLC. Retrieved from
http://laroverket.com: http://laroverket.com/wp
Tremat, H. (2003). From waste fibres to concrete reinforcement. DTI:Partners in
Innovation Contract :CI393/684,cc2227.
zealand.ltd, M. N. (2014). End -of-life tyre management. Dunedin: Ministry of
environment.

Pan-African University Institute for Basic Science, Technology and Innovation
113
APPENDICES
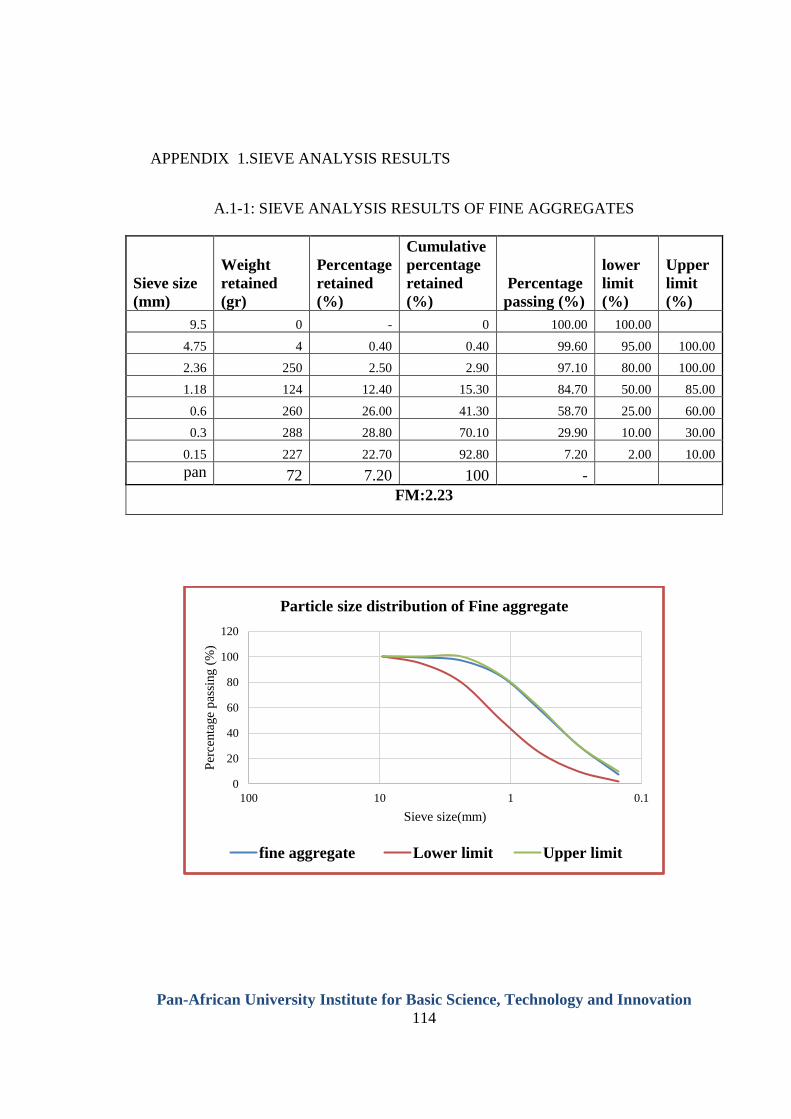
Pan-African University Institute for Basic Science, Technology and Innovation
114
APPENDIX 1.SIEVE ANALYSIS RESULTS
A.1-1: SIEVE ANALYSIS RESULTS OF FINE AGGREGATES
Sieve size
(mm)
Weight
retained
(gr)
Percentage
retained
(%)
Cumulative
percentage
retained
(%)
Percentage
passing (%)
lower
limit
(%)
Upper
limit
(%)
9.5 0 - 0 100.00 100.00
4.75 4 0.40 0.40 99.60 95.00 100.00
2.36 250 2.50 2.90 97.10 80.00 100.00
1.18 124 12.40 15.30 84.70 50.00 85.00
0.6 260 26.00 41.30 58.70 25.00 60.00
0.3 288 28.80 70.10 29.90 10.00 30.00
0.15 227 22.70 92.80 7.20 2.00 10.00
pan 72 7.20 100 -
FM:2.23
0
20
40
60
80
100
120
0.1110100
Per
centa
ge
pas
sing (
%)
Sieve size(mm)
Particle size distribution of Fine aggregate
fine aggregate Lower limit Upper limit
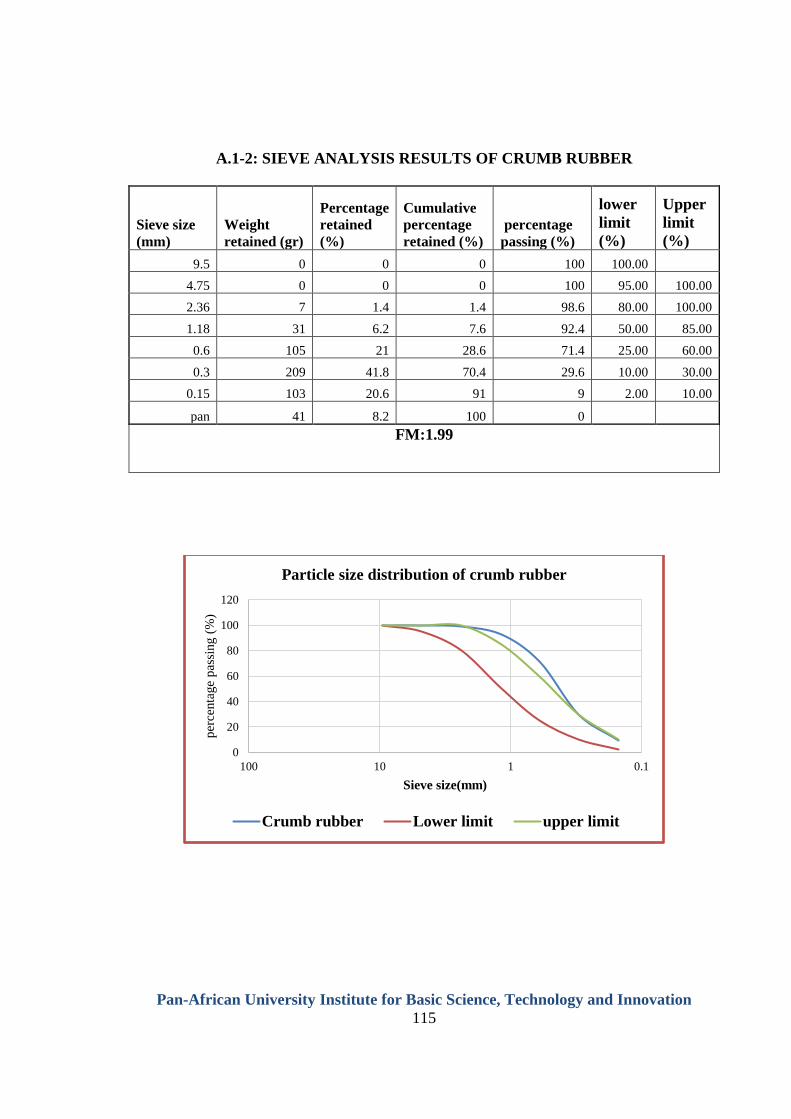
Pan-African University Institute for Basic Science, Technology and Innovation
115
A.1-2: SIEVE ANALYSIS RESULTS OF CRUMB RUBBER
Sieve size
(mm)
Weight
retained (gr)
Percentage
retained
(%)
Cumulative
percentage
retained (%)
percentage
passing (%)
lower
limit
(%)
Upper
limit
(%)
9.5 0 0 0 100 100.00
4.75 0 0 0 100 95.00 100.00
2.36 7 1.4 1.4 98.6 80.00 100.00
1.18 31 6.2 7.6 92.4 50.00 85.00
0.6 105 21 28.6 71.4 25.00 60.00
0.3 209 41.8 70.4 29.6 10.00 30.00
0.15 103 20.6 91 9 2.00 10.00
pan 41 8.2 100 0
FM:1.99
0
20
40
60
80
100
120
0.1110100
per
centa
ge
pas
sing (
%)
Sieve size(mm)
Particle size distribution of crumb rubber
Crumb rubber Lower limit upper limit
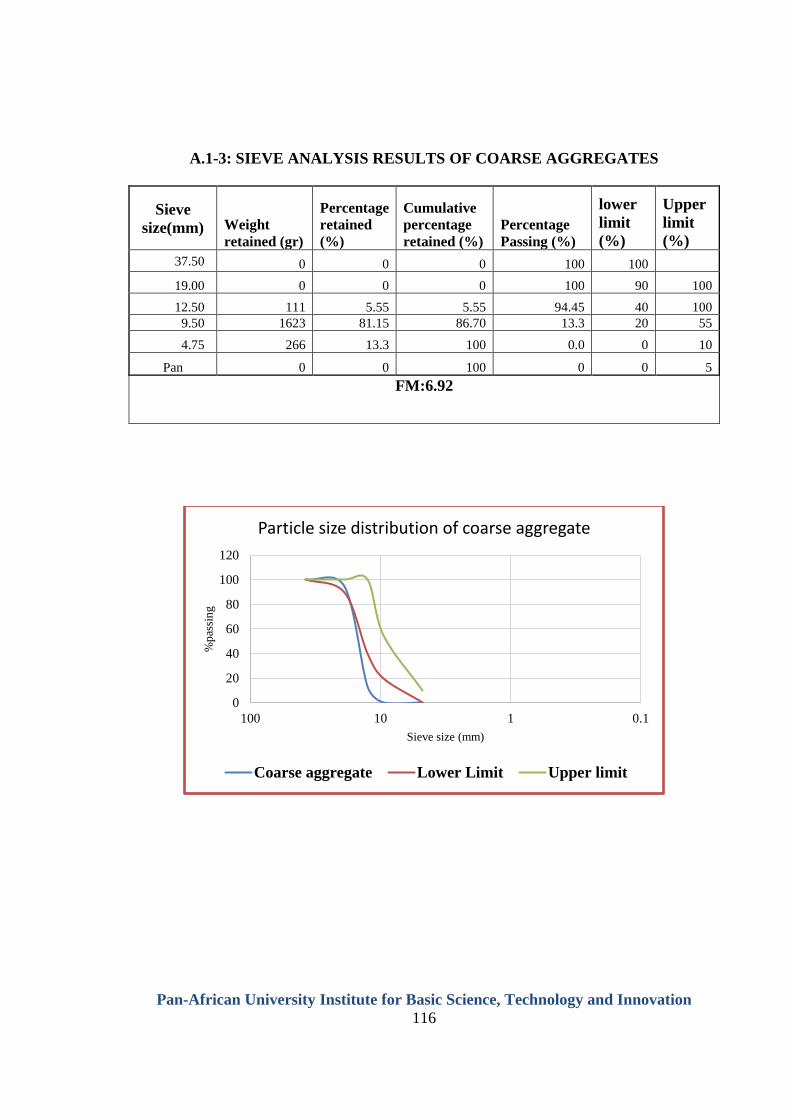
Pan-African University Institute for Basic Science, Technology and Innovation
116
A.1-3: SIEVE ANALYSIS RESULTS OF COARSE AGGREGATES
Sieve
size(mm) Weight
retained (gr)
Percentage
retained
(%)
Cumulative
percentage
retained (%)
Percentage
Passing (%)
lower
limit
(%)
Upper
limit
(%)
37.50 0 0 0 100 100
19.00 0 0 0 100 90 100
12.50 111 5.55 5.55 94.45 40 100
9.50 1623 81.15 86.70 13.3 20 55
4.75 266 13.3 100 0.0 0 10
Pan 0 0 100 0 0 5
FM:6.92
0
20
40
60
80
100
120
0.1110100
%p
assi
ng
Sieve size (mm)
Particle size distribution of coarse aggregate
Coarse aggregate Lower Limit Upper limit
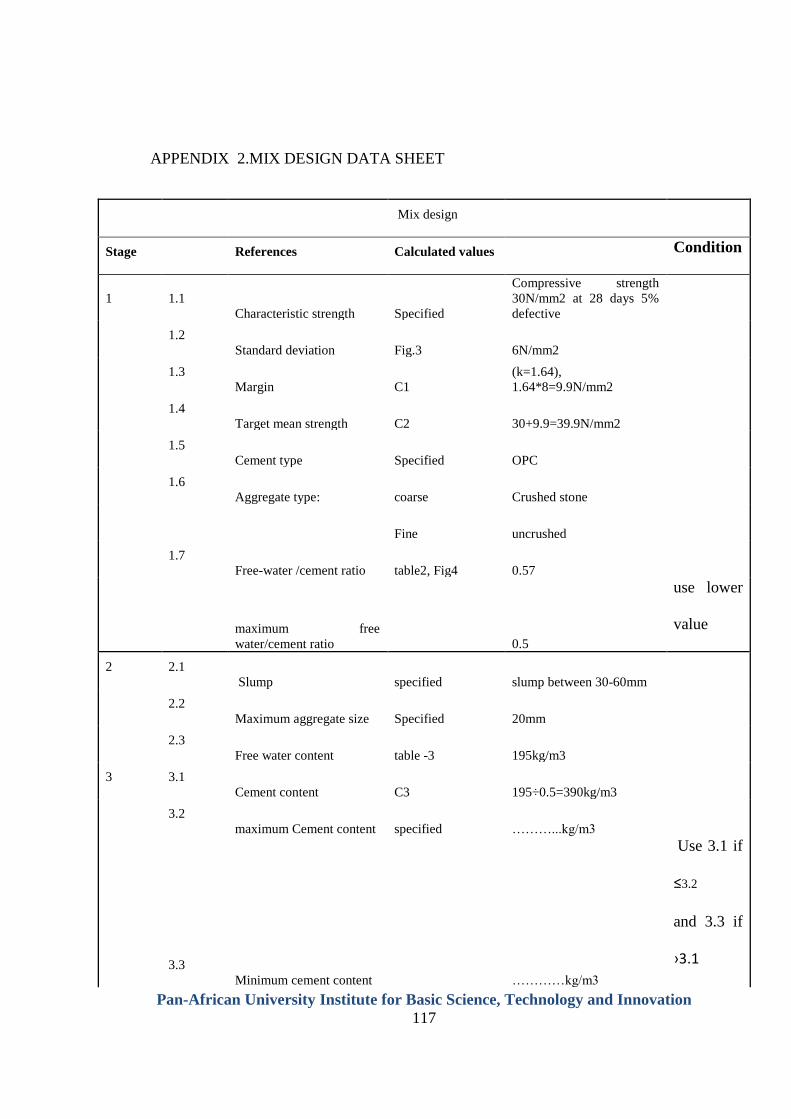
Pan-African University Institute for Basic Science, Technology and Innovation
117
APPENDIX 2.MIX DESIGN DATA SHEET
Mix design
Stage References Calculated values Condition
1 1.1
Characteristic strength Specified
Compressive strength
30N/mm2 at 28 days 5%
defective
1.2
Standard deviation Fig.3 6N/mm2
1.3
Margin C1
(k=1.64),
1.64*8=9.9N/mm2
1.4
Target mean strength C2 30+9.9=39.9N/mm2
1.5
Cement type Specified OPC
1.6
Aggregate type: coarse Crushed stone
Fine uncrushed
1.7
Free-water /cement ratio table2, Fig4 0.57
maximum free
water/cement ratio 0.5
use lower
value
2 2.1
Slump specified slump between 30-60mm
2.2
Maximum aggregate size Specified 20mm
2.3
Free water content table -3 195kg/m3
3 3.1
Cement content C3 195÷0.5=390kg/m3
3.2
maximum Cement content specified ………...kg/m3
3.3
Minimum cement content …………kg/m3
Use 3.1 if
≤3.2
and 3.3 if
›3.1
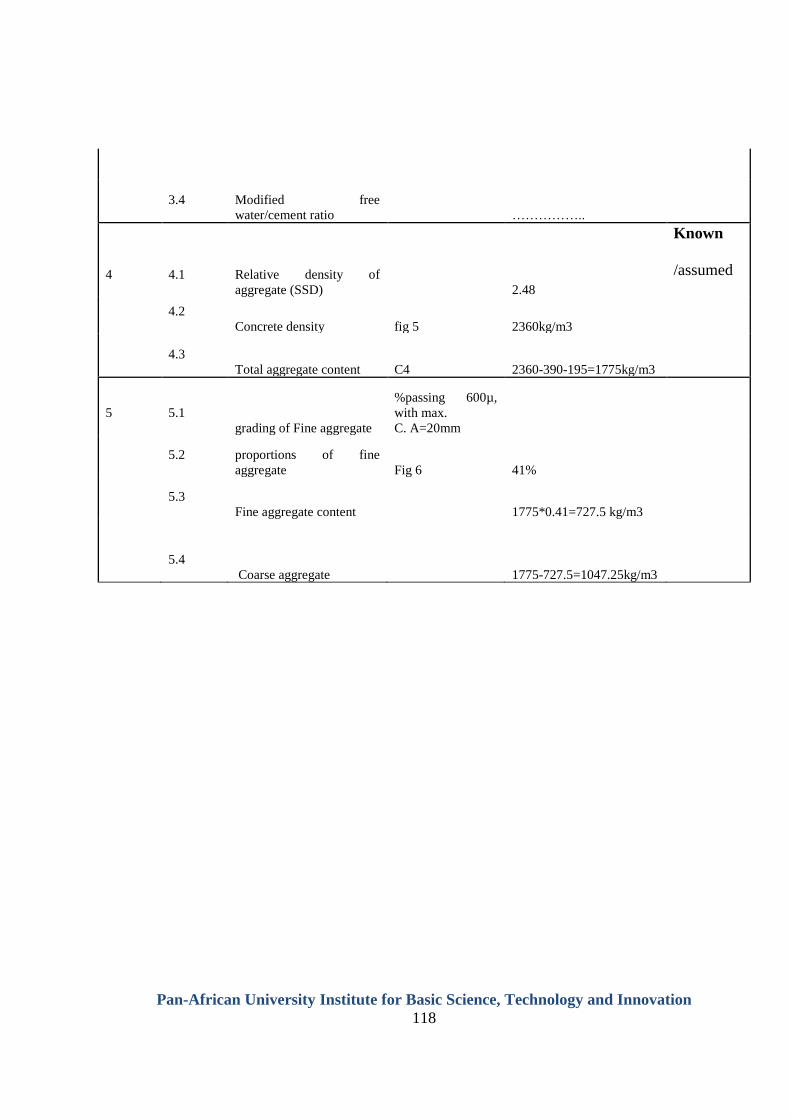
Pan-African University Institute for Basic Science, Technology and Innovation
118
3.4 Modified free
water/cement ratio ……………..
4 4.1 Relative density of
aggregate (SSD) 2.48
Known
/assumed
4.2
Concrete density fig 5 2360kg/m3
4.3
Total aggregate content C4 2360-390-195=1775kg/m3
5 5.1
grading of Fine aggregate
%passing 600µ,
with max.
C. A=20mm
5.2 proportions of fine
aggregate Fig 6 41%
5.3
Fine aggregate content 1775*0.41=727.5 kg/m3
5.4
Coarse aggregate 1775-727.5=1047.25kg/m3
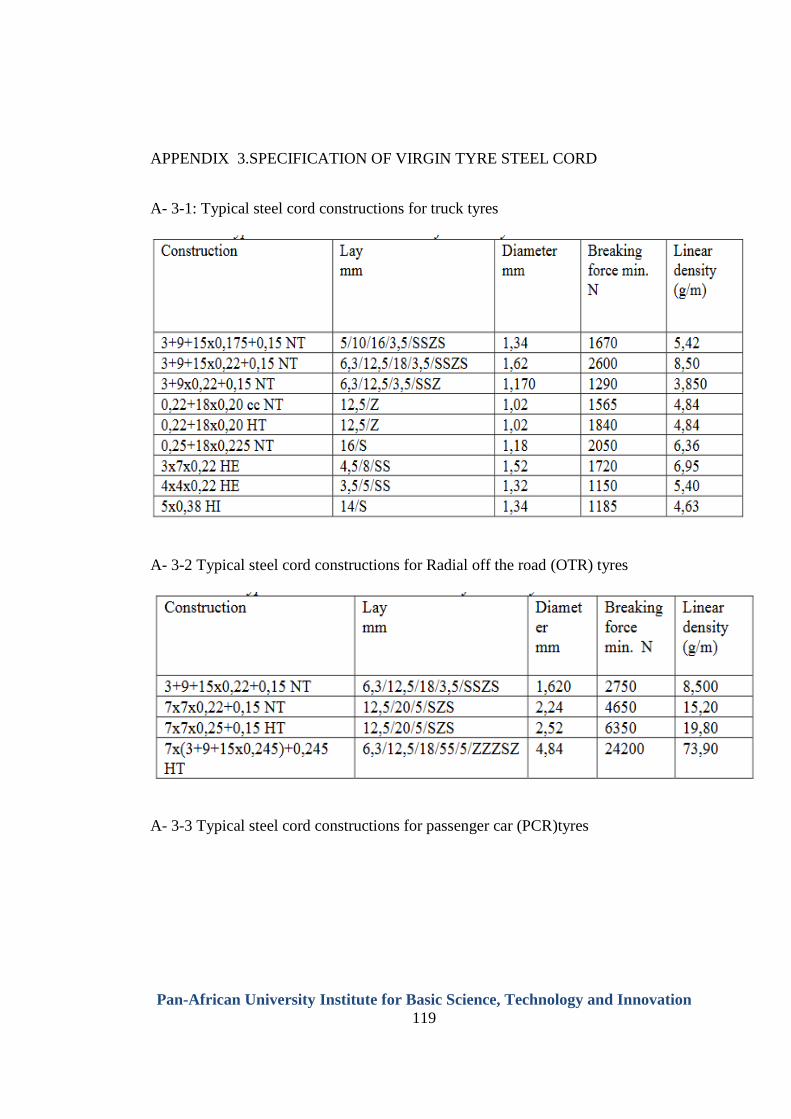
Pan-African University Institute for Basic Science, Technology and Innovation
119
APPENDIX 3.SPECIFICATION OF VIRGIN TYRE STEEL CORD
A- 3-1: Typical steel cord constructions for truck tyres
A- 3-2 Typical steel cord constructions for Radial off the road (OTR) tyres
A- 3-3 Typical steel cord constructions for passenger car (PCR)tyres
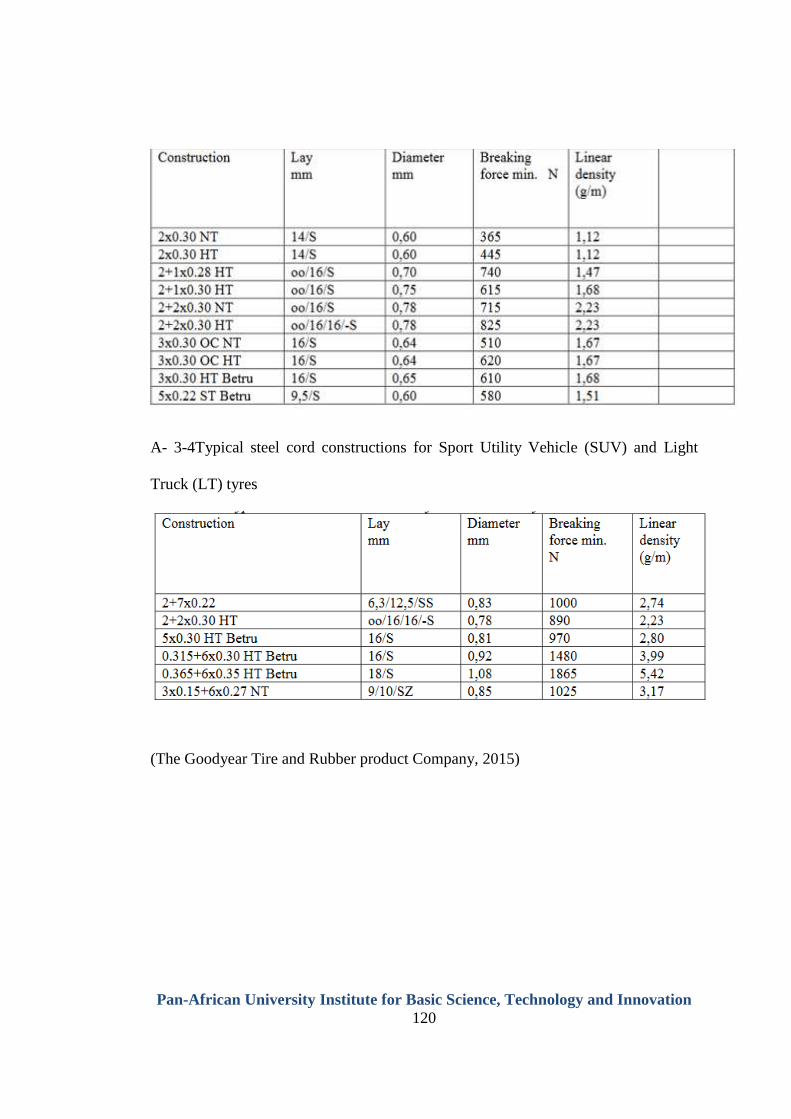
Pan-African University Institute for Basic Science, Technology and Innovation
120
A- 3-4Typical steel cord constructions for Sport Utility Vehicle (SUV) and Light
Truck (LT) tyres
(The Goodyear Tire and Rubber product Company, 2015)
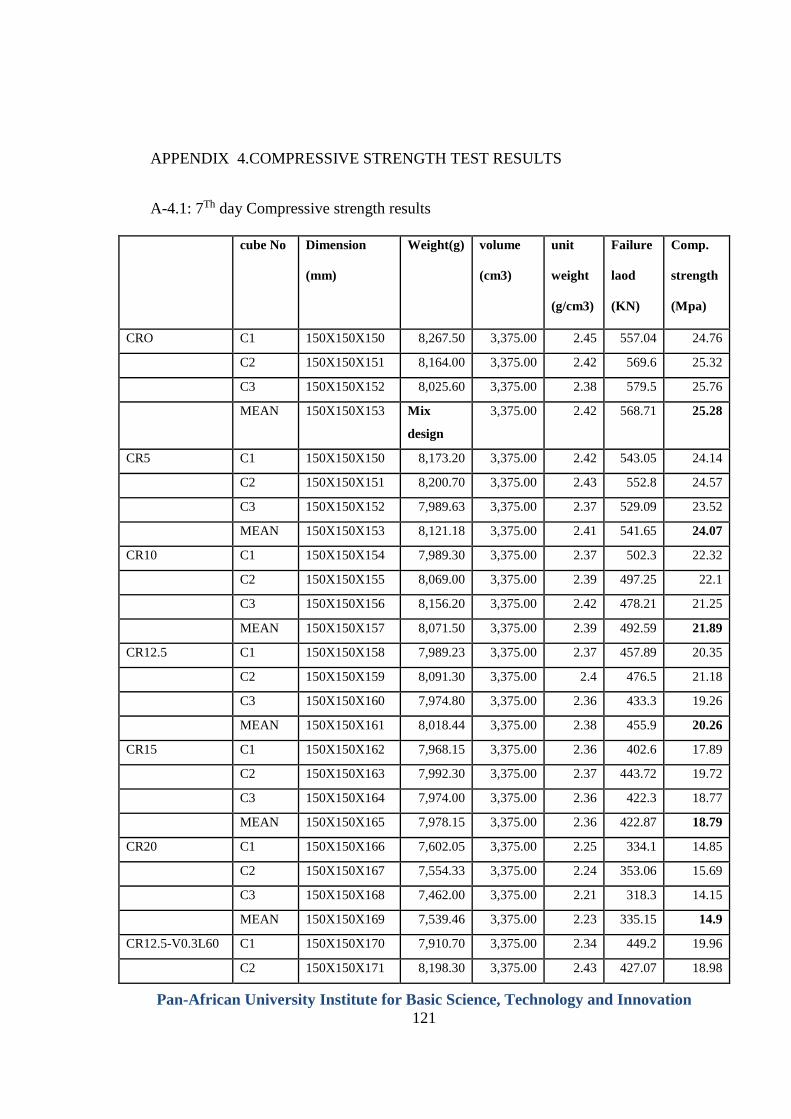
Pan-African University Institute for Basic Science, Technology and Innovation
121
APPENDIX 4.COMPRESSIVE STRENGTH TEST RESULTS
A-4.1: 7Th day Compressive strength results
cube No Dimension
(mm)
Weight(g) volume
(cm3)
unit
weight
(g/cm3)
Failure
laod
(KN)
Comp.
strength
(Mpa)
CRO C1 150X150X150 8,267.50 3,375.00 2.45 557.04 24.76
C2 150X150X151 8,164.00 3,375.00 2.42 569.6 25.32
C3 150X150X152 8,025.60 3,375.00 2.38 579.5 25.76
MEAN 150X150X153 Mix
design
3,375.00 2.42 568.71 25.28
CR5 C1 150X150X150 8,173.20 3,375.00 2.42 543.05 24.14
C2 150X150X151 8,200.70 3,375.00 2.43 552.8 24.57
C3 150X150X152 7,989.63 3,375.00 2.37 529.09 23.52
MEAN 150X150X153 8,121.18 3,375.00 2.41 541.65 24.07
CR10 C1 150X150X154 7,989.30 3,375.00 2.37 502.3 22.32
C2 150X150X155 8,069.00 3,375.00 2.39 497.25 22.1
C3 150X150X156 8,156.20 3,375.00 2.42 478.21 21.25
MEAN 150X150X157 8,071.50 3,375.00 2.39 492.59 21.89
CR12.5 C1 150X150X158 7,989.23 3,375.00 2.37 457.89 20.35
C2 150X150X159 8,091.30 3,375.00 2.4 476.5 21.18
C3 150X150X160 7,974.80 3,375.00 2.36 433.3 19.26
MEAN 150X150X161 8,018.44 3,375.00 2.38 455.9 20.26
CR15 C1 150X150X162 7,968.15 3,375.00 2.36 402.6 17.89
C2 150X150X163 7,992.30 3,375.00 2.37 443.72 19.72
C3 150X150X164 7,974.00 3,375.00 2.36 422.3 18.77
MEAN 150X150X165 7,978.15 3,375.00 2.36 422.87 18.79
CR20 C1 150X150X166 7,602.05 3,375.00 2.25 334.1 14.85
C2 150X150X167 7,554.33 3,375.00 2.24 353.06 15.69
C3 150X150X168 7,462.00 3,375.00 2.21 318.3 14.15
MEAN 150X150X169 7,539.46 3,375.00 2.23 335.15 14.9
CR12.5-V0.3L60 C1 150X150X170 7,910.70 3,375.00 2.34 449.2 19.96
C2 150X150X171 8,198.30 3,375.00 2.43 427.07 18.98
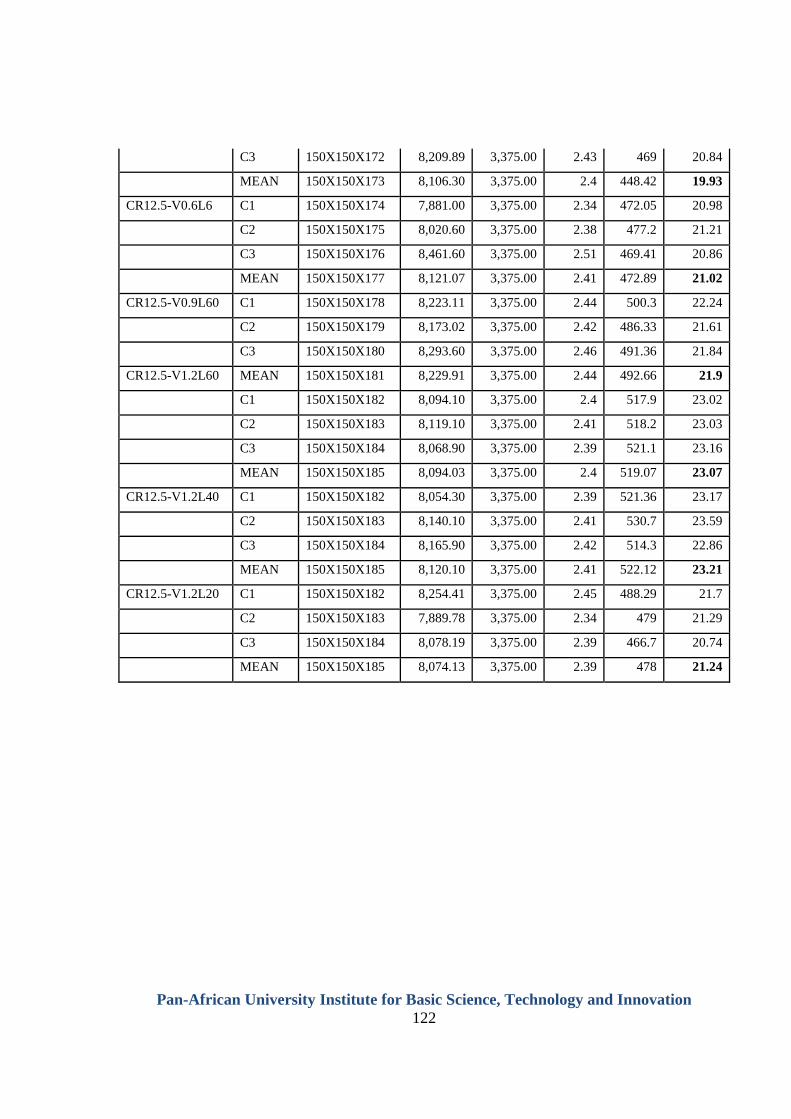
Pan-African University Institute for Basic Science, Technology and Innovation
122
C3 150X150X172 8,209.89 3,375.00 2.43 469 20.84
MEAN 150X150X173 8,106.30 3,375.00 2.4 448.42 19.93
CR12.5-V0.6L6 C1 150X150X174 7,881.00 3,375.00 2.34 472.05 20.98
C2 150X150X175 8,020.60 3,375.00 2.38 477.2 21.21
C3 150X150X176 8,461.60 3,375.00 2.51 469.41 20.86
MEAN 150X150X177 8,121.07 3,375.00 2.41 472.89 21.02
CR12.5-V0.9L60 C1 150X150X178 8,223.11 3,375.00 2.44 500.3 22.24
C2 150X150X179 8,173.02 3,375.00 2.42 486.33 21.61
C3 150X150X180 8,293.60 3,375.00 2.46 491.36 21.84
CR12.5-V1.2L60 MEAN 150X150X181 8,229.91 3,375.00 2.44 492.66 21.9
C1 150X150X182 8,094.10 3,375.00 2.4 517.9 23.02
C2 150X150X183 8,119.10 3,375.00 2.41 518.2 23.03
C3 150X150X184 8,068.90 3,375.00 2.39 521.1 23.16
MEAN 150X150X185 8,094.03 3,375.00 2.4 519.07 23.07
CR12.5-V1.2L40 C1 150X150X182 8,054.30 3,375.00 2.39 521.36 23.17
C2 150X150X183 8,140.10 3,375.00 2.41 530.7 23.59
C3 150X150X184 8,165.90 3,375.00 2.42 514.3 22.86
MEAN 150X150X185 8,120.10 3,375.00 2.41 522.12 23.21
CR12.5-V1.2L20 C1 150X150X182 8,254.41 3,375.00 2.45 488.29 21.7
C2 150X150X183 7,889.78 3,375.00 2.34 479 21.29
C3 150X150X184 8,078.19 3,375.00 2.39 466.7 20.74
MEAN 150X150X185 8,074.13 3,375.00 2.39 478 21.24
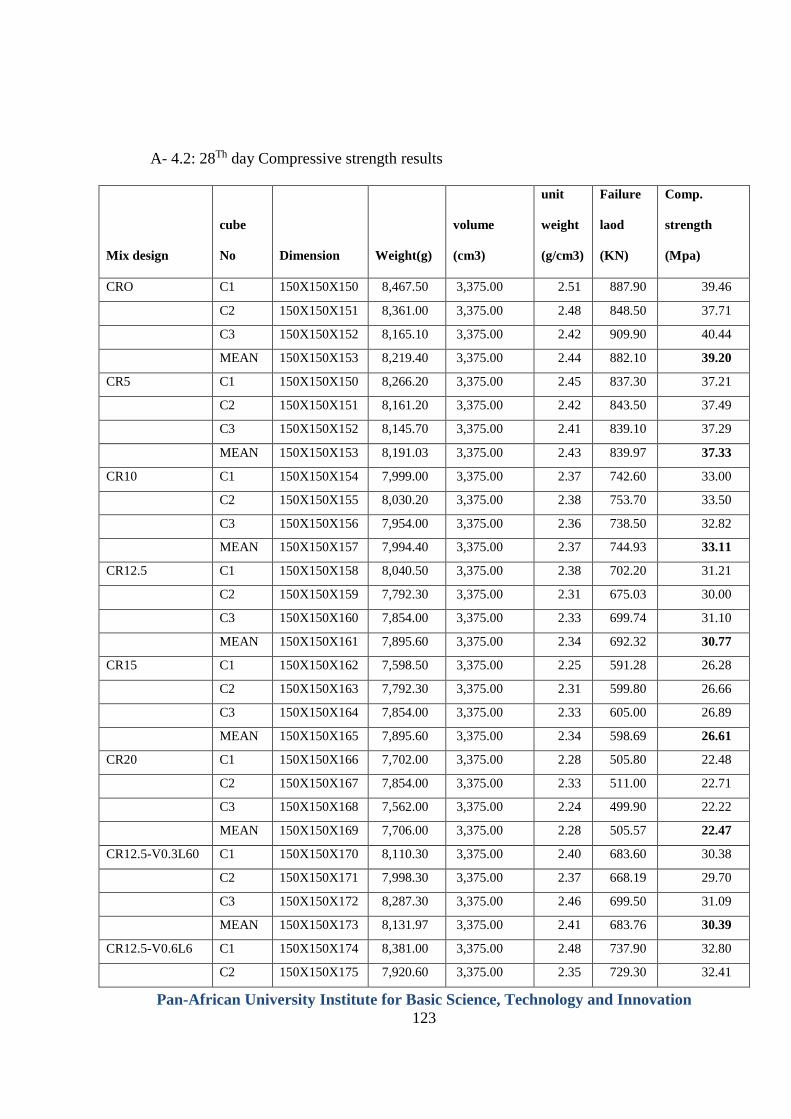
Pan-African University Institute for Basic Science, Technology and Innovation
123
A- 4.2: 28Th day Compressive strength results
Mix design
cube
No Dimension Weight(g)
volume
(cm3)
unit
weight
(g/cm3)
Failure
laod
(KN)
Comp.
strength
(Mpa)
CRO C1 150X150X150 8,467.50 3,375.00 2.51 887.90 39.46
C2 150X150X151 8,361.00 3,375.00 2.48 848.50 37.71
C3 150X150X152 8,165.10 3,375.00 2.42 909.90 40.44
MEAN 150X150X153 8,219.40 3,375.00 2.44 882.10 39.20
CR5 C1 150X150X150 8,266.20 3,375.00 2.45 837.30 37.21
C2 150X150X151 8,161.20 3,375.00 2.42 843.50 37.49
C3 150X150X152 8,145.70 3,375.00 2.41 839.10 37.29
MEAN 150X150X153 8,191.03 3,375.00 2.43 839.97 37.33
CR10 C1 150X150X154 7,999.00 3,375.00 2.37 742.60 33.00
C2 150X150X155 8,030.20 3,375.00 2.38 753.70 33.50
C3 150X150X156 7,954.00 3,375.00 2.36 738.50 32.82
MEAN 150X150X157 7,994.40 3,375.00 2.37 744.93 33.11
CR12.5 C1 150X150X158 8,040.50 3,375.00 2.38 702.20 31.21
C2 150X150X159 7,792.30 3,375.00 2.31 675.03 30.00
C3 150X150X160 7,854.00 3,375.00 2.33 699.74 31.10
MEAN 150X150X161 7,895.60 3,375.00 2.34 692.32 30.77
CR15 C1 150X150X162 7,598.50 3,375.00 2.25 591.28 26.28
C2 150X150X163 7,792.30 3,375.00 2.31 599.80 26.66
C3 150X150X164 7,854.00 3,375.00 2.33 605.00 26.89
MEAN 150X150X165 7,895.60 3,375.00 2.34 598.69 26.61
CR20 C1 150X150X166 7,702.00 3,375.00 2.28 505.80 22.48
C2 150X150X167 7,854.00 3,375.00 2.33 511.00 22.71
C3 150X150X168 7,562.00 3,375.00 2.24 499.90 22.22
MEAN 150X150X169 7,706.00 3,375.00 2.28 505.57 22.47
CR12.5-V0.3L60 C1 150X150X170 8,110.30 3,375.00 2.40 683.60 30.38
C2 150X150X171 7,998.30 3,375.00 2.37 668.19 29.70
C3 150X150X172 8,287.30 3,375.00 2.46 699.50 31.09
MEAN 150X150X173 8,131.97 3,375.00 2.41 683.76 30.39
CR12.5-V0.6L6 C1 150X150X174 8,381.00 3,375.00 2.48 737.90 32.80
C2 150X150X175 7,920.60 3,375.00 2.35 729.30 32.41
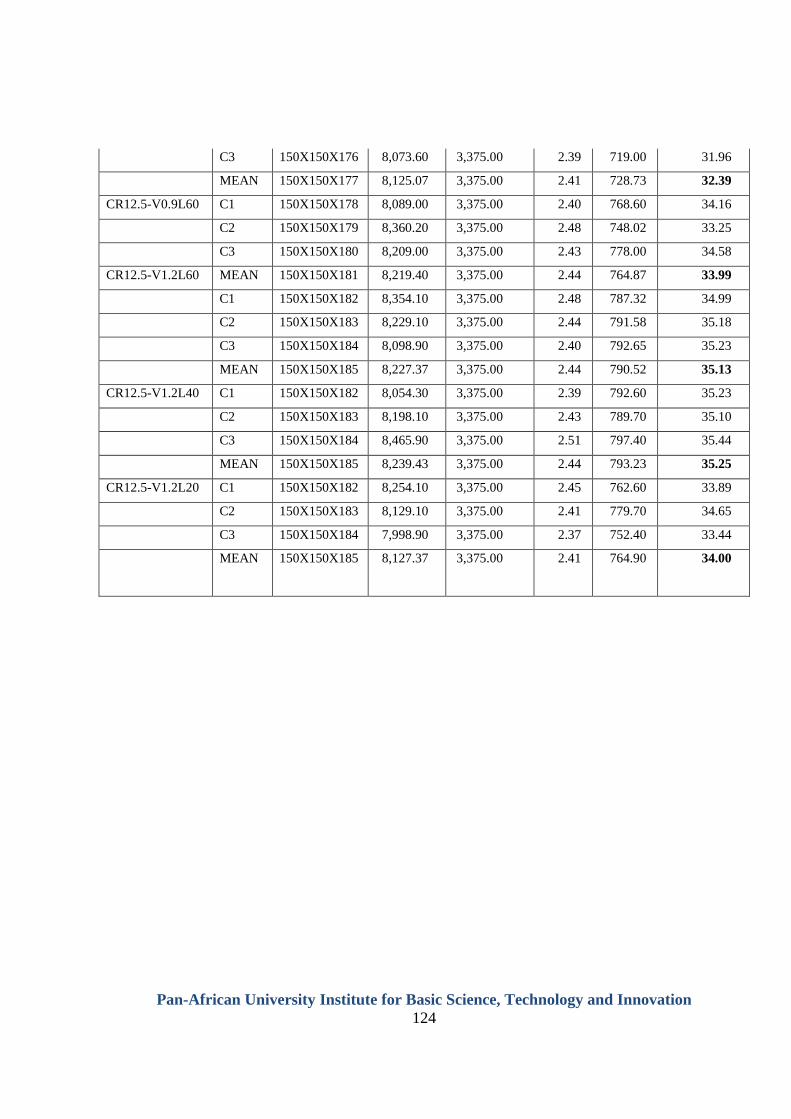
Pan-African University Institute for Basic Science, Technology and Innovation
124
C3 150X150X176 8,073.60 3,375.00 2.39 719.00 31.96
MEAN 150X150X177 8,125.07 3,375.00 2.41 728.73 32.39
CR12.5-V0.9L60 C1 150X150X178 8,089.00 3,375.00 2.40 768.60 34.16
C2 150X150X179 8,360.20 3,375.00 2.48 748.02 33.25
C3 150X150X180 8,209.00 3,375.00 2.43 778.00 34.58
CR12.5-V1.2L60 MEAN 150X150X181 8,219.40 3,375.00 2.44 764.87 33.99
C1 150X150X182 8,354.10 3,375.00 2.48 787.32 34.99
C2 150X150X183 8,229.10 3,375.00 2.44 791.58 35.18
C3 150X150X184 8,098.90 3,375.00 2.40 792.65 35.23
MEAN 150X150X185 8,227.37 3,375.00 2.44 790.52 35.13
CR12.5-V1.2L40 C1 150X150X182 8,054.30 3,375.00 2.39 792.60 35.23
C2 150X150X183 8,198.10 3,375.00 2.43 789.70 35.10
C3 150X150X184 8,465.90 3,375.00 2.51 797.40 35.44
MEAN 150X150X185 8,239.43 3,375.00 2.44 793.23 35.25
CR12.5-V1.2L20 C1 150X150X182 8,254.10 3,375.00 2.45 762.60 33.89
C2 150X150X183 8,129.10 3,375.00 2.41 779.70 34.65
C3 150X150X184 7,998.90 3,375.00 2.37 752.40 33.44
MEAN 150X150X185 8,127.37 3,375.00 2.41 764.90 34.00
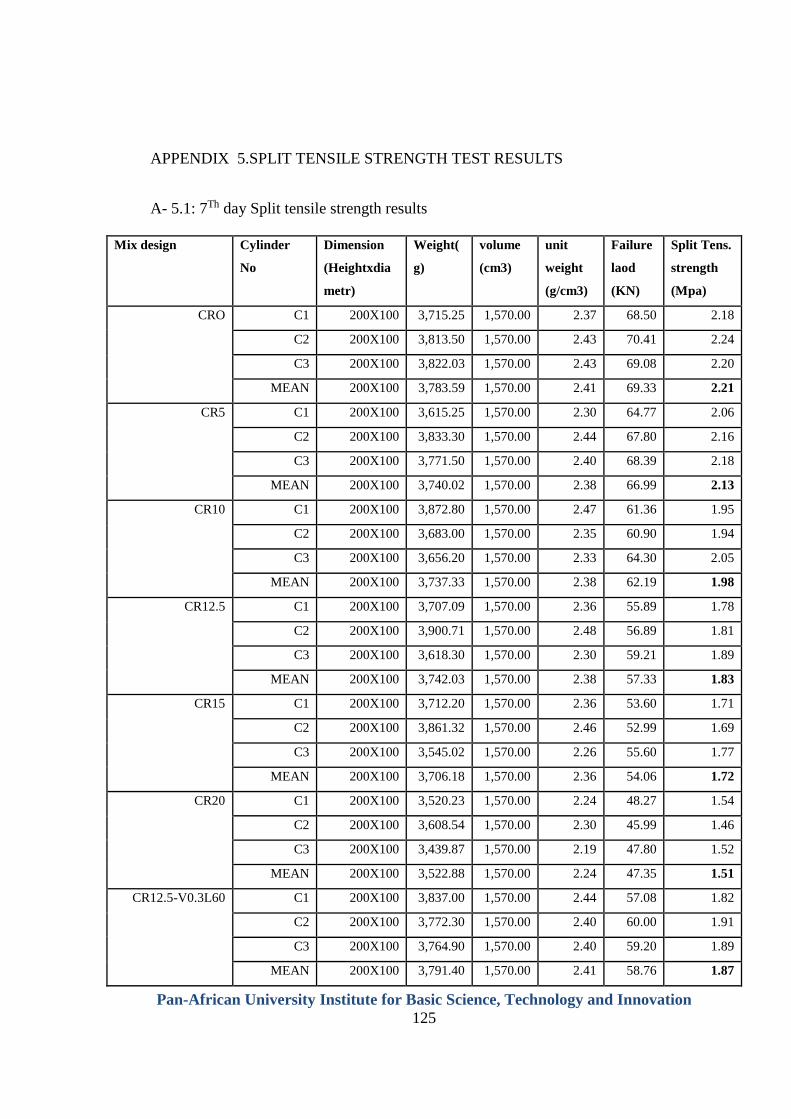
Pan-African University Institute for Basic Science, Technology and Innovation
125
APPENDIX 5.SPLIT TENSILE STRENGTH TEST RESULTS
A- 5.1: 7Th day Split tensile strength results
Mix design Cylinder
No
Dimension
(Heightxdia
metr)
Weight(
g)
volume
(cm3)
unit
weight
(g/cm3)
Failure
laod
(KN)
Split Tens.
strength
(Mpa)
CRO C1 200X100 3,715.25 1,570.00 2.37 68.50 2.18
C2 200X100 3,813.50 1,570.00 2.43 70.41 2.24
C3 200X100 3,822.03 1,570.00 2.43 69.08 2.20
MEAN 200X100 3,783.59 1,570.00 2.41 69.33 2.21
CR5 C1 200X100 3,615.25 1,570.00 2.30 64.77 2.06
C2 200X100 3,833.30 1,570.00 2.44 67.80 2.16
C3 200X100 3,771.50 1,570.00 2.40 68.39 2.18
MEAN 200X100 3,740.02 1,570.00 2.38 66.99 2.13
CR10 C1 200X100 3,872.80 1,570.00 2.47 61.36 1.95
C2 200X100 3,683.00 1,570.00 2.35 60.90 1.94
C3 200X100 3,656.20 1,570.00 2.33 64.30 2.05
MEAN 200X100 3,737.33 1,570.00 2.38 62.19 1.98
CR12.5 C1 200X100 3,707.09 1,570.00 2.36 55.89 1.78
C2 200X100 3,900.71 1,570.00 2.48 56.89 1.81
C3 200X100 3,618.30 1,570.00 2.30 59.21 1.89
MEAN 200X100 3,742.03 1,570.00 2.38 57.33 1.83
CR15 C1 200X100 3,712.20 1,570.00 2.36 53.60 1.71
C2 200X100 3,861.32 1,570.00 2.46 52.99 1.69
C3 200X100 3,545.02 1,570.00 2.26 55.60 1.77
MEAN 200X100 3,706.18 1,570.00 2.36 54.06 1.72
CR20 C1 200X100 3,520.23 1,570.00 2.24 48.27 1.54
C2 200X100 3,608.54 1,570.00 2.30 45.99 1.46
C3 200X100 3,439.87 1,570.00 2.19 47.80 1.52
MEAN 200X100 3,522.88 1,570.00 2.24 47.35 1.51
CR12.5-V0.3L60 C1 200X100 3,837.00 1,570.00 2.44 57.08 1.82
C2 200X100 3,772.30 1,570.00 2.40 60.00 1.91
C3 200X100 3,764.90 1,570.00 2.40 59.20 1.89
MEAN 200X100 3,791.40 1,570.00 2.41 58.76 1.87
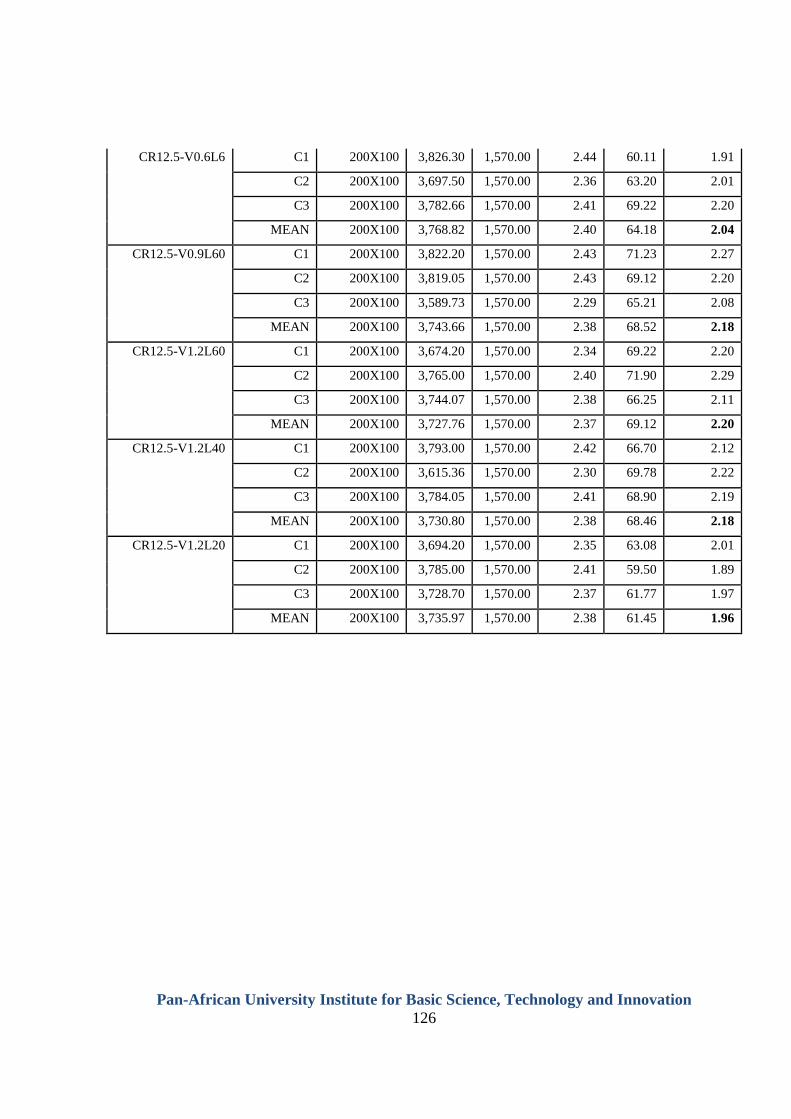
Pan-African University Institute for Basic Science, Technology and Innovation
126
CR12.5-V0.6L6 C1 200X100 3,826.30 1,570.00 2.44 60.11 1.91
C2 200X100 3,697.50 1,570.00 2.36 63.20 2.01
C3 200X100 3,782.66 1,570.00 2.41 69.22 2.20
MEAN 200X100 3,768.82 1,570.00 2.40 64.18 2.04
CR12.5-V0.9L60 C1 200X100 3,822.20 1,570.00 2.43 71.23 2.27
C2 200X100 3,819.05 1,570.00 2.43 69.12 2.20
C3 200X100 3,589.73 1,570.00 2.29 65.21 2.08
MEAN 200X100 3,743.66 1,570.00 2.38 68.52 2.18
CR12.5-V1.2L60 C1 200X100 3,674.20 1,570.00 2.34 69.22 2.20
C2 200X100 3,765.00 1,570.00 2.40 71.90 2.29
C3 200X100 3,744.07 1,570.00 2.38 66.25 2.11
MEAN 200X100 3,727.76 1,570.00 2.37 69.12 2.20
CR12.5-V1.2L40 C1 200X100 3,793.00 1,570.00 2.42 66.70 2.12
C2 200X100 3,615.36 1,570.00 2.30 69.78 2.22
C3 200X100 3,784.05 1,570.00 2.41 68.90 2.19
MEAN 200X100 3,730.80 1,570.00 2.38 68.46 2.18
CR12.5-V1.2L20 C1 200X100 3,694.20 1,570.00 2.35 63.08 2.01
C2 200X100 3,785.00 1,570.00 2.41 59.50 1.89
C3 200X100 3,728.70 1,570.00 2.37 61.77 1.97
MEAN 200X100 3,735.97 1,570.00 2.38 61.45 1.96
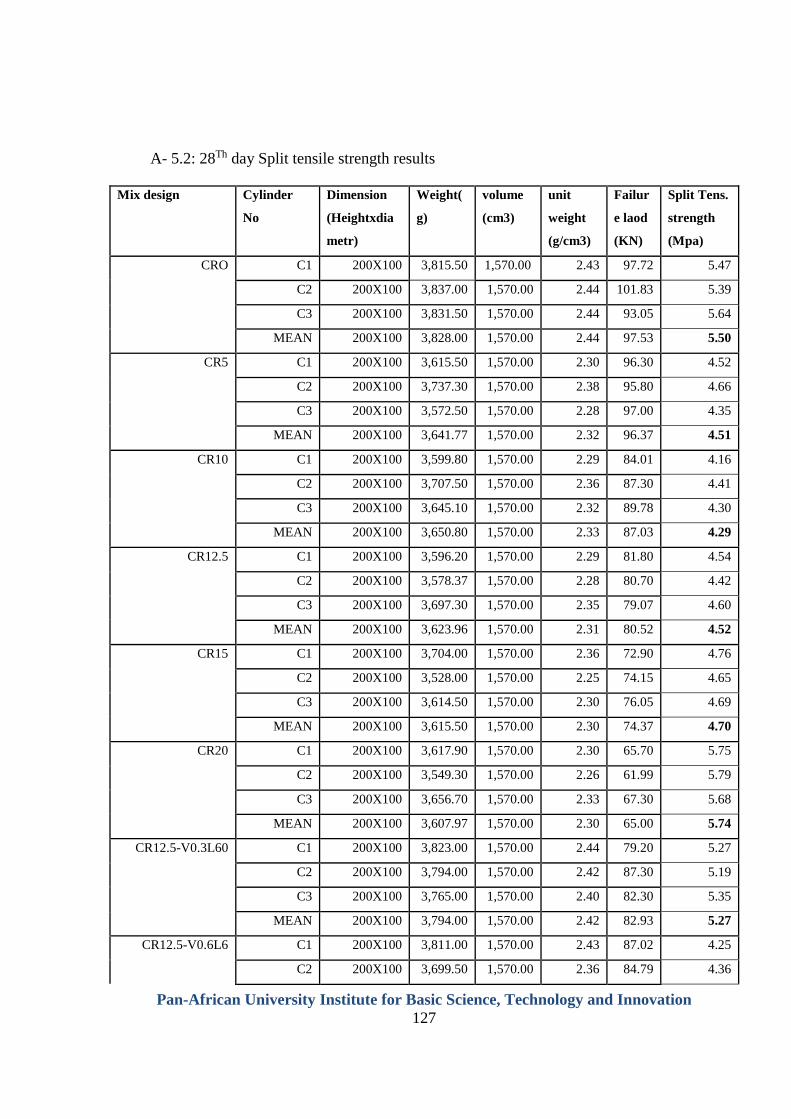
Pan-African University Institute for Basic Science, Technology and Innovation
127
A- 5.2: 28Th day Split tensile strength results
Mix design Cylinder
No
Dimension
(Heightxdia
metr)
Weight(
g)
volume
(cm3)
unit
weight
(g/cm3)
Failur
e laod
(KN)
Split Tens.
strength
(Mpa)
CRO C1 200X100 3,815.50 1,570.00 2.43 97.72 5.47
C2 200X100 3,837.00 1,570.00 2.44 101.83 5.39
C3 200X100 3,831.50 1,570.00 2.44 93.05 5.64
MEAN 200X100 3,828.00 1,570.00 2.44 97.53 5.50
CR5 C1 200X100 3,615.50 1,570.00 2.30 96.30 4.52
C2 200X100 3,737.30 1,570.00 2.38 95.80 4.66
C3 200X100 3,572.50 1,570.00 2.28 97.00 4.35
MEAN 200X100 3,641.77 1,570.00 2.32 96.37 4.51
CR10 C1 200X100 3,599.80 1,570.00 2.29 84.01 4.16
C2 200X100 3,707.50 1,570.00 2.36 87.30 4.41
C3 200X100 3,645.10 1,570.00 2.32 89.78 4.30
MEAN 200X100 3,650.80 1,570.00 2.33 87.03 4.29
CR12.5 C1 200X100 3,596.20 1,570.00 2.29 81.80 4.54
C2 200X100 3,578.37 1,570.00 2.28 80.70 4.42
C3 200X100 3,697.30 1,570.00 2.35 79.07 4.60
MEAN 200X100 3,623.96 1,570.00 2.31 80.52 4.52
CR15 C1 200X100 3,704.00 1,570.00 2.36 72.90 4.76
C2 200X100 3,528.00 1,570.00 2.25 74.15 4.65
C3 200X100 3,614.50 1,570.00 2.30 76.05 4.69
MEAN 200X100 3,615.50 1,570.00 2.30 74.37 4.70
CR20 C1 200X100 3,617.90 1,570.00 2.30 65.70 5.75
C2 200X100 3,549.30 1,570.00 2.26 61.99 5.79
C3 200X100 3,656.70 1,570.00 2.33 67.30 5.68
MEAN 200X100 3,607.97 1,570.00 2.30 65.00 5.74
CR12.5-V0.3L60 C1 200X100 3,823.00 1,570.00 2.44 79.20 5.27
C2 200X100 3,794.00 1,570.00 2.42 87.30 5.19
C3 200X100 3,765.00 1,570.00 2.40 82.30 5.35
MEAN 200X100 3,794.00 1,570.00 2.42 82.93 5.27
CR12.5-V0.6L6 C1 200X100 3,811.00 1,570.00 2.43 87.02 4.25
C2 200X100 3,699.50 1,570.00 2.36 84.79 4.36
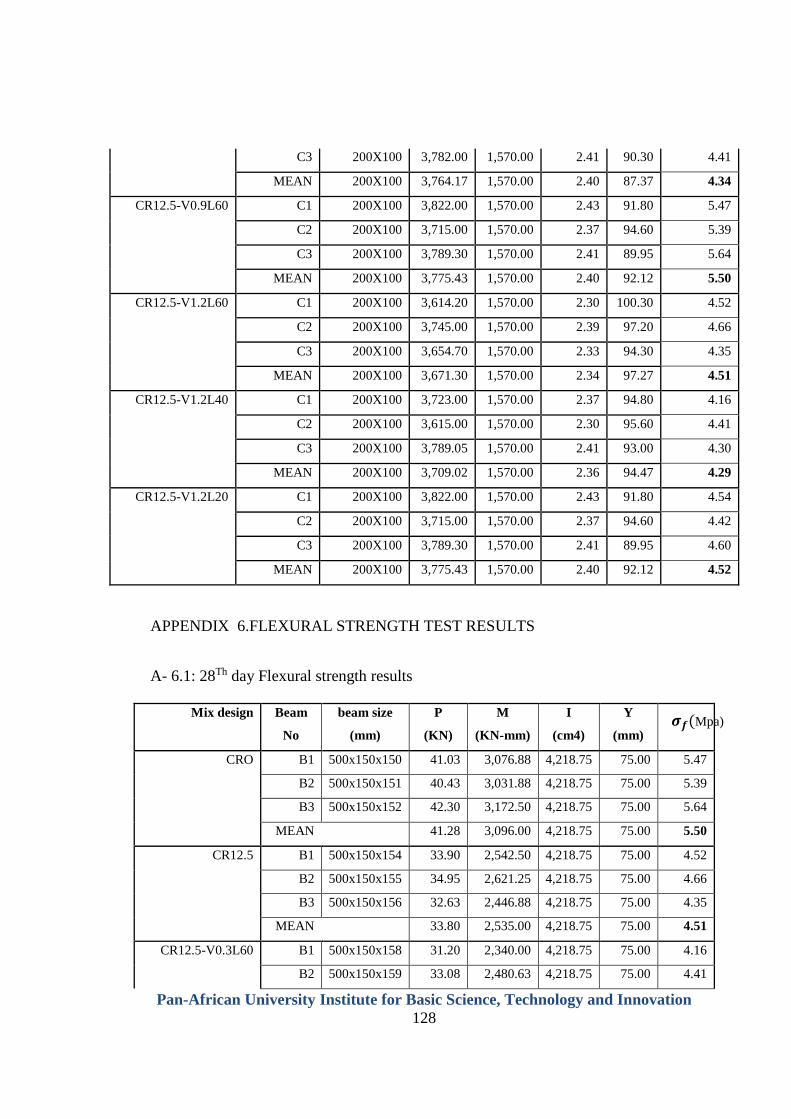
Pan-African University Institute for Basic Science, Technology and Innovation
128
C3 200X100 3,782.00 1,570.00 2.41 90.30 4.41
MEAN 200X100 3,764.17 1,570.00 2.40 87.37 4.34
CR12.5-V0.9L60 C1 200X100 3,822.00 1,570.00 2.43 91.80 5.47
C2 200X100 3,715.00 1,570.00 2.37 94.60 5.39
C3 200X100 3,789.30 1,570.00 2.41 89.95 5.64
MEAN 200X100 3,775.43 1,570.00 2.40 92.12 5.50
CR12.5-V1.2L60 C1 200X100 3,614.20 1,570.00 2.30 100.30 4.52
C2 200X100 3,745.00 1,570.00 2.39 97.20 4.66
C3 200X100 3,654.70 1,570.00 2.33 94.30 4.35
MEAN 200X100 3,671.30 1,570.00 2.34 97.27 4.51
CR12.5-V1.2L40 C1 200X100 3,723.00 1,570.00 2.37 94.80 4.16
C2 200X100 3,615.00 1,570.00 2.30 95.60 4.41
C3 200X100 3,789.05 1,570.00 2.41 93.00 4.30
MEAN 200X100 3,709.02 1,570.00 2.36 94.47 4.29
CR12.5-V1.2L20 C1 200X100 3,822.00 1,570.00 2.43 91.80 4.54
C2 200X100 3,715.00 1,570.00 2.37 94.60 4.42
C3 200X100 3,789.30 1,570.00 2.41 89.95 4.60
MEAN 200X100 3,775.43 1,570.00 2.40 92.12 4.52
APPENDIX 6.FLEXURAL STRENGTH TEST RESULTS
A- 6.1: 28Th day Flexural strength results
Mix design Beam
No
beam size
(mm)
P
(KN)
M
(KN-mm)
I
(cm4)
Y
(mm)
CRO B1 500x150x150 41.03 3,076.88 4,218.75 75.00 5.47
B2 500x150x151 40.43 3,031.88 4,218.75 75.00 5.39
B3 500x150x152 42.30 3,172.50 4,218.75 75.00 5.64
MEAN 41.28 3,096.00 4,218.75 75.00 5.50
CR12.5 B1 500x150x154 33.90 2,542.50 4,218.75 75.00 4.52
B2 500x150x155 34.95 2,621.25 4,218.75 75.00 4.66
B3 500x150x156 32.63 2,446.88 4,218.75 75.00 4.35
MEAN 33.80 2,535.00 4,218.75 75.00 4.51
CR12.5-V0.3L60 B1 500x150x158 31.20 2,340.00 4,218.75 75.00 4.16
B2 500x150x159 33.08 2,480.63 4,218.75 75.00 4.41
𝝈𝒇(Mpa)
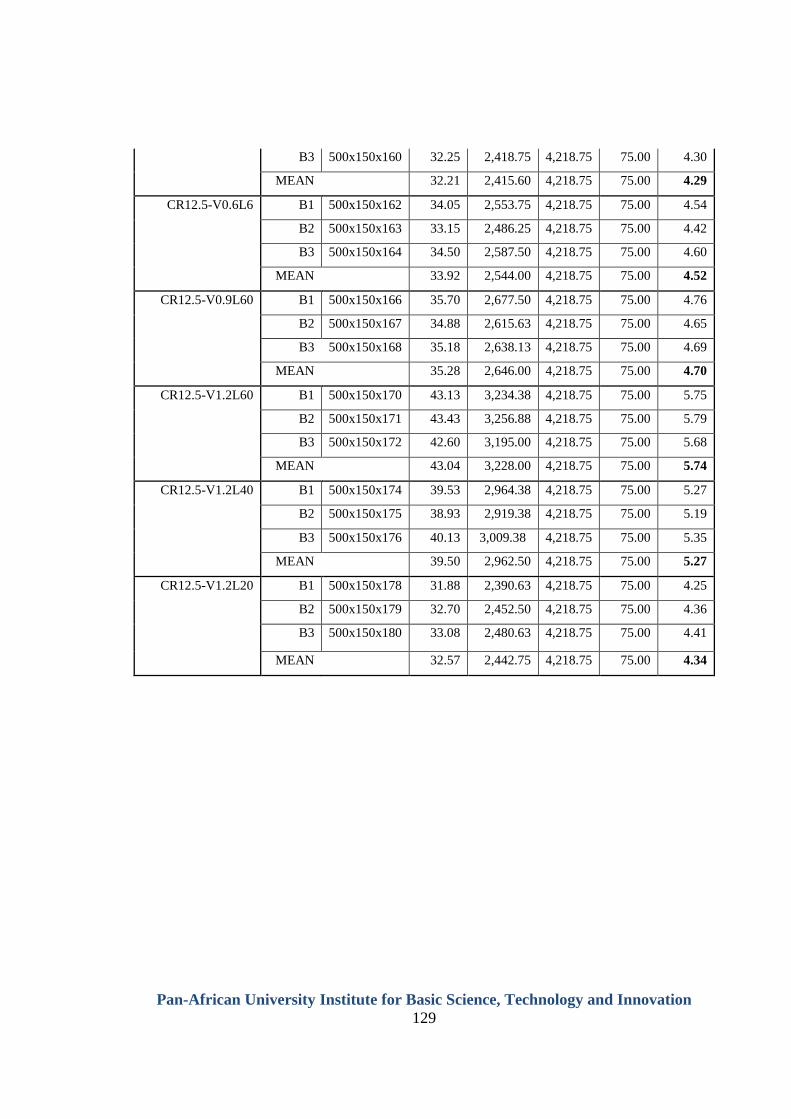
Pan-African University Institute for Basic Science, Technology and Innovation
129
B3 500x150x160 32.25 2,418.75 4,218.75 75.00 4.30
MEAN 32.21 2,415.60 4,218.75 75.00 4.29
CR12.5-V0.6L6 B1 500x150x162 34.05 2,553.75 4,218.75 75.00 4.54
B2 500x150x163 33.15 2,486.25 4,218.75 75.00 4.42
B3 500x150x164 34.50 2,587.50 4,218.75 75.00 4.60
MEAN 33.92 2,544.00 4,218.75 75.00 4.52
CR12.5-V0.9L60 B1 500x150x166 35.70 2,677.50 4,218.75 75.00 4.76
B2 500x150x167 34.88 2,615.63 4,218.75 75.00 4.65
B3 500x150x168 35.18 2,638.13 4,218.75 75.00 4.69
MEAN 35.28 2,646.00 4,218.75 75.00 4.70
CR12.5-V1.2L60 B1 500x150x170 43.13 3,234.38 4,218.75 75.00 5.75
B2 500x150x171 43.43 3,256.88 4,218.75 75.00 5.79
B3 500x150x172 42.60 3,195.00 4,218.75 75.00 5.68
MEAN 43.04 3,228.00 4,218.75 75.00 5.74
CR12.5-V1.2L40 B1 500x150x174 39.53 2,964.38 4,218.75 75.00 5.27
B2 500x150x175 38.93 2,919.38 4,218.75 75.00 5.19
B3 500x150x176 40.13 3,009.38 4,218.75 75.00 5.35
MEAN 39.50 2,962.50 4,218.75 75.00 5.27
CR12.5-V1.2L20 B1 500x150x178 31.88 2,390.63 4,218.75 75.00 4.25
B2 500x150x179 32.70 2,452.50 4,218.75 75.00 4.36
B3 500x150x180 33.08 2,480.63 4,218.75 75.00 4.41
MEAN 32.57 2,442.75 4,218.75 75.00 4.34
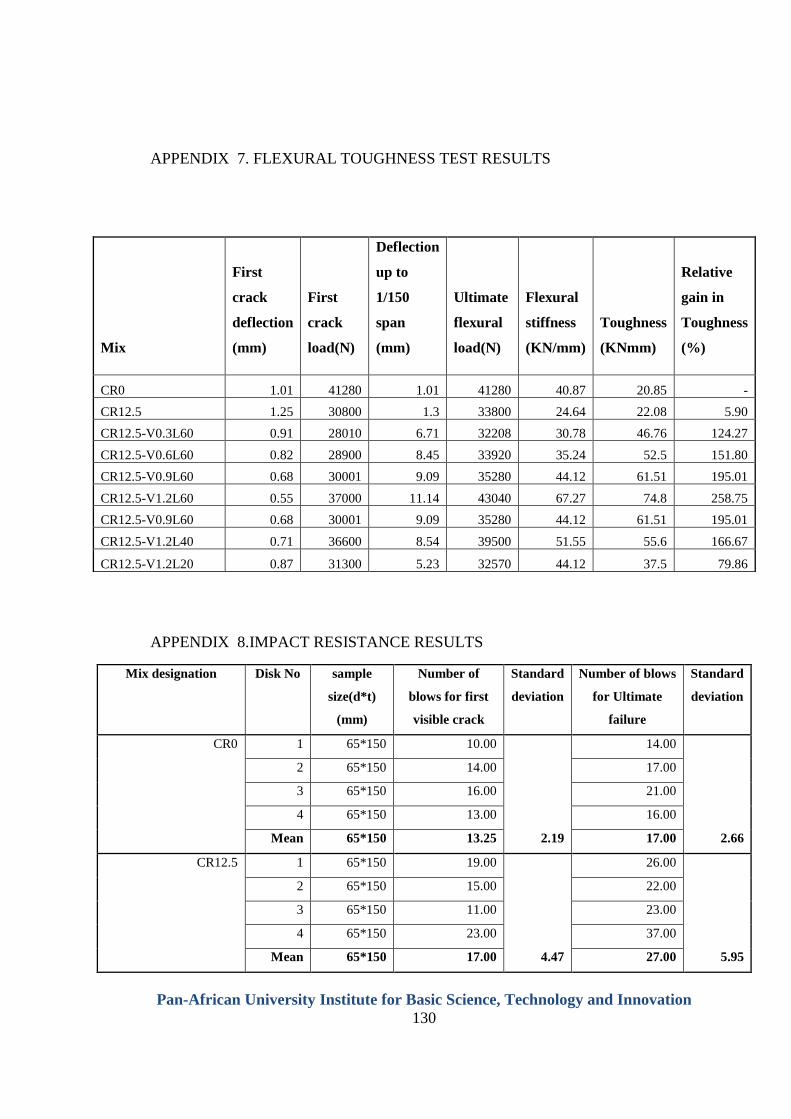
Pan-African University Institute for Basic Science, Technology and Innovation
130
APPENDIX 7. FLEXURAL TOUGHNESS TEST RESULTS
APPENDIX 8.IMPACT RESISTANCE RESULTS
Mix designation Disk No sample
size(d*t)
(mm)
Number of
blows for first
visible crack
Standard
deviation
Number of blows
for Ultimate
failure
Standard
deviation
CR0 1 65*150 10.00 14.00
2 65*150 14.00 17.00
3 65*150 16.00 21.00
4 65*150 13.00 16.00
Mean 65*150 13.25 2.19 17.00 2.66
CR12.5 1 65*150 19.00 26.00
2 65*150 15.00 22.00
3 65*150 11.00 23.00
4 65*150 23.00 37.00
Mean 65*150 17.00 4.47 27.00 5.95
Mix
First
crack
deflection
(mm)
First
crack
load(N)
Deflection
up to
1/150
span
(mm)
Ultimate
flexural
load(N)
Flexural
stiffness
(KN/mm)
Toughness
(KNmm)
Relative
gain in
Toughness
(%)
CR0 1.01 41280 1.01 41280 40.87 20.85 -
CR12.5 1.25 30800 1.3 33800 24.64 22.08 5.90
CR12.5-V0.3L60 0.91 28010 6.71 32208 30.78 46.76 124.27
CR12.5-V0.6L60 0.82 28900 8.45 33920 35.24 52.5 151.80
CR12.5-V0.9L60 0.68 30001 9.09 35280 44.12 61.51 195.01
CR12.5-V1.2L60 0.55 37000 11.14 43040 67.27 74.8 258.75
CR12.5-V0.9L60 0.68 30001 9.09 35280 44.12 61.51 195.01
CR12.5-V1.2L40 0.71 36600 8.54 39500 51.55 55.6 166.67
CR12.5-V1.2L20 0.87 31300 5.23 32570 44.12 37.5 79.86
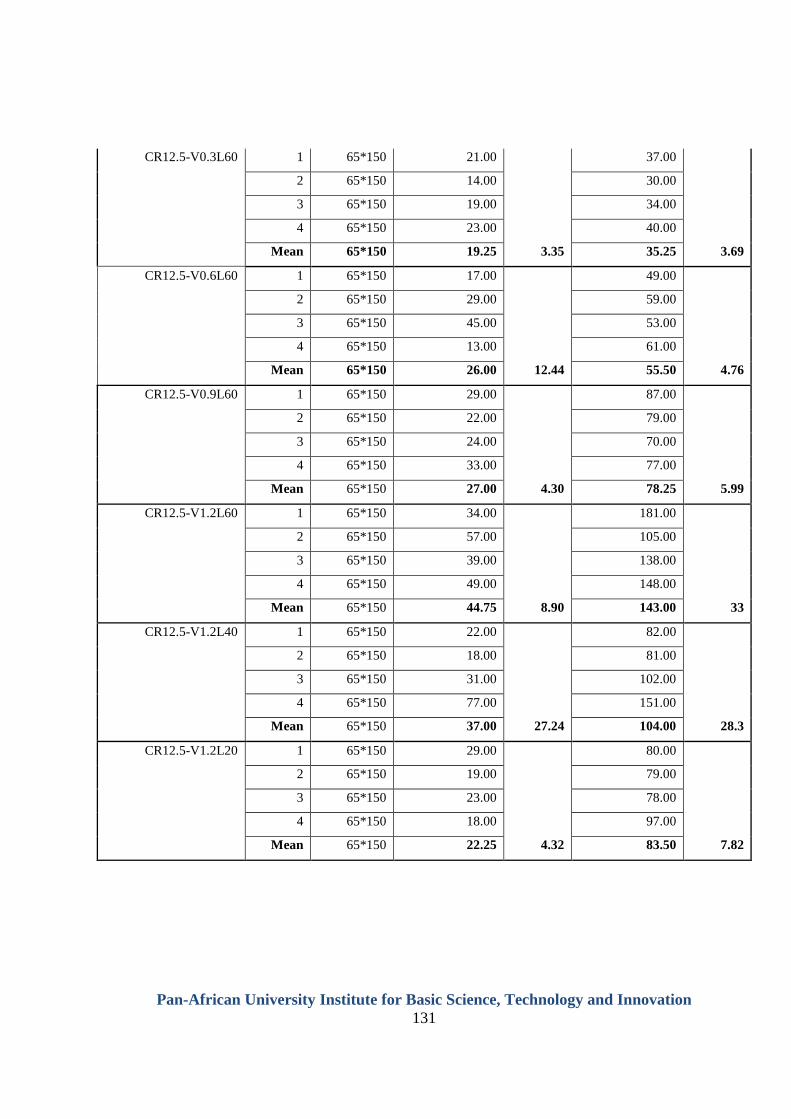
Pan-African University Institute for Basic Science, Technology and Innovation
131
CR12.5-V0.3L60 1 65*150 21.00 37.00
2 65*150 14.00 30.00
3 65*150 19.00 34.00
4 65*150 23.00 40.00
Mean 65*150 19.25 3.35 35.25 3.69
CR12.5-V0.6L60 1 65*150 17.00 49.00
2 65*150 29.00 59.00
3 65*150 45.00 53.00
4 65*150 13.00 61.00
Mean 65*150 26.00 12.44 55.50 4.76
CR12.5-V0.9L60 1 65*150 29.00 87.00
2 65*150 22.00 79.00
3 65*150 24.00 70.00
4 65*150 33.00 77.00
Mean 65*150 27.00 4.30 78.25 5.99
CR12.5-V1.2L60 1 65*150 34.00 181.00
2 65*150 57.00 105.00
3 65*150 39.00 138.00
4 65*150 49.00 148.00
Mean 65*150 44.75 8.90 143.00 33
CR12.5-V1.2L40 1 65*150 22.00 82.00
2 65*150 18.00 81.00
3 65*150 31.00 102.00
4 65*150 77.00 151.00
Mean 65*150 37.00 27.24 104.00 28.3
CR12.5-V1.2L20 1 65*150 29.00 80.00
2 65*150 19.00 79.00
3 65*150 23.00 78.00
4 65*150 18.00 97.00
Mean 65*150 22.25 4.32 83.50 7.82
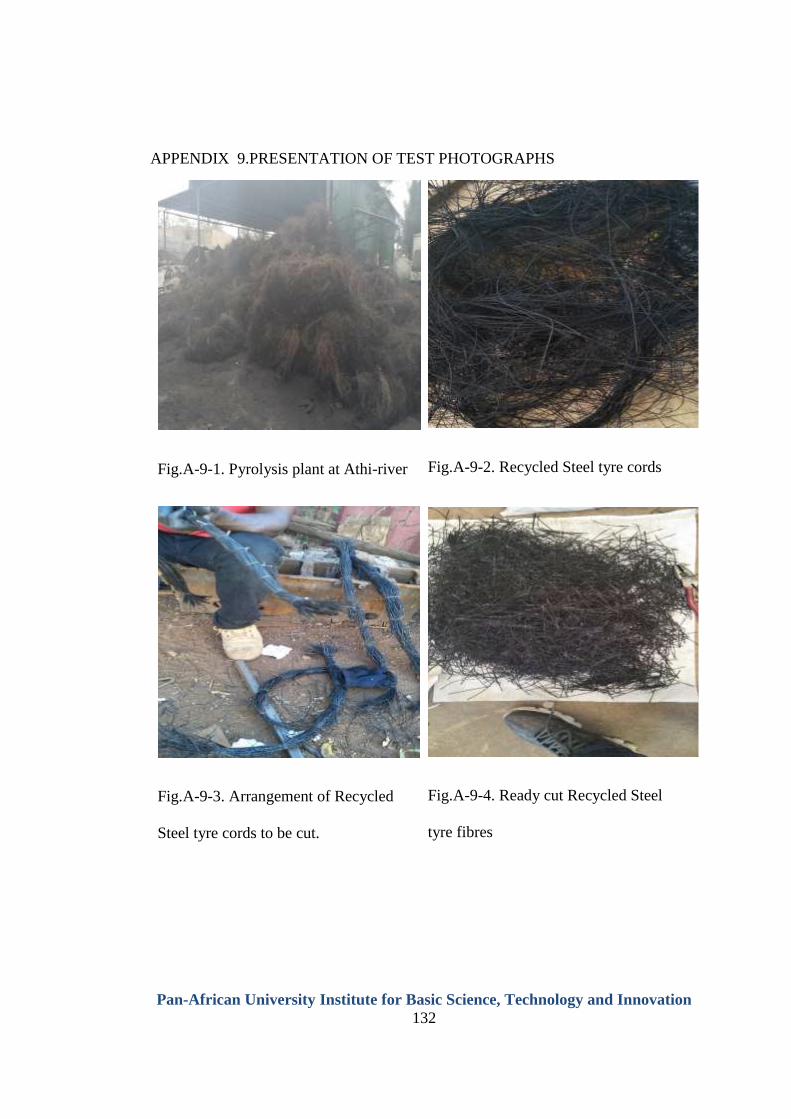
Pan-African University Institute for Basic Science, Technology and Innovation
132
APPENDIX 9.PRESENTATION OF TEST PHOTOGRAPHS
Fig.A-9-1. Pyrolysis plant at Athi-river
Fig.A-9-2. Recycled Steel tyre cords
Fig.A-9-3. Arrangement of Recycled
Steel tyre cords to be cut.
Fig.A-9-4. Ready cut Recycled Steel
tyre fibres
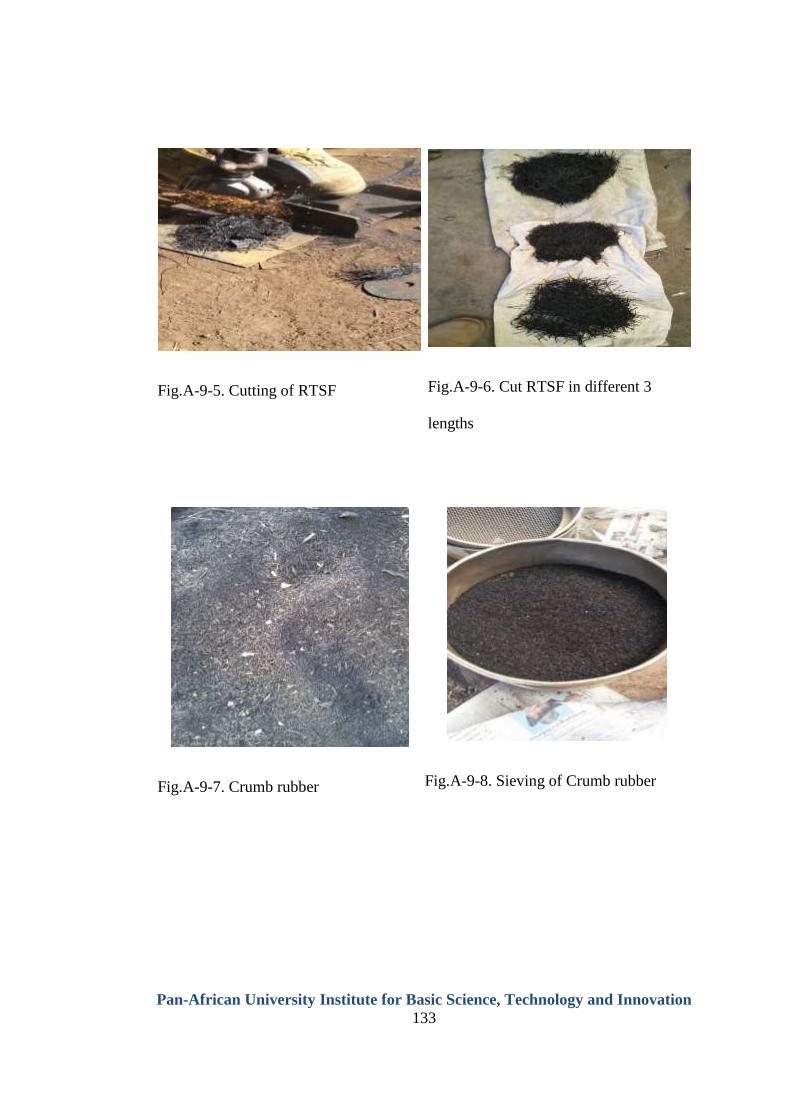
Pan-African University Institute for Basic Science, Technology and Innovation
133
Fig.A-9-5. Cutting of RTSF
Fig.A-9-6. Cut RTSF in different 3
lengths
Fig.A-9-7. Crumb rubber
Fig.A-9-8. Sieving of Crumb rubber
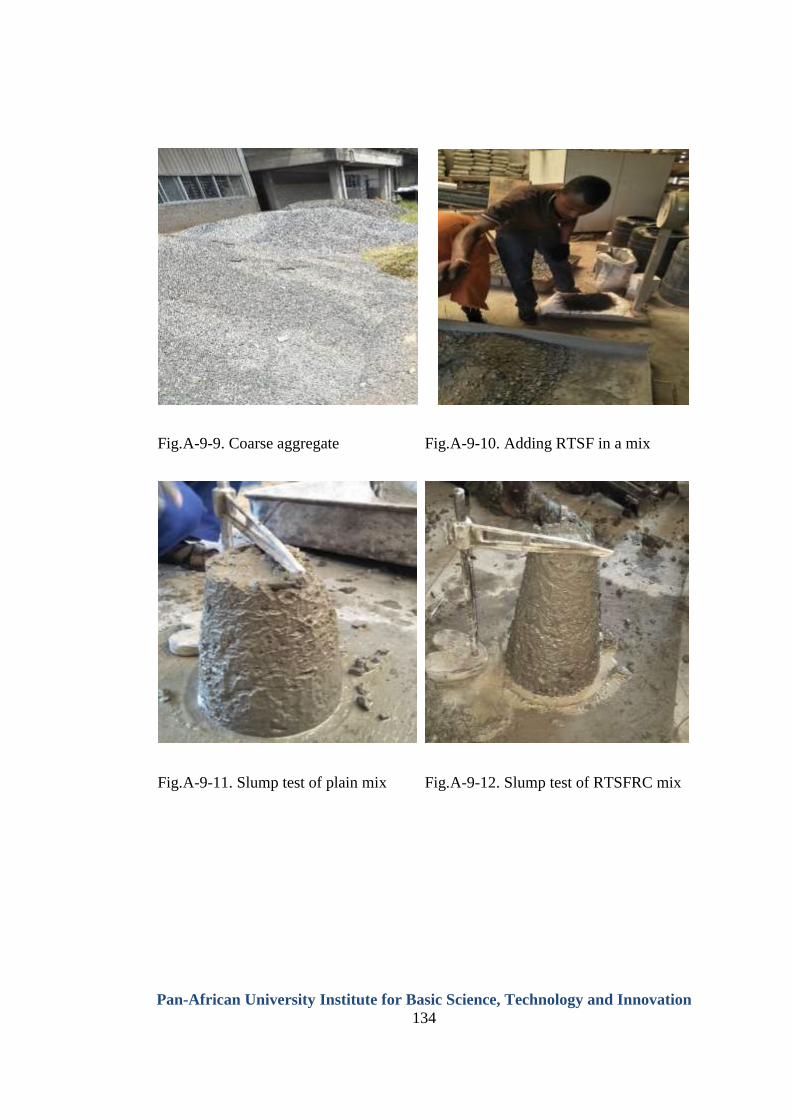
Pan-African University Institute for Basic Science, Technology and Innovation
134
Fig.A-9-9. Coarse aggregate
Fig.A-9-10. Adding RTSF in a mix
Fig.A-9-11. Slump test of plain mix
Fig.A-9-12. Slump test of RTSFRC mix
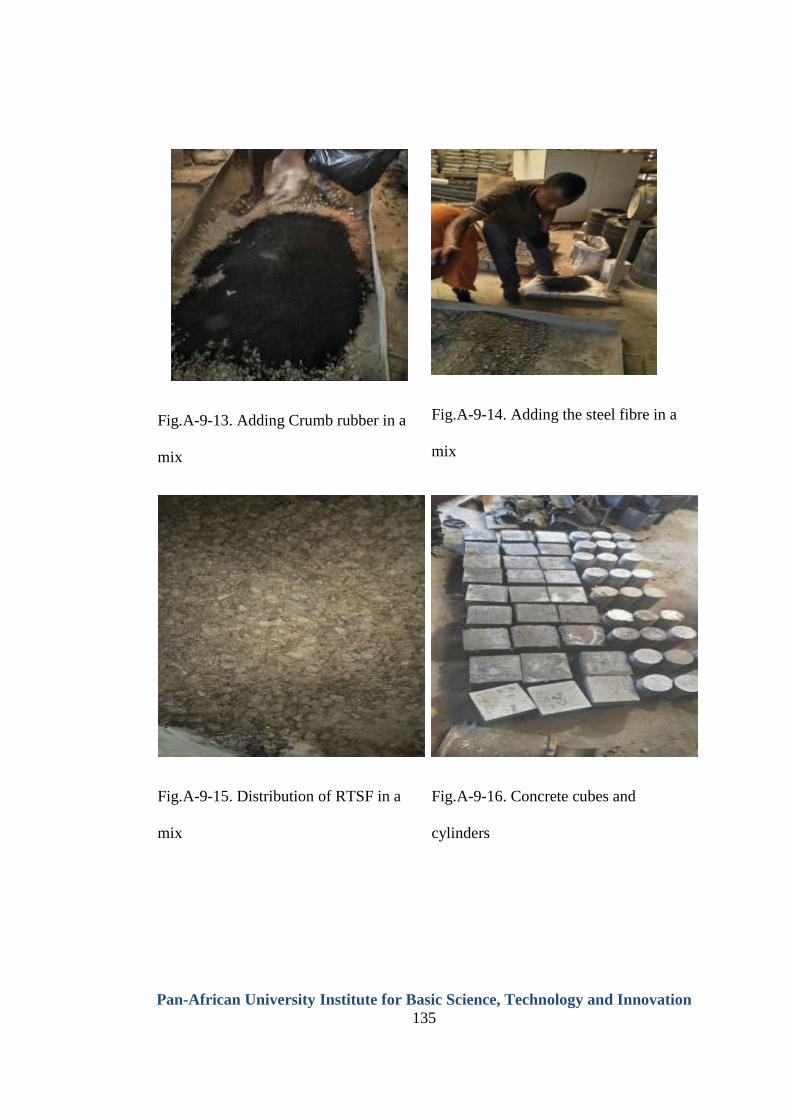
Pan-African University Institute for Basic Science, Technology and Innovation
135
Fig.A-9-13. Adding Crumb rubber in a
mix
Fig.A-9-14. Adding the steel fibre in a
mix
Fig.A-9-15. Distribution of RTSF in a
mix
Fig.A-9-16. Concrete cubes and
cylinders
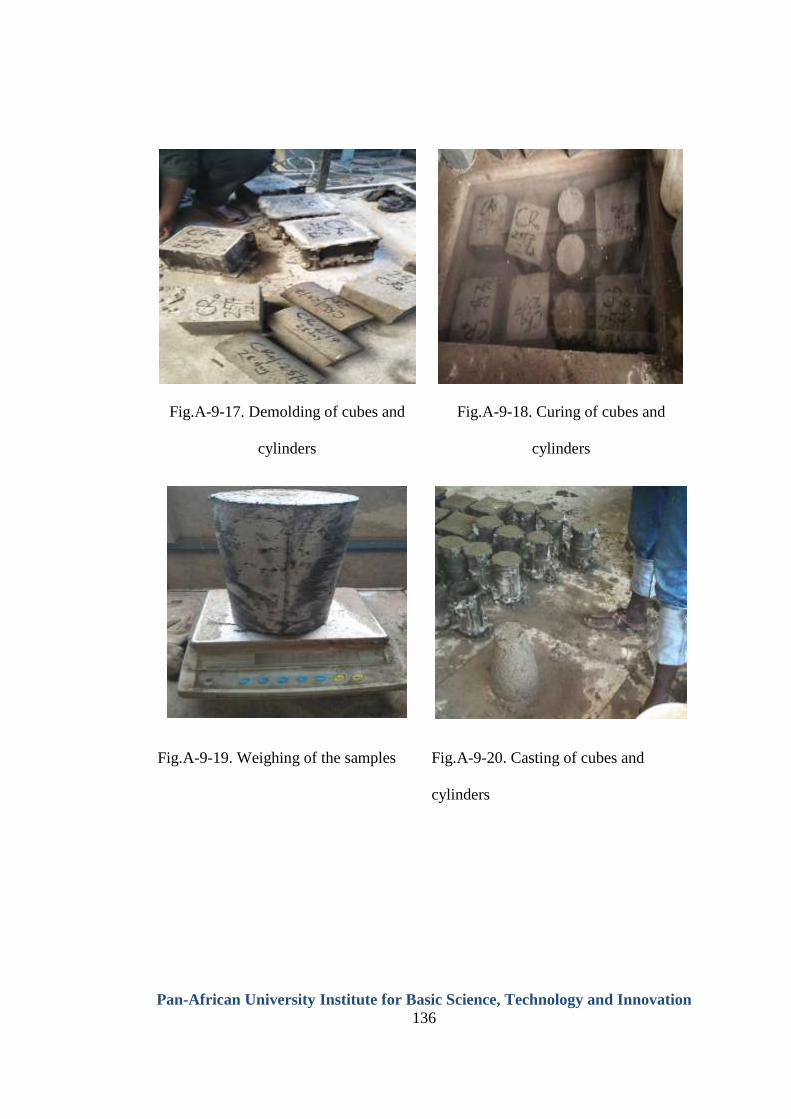
Pan-African University Institute for Basic Science, Technology and Innovation
136
Fig.A-9-17. Demolding of cubes and
cylinders
Fig.A-9-18. Curing of cubes and
cylinders
Fig.A-9-19. Weighing of the samples
Fig.A-9-20. Casting of cubes and
cylinders
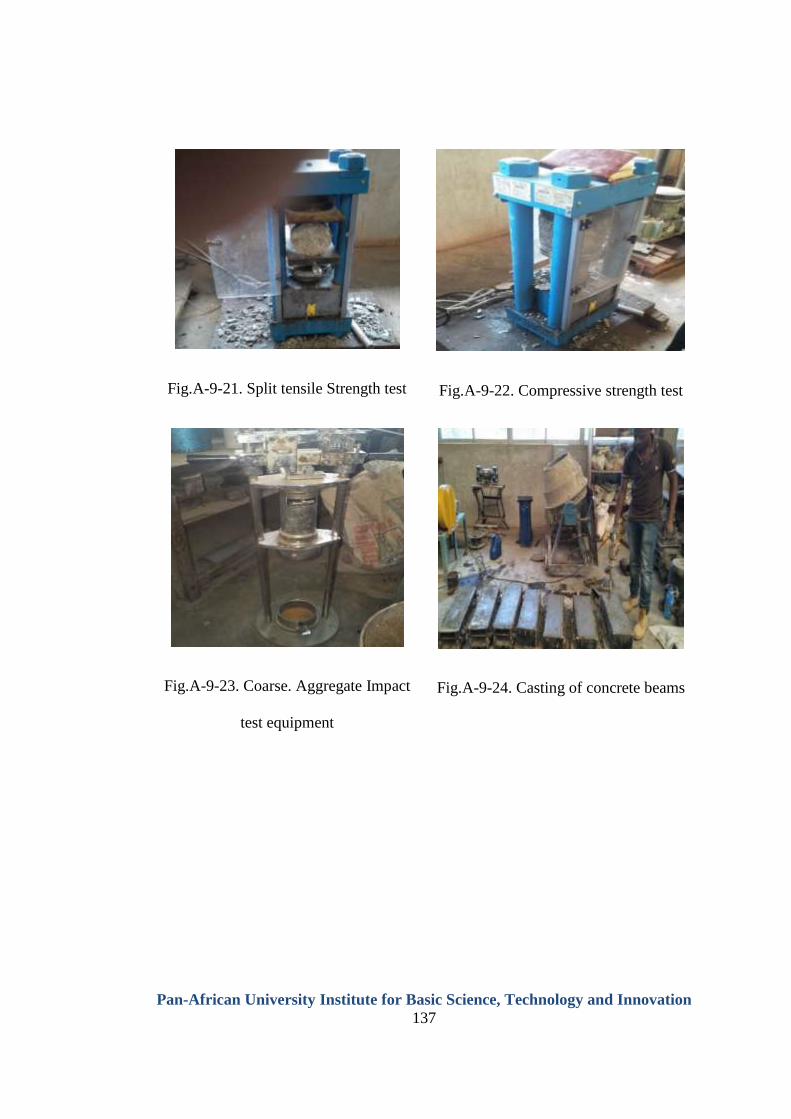
Pan-African University Institute for Basic Science, Technology and Innovation
137
Fig.A-9-21. Split tensile Strength test
Fig.A-9-22. Compressive strength test
Fig.A-9-23. Coarse. Aggregate Impact
test equipment
Fig.A-9-24. Casting of concrete beams
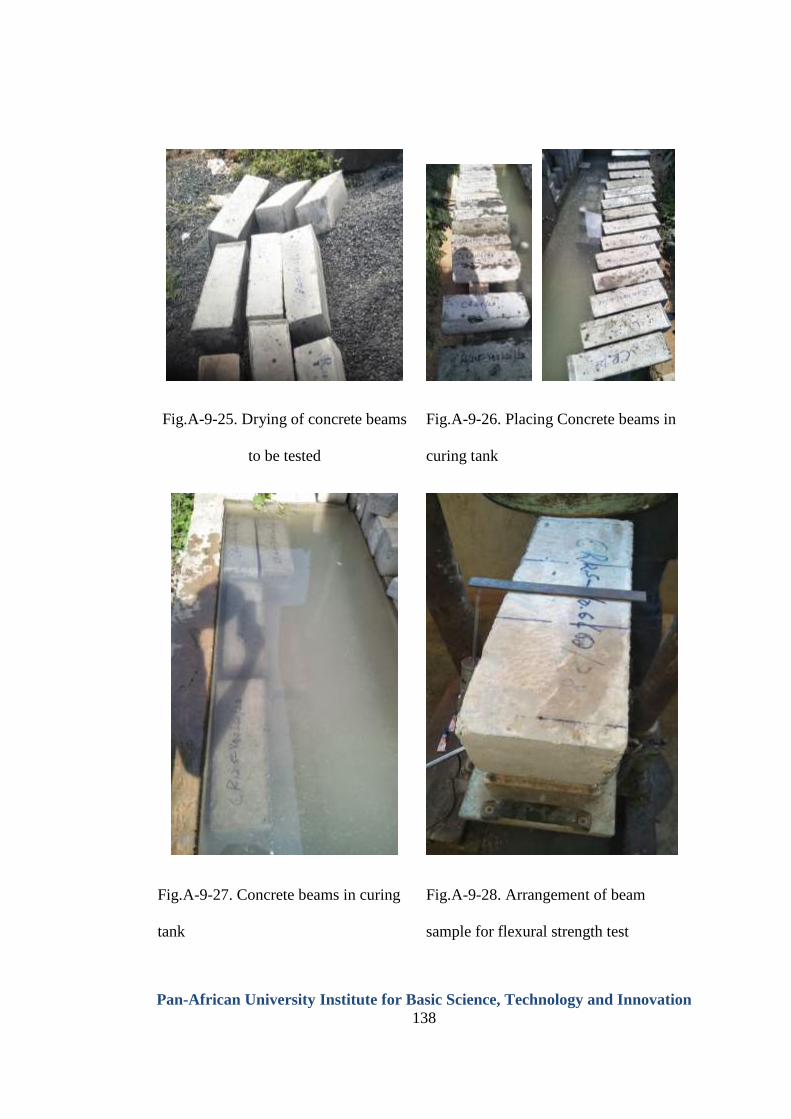
Pan-African University Institute for Basic Science, Technology and Innovation
138
Fig.A-9-25. Drying of concrete beams
to be tested
Fig.A-9-26. Placing Concrete beams in
curing tank
Fig.A-9-27. Concrete beams in curing
tank
Fig.A-9-28. Arrangement of beam
sample for flexural strength test
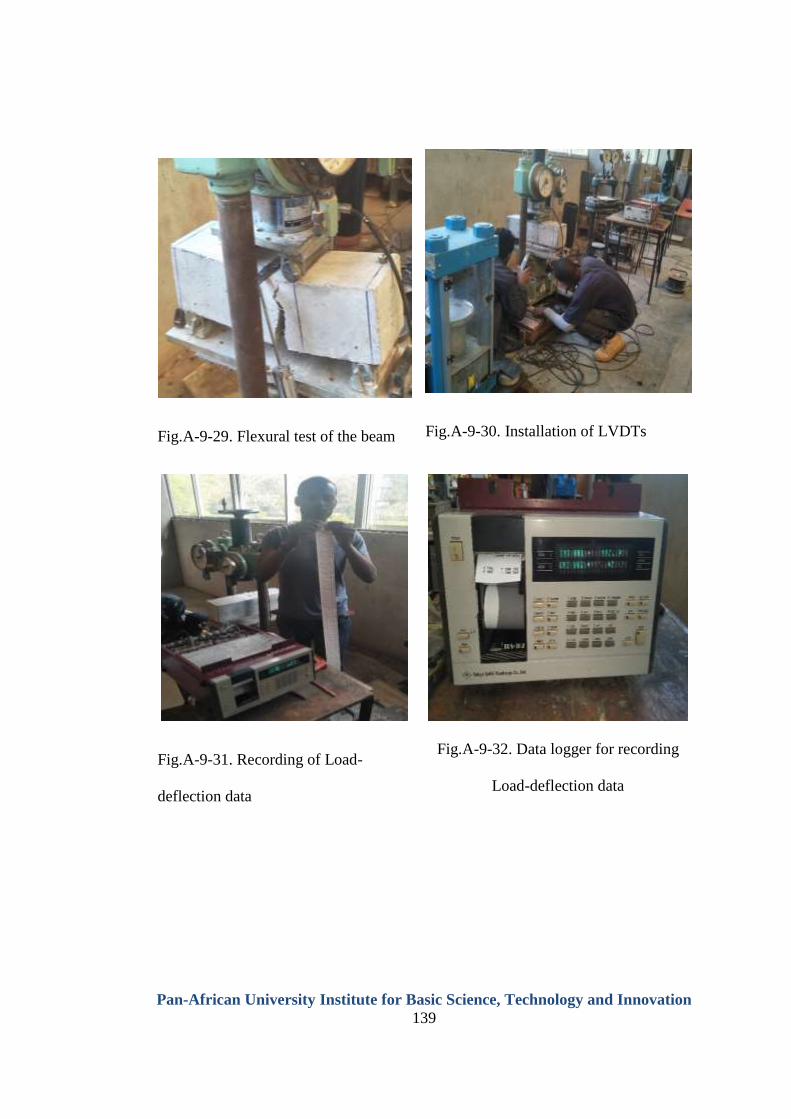
Pan-African University Institute for Basic Science, Technology and Innovation
139
Fig.A-9-29. Flexural test of the beam
Fig.A-9-30. Installation of LVDTs
Fig.A-9-31. Recording of Load-
deflection data
Fig.A-9-32. Data logger for recording
Load-deflection data
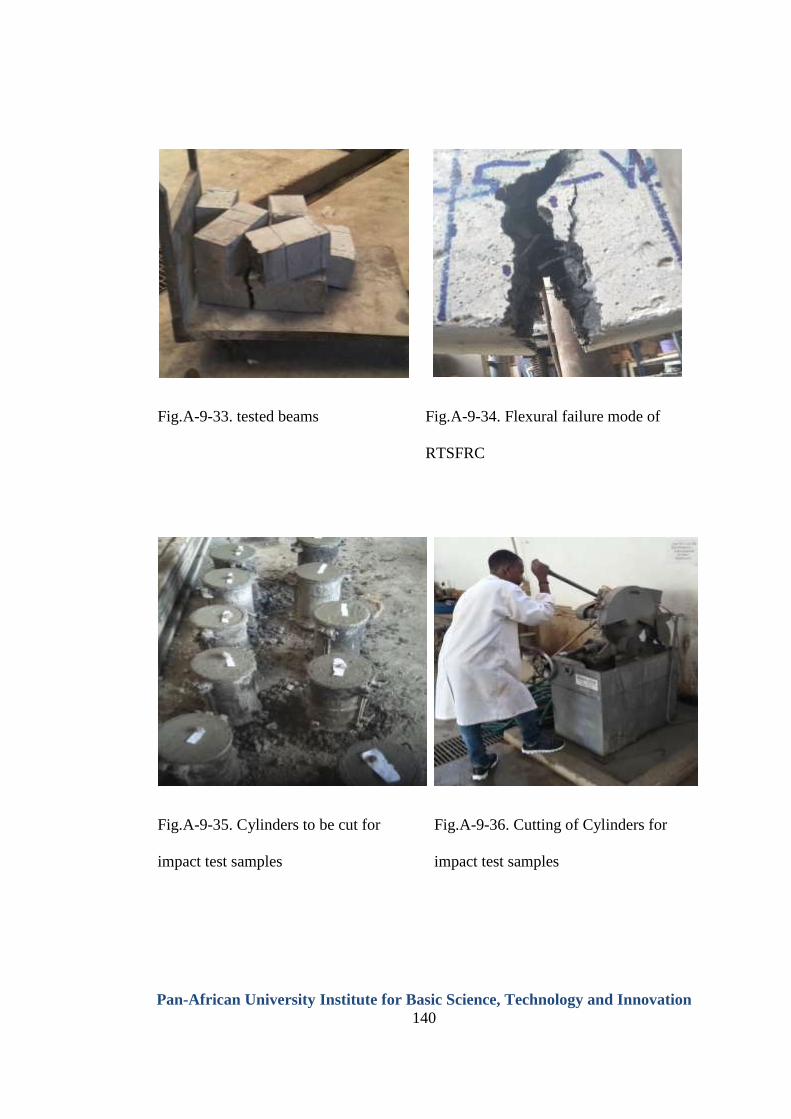
Pan-African University Institute for Basic Science, Technology and Innovation
140
Fig.A-9-33. tested beams
Fig.A-9-34. Flexural failure mode of
RTSFRC
Fig.A-9-35. Cylinders to be cut for
impact test samples
Fig.A-9-36. Cutting of Cylinders for
impact test samples
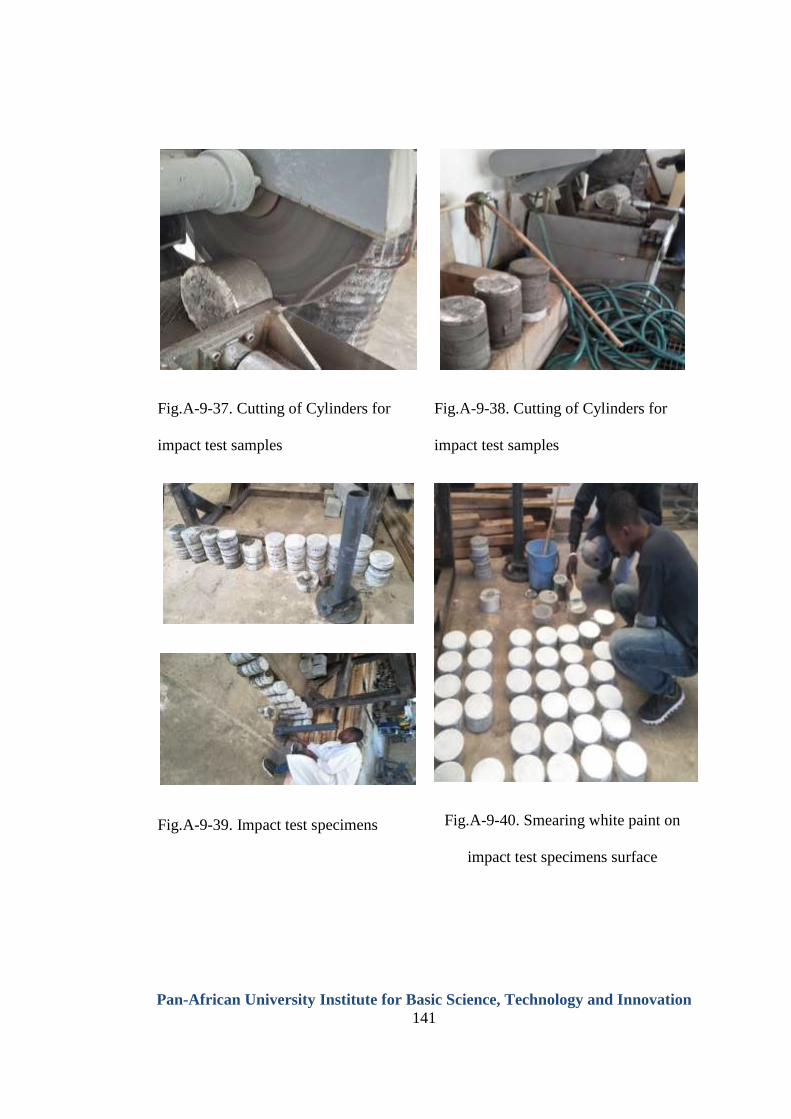
Pan-African University Institute for Basic Science, Technology and Innovation
141
Fig.A-9-37. Cutting of Cylinders for
impact test samples
Fig.A-9-38. Cutting of Cylinders for
impact test samples
Fig.A-9-39. Impact test specimens
Fig.A-9-40. Smearing white paint on
impact test specimens surface
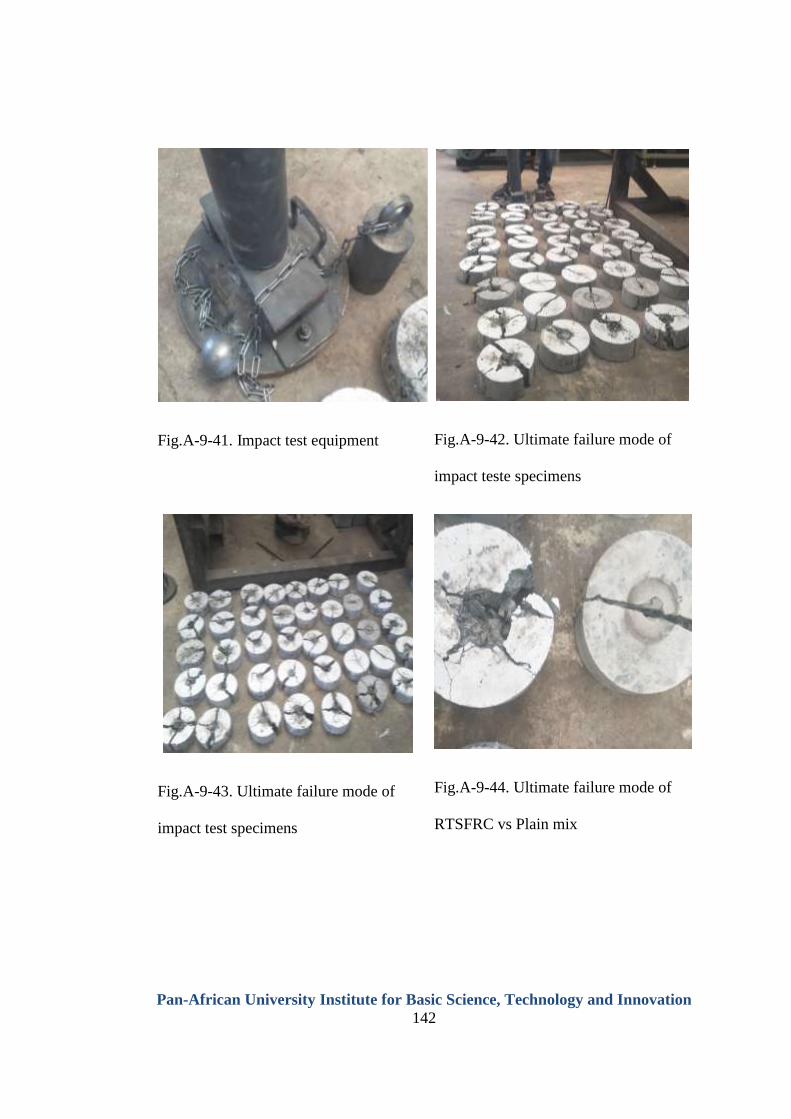
Pan-African University Institute for Basic Science, Technology and Innovation
142
Fig.A-9-41. Impact test equipment
Fig.A-9-42. Ultimate failure mode of
impact teste specimens
Fig.A-9-43. Ultimate failure mode of
impact test specimens
Fig.A-9-44. Ultimate failure mode of
RTSFRC vs Plain mix
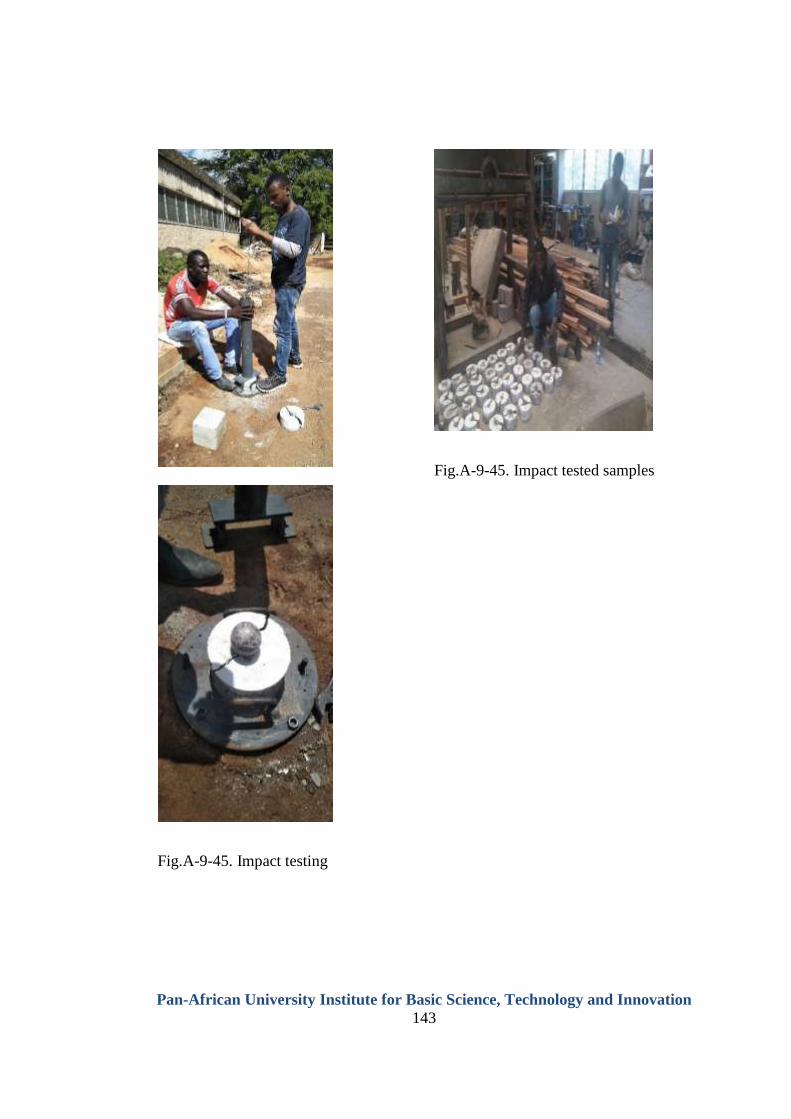
Pan-African University Institute for Basic Science, Technology and Innovation
143
Fig.A-9-45. Impact testing
Fig.A-9-45. Impact tested samples

Pan-African University Institute for Basic Science, Technology and Innovation
144