Embed Size (px)
Citation preview

Smart Structures and Systems, Vol. 6, No. 3 (2010) 183-196 183
Structural monitoring of wind turbines using wirelesssensor networks
R. Andrew Swartz1, Jerome P. Lynch2*, Stephan Zerbst3, Bert Sweetman4
and Raimund Rolfes3
1Department of Civil and Environmental Engineering, Michigan Technological University, Houghton,
MI 49931, USA2Department of Civil and Environmental Engineering, University of Michigan, Ann Arbor, MI 48109, USA
3Institute for Structural Analysis, Leibniz University of Hanover, Germany4Department of Maritime Systems Engineering, Texas A&M Galveston, Galveston, TX 77553, USA
(Received May 1, 2008, Accepted July 1, 2009)
Abstract. Monitoring and economical design of alternative energy generators such as wind turbines is becomingincreasingly critical; however acquisition of the dynamic output data can be a time-consuming and costly process.In recent years, low-cost wireless sensors have emerged as an enabling technology for structural monitoringapplications. In this study, wireless sensor networks are installed in three operational turbines in order to demonstratetheir efficacy in this unique operational environment. The objectives of the first installation are to verify thatvibrational (acceleration) data can be collected and transmitted within a turbine tower and that it is comparable todata collected using a traditional tethered system. In the second instrumentation, the wireless network includesstrain gauges at the base of the structure. Also, data is collected regarding the performance of the wirelesscommunication channels within the tower. In both turbines, collected wireless sensor data is used for off-line,output-only modal analysis of the ambiently (wind) excited turbine towers. The final installation is on a turbinewith embedded braking capabilities within the nacelle to generate an “impulse-like” load at the top of the tower.This ability to apply such a load improves the modal analysis results obtained in cases where ambient excitationfails to be sufficiently broad-band or white. The improved loading allows for computation of true mode shapes, anecessary precursor to many conditional monitoring techniques.
Keywords: wireless sensors; structural health monitoring; wind energy; modal analysis.
1. Introduction
With the recent rise in public interest in renewable and carbon-neutral energy sources, wind energy is
gaining popularity as perhaps the most technologically developed and practical alternative available
today. Recent studies put the annual wind energy generation capacity of the United States at 11,575
megawatts (Leopold 2007) with a growth rate of 30% annually (Southern 2007). Technological
improvements (e.g., larger, more powerful turbines) and federal tax subsidies have increased
investment in wind energy technology to the point where 33 states host sizable wind farms, 19 of which
are significant with capacities over 100 MW (DOE 2006). Despite those accomplishments, wind energy
only accounts for 0.8% of the United State’s total energy supply (Leopold 2007). This number pales in
*Corresponding Author, Associate Professor, E-mail: [email protected]

184 R. Andrew Swartz, Jerome P. Lynch, Stephan Zerbst, Bert Sweetman and Raimund Rolfes
comparison to other developed nations such as Germany which already realizes a full 7% of its energy
supply from wind (Wiser and Bolinger 2007). By substantially increasing its wind power capacity, the
United States could drastically reduce its own carbon emissions by as much as 2 billion tons by 2050, if
it were to generate 20% of its energy by wind (DOE 2006).
Improvements to the cost/benefit ratio of wind turbine construction can come through the aggressive
pursuit of efficient turbine designs. Longer and lighter blade designs using novel materials (e.g., fiberglass
composites) will yield better performance (Schulz and Sundaresan 2006). Frequently reversing wind
loads and blade orientation with respect to gravity subjects blades to high levels of fatigue that have the
potential to cause sudden failure (Pitchford et al. 2007). Typically, blades experience damage requiring
repair or even replacement, on average, five times per year (Rolfes et al. 2006), a fact that negatively
affects the long-term profitability of wind turbines. Undetected damage can propagate into sudden and
catastrophic failure. A sheared blade presents a substantial risk to anyone on the ground and unbalances
the entire nacelle potentially resulting in damage to internal gears and the energy plant (Schulz and
Sundaresan 2006). For example, an on-shore turbine experienced sudden blade failure in Dunbar,
Scotland in 2005, resulting in £1.25 million in repair costs and significant downtime (Tweedie 2005).
Other reported damage mechanisms in wind turbines include corrosion (particularly for turbines sited
near bodies of salt water), foundation failures, and fatigue cracking in the steel turbine tower (Hau
2006). As future wind farms go off-shore, damage may not be detected as promptly, resulting in more
extensive damage, longer downtimes, and reduced profitability.
Installation of sensors, whether temporary or permanent, can provide turbine response data from
which the wind energy field can greatly benefit. First, data pertaining to the dynamic response of
turbines exposed to wind and wave loads (as in the case of off-shore turbines) may be collected. Such
data can be used to better understand the behavior of turbines under complex loading scenarios. The
end result is improved analytical models and more cost-efficient design procedures. Permanently
installed sensors can also serve as the basis for a structural health monitoring (SHM) system (Feng
2009). Such systems would provide turbine owners with data from which damage could be detected
and quantified. Early warning of damage can lower the cost of repairs and reduce turbine downtime;
the result is an increase in the long-term profitability of wind energy. While the many benefits
provided by monitoring are evident, few operational turbines have extensive sensor instrumentations
due to cost restrictions. With cable-based monitoring systems being challenging and costly to install,
alternative sensor technologies should be considered. Furthermore, installation of dense sensor
arrays in turbine blades are restricted by the availability of data communication lines in the turbine
slip ring. In particular, wireless sensors are considerably less-expensive to purchase and easier to
install than traditional cable-based systems (Lynch and Loh 2006). In the case of turbine blades,
wireless communication eradicates a need to move data through a slip ring interface, which can be
difficult and costly. Furthermore, wireless sensors may be rapidly installed for temporary installation
in turbine towers should the need arise.
In this study, wireless sensors are considered for dense installation in large operational wind turbines.
The objectives of this study are to: 1) illustrate the utility of wireless sensors in wind turbines; 2)
quantify the wireless communication reliability in turbine applications; and 3) employ high-quality
turbine response data for output-only modal analysis of operational turbines. This paper begins with a
brief overview of wireless sensing technology in general followed by a detailed discussion of the
wireless data acquisition system used herein in particular. To illustrate the utility of wireless sensors
installed in wind turbines, the proposed sensor technology is installed in three operational turbines in
Germany. Results for turbine designs by NEG Micon and Vestas Wind Systems are described with

Structural monitoring of wind turbines using wireless sensor networks 185
experimentally derived modal frequencies and operational deflection shapes (ODS) presented. Modal
analysis is accomplished off-line using DIAMOND (Damage Identification And Modal Analysis for
Dummies), a modal analysis software package developed at Los Alamos National Laboratory for MATLAB
(Doebling et al. 1997).
2. Wireless monitoring
Wireless sensors are gaining popularity for the monitoring of large structures because they are
inexpensive and easy to install (Lynch and Loh 2006). Recent years have seen a number of successful
field validation studies of wireless monitoring systems installed on operational civil structures (Lynch
et al. 2003, Kurata et al. 2005, Whelan et al. 2007, Pakzad et al. 2008). Wireless sensors are capable of
collecting data in lieu of traditional cabled sensors, but do not function as exact replacements. Without
wires, wireless sensors are often dependent on internally stored power (i.e., batteries) for operation.
Inefficient use of wireless sensors will deplete this finite energy source rapidly, necessitating frequent
battery replacement; repeated battery replacement would quickly erode any cost savings realized by
using wireless sensors. In particular, the wireless modem that serves as the link between a wireless
sensor and the outside world is the largest consumer of energy on the sensor. Therefore, it is important
to be selective about how the wireless communication channel is used. This fact has led to research into
parallel and distributed algorithms in which data processing is actually accomplished within the
wireless sensor, allowing them to broadcast a relatively small amount of processed data as opposed to a
massive amount of raw data (Straser and Kiremidjian 1998, Tanner et al. 2002, Lynch et al. 2004,
Clayton et al. 2005, Nagayama et al. 2007, Kijewski-Correa and Su 2009). Distributed processing is
possible in wireless sensing because of the computational processing power that is collocated with the
sensor. Another motivation for distributed processing is bandwidth limitations over the wireless
communication channel. Wireless communications are inherently limited by over-the-air transmission
rates and the amount of wireless bandwidth available in the crowded unlicensed industrial, scientific,
and medical (ISM) bands. This limitation restricts data transfer rates to less than what can be
accomplished with a comparable wired system. More recently, network-wide algorithms have been
proposed in which wireless sensors exchange limited data between themselves to compute a complete
picture of the modal properties of the structure (Zimmerman et al. 2008).
The wireless sensor utilized in this study is the Stanford WiMMS unit (Wang et al. 2007) consisting
of a printed circuit board (PCB) that hosts the computational core (i.e., microcontroller) and the sensing
interface (i.e., analog-to-digital converter) while providing connections for the communications interface
(Fig. 1). The computational core is responsible for running the operating system (OS), contains the
engineering application software, performs embedded data processing, and stores data. It consists of an
Atmel ATMega128 microcontroller with an 8-bit integrated circuit architecture and 128 kB of flash memory.
An additional 128 kB of static random access memory (SRAM) housed in an external package is added
to the core for additional data storage. The sensing interface consists of a Texas Instruments ADS8341,
a 4 channel, 16-bit analog-to-digital converter (ADC) responsible for digitizing data from sensors
interfaced. The communications interface consists of a MaxStream 24XStream wireless modem that
operates within the 2.4 GHz ISM communications band. The radio has a maximum data rate of 192
kbps and is rated for a line-of-site communications range of 5 km. Although the radio has an impressive
line of sight range, use inside an entirely metallic structure such as a wind turbine tower might reduce
the effective communication range of the radio.

186 R. Andrew Swartz, Jerome P. Lynch, Stephan Zerbst, Bert Sweetman and Raimund Rolfes
In this study, two sensors are interfaced to the wireless sensor: a MEMS accelerometer (Crossbow
CXL01) and metal foil strain gauge (Texas Measurements YFLA-5-5L). The accelerometer has a low
sensitivity of 1.0 V/g which means its output will be small during ambient excitation of the turbines.
Hence, a signal conditioning board custom designed for ambient vibration measurements (Fig. 2) is also
employed. The signal conditioning circuit serves two functions; it serves as a band-pass (0.03 to 25 Hz) anti-
aliasing filter and amplifies the sensor output voltage by a factor of twenty so as to better utilize the full
input range of the ADC. Amplification is especially important when recording the output of accelerometers
deployed for ambient response measurements. Unlike most sensors, strain gauges do not output a
voltage signal directly. Rather, a bridge circuit is necessary to convert changes in gauge resistance to a
voltage signal. A Wheatstone bridge circuit is designed (Fig. 3) to convert the strain gauge resistance
changes to a voltage signal that can be digitized by the wireless sensor ADC.
3. Wind turbine instrumentations
The subjects of this study are three wind turbines: two 78 m tall, 2 MW Vestas V-80 turbines, Figs.
4(a) and (b), and one 40 m tall, 250 kW NEG-Micon 250 turbine, Fig. 4(c). All three are circular steel
Fig. 1 Low-cost WiMMS wireless sensor proposed forstructural monitoring of wind turbines
Fig. 2 Signal conditioning board for amplifying andband-pass filtering of low-amplitude accelerationsignals
Fig. 3 Wheatstone bridge circuit for conversion of strain gauge resistance changes to amplified voltage signals

Structural monitoring of wind turbines using wireless sensor networks 187
towers bolted to concrete foundations with power generators and nacelles located at the top. Internally,
the towers are hollow with periodic steel platforms intended to prevent workers from accidentally
falling the entire tower height. The instrumentation of each tower included in this study is designed to
fulfill specific objectives in order to demonstrate the effectiveness of wireless sensors in this
challenging operational environment. The individual instrumentations and their objectives are detailed
in the following sub-sections and are also summarized in Table 1.
3.1 Vestas turbine installation 1
The first turbine instrumentation presented in this study is one of the 2 MW Vestas V-80 turbines.
This turbine is located in a rural area outside of Wilhelmshaven, Germany and is sited on the German
Wind Energy Institute testing site. The objectives of the first instrumentation are to: 1) demonstrate that
wireless sensors will operate within the turbine tower, 2) collect and transmit acceleration data, and 3)
demonstrate that the data collected compares favorably with similar data collected via a traditional
tethered data acquisition (DAQ) system installed in parallel. To accomplish these goals, four wireless
sensor nodes are located at different levels within the tower, one at each of the steel platforms; connected to
each wireless sensor node are two accelerometers measuring lateral acceleration in orthogonal directions
(denoted as X and Y in Fig. 4(a), for a total of eight accelerometers). Amplification and filtering circuitry
(previously detailed) is also provided for each transducer. In the Vestas turbine, wireless sensors are
placed at heights of 11.1 m (Level 1), 28.1 m (Level 2), 51.7 m (Level 3), and 76.1 m (Level 4) above
the ground level. The locations of the wireless sensors with respect to the height of the tower may be
Fig. 4 Location of wireless sensors within the (a) Vestas #1 (located near Wilhelmshaven, Germany), (b)Vestas #2 (located near Jever, Germany), and (c) Micon (located near Langeln, Germany) turbines
Table 1 Summary of turbine installation objectives
Turbine, Location Vestas V-80, Wilhelmshaven Vestas V-80, Jever NEG-Micron 250, Langeln
Testing objectives
Basic wireless functionality Wireless range testing/reliability Impulse loading
Side-by-side wired comparison Strain sensing Modal analysis
Operational deflection shape Operational deflection shape Mode shapes
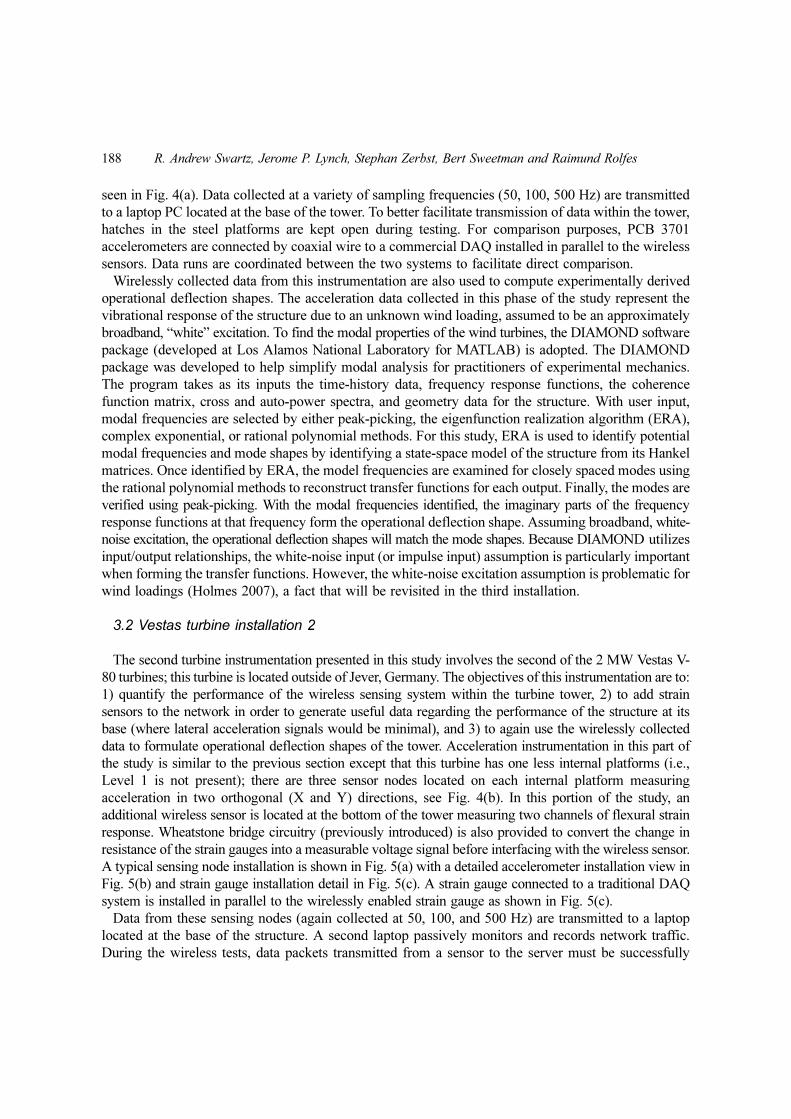
188 R. Andrew Swartz, Jerome P. Lynch, Stephan Zerbst, Bert Sweetman and Raimund Rolfes
seen in Fig. 4(a). Data collected at a variety of sampling frequencies (50, 100, 500 Hz) are transmitted
to a laptop PC located at the base of the tower. To better facilitate transmission of data within the tower,
hatches in the steel platforms are kept open during testing. For comparison purposes, PCB 3701
accelerometers are connected by coaxial wire to a commercial DAQ installed in parallel to the wireless
sensors. Data runs are coordinated between the two systems to facilitate direct comparison.
Wirelessly collected data from this instrumentation are also used to compute experimentally derived
operational deflection shapes. The acceleration data collected in this phase of the study represent the
vibrational response of the structure due to an unknown wind loading, assumed to be an approximately
broadband, “white” excitation. To find the modal properties of the wind turbines, the DIAMOND software
package (developed at Los Alamos National Laboratory for MATLAB) is adopted. The DIAMOND
package was developed to help simplify modal analysis for practitioners of experimental mechanics.
The program takes as its inputs the time-history data, frequency response functions, the coherence
function matrix, cross and auto-power spectra, and geometry data for the structure. With user input,
modal frequencies are selected by either peak-picking, the eigenfunction realization algorithm (ERA),
complex exponential, or rational polynomial methods. For this study, ERA is used to identify potential
modal frequencies and mode shapes by identifying a state-space model of the structure from its Hankel
matrices. Once identified by ERA, the model frequencies are examined for closely spaced modes using
the rational polynomial methods to reconstruct transfer functions for each output. Finally, the modes are
verified using peak-picking. With the modal frequencies identified, the imaginary parts of the frequency
response functions at that frequency form the operational deflection shape. Assuming broadband, white-
noise excitation, the operational deflection shapes will match the mode shapes. Because DIAMOND utilizes
input/output relationships, the white-noise input (or impulse input) assumption is particularly important
when forming the transfer functions. However, the white-noise excitation assumption is problematic for
wind loadings (Holmes 2007), a fact that will be revisited in the third installation.
3.2 Vestas turbine installation 2
The second turbine instrumentation presented in this study involves the second of the 2 MW Vestas V-
80 turbines; this turbine is located outside of Jever, Germany. The objectives of this instrumentation are to:
1) quantify the performance of the wireless sensing system within the turbine tower, 2) to add strain
sensors to the network in order to generate useful data regarding the performance of the structure at its
base (where lateral acceleration signals would be minimal), and 3) to again use the wirelessly collected
data to formulate operational deflection shapes of the tower. Acceleration instrumentation in this part of
the study is similar to the previous section except that this turbine has one less internal platforms (i.e.,
Level 1 is not present); there are three sensor nodes located on each internal platform measuring
acceleration in two orthogonal (X and Y) directions, see Fig. 4(b). In this portion of the study, an
additional wireless sensor is located at the bottom of the tower measuring two channels of flexural strain
response. Wheatstone bridge circuitry (previously introduced) is also provided to convert the change in
resistance of the strain gauges into a measurable voltage signal before interfacing with the wireless sensor.
A typical sensing node installation is shown in Fig. 5(a) with a detailed accelerometer installation view in
Fig. 5(b) and strain gauge installation detail in Fig. 5(c). A strain gauge connected to a traditional DAQ
system is installed in parallel to the wirelessly enabled strain gauge as shown in Fig. 5(c).
Data from these sensing nodes (again collected at 50, 100, and 500 Hz) are transmitted to a laptop
located at the base of the structure. A second laptop passively monitors and records network traffic.
During the wireless tests, data packets transmitted from a sensor to the server must be successfully

Structural monitoring of wind turbines using wireless sensor networks 189
acknowledged by the server. The record of network traffic shows where multiple attempts are made to
send individual data points. In the event that the network monitor misses a packet, one can still infer its
presence based on the expected timing of the packets and their embedded (consecutive) sequence
numbers. After the data collection, an off-line analysis of this record is performed to quantify the
percentage of packets requiring additional transmissions before they successfully generate and receive
an acknowledgement from the server. This analysis will quantify the reliability of the wireless
communication channel within the turbine tower. The parallel tethered DAQ system is again installed
for comparison purposes. Operational deflection shapes are also again identified using the wireless data
and the DIAMOND software package.
3.3 Micon turbine installation
The final part of this study focuses on the Micon turbine; this turbine is located in Langeln, Germany.
In the Micon turbine, controls are available to the operator to engage a braking mechanism on the hub
of the turbine. Hard braking provides an “impulse-like” loading to the entire structure. This ability is
important for modal analysis of structures with unmeasurable inputs or structures that are excited by
ambient excitation sources (e.g., wind) that do not generally manifest themselves as white-noise
(Holmes 2007). With the presence of the impulse-like load, proper excitation of modal frequencies is
assured thereby allowing the identification of true mode shapes whereas, in the previous two
instrumentations, only identification of operational deflection shapes is possible. Again, four wireless
sensor nodes are located in the towers, each with two accelerometers measuring lateral acceleration in
orthogonal X and Y directions. In the Micon turbine, these sensors are located at heights of 8 m (Level
1), 17 m (Level 2), 26.5 m (Level 3), and 33.2 m (Level 4) above the base (ground) level. The locations
of the wireless sensors with respect to the height of the Micon tower are presented in Fig. 4(c). Data is
collected both wirelessly (sampled at 100 Hz) and with the parallel tethered DAQ system (sampled at
200 Hz) under both ambient and impulse-like loadings. Modal analysis is performed with the
DIAMOND software package using a discrete-time impulse load at the top of the tower as its input.
4. Results and discussion
Results from the first Vestas turbine installation demonstrate that wireless sensors can indeed function
Fig. 5 Installation of the wireless sensing system in the Vestas #2 turbine : (a) one sensing node with twoaccelerometers, (b) accelerometer installation detail, and (c) strain gauge installation detail

190 R. Andrew Swartz, Jerome P. Lynch, Stephan Zerbst, Bert Sweetman and Raimund Rolfes
effectively in the wind turbine environment. The wireless sensing system effectively measures effects
of ambient (wind) excitation on the turbine during normal operation. Additionally, wireless sensors are
capable of communicating data from all levels of the tower to a server located at the base of the structure. For
Fig. 6 Sample acceleration data collected on the wireless sensor network in the Vestas #1 turbine
Fig. 7 Comparison of wired and wirelessly obtained data from the Vestas #1 turbine. Acceleration data shownis for Level 4

Structural monitoring of wind turbines using wireless sensor networks 191
example, time history accelerations from all 8 channels are shown in Fig. 6. A comparison between the
wirelessly collected data and that recorded by a traditional tethered system shows very good agreement
between the two (see sample ambient data in Fig. 7), thus validating the viability of the wireless sensing
system in this application. Some minor differences in noise levels are evident due to minor analog
domain corruption of the wired system signals in imperfectly shielded cable runs down the height of the
tower as well as differing low-pass anti-aliasing filter designs used in each system. Finally, natural
frequencies are evident in the frequency domain realization of the wirelessly collected data (Fig. 8),
yielding identified operational deflection shapes for the first two suspected modes found to be associated
with tower flexure (at 0.76 and 3.70 Hz) of the Vestas turbine (Fig. 9).
The primary goal of the second Vestas installation is to quantify wireless network performance.
Interference in the digital wireless channel will manifest itself as dropped packets (that must be
retransmitted) rather than as corrupted data. A second laptop computer, acting as a network monitor,
Fig. 8 FFT results from the Vestas #1 turbine, Level 4 accelerations
Fig. 9 First two modes of the Vestas #1 turbine

192 R. Andrew Swartz, Jerome P. Lynch, Stephan Zerbst, Bert Sweetman and Raimund Rolfes
observed two levels of performance: one level for the sensors located at the base, and another for those
located further up the tower. At the base, 3-4% of the packets require multiple attempts to send before
an acknowledgement packet is received. Because of the relatively short distance between antennas (less
than 2 m), losses here are primarily due to interference from the electrical equipment located at the base
of the tower as well as adverse multipath effects. Sensors located at higher levels record a slight drop in
reliability, with 5-6% of packets requiring multiple transmission attempts. Internal bulkheads do not
appear to degrade the wireless transmissions; for instance, Level 4 performance is not significantly
different than Level 2 performance due to numerous openings in the bulkheads and an air gap between
the bulkhead and the tower shell. Because in the wireless system the sensor signal is digitized directly at
its source, there is less opportunity for analog domain corruption of the signal than in a traditional
tethered system.
Another objective of testing in the second Vestas turbine was the ability to collect strain data using
wireless sensors. Strain gauge data collected from the base of the second Vestas turbine is also
presented (Fig. 10) to demonstrate successful collection of vibrational strain data from the base of the
structure. Modal results (using acceleration measurements) for the second Vestas turbine are found to
be similar (though not identical) to the first with the first two suspected modes at 0.64 Hz and 3.74 Hz,
see Fig. 11.
Finally, example time history plots that include blade braking within the nacelle are presented for the
Micon turbine in Fig. 12. During these runs, the brake is activated for a short pulse which instantaneously
stops the blades from turning, resulting in an impulse-like loading upon the tower. Fig. 13 presents the
fast-Fourier transform (FFT) and the covariance estimate of the discrete-time power spectral density
(PSD) calculated for data measured at Level 4 of the Micon turbine. These processed signals are used
in DIAMOND for the modal analysis portion of the study. Mode shape results for the Micon turbine are
Fig. 10 Strain comparison between the wired and wireless systems in the Vestas #2 turbine

Structural monitoring of wind turbines using wireless sensor networks 193
presented in Fig. 14. Modal frequencies identified (0.89 and 4.24 Hz) in this study for the Micon
turbines compare well with those found for the same structure using finite element updating methods,
as reported in Rolfes et al. (2007).
The sum of these results demonstrate that data collected from the wireless sensor network are of
sufficient quality to identify modes (or operational deflectional shapes) from the structures. The first
two modal frequencies of the Vestas turbine fall within the most well characterized frequency range of
the wireless network. Similarly, the first two modal frequencies of the Micon turbine also fall within
that range. Note the fundamental difference in shape between the lowest frequency mode of the Vestas
turbine (Fig. 9) and that of the Micon turbine (Fig. 14). The taller Vestas tower exhibits a clear first-
order cantilever bending mode where the stouter Micon tower’s lowest modal frequency is associated
with a second-order cantilever bending mode. This fact is also apparent in the time domain data
Fig. 11 First two modes of the Vestas #2 turbine
Fig. 12 Time history response of Micon tower under “impulse” loading

194 R. Andrew Swartz, Jerome P. Lynch, Stephan Zerbst, Bert Sweetman and Raimund Rolfes
presented in Fig. 12 where the vibrations due to the brake induced “impulse” load are greatest in Levels
2 and 3, with less excitation apparent at Level 4.
5. Conclusions
Characterization of dynamic loads and their interaction with the wind turbine towers are vital for the
future development of this promising renewable energy technology. Wireless sensor networks provide a
low-cost and easy to install platform from which data needed to build analytical models can be
collected. In addition, wireless sensors, with their inherent on-board data processing abilities, can be
used to automate monitoring and damage detection in large-scale wind turbines in an economical
manner. By demonstrating the effectiveness of wireless sensors in the wind turbine environment for
data collection, this study demonstrates the first phase of their implementation for improving the design
Fig. 13 FFT and PSD results from the Micon turbine
Fig. 14 First two modes of the Micon turbine

Structural monitoring of wind turbines using wireless sensor networks 195
and economic viability of wind power technology. Future work should focus in three new directions.
First, long-term monitoring using permanent monitoring systems is important in order to study loads
and structural responses of turbines over a large range of conditions. Second, turbines, especially off-shore
turbines, require additional study of both their dynamic behavior and the loadings to which they are
subjected. In particular, the combination of wind and wave loads on the turbine structure remains a
challenging environment for the economical design of off-shore turbines. For such turbines, dense
sensor instrumentation will be necessary to measure the dynamic response of the system to wind and
wave loads. Finally, damage detection algorithms must be included in the computing cores of the
wireless sensors to provide automated monitoring of the condition of turbine towers, nacelles, and
blades and report failures, both after the fact and, if possible, incipient. With this information, the cost
and risk inherent in building these structures may be reduced increasing their attractiveness to the
energy industry and to the public as a whole.
Acknowledgements
The authors would like to thank the National Science Foundation and the European Science Foundations
for their generous support of travel costs associated with attending the ESF-NSF Workshop on Sensor
Networks for Civil Infrastructure Systems. This research has been partially funded by the National
Science Foundation through Grant Number CMMI-0726812 (Dr. S.C. Liu, Program Manager). In addition,
the U.S. authors would like to thank the National Science Foundation (Grant Number OISE 08-20607,
Dr. Jennifer Pearl, Program Manager) for supporting the joint collaboration between a team from the
University of Hannover (Prof. Rolfes) and the authors from the United States. Finally, the first author
(R. Andrew Swartz) acknowledges the generous fellowship support provided by the Graham Environmental
Sustainability Institute (GESI) Graduate Fellowship Program.
References
Clayton, E.H., Lu, C., Koh, B.H., Xing, G. and Fok, C.L. (2005), “Damage detections and correlation-basedlocalization using wireless mote sensors”, Proceedings of the 20th IEEE International Symposium onIntelligent Control, ISIC '05 and the 13th Mediterranean Conference on Control and Automation, MED '05,Limassol, Cyprus.
DOE (2006), Wind Energy Multiyear Program Plan for 2007-2012, U.S. Department of Energy (DOE), WashingtonD.C.
Doebling, S.W., Farrar, C.R. and Cornwell, P.J. (1997), “DIAMOND: a graphical interface toolbox for comparativemodal analysis and damage identification”, Proceedings of the 6th International Conference on RecentAdvances in Structural Dynamics, Southampton, U.K.
Feng, M. (2009), “Application of structural health monitoring in civil infrastructure”, Smart Struct. Syst., 5(4), 469-482.
Hau, E. (2006), Wind Turbines: Fundamentals, Technologies, Application and Economics, Springer, Berlin, Germany.Holmes, J.D. (2007), Wind Loading of Structures, Taylor and Francis, New York, NY.Kijewski-Correa, T. and Su, S. (2009), “BRAIN: A bivariate data-driven approach to damage detection in multi-
scale wireless sensor networks”, Smart Struct. Syst., 5(4), 415-426.Kurata, N., Spencer, Jr., B.F. and Ruiz-Sandoval, M. (2005), “Risk monitoring of buildings with wireless sensor
networks”, Struct. Health Monit., 12(3), 315-327.Leopold, G. (2007), U.S. wind power is rising, but will it fly?, EE Times, June.

196 R. Andrew Swartz, Jerome P. Lynch, Stephan Zerbst, Bert Sweetman and Raimund Rolfes
Lynch, J.P. and Loh, K.J. (2006), “A summary review of wireless sensors and sensor networks for structuralhealth monitoring”, Shock Vib. Digest, 38(2), 91-128.
Lynch, J.P., Sundararajan, A., Law, K.H., Kiremidjian, A.S. and Carryer, E. (2004), “Embedding damage detectionalgorithms in a wireless sensing unit for attainment of operational power efficiency”, Smart Mater. Struct.,13(4), 800-810.
Lynch, J.P., Sundararajan, A., Law, K.H., Kiremidjian, A.S., Carryer, E., Sohn, H. and Farrar, C.R. (2003), “FieldValidation of a wireless structural monitoring system on the Alamosa Canyon Bridge”, Proceedings of theSPIE, 5057, 267-278.
Nagayama, T., Spencer, Jr., B.F. and Rice, J.A. (2007), “Structural health monitoring utilizing Intel’s Imote2wireless sensor platform”, Proceedings of the SPIE--Sensors Smart Structures Technologies for Civil,Mechanical, and Aerospace Systems 2007, 6529(2), 6592943.
Pakzad, S.N., Fenves, G.L., Kim, S. and Culler, D.E. (2008), “Design and implementation of scalable wirelesssensor network for structural monitoring”, J. Infrastruct. Syst., 14(1), 89-101.
Pitchford, C., Grisso, B.L. and Inman, D.J. (2007), “Impedance-based structural health monitoring of wind turbineblades”, Proceedings of the SPIE, 6532, 653211-1-653211-11.
Rolfes, R., Gerasch, G., Haake, G., Reetz, J. and Zerbst, S. (2006), “Early damage detection system for tower androtor blades of offshore wind turbines”, Proceedings of the 3rd European, Workshop on Structural HealthMonitoring, Granada, Spain.
Rolfes, R., Zerbst, S., Haake, G., Reetz, J. and Lynch, J.P. (2007), “Integral SHM-system for offshore wind turbinesusing smart wireless sensors”, Proceedings of the 6th International Workshop on Structural HealthMonitoring, Stanford, CA.
Schulz, M.J. and Sundaresan, M.J. (2006), Smart Sensor System for Structural Condition Monitoring of Wind Turbines,Technical Report NREL/SR-500-40089, National Renewable Energy Laboratory, Golden, CO.
Southern, A. (2007), Michigan goes green, dBusiness, November.Straser, E. and Kiremidjian, A.S. (1998), Modular, Wireless Damage Monitoring System for Structures, Technical
Report 128, John A. Blume Earthquake Engineering Center, Stanford, CA.Tanner, N.A., Farrar, C.R. and Sohn, H. (2002), “Structural health monitoring using wireless sensing system with
embedded processing”, Proceedings of the SPIE, 4704, 215-224.Tweedie, K. (2005), Wind farm fears as blade snaps, The Times, April.Wang, Y., Lynch, J.P. and Law, K.H. (2007), “A wireless structural health monitoring system with multithreaded
sensing devices: design and validation”, Struct. Infrastruct. E., 3(2), 103-120.Whelan, M.J., Gangone, M.V., Janoyan, K.D., Cross, K. and Jha, R. (2007), “Reliable high-rate bridge monitoring
using dense wireless sensor arrays”, Proceedings of the International Workshop on Structural HealthMonitoring, Stanford, CA.
Wiser, R. and Bolinger, M. (2007), Annual Report on U.S. Wind Power Installation, Costruction and PerformanceTrends: 2006, U.S. Department of Energy (DOE), Washington D.C.
Zimmerman, A.T., Shiraishi, M., Swartz, R.A. and Lynch, J.P. (2008), “Automated modal parameter estimationby parallel processing within wireless monitoring systems”, J. Infrastruct. Syst., 14(1), 102-113.