Embed Size (px)
Citation preview
STRUCTURAL DYNAMIC ANALYSIS OF OIL AND GAS
TRANSMISSION PIPE
WAN DONG HUA
Report submitted in partial fulfillment of the requirements
for the award of the degree of
Bachelor of Mechanical Engineering
Faculty of Mechanical Engineering
University Malaysia Pahang
JUNE 2013
vi
ABSTRACT
This project was carried out as a study of structural dynamic analysis using ANSYS to
simulate the system vibration. The objective of this project is to obtain dynamic
characteristics of oil and gas transmission pipeline. In order to get the dynamic
characteristics, the pipeline system should be designed to be used for the experiment and
simulation test. Following the design system, setting the PVC material, then import the
pipeline system into ANSYS to make modal analysis. Simulating the vibrate variation from
0 Hz to 600 Hz. According to the deformation of the pipeline system, to find where is the
most serious deformation place. So the point what we find is the damping point, the
frequency at this point is the natural frequency. Collecting all data of the natural frequency
and mode shapes at the damping points. The second part is the experiment. Following the
design system, assemble the entity system. Use the accelerometer sensor to convert pipeline
system vibration to electrical as input data. Following the accelerometer, use the instrument
driver to connect the accelerometer with the laptop. Lastly to start the experiment by the
impact hammer knock the pipeline system, and then collect the data of natural frequencies,
mode shapes and damping of the structural dynamic of the pipeline system. Comparing the
mode shapes to select the natural frequency with the same mode shapes from the
experiment and simulation.

vii
ABSTRAK
Projek ini dijalankan sebagai satu kajian analisis dinamik struktur yang menggunakan
ANSYS untuk meniru getaran sistem. Objektif projek ini adalah untuk mendapatkan
ciri-ciri dinamik struktur paip bagi penghentaran minyak dan gas. Dalam usaha
mendapatkan ciri-ciri dinamik, sistem saluran paip direka untuk simulasi dan eksperimen.
Selepas mencipta sistem rekabentuk dan menetapkan bahan PVC, sistem talian paip
dimport ke ANSYS untuk membuat analisis mod. Simulasi untuk getaran berubah dari 0
Hz hingga 600 Hz. Menurut ubah sistem perancangan, tempat ubah bentuk kritikal perlu
dicari. Tempat ubah bentuk kritikal ralah titik redaman, frekvensi pada ketika ini adalah
frekvensi semula jadi dan bentuk mod dikumpul di mata redaman. Bahagian kedua adalah
eksperimen. Mengikati system relca bentuk, sistem entiti dipasang. Sensor percubaan
digunakan untuk menukar sistem getaran paip untuk elektrik sebagai input. Alat pemandu
digunalcan untuk menyanbang pecutan dengan laptop. Akhir sekali eksperimen dimulakan
dengan mengguna impak tukul dan mengumpul data frekuensi semulajadi, bentuk mod dan
redaman dinamik struktur sistem perancangan. Perbandingan mod membentuk untuk
memilih frekuensi semula jadi dengan bentuk mod sama dari eksperimen dan simulasi.
viii
TABLE OF CONTENTS
Page
SUPERVISOR’S DECLARATION ii
STUDENT’S DECLARATION iii
ACKNOWLEDGEMENTS v
ABSTRACT vi
ABSTRACT vii
TABLE OF CONTENTS viii
LIST OF TABLES xii
LIST OF FIGURES xiii
LIST OF SYMBOLS xiv
LIST OF ABBREVIATIONS xv
CHAPTER 1 INTRODUCTION
1.1 Background of study 1
1.2 Statement of problem 3
1.3 Research objective 4
1.4 Scopes of the study 4
ix
CHAPTER 2 LITERATURE REVIEW
2.1 Introduction 5
2.2 Frequency Response Function 5
2.2.1 Transfer function 6
2.2.2 Frequency response function 8
2.3 The experiment principle 9
2.3.1 First-order system for the amplitude frequency characteristics 10
2.3.2 Second order differential equation 10
2.3.3 Error of measurement precision 11
2.5.3 Types of Engineering Analysis 21
2.5.4 Results of Finite Element Analysis 22
2.6 Vibration in pipeline 22
2.7 Modal analysis 23
2.4 Structural dynamic analysis 12
2.4. 1 Damping 13
2.4.2 Modal analysis 14
2.4.3 Energy method 15
2.4.4 Modal response 16
2.5 Finite element analysis 17
2.5.1 What is Finite Element Analysis? 18
2.5.2 How Does Finite Element Analysis Work? 19
x
CHAPTER 3 METHODOLOGY
3.1 Introduction 25
3.2 Flow chart 25
3.2.1 Flow chart 1 26
3.2.2 Flow chart 2 27
3.3 Gantt chart 28
3.4 Simulation Procedures 30
3.5 Experiment at Procedures 31
3.6 Data Analysis 31
CHAPTER 4 RESULT AND DISCUSSION
4.1 Introduction 37
4.2 Simulation Results 37
4.3 Experiment Results 43
4.4 Discussion 46
3.7 Tools Preparation 32
3.8 Basic Component of Piping System 34

xi
CHAPTER 5 CONCLUSION
5.1 Conclusion 48
5.2 Suggestion 48

xii
LIST OF TABLES
Table No. Title Page
4.1 Result from simulation and experiment 47
xiii
LIST OF FIGURES
Figure No. Title Page
2.1 Vice frequency and Phase frequency curve 8
3.1 Flow chart 1 26
3.2 Flow chart 2 27
3.3 PVC Properties 30
3.4 Impact Hammer 32
3.5 National Instruments 33
3.6 Accelerometer Sensor 34
3.7 L joint structure 35
3.8 T joint structure 35
3.9 L input 36
3.10 Pipeline System 36
4.1 Modal analysis for frequency for 154.25 Hz 38
4.2 Modal analysis for frequency for 173.7 Hz 38
4.3 Modal analysis for frequency for 226.82 Hz 39
4.4 Modal analysis for frequency for 182.89 Hz 39
xiv
4.5 Modal analysis for frequency for 272.91 Hz 40
4.6 Modal analysis for frequency for 310.97 Hz 40
4.7 Modal analysis for frequency for 323.64 Hz 41
4.8 Modal analysis for frequency for 348.66 Hz 41
4.9 Modal analysis for 416.71 Hz 42
4.10 Modal analysis for frequency 487.88 Hz 42
4.11 Frequencies in X axle 43
4.12 Frequencies curve fitting in X axle 44
4.13 Frequencies in Y axle 44
4.14 Frequencies curve fitting in Y axle 45
4.15 Frequencies in Z axle 45
4.16 Frequencies curve fitting in Z axle 46
4.17 Result from simulation and experiment 47

xv
LIST OF SYMOLS
A Area
ω natural frequency
D Pipe diameter
K resistance coefficient
L entry length
Р density
Re Reynolds number
xvi
LIST OF ABBREVIATION
PVC Polyvinyl chloride
FRF Frequency response function
F&D Frequency and damping
NI National Instruments
L L shape
T T shape

1
1
CHPATER 1
INTRODUCTION
1.1 Introduction
With the rapid development of modern technology, industrialization progress
unceasingly strengthens; pipeline in people's life is playing the more and more
important role. City heat supply, gas supply pipe main and long oil and gas pipeline and
so on a variety of related to people all aspects of life all have the form of pipeline.
Pipeline transport,it was known as one of the five transportation industry. And it is
phase parallel with railway, aviation, highways, marine transportations. It is a huge
energy transport tool. Pipeline, its definition is usually to use various materials made of
pipe. Pipeline is to use pipe, pipe connecting parts and valve connection into for
conveying gas, liquid or solid particles with the fluid flow unit. Usually, fluid the
blower, compressors, pumps and boiler etc booster, from the high place of the pipe flow
to the low pressure place. It also can be used to fluid by their stress or gravity delivery.
Pipeline can generally be divided into: according to use: gas pipe, water pipe, oil
pipe. According to the material: steel, aluminum gold, polyvinyl chloride (PVC), etc.;
According to the pressure, pressure pipe, not pressure pipe; According to the pressure
level: the low pressure pipeline, high pressure pipe.
Pipeline transport,it was known as one of the five transportation industry. And it
2
is phase parallel with railway, aviation, highways, marine transportations. It is a huge
energy transport tool. . For example, Crude oil pipeline transport crude oil 90 million
tons in Alaska, it is quite to the transportations by trains. Pipeline transport dangerous
goods of oil and gas, especially a large number of natural gas transportation, it is
irreplaceable transportation with other transportation tools. This energy transport
function is better than other transportation to finish the transportation.
Pipeline transport is also known as civilization transportation, because only
when the country development to a civilization, a pipeline will be emergence. It is a
kind of do not produce noise transportation, so called civilization transport. For a
industrial nations, the more developed industry, the people's living standard is higher,
the greater the energy consumption, relying on the pipeline transport is the greater. For
example, the consumption energy in 1955 year, 1965 year, 1975 year, 1985 year in Italy,
the proportion of refined oil were 33%, 63%, 67%, 69%; The proportion of natural gas
were 8%, 8%, 15% 17%, so as show as we can know from this, the product oil and
natural gas consumption is increasing year by year, most of the transportation is
pipeline transportation. It also shows that pipeline transport plays the huge role of
energyfor developed industrial nations (Zhang, 2008).
Natural gas is the world's second energy. It is only can rely on pipeline transport
to convey a large number of gas on the land. In this field plays a dispensing effect
between internationals and even among the intercontinental. Such as the Soviet union
Yamel pipeline built through the arctic permafrost zone and thousands of kilometers of
marshes leads to Europe, total length of 9000 km, tube diameter of 1420 mm, 32 billion
cubic meters of natural gas transport every year, except for the original eastern Europe
eight countries outside, every year, 10 billion cubic meters for Germany, France 10
billion cubic meters, Italy 8 billion cubic meters, played the international energy
adjustment effect. In the intercontinental, such as African countries Algerian pipeline
for 1220 mm diameter of natural gas pipeline length is 1200 km. Every year transport
3
natural gas quantity is 12.5 billion cubic meters, crossing the water depth that is 600
meters of the Mediterranean, delivery to northern Italy. It is a famous pipeline crossing
the Mediterranean (Ge, 2011).
1.2 Problem Statement
The pipeline system is very important in the oil and gas transmission. It is
concern greatly nowadays since will affect the ratio of the accident happened. It is so
dangerous that the pipeline resonance happen when the oil and gas transmit in the
pipeline.
Vibration on pipeline is a dynamic load for the pipeline system.
The harm of pipeline vibration:
a. Haste material fatigue damage and shorten the life of the material
b. Cause pipe fracture, cracking or even take over the seat pipe burst, causing a
catastrophic accident
c. Damage to the pipeline valves, valve head vibration velocity higher than the speed of
the pipe vibration, easy to shake loose valve components result in loss of control or leak,
may result in system downtime
d. Damage to the pipeline on the meter pipes, meters and other equipment, resulting in
failure of the control system
On the other hand, the pipeline system also will affect the oil and gas
transmission efficiency. Sometimes the improper pipeline system may cause the oil and
gas translate lately to the destination, even through cannot reach to the destination. So
my study is aim for finding out the nature frequency, mode shape, and damping of the
oil and gas transmission pipe to avoid the pipeline system accident.
4
1.3 Objective of study
To determine the dynamic characteristics of oil and gas transmission pipeline
using modal analysis and vibration experiment.
1.4 Scope of the study
The scopes of study for this research are:
1. Utilize FRF modal analysis the pipeline system
2. Obtain the natural frequencies of the structure to analyse the dynamic
mathematical model of the pipeline.
3. Obtain the mode shapes of the structure to analyse of dynamic mathematical
model of the pipeline.
4. Obtain the damping of the structure to analyse of dynamic mathematical model
of the pipeline.
5
CHAPTER 2
LITERATURE REVIEW
2.1 Introduction
This chapter I will briefly explain about frequency response function (FRF),
structure dynamic analysis, vibration in pipeline, and modal analysis. I need use the
ANSYS software through FRF to make the modal analysis of structure dynamic, to get
the result of nature frequencies, mode shapes, and damping of the structural dynamic of
the pipeline system. All this information is important to achieve what my objectives and
make sure my experiment property conducted.
2.2 Frequency Response Function
Our research problem is continuous time in the vibration. The general input is
the extra force, also called vibration force, or vibration load. Force is a vector. It is made
of different frequency components of something that we facilitate research of typical
function (generally trigonometric function) composition; the vector of the force to
frequency domain (that is the independent variable for frequency) is a transformation to
complete. And the output is commonly equipment or is the research object of the
displacement or vibration, this volume obviously also can transfer into frequency
domain.
6
Then our research is for the system, but we research for the equipment itself is
unavailable. So we need to through put into a input to measure the reaction (namely
response). So we find the ratio between the input and output to represent some
properties of function of the system. This function is frequency response function.
In fact, we know that do a function of deduct, the most basic that is the premise
of their argument “synchronicity”, that is to say the two deduct function only when it is
in the independent variable of the same time, can they work. This is why the time
domain does work. And the frequency domain has an important characteristic that is the
input and output function frequency is fixed. Only change the amplitude and phase,
which is exactly what we want to research (Cao, 2008).
2.2.1 Transfer function
Transfer function H(s) and the frequency response function relationship:
For constant linear system, frequency response function
(2.1)
Where of
If in the time t=0 the input signal access time-invariant linear systems, make
substituting Laplace transform, is actually the Laplace transform into Fourier
transform. And because the system of the initial condition is zero, so the system
Frequency response function H (ω) will become output y (t) , input x (t) the Fourier
transform Y (ω), X (ω) the ratio
(2.2)
7
The type tells us that in the measured output and input , by the Fourier
transform and . The frequency response function can be obtained as
(2.3)
Need to pay attention to, the frequency response function is to describe system
harmonic input and the steady-state output relationship in measurement system
frequency response function, must in the system response to achieve steady stage to
measurement.
Frequency response function is complex, and it can be rewritten for
(2.4)
Where: is a system amplitude frequency characteristic; is the system phase
frequency characteristic.
From the foregoing, the system frequency response function or the
amplitude frequency characteristics , phase frequency characteristics , all is
the harmonic input frequency Function.
As the research problem is convenient, sometimes used to describe the curve
of the transmission characteristic of system. curve and curve respectively
called system amplitude frequency characteristics curve and phase frequency
characteristic curve. Curve, respectively called logarithmic amplitude frequency curve
and logarithmic phase frequency curve, the total called Bode diagram
If the According to the real part and imaginary part rewrite, there is and
are the real function, curve and respectively called system real
8
frequency characteristics and virtual frequency characteristic curve. If the The
imaginary part and real component respectively as a vertical and horizontal coordinates,
the curve called Nye chief Gustavo diagram (Nyquist Chart).There are
obviously
(2.5)
(2.6)
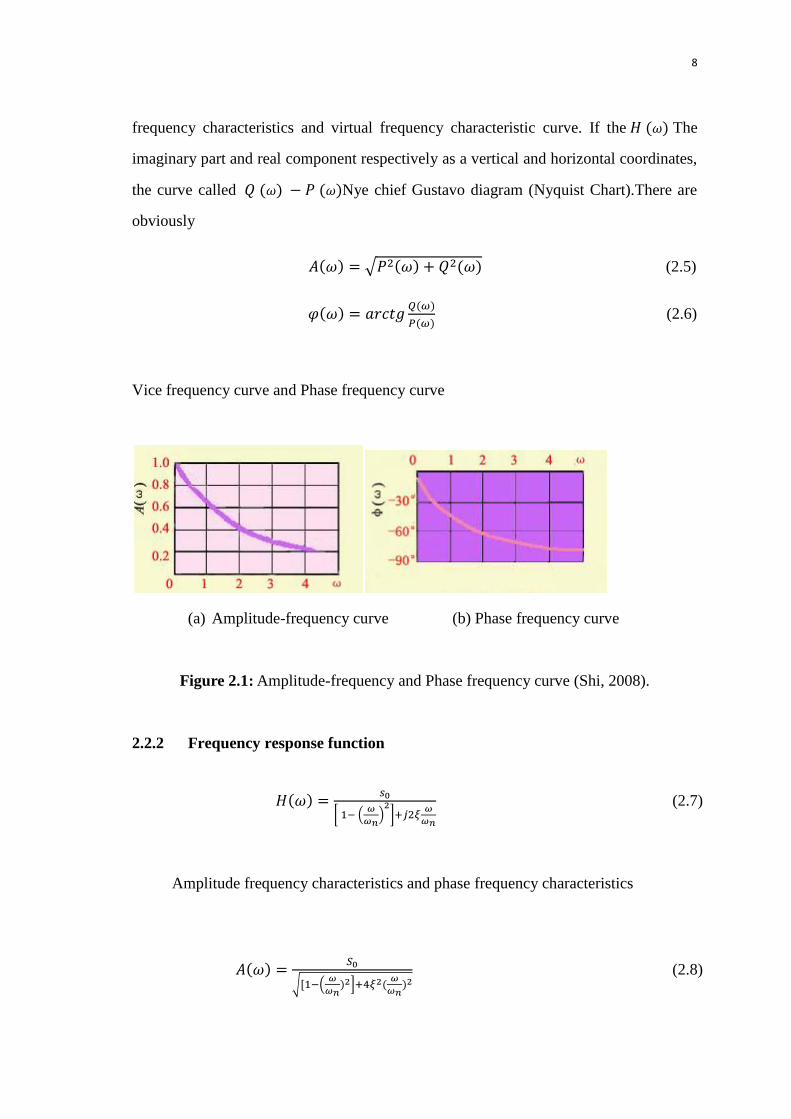
Vice frequency curve and Phase frequency curve
(a) Amplitude-frequency curve (b) Phase frequency curve
Figure 2.1: Amplitude-frequency and Phase frequency curve (Shi, 2008).
2.2.2 Frequency response function
(2.7)
Amplitude frequency characteristics and phase frequency characteristics
(2.8)
9
(2.9)
2.3 The experiment principle
Frequency response function is to describe and study the characteristics of the
system in frequency domain, the use of it and the transfer function relation, and very
easy to find the transfer function. It is the study of the system characteristics of the
important tool.
Steady system in simple harmonic excitation signal, the steady-state output
signal and the input signal amplitude ratio as the system amplitude characteristics,
recorded as A(ω); Steady-state output signal to the input signal of the phase difference is
defined as the system phase frequency characteristics, both collectively referred to as
frequency characteristics of the system. So the system frequency response refers to the
system in simple harmonic excitation signal, the steady-state output to lose the
amplitude ratio and phase difference with the excitation frequency ω change
characteristic.
2.3.1 First-order system for the amplitude frequency characteristics
(2.10)
Phase frequency characteristics for
(2.11)
10
Change the characteristics of the system parameter τ can observe the
corresponding characteristic curve.
2.3.2 Second order differential equation
With the second order differential equation said second order system
characteristics, the amplitude frequency characteristics and phase frequency
characteristics respectively
(2.12)
(2.13)
Influence of second-order dynamic characteristic parameters are natural
frequency and damping ratio, in common use in the frequency range, and with the
influence of the inherent frequency is the most important. So the second order system
natural frequency ω n should be selected with its working frequency range for basis.
In = near, system amplitude frequency characteristics by damping ratio has great
influence, when ≈ when, the system resonance occur. So as a real Use device,
rarely choose this kind of frequency relations. But this kind of relations in the
determination of the parameters of the system itself, it is very important.
Change the parameters of the system and observe the change of system parameters.
2.3.3 Error of measurement precision
11
Error of measurement precision is a kind of evaluation or described, in the test
work, usually use accuracy, precision and accurate degree, respectively to describe
system error and random error and the sum of the two.
The difference is as follows:
Accuracy: a measured value and the real value of the close degree, is a
measure of the size of the system error reflect. System error is smaller, the higher the
accuracy.
Precision: refers to the same under the same conditions is measured
repeatedly repeated measurement, the measurement value of the degree of repetition, is
a measure of the size of the random error reflecting. Random error is smaller, the higher
the precision.
In eliminate system error, precision and accuracy is consistent, collectively
referred to as accuracy.
In the signal sampling process, will be due to the sampling signal spectrum
changing and appear high and low frequency component happen confusion, such a
phenomenon is called frequency mixing lap. This experimental design the exponential
function and carries on the sampling, and then change the sampling frequency,
observation frequency mixing phenomenon (Gu, 2008).
2.4 Structural dynamic analysis
Structural analysis is mainly concerned with finding out the behavior of a
structure when subjected to some action. This action can be in the form of load due to
the weight of things such as people, furniture, wind, snow, etc. or some other kind of
excitation such as an earthquake, shaking of the ground due to a blast nearby, etc. In
essence all these loads are dynamic, including the self-weight of the structure because at