Embed Size (px)
Citation preview
STRUCTURAL CHARACTERIZATION OF ALKALINE HYDROGEN PEROXIDE (AHP)
PRETREATED BIOMASS
By
Muyang Li
A THESIS
Submitted to Michigan State University
in partial fulfillment of the requirements for the degree of
MASTER OF SCIENCE
Chemical Engineering
2011
ABSTRACT
STRUCTURAL CHARACTERIZATION OF ALKALINE HYDROGEN PEROXIDE (AHP)
PRETEATED BIOMASS
By
Muyang Li
Alkaline hydrogen peroxide (AHP) pretreatment is exceptionally well-suited
to grasses, yielding high digestibilities at low enzyme loadings, while generating
relatively few fermentation inhibitors. For AHP pretreatment, the question of how
structural and chemical compositional changes within the plant cell wall correlate to
pretreatment effectiveness has not been effectively resolved, while knowledge of how
selective modification of lignin during pretreatment may improve digestibility may
yield insights into both improving pretreatments and tailoring plant cell walls for
deconstruction. This study presents a comprehensive chemical and structural
characterization of the changes in plant cell walls associated with switchgrass
(Panicum virgatum cv. Cave-In-Rock), corn stovers (a commercial hybrid and inbred
brown midrib lines bm1 and bm3) and sugar maple (Acer saccharum) and that were
AHP pretreated at varied severities. Both the remaining solids and solubilized
biomass hydrolysates were subjected to a number of characterizations including total
polysaccharide composition, lignin content as both Klason and acetyl bromide lignin,
and the ratio of H/G/S monolignols as determined by thioacidolysis
GC/MS. Solid-state 13
C CP/MAS NMR and HSQC 2D NMR were applied to
determine changes associated with intra-lignin, carbohydrate-carbohydrate,
carbohydrate-lignin linkages and functional groups. Apparent molecular weight
distributions of soluble polymeric lignins and hemicellulose aggregates were
determined by HP-SEC. Pyrolysis-GC/MS was utilized to characterize changes in the
volatilized compounds before and after pretreatment implying pretreatment-induced
alterations in pyrolysis-labile monolignol linkages.
iv
TABLE OF CONTENTS
LIST OF TABLES ............................................................................................ vi LIST OF FIGURES .......................................................................................... vi ABBREVIATIONS ....................................................................................... viii 1. INTRODUCTION .................................................................................... 1
1.1 LIGNOCELLULOSIC BIOMASS ...................................................... 1
1.2 BIOMASS CONVERSION PROCESSES .......................................... 3 1.3 ALKALINE HYDROGEN PEROXIDE (AHP) PRETREATMENT . 4
1.4 OBJECTIVES ...................................................................................... 6 2. STRUCTRAL CHANGES OF RESIDUE CELL WALL ........................ 9
2.1 INTRODUCTION ............................................................................... 9
2.2 MATERIALS AND METHODS ....................................................... 11
2.2.1 Sampling ................................................................................. 11
2.2.2 AHP Pretreatment ................................................................... 12
2.2.3 Milling..................................................................................... 12
2.2.3 NREL Compositional Analysis............................................... 13
2.2.5 ABSL Analysis ....................................................................... 13
2.2.6 Enzymatic Hydrolysis ............................................................. 13
2.2.7 Bacterial Cellulose Solid-state NMR Study ........................... 14 2.2.8 Residual Cell Wall Solid-state NMR Study............................ 14 2.2.9 Residue Cell Wall 2D HSQC NMR Profiling ........................ 15
2.3 RESULTS AND DISCUSSIONS ...................................................... 15
2.3.1 NREL Compositional Analysis and Digestibility Evaluation 15 2.3.2 ABSL Analysis ....................................................................... 18
2.3.3 Correlation between Lignin Content and Glucan Digestibility20
2.3.4 Bacterial Cellulose Peak Assignment ..................................... 21
2.3.5 Residual Cell Wall Solid-state NMR Study............................ 22 2.3.6 Residue Cell Wall 2D HSQC NMR Profiling ........................ 25
3. SOLUBILIZED COMPOUNDS IN HYDROLYSATE ......................... 27
3.1 INTRODUCTION ............................................................................. 27
3.2 MATERIAL AND METHODS ......................................................... 28
3.2.1 Sample Concentration ............................................................. 28
3.2.2 Compositional Analysis of Hydrolysate ................................. 28
v
3.2.3 Hydrolysate NMR Profiling .................................................... 29
3.2.4 SEC Study on Hydrolysate ..................................................... 29
3.3 RESULTS AND DISCUSSION ........................................................ 30
3.3.1 Compositional Analysis of Hydrolysate ................................. 30 3.3.2 Hydrolysate NMR Profiling .................................................... 32
3.2.3 1H NMR characterization of Hydrolysate ............................... 33 3.3.4 SEC Study on Hydrolysate ..................................................... 36
4. PHYSIOCHEMICAL CHARACTERIZATION OF LIGNIN ............... 39
4.1 INTRODUCTION ............................................................................. 39
4.2 MATERIALS AND METHODS ....................................................... 41
4.2.1 Thioacidolysis ......................................................................... 41
4.2.2 Analytical Pyrolysis ................................................................ 42
4.3 RESULTS AND DISCUSSIONS ...................................................... 43
4.3.1 Pretreatment, Lignin Composition and Digestibility .............. 43 4.3.2 Pyrogram Peak Assignment .................................................... 44
4.3.3 Pyrolyzable Compound Comparison ...................................... 48 4.3.4 Lignin Composition Based on Abundant Pyrolyzable Compounds
...................................................................................................................... 50 4.3.5 Lignin Compositional Changes by Pretreatment .................... 51 4.3.6 S/G Variation .......................................................................... 53
5. CONCLUSIONS..................................................................................... 54 APPENDIX ...................................................................................................... 57 BIBLIOGRAPHY ............................................................................................ 61
vi
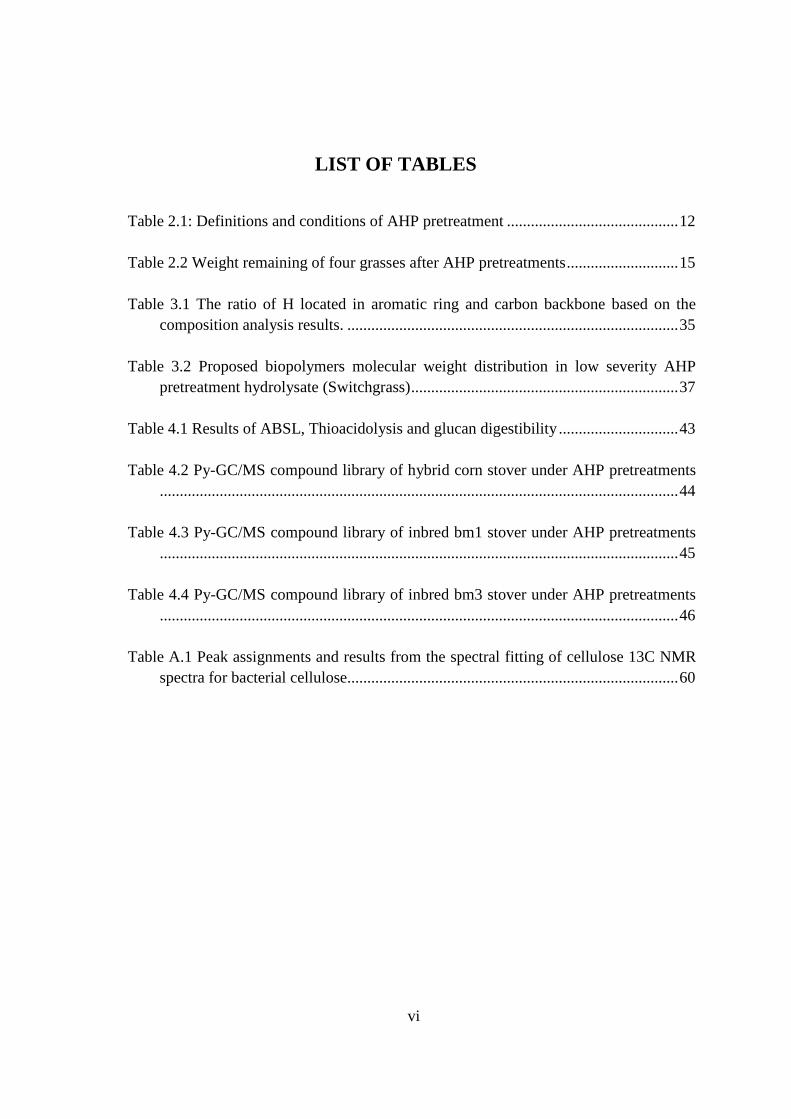
LIST OF TABLES
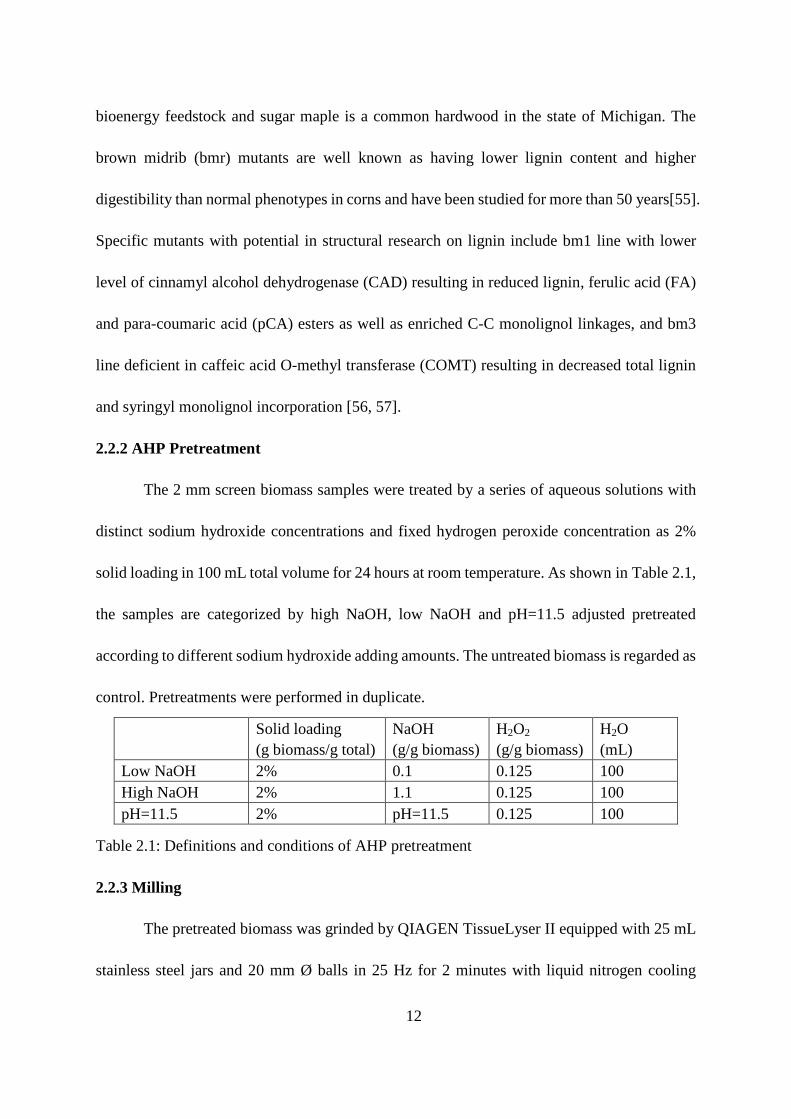
Table 2.1: Definitions and conditions of AHP pretreatment ........................................... 12
Table 2.2 Weight remaining of four grasses after AHP pretreatments ............................ 15
Table 3.1 The ratio of H located in aromatic ring and carbon backbone based on the composition analysis results. ................................................................................... 35
Table 3.2 Proposed biopolymers molecular weight distribution in low severity AHP
pretreatment hydrolysate (Switchgrass) ................................................................... 37
Table 4.1 Results of ABSL, Thioacidolysis and glucan digestibility .............................. 43
Table 4.2 Py-GC/MS compound library of hybrid corn stover under AHP pretreatments.................................................................................................................................. 44
Table 4.3 Py-GC/MS compound library of inbred bm1 stover under AHP pretreatments
.................................................................................................................................. 45
Table 4.4 Py-GC/MS compound library of inbred bm3 stover under AHP pretreatments.................................................................................................................................. 46
Table A.1 Peak assignments and results from the spectral fitting of cellulose 13C NMR
spectra for bacterial cellulose ................................................................................... 60
vii
LIST OF FIGURES
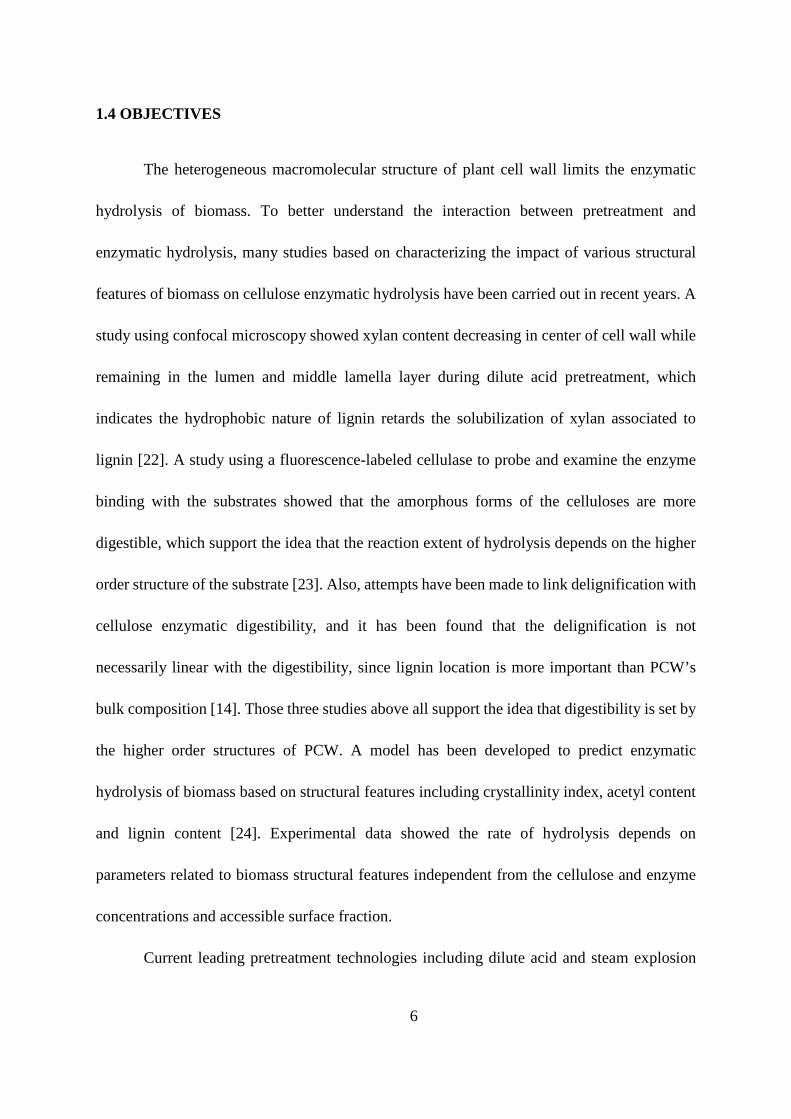
Figure 2.1 Compositional analysis of four grasses under different AHP pretreatments . 16
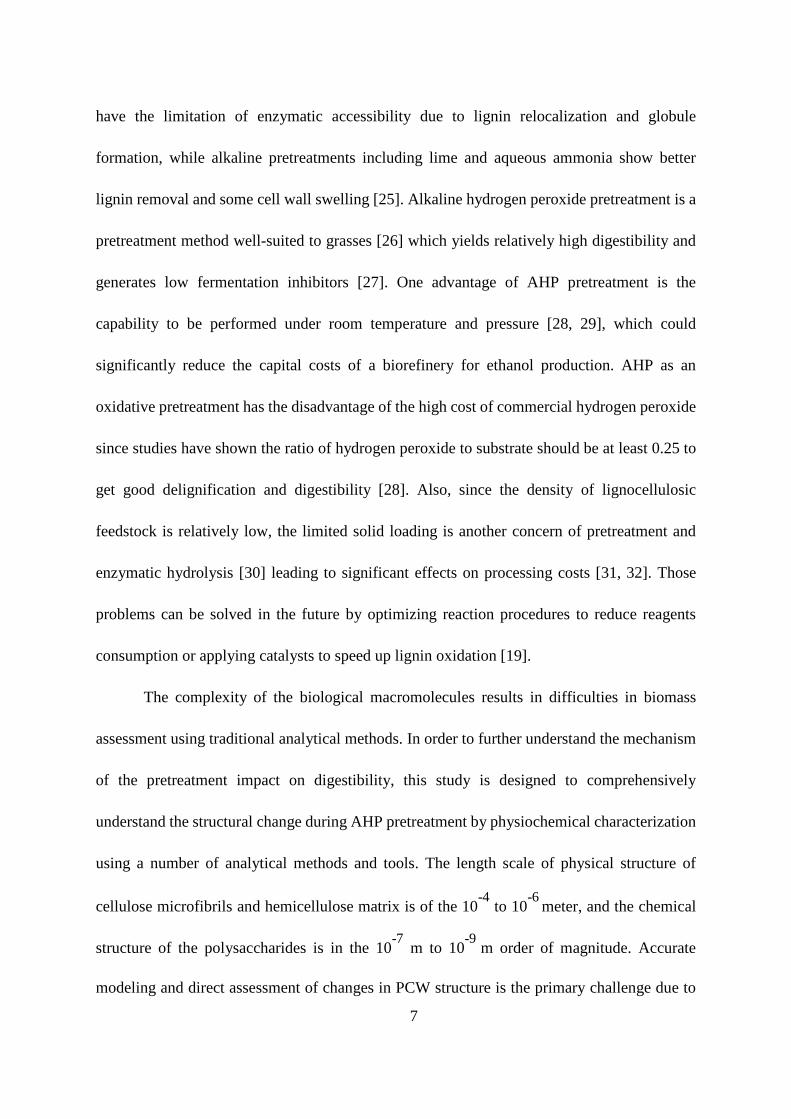
Figure 2.2 Glucan digestibilities of four grasses under different AHP pretreatments ..... 16
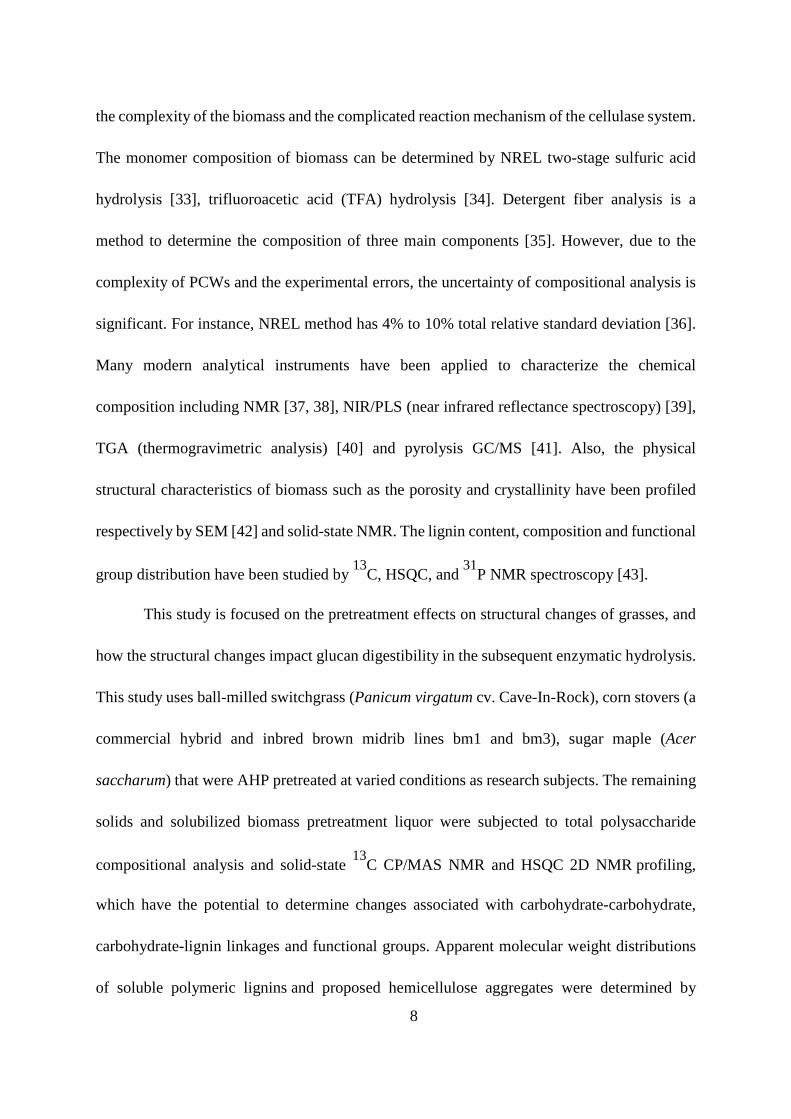
Figure 2.3 Correlation between ABSL and Klason lignin ............................................... 19
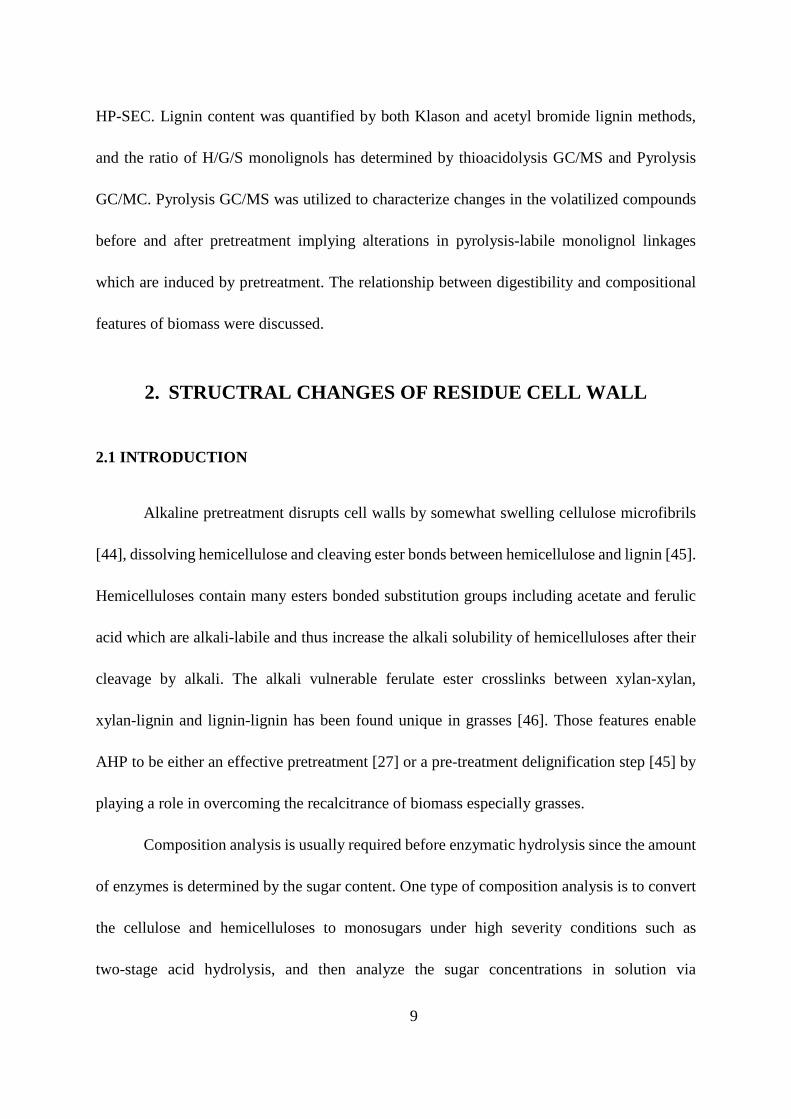
Figure 2.4 Correlation between Klason lignin and glucan digestibility by species ......... 20
Figure 2.5 Correlation between ABSL and glucan digestibility by treatments ............... 20
Figure 2.6 900 MHz Solid-state NMR spectra for bacterial cellulose (Numbers on the peaks refer to 6 carbon atoms on the hexose ring) ................................................... 21
Figure 2.7 Solid-state CP/MAS 13C NMR spectra of switchgrass under AHP
pretreatments with different NaOH concentration ................................................... 22
Figure 2.8 Solid-state CP/MAS 13C NMR spectra of switchgrass under AHP pretreatments with different NaOH concentration (15-40 ppm) .............................. 23
Figure 2.9 Solid-state CP/MAS 13C NMR spectra of switchgrass under AHP
pretreatments with different NaOH concentration (110-150 ppm) .......................... 23
Figure 2.10 Gel-state HSQC 2D NMR spectrum of ball-milled low severity AHP pretreated switchgrass with a mixture solvent DMSO-d6 and Pyridine-d5 (4:1 v/v).................................................................................................................................. 25
Figure 3.1 Flowchart of Low NaOH AHP pretreatment (Switchgrass)........................... 30
Figure 3.2 Mass balance of solid (s) and liquid (l) phase before (1) and after (2) low NaOH
AHP pretreatment (Switchgrass) ............................................................................. 30
Figure 3.3 HSQC 2D NMR spectrum of AHP Pretreatment liquor with solvent DMSO-d6 and a series of depressed water peak in 1H at 3.5 ppm ........................................... 32
Figure 3.4 Labeled 1H NMR spectrum of AHP pretreatment liquor with solvent
DMSO-d6 ................................................................................................................. 33
Figure 3.5 Labeled 1H NMR spectrum of AHP pretreatment liquor with solvent D2O after 0.22 µm pore size ultra-filtering. ............................................................................. 34
viii
Figure 3.6 SEC result of low severity AHP pretreatment liquor (Switchgrass) .............. 36
Figure A.1 C4 region peak deconvolution of solid-state 13C NMR spectra for bacterial cellulose ................................................................................................................... 59
ix
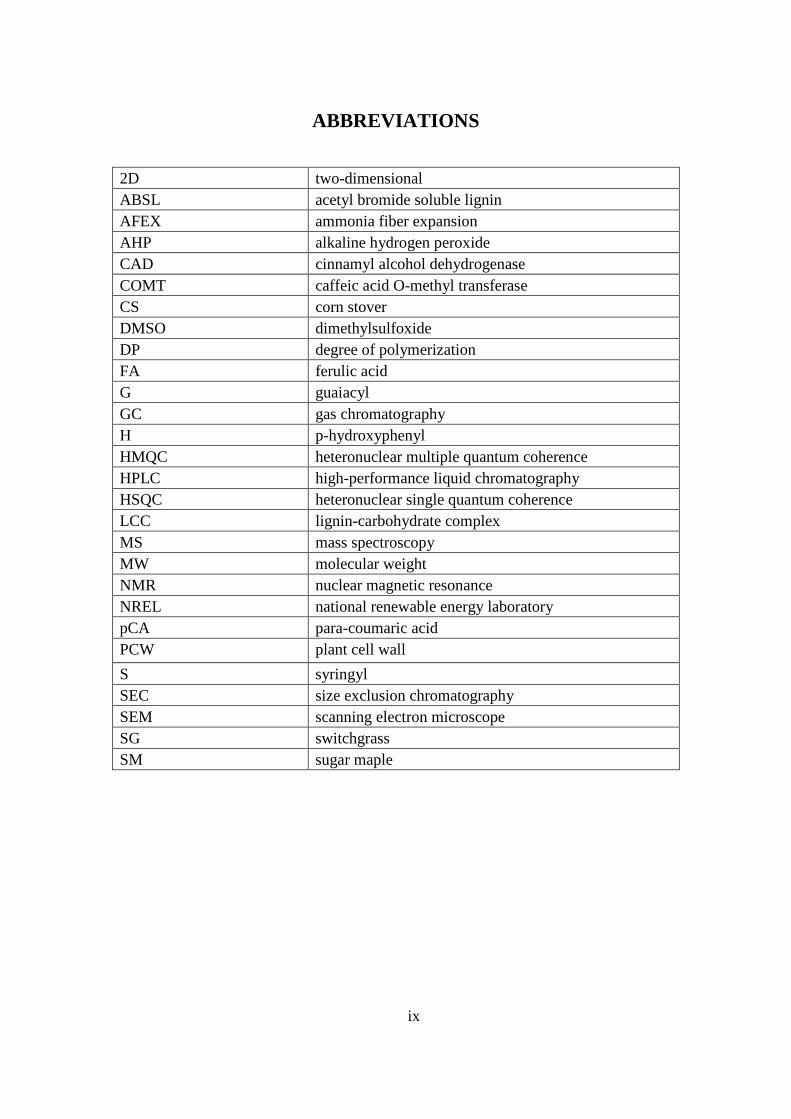
ABBREVIATIONS
2D two-dimensional ABSL acetyl bromide soluble lignin AFEX ammonia fiber expansion AHP alkaline hydrogen peroxide CAD cinnamyl alcohol dehydrogenase COMT caffeic acid O-methyl transferase CS corn stover DMSO dimethylsulfoxide DP degree of polymerization FA ferulic acid G guaiacyl GC gas chromatography H p-hydroxyphenyl HMQC heteronuclear multiple quantum coherence HPLC high-performance liquid chromatography HSQC heteronuclear single quantum coherence LCC lignin-carbohydrate complex MS mass spectroscopy MW molecular weight NMR nuclear magnetic resonance NREL national renewable energy laboratory pCA para-coumaric acid PCW plant cell wall
S syringyl SEC size exclusion chromatography SEM scanning electron microscope SG switchgrass SM sugar maple
1
1. INTRODUCTION
1.1 LIGNOCELLULOSIC BIOMASS
The worldwide emerging demand of fossil fuel replacements leads to the development
of alternative renewable energy resource such as bioenergy, solar and wind energy. Among
them, bioenergy based on conversion of the natural biological materials plays an important role
in clean liquid transportation fuel production. Bioenergy can be produced by either
biochemical methods including hydrolysis and fermentation, or thermochemical processes
including gasfication, pyrolysis and depolymerization. Since ethanol is a neat transportation
fuel can be blend with gasoline to reduce emissions and increase octane [1], production of
ethanol from renewable sources of lignocellulosic biomass is a potential energy supply to meet
the current U.S. Renewable Fuels Standard (RFS) which is 36 billion gallons of biofuel and
biodiesel production per year by 2022 [2].
First generation biofuels are generally made by agricultural products including
biodiesel produced from soybean, palm oil or canola oil, and bioethanol produced from corn
starch and sugarcane. Second generation biofuels are based on lignocellulosic biomass
including energy crops, forestry and agricultural waste, which is more abundant and not in
competition with human food. Compared to the first generation bioethanol production, which
is mainly enzymatic hydrolysis followed by fermentation of cornstarch, or fermentation of
sucrose from sugarcane, the heterogeneous structure of lignocellulosic biomass needs an acid,
2
thermal or alkaline pretreatment process before the more complex enzymatic hydrolysis, in
order to break down the ultrastructure of biomass. Lignocellulosic biomass represents one of
the highest potential replacements of fossil fuel because of its high sugar content and high yield
of liquid clean fuel conversion.
Plant cell walls (PCWs), which mainly present in plants transport tissues, are the
majority of lignocellulosic biomass. The low bulk density, high moisture content and
heterogeneous structure of PCWs result in limitations including relative low productivity,
collection, transportation, and fractionation of the agriculture-based bioenergy. The three
major components of PCWs are cellulose, hemicellulose and lignin [3]. The organization of
typical PCW is primary cell wall around a lumen in the center, and then the adjacent secondary
cell wall. In the primary cell wall, cellulose exists as the crystalline structure form, and
hemicelluloses coalesce with the surface of cellulose microfibrils [4]. In the secondary cell
wall, lignin grows surrounding the primary cell wall forming a middle lamella layer to resist
water and enhance rigidity [5, 6]. Lignification is regarded as the main barrier to biomass
conversion.
The hydrogen bonded matrix structure consists of cellulose microfibrils and
hemicelluloses provides the major strength of PCWs [7]. Native cellulose has crystalline and
amorphous structures, which are both polysaccharide chains composed of β-1-4 linked
D-glucosyl units. In nature, the crystalline structure has distinct but coexist crystallite forms, Iα
and Iβ [8]. Hemicelluloses are branched polysaccharides which consist of different unmodified
sugars or modified sugars including glucose, xylose, arabinose, mannose and galactose, with
random and amorphous structures. Lignins are complex polymers composed of 3 monolignols
3
(coniferyl, sinapyl, and p-coumaryl alcohols) and up to 11 types of linkages [9]. The
composition properties of both hemicelluloses and lignin vary by species.
1.2 BIOMASS CONVERSION PROCESSES
The conversion of biomass is mainly about breaking down the ultrastructure of biomass,
overcoming the lignin preventing access to polysaccharides for enzymes, and depolymerizing
crystalline cellulose to fermentable monosugars. In order to be effective, biomass conversion
processes requires both physical effects and chemical effects. At a molecular level, the physical
effect is disrupting the higher order structure such as increasing the surface area to let chemical
or enzyme better penetrate into plant cell walls, as well as the chemical effect of changing the
solubility of macromolecules, or depolymerizing and breaking the crosslinking between the
macromolecules.
Targeting at the crystalline structure of cellulose, the enzymatic hydrolysis primarily
needs the synergy of three types of enzymes [10]. Endoglucanases first split the crystalline
structure of cellulose and increase the porosity and surface area of the substrate.
Cellobiohydrolases next cut the end of cellulose chain to produce cellobiose. This is followed
by β-glucosidase conversion of cellobiose to two glucose units. The physical properties of
biomass including porosity and accessible surface area have impact on enzyme access to
cellulose microfibrils [11]. Quantitative models were set up describing enzyme absorbance and
inhibition by substrates features. Studies showed increasing degree of polymerization
decreases cellulose solubility and the availability of chain ends, and the crystallinity index and
enzymatic hydrolysis have negative correlations with cellulase accessibility [12].
4
Major factors influencing the digestibility of lignocellulosic biomass include porosity,
cellulose crystallinity, lignin content and hemicellulose content [13]. Various pretreatments
have different effects on these factors such as changing the lignin structure, partially removing
hemicelluloses and interrupting cellulose crystallinity, which increase the accessible area of
cellulose microfibrils. One of the best studied pretreatments is dilute acid pretreatment
performed between 160°C and 220°C [14]. Since the hydrothermal pretreatment requires high
temperature and has drawbacks in lignin globule impediment and fermentation inhibitor
formation, a series of alternative pretreatments are being studied and developed, such as
organic solvent [15], ionic liquid [16], oxidation and alkaline pretreatments [17, 18].
1.3 ALKALINE HYDROGEN PEROXIDE (AHP) PRETREATMENT
An effective pretreatments applied in biomass conversion are through chemical
modification and physical redistribution of the supramolecular structure of the raw material in
order to achieve higher digestibility. One class of pretreatments including acidic hydrothermal
pretreatment utilizing the acid to hydrolyze and solubilize xylan, melt and redistribute lignin,
increases the enzymatic accessible surface area of the raw material to improve digestibility,
while another class of pretreatment approaches such as kraft pulping and bleaching is based on
changing lignin solubility besides the solubilization of xylan as well.
Alkaline hydrogen peroxide (AHP) pretreatment is originally a bleaching process
widely applied in the paper industry for pulping. Kraft pulping is cooking wood chips at high
temperature (170°C) in sodium hydroxide and sodium sulfide solution to remove the majority
of the lignin [19], the beaching step is to utilize hydrogen peroxide to decolor the remaining
5
kraft lignin which is structurally distinct from native lignin. AHP pretreatment is based on
hydrogen peroxide oxidation of lignin under alkaline condition in room temperature, while
alkali saponification reactions with hemicellulose esters and lipids. The solubilization and
cleavage of lignin and hemicelluloses from cellulose can effectively increase the hydrolysis
conversion of residual PCWs.
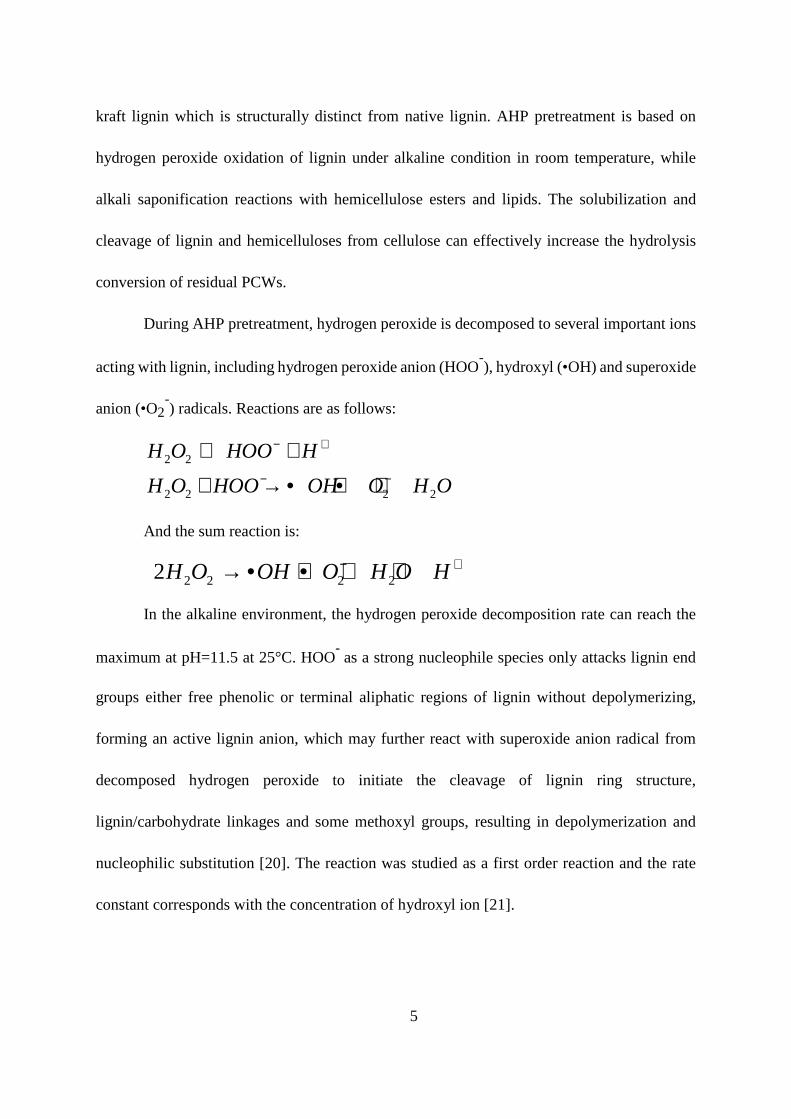
During AHP pretreatment, hydrogen peroxide is decomposed to several important ions
acting with lignin, including hydrogen peroxide anion (HOO-), hydroxyl (•OH) and superoxide
anion (•O2-) radicals. Reactions are as follows:
And the sum reaction is:
In the alkaline environment, the hydrogen peroxide decomposition rate can reach the
maximum at pH=11.5 at 25°C. HOO- as a strong nucleophile species only attacks lignin end
groups either free phenolic or terminal aliphatic regions of lignin without depolymerizing,
forming an active lignin anion, which may further react with superoxide anion radical from
decomposed hydrogen peroxide to initiate the cleavage of lignin ring structure,
lignin/carbohydrate linkages and some methoxyl groups, resulting in depolymerization and
nucleophilic substitution [20]. The reaction was studied as a first order reaction and the rate
constant corresponds with the concentration of hydroxyl ion [21].
2 2
2 2 2 2
H O HOO H
H O HOO OH O H O
− +
− −
⇔ +
+ → • + • +
2 2 2 22H O OH O H O H− +→ • + • + +
6
1.4 OBJECTIVES
The heterogeneous macromolecular structure of plant cell wall limits the enzymatic
hydrolysis of biomass. To better understand the interaction between pretreatment and
enzymatic hydrolysis, many studies based on characterizing the impact of various structural
features of biomass on cellulose enzymatic hydrolysis have been carried out in recent years. A
study using confocal microscopy showed xylan content decreasing in center of cell wall while
remaining in the lumen and middle lamella layer during dilute acid pretreatment, which
indicates the hydrophobic nature of lignin retards the solubilization of xylan associated to
lignin [22]. A study using a fluorescence-labeled cellulase to probe and examine the enzyme
binding with the substrates showed that the amorphous forms of the celluloses are more
digestible, which support the idea that the reaction extent of hydrolysis depends on the higher
order structure of the substrate [23]. Also, attempts have been made to link delignification with
cellulose enzymatic digestibility, and it has been found that the delignification is not
necessarily linear with the digestibility, since lignin location is more important than PCW’s
bulk composition [14]. Those three studies above all support the idea that digestibility is set by
the higher order structures of PCW. A model has been developed to predict enzymatic
hydrolysis of biomass based on structural features including crystallinity index, acetyl content
and lignin content [24]. Experimental data showed the rate of hydrolysis depends on
parameters related to biomass structural features independent from the cellulose and enzyme
concentrations and accessible surface fraction.
Current leading pretreatment technologies including dilute acid and steam explosion
7
have the limitation of enzymatic accessibility due to lignin relocalization and globule
formation, while alkaline pretreatments including lime and aqueous ammonia show better
lignin removal and some cell wall swelling [25]. Alkaline hydrogen peroxide pretreatment is a
pretreatment method well-suited to grasses [26] which yields relatively high digestibility and
generates low fermentation inhibitors [27]. One advantage of AHP pretreatment is the
capability to be performed under room temperature and pressure [28, 29], which could
significantly reduce the capital costs of a biorefinery for ethanol production. AHP as an
oxidative pretreatment has the disadvantage of the high cost of commercial hydrogen peroxide
since studies have shown the ratio of hydrogen peroxide to substrate should be at least 0.25 to
get good delignification and digestibility [28]. Also, since the density of lignocellulosic
feedstock is relatively low, the limited solid loading is another concern of pretreatment and
enzymatic hydrolysis [30] leading to significant effects on processing costs [31, 32]. Those
problems can be solved in the future by optimizing reaction procedures to reduce reagents
consumption or applying catalysts to speed up lignin oxidation [19].
The complexity of the biological macromolecules results in difficulties in biomass
assessment using traditional analytical methods. In order to further understand the mechanism
of the pretreatment impact on digestibility, this study is designed to comprehensively
understand the structural change during AHP pretreatment by physiochemical characterization
using a number of analytical methods and tools. The length scale of physical structure of
cellulose microfibrils and hemicellulose matrix is of the 10-4
to 10-6 meter, and the chemical
structure of the polysaccharides is in the 10-7
m to 10-9 m order of magnitude. Accurate
modeling and direct assessment of changes in PCW structure is the primary challenge due to
8
the complexity of the biomass and the complicated reaction mechanism of the cellulase system.
The monomer composition of biomass can be determined by NREL two-stage sulfuric acid
hydrolysis [33], trifluoroacetic acid (TFA) hydrolysis [34]. Detergent fiber analysis is a
method to determine the composition of three main components [35]. However, due to the
complexity of PCWs and the experimental errors, the uncertainty of compositional analysis is
significant. For instance, NREL method has 4% to 10% total relative standard deviation [36].
Many modern analytical instruments have been applied to characterize the chemical
composition including NMR [37, 38], NIR/PLS (near infrared reflectance spectroscopy) [39],
TGA (thermogravimetric analysis) [40] and pyrolysis GC/MS [41]. Also, the physical
structural characteristics of biomass such as the porosity and crystallinity have been profiled
respectively by SEM [42] and solid-state NMR. The lignin content, composition and functional
group distribution have been studied by 13
C, HSQC, and 31
P NMR spectroscopy [43].
This study is focused on the pretreatment effects on structural changes of grasses, and
how the structural changes impact glucan digestibility in the subsequent enzymatic hydrolysis.
This study uses ball-milled switchgrass (Panicum virgatum cv. Cave-In-Rock), corn stovers (a
commercial hybrid and inbred brown midrib lines bm1 and bm3), sugar maple (Acer
saccharum) that were AHP pretreated at varied conditions as research subjects. The remaining
solids and solubilized biomass pretreatment liquor were subjected to total polysaccharide
compositional analysis and solid-state 13
C CP/MAS NMR and HSQC 2D NMR profiling,
which have the potential to determine changes associated with carbohydrate-carbohydrate,
carbohydrate-lignin linkages and functional groups. Apparent molecular weight distributions
of soluble polymeric lignins and proposed hemicellulose aggregates were determined by
9
HP-SEC. Lignin content was quantified by both Klason and acetyl bromide lignin methods,
and the ratio of H/G/S monolignols has determined by thioacidolysis GC/MS and Pyrolysis
GC/MC. Pyrolysis GC/MS was utilized to characterize changes in the volatilized compounds
before and after pretreatment implying alterations in pyrolysis-labile monolignol linkages
which are induced by pretreatment. The relationship between digestibility and compositional
features of biomass were discussed.
2. STRUCTRAL CHANGES OF RESIDUE CELL WALL
2.1 INTRODUCTION
Alkaline pretreatment disrupts cell walls by somewhat swelling cellulose microfibrils
[44], dissolving hemicellulose and cleaving ester bonds between hemicellulose and lignin [45].
Hemicelluloses contain many esters bonded substitution groups including acetate and ferulic
acid which are alkali-labile and thus increase the alkali solubility of hemicelluloses after their
cleavage by alkali. The alkali vulnerable ferulate ester crosslinks between xylan-xylan,
xylan-lignin and lignin-lignin has been found unique in grasses [46]. Those features enable
AHP to be either an effective pretreatment [27] or a pre-treatment delignification step [45] by
playing a role in overcoming the recalcitrance of biomass especially grasses.
Composition analysis is usually required before enzymatic hydrolysis since the amount
of enzymes is determined by the sugar content. One type of composition analysis is to convert
the cellulose and hemicelluloses to monosugars under high severity conditions such as
two-stage acid hydrolysis, and then analyze the sugar concentrations in solution via
10
chromatography [33]. The acid insoluble portion is regarded as Klason lignin. Acetyl Bromide
Soluble Lignin (ABSL) provides quantitative information of total lignin content by UV
absorbance of aromatic rings in lignin [47].
In order to understand important features of lignocellulosic biomass other than sugar
composition, such as crystallinity index, degree of polymerization and lignin carbohydrate
linkages, previous research has applied many instruments and analytical methods including
SEM, XRD and so on. Among them, Nuclear Magnetic Resonance (NMR) is a method
commonly used in recent years for studying the structural characteristics of lignocellulosic
biomass. It is based on the principle that certain types of magnetic nuclei with spin properties in
an applied magnetic field absorb electromagnetic radiation at a frequency depending on the
local chemical environment, which makes it possible to provide information of the molecules
in which they are contained through exploiting the magnetic properties of the certain nuclei.
The properties of 13
C and 1H can provide information of the macromolecules in which they are
contained.
Native cellulose exists as cellulose microfibrils each contains 36 cellulose chains, and
coalesce as two distinct crystalline forms Iα and Iβ [8]. The ratio of crystalline and amorphous
cellulose varies by species. In order to further investigate the chemical changes during biomass
conversion, the morphology of cellulose including crystallinity is one of the target properties of
structural characterization. Solid-state NMR method is a way to analyze chemical structure in a
native state, which is effective for biobased macromolecular samples which usually have
limited solubility. 13
C-cross-polarisation magic angle spinning (CP/MAS) NMR spectrum
contains information of amount and structures of different cellulose, which make it possible to
11
study the cellulose morphology including the degree of crystallinity and accessible surface area
through spectrum fitting[48-51].
Solid-state 13
C CP/MAS NMR can provide information of polysaccharides through
characterization of chemical environment of carbon nuclei. 2D NMR methods including
HSQC (Heteronuclear Single Quantum Correlation) and HMQC (heteronuclear multiple
quantum coherence) through correlating C and H nuclei on the complex biopolymers of PCWs
provide structural information including intra-lignin, carbohydrate-carbohydrate,
carbohydrate-lignin linkages and functional groups [52, 53], which are also important
properties associated with pretreatment effectiveness. For investigation on structural change
associated with pretreatment, previous studies have showed no distinction between intact and
degraded cellulose microfibrils [54], the different pulping conditions influence the crystallinity
of cellulose differently [51], and hydrolysis does not alter apparent crystallinity [42]. This
chapter is focusing on structural information provided by NMR indicating pretreatment
effectiveness. The cellulose crystallinity and functional groups was studied by 13
C CP/MAS
NMR. The carbohydrate-carbohydrate and carbohydrate-lignin linkages were determined by
2D HSQC NMR.
2.2 MATERIALS AND METHODS
2.2.1 Sampling
In this study, several types of biomass have been used including switchgrass (Panicum
virgatum cv. Cave-In-Rock), corn stovers (a commercial hybrid and inbred brown midrib lines
bm1 and bm3) and sugar maple (Acer saccharum). Corn stover and switchgrass are common
12
bioenergy feedstock and sugar maple is a common hardwood in the state of Michigan. The
brown midrib (bmr) mutants are well known as having lower lignin content and higher
digestibility than normal phenotypes in corns and have been studied for more than 50 years[55].
Specific mutants with potential in structural research on lignin include bm1 line with lower
level of cinnamyl alcohol dehydrogenase (CAD) resulting in reduced lignin, ferulic acid (FA)
and para-coumaric acid (pCA) esters as well as enriched C-C monolignol linkages, and bm3
line deficient in caffeic acid O-methyl transferase (COMT) resulting in decreased total lignin
and syringyl monolignol incorporation [56, 57].
2.2.2 AHP Pretreatment
The 2 mm screen biomass samples were treated by a series of aqueous solutions with
distinct sodium hydroxide concentrations and fixed hydrogen peroxide concentration as 2%
solid loading in 100 mL total volume for 24 hours at room temperature. As shown in Table 2.1,
the samples are categorized by high NaOH, low NaOH and pH=11.5 adjusted pretreated
according to different sodium hydroxide adding amounts. The untreated biomass is regarded as
control. Pretreatments were performed in duplicate.
Solid loading (g biomass/g total)
NaOH (g/g biomass)
H2O2
(g/g biomass) H2O (mL)
Low NaOH 2% 0.1 0.125 100 High NaOH 2% 1.1 0.125 100 pH=11.5 2% pH=11.5 0.125 100
Table 2.1: Definitions and conditions of AHP pretreatment
2.2.3 Milling
The pretreated biomass was grinded by QIAGEN TissueLyser II equipped with 25 mL
stainless steel jars and 20 mm Ø balls in 25 Hz for 2 minutes with liquid nitrogen cooling
13
interval.
2.2.3 NREL Compositional Analysis
NREL compositional analysis method is a two-stage acid hydrolysis followed by
HPLC (Aminex HPX-87H column and Refractive Index detector) to get the monosaccharide
concentration. 0.1 g biomass sample was measured and put into pressure tube equipped with a
glass rob, 1 mL 72% H2SO4 was added and the pressure tube was immersed into water bath set
at 30°C for 1 hour with stirring every five minutes. 28 mL deionized water was added to adjust
the concentration of H2SO4 to 4% which was then autoclaved at 121°C for 1 hour. 1mL of the
solution was neutralized by CaCO3, filtered by 0.22 mm syringe filter and transferred to HPLC
vial. Five standard solutions of D(+)glucose, D(+)xylose, L(+) arabinose with concentration
gradient were prepared. Standards were injected with samples at the same time and the sugar
concentrations were calculated by peak integration of demand ingredients. The remaining
liquid was filtered to get acid insoluble lignin (AIL) content as Klason lignin [58].
2.2.5 ABSL Analysis
2mg ball-milled biomass sample was reacted with 250 µL fresh 25% acetyl bromide in
acetic acid solution at 50°C for 3 hours [59]. After centrifugation, 100 µL of the reaction
solution was transferred into an empty 2 ml volumetric flask, then 400 µL 2 M NaOH and 75
µL fresh 0.5 M hydroxylamine hydrochloride solutions were added, and the volume was added
up to 2 mL with acetic acid. Triplicate samples were tested with 96-well UV spectrophotometer
at 280 nm absorbance.
2.2.6 Enzymatic Hydrolysis
Pretreated samples were incubated at 50°C for 24 hours with Accellerase 1500 enzyme
14
provided by Genencor at a loading of 50 mg protein/g glucan, which is higher than the
theoretical enzyme requirement in order to achieve highest possible conversion and evaluate
only substrate effects. The conditions were 10% solid loading at 5 mL total volume and with
0.05 M Na-citrate buffer pH 5. The digestibility was determined by the HPLC analyzable
glucose concentration after incubation divided by the original glucan content in the pretreated
samples.
2.2.7 Bacterial Cellulose Solid-state NMR Study
Bacterial cellulose G. xylium was cultivated in Hestrin and Schramm (HS) medium
containing 5 g/L peptone, 5 g/L yeast extract, 2.7 g/L Na2HPO4, 1.15 g/L citric acid and 20 g/L
glucose [60] for 7 days in room temperature. The NMR instrument is a Bruker Avance 900
MHz superconducting NMR Spectrometer equipped with a TCI triple resonance inverse
detection cryoprobe.
2.2.8 Residual Cell Wall Solid-state NMR Study
The 2 mm screen biomass samples were treated by three conditions of AHP
pretreatment based on different NaOH loadings, 0.05 g/g, 0.1 g/g and 0.15 g/g biomass, and the
same H2O2 concentration, 0.125 g/g biomass at 30°C for 24 hours. The samples were air-dried
after pretreatment and 300 mg of each sample was packed into solid-state NMR tube. The 13
C
CP/MAS solid-state NMR instrument is a Varian 400 MHz superconducting
NMR-Spectrometer operating at 399.745 MHz interfaced with a Sun Microsystems Ultra5
UNIX console. Spectrum were acquired over 4 hours and normalized to the height of the C6
cellulose peak. Peak identifications were taken from figure 2.6.
15
2.2.9 Residue Cell Wall 2D HSQC NMR Profiling
For HSQC 2D NMR study, the pre-milled switchgrass under low severity AHP
pretreatment was extracted with distilled water (ultrasonication 1 hour for three times) and 80%
ethanol (ultrasonication 1 hour for three times) to remove the metal ions induced from the
stainless ball and jar during pre-milling. Then after drying, the metal ions free sample was
ball-milled by QIAGEN TissueLyser II in 2 mL polycarbon tubes with 2 mm Ø zirconium
dioxide (ZrO2) balls (25 Hz, 2 minutes, 5 times) with liquid nitrogen cooling interval. 50 mg
ball-milled sample were transferred into a 5 mm diameter x 8” length NMR tube, where the
sample powder was distributed as well as possible along the sides of the tube. 1 mL mixture
solvent of DMSO-d6 and pyridine-d5 with a ratio 4:1 v/v was previously prepared, and was
carefully added along the side of the tube. The NMR tubes were placed in a sonicator and
sonicated for 5 hours until the gel became homogenous[52]. The HSQC 2D NMR instrument is
a Varian 600 MHz superconducting NMR-Spectrometer operating at 599.892 MHz interfaced
with a Sun Microsystems Ultra2 UNIX console, capable for probes pretuned for 1H,
13C, and
15N. HSQC spectrum was acquired over 4 hours.
2.3 RESULTS AND DISCUSSIONS
2.3.1 NREL Compositional Analysis and Digestibility Evaluation
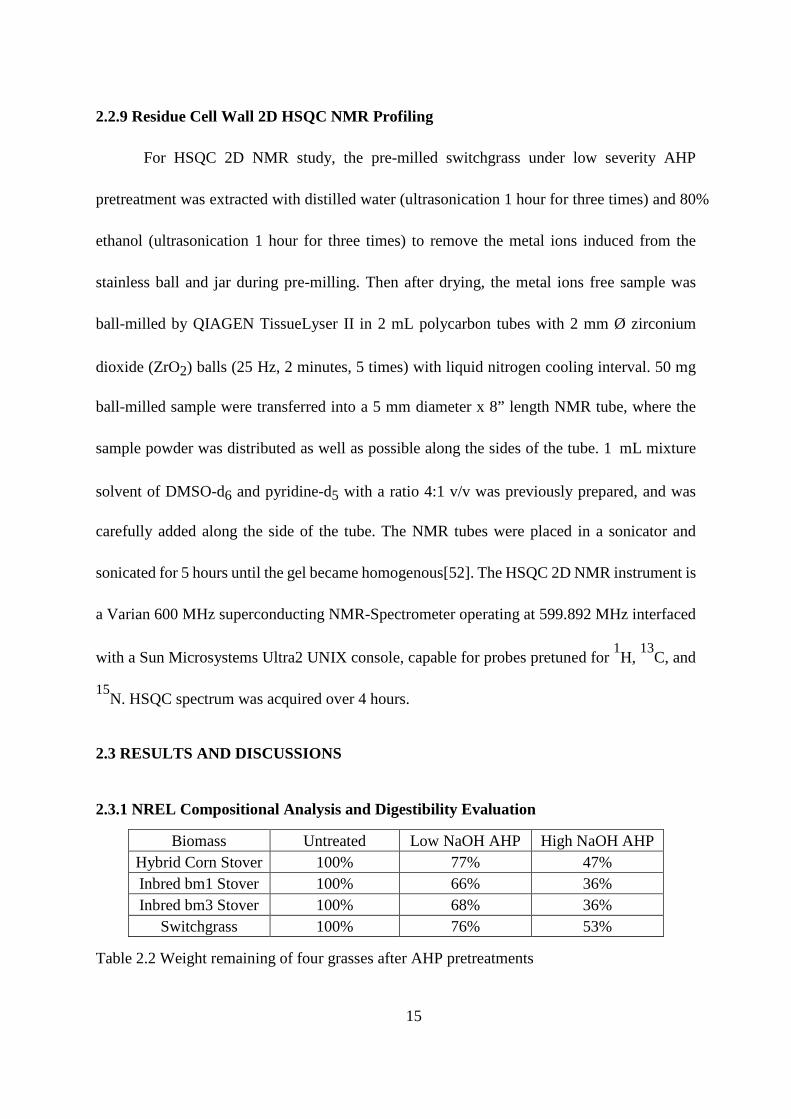
Biomass Untreated Low NaOH AHP High NaOH AHP Hybrid Corn Stover 100% 77% 47% Inbred bm1 Stover 100% 66% 36% Inbred bm3 Stover 100% 68% 36%
Switchgrass 100% 76% 53%
Table 2.2 Weight remaining of four grasses after AHP pretreatments
16
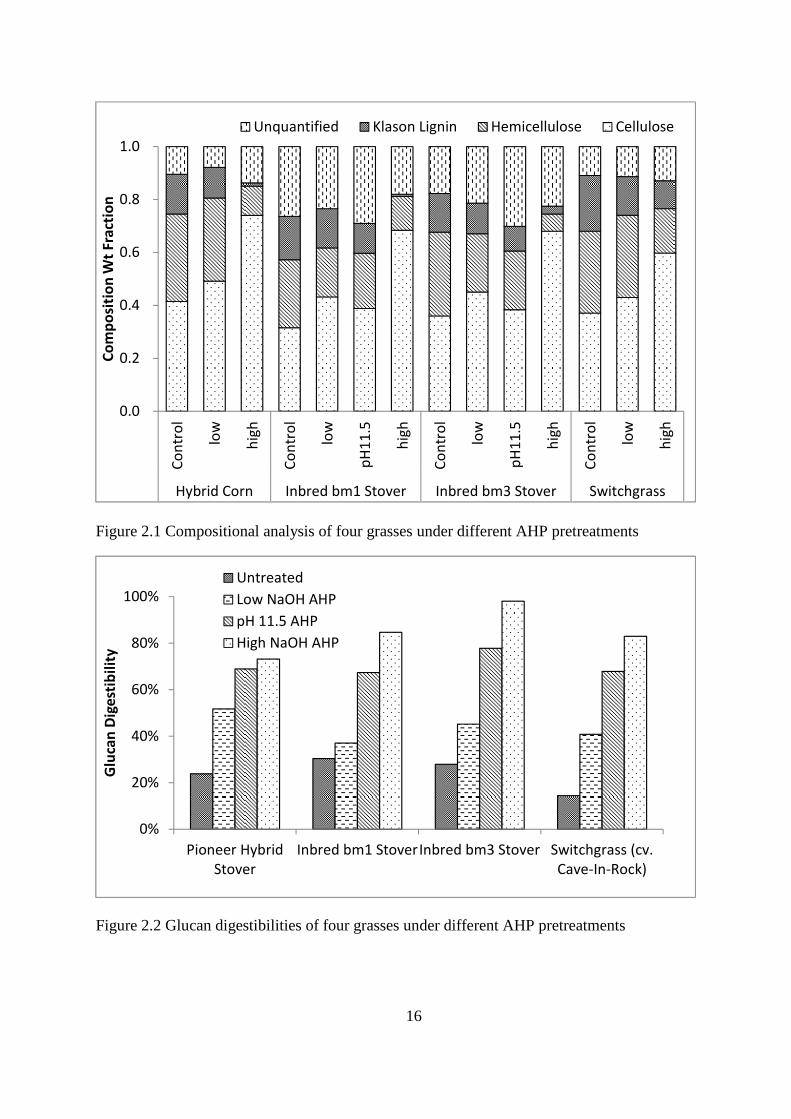
Figure 2.1 Compositional analysis of four grasses under different AHP pretreatments
Figure 2.2 Glucan digestibilities of four grasses under different AHP pretreatments
0.0
0.2
0.4
0.6
0.8
1.0
Co
ntr
ol
low
hig
h
Co
ntr
ol
low
pH
11
.5
hig
h
Co
ntr
ol
low
pH
11
.5
hig
h
Co
ntr
ol
low
hig
h
Hybrid Corn
Stover
Inbred bm1 Stover Inbred bm3 Stover Switchgrass
Co
mp
osi
tio
n W
t F
ract
ion
Unquantified Klason Lignin Hemicellulose Cellulose
0%
20%
40%
60%
80%
100%
Pioneer Hybrid
Stover
Inbred bm1 StoverInbred bm3 Stover Switchgrass (cv.
Cave-In-Rock)
Glu
can
Dig
est
ibil
ity
Untreated
Low NaOH AHP
pH 11.5 AHP
High NaOH AHP
17
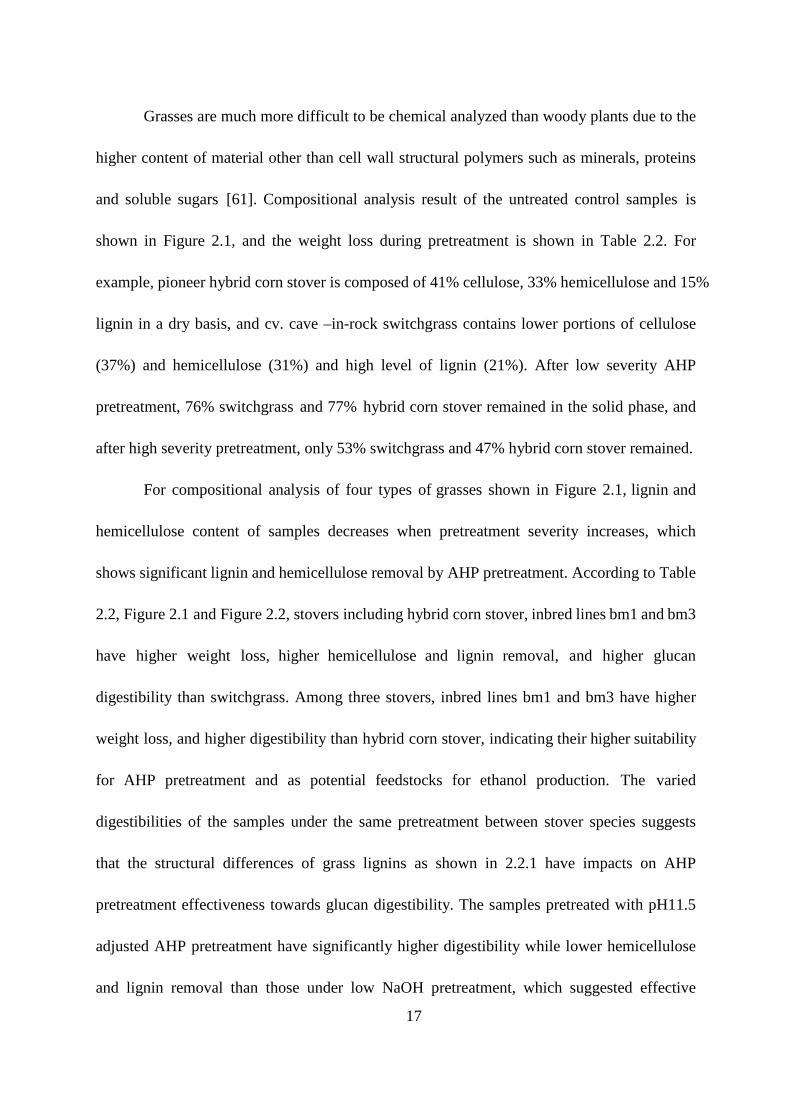
Grasses are much more difficult to be chemical analyzed than woody plants due to the
higher content of material other than cell wall structural polymers such as minerals, proteins
and soluble sugars [61]. Compositional analysis result of the untreated control samples is
shown in Figure 2.1, and the weight loss during pretreatment is shown in Table 2.2. For
example, pioneer hybrid corn stover is composed of 41% cellulose, 33% hemicellulose and 15%
lignin in a dry basis, and cv. cave –in-rock switchgrass contains lower portions of cellulose
(37%) and hemicellulose (31%) and high level of lignin (21%). After low severity AHP
pretreatment, 76% switchgrass and 77% hybrid corn stover remained in the solid phase, and
after high severity pretreatment, only 53% switchgrass and 47% hybrid corn stover remained.
For compositional analysis of four types of grasses shown in Figure 2.1, lignin and
hemicellulose content of samples decreases when pretreatment severity increases, which
shows significant lignin and hemicellulose removal by AHP pretreatment. According to Table
2.2, Figure 2.1 and Figure 2.2, stovers including hybrid corn stover, inbred lines bm1 and bm3
have higher weight loss, higher hemicellulose and lignin removal, and higher glucan
digestibility than switchgrass. Among three stovers, inbred lines bm1 and bm3 have higher
weight loss, and higher digestibility than hybrid corn stover, indicating their higher suitability
for AHP pretreatment and as potential feedstocks for ethanol production. The varied
digestibilities of the samples under the same pretreatment between stover species suggests
that the structural differences of grass lignins as shown in 2.2.1 have impacts on AHP
pretreatment effectiveness towards glucan digestibility. The samples pretreated with pH11.5
adjusted AHP pretreatment have significantly higher digestibility while lower hemicellulose
and lignin removal than those under low NaOH pretreatment, which suggested effective
18
oxidation of lignin may contribute to pretreatment effectiveness.
2.3.2 ABSL Analysis
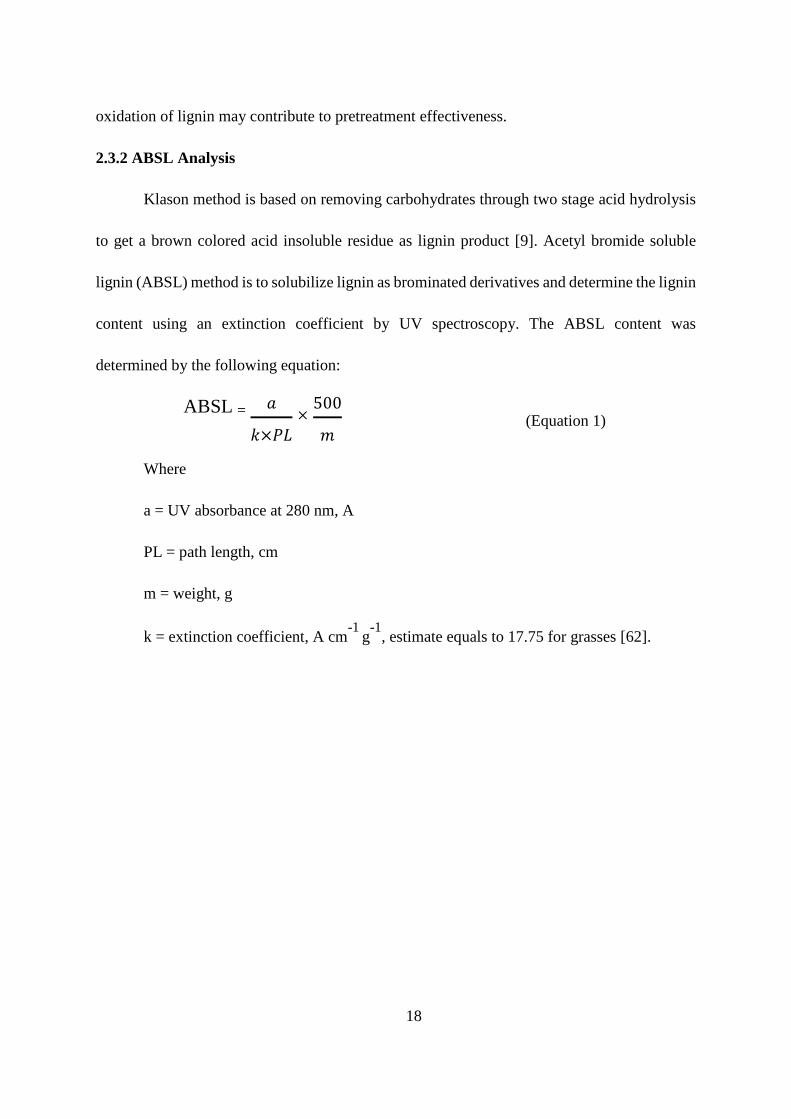
Klason method is based on removing carbohydrates through two stage acid hydrolysis
to get a brown colored acid insoluble residue as lignin product [9]. Acetyl bromide soluble
lignin (ABSL) method is to solubilize lignin as brominated derivatives and determine the lignin
content using an extinction coefficient by UV spectroscopy. The ABSL content was
determined by the following equation:
ABSL= �
�×��×500
(Equation 1)
Where
a = UV absorbance at 280 nm, A
PL = path length, cm
m = weight, g
k = extinction coefficient, A cm-1 g
-1, estimate equals to 17.75 for grasses [62].
19
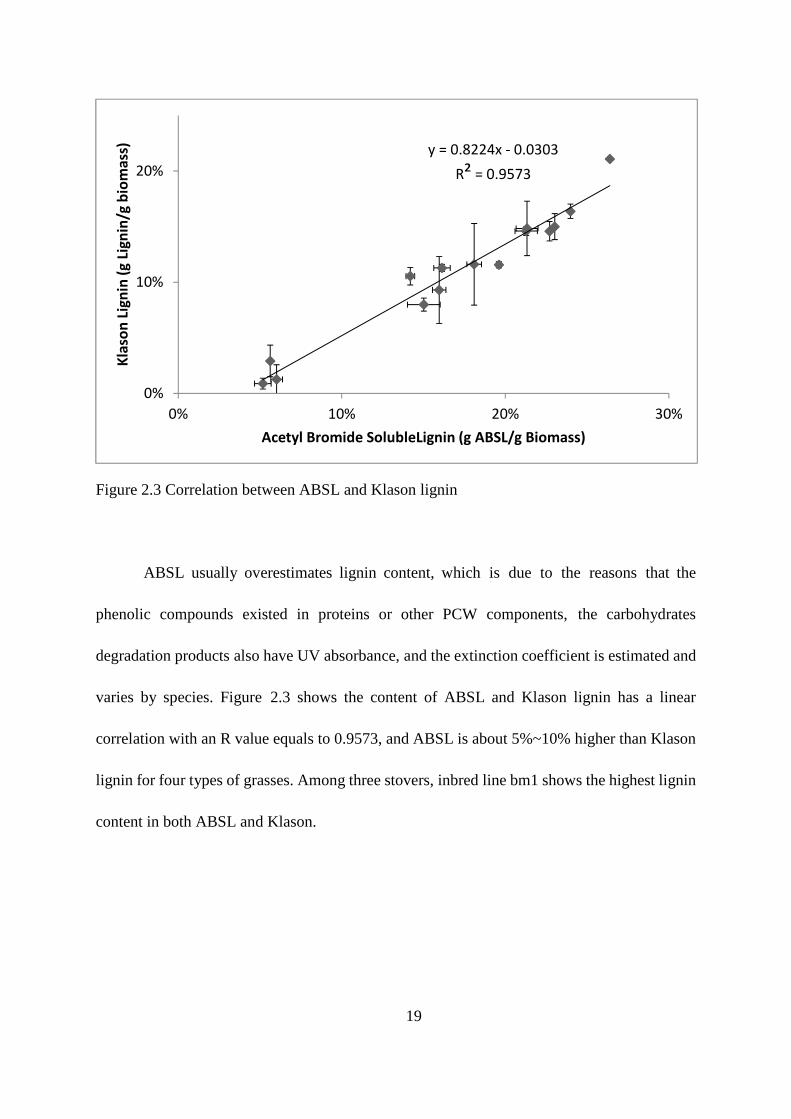
Figure 2.3 Correlation between ABSL and Klason lignin
ABSL usually overestimates lignin content, which is due to the reasons that the
phenolic compounds existed in proteins or other PCW components, the carbohydrates
degradation products also have UV absorbance, and the extinction coefficient is estimated and
varies by species. Figure 2.3 shows the content of ABSL and Klason lignin has a linear
correlation with an R value equals to 0.9573, and ABSL is about 5%~10% higher than Klason
lignin for four types of grasses. Among three stovers, inbred line bm1 shows the highest lignin
content in both ABSL and Klason.
y = 0.8224x - 0.0303
R² = 0.9573
0%
10%
20%
0% 10% 20% 30%
Kla
son
Lig
nin
(g
Lig
nin
/g b
iom
ass
)
Acetyl Bromide SolubleLignin (g ABSL/g Biomass)
20
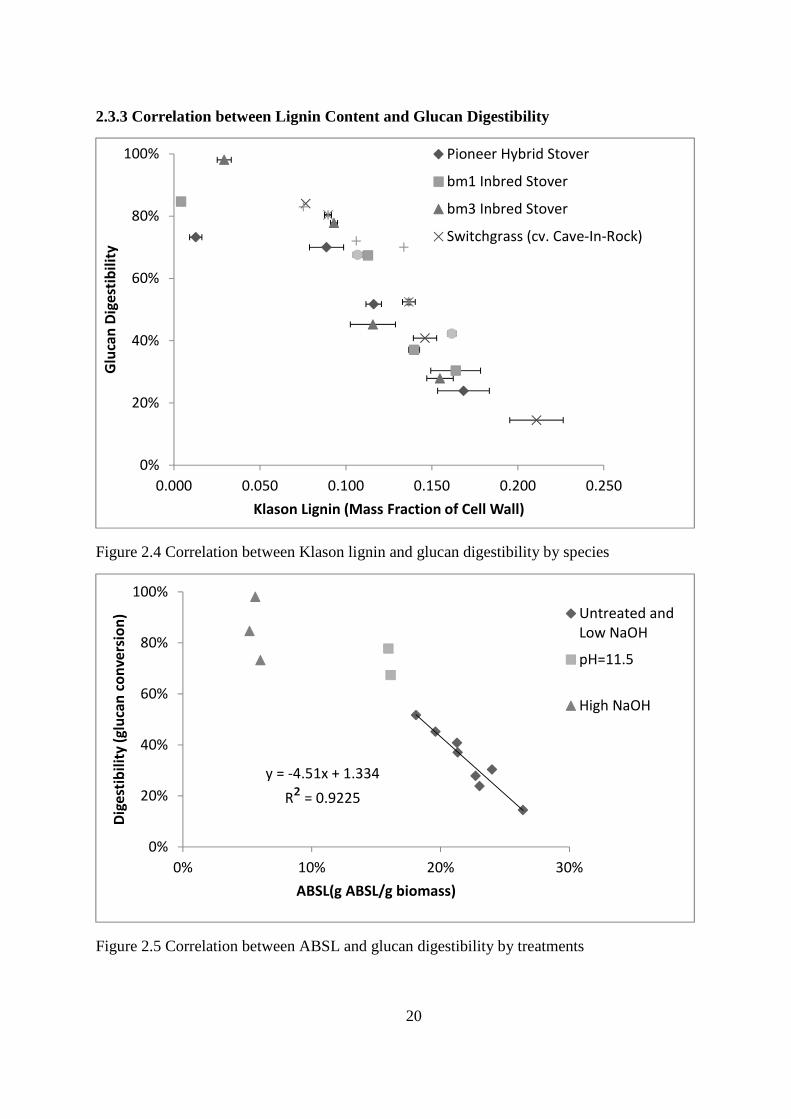
2.3.3 Correlation between Lignin Content and Glucan Digestibility
Figure 2.4 Correlation between Klason lignin and glucan digestibility by species
Figure 2.5 Correlation between ABSL and glucan digestibility by treatments
0%
20%
40%
60%
80%
100%
0.000 0.050 0.100 0.150 0.200 0.250
Glu
can
Dig
est
ibil
ity
Klason Lignin (Mass Fraction of Cell Wall)
Pioneer Hybrid Stover
bm1 Inbred Stover
bm3 Inbred Stover
Switchgrass (cv. Cave-In-Rock)
y = -4.51x + 1.334
R² = 0.9225
0%
20%
40%
60%
80%
100%
0% 10% 20% 30%
Dig
est
ibil
ity
(g
luca
n c
on
ve
rsio
n)
ABSL(g ABSL/g biomass)
Untreated and
Low NaOH
pH=11.5
High NaOH
21
The sigmoid negative correlation shown in Figure 2.4 between Klason lignin and
digestibility by species shows that in both very high and very low lignin content grasses, the
increase in digestibility due to decreased lignin content is less significant than in the middle
range of lignin content, indicating structural changes occurs due to different pretreatments.
When plotted by types of pretreatment, the glucan digestibility directly depends on lignin
content of ABSL as well as Klason at the same slope for the untreated samples and the mild
pretreated samples. However, pH-adjusted and high NaOH pretreated samples are of different
slope of correlation between lignin content and digestibility which implies structural changes
and needs detailed investigation.
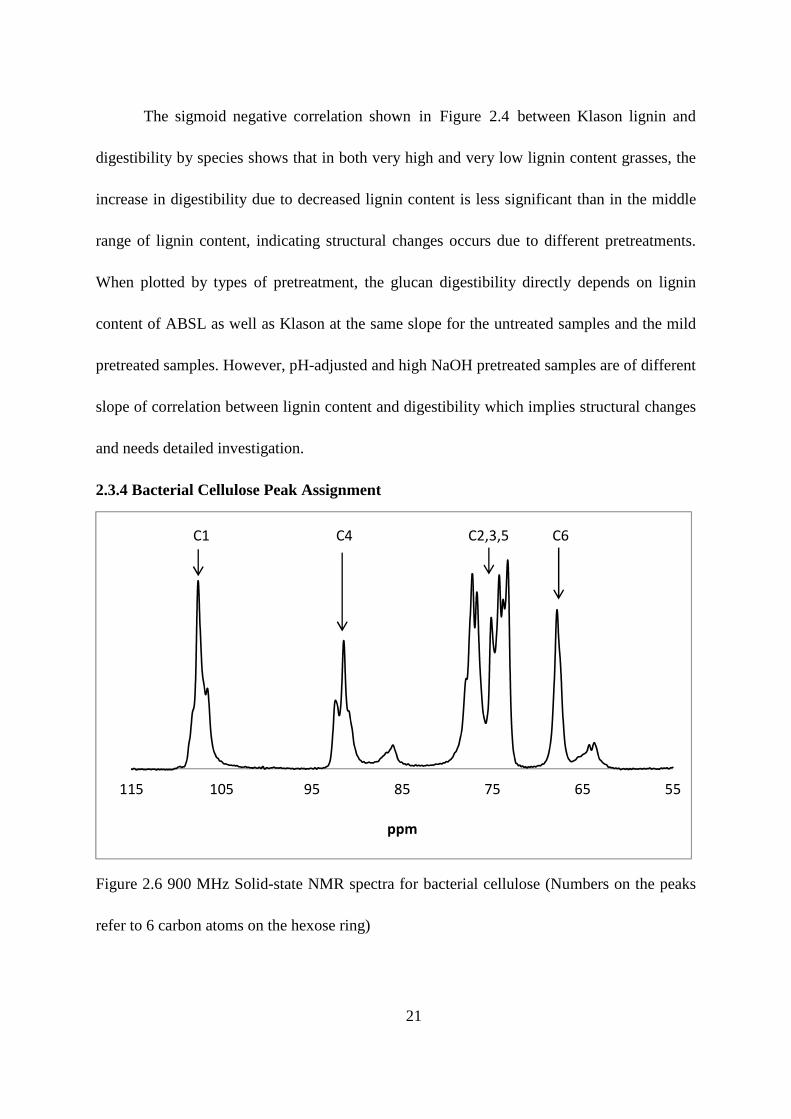
2.3.4 Bacterial Cellulose Peak Assignment
Figure 2.6 900 MHz Solid-state NMR spectra for bacterial cellulose (Numbers on the peaks
refer to 6 carbon atoms on the hexose ring)
5565758595105115
ppm
C1 C4 C2,3,5 C6
22
Bacterial cellulose synthesized by Acetobacter species with ultra-fine fiber network
structure with high mechanical strength, water absorption and crystallinity, has been looked
as a novel commercial biochemical with applications in food science, tissue engineering and
paper industry [63]. Peaks referred to carbons on the hexose ring of bacterial cellulose
microfibrils have been assigned in Figure 2.6 according to Udhardt et al. [64]. Since the 900
MHz facility equipped with cyroprobe gives high resolution spectrum, the clearly defined
peak assignment can be applied to other 13
C solid-state NMR results. The detailed
crystallinity study of bacterial cellulose is shown in the Appendix.
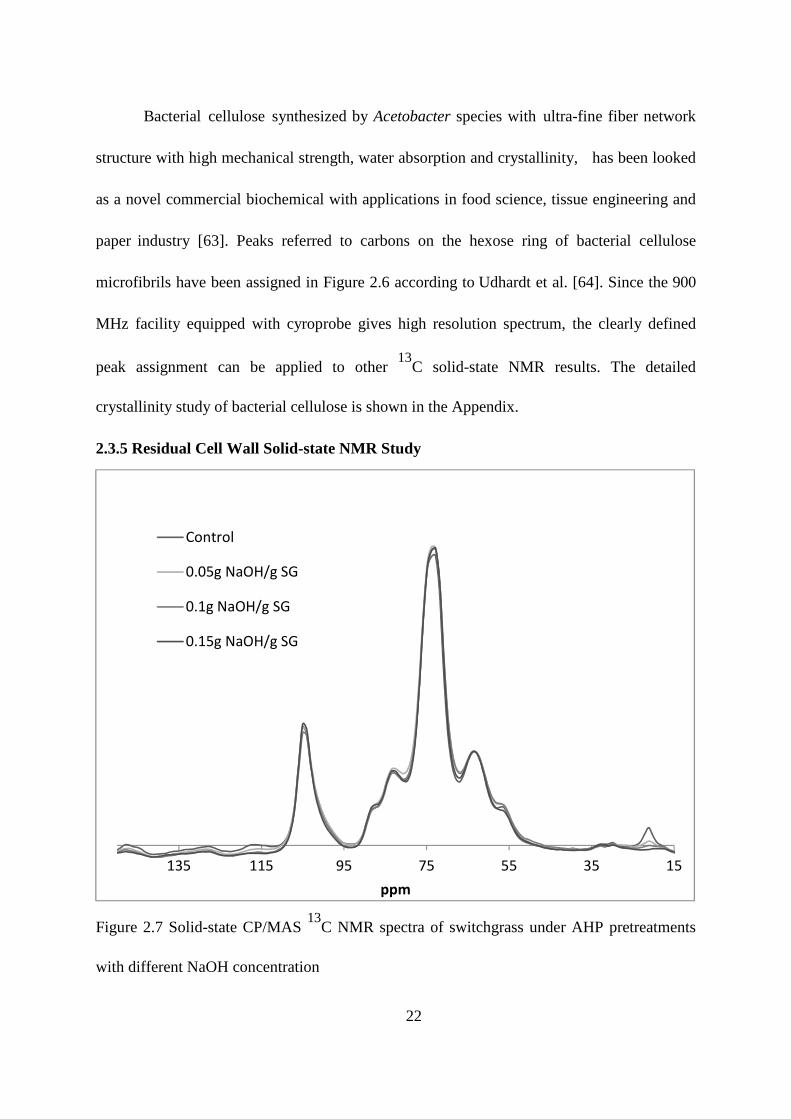
2.3.5 Residual Cell Wall Solid-state NMR Study
Figure 2.7 Solid-state CP/MAS 13
C NMR spectra of switchgrass under AHP pretreatments
with different NaOH concentration
1535557595115135
ppm
Control
0.05g NaOH/g SG
0.1g NaOH/g SG
0.15g NaOH/g SG
23
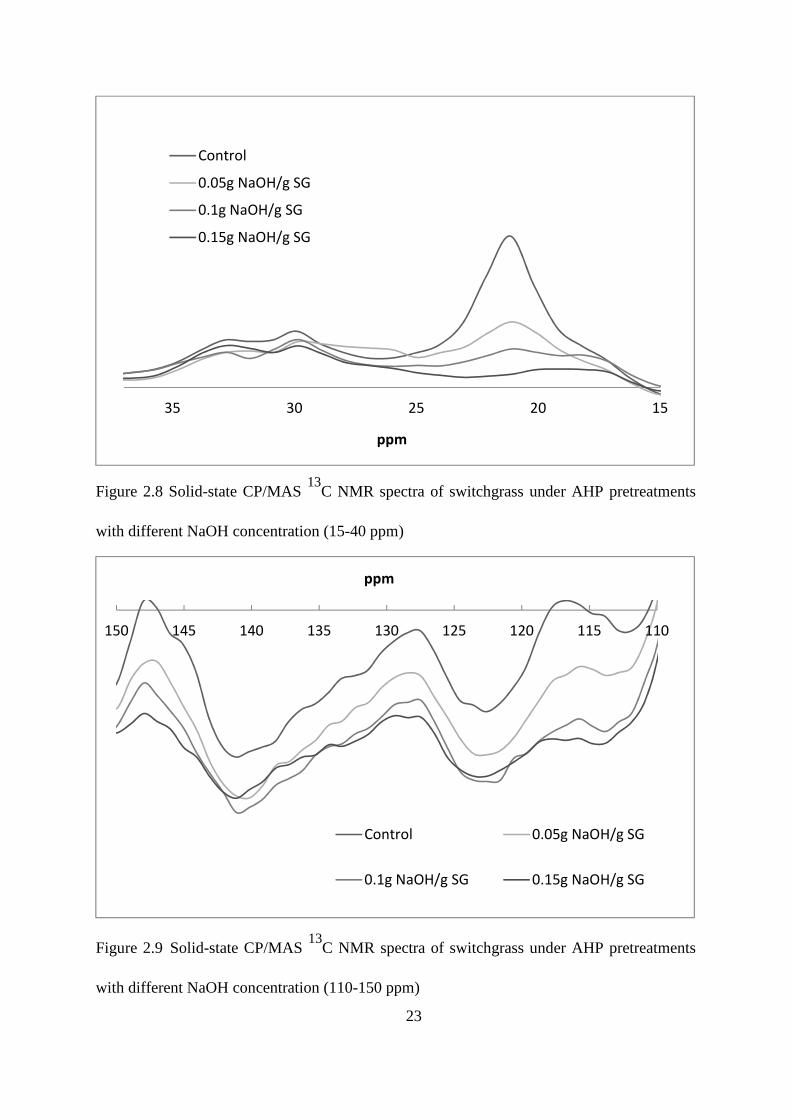
Figure 2.8 Solid-state CP/MAS 13
C NMR spectra of switchgrass under AHP pretreatments
with different NaOH concentration (15-40 ppm)
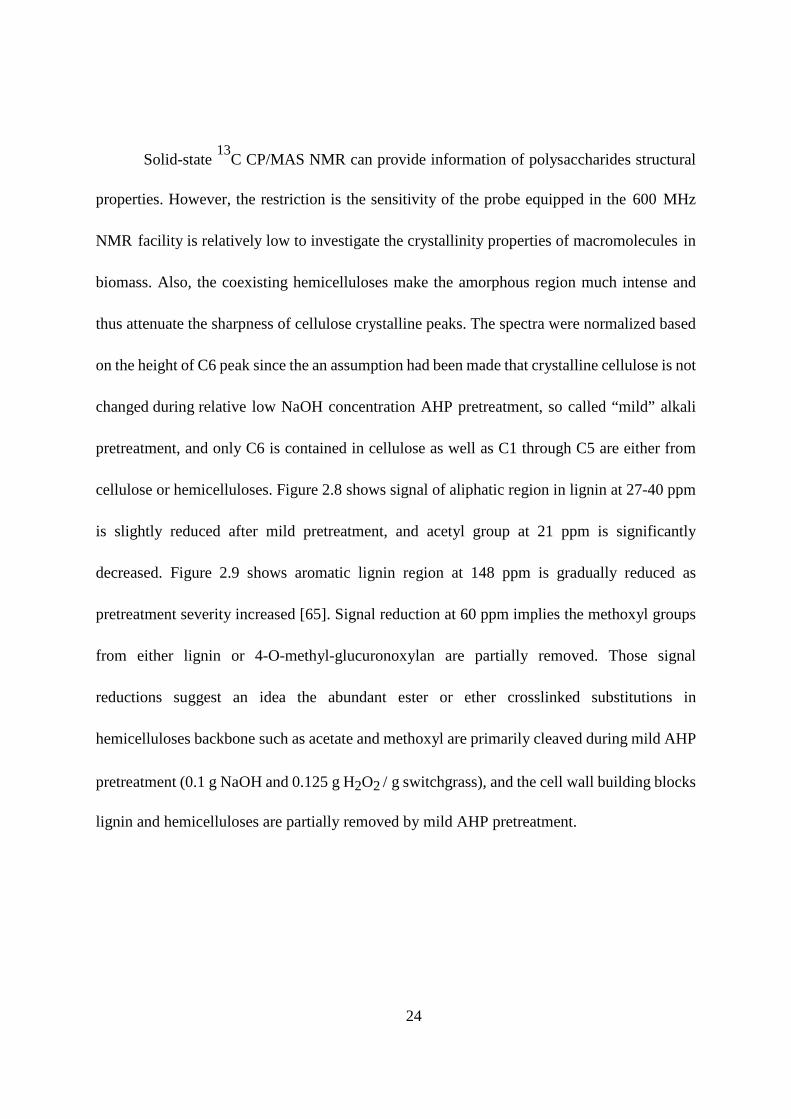
Figure 2.9 Solid-state CP/MAS 13
C NMR spectra of switchgrass under AHP pretreatments
with different NaOH concentration (110-150 ppm)
1520253035
ppm
Control
0.05g NaOH/g SG
0.1g NaOH/g SG
0.15g NaOH/g SG
110115120125130135140145150
ppm
Control 0.05g NaOH/g SG
0.1g NaOH/g SG 0.15g NaOH/g SG
24
Solid-state 13
C CP/MAS NMR can provide information of polysaccharides structural
properties. However, the restriction is the sensitivity of the probe equipped in the 600 MHz
NMR facility is relatively low to investigate the crystallinity properties of macromolecules in
biomass. Also, the coexisting hemicelluloses make the amorphous region much intense and
thus attenuate the sharpness of cellulose crystalline peaks. The spectra were normalized based
on the height of C6 peak since the an assumption had been made that crystalline cellulose is not
changed during relative low NaOH concentration AHP pretreatment, so called “mild” alkali
pretreatment, and only C6 is contained in cellulose as well as C1 through C5 are either from
cellulose or hemicelluloses. Figure 2.8 shows signal of aliphatic region in lignin at 27-40 ppm
is slightly reduced after mild pretreatment, and acetyl group at 21 ppm is significantly
decreased. Figure 2.9 shows aromatic lignin region at 148 ppm is gradually reduced as
pretreatment severity increased [65]. Signal reduction at 60 ppm implies the methoxyl groups
from either lignin or 4-O-methyl-glucuronoxylan are partially removed. Those signal
reductions suggest an idea the abundant ester or ether crosslinked substitutions in
hemicelluloses backbone such as acetate and methoxyl are primarily cleaved during mild AHP
pretreatment (0.1 g NaOH and 0.125 g H2O2 / g switchgrass), and the cell wall building blocks
lignin and hemicelluloses are partially removed by mild AHP pretreatment.
25
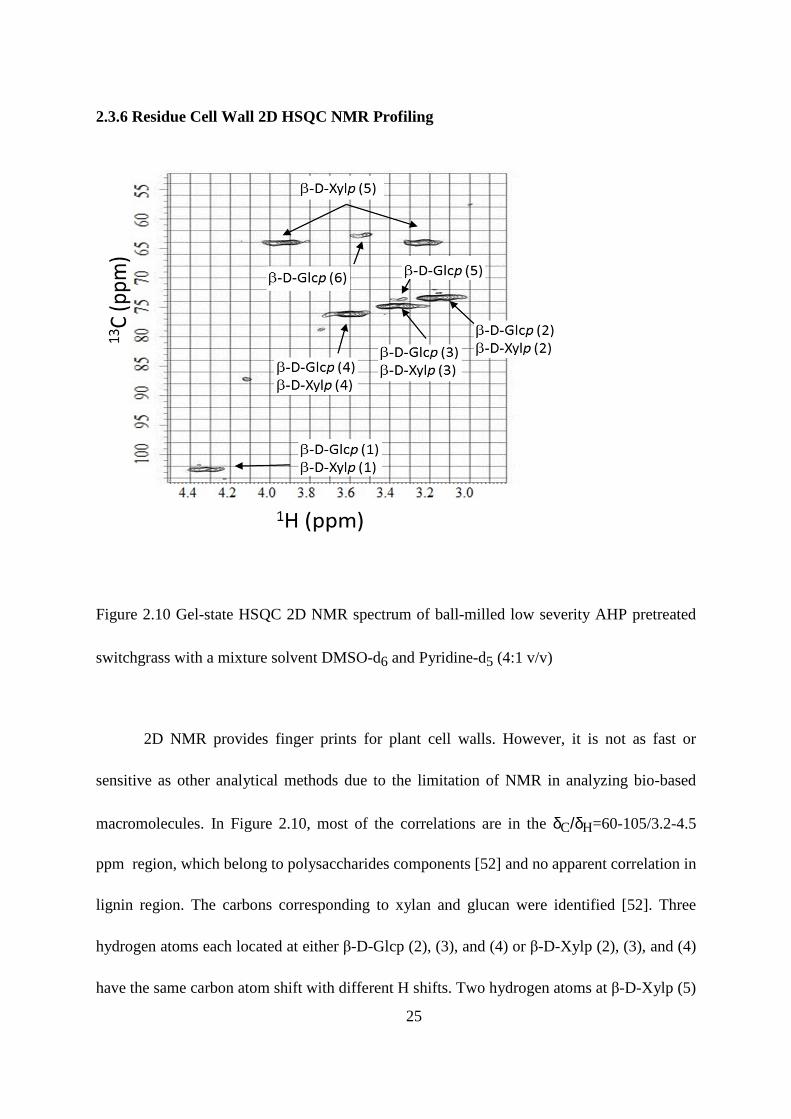
2.3.6 Residue Cell Wall 2D HSQC NMR Profiling
Figure 2.10 Gel-state HSQC 2D NMR spectrum of ball-milled low severity AHP pretreated
switchgrass with a mixture solvent DMSO-d6 and Pyridine-d5 (4:1 v/v)
2D NMR provides finger prints for plant cell walls. However, it is not as fast or
sensitive as other analytical methods due to the limitation of NMR in analyzing bio-based
macromolecules. In Figure 2.10, most of the correlations are in the δC/δH=60-105/3.2-4.5
ppm region, which belong to polysaccharides components [52] and no apparent correlation in
lignin region. The carbons corresponding to xylan and glucan were identified [52]. Three
hydrogen atoms each located at either β-D-Glcp (2), (3), and (4) or β-D-Xylp (2), (3), and (4)
have the same carbon atom shift with different H shifts. Two hydrogen atoms at β-D-Xylp (5)
26
and one hydrogen atoms at β-D-Glcp (6) have the same carbon atom shift with different
hydrogen shifts. β-D-Glcp (1) and β-D-Xylp (1) have one unique shift. The lack of cryoprobe
leads to low S/N (signal to noise) in the experiment and low resolution spectra. Kim et al. [52]
stated the importance of milling of the biobased macromolecules in order to homogenously
suspend them in solvent as a gel state, and the time length and cycle number of milling depend
on the biomass species and treatment. The Retsch Mixer Mill MM400 mentioned in his paper
provides rotary grinding and results in smaller particles. After appropriate milling, the
spectrum was able to be obtained in only two hours. Thus milling is another possibility that low
resolution and only carbohydrate region shows up in the result. However, since the
hemicelluloses have more amorphous structure than cellulose, the better swelling and
suspending in the solvent lead to stronger carbon-hydrogen correlation of xylan shown in the
spectrum, although the concentration of xylan is considered to be lower than glucan.
27
3. SOLUBILIZED COMPOUNDS IN HYDROLYSATE
3.1 INTRODUCTION
Ester/ether linkages between lignin and hemicellulose forming lignin carbohydrate
complex (LCC) are one of the major contributions to recalcitrance to enzymatic accessibility
[46], which makes mild alkaline treatment effective way to extract hemicelluloses and lignin
from biomass [26]. Depending on the conditions, alkaline pretreatments partially solubilize
polysaccharides into the liquid phase and some of them are degraded to toxic or nontoxic
byproducts including organic acids, aldehydes and phenols [66]. Pretreatment also could be a
pre-extraction step results in the removal of extractives including lipids, proteins and
inorganics which are contained in plant tissues. The toxicity of the hydrolysate of AHP
pretreatment was investigated in order to demonstrate if a detoxify step is indispensible for
following enzymatic hydrolysis and fermentation [67].
Lignin carbohydrate complexes (LCCs) were introduced in 1950s [68] and were found
in many organic extracted or alkaline extracted woods [69]. Study has shown the aggregate
formation of glucuronoxylan from alkali extracted aspen by detecting the glucuronic acid
distribution along the xylan chains [70]. For grasses, alkali extracted LCCs were also observed
and found to contain the similar ratio of monosaccharide residues as those in the untreated cell
wall [71, 72] with a reported DP at around 50 [73].
Last chapter showed AHP pretreatment effects on fractionation of lignin and
hemicelluloses. In order to investigate the pretreatment hydrolysate, the mass balance of
soluble and insoluble phases was performed in this chapter, and molecular weight distribution
28
of hemicelluloses and lignin in the hydrolysate was estimated by Size Exclusion
Chromatography (SEC). Similar to gel-state NMR for residue cell walls, solution-state HSQC
NMR were utilized for profiling the hydrolysate. Meanwhile, solution-state 1H NMR is
another fast method to obtain the information about compounds contained in the hydrolysate
[38].
3.2 MATERIAL AND METHODS
3.2.1 Sample Concentration
140 mL low severity switchgrass pretreatment liquor was filled into a 15” x 3” dialysis
tube with closures in both ends and the air was removed out of the tubing. The dialysis tubing
was immersed into a basin filled with deionized water overnight in 4°C. Transfer the liquor to a
round bottom flask connected with rotary evaporator and set the water bath to 50°C to let the
liquor concentrate until the volume become around 30 mL(5 times concentrated).
3.2.2 Compositional Analysis of Hydrolysate
10 mL concentrated liquor was taken. pH was measured to calculate the amount of 72%
H2SO4 needed to bring the pH equals to the pH of 4% H2SO4. The liquor and that amount of
72% H2SO4 were transferred to pressure tube to autoclave at 121°C for 1 hour. 1 mL of the
autoclaved solution was filtered by 0.22 mm microfilter and transferred to HPLC vial. Five
standard solutions of D(+)glucose, D(+)xylose, L(+) arabinose with concentration gradient
were prepared and injected with the samples at the same time and the peak area of the demand
ingredients in chromatogram were integrated to calculate sugar concentrations.

29
3.2.3 Hydrolysate NMR Profiling
10mL concentrated sample was taken and filled into five 2 mL sarstedt tubes,
lyophilized overnight. One of those tubes was taken and 100 µL deionized water was added to
dissolve the dried hydrolysate, then 900 µL DMSO-d6 was added to vortex. The mixture was
injected to a 5 mm diameter x 8” length NMR tube. The HSQC 2D NMR instrument is a Varian
600 MHz superconducting NMR-Spectrometer operating at 599.892 MHz interfaced with a
Sun Microsystems Ultra2 UNIX console, capable for probes pretuned for 1H,
13C, and
15N.
HSQC spectrum was acquired in 14 hours [53]. The 1H NMR experiments were using the same
instrument as HSQC 2D NMR and the spectrum were obtained in 10 minutes.
3.2.4 SEC Study on Hydrolysate
0.5 mL of concentrated liquor was combined with 0.5 mL mobile phase and injected to
HPLC sample vial. The size exclusion chromatography utilizes 0.1 M sodium nitrate and 0.01
M sodium hydroxide solution as the mobile phase. The column is Waters ultrahydrogel 250
column, 6 µm, 7.8 x 300 mm, which is applicable for molecular weight range from 1,000 Da to
80,000 Da. The experimental condition is 20 µL injection and 0.6 mL/min flow rate with both
detectors of Refractive Index Detector and UV Diode Array Detector. Six standard 2 g/L
dextran solutions are utilized and the apparent molecular weights are 1,000, 5,000, 12,000,
25,000, 50,000 and 80,000 Da. A calibration curve was set up and the apparent molecular
weight distribution of the sample was calculated via the calibration curve.
30
3.3 RESULTS AND DISCUSSION
3.3.1 Compositional Analysis of Hydrolysate
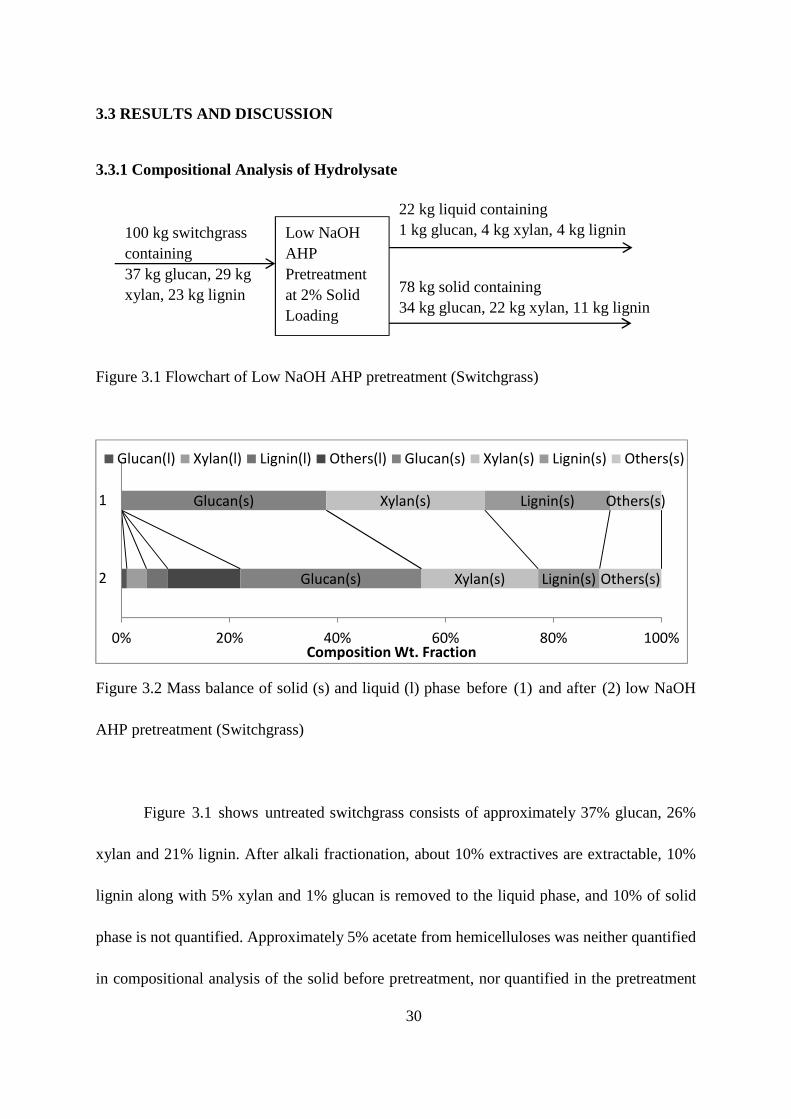
Figure 3.1 Flowchart of Low NaOH AHP pretreatment (Switchgrass)
Figure 3.2 Mass balance of solid (s) and liquid (l) phase before (1) and after (2) low NaOH
AHP pretreatment (Switchgrass)
Figure 3.1 shows untreated switchgrass consists of approximately 37% glucan, 26%
xylan and 21% lignin. After alkali fractionation, about 10% extractives are extractable, 10%
lignin along with 5% xylan and 1% glucan is removed to the liquid phase, and 10% of solid
phase is not quantified. Approximately 5% acetate from hemicelluloses was neither quantified
in compositional analysis of the solid before pretreatment, nor quantified in the pretreatment
Glucan(s)
Glucan(s)
Xylan(s)
Xylan(s)
Lignin(s)
Lignin(s)
Others(s)
Others(s)
0% 20% 40% 60% 80% 100%
2
1
Composition Wt. Fraction
Glucan(l) Xylan(l) Lignin(l) Others(l) Glucan(s) Xylan(s) Lignin(s) Others(s)
100 kg switchgrass containing 37 kg glucan, 29 kg xylan, 23 kg lignin
Low NaOH AHP Pretreatment at 2% Solid Loading
22 kg liquid containing 1 kg glucan, 4 kg xylan, 4 kg lignin
78 kg solid containing 34 kg glucan, 22 kg xylan, 11 kg lignin
31
liquor due to the removal of low molecular weight compounds during dialysis. The glucan in
the liquid phase could be derived from either the minor cell wall components such as starch,
sucrose or xyloglucan hemicellulose.
Different pretreatments have diverse decomposition products in hydrolysates.
Literatures showed during ammonia fiber expansion (AFEX) and dilute acid pretreatment of
corn stover, water soluble decomposition products were identified by LC/MS and GC/MS
including carboxylic acids, furans, carbohydrates, lignin derived aromatics [74]. Those
compounds in hydrolysate have different impacts on fermentation. AFEX pretreated biomass
is fermentable with no detoxification or external nutrient supplementation necessary. Dilute
acid pretreatment forms furans in high severity conditions as considered fermentation
inhibitors. Unlike these, alkali pretreatment significantly fractionates lignin and hemicelluloses
into solution as recoverable polymers, which are further quantified by SEC in 3.3.4.
32
3.3.2 Hydrolysate NMR Profiling
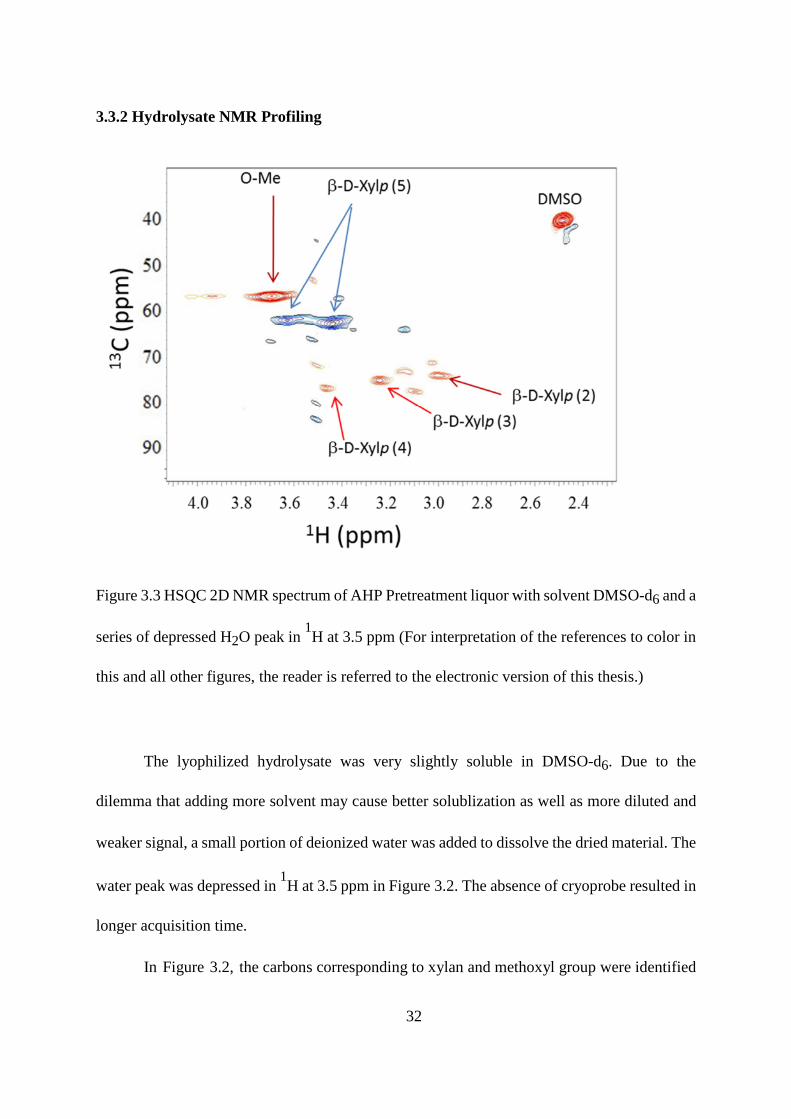
Figure 3.3 HSQC 2D NMR spectrum of AHP Pretreatment liquor with solvent DMSO-d6 and a
series of depressed H2O peak in 1H at 3.5 ppm (For interpretation of the references to color in
this and all other figures, the reader is referred to the electronic version of this thesis.)
The lyophilized hydrolysate was very slightly soluble in DMSO-d6. Due to the
dilemma that adding more solvent may cause better solublization as well as more diluted and
weaker signal, a small portion of deionized water was added to dissolve the dried material. The
water peak was depressed in 1H at 3.5 ppm in Figure 3.2. The absence of cryoprobe resulted in
longer acquisition time.
In Figure 3.2, the carbons corresponding to xylan and methoxyl group were identified
33
according to Kim et al. [52]. Three hydrogen atoms each located at β-D-Xylp (2), (3), and (4)
have the same carbon atom shift with different hydrogen shifts. Two hydrogen atoms at
β-D-Xylp (5) have the same carbon atom shift with different hydrogen shifts. β-D-Xylp (1)
have one unique carbon and hydrogen shift. The methoxyl group peak shown in hydrolysate is
either in lignin or 4-O-methyl-glucuronoxylan, which is consistent with the significantly
reduction signal of methoxyl group shown in Figure 2.7, the solid-state 13
C NMR result of
residual cell wall.
3.2.3 1H NMR characterization of Hydrolysate
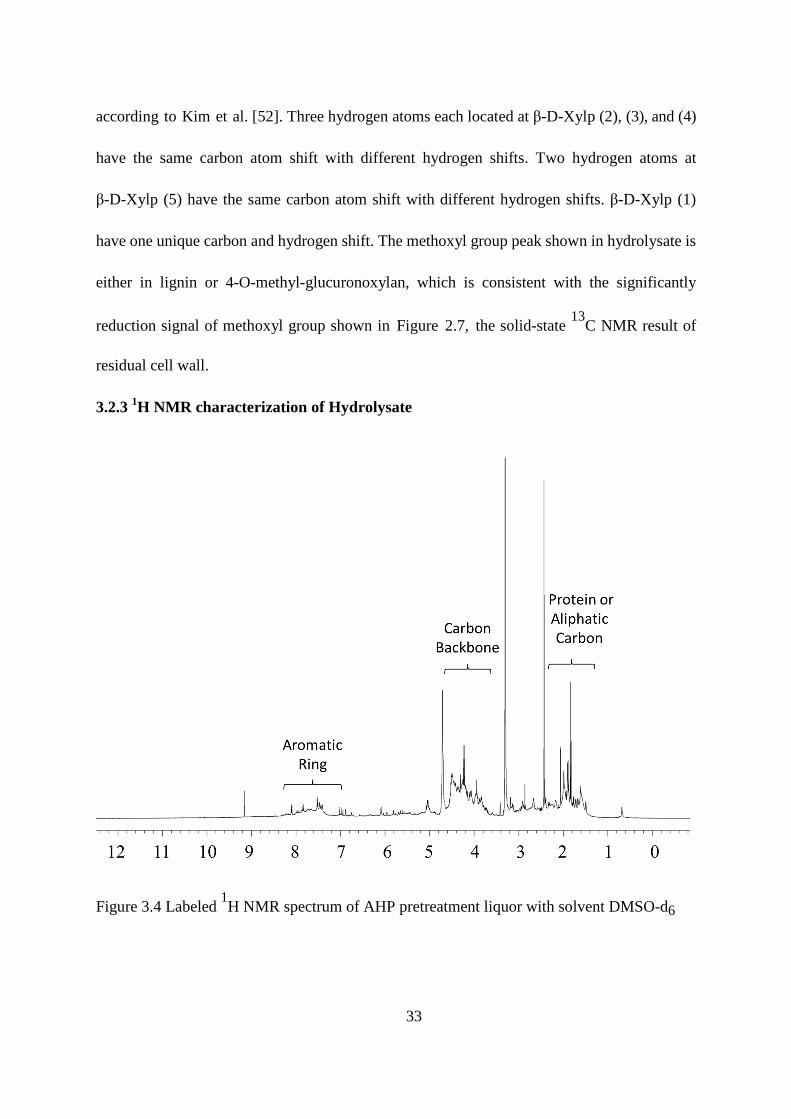
Figure 3.4 Labeled 1H NMR spectrum of AHP pretreatment liquor with solvent DMSO-d6
34
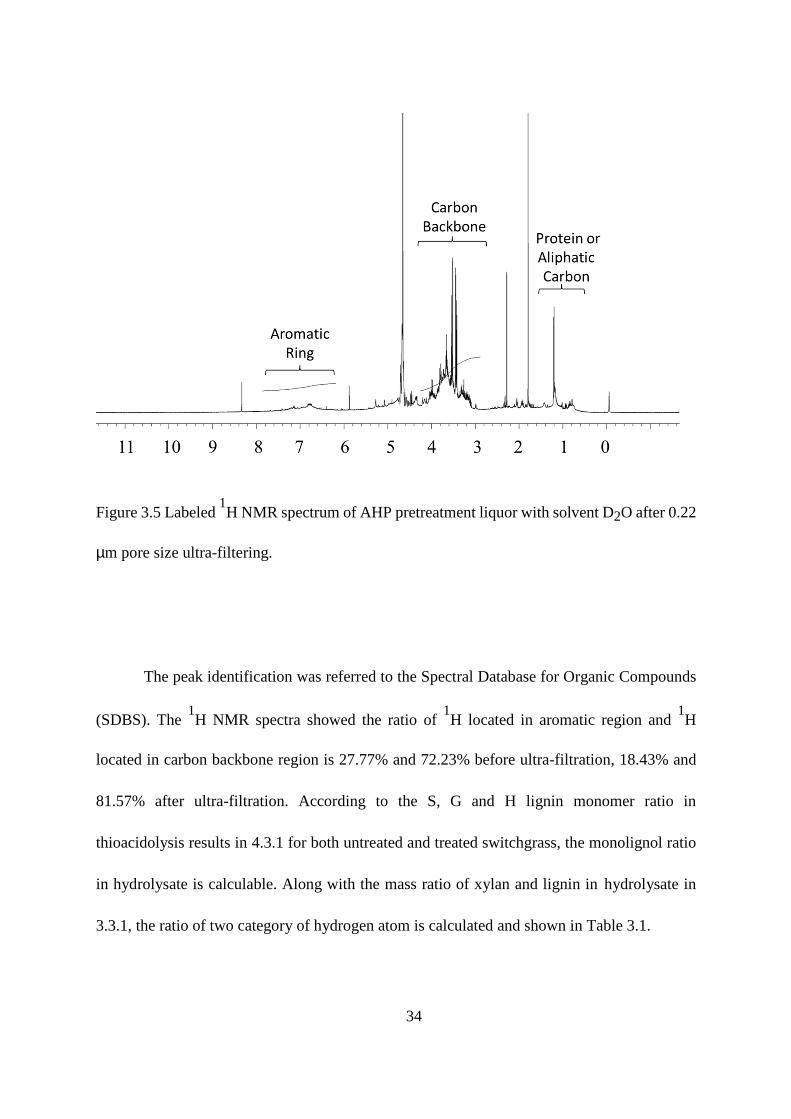
Figure 3.5 Labeled 1H NMR spectrum of AHP pretreatment liquor with solvent D2O after 0.22
µm pore size ultra-filtering.
The peak identification was referred to the Spectral Database for Organic Compounds
(SDBS). The 1H NMR spectra showed the ratio of
1H located in aromatic region and
1H
located in carbon backbone region is 27.77% and 72.23% before ultra-filtration, 18.43% and
81.57% after ultra-filtration. According to the S, G and H lignin monomer ratio in
thioacidolysis results in 4.3.1 for both untreated and treated switchgrass, the monolignol ratio
in hydrolysate is calculable. Along with the mass ratio of xylan and lignin in hydrolysate in
3.3.1, the ratio of two category of hydrogen atom is calculated and shown in Table 3.1.
35
Aromatic
H # (Ha)
Backbone
H # (Hb)
Mass Ratio
Average M.W.
Molar Ratio (f) Ha x f Hb x f
H Lignin 5 5 0.120 150 0.013 0.067 0.067 G Lignin 3 7 0.429 180 0.395 1.185 2.764 S Lignin 2 10 0.080 210 0.063 0.126 0.629 Xylan 0 5 0.480 150 0.529 0.000 2.645
Sum: 1.377 6.104 Ratio: 18.41% 81.59%
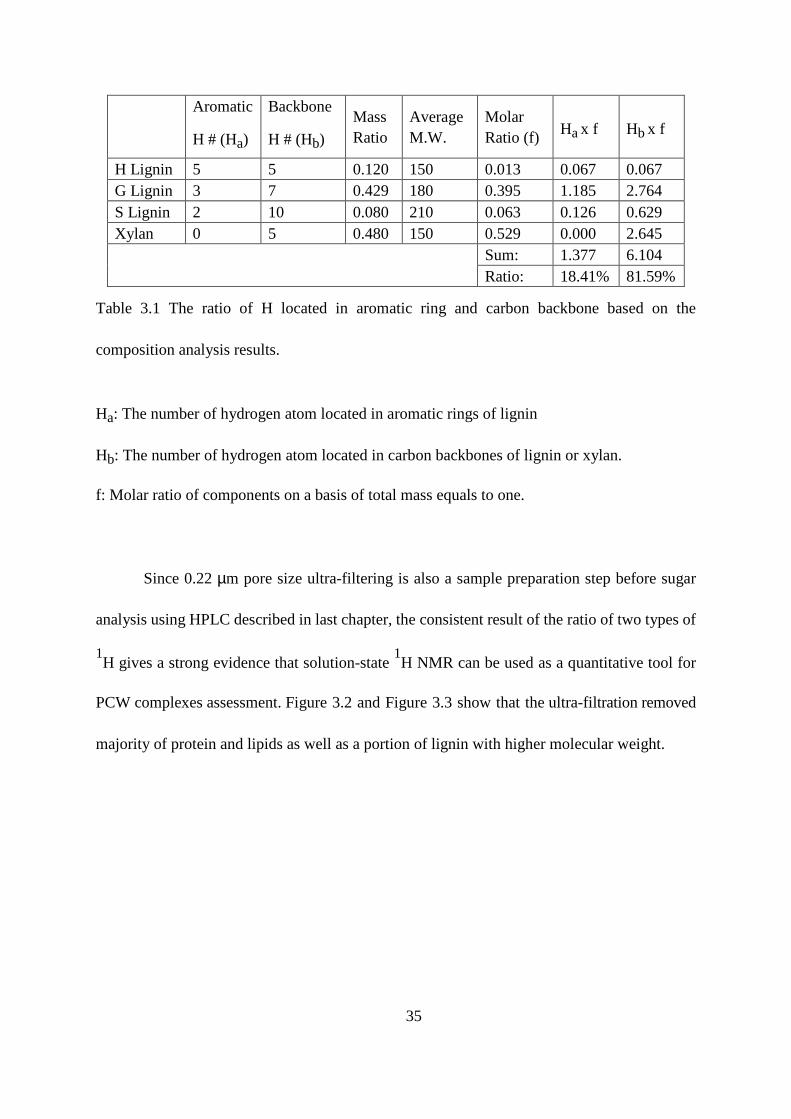
Table 3.1 The ratio of H located in aromatic ring and carbon backbone based on the
composition analysis results.
Ha: The number of hydrogen atom located in aromatic rings of lignin
Hb: The number of hydrogen atom located in carbon backbones of lignin or xylan.
f: Molar ratio of components on a basis of total mass equals to one.
Since 0.22 µm pore size ultra-filtering is also a sample preparation step before sugar
analysis using HPLC described in last chapter, the consistent result of the ratio of two types of
1H gives a strong evidence that solution-state
1H NMR can be used as a quantitative tool for
PCW complexes assessment. Figure 3.2 and Figure 3.3 show that the ultra-filtration removed
majority of protein and lipids as well as a portion of lignin with higher molecular weight.
36
3.3.4 SEC Study on Hydrolysate
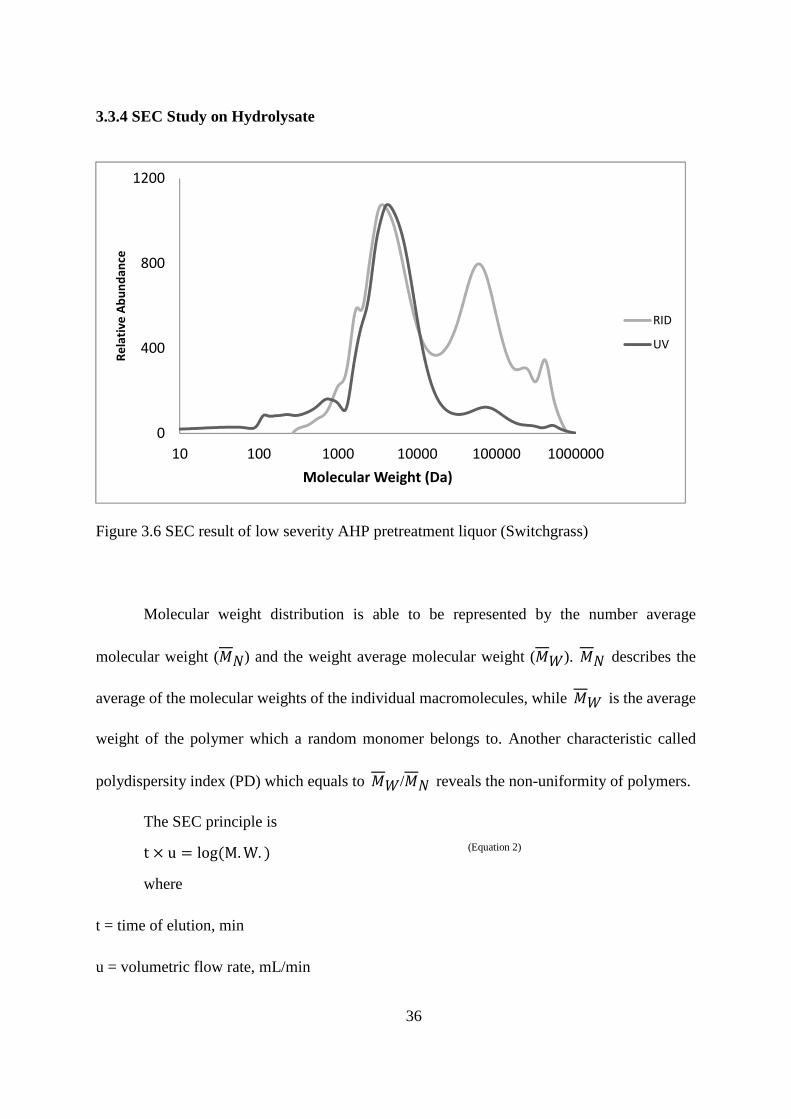
Figure 3.6 SEC result of low severity AHP pretreatment liquor (Switchgrass)
Molecular weight distribution is able to be represented by the number average
molecular weight (�) and the weight average molecular weight (�). � describes the
average of the molecular weights of the individual macromolecules, while � is the average
weight of the polymer which a random monomer belongs to. Another characteristic called
polydispersity index (PD) which equals to �/� reveals the non-uniformity of polymers.
The SEC principle is
t × u = log(M.W. ) (Equation 2)
where
t = time of elution, min
u = volumetric flow rate, mL/min
0
400
800
1200
10 100 1000 10000 100000 1000000
Re
lati
ve
Ab
un
da
nce
Molecular Weight (Da)
RID
UV
37
M.W. = molecular weight, Da
Number average molecular weight M� =∑����∑��
(Equation 3)
Weight average molecular weight M� = ∑�����
∑���� (Equation 4)
Polydispersity index PD = ∑�!
∑�"
(Equation 5)
where
#= molecular weight of an individual polymer, Da
$#=fraction of an individual polymer
Type of polymer MN (kDa) MW (kDa)
Polydispersity Index
Hemicellulose oligomers 4.7 7.0 1.48 Hemicellulose aggregations 64.5 88.4 1.37
Lignin 6.2 10.2 1.64
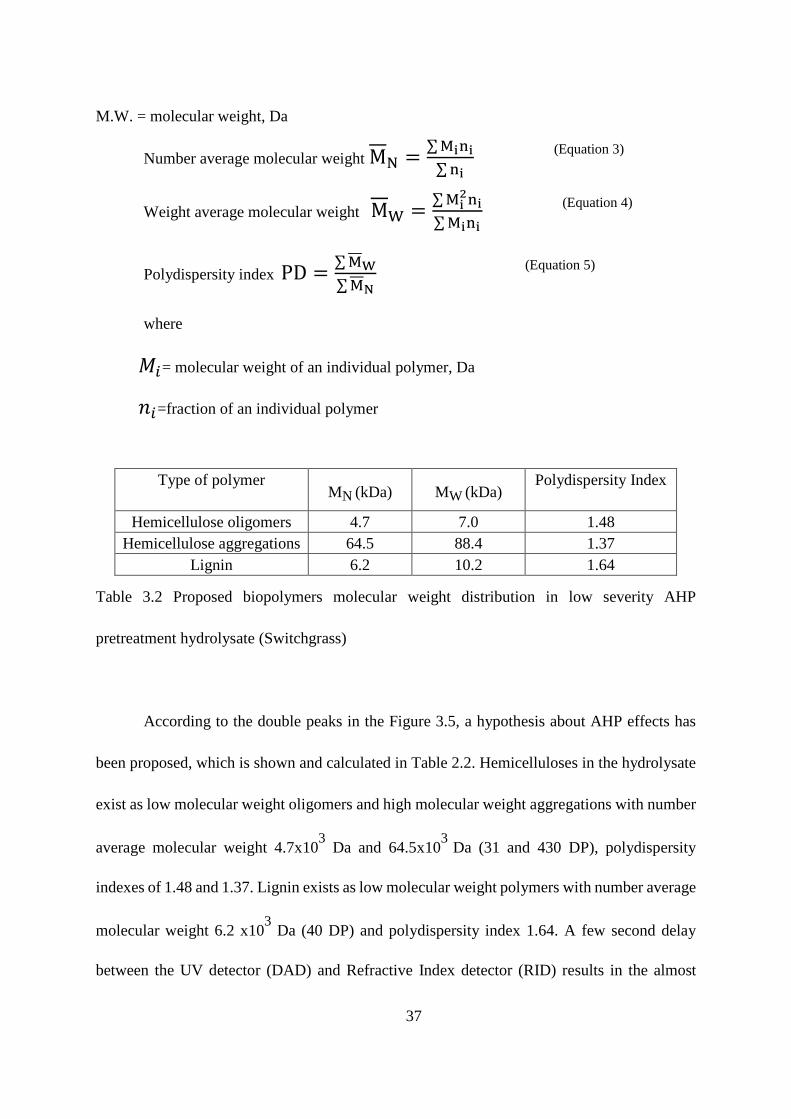
Table 3.2 Proposed biopolymers molecular weight distribution in low severity AHP
pretreatment hydrolysate (Switchgrass)
According to the double peaks in the Figure 3.5, a hypothesis about AHP effects has
been proposed, which is shown and calculated in Table 2.2. Hemicelluloses in the hydrolysate
exist as low molecular weight oligomers and high molecular weight aggregations with number
average molecular weight 4.7x10³ Da and 64.5x10
3 Da (31 and 430 DP), polydispersity
indexes of 1.48 and 1.37. Lignin exists as low molecular weight polymers with number average
molecular weight 6.2 x10³ Da (40 DP) and polydispersity index 1.64. A few second delay
between the UV detector (DAD) and Refractive Index detector (RID) results in the almost
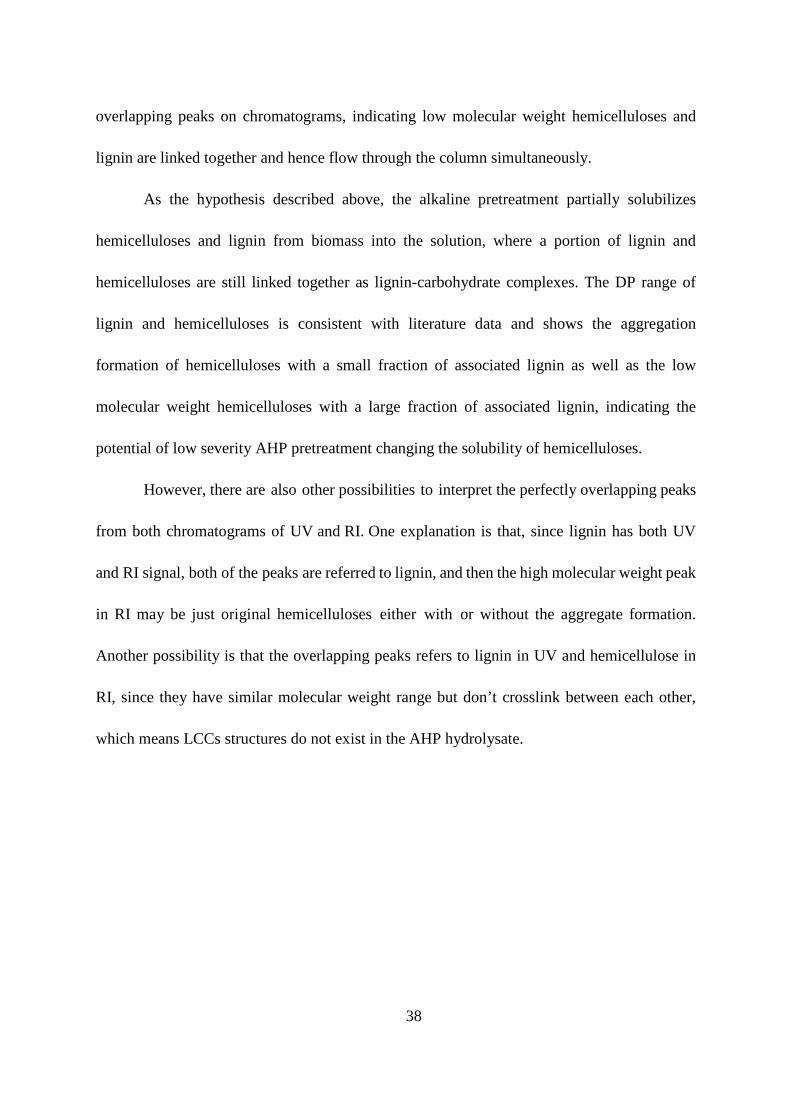
38
overlapping peaks on chromatograms, indicating low molecular weight hemicelluloses and
lignin are linked together and hence flow through the column simultaneously.
As the hypothesis described above, the alkaline pretreatment partially solubilizes
hemicelluloses and lignin from biomass into the solution, where a portion of lignin and
hemicelluloses are still linked together as lignin-carbohydrate complexes. The DP range of
lignin and hemicelluloses is consistent with literature data and shows the aggregation
formation of hemicelluloses with a small fraction of associated lignin as well as the low
molecular weight hemicelluloses with a large fraction of associated lignin, indicating the
potential of low severity AHP pretreatment changing the solubility of hemicelluloses.
However, there are also other possibilities to interpret the perfectly overlapping peaks
from both chromatograms of UV and RI. One explanation is that, since lignin has both UV
and RI signal, both of the peaks are referred to lignin, and then the high molecular weight peak
in RI may be just original hemicelluloses either with or without the aggregate formation.
Another possibility is that the overlapping peaks refers to lignin in UV and hemicellulose in
RI, since they have similar molecular weight range but don’t crosslink between each other,
which means LCCs structures do not exist in the AHP hydrolysate.
39
4. PHYSIOCHEMICAL CHARACTERIZATION OF LIGNIN
4.1 INTRODUCTION
Lignin as the most complicated compound plays a resistance role in plant cell wall
materials. It is a web structure composed of three types of p-hydroxycinnamyl alcohols
(monolignols) and up to 11 types of linkages [9]. Based on the number of methoxyl group on
the aromatic rings, the three monolignols are defined as p-coumaryl alcohol, coniferyl alcohol
and sinapyl alcohol. The linkages between lignin units are primarily labile β-O-4 and α-O-4
ether bonds and a smaller fraction of “C-C” including β–5, β–β, and 5–5 and biphenyl ether
including 4-O-5 and 5-O-4 bonds which are called condensed structure and resistant to
chemical degradation [75]. Lignin composition and structural organization in monocot grasses
are significantly different from herbaceous and woody dicots or gymnosperm lignins. Instead
of branched softwood lignins and β-O-4 linkage rich hardwood lignins, ferulates and
p-coumarate comprise a considerable fraction in grass lignins via ester crosslinks and makes
the lignin highly condensed with higher phenolic hydroxyl content [76], which increases the
solubilization of grass lignins in alkali [75]. Also, many alkali-labile esters bonds existing in
hemicelluloses such as diferulate ester is unique in grasses [77]. Those characteristics of grass
lignins yield high alkali solubility and make alkaline hydrogen peroxide pretreatment
well-suited to grasses.
Studies have shown strong negative correlation between lignin content and digestibility
of different types of biomass [78, 79], however, impacts of lignin composition on digestibility
are varied by type of biomass and types of pretreatments. During dilute acid hydrolysis of
40
woody biomass from the populus family, both lignin content and S/G ratio effects its sugar
yield, and slightly lower S/G ratio yield significantly higher rate of hydrolysis [80]. However,
after hot water pretreatment, sugar release was higher for natural populus with higher S/G
ratios [78]. For alfalfa biomass under dilute acid pretreatment, large differences in enzymatic
saccharification efficiencies were observed between various lines, and with those lines have
high H content, S/G ratio alone doesn’t correlate with sugar yield [79]. For arabidopsis tissue
after hot water pretreatment, cell walls with higher S/G ratio gave a much higher glucose yield
[81].
In order to obtain the detailed information of the lignin structure in biomass, different
methods can be used. Klason and ABSL described in the residual cell wall analysis chapter are
methods estimating the total lignin content. However, since lignin composition and structures
differ among softwood, hardwood and grasses, methods are being developed to determine the
ratio of monomers, the linkage composition and distribution. This chapter mainly discussed
two methods estimating the lignin composition. The first method called thioaciolysis is based
on the principle of cleaving the β-O-4 inter-unit linkage after lignin isolation from
polysaccharides by dioxane, then adding volatile groups on monolignols to test by GC/MS.
Since the β-O-4 content is varied by species and only composes 40% of grass lignin
crosslinkings, thioacidolysis usually yields only 10%-20% monolignols. Analytical pyrolysis
based on GC/MS is another direct method of lignin content measurement with advantages
including easy sample preparation, short analysis times and small sample sizes [82-84]. When
heating biomass at high temperature between 300 and 600°C in the absence of oxygen, the
carbohydrate molecules are rapidly depolymerized to anhydroglucose units that further react to
41
provide a tarry pyrolyzate [85]. Vapor phase cracking products were identified based on
GC/MS chromatogram and primary pyrolysis pathway was discussed by Evans et al [86].
Pyrolysis phenolic products are able to classify precursor lignins as either guaiacyl type or
syringyl type [87]. Correlations between pyrolysis lignin and Klason lignin content have been
analyzed in softwood and hardwood [82]. Among the major pyrolysis lignin product of
monocot grasses, 4-vinylphenol and 4-vinylguaiacol have been identified to be derived from
p-coumaric acid and ferulic acid residues [88].
4.2 MATERIALS AND METHODS
4.2.1 Thioacidolysis
Thioacidolysis is the method being used to estimate the H/G/S ratio of lignin based on
the cleavage of β-O-4 bond, which is to extract lignin using dioxane and add trymethylsilyl
groups to volatilize monolignols for GC/MS quantitative determination. The procedure is to
weigh 2 mg ball-milled biomass sample, react with 200 µL 2.5% BF3, 10% EtSH dioxane
solution at 100°C for 4 hours. After cooling down the sample, 150 µL 0.4 M sodium
bicarbonate, 10 µL tetracosane standard solution (5 mg/mL EtOH, internal standard), 1 mL
water and 0.5 mL EtOAc were added in sequence, then the samples were vortexred to separate
phases. 150 µL EtOH phase of each sample was transferred to GC/MS vial, then dried to
evaporate ethanol and washed with acetone for twice, followed by adding 400 µL EtOAc, 20
µL pyridine and 100 µL N-O-bis (trymethylsilyl) acetamide to react at room temperature for 2
hours before sample injection to GC/MS. To get a quantitative result, 50 µL of 1 mg/mL
Bisphenol E was used as an internal standard before the 4-hour reaction, and 1000 µL dioxane
42
mixture was added to instead of 200 µL to complete the extraction.
4.2.2 Analytical Pyrolysis
Ball-milled control and pretreated samples 50-100 µg was pyrolyzed in a quartz tube in
a Pyroprobe 120 (Chemical Data Systems) at 600°C for 10 seconds using helium as the carrier
gas with a flow rate of 1 mL/min. The sample was carried onto a 60 m x 0.25 µm x 0.25 µm
Restek 1701 column fitted in a Shimadzu GCMS-QP5050 with a 100 split ratio. The
temperature was programmed to rise from 40°C to a final temperature of 260°C at 8°C/min, and
held at that temperature for a total run time of 35 minutes.
43
4.3 RESULTS AND DISCUSSIONS
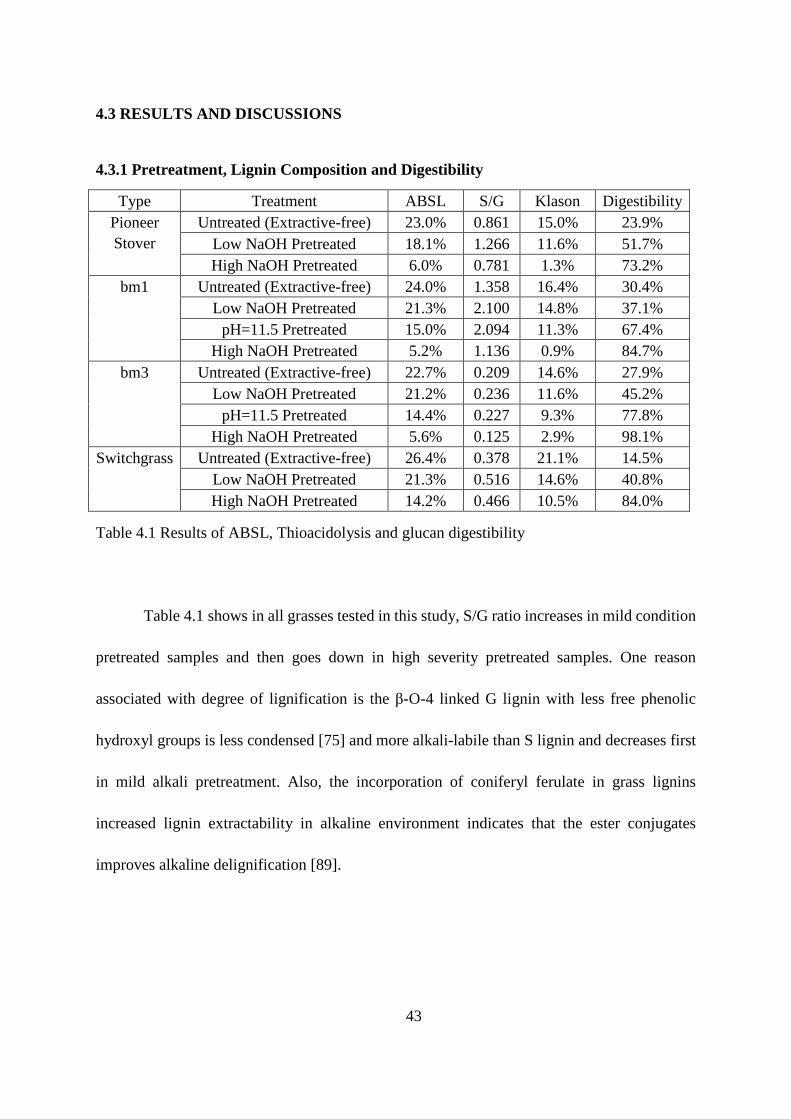
4.3.1 Pretreatment, Lignin Composition and Digestibility
Type Treatment ABSL S/G Klason Digestibility Pioneer Stover
Untreated (Extractive-free) 23.0% 0.861 15.0% 23.9% Low NaOH Pretreated 18.1% 1.266 11.6% 51.7% High NaOH Pretreated 6.0% 0.781 1.3% 73.2%
bm1 Untreated (Extractive-free) 24.0% 1.358 16.4% 30.4% Low NaOH Pretreated 21.3% 2.100 14.8% 37.1%
pH=11.5 Pretreated 15.0% 2.094 11.3% 67.4% High NaOH Pretreated 5.2% 1.136 0.9% 84.7%
bm3 Untreated (Extractive-free) 22.7% 0.209 14.6% 27.9% Low NaOH Pretreated 21.2% 0.236 11.6% 45.2%
pH=11.5 Pretreated 14.4% 0.227 9.3% 77.8% High NaOH Pretreated 5.6% 0.125 2.9% 98.1%
Switchgrass Untreated (Extractive-free) 26.4% 0.378 21.1% 14.5% Low NaOH Pretreated 21.3% 0.516 14.6% 40.8% High NaOH Pretreated 14.2% 0.466 10.5% 84.0%
Table 4.1 Results of ABSL, Thioacidolysis and glucan digestibility
Table 4.1 shows in all grasses tested in this study, S/G ratio increases in mild condition
pretreated samples and then goes down in high severity pretreated samples. One reason
associated with degree of lignification is the β-O-4 linked G lignin with less free phenolic
hydroxyl groups is less condensed [75] and more alkali-labile than S lignin and decreases first
in mild alkali pretreatment. Also, the incorporation of coniferyl ferulate in grass lignins
increased lignin extractability in alkaline environment indicates that the ester conjugates
improves alkaline delignification [89].
44
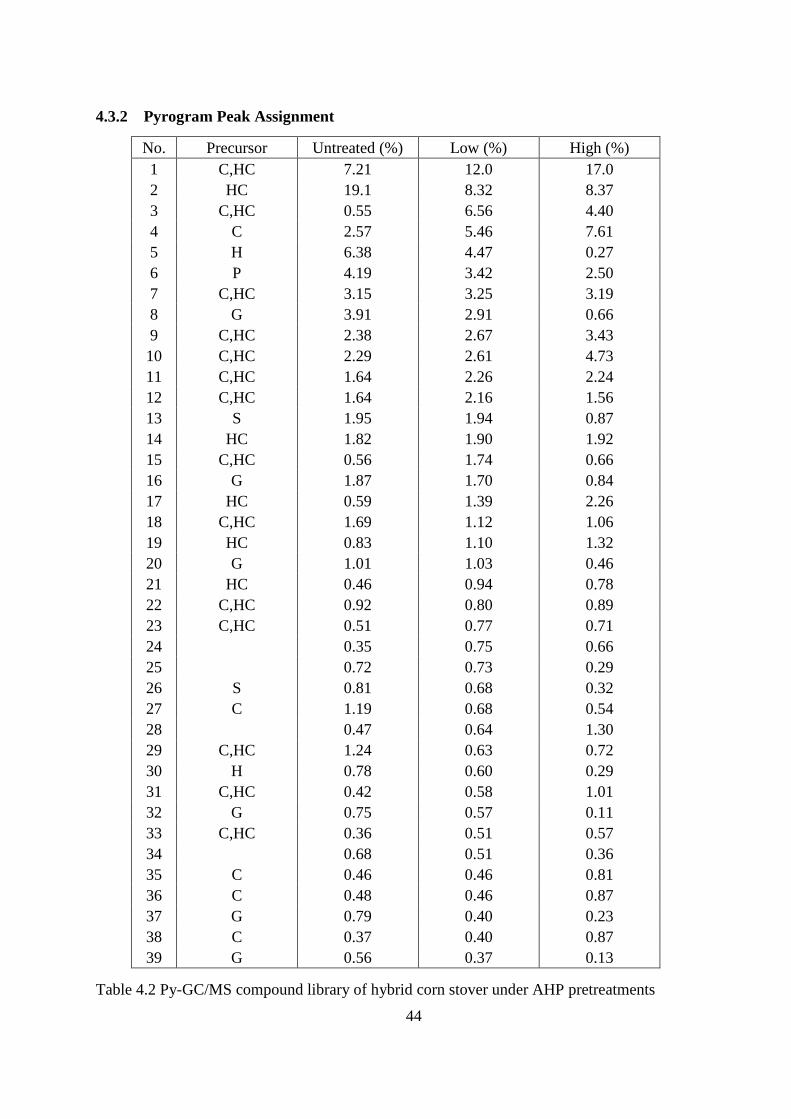
4.3.2 Pyrogram Peak Assignment
No. Precursor Untreated (%) Low (%) High (%) 1 C,HC 7.21 12.0 17.0 2 HC 19.1 8.32 8.37 3 C,HC 0.55 6.56 4.40 4 C 2.57 5.46 7.61 5 H 6.38 4.47 0.27 6 P 4.19 3.42 2.50 7 C,HC 3.15 3.25 3.19 8 G 3.91 2.91 0.66 9 C,HC 2.38 2.67 3.43 10 C,HC 2.29 2.61 4.73 11 C,HC 1.64 2.26 2.24 12 C,HC 1.64 2.16 1.56 13 S 1.95 1.94 0.87 14 HC 1.82 1.90 1.92 15 C,HC 0.56 1.74 0.66 16 G 1.87 1.70 0.84 17 HC 0.59 1.39 2.26 18 C,HC 1.69 1.12 1.06 19 HC 0.83 1.10 1.32 20 G 1.01 1.03 0.46 21 HC 0.46 0.94 0.78 22 C,HC 0.92 0.80 0.89 23 C,HC 0.51 0.77 0.71 24 0.35 0.75 0.66 25 0.72 0.73 0.29 26 S 0.81 0.68 0.32 27 C 1.19 0.68 0.54 28 0.47 0.64 1.30 29 C,HC 1.24 0.63 0.72 30 H 0.78 0.60 0.29 31 C,HC 0.42 0.58 1.01 32 G 0.75 0.57 0.11 33 C,HC 0.36 0.51 0.57 34 0.68 0.51 0.36 35 C 0.46 0.46 0.81 36 C 0.48 0.46 0.87 37 G 0.79 0.40 0.23 38 C 0.37 0.40 0.87 39 G 0.56 0.37 0.13
Table 4.2 Py-GC/MS compound library of hybrid corn stover under AHP pretreatments
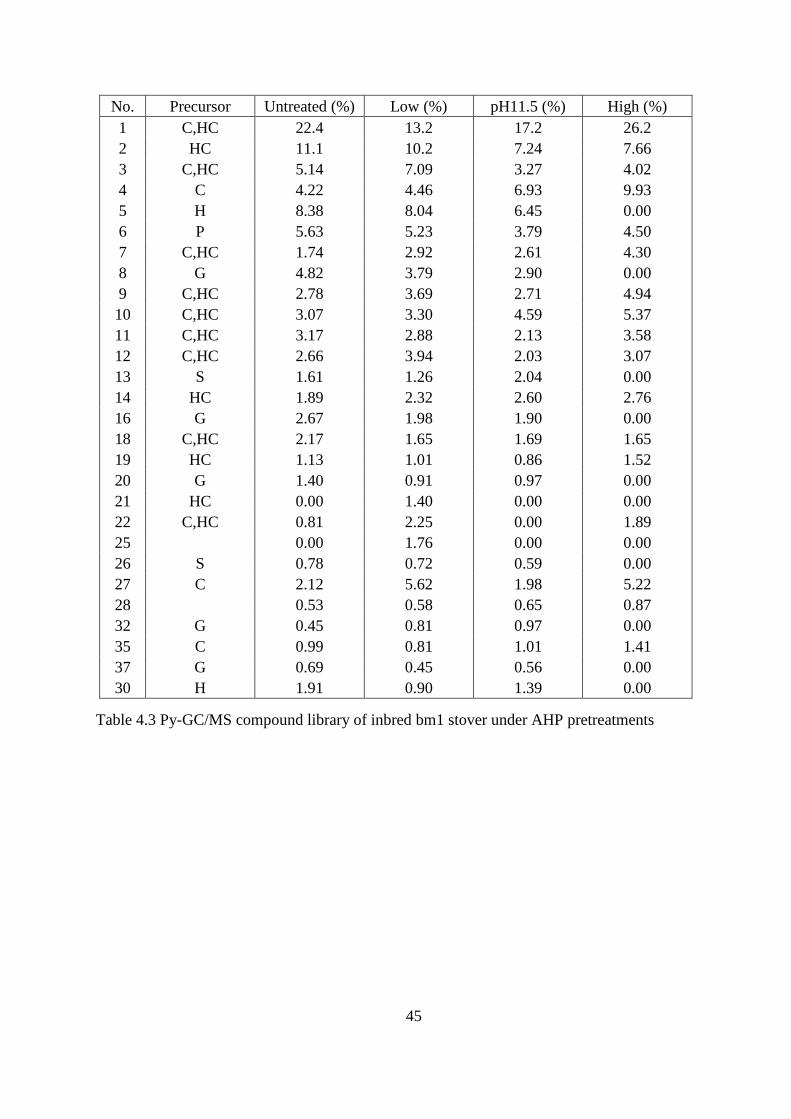
45
No. Precursor Untreated (%) Low (%) pH11.5 (%) High (%) 1 C,HC 22.4 13.2 17.2 26.2 2 HC 11.1 10.2 7.24 7.66 3 C,HC 5.14 7.09 3.27 4.02 4 C 4.22 4.46 6.93 9.93 5 H 8.38 8.04 6.45 0.00 6 P 5.63 5.23 3.79 4.50 7 C,HC 1.74 2.92 2.61 4.30 8 G 4.82 3.79 2.90 0.00 9 C,HC 2.78 3.69 2.71 4.94 10 C,HC 3.07 3.30 4.59 5.37 11 C,HC 3.17 2.88 2.13 3.58 12 C,HC 2.66 3.94 2.03 3.07 13 S 1.61 1.26 2.04 0.00 14 HC 1.89 2.32 2.60 2.76 16 G 2.67 1.98 1.90 0.00 18 C,HC 2.17 1.65 1.69 1.65 19 HC 1.13 1.01 0.86 1.52 20 G 1.40 0.91 0.97 0.00 21 HC 0.00 1.40 0.00 0.00 22 C,HC 0.81 2.25 0.00 1.89 25 0.00 1.76 0.00 0.00 26 S 0.78 0.72 0.59 0.00 27 C 2.12 5.62 1.98 5.22 28 0.53 0.58 0.65 0.87 32 G 0.45 0.81 0.97 0.00 35 C 0.99 0.81 1.01 1.41 37 G 0.69 0.45 0.56 0.00 30 H 1.91 0.90 1.39 0.00
Table 4.3 Py-GC/MS compound library of inbred bm1 stover under AHP pretreatments
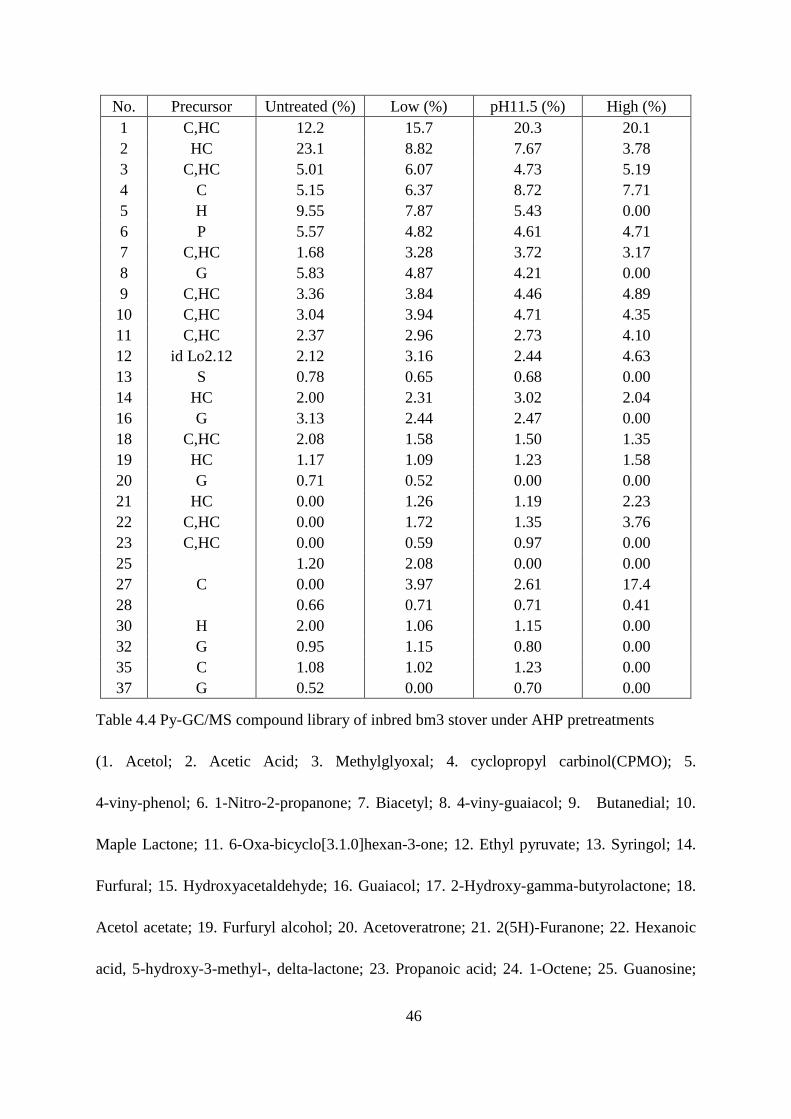
46
No. Precursor Untreated (%) Low (%) pH11.5 (%) High (%) 1 C,HC 12.2 15.7 20.3 20.1 2 HC 23.1 8.82 7.67 3.78 3 C,HC 5.01 6.07 4.73 5.19 4 C 5.15 6.37 8.72 7.71 5 H 9.55 7.87 5.43 0.00 6 P 5.57 4.82 4.61 4.71 7 C,HC 1.68 3.28 3.72 3.17 8 G 5.83 4.87 4.21 0.00 9 C,HC 3.36 3.84 4.46 4.89 10 C,HC 3.04 3.94 4.71 4.35 11 C,HC 2.37 2.96 2.73 4.10 12 id Lo2.12 2.12 3.16 2.44 4.63 13 S 0.78 0.65 0.68 0.00 14 HC 2.00 2.31 3.02 2.04 16 G 3.13 2.44 2.47 0.00 18 C,HC 2.08 1.58 1.50 1.35 19 HC 1.17 1.09 1.23 1.58 20 G 0.71 0.52 0.00 0.00 21 HC 0.00 1.26 1.19 2.23 22 C,HC 0.00 1.72 1.35 3.76 23 C,HC 0.00 0.59 0.97 0.00 25 1.20 2.08 0.00 0.00 27 C 0.00 3.97 2.61 17.4 28 0.66 0.71 0.71 0.41 30 H 2.00 1.06 1.15 0.00 32 G 0.95 1.15 0.80 0.00 35 C 1.08 1.02 1.23 0.00 37 G 0.52 0.00 0.70 0.00
Table 4.4 Py-GC/MS compound library of inbred bm3 stover under AHP pretreatments
(1. Acetol; 2. Acetic Acid; 3. Methylglyoxal; 4. cyclopropyl carbinol(CPMO); 5.
4-viny-phenol; 6. 1-Nitro-2-propanone; 7. Biacetyl; 8. 4-viny-guaiacol; 9. Butanedial; 10.
Maple Lactone; 11. 6-Oxa-bicyclo[3.1.0]hexan-3-one; 12. Ethyl pyruvate; 13. Syringol; 14.
Furfural; 15. Hydroxyacetaldehyde; 16. Guaiacol; 17. 2-Hydroxy-gamma-butyrolactone; 18.
Acetol acetate; 19. Furfuryl alcohol; 20. Acetoveratrone; 21. 2(5H)-Furanone; 22. Hexanoic
acid, 5-hydroxy-3-methyl-, delta-lactone; 23. Propanoic acid; 24. 1-Octene; 25. Guanosine;
47
26. Methoxyeugenol; 27. Levoglucosan; 28. 3-ethyl-2-hydroxy-2-Cyclopenten-1-one; 29.
Butanone 30. Phenol; 31. Butyrolactone; 32. Creosol; 33. Acetylpropionyl; 34. Propylene
Carbonate; 35. 3-methyl-2-Cyclopenten-1-one; 36. 2-Propanol,1-isopropoxy; 37.
p-Ethylguaiacol; 38. (S)-(+)-2',3'-Dideoxyribonolactone; 39. (E)-Isoeugenol)
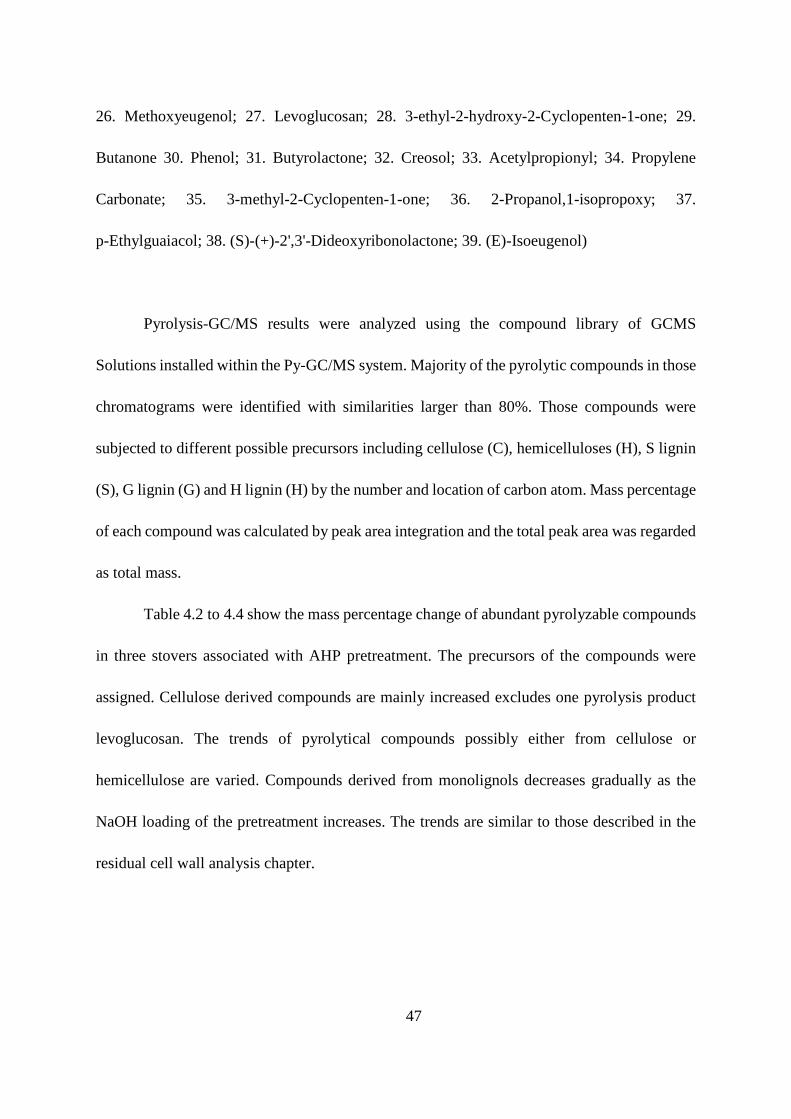
Pyrolysis-GC/MS results were analyzed using the compound library of GCMS
Solutions installed within the Py-GC/MS system. Majority of the pyrolytic compounds in those
chromatograms were identified with similarities larger than 80%. Those compounds were
subjected to different possible precursors including cellulose (C), hemicelluloses (H), S lignin
(S), G lignin (G) and H lignin (H) by the number and location of carbon atom. Mass percentage
of each compound was calculated by peak area integration and the total peak area was regarded
as total mass.
Table 4.2 to 4.4 show the mass percentage change of abundant pyrolyzable compounds
in three stovers associated with AHP pretreatment. The precursors of the compounds were
assigned. Cellulose derived compounds are mainly increased excludes one pyrolysis product
levoglucosan. The trends of pyrolytical compounds possibly either from cellulose or
hemicellulose are varied. Compounds derived from monolignols decreases gradually as the
NaOH loading of the pretreatment increases. The trends are similar to those described in the
residual cell wall analysis chapter.
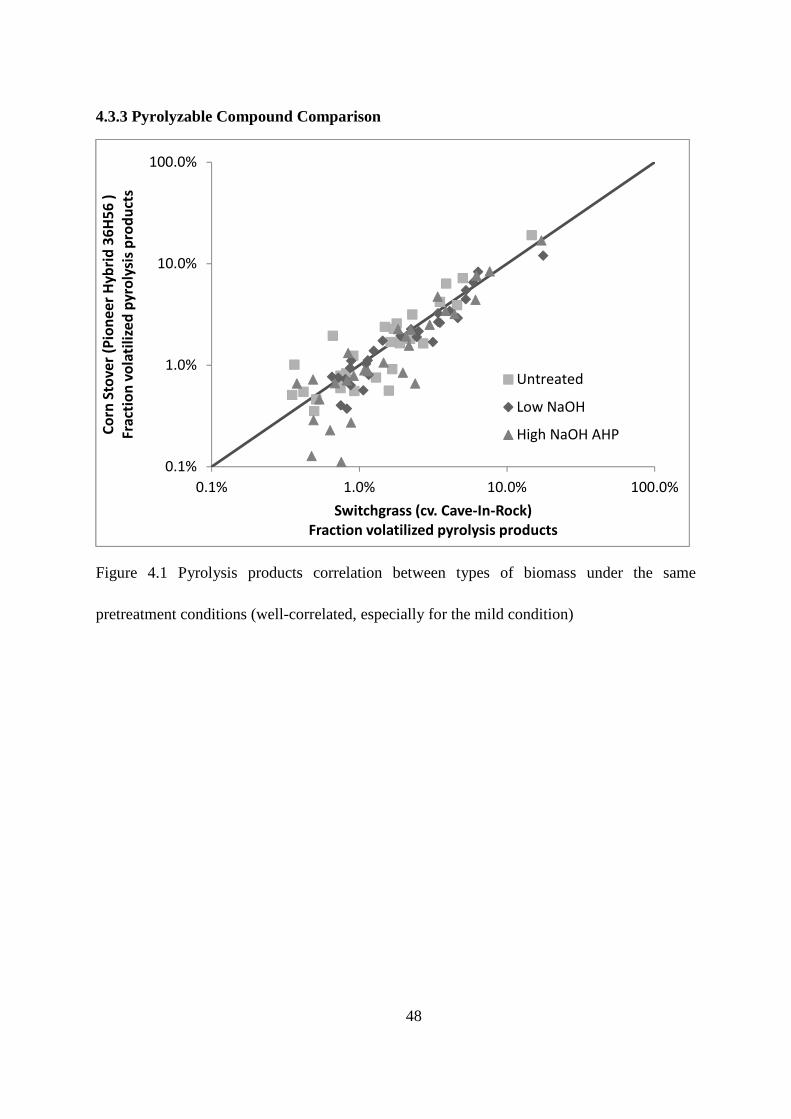
48
4.3.3 Pyrolyzable Compound Comparison
Figure 4.1 Pyrolysis products correlation between types of biomass under the same
pretreatment conditions (well-correlated, especially for the mild condition)
0.1%
1.0%
10.0%
100.0%
0.1% 1.0% 10.0% 100.0%
Co
rn S
tov
er
(Pio
ne
er
Hy
bri
d 3
6H
56
)
Fra
ctio
n v
ola
tili
zed
py
roly
sis
pro
du
cts
Switchgrass (cv. Cave-In-Rock)
Fraction volatilized pyrolysis products
Untreated
Low NaOH
High NaOH AHP
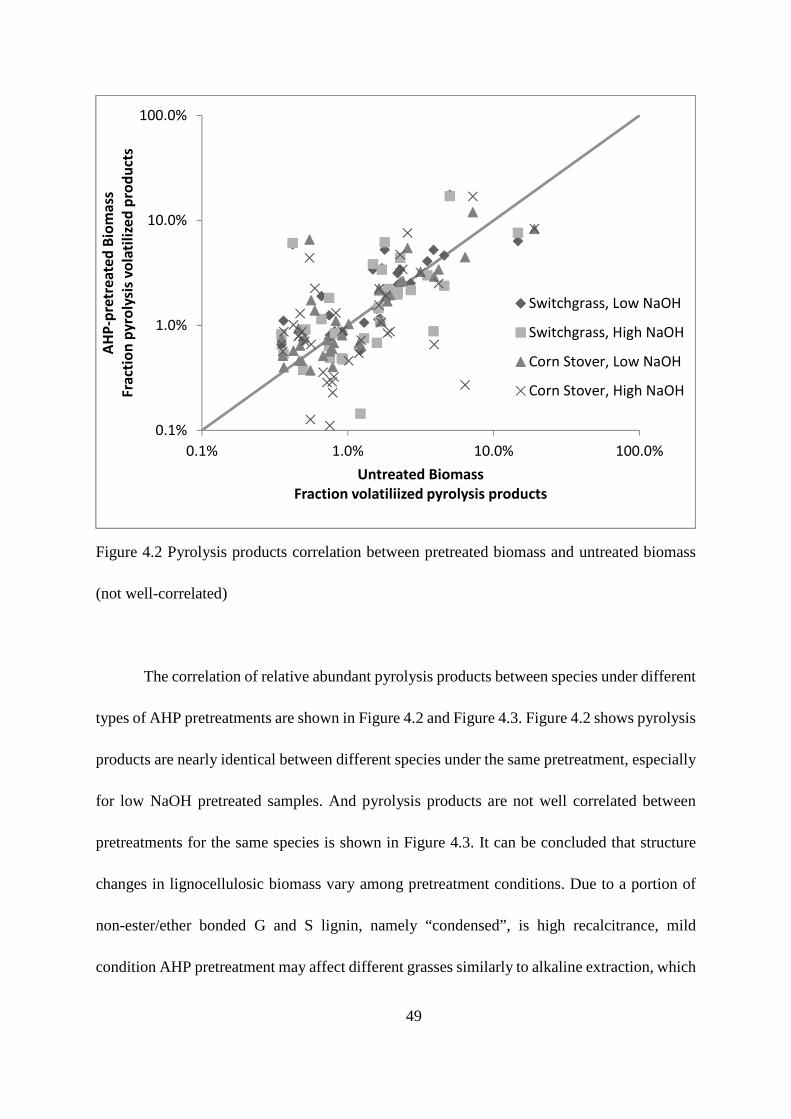
49
Figure 4.2 Pyrolysis products correlation between pretreated biomass and untreated biomass
(not well-correlated)
The correlation of relative abundant pyrolysis products between species under different
types of AHP pretreatments are shown in Figure 4.2 and Figure 4.3. Figure 4.2 shows pyrolysis
products are nearly identical between different species under the same pretreatment, especially
for low NaOH pretreated samples. And pyrolysis products are not well correlated between
pretreatments for the same species is shown in Figure 4.3. It can be concluded that structure
changes in lignocellulosic biomass vary among pretreatment conditions. Due to a portion of
non-ester/ether bonded G and S lignin, namely “condensed”, is high recalcitrance, mild
condition AHP pretreatment may affect different grasses similarly to alkaline extraction, which
0.1%
1.0%
10.0%
100.0%
0.1% 1.0% 10.0% 100.0%
AH
P-p
retr
ea
ted
Bio
ma
ss
Fra
ctio
n p
yro
lysi
s v
ola
tili
zed
pro
du
cts
Untreated Biomass
Fraction volatiliized pyrolysis products
Switchgrass, Low NaOH
Switchgrass, High NaOH
Corn Stover, Low NaOH
Corn Stover, High NaOH
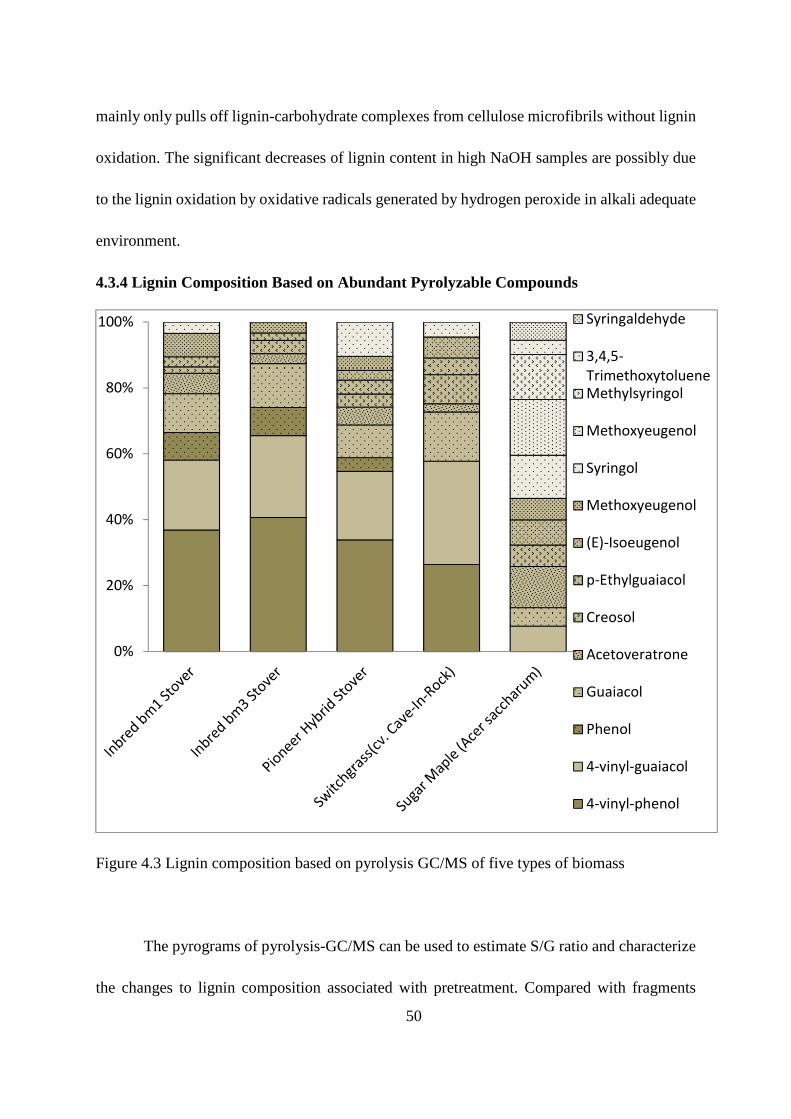
50
mainly only pulls off lignin-carbohydrate complexes from cellulose microfibrils without lignin
oxidation. The significant decreases of lignin content in high NaOH samples are possibly due
to the lignin oxidation by oxidative radicals generated by hydrogen peroxide in alkali adequate
environment.
4.3.4 Lignin Composition Based on Abundant Pyrolyzable Compounds
Figure 4.3 Lignin composition based on pyrolysis GC/MS of five types of biomass
The pyrograms of pyrolysis-GC/MS can be used to estimate S/G ratio and characterize
the changes to lignin composition associated with pretreatment. Compared with fragments
0%
20%
40%
60%
80%
100% Syringaldehyde
3,4,5-
TrimethoxytolueneMethylsyringol
Methoxyeugenol
Syringol
Methoxyeugenol
(E)-Isoeugenol
p-Ethylguaiacol
Creosol
Acetoveratrone
Guaiacol
Phenol
4-vinyl-guaiacol
4-vinyl-phenol
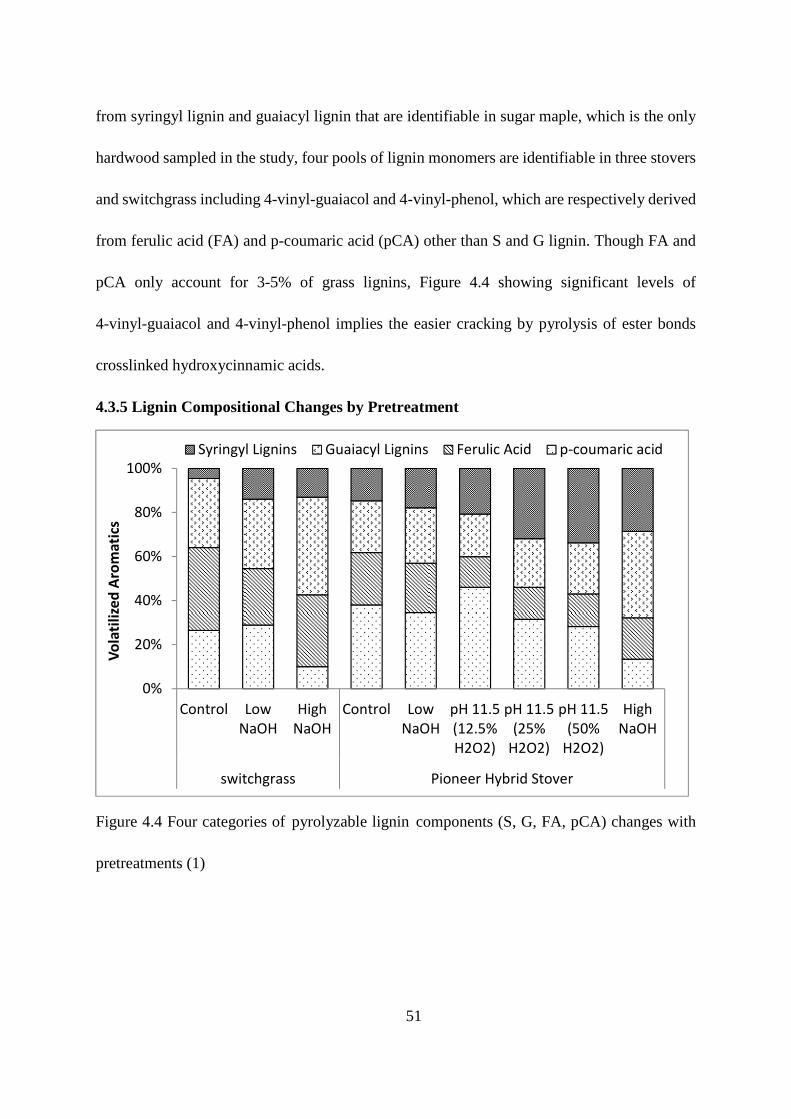
51
from syringyl lignin and guaiacyl lignin that are identifiable in sugar maple, which is the only
hardwood sampled in the study, four pools of lignin monomers are identifiable in three stovers
and switchgrass including 4-vinyl-guaiacol and 4-vinyl-phenol, which are respectively derived
from ferulic acid (FA) and p-coumaric acid (pCA) other than S and G lignin. Though FA and
pCA only account for 3-5% of grass lignins, Figure 4.4 showing significant levels of
4-vinyl-guaiacol and 4-vinyl-phenol implies the easier cracking by pyrolysis of ester bonds
crosslinked hydroxycinnamic acids.
4.3.5 Lignin Compositional Changes by Pretreatment
Figure 4.4 Four categories of pyrolyzable lignin components (S, G, FA, pCA) changes with
pretreatments (1)
0%
20%
40%
60%
80%
100%
Control Low
NaOH
High
NaOH
Control Low
NaOH
pH 11.5
(12.5%
H2O2)
pH 11.5
(25%
H2O2)
pH 11.5
(50%
H2O2)
High
NaOH
switchgrass Pioneer Hybrid Stover
Vo
lati
lize
d A
rom
ati
cs
Syringyl Lignins Guaiacyl Lignins Ferulic Acid p-coumaric acid
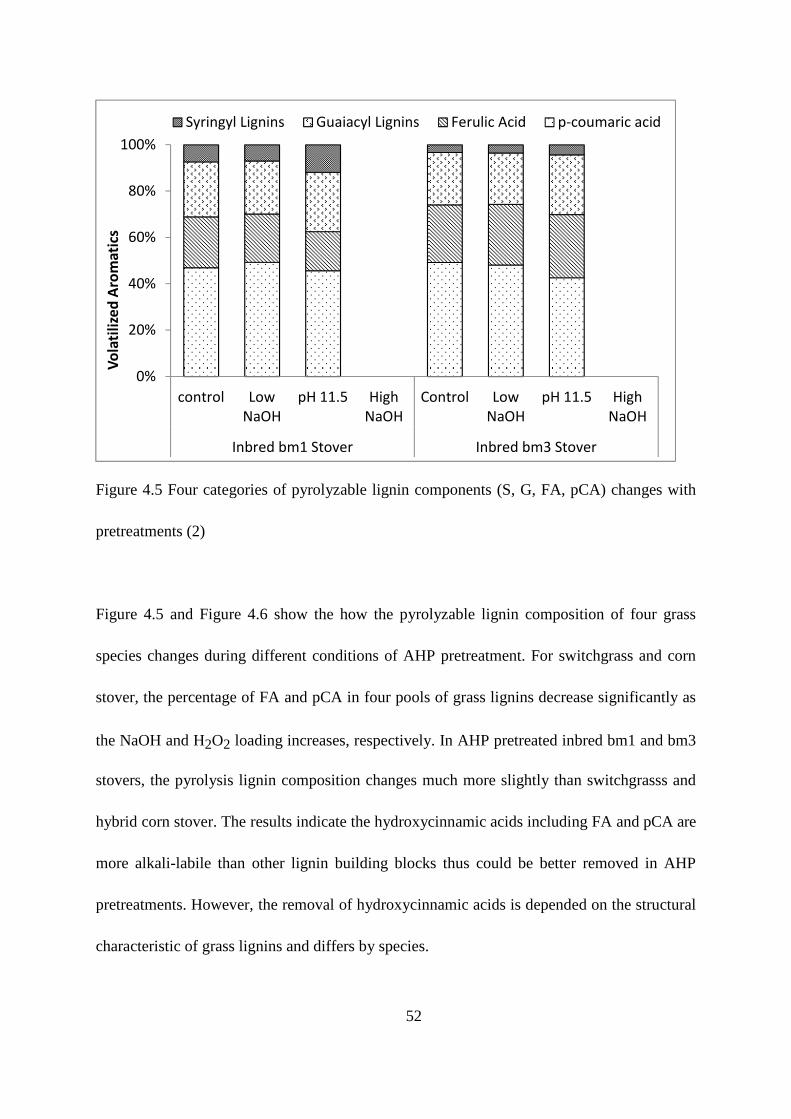
52
Figure 4.5 Four categories of pyrolyzable lignin components (S, G, FA, pCA) changes with
pretreatments (2)
Figure 4.5 and Figure 4.6 show the how the pyrolyzable lignin composition of four grass
species changes during different conditions of AHP pretreatment. For switchgrass and corn
stover, the percentage of FA and pCA in four pools of grass lignins decrease significantly as
the NaOH and H2O2 loading increases, respectively. In AHP pretreated inbred bm1 and bm3
stovers, the pyrolysis lignin composition changes much more slightly than switchgrasss and
hybrid corn stover. The results indicate the hydroxycinnamic acids including FA and pCA are
more alkali-labile than other lignin building blocks thus could be better removed in AHP
pretreatments. However, the removal of hydroxycinnamic acids is depended on the structural
characteristic of grass lignins and differs by species.
0%
20%
40%
60%
80%
100%
control Low
NaOH
pH 11.5 High
NaOH
Control Low
NaOH
pH 11.5 High
NaOH
Inbred bm1 Stover Inbred bm3 Stover
Vo
lati
lize
d A
rom
ati
csSyringyl Lignins Guaiacyl Lignins Ferulic Acid p-coumaric acid
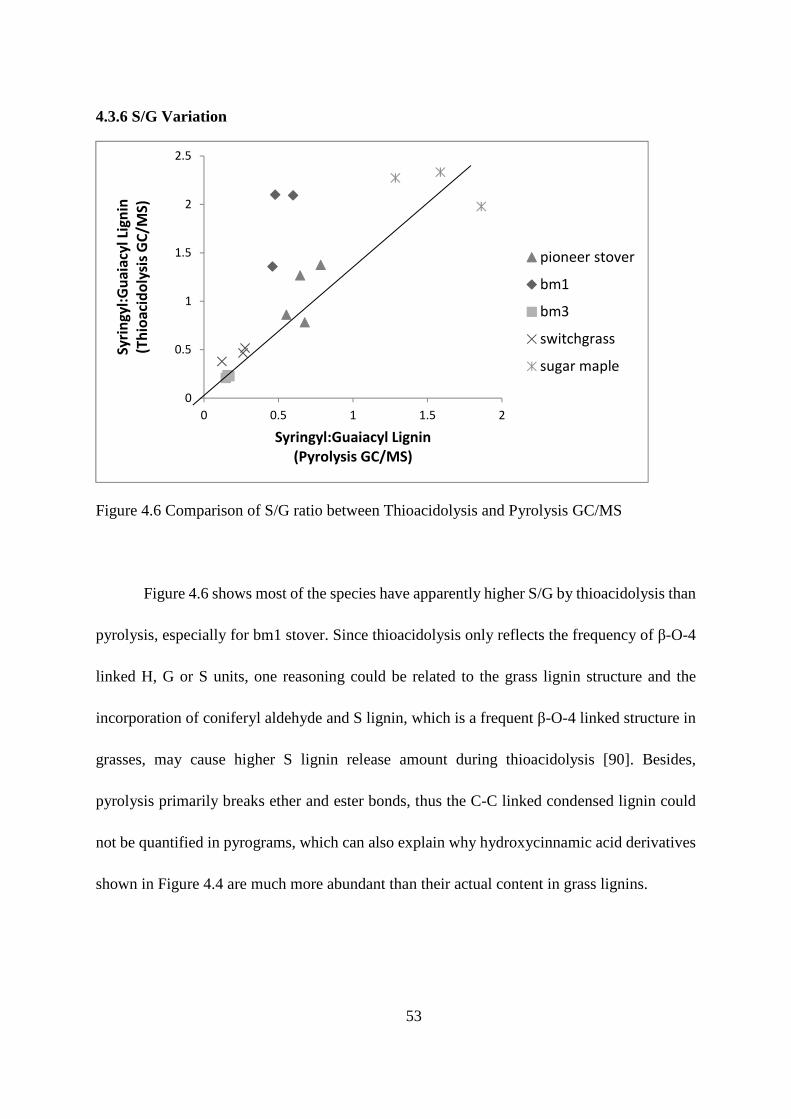
53
4.3.6 S/G Variation
Figure 4.6 Comparison of S/G ratio between Thioacidolysis and Pyrolysis GC/MS
Figure 4.6 shows most of the species have apparently higher S/G by thioacidolysis than
pyrolysis, especially for bm1 stover. Since thioacidolysis only reflects the frequency of β-O-4
linked H, G or S units, one reasoning could be related to the grass lignin structure and the
incorporation of coniferyl aldehyde and S lignin, which is a frequent β-O-4 linked structure in
grasses, may cause higher S lignin release amount during thioacidolysis [90]. Besides,
pyrolysis primarily breaks ether and ester bonds, thus the C-C linked condensed lignin could
not be quantified in pyrograms, which can also explain why hydroxycinnamic acid derivatives
shown in Figure 4.4 are much more abundant than their actual content in grass lignins.
0
0.5
1
1.5
2
2.5
0 0.5 1 1.5 2
Sy
rin
gy
l:G
ua
iacy
l Li
gn
in
(Th
ioa
cid
oly
sis
GC
/MS
)
Syringyl:Guaiacyl Lignin
(Pyrolysis GC/MS)
pioneer stover
bm1
bm3
switchgrass
sugar maple
54
5. CONCLUSIONS
Cellulose, hemicellulose and lignin as three major components in plant cell walls were
investigated in the study respectively for the physical and chemical properties including
crystallinity, molecular weight distribution, composition and content. The structural changes of
plant cell wall and the composition of hydrolysate associated with AHP pretreatment were
assessed by a series of analytical techniques. Compositional analysis of the residual cell wall
and the pretreatment liquor was performed using HPLC method developed by NREL. Plant
cell wall residues were profiled in a native state by 13
C solid-state NMR and HSQC gel-state
NMR. Pretreatment hydrolysate was profiled by SEC, HSQC solution-state NMR and 1H
solution-state NMR. Lignin composition and content was studied through chemical and
physical approaches including ABSL, thioacidolysis and pyrolysis-GC/MS.
Low NaOH concentration mild AHP pretreatment performs similarly to alkaline
extraction, which partially solubilizes hemicelluloses and lignin while LCCs structures
possibly maintain. SEC results indicated the hydrolysate either contains hemicelluloses
aggregation and low molecular weight LCCs, or high molecular weight hemicellulose
oligomers as well as low molecular weight lignin. Solid-state 13
C NMR result of the residual
cell walls showed reduction of acetate and methoxyl substitutional groups on hemicelluloses
and the decreasing of methoxyl groups and the aromatics on lignin. For the analysis on lignin,
the content of ABSL and Klason lignin in biomass has a linear correlation, while ABSL is
around 5%~10% higher than Klason lignin. The digestibility significantly increased by the
increasing amount of lignin removal in different pretreatment conditions, which also has been
55
shown in flowthrough dilute acid pretreatment [14]. Thioacidolysis results showed G lignin
drops first in mild alkali pretreatment, because β-O-4 linked G lignin with less free phenolic
hydroxyl groups is less condensed [75] and more alkali-labile than S lignin and dissociates first
in mild alkali pretreatment.
In order to further investigate the pretreatment impacts on structural changes related to
pretreatment effectiveness, two inbred brown midrib stovers bm1 and bm3 were utilized in
studying of pretreatment effects on lignin composition and glucan digestibility. CAD down
regulated bm1 shows the highest lignin content in both ABSL and Klason results among three
stovers. Since sigmoid alike correlations were found between lignin content and glucan
digestibility for different grasses, structural changes differ with respect to pretreatment
conditions. Plotting of pyrolysis products correlation between conditions and species shown in
Figure 4.2 and Figure 4.3 also implies that mild pretreatment removes cell wall components
without notably changing lignin structure, while high NaOH pretreatment modifies lignin
structures or selectively removes lignin with certain structural features. In monocot grasses,
non-ester/ether bonded lignin portion is called condensed structure and high recalcitrance [75],
mild AHP pretreatment pulls off a certain amount of lignin as LCCs. In high NaOH or pH=11.5
adjusted AHP pretreated samples, the dramatically decreasing lignin content are possibly due
to the lignin oxidation by oxidative radicals generated by hydrogen peroxide in alkali adequate
environment.
The effectiveness of AHP pretreatment on grasses is demonstrated by the observation
that besides three major lignin building blocks, the majority of pyrolyzable grass lignins are
alkali-liable p-coumeric acid and ferulic acid. The incorporation of coniferylaldehyde and S
56
lignin in grasses was shown by the higher level of S lignin releasing in thioacidolysis than
pyrolysis. Higher xylan and lignin removal of stovers than switchgrass showed stovers might
be more promising feedstock for bioethanol production, and different digestibilities of mutant
bm1 and bm3 stovers revealed the lignin composition plays important role in AHP
pretreatment speeding enzymatic hydrolysis. Less condensed G lignin abundant bm3 has the
highest digestibility under different pretreatments among stovers indicates lignin structure has
impact on the glucan digestibility.
57
APPENDIX
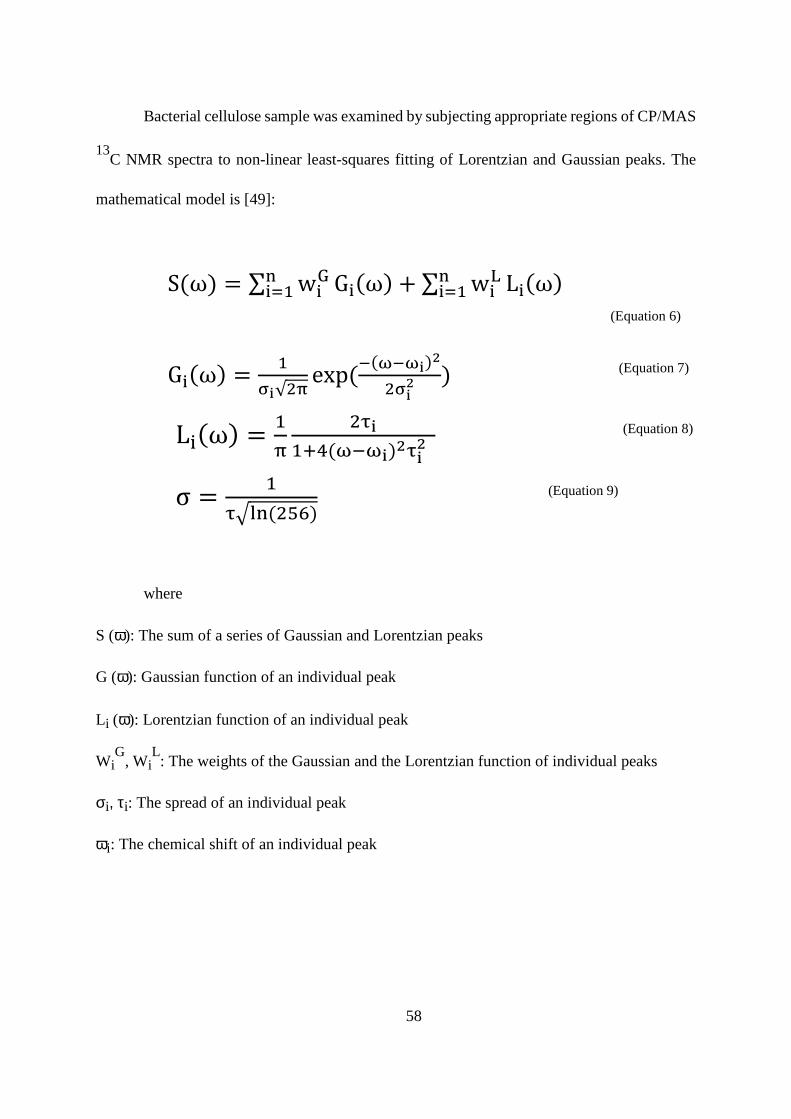
58
Bacterial cellulose sample was examined by subjecting appropriate regions of CP/MAS
13C NMR spectra to non-linear least-squares fitting of Lorentzian and Gaussian peaks. The
mathematical model is [49]:
S(ω) = ∑ w()�
(*+ G((ω) + ∑ w(.�
(*+ L((ω)
(Equation 6)
G((ω) =+
0�√23exp(7
(878�)�
20�� ) (Equation 7)
L((ω) =+3
29�+:;(878�)�9�
� (Equation 8)
σ = +9=>�(2?@)
(Equation 9)
where
S (ω): The sum of a series of Gaussian and Lorentzian peaks
G (ω): Gaussian function of an individual peak
Li (ω): Lorentzian function of an individual peak
WiG
, WiL: The weights of the Gaussian and the Lorentzian function of individual peaks
σi, τi: The spread of an individual peak
ωi: The chemical shift of an individual peak
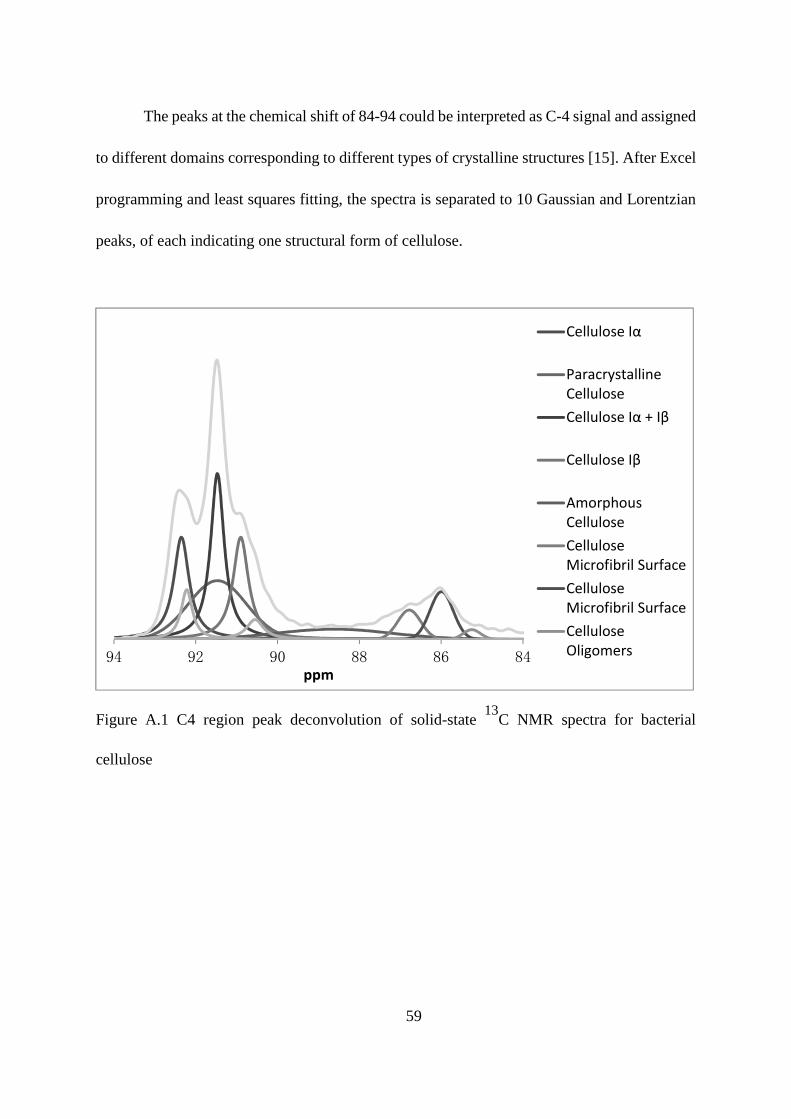
59
The peaks at the chemical shift of 84-94 could be interpreted as C-4 signal and assigned
to different domains corresponding to different types of crystalline structures [15]. After Excel
programming and least squares fitting, the spectra is separated to 10 Gaussian and Lorentzian
peaks, of each indicating one structural form of cellulose.
Figure A.1 C4 region peak deconvolution of solid-state 13
C NMR spectra for bacterial
cellulose
848688909294
ppm
Cellulose Iα
Paracrystalline
Cellulose
Cellulose Iα + Iβ
Cellulose Iβ
Amorphous
Cellulose
Cellulose
Microfibril Surface
Cellulose
Microfibril Surface
Cellulose
Oligomers
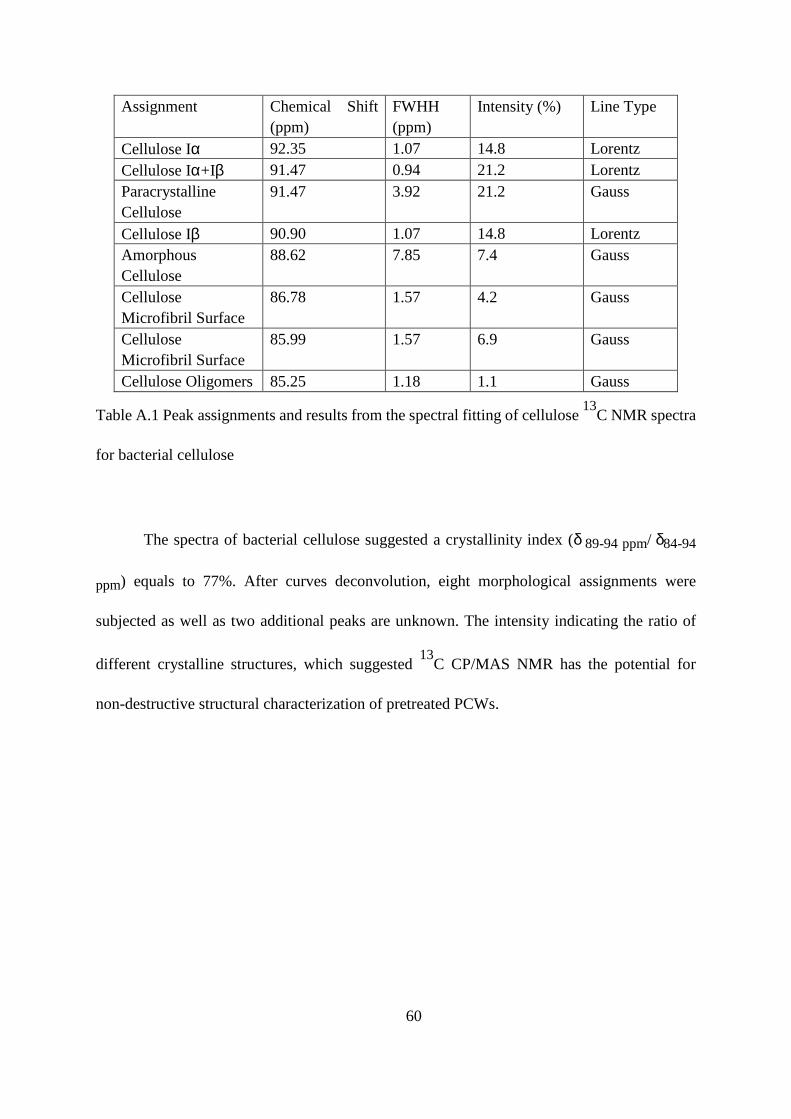
60
Assignment Chemical Shift (ppm)
FWHH (ppm)
Intensity (%) Line Type
Cellulose Iα 92.35 1.07 14.8 Lorentz Cellulose Iα+Iβ 91.47 0.94 21.2 Lorentz Paracrystalline Cellulose
91.47 3.92 21.2 Gauss
Cellulose Iβ 90.90 1.07 14.8 Lorentz Amorphous Cellulose
88.62 7.85 7.4 Gauss
Cellulose Microfibril Surface
86.78 1.57 4.2 Gauss
Cellulose Microfibril Surface
85.99 1.57 6.9 Gauss
Cellulose Oligomers 85.25 1.18 1.1 Gauss
Table A.1 Peak assignments and results from the spectral fitting of cellulose 13
C NMR spectra
for bacterial cellulose
The spectra of bacterial cellulose suggested a crystallinity index (δ 89-94 ppm/ δ84-94
ppm) equals to 77%. After curves deconvolution, eight morphological assignments were
subjected as well as two additional peaks are unknown. The intensity indicating the ratio of
different crystalline structures, which suggested 13
C CP/MAS NMR has the potential for
non-destructive structural characterization of pretreated PCWs.

61
BIBLIOGRAPHY
62
1. Wyman, C.E., Ethanol from lignocellulosic biomass: Technology, economics, and
opportunities. Bioresource Technology, 1994. 50(1): p. 3-15.
2. A USDA Regional Roadmap to Meeting the Biofuels Goals of the Renewable Fuels
Standard by 2022. 2010, U.S. Department of Agriculture (USDA).
3. Muhlethaler, K., Ultrastructure and Formation of Plant Cell Walls. Annual Review of
Plant Physiology, 1967. 18(1): p. 1-24.
4. Hayashi, T., M.P.F. Marsden, and D.P. Delmer, Pea Xyloglucan and Cellulose: V.
Xyloglucan-Cellulose Interactions in vitro and In vivo. Plant Physiology, 1987. 83(2): p.
384-389.
5. Micic, M., et al., Study of the lignin model compound supramolecular structure by
combination of near-field scanning optical microscopy and atomic force microscopy.
Colloids and Surfaces B: Biointerfaces, 2004. 34(1): p. 33-40.
6. Terashima, N., Formation of macromolecular lignin in ginkgo xylem cell walls as
observed by field emission scanning electron microscopy? Comptes Rendus Biologies,
2004. 327(9-10): p. 903-910.
7. Whitney, S.E.C., et al., Roles of cellulose and xyloglucan in determining the
mechanical properties of primary plant cell walls. Plant Physiology, 1999. 121(2): p.
657-663.
8. Atalla, R.H. and D.L. Vanderhart, NATIVE CELLULOSE - A COMPOSITE OF 2 DISTINCT
CRYSTALLINE FORMS. Science, 1984. 223(4633): p. 283-285.
9. Adler, E., Lignin chemistry—past, present and future. Wood Science and Technology,
1977. 11(3): p. 169-218.
10. Mosier, N., et al., Reaction Kinetics, Molecular Action, and Mechanisms of Cellulolytic
Proteins, in Recent Progress in Bioconversion of Lignocellulosics. 1999, Springer Berlin
/ Heidelberg. p. 23-40.
11. Himmel, M.E., et al., Biomass Recalcitrance: Engineering Plants and Enzymes for
Biofuels Production. Science, 2007. 315(5813): p. 804-807.
12. Zhang, Y.-H.P. and L.R. Lynd, Toward an aggregated understanding of enzymatic
hydrolysis of cellulose: Noncomplexed cellulase systems. Biotechnology and
Bioengineering, 2004. 88(7): p. 797-824.
63
13. McMillan, J.D., Pretreatment of Lignocellulosic Biomass, in Enzymatic Conversion of
Biomass for Fuels Production, M.E. Himmel, J.O. Baker, and R.P. Overend, Editors.
1994. p. 292-324.
14. Yang, B. and C.E. Wyman, Effect of xylan and lignin removal by batch and
flowthrough pretreatment on the enzymatic digestibility of corn stover cellulose.
Biotechnology and Bioengineering, 2004. 86(1): p. 88-98.
15. Sannigrahi, P., S.J. Miller, and A.J. Ragauskas, Effects of organosolv pretreatment and
enzymatic hydrolysis on cellulose structure and crystallinity in Loblolly pine.
Carbohydrate Research, 2010. 345(7): p. 965-970.
16. Zhao, H., G.A. Baker, and J.V. Cowins, Fast Enzymatic Saccharification of Switchgrass
After Pretreatment with Ionic Liquids. Biotechnology Progress, 2010. 26(1): p.
127-133.
17. Gupta, R. and Y.Y. Lee, Pretreatment of hybrid poplar by aqueous ammonia.
Biotechnology Progress, 2009. 25(2): p. 357-364.
18. Kim, J., Y. Lee, and S. Park, Pretreatment of wastepaper and pulp mill sludge by
aqueous ammonia and hydrogen peroxide. Applied Biochemistry and Biotechnology,
2000. 84-86(1): p. 129-139.
19. Weinstock, I.A., et al., A new environmentally benign technology for transforming
wood pulp into paper. Engineering polyoxometalates as catalysts for multiple
processes. Journal of Molecular Catalysis A: Chemical, 1997. 116(1-2): p. 59-84.
20. Xiang, Q. and Y. Lee, Oxidative cracking of precipitated hardwood lignin by hydrogen
peroxide. Applied Biochemistry and Biotechnology, 2000. 84-86(1): p. 153-162.
21. Ji, Y., E. Vanska, and A. van Heiningen, New kinetics and mechanisms of oxygen
delignification observed in a continuous stirred tank reactor. Holzforschung, 2009.
63(3): p. 264-271.
22. Brunecky, R., et al., Redistribution of xylan in maize cell walls during dilute acid
pretreatment. Biotechnology and Bioengineering, 2009. 102(6): p. 1537-1543.
23. Jeoh, T., et al., Cellulase digestibility of pretreated biomass is limited by cellulose
accessibility. Biotechnology and Bioengineering, 2007. 98(1): p. 112-122.
64
24. Zhu, L., et al., Structural features affecting biomass enzymatic digestibility.
Bioresource Technology, 2008. 99(9): p. 3817-3828.
25. Donohoe, B.S., et al., Surface and ultrastructural characterization of raw and
pretreated switchgrass. Bioresource Technology. In Press, Corrected Proof.
26. Scalbert, A., et al., Ether linkage between phenolic acids and lignin fractions from
wheat straw. Phytochemistry, 1985. 24(6): p. 1359-1362.
27. Saha, B.C. and M.A. Cotta, Ethanol production from alkaline peroxide pretreated
enzymatically saccharified wheat straw. Biotechnology Progress, 2006. 22(2): p.
449-453.
28. Gould, J.M., ALKALINE PEROXIDE DELIGNIFICATION OF AGRICULTURAL RESIDUES TO
ENHANCE ENZYMATIC SACCHARIFICATION. Biotechnology and Bioengineering, 1984.
26(1): p. 46-52.
29. Gould, J.M., Studies on the mechanism of alkaline peroxide delignification of
agricultural residues. Biotechnology and Bioengineering, 1985. 27(3): p. 225-231.
30. Kristensen, J., C. Felby, and H. Jørgensen, Yield-determining factors in high-solids
enzymatic hydrolysis of lignocellulose. Biotechnology for Biofuels, 2009. 2(1): p. 1-10.
31. Zacchi, G. and A. Axelsson, Economic evaluation of preconcentration in production of
ethanol from dilute sugar solutions. Biotechnology and Bioengineering, 1989. 34(2):
p. 223-233.
32. Wingren, A., M. Galbe, and G. Zacchi, Techno-Economic Evaluation of Producing
Ethanol from Softwood: Comparison of SSF and SHF and Identification of Bottlenecks.
Biotechnology Progress, 2003. 19(4): p. 1109-1117.
33. Sluiter, J.B., et al., Compositional Analysis of Lignocellulosic Feedstocks. 1. Review
and Description of Methods. Journal of Agricultural and Food Chemistry, 2010.
58(16): p. 9043-9053.
34. Yu Ip, C.C., et al., Carbohydrate composition analysis of bacterial polysaccharides:
Optimized acid hydrolysis conditions for HPAEC-PAD analysis. Analytical Biochemistry,
1992. 201(2): p. 343-349.
35. Sarath, G., et al., Internode structure and cell wall composition in maturing tillers of
switchgrass (Panicum virgatum. L). Bioresource Technology, 2007. 98(16): p.
2985-2992.
65
36. Templeton, D.W., et al., Compositional Analysis of Lignocellulosic Feedstocks. 2.
Method Uncertainties. Journal of Agricultural and Food Chemistry, 2010. 58(16): p.
9054-9062.
37. Kiemle, D.J., A.J. Stipanovic, and K.E. Mayo, Proton NMR methods in the
compositional characterization of polysaccharides, in Hemicelluloses: Science and
Technology, P. Gatenholm and M. Tenhanen, Editors. 2004, Amer Chemical Soc:
Washington. p. 122-139.
38. Mittal, A., et al., Quantitative analysis of sugars in wood hydrolyzates with 1H NMR
during the autohydrolysis of hardwoods. Bioresource Technology, 2009. 100(24): p.
6398-6406.
39. Hames, B.R., et al., Rapid biomass analysis - New tools for compositional analysis of
corn stover feedstocks and process intermediates from ethanol production. Applied
Biochemistry and Biotechnology, 2003. 105: p. 5-16.
40. Renneckar, S., et al., Compositional analysis of thermoplastic wood composites by
TGA. Journal of Applied Polymer Science, 2004. 93(3): p. 1484-1492.
41. Liu, Q., et al., Pyrolysis of wood species based on the compositional analysis. Korean
Journal of Chemical Engineering, 2009. 26(2): p. 548-553.
42. Zhao, H., et al., Studying cellulose fiber structure by SEM, XRD, NMR and acid
hydrolysis. Carbohydrate Polymers, 2007. 68(2): p. 235-241.
43. Samuel, R., et al., Structural Characterization and Comparison of Switchgrass
Ball-milled Lignin Before and After Dilute Acid Pretreatment. Applied Biochemistry
and Biotechnology, 2009. 162(1): p. 62-74.
44. Westman, L. and T. Lindstroem, Swelling and mechanical properties of cellulose
hydrogels. V. Swelling in concentrated alkaline solutions. 1983. Medium: X; Size:
Pages: 363-376.
45. Sun, R., J.M. Lawther, and W.B. Banks, Influence of alkaline pre-treatments on the
cell wall components of wheat straw. Industrial Crops and Products, 1995. 4(2): p.
127-145.
46. Hatfield, R.D., J. Ralph, and J.H. Grabber, Cell wall cross-linking by ferulates and
diferulates in grasses. Journal of the Science of Food and Agriculture, 1999. 79(3): p.
403-407.
66
47. Iiyama, K. and A.F.A. Wallis, Determination of lignin in herbaceous plants by an
improved acetyl bromide procedure. Journal of the Science of Food and Agriculture,
1990. 51(2): p. 145-161.
48. Larsson, P.T. and P.-O. Westlund, Line shapes in CP/MAS 13C NMR spectra of
cellulose I. Spectrochimica Acta Part A: Molecular and Biomolecular Spectroscopy,
2005. 62(1-3): p. 539-546.
49. Larsson, P.T., K. Wickholm, and T. Iversen, A CP/MAS13C NMR investigation of
molecular ordering in celluloses. Carbohydrate Research, 1997. 302(1-2): p. 19-25.
50. Hult, E.-L., P.T. Larsson, and T. Iversen, A comparative CP/MAS 13C-NMR study of
cellulose structure in spruce wood and kraft pulp. Cellulose, 2000. 7(1): p. 35-55.
51. Maunu, S., et al., 13C CPMAS NMR investigations of cellulose polymorphs in different
pulps. Cellulose, 2000. 7(2): p. 147-159.
52. Kim, H. and J. Ralph, Solution-state 2D NMR of ball-milled plant cell wall gels in
DMSO-d6/pyridine-d5. Organic & Biomolecular Chemistry, 2010. 8(3): p. 576.
53. Kim, H., J. Ralph, and T. Akiyama, Solution-state 2D NMR of Ball-milled Plant Cell Wall
Gels in DMSO-d 6. BioEnergy Research, 2008. 1(1): p. 56-66.
54. Josefsson, T., H. Lennholm, and G. Gellerstedt, Steam explosion of aspen wood.
Characterisation of reaction products. Holzforschung, 2002. 56(3): p. 289-297.
55. Barrière, Y. and O. Argillier, Brown-midrib genes of maize: a review. Agronomie, 1993.
13(10): p. 865-876.
56. Marita, J.M., et al., Variations in the Cell Wall Composition of Maize brown midrib
Mutants. Journal of Agricultural and Food Chemistry, 2003. 51(5): p. 1313-1321.
57. Barriere, Y., et al., Genetic variation for organic matter and cell wall digestibility in
silage maize. Lessons from a 34-year long experiment with sheep in digestibility
crates. MYDCAH 2004. 49: p. 115-126.
58. Sluiter, A., et al., Determination of Structural Carbohydrates and Lignin in Biomass.
NREL Analytical Procedure, 2004. National Renewable Energy Laboratory, Golden,
CO.
59. Hatfield, R.D., et al., Using the Acetyl Bromide Assay To Determine Lignin
Concentrations in Herbaceous Plants: Some Cautionary Notes. Journal of Agricultural
and Food Chemistry, 1999. 47(2): p. 628-632.
67
60. Hestrin, S. and M. Schramm, SYNTHESIS OF CELLULOSE BY
ACETOBACTER-XYLINUM .2. PREPARATION OF FREEZE-DRIED CELLS CAPABLE OF
POLYMERIZING GLUCOSE TO CELLULOSE. Biochemical Journal, 1954. 58(2): p.
345-352.
61. Torget, R., et al., Dilute acid pretreatment of short rotation woody and herbaceous
crops. Applied Biochemistry and Biotechnology, 1990. 24-25(1): p. 115-126.
62. Fukushima, R.S. and R.D. Hatfield, Comparison of the Acetyl Bromide
Spectrophotometric Method with Other Analytical Lignin Methods for Determining
Lignin Concentration in Forage Samples. Journal of Agricultural and Food Chemistry,
2004. 52(12): p. 3713-3720.
63. Iguchi, M., S. Yamanaka, and A. Budhiono, Bacterial cellulose—a masterpiece of
nature's arts. Journal of Materials Science, 2000. 35(2): p. 261-270.
64. Udhardt, U., S. Hesse, and D. Klemm, Analytical Investigations of Bacterial Cellulose.
Macromolecular Symposia, 2005. 223(1): p. 201-212.
65. Willis, J.M. and F.G. Herring, 13C CP/MAS nuclear magnetic resonance study of the
peroxide bleaching of ultra high yield chemimechanical pulp produced from sound
and spruce budworm killed balsam fir. Wood Science and Technology, 1987. 21(4): p.
373-380.
66. Klinke, H.B., et al., Characterization of degradation products from alkaline wet
oxidation of wheat straw. Bioresource Technology, 2002. 82(1): p. 15-26.
67. Qureshi, N., et al., Removal of fermentation inhibitors from alkaline peroxide
pretreated and enzymatically hydrolyzed wheat straw: Production of butanol from
hydrolysate using Clostridium beijerinckii in batch reactors. Biomass and Bioenergy,
2008. 32(12): p. 1353-1358.
68. Bjorkman, A., Lignin and Lignin-Carbohydrate Complexes. Industrial & Engineering
Chemistry, 1957. 49(9): p. 1395-1398.
69. Lundquist, K., R. Simonson, and K. Tingsvik, LIGNIN CARBOHYDRATE LINKAGES IN
MILLED WOOD LIGNIN PREPARATIONS FROM SPRUCE WOOD. Svensk
Papperstidning-Nordisk Cellulosa, 1983. 86(6): p. R44-R47.
70. Roubroeks Johannes, P., et al., Contribution of the Molecular Architecture of
4-Contribution of the Molecular Architecture of 4-O-Methyl Glucuronoxylan to Its
Aggregation Behavior in Solution, in Hemicelluloses: Science and Technology. 2003,
American Chemical Society. p. 167-183.
68
71. Morrison, I.M., Structural invesiigations on the lignin-carbohydrate complexes of
Lolium perenne. The Biochemical journal, 1974. 139(1): p. 197-204.
72. Morrison, I.M., Isolation and analysis of lignin-carbohydrate complexes from Lolium
multiflorum. Phytochemistry, 1973. 12(12): p. 2979-2984.
73. Alam, M. and R.J. McIlroy, A xylan from perennial rye-grass (Lolium perenne). Journal
of the Chemical Society C: Organic, 1967: p. 1577-1580.
74. Chundawat, S.P.S., et al., Multifaceted characterization of cell wall decomposition
products formed during ammonia fiber expansion (AFEX) and dilute acid based
pretreatments. Bioresource Technology, 2010. 101(21): p. 8429-8438.
75. Grabber, J.H., et al., Genetic and molecular basis of grass cell-wall degradability.
I. Lignin-cell wall matrix interactions. Comptes Rendus Biologies, 2004. 327(5): p.
455-465.
76. Higuchi, T., Y. Ito, and I. Kawamura, p-hydroxyphenylpropane component of grass
lignin and role of tyrosine-ammonia lyase in its formation. Phytochemistry, 1967.
6(6): p. 875-881.
77. Iiyama, K., T.B.T. Lam, and B.A. Stone, Phenolic acid bridges between polysaccharides
and lignin in wheat internodes. Phytochemistry, 1990. 29(3): p. 733-737.
78. Studer, M.H., et al., Lignin content in natural Populus variants affects sugar release.
Proceedings of the National Academy of Sciences, 2011. 108(15): p. 6300-6305.
79. Chen, F. and R.A. Dixon, Lignin modification improves fermentable sugar yields for
biofuel production. Nature Biotechnology, 2007. 25(7): p. 759-761.
80. Davison, B.H., et al., Variation of S/G ratio and lignin content in a Populus family
influences the release of xylose by dilute acid hydrolysis. Applied Biochemistry and
Biotechnology, 2006. 130(1-3): p. 427-435.
81. Li, X., et al., Lignin monomer composition affects Arabidopsis cell-wall degradability
after liquid hot water pretreatment. Biotechnology for Biofuels, 2010. 3(1): p. 1-7.
82. Alves, A., et al., Analytical pyrolysis as a direct method to determine the lignin
content in wood. Journal of Analytical and Applied Pyrolysis, 2006. 76(1-2): p.
209-213.
69
83. Alves, A., et al., Analytical pyrolysis as a direct method to determine the lignin
content in woodPart 2: Evaluation of the common model and the influence of
compression wood. Journal of Analytical and Applied Pyrolysis, 2007.
84. Alves, A., et al., Analytical pyrolysis as a direct method to determine the lignin
content in woodPart 3. Evaluation of species-specific and tissue-specific differences in
softwood lignin composition using principal component analysis. Journal of Analytical
and Applied Pyrolysis, 2009. 85(1-2): p. 30-37.
85. Shafizadeh, F., Introduction to pyrolysis of biomass. Journal of Analytical and Applied
Pyrolysis, 1982. 3(4): p. 283-305.
86. Evans, R.J. and T.A. Milne, Molecular characterization of the pyrolysis of biomass.
Energy & Fuels, 1987. 1(2): p. 123-137.
87. Obst, J.R., Analytical pyrolysis of hardwood and softwood lignins and its use in
lignin-type determination of hardwood vessel elements. Journal Name: J. Wood
Chem. Technol.; (United States); Journal Volume: 3:4, 1983: p. Medium: X; Size:
Pages: 377-397.
88. Ralph, J. and R.D. Hatfield, Pyrolysis-GC-MS characterization of forage materials.
Journal of Agricultural and Food Chemistry, 1991. 39(8): p. 1426-1437.
89. Grabber, J.H., et al., Coniferyl Ferulate Incorporation into Lignin Enhances the
Alkaline Delignification and Enzymatic Degradation of Cell Walls. Biomacromolecules,
2008. 9(9): p. 2510-2516.
90. Grabber, J.H., S. Quideau, and J. Ralph, p-coumaroylated syringyl units in maize lignin:
Implications for [beta]-ether cleavage by thioacidolysis. Phytochemistry, 1996. 43(6):
p. 1189-1194.