Embed Size (px)
Citation preview

Structural Change and CompetitionStructural Change and CompetitionIn the U.S. Dairy IndustryIn the U.S. Dairy Industry
Brian W. GouldBrian W. GouldAssociate ProfessorAssociate Professor
Department of Agricultural and Applied EconomicsDepartment of Agricultural and Applied EconomicsUniversity of WisconsinUniversity of Wisconsin--MadisonMadison
Economic Research ServiceEconomic Research ServiceDecember 7, 2009December 7, 2009

Presentation OutlinePresentation Outline
Industry structure at the farm levelIndustry structure at the farm levelFarm size and locationFarm size and location
Classified pricing of farm milk in the U.S.Classified pricing of farm milk in the U.S.Pricing practices of dairy manufacturersPricing practices of dairy manufacturersImplications of a thin marketImplications of a thin market
Industry structure in the marketing of farm milkIndustry structure in the marketing of farm milkEmergence of regional/supraEmergence of regional/supra--regional cooperativesregional cooperatives
Industry structure in milk processing/distributionIndustry structure in milk processing/distributionSuizaSuiza →→ Dean FoodsDean Foods
22

Dairy Farm StructureDairy Farm Structure
5,6965,696WA5,2365,236NM4,2334,233IAIA2,9422,942WA3,0123,012MOMO7,7637,763MIMI5,5935,593WA4,3924,392WA3,6253,625TX3,0653,065TX7,8657,865NM5,7055,705MIMI4,6674,667OHOH3,9943,994IAIA4,4204,420OHOH8,4168,416TX5,7435,743TX5,2345,234MIMI4,3104,310OHOH4,6024,602MIMI8,7828,782MNMN7,2237,223ID5,5395,539TX4,9704,970MIMI4,6704,670IAIA
10,57510,575PAPA9,4939,493MNMN10,01410,014PAPA8,4968,496PAPA7,1247,124PAPA12,31512,315ID11,15611,156PAPA10,03010,030MNMN9,5359,535MNMN9,4579,457CA12,43212,432NYNY11,92111,921NYNY11,06711,067NYNY10,97410,974NYNY9,6369,636MNMN24,47224,472WIWI23,25923,259WIWI20,94720,947CA13,57713,577CA10,34110,341NYNY41,20341,203CA32,245 32,245 CA24,187 24,187 WIWI22,38022,380WIWI18,435 18,435 WI WI ProdProdStateStateProdProdStateStateProdProdStateStateProdProdStateStateProdProdStateState
2008200820002000199019901980198019701970Milk production has shifted westwardMilk production has shifted westward
Note: Top ten states. Production is in terms of millions of lNote: Top ten states. Production is in terms of millions of lbsbs 33

Distribution of milk production by herd size, 2007Distribution of milk production by herd size, 2007
0%
10%
20%
30%
40%
50%
60%
1-49 Head 50-99 Head 100-199 Head 200-499 Head 500+ Head
Wisconsin New YorkPennsylvania MinnesotaMichigan United States
Dairy Farm StructureDairy Farm Structure
Farms Avg SizeWI 14,200 88NY 5,700 110PA 8,300 66MN 5,100 90MI 2,700 124US 69,995 131

Distribution of milk production by herd size, 2007Distribution of milk production by herd size, 2007
0%
10%
20%
30%
40%
50%
60%
70%
80%
90%
100%
1-49 Head 50-99 Head 100-199 Head 200-499 Head 500+ Head
California IdahoTexas New MexicoWashington
Dairy Farm StructureDairy Farm Structure
Farms Avg SizeCA 2,200 824ID 810 633TX 1,300 268NM 270 1,267WA 820 290

A majority of the milk produced in the U.S. takes place A majority of the milk produced in the U.S. takes place under Federal and State marketing ordersunder Federal and State marketing orders
CA and Federal Milk Marketing Order (FMMO) CA and Federal Milk Marketing Order (FMMO) system account for 83% of U.S. milk in 2008system account for 83% of U.S. milk in 2008
Formulas used to set Formulas used to set minimumminimum milk pricesmilk pricesPrices determined by use of milk (i.e., milk class)Prices determined by use of milk (i.e., milk class)Wholesale commodity Wholesale commodity pricesprices→→milkmilk component component valuevalue
Milk Class minimum price = sum of component Milk Class minimum price = sum of component values at standard milk compositionvalues at standard milk composition
Classified Pricing of Farm MilkClassified Pricing of Farm Milk
66

How can market structure either at the milk How can market structure either at the milk procurement or processing stages impact farm procurement or processing stages impact farm milk prices given above system?milk prices given above system?
Lets examine the valuation of FMMO Class III milkLets examine the valuation of FMMO Class III milk76.4% of Upper Midwest milk in 200876.4% of Upper Midwest milk in 200836.0% of U.S. milk36.0% of U.S. milk3.1% of Florida milk3.1% of Florida milk
77
Classified Pricing of Farm MilkClassified Pricing of Farm Milk

NASS Grade AButter Price
($/lb)
Butterfat Value($/lb)
Class III Price
($/cwt)
OtherSolids Value
($/lb)
Class III Skim Price
($/cwt)
x 3.5
x 0.965
x 5.9
NASS CheddarPrice ($/lb)
Protein Value($/lb)
x 3.1
88
Mailbox Price
($/cwt)
NASS DryWhey Price
($/lb)
98% of WI mailbox pricevariabilitydetermined byClass III
FMMO Pricing of Class III MilkFMMO Pricing of Class III Milk
CME Butter Spot Price
CME Cheddar Spot Price
Lag
Lag
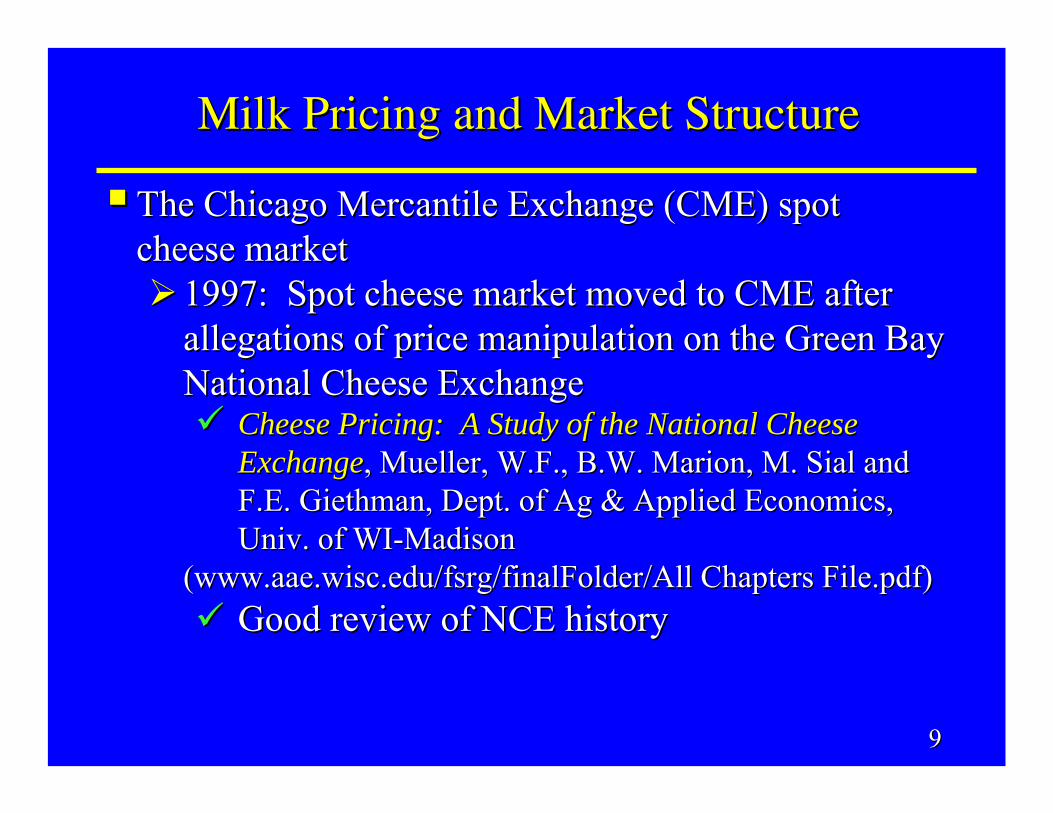
The Chicago Mercantile Exchange (CME) spot The Chicago Mercantile Exchange (CME) spot cheese marketcheese market
1997: Spot cheese market moved to CME after 1997: Spot cheese market moved to CME after allegations of price manipulation on the Green Bay allegations of price manipulation on the Green Bay National Cheese Exchange National Cheese Exchange
Cheese Pricing: A Study of the National Cheese Cheese Pricing: A Study of the National Cheese ExchangeExchange, Mueller, W.F., B.W. Marion, M. , Mueller, W.F., B.W. Marion, M. SialSial and and F.E. F.E. GiethmanGiethman, Dept. of Ag & Applied Economics, , Dept. of Ag & Applied Economics, Univ. of WIUniv. of WI--MadisonMadison
((www.aae.wisc.edu/fsrg/finalFolder/Allwww.aae.wisc.edu/fsrg/finalFolder/All Chapters Chapters File.pdfFile.pdf))Good review of NCE historyGood review of NCE history
Milk Pricing and Market StructureMilk Pricing and Market Structure
99

Cheese producers generally use the CME in setting sales Cheese producers generally use the CME in setting sales prices even though not part of FMMO systemprices even though not part of FMMO system
Carlson and Gould (1996) study of Wisconsin Cheese Carlson and Gould (1996) study of Wisconsin Cheese plant managersplant managers
Typical statement: Typical statement: ““22¢¢ over the Fridayover the Friday’’s CMEs CME””Lag effect on NASS prices used in formulasLag effect on NASS prices used in formulas
Impacts all cheese varieties not just cheddarImpacts all cheese varieties not just cheddar2008: Cheddar was 31.7% of U.S. cheese prod.2008: Cheddar was 31.7% of U.S. cheese prod.
The Commodity Futures Trading Commission (CFTC) The Commodity Futures Trading Commission (CFTC) has regulatory oversighthas regulatory oversight
Milk Pricing and Market StructureMilk Pricing and Market Structure
1010
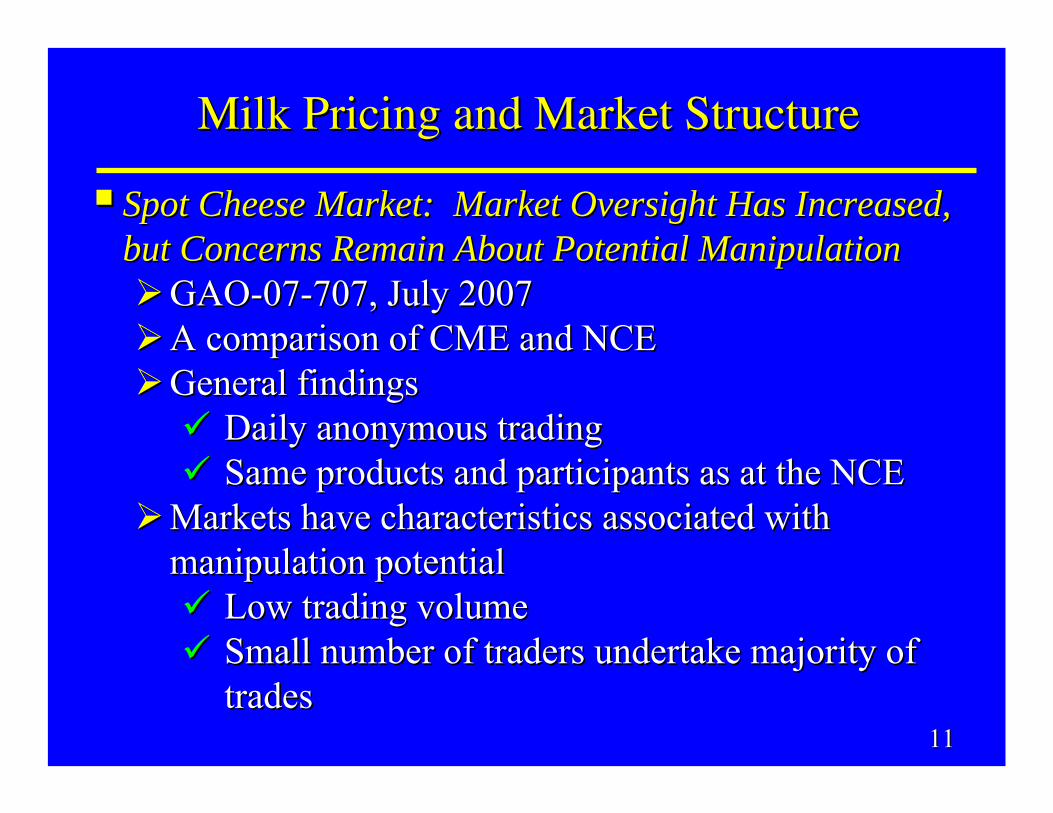
Spot Cheese Market: Market Oversight Has Increased, Spot Cheese Market: Market Oversight Has Increased, but Concerns Remain About Potential Manipulationbut Concerns Remain About Potential Manipulation
GAOGAO--0707--707, July 2007707, July 2007A comparison of CME and NCEA comparison of CME and NCEGeneral findingsGeneral findings
Daily anonymous tradingDaily anonymous tradingSame products and participants as at the NCESame products and participants as at the NCE
Markets have characteristics associated with Markets have characteristics associated with manipulation potentialmanipulation potential
Low trading volumeLow trading volumeSmall number of traders undertake majority of Small number of traders undertake majority of tradestrades
Milk Pricing and Market StructureMilk Pricing and Market Structure
1111

Spot Cheese Market: Market Oversight Has Increased, Spot Cheese Market: Market Oversight Has Increased, but Concerns Remain About Potential Manipulationbut Concerns Remain About Potential Manipulation
Between Jan. 1, 1999 Between Jan. 1, 1999 –– Feb 2, 2007 closing price Feb 2, 2007 closing price determined by unfilled bids and uncovered offers:determined by unfilled bids and uncovered offers:
Blocks: 17% of trading daysBlocks: 17% of trading daysBarrels: 28% of trading days Barrels: 28% of trading days
% of Trades: Jan 1, 1999 % of Trades: Jan 1, 1999 –– Feb 2, 2007Feb 2, 2007
Milk Pricing and Market StructureMilk Pricing and Market Structure
1212
Largest 2 Sellers: 68%Largest 2 Sellers: 68%Largest 3 Sellers: 67%Largest 3 Sellers: 67%
Largest 4 Buyers: 56%Largest 4 Buyers: 56%Largest 2 Buyers: 74%Largest 2 Buyers: 74%BarrelsBarrelsBlocksBlocks

Milk Pricing and Market StructureMilk Pricing and Market Structure
Ratio of Monthly CME Spot Sales and U.S. Cheddar Production
0.00
0.75
1.50
2.25
3.00
3.75
4.50
5.25
6.00
6.75
Jan-00
Jul-00
Jan-01
Jul-01
Jan-02
Jul-02
Jan-03
Jul-03
Jan-04
Jul-04
Jan-05
Jul-05
Jan-06
Jul-06
Jan-07
Jul-07
Jan-08
Jul-08
Jan-09
Average %

Relationship between weekly average CME Spot Relationship between weekly average CME Spot and NASS Cheddar Block pricesand NASS Cheddar Block prices
Milk Pricing and Market StructureMilk Pricing and Market Structure
1 .00
1 .25
1 .50
1 .75
2 .00
2 .25
1/15/009/15/005/15/011/15/029/15/025/15/031/15/049/15/045/15/051/15/069/15/065/15/071/15/089/15/085/15/09
C M E 2-W eek LagN ass
$/lb
( ) ( )2
0.006 0.004
NASS Cheddar Block Price =0.017 0.982CME Spot Price(-2) R 0.990+ =
1414

Class III futures and spot prices linked viaClass III futures and spot prices linked viaFMMO pricing rulesFMMO pricing rulesClass III futures cash settle to Announced Class IIIClass III futures cash settle to Announced Class III
Dec. 2008 CFTC Sanctioning of DFADec. 2008 CFTC Sanctioning of DFAMay 21May 21-- June 23, 2004 cheese spot market activityJune 23, 2004 cheese spot market activityDFA attempted to manipulate June, July and Aug. DFA attempted to manipulate June, July and Aug. 2004 Class III futures2004 Class III futures
Long in Class III futuresLong in Class III futuresFutures started to declineFutures started to decline
Milk Pricing and Market StructureMilk Pricing and Market Structure
1515

“…“…attempted to manipulate Class III milk futures contract attempted to manipulate Class III milk futures contract prices through purchases of cheddar cheese blocks on the CME prices through purchases of cheddar cheese blocks on the CME Cheese Spot Call market in an effort to minimize potential Cheese Spot Call market in an effort to minimize potential losses from losses from DFADFA’’ss speculative long Class III milk futures speculative long Class III milk futures positionspositions…”…” (CFTC, 2008)(CFTC, 2008)
HanmanHanman (CEO) and (CEO) and BosBos (CFO) found guilty(CFO) found guiltyFined $12,000,000Fined $12,000,000Cannot trade for 5 yearsCannot trade for 5 years
http://future.aae.wisc.edu/pubs/pubs/show/408http://future.aae.wisc.edu/pubs/pubs/show/408
Similar relationship found between NASS and CME Similar relationship found between NASS and CME butter spot pricebutter spot price
Milk Pricing and Market StructureMilk Pricing and Market Structure
1616
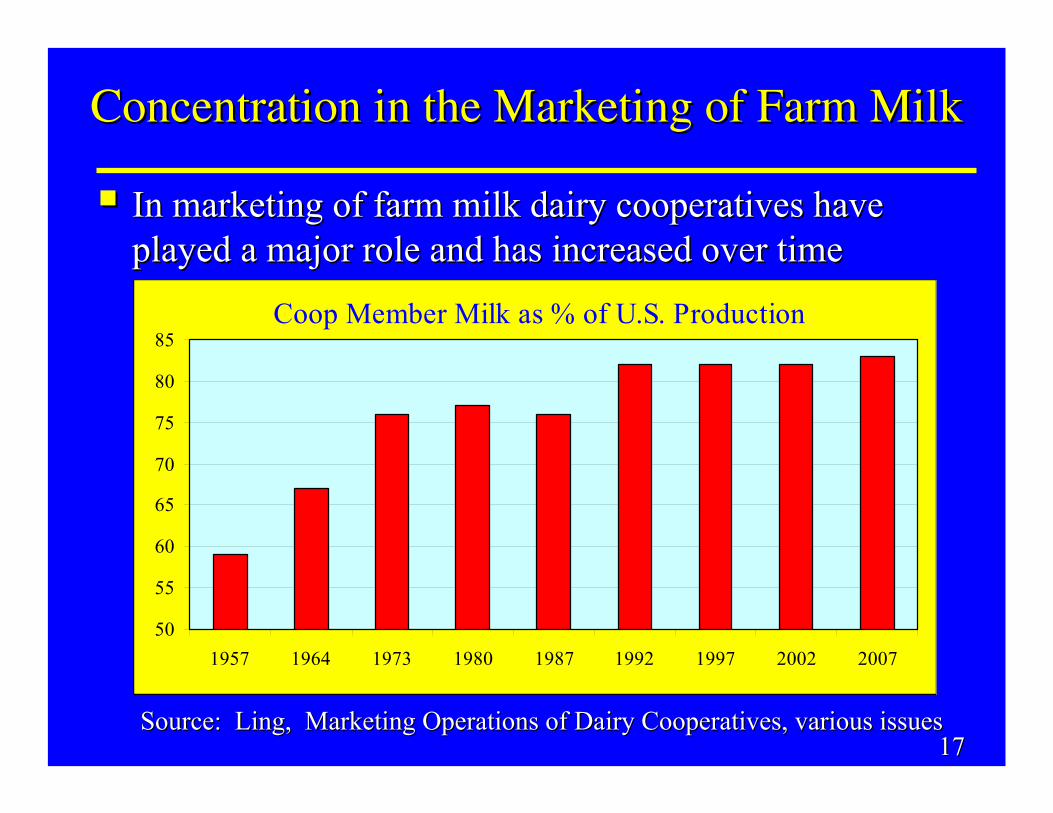
In marketing of farm milk dairy cooperatives have In marketing of farm milk dairy cooperatives have played a major role and has increased over timeplayed a major role and has increased over time
Coop Member Milk as % of U.S. Production
50
55
60
65
70
75
80
85
1957 1964 1973 1980 1987 1992 1997 2002 2007
Source: Ling, Marketing Operations of Dairy Cooperatives, variSource: Ling, Marketing Operations of Dairy Cooperatives, various issuesous issues
Concentration in the Marketing of Farm MilkConcentration in the Marketing of Farm Milk
1717

Source: Ling, Marketing Operations of Dairy Cooperatives, variSource: Ling, Marketing Operations of Dairy Cooperatives, various issuesous issues
Concentration in the Marketing of Farm MilkConcentration in the Marketing of Farm Milk
1818

Dairy cooperative unification efforts in 1960Dairy cooperative unification efforts in 1960’’s s –– 19701970’’s s resulted in regional cooperativesresulted in regional cooperatives
Continued unification resulted in creation of multiContinued unification resulted in creation of multi--regional cooperativesregional cooperatives
Account for a significant percentage of U.S. milkAccount for a significant percentage of U.S. milkExample of Dairy Farmers of America (DFA) and Example of Dairy Farmers of America (DFA) and Land OLand O’’Lakes (LOL)Lakes (LOL)
Concentration in the Marketing of Farm MilkConcentration in the Marketing of Farm Milk
1919

Concentration in the Marketing of Farm MilkConcentration in the Marketing of Farm Milk
11.211.217,19317,19311MidMid--America Dairymen, IncAmerica Dairymen, Inc2.02.03,0893,0891313Western Dairymen, IncWestern Dairymen, Inc
3.13.11,4101,41044MidMid--America Dairymen, IncAmerica Dairymen, Inc0.20.21021029696Western Dairymen, IncWestern Dairymen, Inc
19961996Cooperatives Forming Cooperatives Forming DFADFA % of Top % of Top
100100Processing Processing
Sales ($ Mil)Sales ($ Mil)Processing Processing
RankRank
Milk Marketing Inc.Milk Marketing Inc.
AMPIAMPI--Southern Region*Southern Region*
Milk Marketing Inc.Milk Marketing Inc.
AMPIAMPI--Southern RegionSouthern Region
U.S. Prod. U.S. Prod. % %
Milk Milk MarketingsMarketings(Mil. Lbs)(Mil. Lbs)
Milk Milk Marketing Marketing Coop RankCoop Rank
4.54.57,0007,00033
3.43.45,2365,23677
0.80.8
0.80.8
353353
386386
3737
3535
Note: *Estimated. AMPI marketed 11,800 mil. lbs of farm milk aNote: *Estimated. AMPI marketed 11,800 mil. lbs of farm milk and was the 2nd was the 2ndnd
largest cooperative. The Southern Unit accounted for 32% of dailargest cooperative. The Southern Unit accounted for 32% of dairy processing sales.ry processing sales.
Concentration in the Marketing of Farm MilkConcentration in the Marketing of Farm Milk
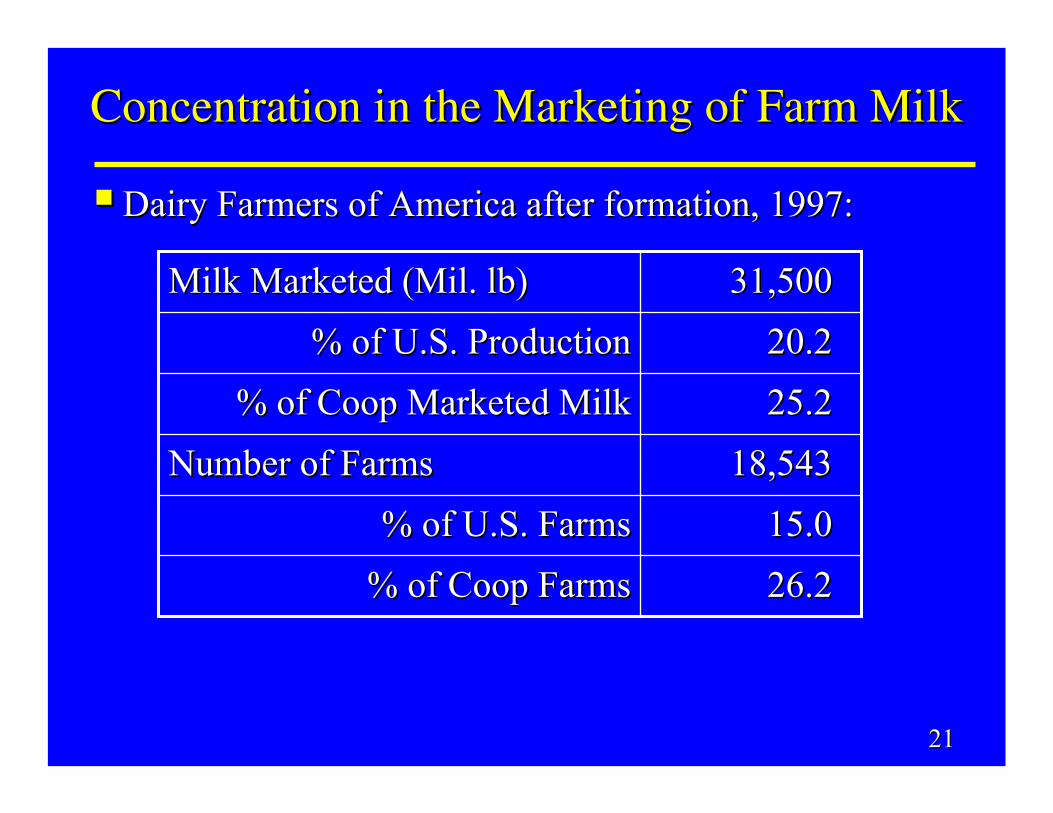
Dairy Farmers of America after formation, 1997:Dairy Farmers of America after formation, 1997:
25.225.2% of Coop Marketed Milk% of Coop Marketed Milk
26.226.2% of Coop Farms% of Coop Farms15.015.0% of U.S. Farms% of U.S. Farms
18,54318,543Number of FarmsNumber of Farms
20.220.2% of U.S. Production% of U.S. Production31,50031,500Milk Marketed (Mil. lb)Milk Marketed (Mil. lb)
2121

Concentration in the Marketing of Farm MilkConcentration in the Marketing of Farm Milk
19971997Land OLand O’’Lakes and Lakes and
DairymenDairymen’’s Cooperatives Cooperative % of Top % of Top 100100
Processing Processing Sales ($ Mil)Sales ($ Mil)
Processing Processing RankRank
DairymenDairymen’’s Cooperative s Cooperative Creamery AssociationCreamery Association
Land OLand O’’ Lakes Lakes
DairymenDairymen’’s Cooperative s Cooperative Creamery AssociationCreamery Association
Land OLand O’’ Lakes Lakes
U.S. U.S. Prod. % Prod. %
Milk Milk MarketingsMarketings(Mil. Lbs)(Mil. Lbs)
Milk Milk Marketing Marketing
RankRank
2.72.74,2124,21299
7.87.812,20012,20022
1.11.1
3.83.8
499.4499.4
1,800.01,800.0
3030
55
Merger effective July 1, 1998Merger effective July 1, 1998
2222

Source: Ling, Marketing Operations of Dairy Cooperatives, VariSource: Ling, Marketing Operations of Dairy Cooperatives, Various Issuesous IssuesHoardHoard’’s Dairymen, Various Issuess Dairymen, Various Issues
Coop CR Values of U.S. Milk Marketed
15
25
35
45
55
65
75
1980 1987 1992 1997 2002 2007 2008
CR2 CR4 CR8CR10 CR20
Concentration in the Marketing of Farm MilkConcentration in the Marketing of Farm Milk
2323
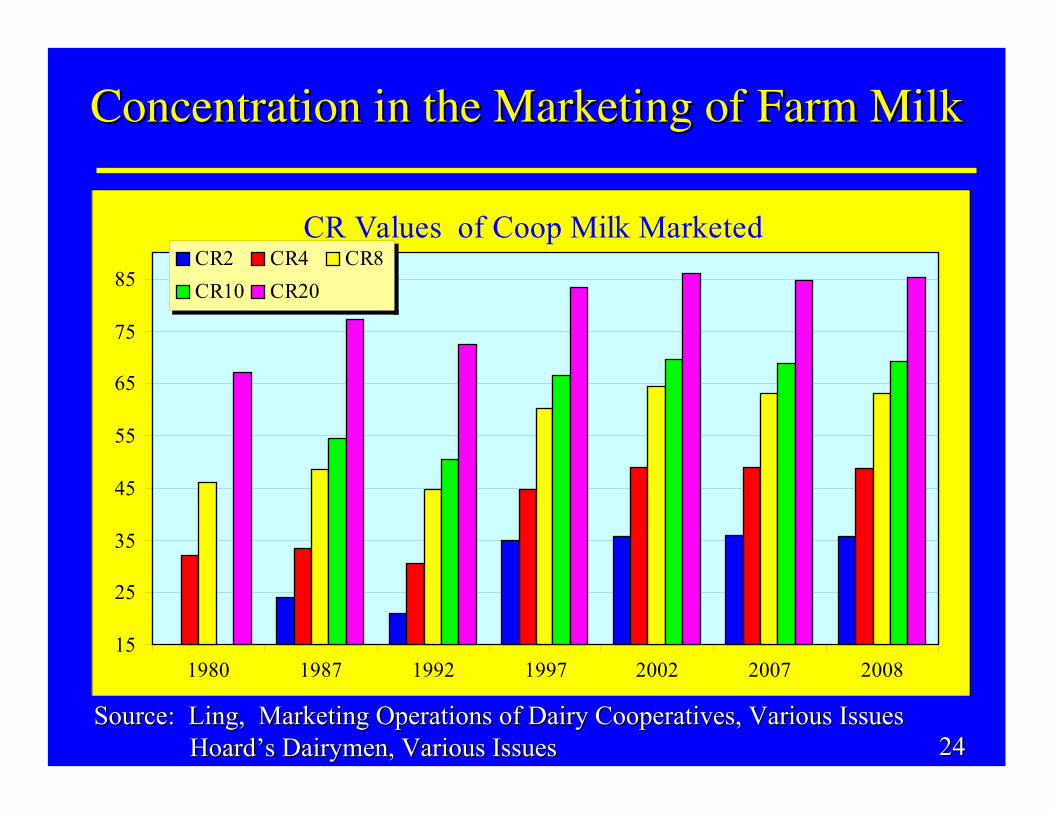
Source: Ling, Marketing Operations of Dairy Cooperatives, VariSource: Ling, Marketing Operations of Dairy Cooperatives, Various Issuesous IssuesHoardHoard’’s Dairymen, Various Issuess Dairymen, Various Issues
CR Values of Coop Milk Marketed
15
25
35
45
55
65
75
85
1980 1987 1992 1997 2002 2007 2008
CR2 CR4 CR8CR10 CR20
Concentration in the Marketing of Farm MilkConcentration in the Marketing of Farm Milk
2424

Concentration in the Marketing of Farm MilkConcentration in the Marketing of Farm Milk
Concentration in the marketing of farm milk: 2008Concentration in the marketing of farm milk: 2008
2.42.458.5958.5979794,6294,629Select Milk ProducersSelect Milk Producers1010
% of U.S. % of U.S. Prod.Prod.
Milk /Farm Milk /Farm (Mil Lbs)(Mil Lbs)
No. of No. of FarmsFarms
Milk Marketed Milk Marketed (Mil Lbs)(Mil Lbs)
82.382.33.47*3.47*43,448*43,448*156,399156,399All CooperativesAll Cooperatives
2.62.61.651.652,9452,9454,8574,857Manitowoc Milk Prod.Manitowoc Milk Prod.992.62.62.122.122,3562,3564,9904,990Foremost FarmsForemost Farms883.03.01.611.613,5633,5635,7515,751Family DairiesFamily Dairies773.13.11.661.663,5003,5005,8005,800AMPI (North Central)AMPI (North Central)663.13.12.612.612,2642,2645,9145,914DairyleaDairylea CooperativeCooperative554.24.214.8514.855325327,9007,900NW Dairy Assoc.NW Dairy Assoc.446.76.74.294.292,9652,96512,70612,706Land Land ‘‘O LakesO Lakes339.39.330.0530.0558958917,70017,700California DairiesCalifornia Dairies22
20.020.03.723.7210,17810,17837,90037,900DFADFA11
Note: * values for top 50 dairy cooperativesNote: * values for top 50 dairy cooperatives 2525

Source: 2001, GAOSource: 2001, GAO76.576.576.876.885.085.093.293.271.571.563.563.564.764.797.163.863.885.285.269.669.671.571.5
Dec '99Dec '99
74.774.772.472.411 11 MktMkt AverageAverage77.077.077.177.1Washington D.C.Washington D.C.84.284.284.884.8SeattleSeattle89.089.085.485.4Salt Lake CitySalt Lake City69.969.961.561.5New OrleansNew Orleans57.057.059.359.3MinneapolisMinneapolis62.762.763.163.1MilwaukeeMilwaukee98.296.596.5DallasDallas63.963.961.661.6CincinnatiCincinnati79.579.577.677.6CharlotteCharlotte70.470.468.568.5BostonBoston69.969.961.561.5AtlantaAtlanta
Dec '98Dec '98Dec '97Dec '97Market AreaMarket Area
Share of Milk Delivered by Four Largest Dairy CoopsShare of Milk Delivered by Four Largest Dairy Coops
U.S. CR41997: 35.82002: 40.22008: 40.1
Concentration in the Marketing of Farm MilkConcentration in the Marketing of Farm Milk
2626

Dairy Industry: Information on Milk Prices and Dairy Industry: Information on Milk Prices and Changing Market StructureChanging Market Structure
GAOGAO--0101--561, June 2001561, June 2001
Dairy processing firms have become dominant Dairy processing firms have become dominant wholesale level playerswholesale level players
Similar to milk marketing business strategySimilar to milk marketing business strategyAcquire regional dairy processing plantsAcquire regional dairy processing plants
Concentration in Dairy ManufacturingConcentration in Dairy Manufacturing
2727

An argument has been made that another reason for An argument has been made that another reason for processing consolidation is the response to retail level processing consolidation is the response to retail level consolidationconsolidation
Dean Foods proposed 2009 purchase of 2 fluid Dean Foods proposed 2009 purchase of 2 fluid bottling plants from Foremost Farms in WIbottling plants from Foremost Farms in WI
““As food retailers consolidate to gain market share As food retailers consolidate to gain market share and operating efficiencies, Foremost Farms has been and operating efficiencies, Foremost Farms has been challenged to efficiently supply customers who have a challenged to efficiently supply customers who have a significant regional or national presence and prefer significant regional or national presence and prefer to have a sole supplierto have a sole supplier..””------ Dave Dave FuhrmannFuhrmann, , President, Foremost Farms, 4/7/2009President, Foremost Farms, 4/7/2009
Concentration in Dairy ManufacturingConcentration in Dairy Manufacturing
2828

Dairy processing firms have become dominant Dairy processing firms have become dominant wholesale level playerswholesale level players
SuizaSuiza Foods and Dean Foods purchase more than 50 Foods and Dean Foods purchase more than 50 dairy processors over the 1997dairy processors over the 1997--2000 period2000 periodImportance of Dean Foods and Importance of Dean Foods and SuizaSuiza prior to mergerprior to merger
Concentration in Dairy ManufacturingConcentration in Dairy Manufacturing
333,2553,255115,3655,36520002000333,2003,200224,2374,23719991999223,0003,000332,8202,82019981998332,1002,100441,7201,72019971997221,6001,600323246946919961996551,4001,400404037937919951995
RankRankMil $Mil $RankRankMil $Mil $Dean FoodsDean FoodsSuizaSuiza
2929

April 2001, April 2001, SuizaSuiza acquires Dean Foodsacquires Dean FoodsCombined company processes 33% of U.S. fluid milkCombined company processes 33% of U.S. fluid milkCombined company keeps DeanCombined company keeps Dean’’s name and s name and headquartered in Dallasheadquartered in Dallas
Dean Foods recent major acquisitionsDean Foods recent major acquisitions
Horizon Organic Holding Co.Horizon Organic Holding Co.20042004White Wave, Inc.White Wave, Inc.20022002
Foremost Farms 2 Bottling PlantsForemost Farms 2 Bottling PlantsAlproAlpro division of division of VandemoorteleVandemoortele N.V.N.V.
20092009
Company AcquiredCompany AcquiredYearYear
Concentration in Dairy ManufacturingConcentration in Dairy Manufacturing
3030

National concentration ratios in dairy processingNational concentration ratios in dairy processing
National values hide concentration within local areas and National values hide concentration within local areas and commoditiescommodities
55.055.036.936.921.821.814.614.619951995
46.146.146.546.544.944.9
CR10CR10
67.367.366.166.164.564.5
CR20CR20
28.228.218.918.92008200828.528.517.417.42001200126.826.815.915.919991999
CR4CR4CR2CR2YearYear
Concentration in Dairy ManufacturingConcentration in Dairy Manufacturing
Source: Dairy Foods, Top 100, various issues.Source: Dairy Foods, Top 100, various issues.
3131
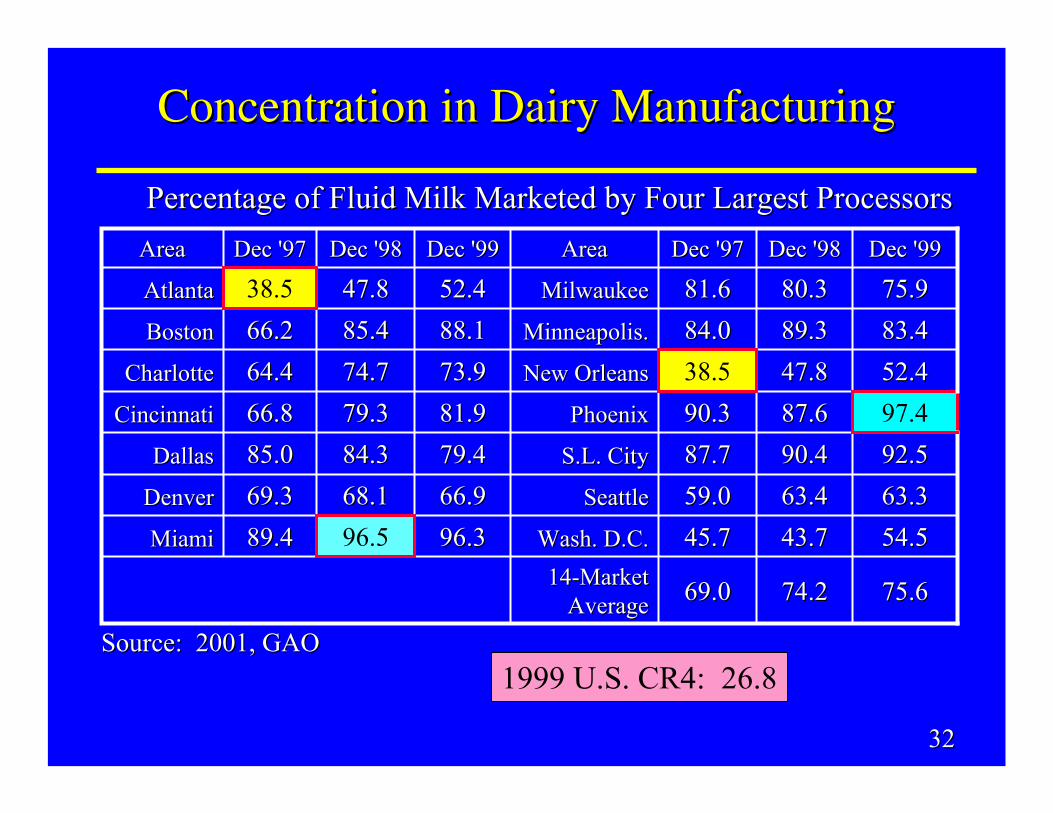
Source: 2001, GAOSource: 2001, GAO
54.554.543.743.745.745.7Wash. D.C.Wash. D.C.96.396.396.589.489.4MiamiMiami
66.966.979.479.481.981.973.973.988.188.152.452.4
Dec '99Dec '99
68.168.184.384.379.379.374.774.785.485.447.847.8
Dec '98Dec '98
69.369.385.085.066.866.864.464.466.266.238.5
Dec '97Dec '97
DenverDenver
DallasDallas
CincinnatiCincinnati
CharlotteCharlotte
BostonBoston
AtlantaAtlanta
AreaArea
75.675.6
63.363.392.592.597.452.452.483.483.475.975.9
Dec '99Dec '99
74.274.269.069.01414--Market Market AverageAverage
63.463.459.059.0SeattleSeattle
90.490.487.787.7S.L. CityS.L. City
87.687.690.390.3PhoenixPhoenix
47.847.838.5New OrleansNew Orleans
89.389.384.084.0Minneapolis.Minneapolis.
80.380.381.681.6MilwaukeeMilwaukee
Dec '98Dec '98Dec '97Dec '97AreaArea
Percentage of Fluid Milk Marketed by Four Largest ProcessorsPercentage of Fluid Milk Marketed by Four Largest Processors
3232
Concentration in Dairy ManufacturingConcentration in Dairy Manufacturing
1999 U.S. CR4: 26.8

Antitrust suit filed against DFA, Dean FoodsAntitrust suit filed against DFA, Dean Foods ----Cheese Market News, October 9, 2009Cheese Market News, October 9, 2009
Private class action lawsuitPrivate class action lawsuitDean and Hood bottle 90% of fluid milk in the Dean and Hood bottle 90% of fluid milk in the NortheastNortheastSuite alleges unlawful agreements between Dean, Suite alleges unlawful agreements between Dean, DFA, Dairy Marketing Services and Hood to DFA, Dairy Marketing Services and Hood to reduce farm pricesreduce farm prices
DFA says recent allegations are without basisDFA says recent allegations are without basis ----Cheese Market News, October 16, 2009Cheese Market News, October 16, 2009
Background story can be found at:Background story can be found at:http://http://future.aae.wisc.edu/publications/dfa_suit.pdffuture.aae.wisc.edu/publications/dfa_suit.pdf
Concentration in Dairy ManufacturingConcentration in Dairy Manufacturing
3333

Contact InformationContact Information
Univ. of Wisconsin Understanding Dairy MarketsWebsite: http://future.aae.wisc.edu
Brian W. Gould(608)[email protected]