Embed Size (px)
Citation preview

www.dbsvickers.com
ed- JS / sa- CW
Awakening of the rising giants
• Dairy demand should continue to outperform the F&B sector on favourable consumption trends in the medium term
• Prefer downstream dairy giants over upstream players; cautious on infant milk formula plays on pricing pressure concerns
• Stock picks: China Mengniu and Bright Dairy
Expect dairy to outperform overall F&B sector. Despite near term challenges, dairy demand should continue to outstrip most other F&B segments, on consumption upgrades and continuing shift towards products with healthy proposition. But the change in competitive landscape (as more global players get in), as well as shift in distribution channels (in particularly e-commerce) and supply dynamics (local production vs imported raw milk sources) would have different implications on different players along the dairy supply chain.
Prefer downstream; pricing pressure for infant formula and upstream. We are more positive on downstream dairy players, in particularly market leaders such as Mengniu and Yili. A segment where market concentration is the highest along the chain, we expect leaders will continue to gain market share given their dominant presence, strong product innovation ability and ASP flexibility. We are cautious however, on the infant milk formula market which remains very fragmented in China with downward pricing pressure going forward. As for upstream dairy farms, their near-term profitability would undoubtedly be affected by the sharp decline in raw milk prices since last year, but in the longer run, major players in the field should still have room for market share gains as industry consolidation continues.
Top picks – China Mengniu and Bright Dairy. We maintain our BUY rating on China Mengniu as we expect the company to record consistent earnings growth with its JV with Danone providing a new earnings driver in the medium to longer term. We initiate coverage on Bright Dairy with BUY given its strong foothold in East China with room for further earnings upside as scale ramps up and impact from its acquisitions kick in. In the longer run, the increasing popularity of pasteurised milk would make Bright Dairy a key beneficiary. While we are cautious on the near term earnings outlook for upstream farms, we maintain our BUY rating on China Modern Dairy as current valuation should have already priced in the weaker outlook, with the company remaining as a key beneficiary of market consolidation.
HSI: 25,399
ANALYST Alice HUI CFA, +852 2971 1960 [email protected] Alison Fok +852 2971 1938 [email protected]
Recommendation & valuation
PriceLocal$
T argetPrice
Local$
Upside%
Rec F Y16PE (x)
MktCap
US$bn
Bright Dairy 'A'(600597 CH)
CNY 18.08 19.70 9 Buy 25.2 3.6
China Mengniu Dairy(2319 HK)
HKD 38.35 47.10 23 Buy 19.6 9.7
China Modern Dairy(1117 HK)
HKD 2.53 3.35 32 Buy 9.1 1.7
Yashili International̂(1230 HK)
HKD 2.27 n.a. n.a. NR 18.8 1.4
Inner Mongolia Yili'A'^ (600887 CH)
CNY 18.63 n.a. n.a. NR 17.7 18.4
Biostime International̂(1112 HK)
HKD 21.60 n.a. n.a. NR 11.3 1.7
China Huishan Dairy#^(6863 HK)
HKD 2.17 n.a. n.a. NR 16.1 4.0
^ Consensus
# FY16: FY17
Source: Thomson Reuters, DBS Vickers
DBS Group Research . Equity 24 July 2015
China / Hong Kong Industry Focus
China Dairy Sector
Refer to important disclosures at the end of this report

Industry Focus
China Dairy Sector
Page 2
Table of Contents
Dairy growth to outperform overall F&B sector 3
Liquid milk and milk beverages – product upgrades are keys 5
Upstream dairy farms – Margin pressure from raw milk price decline 10
Infant formula – plagued by price wars and channel evolution 14
Stock recommendation 18
Stock Profiles 22
Bright Dairy & Food (600597 CH) 22
China Mengniu Dairy (2319 HK) 42
China Modern Dairy (1117 HK) 48
Yashili International (1230 HK) 54
Inner Mongolia Yili (600887 CH) 58
Biostime International (1112 HK) 62
China Huishan Dairy (6863 HK) 66
Appendix 70
PE & PB band charts 78
Industry Focus
China Dairy Sector
Page 3
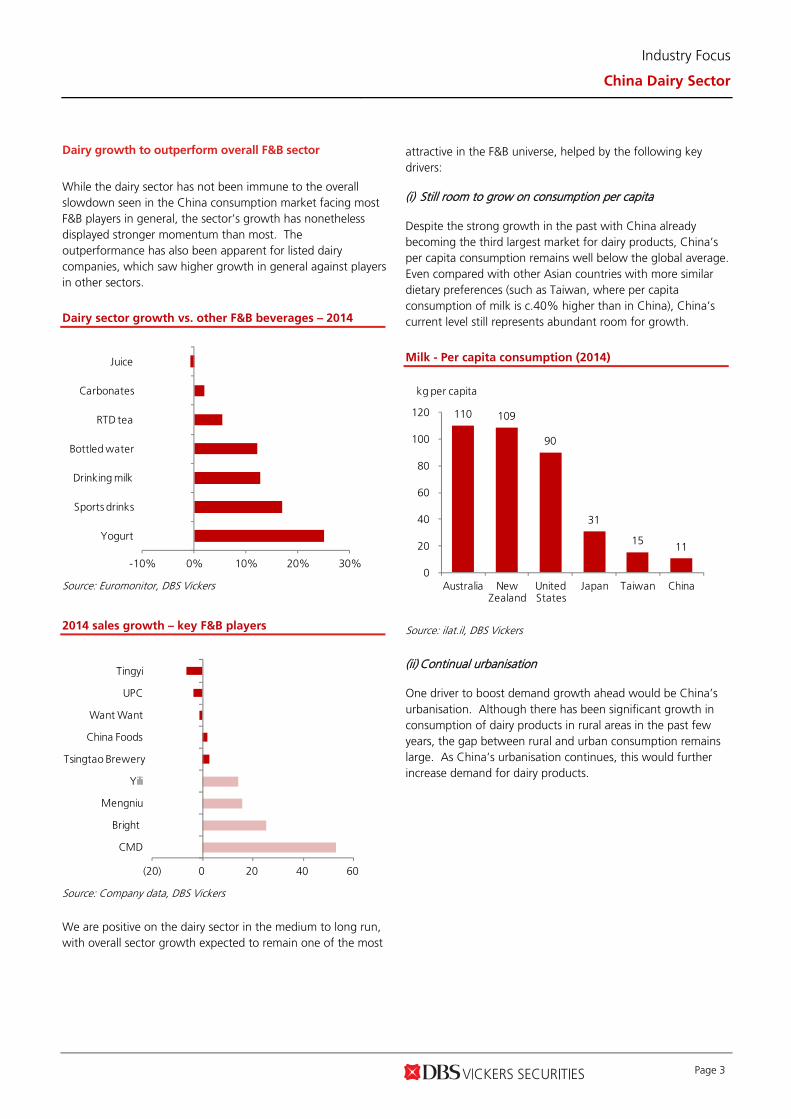
Dairy growth to outperform overall F&B sector
While the dairy sector has not been immune to the overall slowdown seen in the China consumption market facing most F&B players in general, the sector’s growth has nonetheless displayed stronger momentum than most. The outperformance has also been apparent for listed dairy companies, which saw higher growth in general against players in other sectors.
Dairy sector growth vs. other F&B beverages – 2014
-10% 0% 10% 20% 30%
Yogurt
Sports drinks
Drinking milk
Bottled water
RTD tea
Carbonates
Juice
Source: Euromonitor, DBS Vickers
2014 sales growth – key F&B players
(20) 0 20 40 60
CMD
Bright
Mengniu
Yili
Tsingtao Brewery
China Foods
Want Want
UPC
Tingyi
Source: Company data, DBS Vickers
We are positive on the dairy sector in the medium to long run, with overall sector growth expected to remain one of the most
attractive in the F&B universe, helped by the following key drivers:
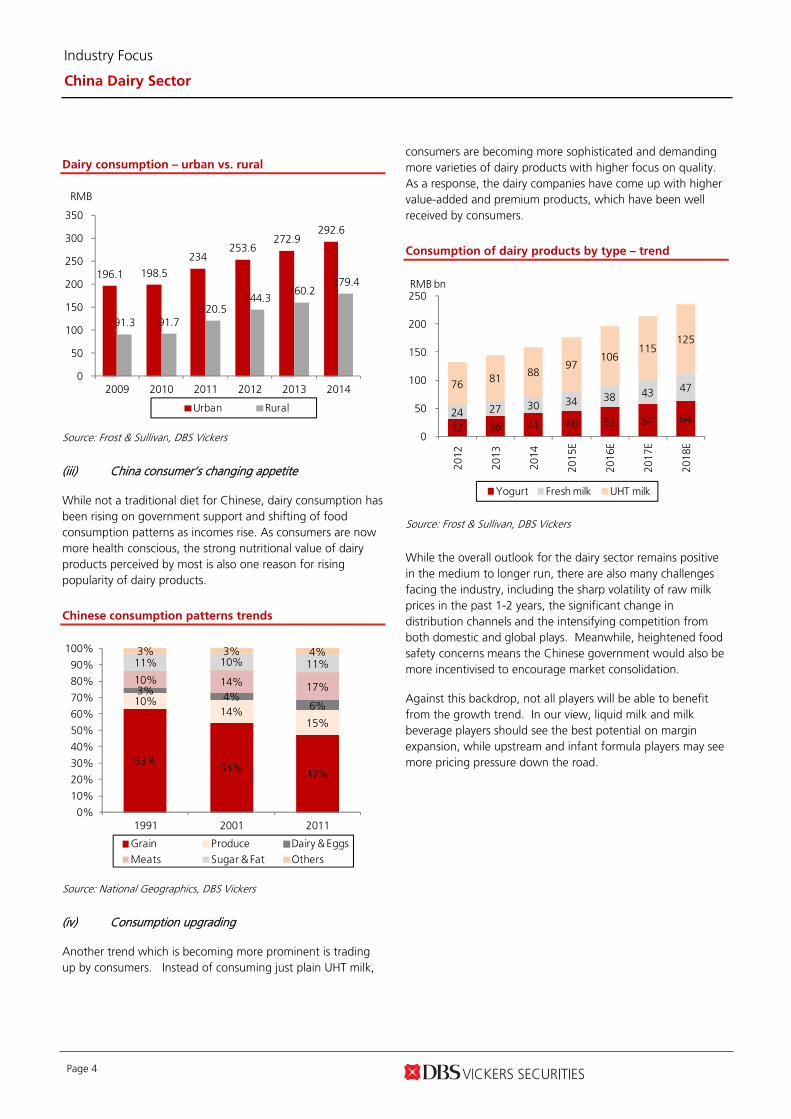
(i) Still room to grow on consumption per capita
Despite the strong growth in the past with China already becoming the third largest market for dairy products, China’s per capita consumption remains well below the global average. Even compared with other Asian countries with more similar dietary preferences (such as Taiwan, where per capita consumption of milk is c.40% higher than in China), China’s current level still represents abundant room for growth.
Milk - Per capita consumption (2014)
110 109
90
31
15 11
0
20
40
60
80
100
120
Australia New Zealand
United States
Japan Taiwan China
kg per capita
Source: ilat.il, DBS Vickers
(ii) Continual urbanisation
One driver to boost demand growth ahead would be China’s urbanisation. Although there has been significant growth in consumption of dairy products in rural areas in the past few years, the gap between rural and urban consumption remains large. As China’s urbanisation continues, this would further increase demand for dairy products.
Industry Focus
China Dairy Sector
Page 4
Dairy consumption – urban vs. rural
196.1 198.5
234253.6
272.9292.6
91.3 91.7120.5
144.3160.2
179.4
0
50
100
150
200
250
300
350
2009 2010 2011 2012 2013 2014
RMB
Urban Rural
Source: Frost & Sullivan, DBS Vickers
(iii) China consumer’s changing appetite
While not a traditional diet for Chinese, dairy consumption has been rising on government support and shifting of food consumption patterns as incomes rise. As consumers are now more health conscious, the strong nutritional value of dairy products perceived by most is also one reason for rising popularity of dairy products.
Chinese consumption patterns trends
63%54% 47%
10%14%
15%
3% 4%6%
10% 14% 17%
11% 10% 11%3% 3% 4%
0%
10%
20%
30%
40%
50%
60%
70%
80%
90%
100%
1991 2001 2011
Grain Produce Dairy & EggsMeats Sugar & Fat Others
Source: National Geographics, DBS Vickers
(iv) Consumption upgrading
Another trend which is becoming more prominent is trading up by consumers. Instead of consuming just plain UHT milk,
consumers are becoming more sophisticated and demanding more varieties of dairy products with higher focus on quality. As a response, the dairy companies have come up with higher value-added and premium products, which have been well received by consumers.
Consumption of dairy products by type – trend
32 36 41 46 52 57 64 24 27 30 34 38 43 47 76 81 88
97 106
115 125
0
50
100
150
200
250
2012
2013
2014
2015
E
2016
E
2017
E
2018
E
RMB bn
Yogurt Fresh milk UHT milk
Source: Frost & Sullivan, DBS Vickers
While the overall outlook for the dairy sector remains positive in the medium to longer run, there are also many challenges facing the industry, including the sharp volatility of raw milk prices in the past 1-2 years, the significant change in distribution channels and the intensifying competition from both domestic and global plays. Meanwhile, heightened food safety concerns means the Chinese government would also be more incentivised to encourage market consolidation.
Against this backdrop, not all players will be able to benefit from the growth trend. In our view, liquid milk and milk beverage players should see the best potential on margin expansion, while upstream and infant formula players may see more pricing pressure down the road.
Industry Focus
China Dairy Sector
Page 5
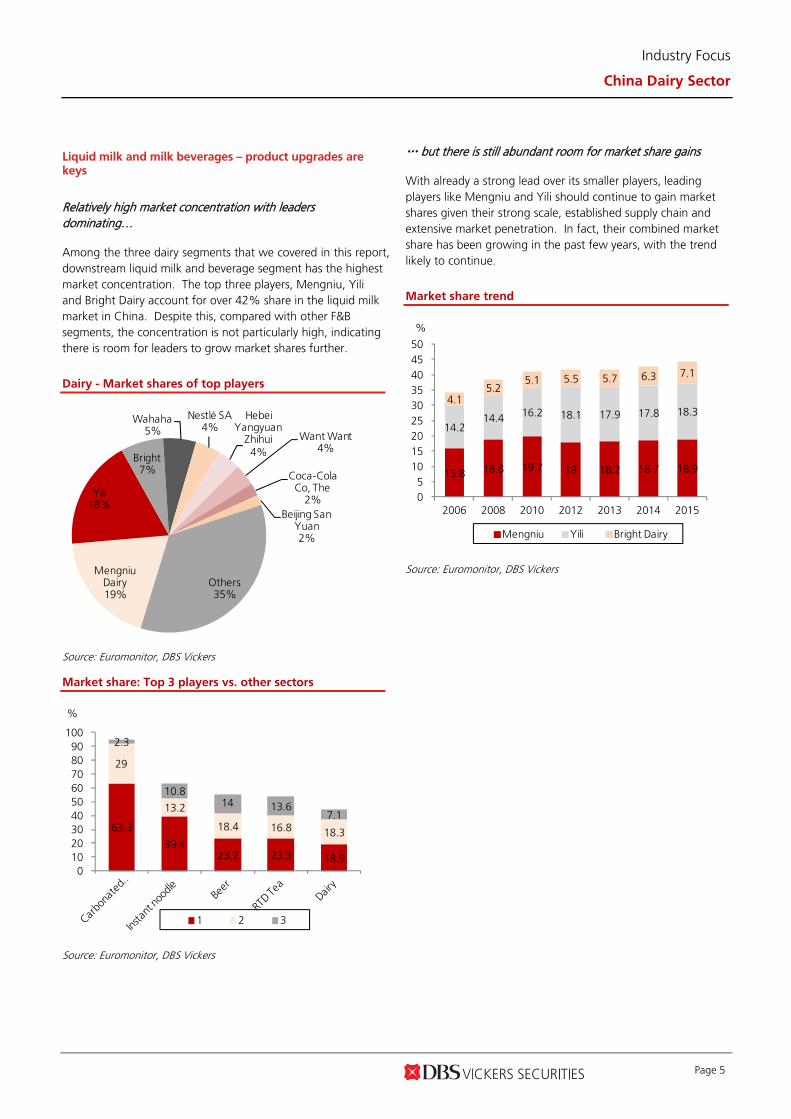
Liquid milk and milk beverages – product upgrades are keys
Relatively high market concentration with leaders dominating…
Among the three dairy segments that we covered in this report, downstream liquid milk and beverage segment has the highest market concentration. The top three players, Mengniu, Yili and Bright Dairy account for over 42% share in the liquid milk market in China. Despite this, compared with other F&B segments, the concentration is not particularly high, indicating there is room for leaders to grow market shares further.
Dairy - Market shares of top players
Mengniu Dairy19%
Yili18%
Bright7%
Wahaha 5%
Nestlé SA4%
Hebei Yangyuan
Zhihui 4%
Want Want 4%
Coca-Cola Co, The
2%Beijing San
Yuan 2%
Others35%
Source: Euromonitor, DBS Vickers
Market share: Top 3 players vs. other sectors
63.3
39.423.2 23.3 18.9
29
13.2
18.4 16.8 18.3
2.3
10.814 13.6
7.1
0 10 20 30 40 50 60 70 80 90
100
%
1 2 3
Source: Euromonitor, DBS Vickers
… but there is still abundant room for market share gains
With already a strong lead over its smaller players, leading players like Mengniu and Yili should continue to gain market shares given their strong scale, established supply chain and extensive market penetration. In fact, their combined market share has been growing in the past few years, with the trend likely to continue.
Market share trend
15.8 18.8 19.7 18 18.2 18.7 18.9
14.214.4 16.2 18.1 17.9 17.8 18.3
4.15.2
5.1 5.5 5.7 6.3 7.1
0 5
10 15 20 25 30 35 40 45 50
2006 2008 2010 2012 2013 2014 2015
%
Mengniu Yili Bright Dairy
Source: Euromonitor, DBS Vickers

Industry Focus
China Dairy Sector
Page 6
Intense competition at the mass-end, yet a necessity
While we expect top players to maintain their leading positions in the UHT plain milk category, the real growth drivers should come from new and value-added products or new categories. The mass market UHT plain milk category, although still a big component of dairy sales, is already a commoditised market where even key players are not having much pricing power. This is also a market where we see increasing, and viable, competition coming from imported UHT milk through the e-commerce channel.
China UHT milk imports
(50)
0
50
100
150
200
250
0
5,000
10,000
15,000
20,000
25,000
30,000
35,000
40,000
Oct
-13
Dec
-13
Feb-
14
Apr
-14
Jun-
14
Aug
-14
Oct
-14
Dec
-14
Feb-
15
Apr
-15
MT
Fresh milk % yoy
%
Source: WIND, DBS Vickers
UHT milk pricing comparison: local brands vs imported brands
Name Origin Size (xno) Price Price/ml
Internat ional ML RMB RMB
Dev ondale New Zealand 200 x 24 79.0 0.016
A nchor Australia 250 x 24 94.0 0.016
Weidendor Germany 200 x 30 79.0 0.013
Oldenburger Germany 200 x 24 69.9 0.015
Meadow F resh New Zealand 250 x 24 69.9 0.012
0.014
Premium local UHT milk
Mengniu - Milk Deluxe 250 x 12 52.5 0.018
Bright Dairy - U+ 250 x 12 39.8 0.013
Y ili - Satine 240 x 12 50.6 0.018
China Modern Dairy - Modern Farming 250 x 12 42.8 0.014
New Hope - Hobuxun 250 x 12 39.0 0.013
0.015
Source: YHD.com, DBS Vickers
Growth to be driven by new products…
To tackle this, domestic leaders have been increasingly focusing on newer and valued-added products. Following the success of Mengniu’s Milk Deluxe, which created a whole new premium milk market in China (market size now estimated at c.Rmb35bn), the good market reception of UHT yogurt, first launched by Bright Dairy in 2010, is another such example.
Bright Dairy – market share in yogurt had double since launch of UHT yogurt Momchilovtsi
10 12 11 11
13 15
18
22 23
0
5
10
15
20
25
2007
2008
2009
2010
2011
2012
2013
2014
2015
%
Launch of Momchilovtsi
Source: Euromonitor, DBS Vickers
… an area where domestic players have clear advantages
For the downstream liquid milk and dairy beverages market, we expect new products would be the key to drive growth, as well as margins. Domestic brands, given their better understanding of consumer tastes and preferences, are in stronger positions compared to their international peers. This, coupled with their extensive distribution network, should continue to give domestic leaders some competitive advantages in launching new products and categories.
Room for margin expansion
We expect launch of new premium products to remain the key focus for most domestic players. The resultant improvement in product mix, coupled with lower raw milk costs, bodes well for margins going forward. Currently, operating margins for the three major domestic players range between 2-6%, below international peer (Danone at 10% in FY14), partly on differences in product mix.

Industry Focus
China Dairy Sector
Page 7
China raw milk cost
2.00
2.50
3.00
3.50
4.00
4.50
Jul-1
0
Nov
-10
Mar
-11
Jul-1
1
Nov
-11
Mar
-12
Jul-1
2
Nov
-12
Mar
-13
Jul-1
3
Nov
-13
Mar
-14
Jul-1
4
Nov
-14
Mar
-15
Jul-1
5
RMB/kg
Source: CEIC, DBS Vickers
Operating margins – Mengniu, Yili, Bright Dairy
0
1
2
3
4
5
6
7
8
9
2010 2011 2012 2013 2014
Mengniu Bright Yili
%
Source: CEIC, DBS Vickers
Is fresh the next big trend?
Pasteurised milk definitely has strong potential and despite good growth in the past few years; it still represents a relatively small portion of overall dairy consumption. As consumers continue to trade up, together with continual development of the cold chain infrastructure in China, pasteurized milk, as well as other “fresh” products (such as cheese and butter), should see further penetration into China. In fact, Mengniu has been increasingly active in pursuing the refrigerated product category through its JV with Danone.
Breakdown of current dairy retail sales %
Cheese1%
Flavoured Milk Drinks
31%Milk -Fresh8%
Milk - UHT28%
Powder Milk5% Yoghurt
and Sour Milk Drinks
26%
Other Dairy1%
Source: Euromonitor, DBS Vickers
Given that production of fresh dairy products such as pasteurized milk would require support of consistent local source of quality raw milk, this would provide domestic dairy leaders some competitive advantages over their global peers given their established raw milk supply locally. Bright Dairy, with a long operating history in pasteurized milk manufacturing, is the leader in this market. Its pending acquisition of Tnuva Food, which is well-known for its cottage cheese products in Israel, could also provide some advantages to Bright in expanding its product line to niche category such as cheese.

Industry Focus
China Dairy Sector
Page 8
Key financials
2010 2011 2012 2013 2014
Sales
Mengniu 30,265 37,388 36,080 43,357 50,049
Bright 9,572 11,789 13,775 16,290 20,385
Yili 29,665 37,451 41,991 47,779 54,436
Sales growth (%)
Mengniu 17.7 23.5 -3.5 20.2 15.4
Bright 20.5 23.2 16.8 18.3 25.1
Yili 22.0 26.2 12.1 13.8 13.9
Average 19.9 24.6 6.0 17.0 16.2
Gross margin (%)
Mengniu 25.7 25.7 25.1 27.0 30.8
Bright 34.0 32.9 34.6 34.2 34.2
Yili 30.0 28.7 29.1 28.2 32.8
Average 28.7 27.9 28.4 28.6 32.2
Operat ing margin (%)
Mengniu 4.8 5.1 4.1 4.3 5.3
Bright 2.2 1.7 2.6 3.8 3.9
Yili 1.9 4.4 4.1 5.5 8.3
Average 3.0 3.7 3.6 4.5 5.9
Net prof it (RMB m)
Mengniu 1,237 1,589 1,257 1,631 2,351
Bright 194 238 311 406 568
Yili 777 1,809 1,717 3,187 4,144
Net margin (%)
Mengniu 4.1 4.3 3.5 3.8 4.7
Bright 2.0 2.0 2.3 2.5 2.8
Yili 2.6 4.8 4.1 6.7 7.6
Average 3.2 4.2 3.6 4.9 5.7
Net cash (debt ) (RMB m)
Mengniu 5,707 6,099 6,264 5,416 (4,034)
Bright 1,319 584 929 (578) 4,087
Yili 734 314 (366) 838 1,314
CA PEX (RMB m)
Mengniu (1,084) (2,293) (1,960) (2,867) (2,931)
Yili (1,987) (3,789) (3,102) (3,241) (3,946)
Bright (343) (977) (1,091) (1,195) (1,796)
Operat ing cash f low (RMB m)
Mengniu 2,485 2,520 2,007 3,284 3,080
Yili 1,475 3,670 2,409 5,475 2,436
Bright 534 89 1,242 1,305 336
Source: Company data, DBS Vickers
Industry Focus
China Dairy Sector
Page 9
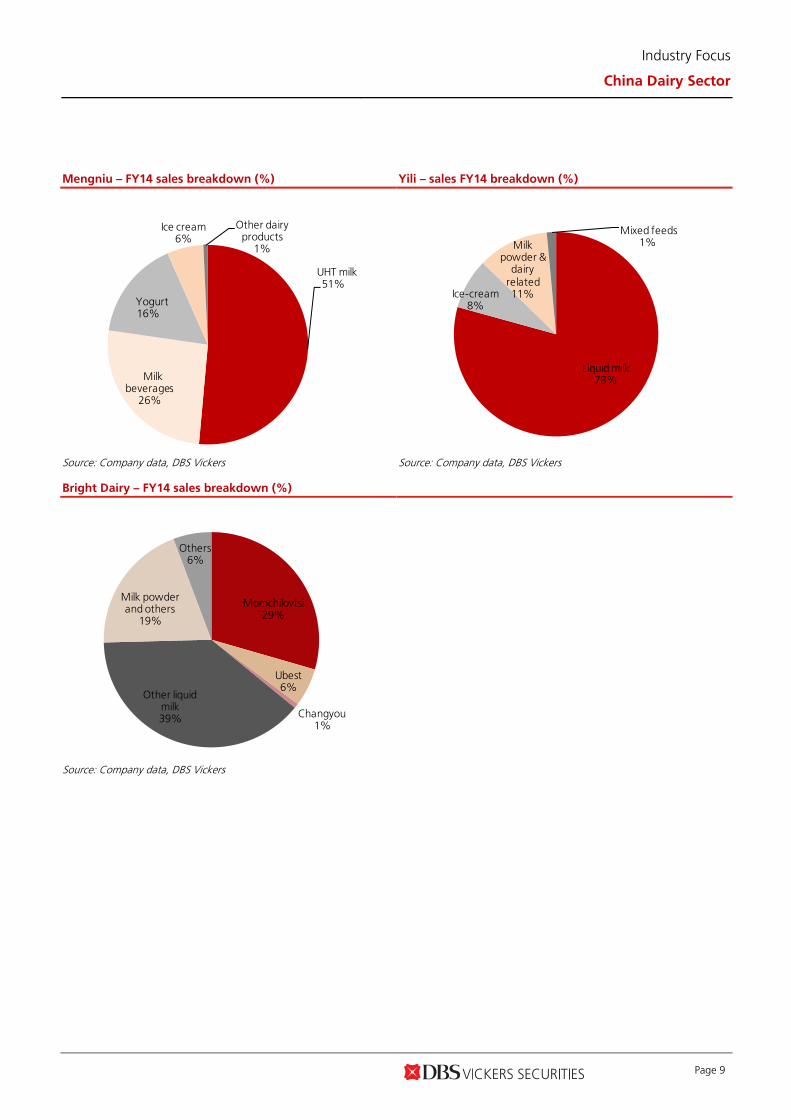
Mengniu – FY14 sales breakdown (%)
Yili – sales FY14 breakdown (%)
UHT milk51%
Milk beverages
26%
Yogurt16%
Ice cream6%
Other dairy products
1%
Liquid milk78%
Ice-cream8%
Milk powder &
dairy related 11%
Mixed feeds1%
Source: Company data, DBS Vickers Source: Company data, DBS Vickers
Bright Dairy – FY14 sales breakdown (%)
Momchilovtsi29%
Ubest6%
Changyou1%
Other liquid milk39%
Milk powder and others
19%
Others6%
Source: Company data, DBS Vickers
Industry Focus
China Dairy Sector
Page 10
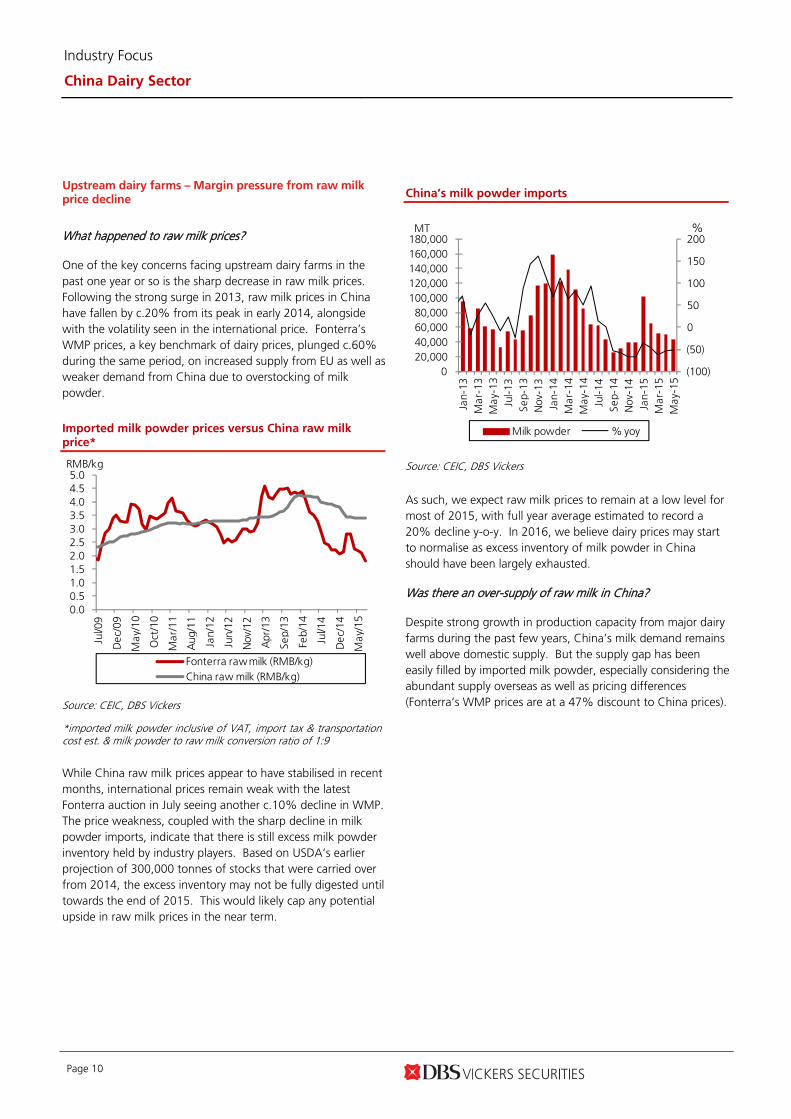
Upstream dairy farms – Margin pressure from raw milk price decline
What happened to raw milk prices?
One of the key concerns facing upstream dairy farms in the past one year or so is the sharp decrease in raw milk prices. Following the strong surge in 2013, raw milk prices in China have fallen by c.20% from its peak in early 2014, alongside with the volatility seen in the international price. Fonterra’s WMP prices, a key benchmark of dairy prices, plunged c.60% during the same period, on increased supply from EU as well as weaker demand from China due to overstocking of milk powder.
Imported milk powder prices versus China raw milk price*
0.0 0.5 1.0 1.5 2.0 2.5 3.0 3.5 4.0 4.5 5.0
Jul/0
9
Dec
/09
May
/10
Oct
/10
Mar
/11
Aug
/11
Jan/
12
Jun/
12
Nov
/12
Apr
/13
Sep/
13
Feb/
14
Jul/1
4
Dec
/14
May
/15
RMB/kg
Fonterra raw milk (RMB/kg)China raw milk (RMB/kg)
Source: CEIC, DBS Vickers
*imported milk powder inclusive of VAT, import tax & transportation cost est. & milk powder to raw milk conversion ratio of 1:9
While China raw milk prices appear to have stabilised in recent months, international prices remain weak with the latest Fonterra auction in July seeing another c.10% decline in WMP. The price weakness, coupled with the sharp decline in milk powder imports, indicate that there is still excess milk powder inventory held by industry players. Based on USDA’s earlier projection of 300,000 tonnes of stocks that were carried over from 2014, the excess inventory may not be fully digested until towards the end of 2015. This would likely cap any potential upside in raw milk prices in the near term.
China’s milk powder imports
(100)
(50)
0
50
100
150
200
0 20,000 40,000 60,000 80,000
100,000 120,000 140,000 160,000 180,000
Jan-
13M
ar-1
3M
ay-1
3Ju
l-13
Sep-
13N
ov-1
3Ja
n-14
Mar
-14
May
-14
Jul-1
4Se
p-14
Nov
-14
Jan-
15M
ar-1
5M
ay-1
5
MT
Milk powder % yoy
%
Source: CEIC, DBS Vickers
As such, we expect raw milk prices to remain at a low level for most of 2015, with full year average estimated to record a 20% decline y-o-y. In 2016, we believe dairy prices may start to normalise as excess inventory of milk powder in China should have been largely exhausted.
Was there an over-supply of raw milk in China?
Despite strong growth in production capacity from major dairy farms during the past few years, China’s milk demand remains well above domestic supply. But the supply gap has been easily filled by imported milk powder, especially considering the abundant supply overseas as well as pricing differences (Fonterra’s WMP prices are at a 47% discount to China prices).

Industry Focus
China Dairy Sector
Page 11
Estimated supply gap in China
35.3 37.3 37.7 38.5 39.6 40.8
4952.3 54.8
58.663.7
69
13.7 15 17.120.1
24.128.2
0
10
20
30
40
50
60
70
80
2013 2014 2015E 2016E 2017E 2018E
m tonnes
Supply Demand Gap
Source: Euromonitor, DBS Vickers
We expect dairy demand in China will continue to be satisfied by a mix of both domestic and imported products. As such, local raw milk prices, to a certain extent, would still be highly affected by prices of imported milk powder. Despite this, domestic prices are likely to remain at a premium over international prices (given cost differences). And we do not expect imports to replace domestic raw milk production, as (i) there are products, such as those labeled as pure milk and pasteurised milk, which can only be produced from raw milk, and not milk powder; (ii) it is in the downstream producers’ interest to have a steady source of local raw milk to ensure a consistent supply; (iii) following the melamine incident in 2008, the government is encouraging the development of an integrated dairy supply chain, which is a necessity in order to ensure food safety.
Large-scale farms to gain market share
Despite the fast development of big scale farms in the past few years, which already represented 14.6% of total herd size in China in 2014 (vs 10% in 2009), there should still be further market consolidation as the market remains highly fragmented and smaller and less efficient players will continue be phased out.
Dairy farms distribution in China (based on herd size)
67% 59%47%
13%17%
24%
10%10%
11%
10% 15% 19%
0%
10%
20%
30%
40%
50%
60%
70%
80%
90%
100%
2009 2014 2018E
<100 heads 100-499 heads500-999 heads >1000 heads
Source: MoA, Frost & Sullivan, DBS Vickers
Major dairy farms in China & respective market share
Companies No. cows %
China Modern Dairy 201,507 1.4%Huishan Dairy 180,331 1.2%
Shengmu 103,252 0.7%Japfa 57,000 0.4%
Bright Dairy-related 50,000 0.3%Fontera 49,000 0.3%YST Dairy 44,623 0.3%
Zhongdi Dairy 21,433 0.1%
Top ten 707,146 4.9%
A s of 2014 (China) 14.5m
Source: Company data, CEIC, DBS Vickers
Near term margin pressure remains
While we see further growth potential for big scale farms in China, earnings outlook in the near term would nonetheless be affected by the low raw milk prices. YTD, raw milk prices of major farms such as CMD have declined by 8%, and are likely to remain at a relatively low level in 2H15. This would take a toll on margins, despite favourable feed costs and potential yield improvement.
Industry Focus
China Dairy Sector
Page 12
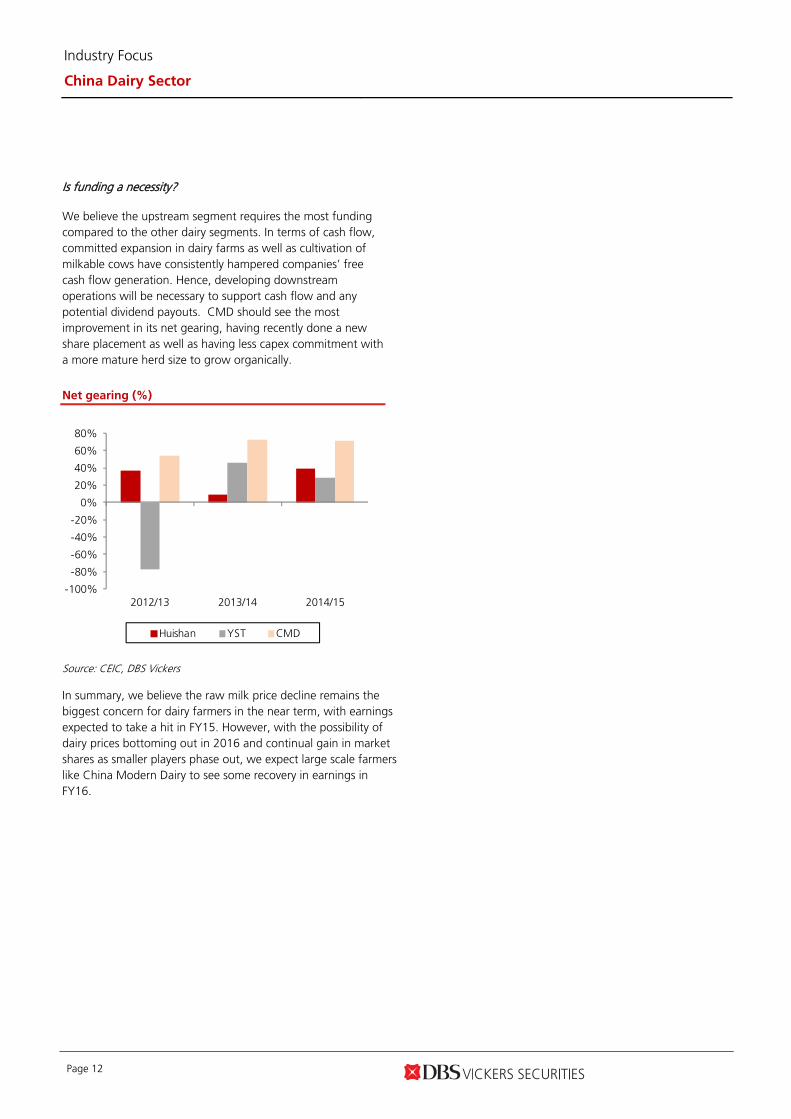
Is funding a necessity?
We believe the upstream segment requires the most funding compared to the other dairy segments. In terms of cash flow, committed expansion in dairy farms as well as cultivation of milkable cows have consistently hampered companies’ free cash flow generation. Hence, developing downstream operations will be necessary to support cash flow and any potential dividend payouts. CMD should see the most improvement in its net gearing, having recently done a new share placement as well as having less capex commitment with a more mature herd size to grow organically.
Net gearing (%)
-100%
-80%
-60%
-40%
-20%
0%
20%
40%
60%
80%
2012/13 2013/14 2014/15
Huishan YST CMD
Source: CEIC, DBS Vickers
In summary, we believe the raw milk price decline remains the biggest concern for dairy farmers in the near term, with earnings expected to take a hit in FY15. However, with the possibility of dairy prices bottoming out in 2016 and continual gain in market shares as smaller players phase out, we expect large scale farmers like China Modern Dairy to see some recovery in earnings in FY16.

Industry Focus
China Dairy Sector
Page 13
Upstream sector - Peer comparison
2011 2012 2013 2014
Consolidated sales (RMB m)China Modern Dairy 1,392 2,040 3,289 5,027
Huishan Dairy 1,333 2,552 3,530 3,923YST Dairy 149 689 881 1,163Upst ream sales (RMB m)
China Modern Dairy 1,384 1,978 2,968 4,194Huishan Dairy 1,143 1,825 1,240 1,491
YST Dairy 149 689 881 1,163Upst ream as % of total
China Modern Dairy 99 97 90 83Huishan Dairy 86 72 35 38
YST Dairy 100 100 100 100Downst ream sales (RMB m)China Modern Dairy 7 62 321 833
Huishan Dairy 190 727 2,290 2,432YST Dairy 0 0 0 0
Gross margin (%) - consolidatedChina Modern Dairy 20.0 22.0 25.0 16.4
Huishan Dairy 38.4 54.0 65.5 61.9YST Dairy 34.5 37.8 42.6 45.7Gross margin (%) - upst ream
China Modern Dairy 31% 32% 40% 41%Huishan Dairy 49% 59% 62% 60%
YST Dairy 35% 38% 43% 46%Herd size
China Modern Dairy 128,759 176,264 186,838 201,507Huishan Dairy 90,254 112,851 144,191 180,331YST Dairy 32,219 37,000 40,396 44,623
Milkable cows % of totalChina Modern Dairy 42 44 53 53
Huishan Dairy 35 44 43 41YST Dairy 46 56 53 58
Sales v olume (tonne/annum)China Modern Dairy 366,656 496,979 679,722 931,334Huishan Dairy 213,920 352,411 482,428 577,071
YST Dairy 35,722 168,070 183,702 230,121Raw milk A SP (conso)
China Modern Dairy 3.8 3.9 4.8 5.0Huishan Dairy 4.5 4.5 5.0 4.9
YST Dairy 4.2 4.1 4.8 5.1Milk y ield (tonne/annum)China Modern Dairy 7.8 7.9 8.5 8.9
Huishan Dairy 8.6 9.1 9.0 9.1YST Dairy 9.2 8.9 9.0 9.4
Source: Company data, DBS Vickers
Industry Focus
China Dairy Sector
Page 14
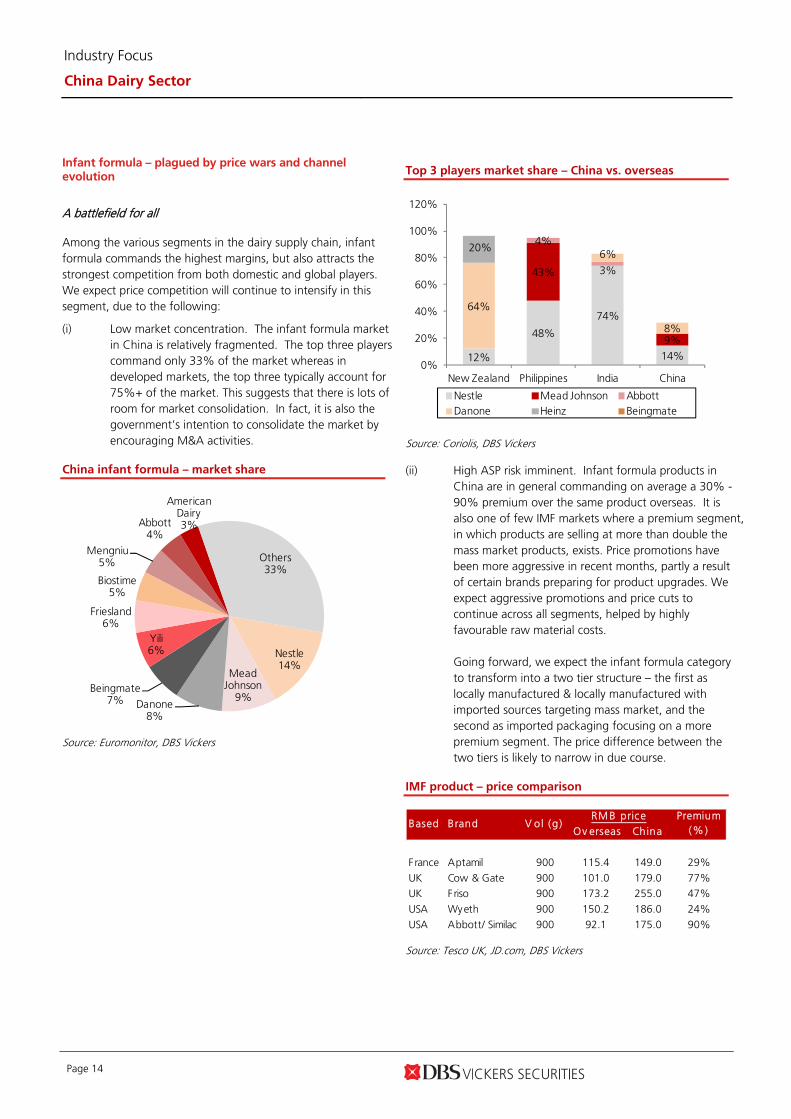
Infant formula – plagued by price wars and channel evolution
A battlefield for all
Among the various segments in the dairy supply chain, infant formula commands the highest margins, but also attracts the strongest competition from both domestic and global players. We expect price competition will continue to intensify in this segment, due to the following:
(i) Low market concentration. The infant formula market in China is relatively fragmented. The top three players command only 33% of the market whereas in developed markets, the top three typically account for 75%+ of the market. This suggests that there is lots of room for market consolidation. In fact, it is also the government’s intention to consolidate the market by encouraging M&A activities.
China infant formula – market share
Nestle14%
Mead Johnson
9%Danone
8%
Beingmate7%
Yili6%
Friesland6%
Biostime5%
Mengniu5%
Abbott4%
American Dairy3%
Others33%
Source: Euromonitor, DBS Vickers
Top 3 players market share – China vs. overseas
12%
48%
74%
14%
43%
9%
4%
3%
64%
6%
8%
20%
0%
20%
40%
60%
80%
100%
120%
New Zealand Philippines India China
Nestle Mead Johnson AbbottDanone Heinz Beingmate
Source: Coriolis, DBS Vickers
(ii) High ASP risk imminent. Infant formula products in China are in general commanding on average a 30% - 90% premium over the same product overseas. It is also one of few IMF markets where a premium segment, in which products are selling at more than double the mass market products, exists. Price promotions have been more aggressive in recent months, partly a result of certain brands preparing for product upgrades. We expect aggressive promotions and price cuts to continue across all segments, helped by highly favourable raw material costs. Going forward, we expect the infant formula category to transform into a two tier structure – the first as locally manufactured & locally manufactured with imported sources targeting mass market, and the second as imported packaging focusing on a more premium segment. The price difference between the two tiers is likely to narrow in due course.
IMF product – price comparison
Ov erseas China
F rance Aptamil 900 115.4 149.0 29%
UK Cow & Gate 900 101.0 179.0 77%UK Friso 900 173.2 255.0 47%
USA Wyeth 900 150.2 186.0 24%
USA Abbott/ Similac 900 92.1 175.0 90%
RM B priceBased Brand V ol (g)
Premium(%)
Source: Tesco UK, JD.com, DBS Vickers
Industry Focus
China Dairy Sector
Page 15
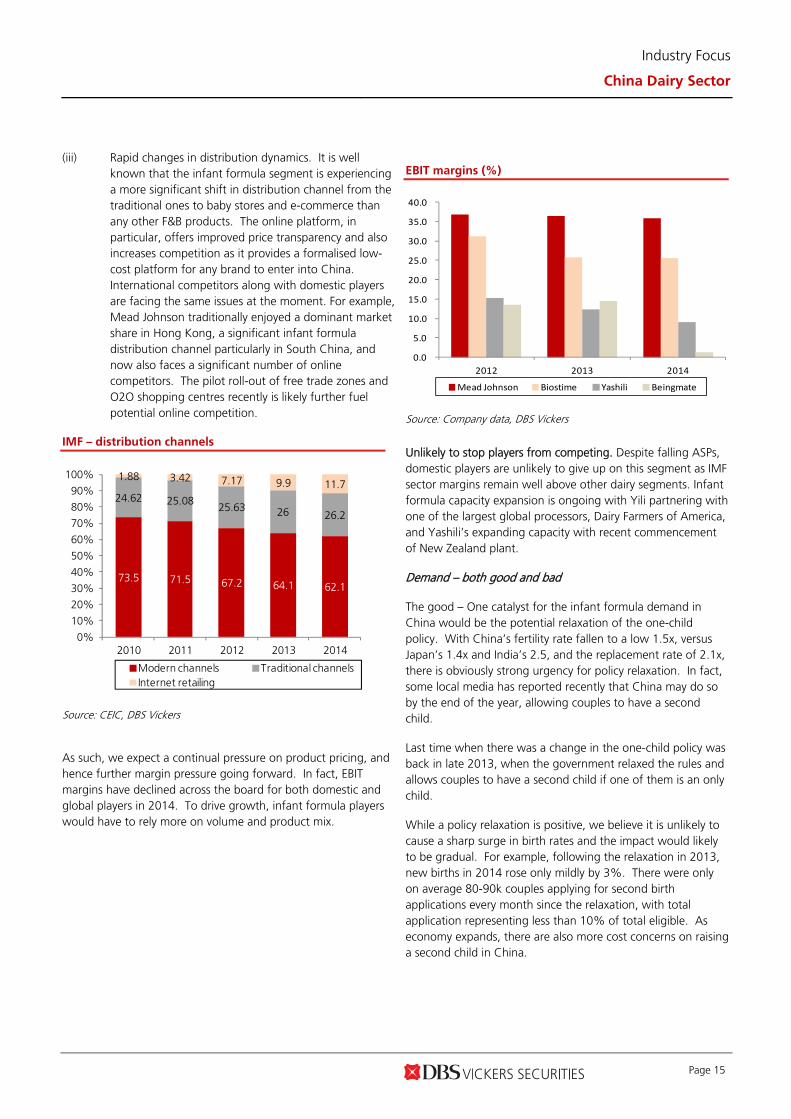
(iii) Rapid changes in distribution dynamics. It is well known that the infant formula segment is experiencing a more significant shift in distribution channel from the traditional ones to baby stores and e-commerce than any other F&B products. The online platform, in particular, offers improved price transparency and also increases competition as it provides a formalised low-cost platform for any brand to enter into China. International competitors along with domestic players are facing the same issues at the moment. For example, Mead Johnson traditionally enjoyed a dominant market share in Hong Kong, a significant infant formula distribution channel particularly in South China, and now also faces a significant number of online competitors. The pilot roll-out of free trade zones and O2O shopping centres recently is likely further fuel potential online competition.
IMF – distribution channels
73.5 71.5 67.2 64.1 62.1
24.62 25.0825.63 26 26.2
1.88 3.42 7.17 9.9 11.7
0%
10%
20%
30%
40%
50%
60%
70%
80%
90%
100%
2010 2011 2012 2013 2014
Modern channels Traditional channelsInternet retailing
Source: CEIC, DBS Vickers
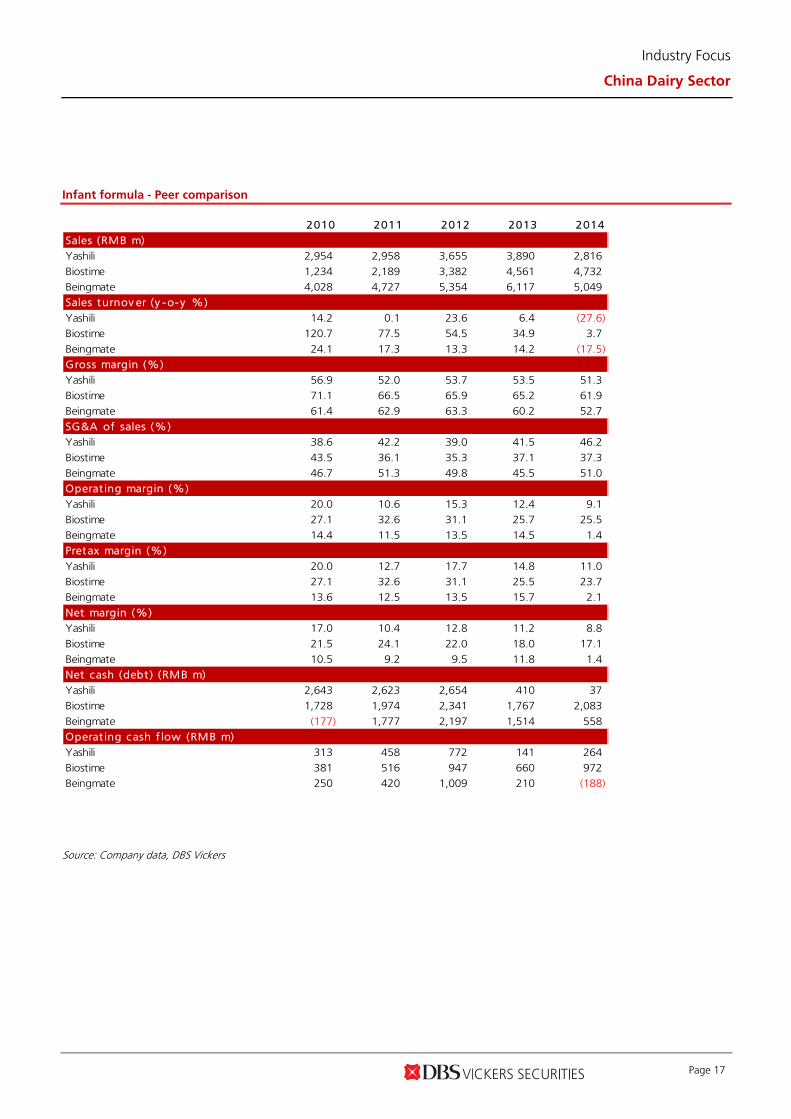
As such, we expect a continual pressure on product pricing, and hence further margin pressure going forward. In fact, EBIT margins have declined across the board for both domestic and global players in 2014. To drive growth, infant formula players would have to rely more on volume and product mix.
EBIT margins (%)
0.0
5.0
10.0
15.0
20.0
25.0
30.0
35.0
40.0
2012 2013 2014
Mead Johnson Biostime Yashili Beingmate
Source: Company data, DBS Vickers
Unlikely to stop players from competing. Despite falling ASPs, domestic players are unlikely to give up on this segment as IMF sector margins remain well above other dairy segments. Infant formula capacity expansion is ongoing with Yili partnering with one of the largest global processors, Dairy Farmers of America, and Yashili’s expanding capacity with recent commencement of New Zealand plant.
Demand – both good and bad
The good – One catalyst for the infant formula demand in China would be the potential relaxation of the one-child policy. With China’s fertility rate fallen to a low 1.5x, versus Japan’s 1.4x and India’s 2.5, and the replacement rate of 2.1x, there is obviously strong urgency for policy relaxation. In fact, some local media has reported recently that China may do so by the end of the year, allowing couples to have a second child.
Last time when there was a change in the one-child policy was back in late 2013, when the government relaxed the rules and allows couples to have a second child if one of them is an only child.
While a policy relaxation is positive, we believe it is unlikely to cause a sharp surge in birth rates and the impact would likely to be gradual. For example, following the relaxation in 2013, new births in 2014 rose only mildly by 3%. There were only on average 80-90k couples applying for second birth applications every month since the relaxation, with total application representing less than 10% of total eligible. As economy expands, there are also more cost concerns on raising a second child in China.

Industry Focus
China Dairy Sector
Page 16
Birth rates
11.60
11.70
11.80
11.90
12.00
12.10
12.20
12.30
12.40
12.50
2004
2005
2006
2007
2008
2009
2010
2011
2012
2013
2014
(%)
Source: CEIC, DBS Vickers
The bad – Apart from a slower economy, China’s State Council aims to raise the breast feeding rate, targeting 50% by 2020 from less than one-third at the moment. This could potentially dampen demand growth stemming from new births and income growth. There is also recent news that China is considering a ban on advertisements for infant formula, a move which illustrates the government’s intention to promote breastfeeding.
Cautious outlook, but M&A possibilities exist
Based on the above, we are cautious on the IMF market, as we believe in terms of price competition, it is likely to be the most intense along the dairy supply chain. At the same time, however, there are lots of M&A and partnership opportunities. International players have been actively seeking local partnerships to strengthen their market position. For example, Danone entered as a strategic shareholder of Yashili in early 2015 with a 25% stake, while Fonterra now holds an 18.8% stake in Beingmate.
Overseas partnerships
Dat e* Domest icSt ak e(% )
PaidIn t ' lp lay er
Desc rip t ionEx is t ing b randsow ned by in t ' l p lay er
F eb-15Yashili(1230 HK)
25%HK$3.70/shareor HK$4.4bn
Danone
Intends to use Yashili as an infant formulaproduct segment arm; Mengniu may injectits existing infant formula business intoYashili in future. In addition, Yashili andMengniu will study the possibility ofinv esting in Dumex China.
Dumex, Nutrilon, Aptamil
Mar-15Beingsmate(0002570:CH)
18.80%RMB18/shareor RMB3.5bn
F onterra
With intention to raise to 20% equitystake; establish J V to purchase Darnumplant in Australia, and exclusiv e distributionagreement for F onterras Annum in China
Annum
Apr-15Huishan Dairy(6863 HK)
n.aRMB692m fora 50% J Vstake
F rieslandCampina
Includes a purchased plant in Xiushui plantnear Sheny ang. The Companies will berunning their existing infant-relatedbusinesses separately - meaning Huishan willmarket its own brands, while F riesland'sF riso will be independent as well.
Dutch Lady , F oremost,F risian F lag, Peak, F riso
* date of completion
Source: CEIC, DBS Vickers
Industry Focus
China Dairy Sector
Page 17
Infant formula - Peer comparison
2010 2011 2012 2013 2014
Sales (RMB m)Yashili 2,954 2,958 3,655 3,890 2,816
Biostime 1,234 2,189 3,382 4,561 4,732Beingmate 4,028 4,727 5,354 6,117 5,049Sales turnov er (y -o-y %)
Yashili 14.2 0.1 23.6 6.4 (27.6)Biostime 120.7 77.5 54.5 34.9 3.7
Beingmate 24.1 17.3 13.3 14.2 (17.5)Gross margin (%)
Yashili 56.9 52.0 53.7 53.5 51.3Biostime 71.1 66.5 65.9 65.2 61.9Beingmate 61.4 62.9 63.3 60.2 52.7
SG&A of sales (%)Yashili 38.6 42.2 39.0 41.5 46.2
Biostime 43.5 36.1 35.3 37.1 37.3Beingmate 46.7 51.3 49.8 45.5 51.0Operat ing margin (%)
Yashili 20.0 10.6 15.3 12.4 9.1Biostime 27.1 32.6 31.1 25.7 25.5
Beingmate 14.4 11.5 13.5 14.5 1.4Pretax margin (%)
Yashili 20.0 12.7 17.7 14.8 11.0Biostime 27.1 32.6 31.1 25.5 23.7Beingmate 13.6 12.5 13.5 15.7 2.1
Net margin (%)Yashili 17.0 10.4 12.8 11.2 8.8
Biostime 21.5 24.1 22.0 18.0 17.1Beingmate 10.5 9.2 9.5 11.8 1.4Net cash (debt ) (RMB m)
Yashili 2,643 2,623 2,654 410 37Biostime 1,728 1,974 2,341 1,767 2,083
Beingmate (177) 1,777 2,197 1,514 558Operat ing cash f low (RMB m)
Yashili 313 458 772 141 264Biostime 381 516 947 660 972Beingmate 250 420 1,009 210 (188)
Source: Company data, DBS Vickers

Industry Focus
China Dairy Sector
Page 18
Stock recommendation
To conclude, our preferences in the dairy industry chain are the downstream dairy giants. Amid competition, we expect their strong market dominance, extensive distribution and product innovation efficiency will enable them to gain further market share and drive out smaller regional players. There is also room for margin improvement as product mix improves, while raw material costs remain generally favourable in the near term. We maintain our BUY rating on Mengniu, and initiate coverage on Bright Dairy with a BUY. Meanwhile, we believe Yili (Not Rated) would also be a strong performer under this trend.
We are cautious on the infant milk formula sector, as we expect price competition to intensify, which coupled with the shift in distribution channel will put pressure on margins. We expect the high-end market will continue to be dominated by global brands but there could be potential for domestic players at the mass market end.
As for the upstream dairy farms, the key concern would be on raw milk prices which dictate profitability. But in the longer run, we continue to see market consolidation potential for major farms, with growth expected to be more driven by top line. Despite weakness in near-term earnings, we maintain BUY on China Modern Dairy on possible bottoming out of milk prices towards the year end and on valuation ground.
Bright Dairy (600597: CH, Buy). We like Bright Dairy for its solid positioning as the market leader in Shanghai. As of end-FY14, it also has a dominant market share in pasteurised milk (53%) and low-temperature yogurt (31%) nationwide, which suggests some immunity from rising competition in the UHT dairy segment. Although Bright Dairy’s profitability and operating efficiency lags behind peers Mengniu and Yili, we believe its’ product mix, coupled with expanding distribution network will help margins to catch up over the medium run. In addition, the pending acquisition of Israel’s Tnuva Foods via a new share placement should help transform Bright Dairy as an integrated dairy player with a solid overseas footprint. However, it will take time for benefits from restructuring and integration to materialize. Bright Dairy offers the highest earnings CAGR of 25% among its peers. Initiating coverage with BUY, TP at Rmb19.7/sh, pegged to 27.5x FY16F PE, equivalent to 1.1x PEG.
China Mengniu (2319: HK, Buy). Product mix upgrades (yogurt and milk beverages) and margin expansion will be key drivers to decent earnings growth in the next 1-2 years. We expect China Mengniu to continue gaining market share with
earnings expected to grow at 14.2% CAGR for FY14-16F. Its JV with Danone, despite limited scale but growing fast, could be a more significant driver in the medium term considering the strong know-how of Danone and Mengniu’s strength in branding and distribution. The stock is currently trading at 19x FY16F PE, below its historical (24x) as well as sector average valuation (25.5x). Our TP is now rolled over to HK$47.1 (Prev. HK$45.8/sh), based on 24x FY16F PE. BUY.
Yili (600887: CH, NR). An even fiercer competitor than Mengniu, Yili has consistently outperformed its peers through improving product mix and strong operating efficiency. We believe Yili will likely beat its own guidance of 12% and 15% growth on FY15 sales and profit respectively, via stronger contribution from high-margin products such as Satine, QQ Star, Ambrosial and Chang Qing. Based on consensus estimates, Yili trades at 17.7x FY16F PE, undemanding against its peers.
China Modern Dairy (1117: HK, Buy). Weaker earnings in FY15, a 17% decline under our estimates, should have been largely priced in at the current valuation, with possible resumption of earnings growth in FY16. In the medium term, we believe leading upstream players should continue to benefit from rising demand from downstream, in particular pasteurised operations, as well as market consolidation. Our new TP is HK$3.35 (Prev. HK$3.45ps), based on DCF valuation. BUY.
Yashili (1230: HK, NR). A leading domestic infant milk formula manufacturer, Yashili holds a 5.4% market share in China as of FY14. With the introduction of Mengniu and Danone as its controlling and second largest shareholders respectively in the past couple of years, Yashili is undergoing restructuring and changes in strategy. While Yashili is unlikely to see a turnaround in FY15, we expect Mengniu and Yashili’s potential investment in Danone’s Dumex China, as well as opportunities to leverage on Danone’s existing online platform, could be potential re-rating catalysts. Valuation is at 18.8x FY16F PE (based on consensus estimates), a premium to Biostime, owing to distortion in earnings from the restructuring in addition to heavy competition. However, with the backing of two giants, Yashili will be a strong contender in the domestic market in the long run.
Biostime (1112: HK, NR). Biostime is a major domestic infant milk formula player in China with a 7.6% market share in FY14. Since late 2014, Biostime has been clearing its old core-infant formula inventory, paving the way for a re-launch of upgraded products (new packaging) in Jul-15. There should also be some margin benefits from lower raw material costs, partly offset by higher marketing expenses associated with the

Industry Focus
China Dairy Sector
Page 19
upgraded product launches. With rising competition and rapid distribution channel changes within the infant formula sector, Biostime’s product ASP faces the largest downside. Despite relatively cheap valuation at 11x FY16F PE based on consensus estimates, there is no re-rating catalyst in sight in the near term.
Huishan (6863: HK, NR). A vertically integrated dairy player, Huishan’s key cost advantage is its ability to command lower feed costs against peers, hence enjoying the strongest
upstream margins in China. However, Huishan’s FYMar15 profitability was still affected by the decline in raw milk prices and weaker than expected downstream sales. It is yet to be determined whether Huishan is able to successfully venture out of NE China into East China, a strong foothold of Bright Dairy. On a positive note, Huishan’s Chairman purchased c.427m shares in the open market, in addition to Huishan’s own share buyback of 338m since August-14, providing some support to share price.
Peers valuation – Dairy Sector
Mk t PE PE Y ield Y ield P/Bk P/Bk ROE ROE
Currency Price Cap 15F 16F 15F 16F 15F 16F 15F 16F
Company Name Code Local$ US$m x x % % x x % %
Liquid M ilk
China Mengniu Dairy* 2319 HK HKD 38.35 9,705 22.3 19.6 1.0 1.1 2.5 2.3 11.9 12.3
Inner Mongolia Yili 'A' 600887 CH CNY 18.63 18,383 22.6 17.7 2.1 2.6 4.7 4.4 26.4 27.7
Sanyuan Foods 'A' 600429 CH CNY 10.44 2,517 261.0 261.0 n.a. n.a. 2.8 2.7 1.6 1.1
Huangshi Dairy 'A' 002329 CH CNY 69.48 2,980 143.3 66.2 0.3 0.5 11.6 10.2 13.0 15.0
Bright Dairy 'A'* 600597 CH CNY 18.08 3,581 31.4 25.2 1.9 2.4 4.6 4.3 15.2 17.8
A v erage 96.1 77.9 1.3 1.6 5.2 4.8 13.6 14.8
Infant F ormula
Yashili International 1230 HK HKD 2.27 1,390 23.6 18.8 1.3 1.9 1.2 1.2 6.8 7.0
Ausnutria Dairy 1717 HK HKD 3.03 386 n.a. n.a. n.a. n.a. n.a. n.a. n.a. n.a.
Biostime International 1112 HK HKD 21.6 1,698 12.0 11.3 3.8 4.0 3.1 2.7 28.1 25.2
Beingmate Baby & Child Food 'A' 002570 CH CNY 18 2,963 36.9 37.5 0.5 0.7 4.5 4.9 4.9 7.6
Synutra International# SYUT US USD 6.52 374 n.a. n.a. n.a. n.a. n.a. n.a. n.a. n.a.
A v erage 24.2 22.5 1.9 2.2 2.9 2.9 13.3 13.3
Mult inat ional Brands
Nestle 'R' NESN VX CHF 72.6 241,525 21.6 20.3 3.1 3.2 3.3 3.1 15.0 15.6
Mead Johnson Nutrition MJN US USD 91.17 18,467 24.7 22.4 1.8 2.0 20.7 14.9 104.0 85.5
Meiji Holdings# 2269 JP JPY 17250 10,630 28.8 31.2 0.7 0.9 3.1 2.9 11.4 10.0
Danone BN FP EUR 62.16 44,528 21.3 19.4 2.5 2.7 3.0 2.7 14.4 14.7
A v erage 24.1 23.3 2.0 2.2 7.5 5.9 36.2 31.4
Dairy F arm
China Modern Dairy* 1117 HK HKD 2.53 1,730 11.0 9.1 0.0 0.5 0.7 0.6 8.2 6.9
China Huishan Dairy# 6863 HK HKD 2.17 4,009 17.4 16.1 1.2 1.4 1.7 1.5 9.8 10.7
Yuanshengtai Dairy Farm 1431 HK HKD 0.71 358 4.7 4.0 0.0 0.0 0.5 0.4 8.5 8.3
A v erage 11.0 9.7 0.4 0.6 0.9 0.9 8.9 8.6
# FY15: FY16; FY16: FY17
Source: Thomson Reuters, *DBS Vickers
Industry Focus
China Dairy Sector
Page 20
Peers valuation – F&B
Mk t PE PE Y ield Y ield P/Bk P/Bk ROE ROE
Price Recom Cap F iscal 15F 16F 15F 16F 15F 16F 15F 16F
Company Name Code HK$ HK$m Yr x x % % x x % %
HK list edBrew ery Sector
Tsingtao Brewery 'H'* 168 HK 44.35 Hold 59,916 Dec 25.1 23.8 1.2 1.3 2.9 2.7 11.9 11.6
China Res.Enterprise 291 HK 24.1 NR 58,638 Dec 103.4 59.2 0.9 0.9 1.2 1.1 2.0 7.1
A v erage 64.3 41.5 1.0 1.1 2.0 1.9 6.9 9.3
Dairy Sector
China Mengniu Dairy* 2319 HK 38.35 Buy 75,216 Dec 22.3 19.5 1.0 1.1 2.5 2.3 11.9 12.3
China Modern Dairy* 1117 HK 2.53 Buy 13,421 Dec 11.1 9.1 0.0 0.5 0.7 0.6 8.2 6.9
Biostime Intl.Holdings 1112 HK 21.60 NR 13,162 Dec 12.0 11.3 3.8 4.0 3.1 2.7 28.1 25.2
China Huishan Dairy# 6863 HK 2.17 NR 31,075 Mar 17.4 16.1 1.2 1.4 1.7 1.5 9.8 10.7Yashili Intl.Holdings 1230 HK 2.27 NR 10,772 Dec 23.6 18.8 1.3 1.9 1.2 1.2 6.8 7.0
Yuanshengtai Dairy 1431 HK 0.71 NR 2,775 Dec 4.7 4.0 0.0 0.0 0.5 0.4 8.5 8.3
A v erage 15.2 13.1 1.2 1.5 1.6 1.4 12.2 11.7
Inst ant Noodle & Bev erage and Others
Tingy i* 322 HK 15.60 Hold 87,421 Dec 24.7 22.6 2.0 2.2 3.4 3.2 14.4 14.6Want Want China* 151 HK 8.37 Buy 109,913 Dec 20.4 18.5 2.7 3.0 5.8 5.1 31.0 29.2
Uni-President China Hdg.* 220 HK 7.00 Hold 30,229 Dec 38.0 31.7 0.8 0.9 2.1 2.0 5.7 6.5
V itasoy Intl.Hdg.*# 345 HK 12.20 Hold 12,685 Mar 29.7 25.4 2.3 2.7 6.0 5.4 21.2 21.2
China Foods* 506 HK 4.07 Hold 11,385 Dec 55.4 35.6 0.0 0.0 1.9 1.8 3.4 5.1
A v erage 33.6 26.8 1.6 1.8 3.9 3.5 15.2 15.3
Slaughter Sector
China Yurun* 1068 HK 2.5 Hold 4,557 Dec n.a. 37.0 0.0 0.0 0.3 0.3 (0.1) 0.8
WH Group 288 HK 5.46 NR 77,878 Dec 11.5 10.4 2.7 3.0 1.8 1.6 16.0 16.0
A v erage 11.5 23.7 1.3 1.5 1.0 0.9 8.0 8.4HK- listed av erage (ex Yurun,CRE) 22.8 19.0 1.4 1.6 2.4 2.2 12.4 12.4
# FY15: FY16; FY16: FY17
Source: Thomson Reuters, *DBS Vickers

Industry Focus
China Dairy Sector
Page 21
Peers valuation – F&B (continued)
Mk t PE PE Y ield Y ield P/Bk P/Bk ROE ROE
Currency Price Cap F iscal 15F 16F 15F 16F 15F 16F 15F 16F
Company Name Code Local$ US$m Yr x x % % x x % %
A -share list ed
Wine Sector
Yantai Changyu Pion.Wine 'B' 200869 CH HKD 27.59 3,266 Dec 13.5 12.1 2.0 2.0 2.0 1.8 15.6 15.3A v erage 13.5 12.1 2.0 2.0 2.0 1.8 15.6 15.3
Brew ery Sector
Beijing Yanjing Brew.'A' 000729 CH CNY 9.04 4,102 Dec 31.4 28.4 1.0 1.0 2.0 1.9 6.3 6.6
Tsingtao Brewery 'A'* 600600 CH CNY 41.38 9,000 Dec 29.3 27.7 1.0 1.1 3.3 3.1 11.9 11.6
A v erage 30.3 28.1 1.0 1.1 2.7 2.5 9.1 9.1
Dairy Sector
Inner Mongolia Yili Indl.Gp.'A' 600887 CH CNY 18.63 18,383 Dec 22.6 17.7 2.1 2.6 4.7 4.4 26.4 27.7
Beijing Sanyuan Foods 'A' 600429 CH CNY 10.44 2,517 Dec 261.0 261.0 n.a. n.a. 2.8 2.7 1.6 1.1
Bright Dairy & Food 'A'* 600597 CH CNY 18.08 3,584 Dec 31.4 25.2 1.9 2.4 4.6 4.3 15.2 17.8
Beingmate Baby & Child Food 'A' 002570 CH CNY 18 2,963 Dec 36.9 37.5 0.5 0.7 4.5 4.9 4.9 7.6A v erage (ex . Sany uan) 30.3 26.8 1.5 1.9 4.6 4.5 15.5 17.7
Bev erage and Others
Hebei Chengde Lolo 'A' 000848 CH CNY 18.01 2,183 Dec 27.8 23.9 1.5 1.6 7.6 6.2 30.6 27.6
Sanquan Food 'A' 002216 CH CNY 15.6 2,020 Dec 101.3 68.1 0.3 0.3 6.4 6.1 5.6 8.0
A v erage 64.5 46.0 0.9 0.9 7.0 6.1 18.1 17.8
Slaughter Sec torHenan Shuanghui Inv .& Dev.'A' 000895 CH CNY 21.86 11,617 Dec 15.4 13.9 4.2 4.9 3.9 3.5 26.2 26.4A v erage 15.4 13.9 4.2 4.9 3.9 3.5 26.2 26.4
Chinese L iqueor Sector
Wuliangye Yibin 'A' 000858 CH CNY 27.9 17,051 Dec 17.5 15.2 2.1 2.5 2.4 2.2 14.4 15.2
Kweichow Moutai 'A' 600519 CH CNY 219.54 44,401 Dec 16.5 15.0 2.0 2.5 4.2 3.6 27.8 25.8
Luzhou Lao J iao 'A' 000568 CH CNY 25.61 5,782 Dec 21.9 18.3 2.0 2.6 3.3 3.0 15.6 16.7
Xinghuacun Fen Wine 'A' 600809 CH CNY 20.15 2,809 Dec 33.4 32.2 0.7 0.8 4.1 3.8 10.4 11.3
J iangsu Yanghe Brew.J st. 'A' 002304 CH CNY 67.5 16,377 Dec 20.6 17.9 2.1 2.5 4.3 3.8 23.1 22.9A v erage 33.3 24.8 1.8 2.2 3.8 3.4 16.2 16.6
29.2 24.0 1.8 2.1 4.0 3.6 16.7 17.1
Mult inat ional CompaniesNestle 'R' NESN VX CHF 72.6 241,525 Dec 21.6 20.3 3.1 3.2 3.3 3.1 15.0 15.6
Unilever (Uk) ULVR LN GBP 29.05 128,581 Dec 0.2 0.2 293.8 312.3 0.1 0.1 37.7 37.4
Coca Cola KO US USD 40.84 178,009 Dec 20.3 19.2 3.2 3.5 6.2 6.1 27.6 29.1
Pepsico PEP US USD 96.87 142,301 Dec 21.4 19.7 2.8 3.0 8.8 8.6 40.0 44.0
Danone BN FP EUR 62.16 44,528 Dec 21.3 19.4 2.5 2.7 3.0 2.7 14.4 14.7
Mondelez International Cl.A MDLZ US USD 42.12 68,513 Dec 24.5 21.0 1.5 1.6 2.6 2.4 9.9 11.5
Hormel Foods HRL US USD 57.66 15,238 Oct 22.7 20.8 1.7 1.9 3.9 3.6 18.0 17.7Tyson Foods 'A' TSN US USD 43.13 13,112 Sep 12.5 11.5 0.9 0.9 1.8 1.6 14.7 13.8
A v erage 20.6 18.8 2.3 2.4 4.2 4.0 19.9 20.9
A - share list ed av erage (ex Beijing Sany uan, Roy al Group,Sanquan F ood)
# FY15: FY16; FY16: FY17
Source: Thomson Reuters, *DBS Vickers

www.dbsvickers.com
ed- JS / sa- AL
BUY (Initiating Coverage)
Last Traded Price: RMB18.08 (CSI300 Index : 4,251) Price Target: RMB 19.70 (9% upside) Potential Catalyst: Star products to drive profitability; expansion in distribution network coverage Where we differ: We are more conservative in our sales estimate for Momchilotvsi Analyst Alice HUI CFA, +852 2971 1960 [email protected] Alison Fok +852 2971 1938 [email protected] Price Relative
8 8
1 3 8
1 8 8
2 3 8
2 8 8
3 3 8
7 .3
1 2 .3
1 7 .3
2 2 .3
2 7 .3
J u l-1 1 J u l-1 2 J u l-1 3 J u l-1 4 J u l-1 5
R e la t iv e In d e xR M B
B r ig h t D a ir y & F o o d C o L td ( L H S ) R e la t iv e S H S Z 3 0 0 In d e x ( R H S )
Forecasts and Valuation FY Dec (RMB m) 2014A 2015F 2016F 2017FTurnover 20,385 23,013 26,036 29,151 EBITDA 893 1,132 1,410 1,734 Pre-tax Profit 714 907 1,132 1,412 Net Profit 568 708 883 1,102 EPS (RMB) 0.46 0.58 0.72 0.89 EPS Gth (%) 39.1 24.6 24.8 24.7 DPS (RMB) 0.29 0.35 0.43 0.54 BV Per Share (RMB) 3.67 3.90 4.18 4.54 PE (X) 39.2 31.4 25.2 20.2 P/Cash Flow (X) 66.3 27.9 20.8 16.9 P/Free CF (X) nm nm nm nm EV/EBITDA (X) 26.4 22.0 18.2 15.2 Net Div Yield (%) 1.6 1.9 2.4 3.0 P/Book Value (X) 4.9 4.6 4.3 4.0 Net Debt/Equity (X) 0.1 0.4 0.5 0.5 ROAE (%) 12.9 15.2 17.8 20.5 Earnings Rev (%): New New New Consensus EPS (RMB) 0.66 0.87 1.06 Other Broker Recs: B: 13 S: 0 H: 4
ICB Industry: Consumer Goods ICB Sector: Food Producers Principal Business: Leading dairy player with the largest market presence in Shanghai. Source of all data: Company, DBSV, Thomson Reuters, HKEX
TRANSFORMATION IN PROGRESS Market leader in Shanghai, Bright Dairy is evolving into an integrated
dairy player with an overseas footprint. Bright Dairy is a leading dairy
player based in Shanghai. It has cultivated a household name under
‘Bright’ with product offerings including both pasteurised and UHT dairy
products, milk beverages and infant formula. It recently proposed a new
share placement with gross proceeds of c.Rmb9bn in exchange for Tel
Aviv-based Tnuva Foods, the largest food company in Israel, and parent
Shanghai Dairy’s upstream assets. While the restructuring and integration
will take time, it will transform Bright Dairy into an integrated dairy player
with a solid overseas footprint.
Despite intense competition, Bright's strong product capability would
continue to support product mix enhancement and drive higher-than-
peers earnings growth of 25% in FY14-17. We estimate sales to grow at
FY14-17F CAGR of 13%. We expect Bright Dairy’s organic sales growth
to be driven by cultivation of its core, high margin brands (Momchilovtsi,
UBEST, Changyou) through expansion of its distribution network further
into South and Central China, where its penetration still lags behind
peers. Coupled with a larger scale and a favourable input cost
environment, there should be abundant room for margin improvement.
Premium valuation justified given strong earnings potential. Initiate
coverage with BUY, TP set at RMB19.7share. We believe Bright Dairy has
significant potential for growth from new products, distribution network
expansion, as well as being a key beneficiary of the SOE reform initiatives
underway right now. We expect Bright Dairy will achieve earnings CAGR
of 25% in FY14-17F, against Mengniu’s 12%, and Yili’s 23% (based on
consensus estimates). Initiate with Buy; TP at RMB19.7/sh, pegged to
27.5x FY16F PE, equivalent to 1.1x PEG, but still below its historical 8-
year average of 35.5x
Valuation
The stock is currently trading at 25.2x FY16F PE, representing a premium
over Mengniu and Yili. This is likely due to Bright Dairy’s higher than
industry growth rate, and potential earnings re-rating from its recent
acquisitions.
Key Risks to Our View:
Food safety, rising penetration. Food safety issues, growing yogurt
competition and raw milk prices could affect Bright Dairy’s profitability.
At A Glance Issued Capital (m shrs) 1,231 Mkt. Cap (RMBm/US$m) 22,250 / 3,581
Major Shareholders Bright Food (%) 54.4
Free Float (%) 45.6 Avg. Daily Vol.(‘000) 35,687
DBS Group Research . Equity 24 July 2015
China / Hong Kong Company Focus
Bright Dairy & Food Co Ltd Bloomberg: 600597 CH Equity | Reuters: 600597.SS Refer to important disclosures at the end of this report
China / Hong Kong Company Focus
Bright Dairy & Food Co Ltd
Page 23
INVESTMENT THESIS
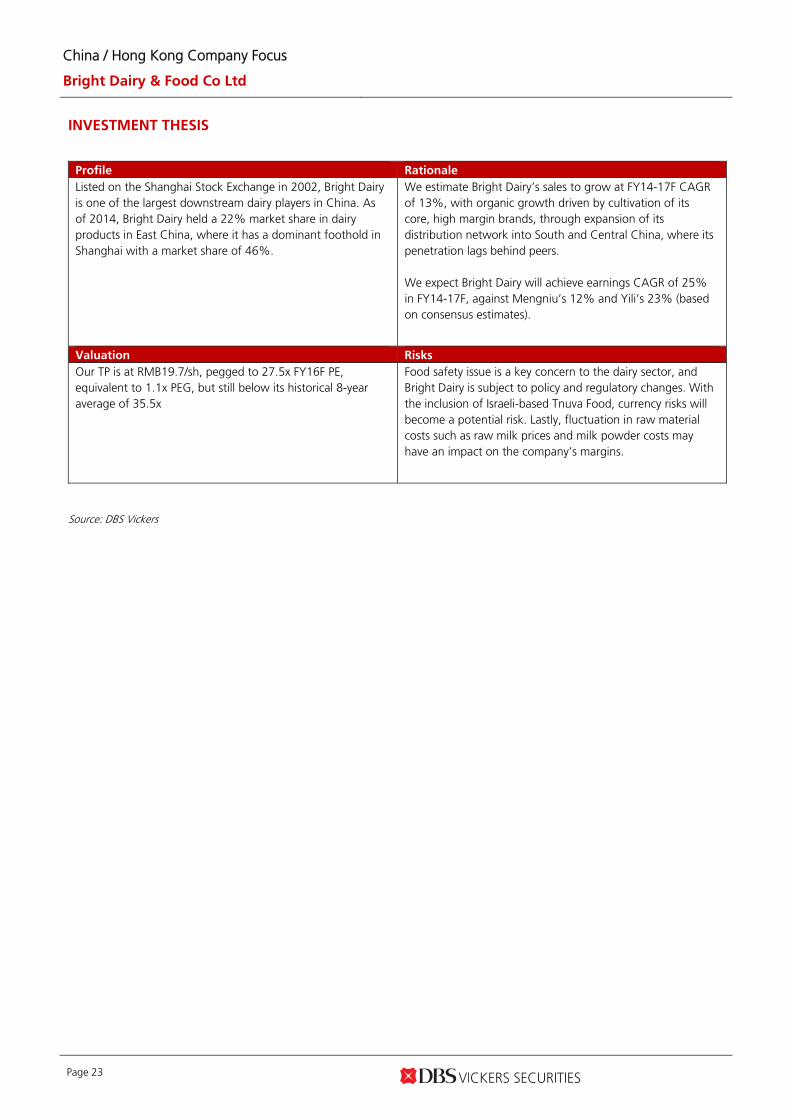
Profile Rationale Listed on the Shanghai Stock Exchange in 2002, Bright Dairy is one of the largest downstream dairy players in China. As of 2014, Bright Dairy held a 22% market share in dairy products in East China, where it has a dominant foothold in Shanghai with a market share of 46%.
We estimate Bright Dairy’s sales to grow at FY14-17F CAGR of 13%, with organic growth driven by cultivation of its core, high margin brands, through expansion of its distribution network into South and Central China, where its penetration lags behind peers. We expect Bright Dairy will achieve earnings CAGR of 25% in FY14-17F, against Mengniu’s 12% and Yili’s 23% (based on consensus estimates).
Valuation Risks Our TP is at RMB19.7/sh, pegged to 27.5x FY16F PE, equivalent to 1.1x PEG, but still below its historical 8-year average of 35.5x
Food safety issue is a key concern to the dairy sector, and Bright Dairy is subject to policy and regulatory changes. With the inclusion of Israeli-based Tnuva Food, currency risks will become a potential risk. Lastly, fluctuation in raw material costs such as raw milk prices and milk powder costs may have an impact on the company’s margins.
Source: DBS Vickers
China / Hong Kong Company Focus
Bright Dairy & Food Co Ltd
Page 24
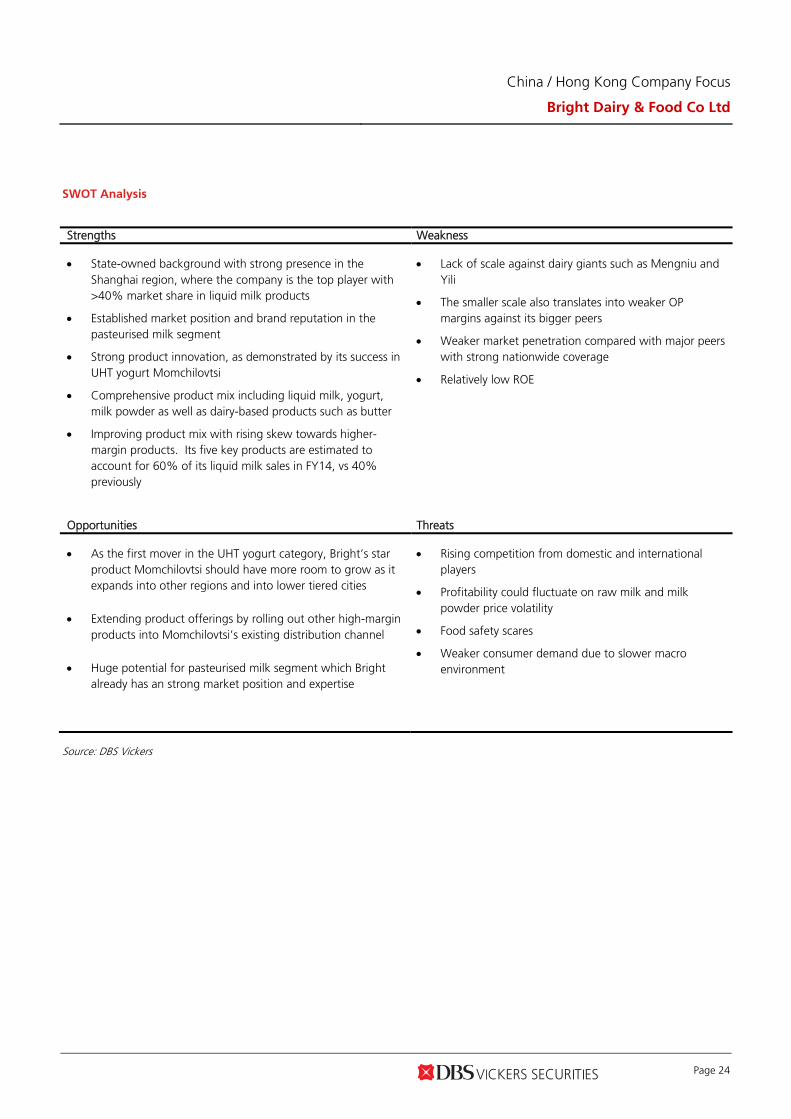
SWOT Analysis
Strengths Weakness
State-owned background with strong presence in the Shanghai region, where the company is the top player with >40% market share in liquid milk products
Established market position and brand reputation in the pasteurised milk segment
Strong product innovation, as demonstrated by its success in UHT yogurt Momchilovtsi
Comprehensive product mix including liquid milk, yogurt, milk powder as well as dairy-based products such as butter
Improving product mix with rising skew towards higher-margin products. Its five key products are estimated to account for 60% of its liquid milk sales in FY14, vs 40% previously
Lack of scale against dairy giants such as Mengniu and Yili
The smaller scale also translates into weaker OP margins against its bigger peers
Weaker market penetration compared with major peers with strong nationwide coverage
Relatively low ROE
Opportunities Threats
As the first mover in the UHT yogurt category, Bright’s star product Momchilovtsi should have more room to grow as it expands into other regions and into lower tiered cities
Extending product offerings by rolling out other high-margin products into Momchilovtsi’s existing distribution channel
Huge potential for pasteurised milk segment which Bright already has an strong market position and expertise
Rising competition from domestic and international players
Profitability could fluctuate on raw milk and milk powder price volatility
Food safety scares
Weaker consumer demand due to slower macro environment
Source: DBS Vickers

China / Hong Kong Company Focus
Bright Dairy & Food Co Ltd
Page 25
Company background
Dominant market player in East China. Listed on the Shanghai Stock Exchange in 2002, Bright Dairy is one of the largest downstream dairy players in China. As of 2014, Bright Dairy held a 22% market share in dairy products in East China, where it has a dominant foothold in Shanghai with a market share of 46%.
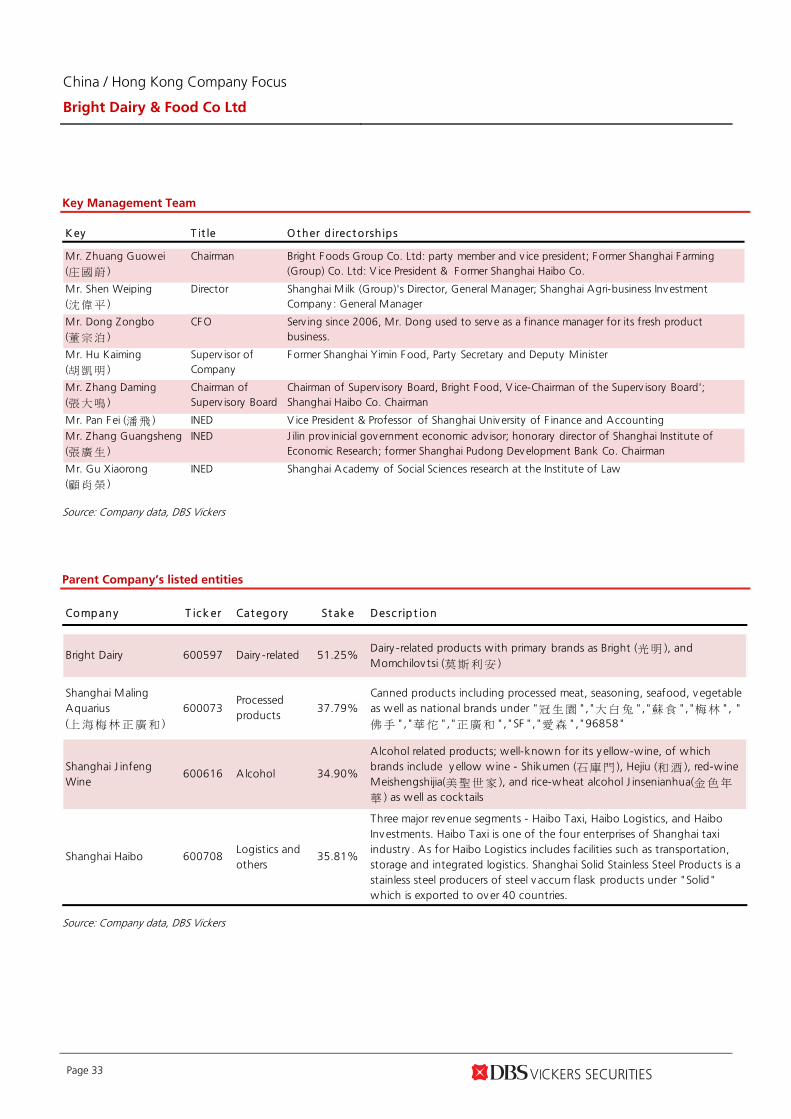
Strong SOE backing. Bright Dairy has a strong state-owned background with Shanghai Municipal Government as its principal shareholder. Bright Dairy is one of the four publicly listed platforms for Bright Food. Other affiliated companies include Shanghai Jinfeng Wine (600616.SH, alcohol related), Shanghai Maling Aquarius (600073.SH, canned products & other products), and Shanghai HaiBo (600708.SH, transportation & logistics).
In Jun-15, Bright Dairy announced its intention to place out no more than 559m shares for Rmb16.1/share to six strategic shareholders. The gross proceeds of Rmb9bn will be used to acquire a 77% stake in Israeli-based Tnuva Food from Parent Company, as well as Shanghai Dairy’s upstream assets. As one of the strategic shareholders in the placement, Bright Food’s effective controlling stake will be lowered to 40.8% (from 54.4%). The new shareholders will be subject to a 3-year holding period.
Part of SOE reform initiatives. The acquisition of Tnuva Food has been well anticipated by the market as Parent Company Bright Food had already announced its intention for the injection after acquiring Tnuva in Jun-14. This is also part of the SOE reform initiatives that aims to (1) bring in strategic shareholders and introduce a mixed ownership scheme; (2) consolidate assets to form a clearer and well defined corporate structure, i.e. use Bright Dairy as the sole platform for dairy-related business.
In addition to acquiring Tnuva Foods, Bright Dairy has been consolidating the Group’s upstream assets. In 2014, Bright Dairy purchased the remaining 20% stake in its upstream subsidiary, Shanghai Bright Holstan from Parent Company Bright Food. In Feb-14, Bright Dairy formed a 55%/45% JV with PE fund RRJ Capital to develop its upstream capabilities. As of end-14, Bright Dairy owns 14 farms with approximately 15,000 cows, and is looking to expand to 20 farms in the next 3-5 years. With the potential acquisition from Shanghai Dairy in the pipeline as well, this should consolidate Bright Dairy’s control on upstream raw milk sourcing. Shanghai Dairy holds c.35,000 cows under 24 dairy farms.
Pending shareholder structure (Before & after new share placement)
Shares (m) % Shares (m) %
Bright Food 669 54.4% 669 37.4%
Yimin Group (益民集團 )* 0 0.0% 62.1 3.5%
Bright F ood 669 54.4% 731 40.8%Xin Cheng Investments (信晟投資 ) 0 0.0% 217.4 12.1%
Cheng Chuang Investments (晟創投資 ) 0 0.0% 186.3 10.4%
Shangqi Investments (上汽投資 ) 0 0.0% 31.1 1.7%
Guosheng Investments (國盛投資 ) 0 0.0% 31.1 1.7%Puke Yuanfuday i (浦科源富達壹 ) 0 0.0% 31.1 1.7%
Other investors 562 45.7% 562 31.4%
Before A f t er
Source: Company data, DBS Vickers
*Owned by Bright Food

China / Hong Kong Company Focus
Bright Dairy & Food Co Ltd
Page 26
Growth drivers
Growth to outperform peers. Bright Dairy derives its revenue from a range of dairy products which includes UHT dairy products (plain milk, premium milk, and yogurt), pasteurised products, milk beverages, infant formula etc. We forecast the company to post FY14-17F earnings CAGR of 25% driven by an enhanced product mix (skewing towards high-margin products such as UHT yogurt), favourable raw material cost environment, and synergies with overseas acquisitions. In the longer term, we expect the possible spin-off of its upstream assets to be a potential re-rating catalyst.
Star product offerings
Premium category Brand Es t. launch
Pastuerised milk U+ (优倍) Sept-06
Fresh yogurt; kid'syogurt
AB100 (健能) July-10
UHT Yogurt Momchilovtsi (莫斯利
安)Dec'10
Fresh yogurt Changyou (畅优) Apr-12
Plant-based bacteriadrink
Zhiwuhuoli (植物活力) Mar-13
Source: Company data
(i) Star products to lead profit growth
Bright Dairy is a pioneer in the UHT yogurt market in China, with its first UHT yogurt product, Momchilotvsi, launched in 2010. Since inception, Momchilotvsi has achieved tremendous growth, and is now the single largest contributor to topline at 35% of total. Targeting the premium market, we estimate this product commands a gross margin that exceeds 40%, above the average for its other UHT dairy products.
In FY14, sales of Momchilovtsi grew 85% y-o-y to c.Rmb6bn. We expect sales to rise further to Rmb8bn in FY15, translating into y-o-y growth of 35%. This will boost its contribution to 38% of overall sales (FY14: 35%). We also expect its other higher margin brands including UBest, Changyou and AB100 to sustain strong double-digit growth in FY15 as penetration improves. We estimate its top-5 star products (Momchilotvsi,
UBEST, Changyou, AB100, Zhiwuhuoli) to account for 60% of FY14 liquid milk sales, and this should continue to improve.
Momchilotvsi sales
0
50
100
150
200
250
300
0
2,000
4,000
6,000
8,000
10,000
12,000
14,000
2010 2011 2012 2013 2014 2015F2016F2017F
% yoyRMB m
Momchilovtsi % yoy
Source: Company data
(ii) Market leader in pasteurised milk
As of FY14, Bright is the market leader in pasteurised milk with a 53.6% market share, of which it holds a dominant market share of 84% in East China. Within fresh yogurt, Bright Dairy holds a nationwide market share of 31.2%, with a 53% market share in East China. We expect Bright Dairy in a better position vs. its competitors as further competitions enters into the UHT segment.
Nationwide & East China market share
53.6%
31.2%
1.6%
84.0%
53.1%
5.7%
0%
10%
20%
30%
40%
50%
60%
70%
80%
90%
Pastuerised milk Low-temp yogurt UHT milk
National East China
Source: Company data

China / Hong Kong Company Focus
Bright Dairy & Food Co Ltd
Page 27
(iii) Deepening penetration.
The success of Momchilovtsi, which is a UHT product with further reach compared to low-temperature or pasteurised products, had enabled Bright Dairy to extend its distribution network beyond its traditional stronghold in Eastern China. With POS reaching 650K in FY14, the company plans to expand it further to 1m POS in FY15. This also opens up opportunities for the company to roll out other products using Momchilovtsi’s existing channel, and provides an established distribution platform for future product launches.
We expect South and Central China regions to exhibit stronger growth, with increasing capacity expansion directed at both regions. As scale picks up, we see room for improvement in operating leverage. In fact, Bright Dairy’s SG&A expense to sales ratio has been on a declining trend in the past two years, but remains higher than bigger peers, an indication of its smaller scale but also implies lots of room for improvement.
SG&A expense % to overall sales versus peers
20%
22%
24%
26%
28%
30%
32%
2013 2014 2015F 2016F 2017F
Yili Bright Mengniu
Source: Company data
(iii) A beneficiary of the SOE reform
Parent Company, Bright Food, has been in the process of dismantling and streamlining existing assets for a number of years through management incentives, inviting strategic shareholders and lately acquiring overseas assets. As a key subsidiary of Bright Food, Bright Dairy should remain under the spotlight, given dairy sector’s stronger-than-industry growth and significant overseas acquisitions recently.
The latest share placement of 559m shares will generate gross proceeds of Rmb9bn, which will be allocated in exchange for (1) c.77% controlling stake in Israeli-Tnuva Food, estimated to be worth c. Rmb6.87bn (implying c. 13.3x FY14 PE or 1.89x P/NAV), and (2) Shanghai Dairy’s upstream dairy operations (no financial details have been released yet).
With the expected injection of Tnuva Foods, Bright is well positioned to become a diversified dairy player over the long term. In addition, we expect Bright Dairy to spin-off its upstream assets in due time after the consolidation of Shanghai Dairy’s upstream assets. If we include Tnuva’s earnings assuming flat earnings growth y-o-y, we expect the potential impact on EPS will be milder at 8%/3%/0% in FY15-17F inclusive of the enlarged share base.
China / Hong Kong Company Focus
Bright Dairy & Food Co Ltd
Page 28
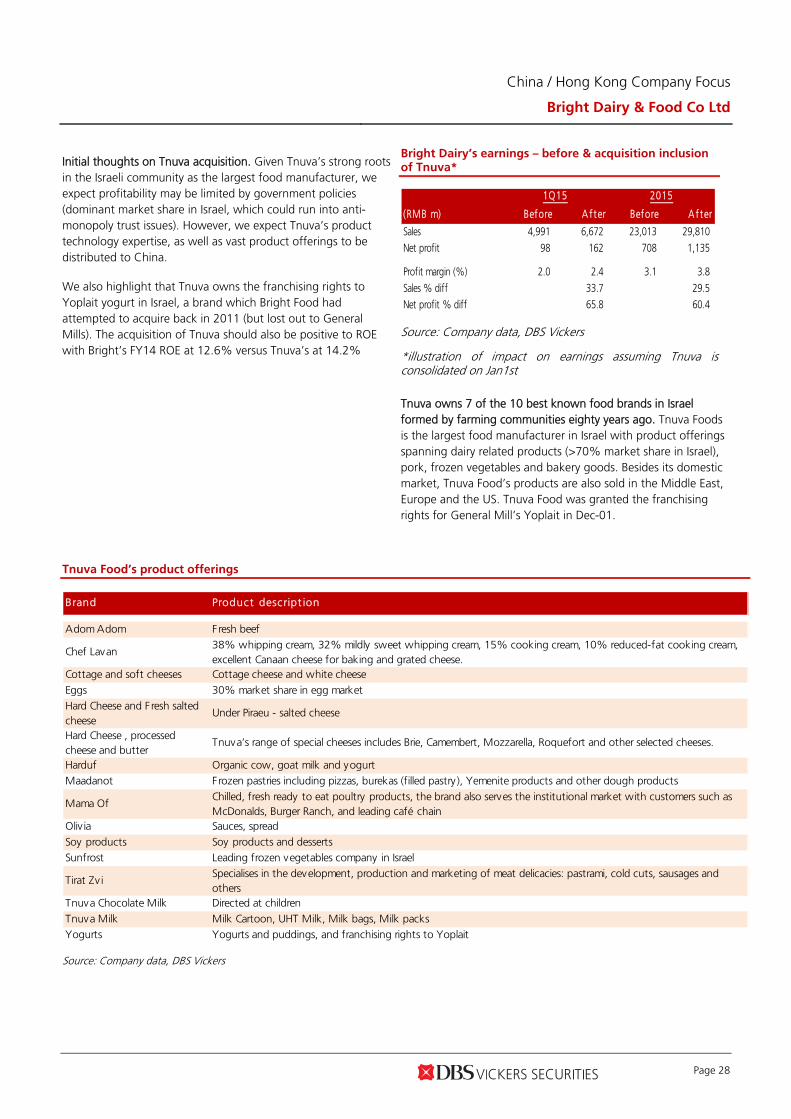
Initial thoughts on Tnuva acquisition. Given Tnuva’s strong roots in the Israeli community as the largest food manufacturer, we expect profitability may be limited by government policies (dominant market share in Israel, which could run into anti-monopoly trust issues). However, we expect Tnuva’s product technology expertise, as well as vast product offerings to be distributed to China.
We also highlight that Tnuva owns the franchising rights to Yoplait yogurt in Israel, a brand which Bright Food had attempted to acquire back in 2011 (but lost out to General Mills). The acquisition of Tnuva should also be positive to ROE with Bright’s FY14 ROE at 12.6% versus Tnuva’s at 14.2%
Bright Dairy’s earnings – before & acquisition inclusion of Tnuva*
(RMB m) Before A f ter Before A f ter
Sales 4,991 6,672 23,013 29,810
Net profit 98 162 708 1,135
Profit margin (%) 2.0 2.4 3.1 3.8
Sales % diff 33.7 29.5
Net profit % diff 65.8 60.4
1Q15 2015
Source: Company data, DBS Vickers
*illustration of impact on earnings assuming Tnuva isconsolidated on Jan1st
Tnuva owns 7 of the 10 best known food brands in Israel formed by farming communities eighty years ago. Tnuva Foods is the largest food manufacturer in Israel with product offerings spanning dairy related products (>70% market share in Israel), pork, frozen vegetables and bakery goods. Besides its domestic market, Tnuva Food’s products are also sold in the Middle East, Europe and the US. Tnuva Food was granted the franchising rights for General Mill’s Yoplait in Dec-01.
Tnuva Food’s product offerings
Brand Product descript ion
Adom Adom Fresh beef
Chef Lavan38% whipping cream, 32% mildly sweet whipping cream, 15% cooking cream, 10% reduced-fat cooking cream,excellent Canaan cheese for baking and grated cheese.
Cottage and soft cheeses Cottage cheese and white cheese
Eggs 30% market share in egg marketHard Cheese and Fresh saltedcheese
Under Piraeu - salted cheese
Hard Cheese , processedcheese and butter
Tnuva’s range of special cheeses includes Brie, Camembert, Mozzarella, Roquefort and other selected cheeses.
Harduf Organic cow, goat milk and yogurt
Maadanot Frozen pastries including pizzas, burekas (filled pastry), Yemenite products and other dough products
Mama OfChilled, fresh ready to eat poultry products, the brand also serves the institutional market with customers such asMcDonalds, Burger Ranch, and leading café chain
Oliv ia Sauces, spread
Soy products Soy products and dessertsSunfrost Leading frozen vegetables company in Israel
Tirat Zv iSpecialises in the development, production and marketing of meat delicacies: pastrami, cold cuts, sausages andothers
Tnuva Chocolate Milk Directed at children
Tnuva Milk Milk Cartoon, UHT Milk, Milk bags, Milk packsYogurts Yogurts and puddings, and franchising rights to Yoplait
Source: Company data, DBS Vickers
China / Hong Kong Company Focus
Bright Dairy & Food Co Ltd
Page 29
Financial analysis
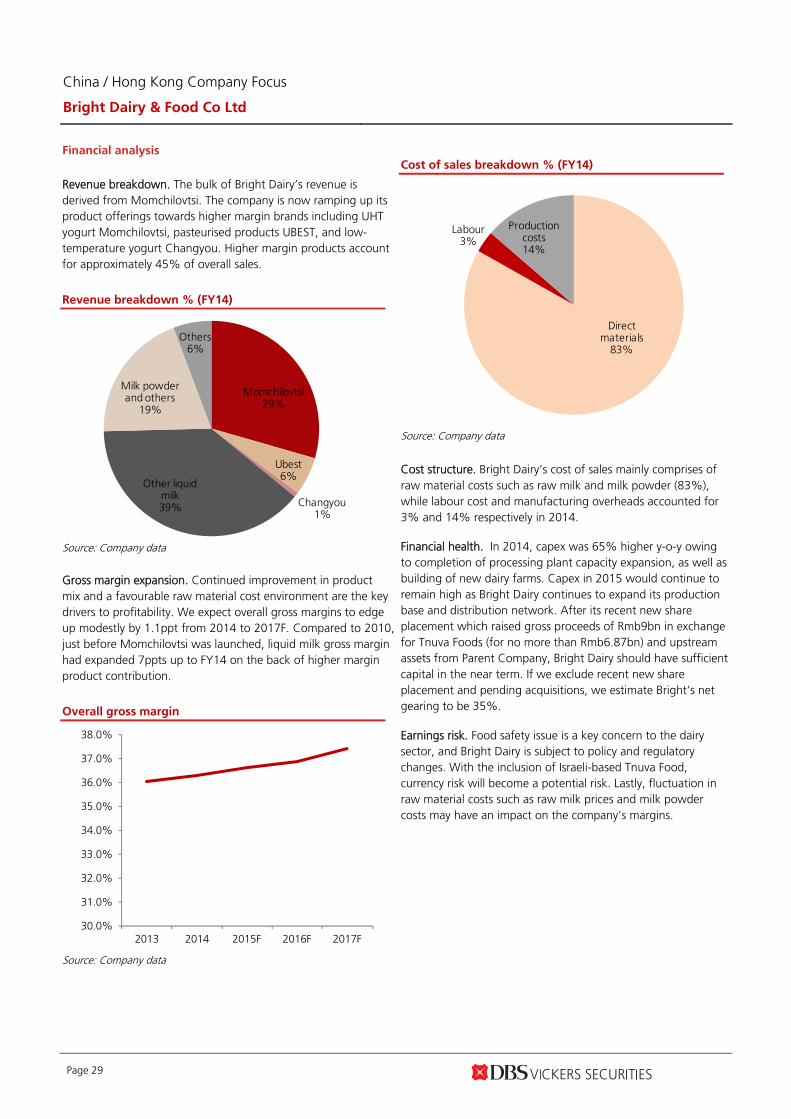
Revenue breakdown. The bulk of Bright Dairy’s revenue is derived from Momchilovtsi. The company is now ramping up its product offerings towards higher margin brands including UHT yogurt Momchilovtsi, pasteurised products UBEST, and low-temperature yogurt Changyou. Higher margin products account for approximately 45% of overall sales.
Revenue breakdown % (FY14)
Momchilovtsi29%
Ubest6%
Changyou1%
Other liquid milk39%
Milk powder and others
19%
Others6%
Source: Company data
Gross margin expansion. Continued improvement in product mix and a favourable raw material cost environment are the key drivers to profitability. We expect overall gross margins to edge up modestly by 1.1ppt from 2014 to 2017F. Compared to 2010, just before Momchilovtsi was launched, liquid milk gross margin had expanded 7ppts up to FY14 on the back of higher margin product contribution.
Overall gross margin
30.0%
31.0%
32.0%
33.0%
34.0%
35.0%
36.0%
37.0%
38.0%
2013 2014 2015F 2016F 2017F
Source: Company data
Cost of sales breakdown % (FY14)
Direct materials
83%
Labour 3%
Production costs14%
Source: Company data
Cost structure. Bright Dairy’s cost of sales mainly comprises of raw material costs such as raw milk and milk powder (83%), while labour cost and manufacturing overheads accounted for 3% and 14% respectively in 2014.
Financial health. In 2014, capex was 65% higher y-o-y owing to completion of processing plant capacity expansion, as well as building of new dairy farms. Capex in 2015 would continue to remain high as Bright Dairy continues to expand its production base and distribution network. After its recent new share placement which raised gross proceeds of Rmb9bn in exchange for Tnuva Foods (for no more than Rmb6.87bn) and upstream assets from Parent Company, Bright Dairy should have sufficient capital in the near term. If we exclude recent new share placement and pending acquisitions, we estimate Bright’s net gearing to be 35%.
Earnings risk. Food safety issue is a key concern to the dairy sector, and Bright Dairy is subject to policy and regulatory changes. With the inclusion of Israeli-based Tnuva Food, currency risk will become a potential risk. Lastly, fluctuation in raw material costs such as raw milk prices and milk powder costs may have an impact on the company’s margins.

China / Hong Kong Company Focus
Bright Dairy & Food Co Ltd
Page 30
Financial forecast
1Q15 analysis. In 1Q15, revenue grew 8.1% while net profit expanded 39.2% y-o-y to Rmb98m. This was on the back of improvement in product mix as well as a favourable raw material environment. Gross margins expanded 0.85ppt to 34.7%, a decent performance but much slower than Yili’s 1Q15 GP margin expansion of 3.4ppts. This is likely a reflection of Bright’s higher-cost milk powder inventory which had yet to be fully digested. In terms of seasonality, 1Q is typically a low season for dairy product sales, while 2H normally reports much stronger sales.
We forecast UHT plain white milk to grow in the single-digits over the next few years, given low barriers of entry and weaker brand loyalty in the low-end price range. As for the higher-margin products, we expect double-digit growth in topline, bringing about stronger profitability expansion, thanks to improving operating leverage. We forecast topline growth of 13%/13%/12% in FY15-17F, and earnings to grow at 25% CAGR in 2014-17F.
Valuation
The stock is currently trading at 25.2x FY16F PE, representing a premium over other downstream dairy players such as Mengniu and Yili. This is likely due to Bright Dairy’s higher than industry growth rate, and potential earnings re-rating from its recent acquisitions.
We peg our TP at 27.5x FY16F PE, which is equivalent to 1.1x PEG, but still below its historical 8-year average of 35.5x. This translates into a fair value of Rmb19.7 per share.
China / Hong Kong Company Focus
Bright Dairy & Food Co Ltd
Page 31
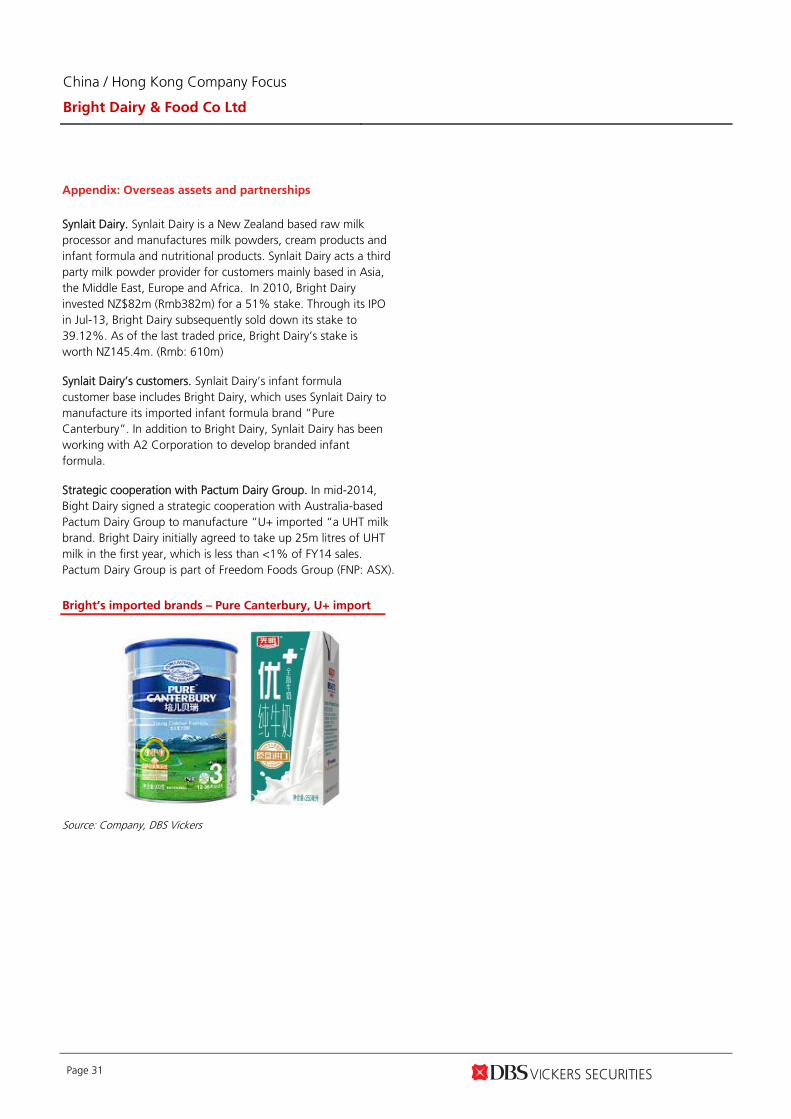
Appendix: Overseas assets and partnerships
Synlait Dairy. Synlait Dairy is a New Zealand based raw milk processor and manufactures milk powders, cream products and infant formula and nutritional products. Synlait Dairy acts a third party milk powder provider for customers mainly based in Asia, the Middle East, Europe and Africa. In 2010, Bright Dairy invested NZ$82m (Rmb382m) for a 51% stake. Through its IPO in Jul-13, Bright Dairy subsequently sold down its stake to 39.12%. As of the last traded price, Bright Dairy’s stake is worth NZ145.4m. (Rmb: 610m)
Synlait Dairy’s customers. Synlait Dairy’s infant formula customer base includes Bright Dairy, which uses Synlait Dairy to manufacture its imported infant formula brand “Pure Canterbury”. In addition to Bright Dairy, Synlait Dairy has been working with A2 Corporation to develop branded infant formula.
Strategic cooperation with Pactum Dairy Group. In mid-2014, Bight Dairy signed a strategic cooperation with Australia-based Pactum Dairy Group to manufacture “U+ imported “a UHT milk brand. Bright Dairy initially agreed to take up 25m litres of UHT milk in the first year, which is less than <1% of FY14 sales. Pactum Dairy Group is part of Freedom Foods Group (FNP: ASX).
Bright’s imported brands – Pure Canterbury, U+ import
Source: Company, DBS Vickers
China / Hong Kong Company Focus
Bright Dairy & Food Co Ltd
Page 32
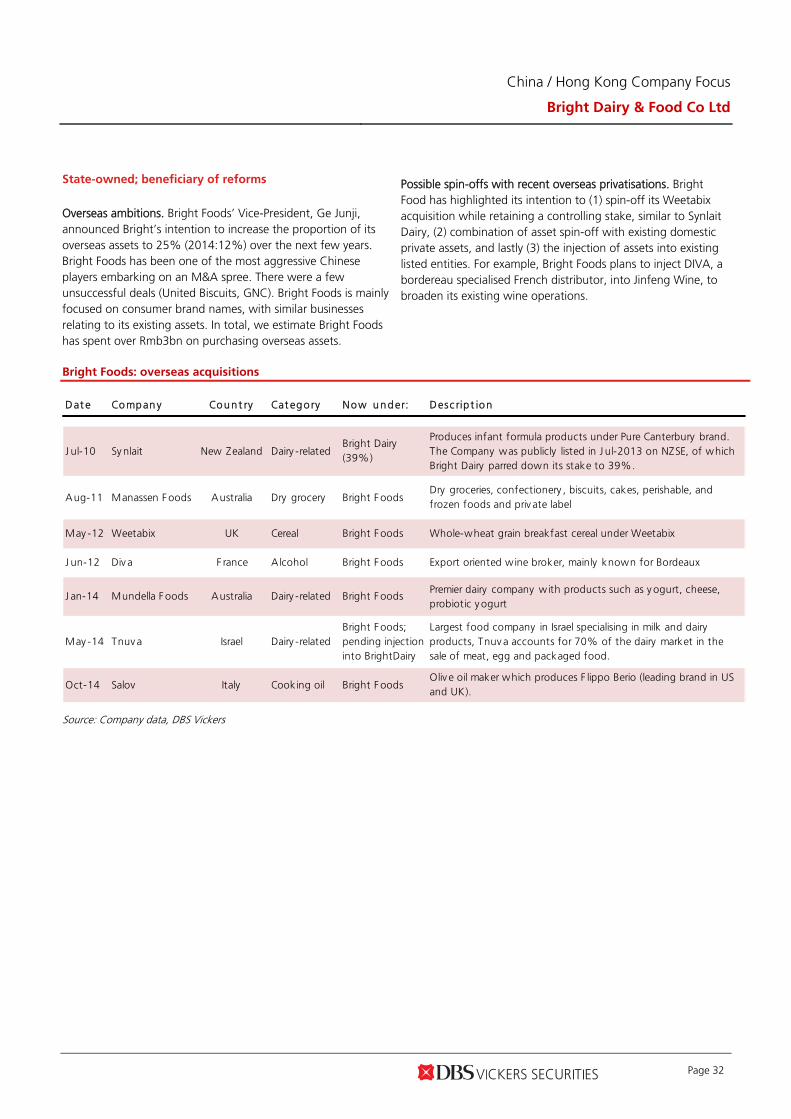
State-owned; beneficiary of reforms
Overseas ambitions. Bright Foods’ Vice-President, Ge Junji, announced Bright’s intention to increase the proportion of its overseas assets to 25% (2014:12%) over the next few years. Bright Foods has been one of the most aggressive Chinese players embarking on an M&A spree. There were a few unsuccessful deals (United Biscuits, GNC). Bright Foods is mainly focused on consumer brand names, with similar businesses relating to its existing assets. In total, we estimate Bright Foods has spent over Rmb3bn on purchasing overseas assets.
Possible spin-offs with recent overseas privatisations. Bright Food has highlighted its intention to (1) spin-off its Weetabix acquisition while retaining a controlling stake, similar to Synlait Dairy, (2) combination of asset spin-off with existing domestic private assets, and lastly (3) the injection of assets into existing listed entities. For example, Bright Foods plans to inject DIVA, a bordereau specialised French distributor, into Jinfeng Wine, to broaden its existing wine operations.
Bright Foods: overseas acquisitions
Dat e Company Coun t ry Cat ego ry Now u nder: Desc rip t ion
J ul-10 Sy nlait New Zealand Dairy -relatedBright Dairy(39%)
Produces infant formula products under Pure Canterbury brand.The Company was publicly listed in J ul-2013 on NZSE, of whichBright Dairy parred down its stake to 39%.
Aug-11 Manassen F oods Australia Dry grocery Bright F oodsDry groceries, confectionery , biscuits, cakes, perishable, andfrozen foods and priv ate label
May -12 Weetabix UK Cereal Bright F oods Whole-wheat grain breakfast cereal under Weetabix
J un-12 Div a F rance A lcohol Bright F oods Export oriented wine broker, mainly known for Bordeaux
J an-14 Mundella F oods Australia Dairy -related Bright F oodsPremier dairy company with products such as y ogurt, cheese,probiotic y ogurt
May -14 Tnuv a Israel Dairy -relatedBright F oods;pending injectioninto BrightDairy
Largest food company in Israel specialising in milk and dairyproducts, Tnuv a accounts for 70% of the dairy market in thesale of meat, egg and packaged food.
Oct-14 Salov Italy Cooking oil Bright F oodsOliv e oil maker which produces F lippo Berio (leading brand in USand UK).
Source: Company data, DBS Vickers
China / Hong Kong Company Focus
Bright Dairy & Food Co Ltd
Page 33
Key Management Team
K ey T it le O t her d irec t o rsh ip s
Mr. Zhuang Guowei(庄國蔚 )
Chairman Bright F oods Group Co. Ltd: party member and v ice president; F ormer Shanghai F arming(Group) Co. Ltd: V ice President & F ormer Shanghai Haibo Co.
Mr. Shen Weiping(沈偉平 )
Director Shanghai Milk (Group)'s Director, General Manager; Shanghai Agri-business Inv estmentCompany : General Manager
Mr. Dong Zongbo(董宗泊 )
CF O Serv ing since 2006, Mr. Dong used to serv e as a finance manager for its fresh productbusiness.
Mr. Hu Kaiming(胡凱明 )
Superv isor ofCompany
F ormer Shanghai Yimin F ood, Party Secretary and Deputy Minister
Mr. Zhang Daming(張大鳴 )
Chairman ofSuperv isory Board
Chairman of Superv isory Board, Bright F ood, V ice-Chairman of the Superv isory Board';Shanghai Haibo Co. Chairman
Mr. Pan F ei (潘飛 ) INED V ice President & Professor of Shanghai Univ ersity of F inance and Accounting
Mr. Zhang Guangsheng(張廣生 )
INED J ilin prov inicial gov ernment economic adv isor; honorary director of Shanghai Institute ofEconomic Research; former Shanghai Pudong Dev elopment Bank Co. Chairman
Mr. Gu Xiaorong(顧肖榮 )
INED Shanghai Academy of Social Sciences research at the Institute of Law
Source: Company data, DBS Vickers
Parent Company’s listed entities
Company T ic k er Cat ego ry St ak e Desc rip t ion
Bright Dairy 600597 Dairy -related 51.25%Dairy -related products with primary brands as Bright (光明 ), andMomchilov tsi (莫斯利安 )
Shanghai MalingAquarius(上海梅林正廣和 )
600073Processedproducts
37.79%Canned products including processed meat, seasoning, seafood, v egetableas well as national brands under "冠生園 ","大白兔 ","蘇食 ","梅林 ", "佛手 ","華佗 ","正廣和 ","SF ","愛森 ","96858"
Shanghai J infengWine
600616 Alcohol 34.90%
Alcohol related products; well-known for its y ellow-wine, of whichbrands include y ellow wine - Shikumen (石庫門 ), Hejiu (和酒 ), red-wineMeishengshijia(美聖世家 ), and rice-wheat alcohol J insenianhua(金色年
華 ) as well as cocktails
Shanghai Haibo 600708Logistics andothers
35.81%
Three major rev enue segments - Haibo Taxi, Haibo Logistics, and HaiboInv estments. Haibo Taxi is one of the four enterprises of Shanghai taxiindustry . As for Haibo Logistics includes facilities such as transportation,storage and integrated logistics. Shanghai Solid Stainless Steel Products is astainless steel producers of steel v accum flask products under "Solid"which is exported to ov er 40 countries.
Source: Company data, DBS Vickers
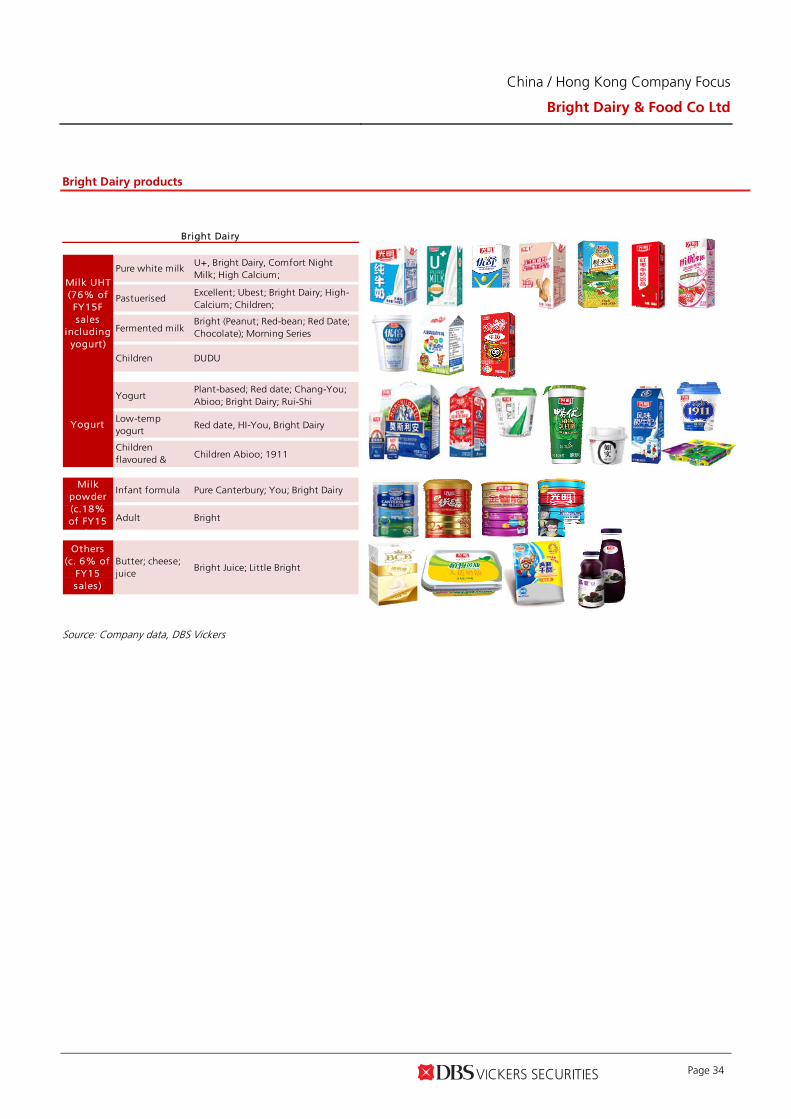
China / Hong Kong Company Focus
Bright Dairy & Food Co Ltd
Page 34
Bright Dairy products
Pure white milkU+, Bright Dairy, Comfort NightMilk; High Calcium;
PastuerisedExcellent; Ubest; Bright Dairy; High-Calcium; Children;
Fermented milkBright (Peanut; Red-bean; Red Date;Chocolate); Morning Series
Children DUDU
YogurtPlant-based; Red date; Chang-You;Abioo; Bright Dairy; Rui-Shi
Low-tempyogurt
Red date, HI-You, Bright Dairy
Childrenflavoured & Children Abioo; 1911
Infant formula Pure Canterbury; You; Bright Dairy
Adult Bright
Bright Dairy
Milk UHT(76% ofFY15Fsales
includingyogurt )
Others(c. 6% of
FY15sales )
Butter; cheese;juice
Bright Juice; Little Bright
Yogurt
Milkpowder(c.18%of FY15
l )
Source: Company data, DBS Vickers

China / Hong Kong Company Focus
Bright Dairy & Food Co Ltd
Page 35
Tnuva Food’s brand offerings
Yoplait Sunfrost Cottage and Soft
Cheeses
Tirat Zvi Hard Cheese, Processed
Cheese and Butter
Maadanot Hard Cheese and Fresh
Salted Cheese
Mama Of Tnuva Milk Chocolate Milk
Chef Lavan Harduf Soy Products Eggs Adom Adom
OIivia
Source: Company data, DBS Vickers
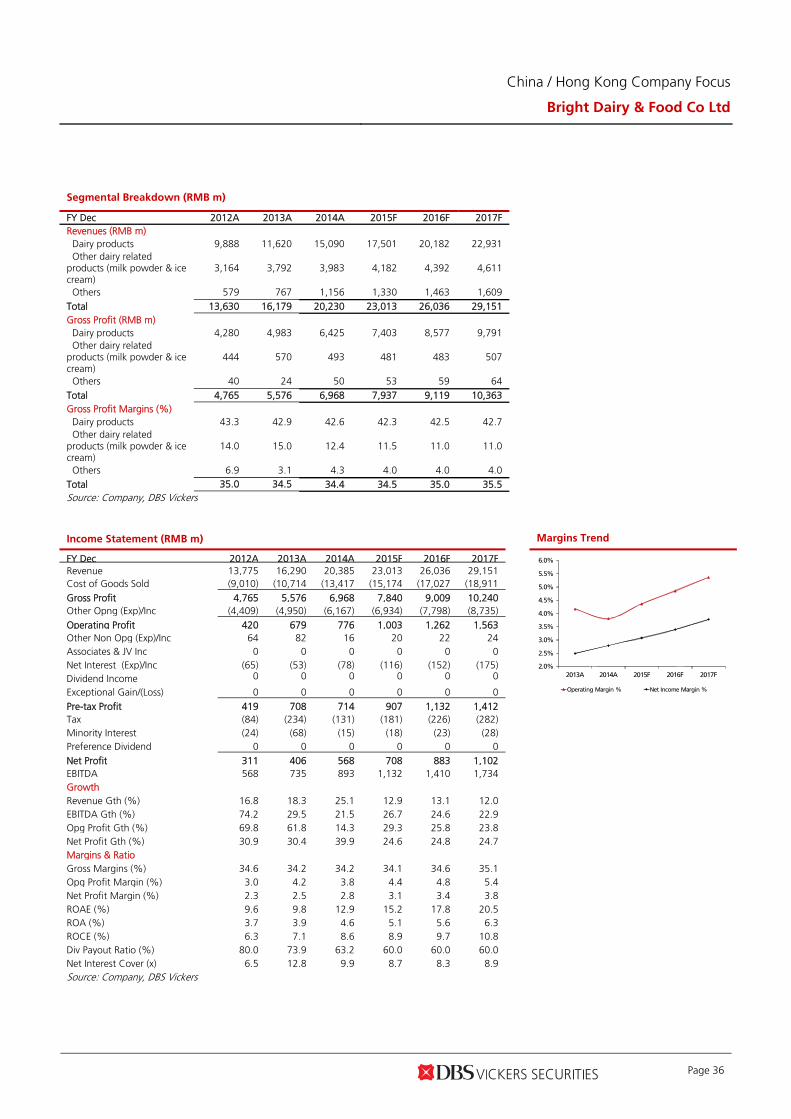
China / Hong Kong Company Focus
Bright Dairy & Food Co Ltd
Page 36
Segmental Breakdown (RMB m)
FY Dec 2012A 2013A 2014A 2015F 2016F 2017F Revenues (RMB m) Dairy products 9,888 11,620 15,090 17,501 20,182 22,931 Other dairy related products (milk powder & ice cream)
3,164 3,792 3,983 4,182 4,392 4,611
Others 579 767 1,156 1,330 1,463 1,609 Total 13,630 16,179 20,230 23,013 26,036 29,151 Gross Profit (RMB m) Dairy products 4,280 4,983 6,425 7,403 8,577 9,791 Other dairy related products (milk powder & ice cream)
444 570 493 481 483 507
Others 40 24 50 53 59 64 Total 4,765 5,576 6,968 7,937 9,119 10,363 Gross Profit Margins (%) Dairy products 43.3 42.9 42.6 42.3 42.5 42.7 Other dairy related products (milk powder & ice cream)
14.0 15.0 12.4 11.5 11.0 11.0
Others 6.9 3.1 4.3 4.0 4.0 4.0 Total 35.0 34.5 34.4 34.5 35.0 35.5 Source: Company, DBS Vickers
Income Statement (RMB m) Margins Trend FY Dec 2012A 2013A 2014A 2015F 2016F 2017F
2.0%
2.5%
3.0%
3.5%
4.0%
4.5%
5.0%
5.5%
6.0%
2013A 2014A 2015F 2016F 2017F
Operating Margin % Net Income Margin %
Revenue 13,775 16,290 20,385 23,013 26,036 29,151 Cost of Goods Sold (9,010) (10,714 (13,417 (15,174 (17,027 (18,911 Gross Profit 4,765 5,576 6,968 7,840 9,009 10,240 Other Opng (Exp)/Inc (4,409) (4,950) (6,167) (6,934) (7,798) (8,735) Operating Profit 420 679 776 1,003 1,262 1,563 Other Non Opg (Exp)/Inc 64 82 16 20 22 24 Associates & JV Inc 0 0 0 0 0 0 Net Interest (Exp)/Inc (65) (53) (78) (116) (152) (175) Dividend Income 0 0 0 0 0 0 Exceptional Gain/(Loss) 0 0 0 0 0 0 Pre-tax Profit 419 708 714 907 1,132 1,412 Tax (84) (234) (131) (181) (226) (282) Minority Interest (24) (68) (15) (18) (23) (28) Preference Dividend 0 0 0 0 0 0 Net Profit 311 406 568 708 883 1,102 EBITDA 568 735 893 1,132 1,410 1,734 Growth Revenue Gth (%) 16.8 18.3 25.1 12.9 13.1 12.0 EBITDA Gth (%) 74.2 29.5 21.5 26.7 24.6 22.9 Opg Profit Gth (%) 69.8 61.8 14.3 29.3 25.8 23.8 Net Profit Gth (%) 30.9 30.4 39.9 24.6 24.8 24.7 Margins & Ratio Gross Margins (%) 34.6 34.2 34.2 34.1 34.6 35.1 Opg Profit Margin (%) 3.0 4.2 3.8 4.4 4.8 5.4 Net Profit Margin (%) 2.3 2.5 2.8 3.1 3.4 3.8 ROAE (%) 9.6 9.8 12.9 15.2 17.8 20.5 ROA (%) 3.7 3.9 4.6 5.1 5.6 6.3 ROCE (%) 6.3 7.1 8.6 8.9 9.7 10.8 Div Payout Ratio (%) 80.0 73.9 63.2 60.0 60.0 60.0 Net Interest Cover (x) 6.5 12.8 9.9 8.7 8.3 8.9 Source: Company, DBS Vickers

China / Hong Kong Company Focus
Bright Dairy & Food Co Ltd
Page 37
Interim Income Statement (RMB m) Margins Trend FY Dec 1H2012 2H2012 1H2013 2H2013 1H2014 2H2014
0%
1%
2%
3%
4%
5%
6%
1H12
2H12
1H13
2H13
1H14
2H14
Operating Margin % Net Income Margin %
Revenue 6,461 7,314 7,443 8,847 9,872 10,513 Cost of Goods Sold (4,805) (4,784) (5,930) (6,481) (6,481) (6,936) Gross Profit 2,256 2,508 2,659 2,917 3,391 3,577 Other Oper. (Exp)/Inc (3,780) (4,750) (3,938) (4,838) (6,480) (6,680) Operating Profit 132 288 235 445 302 474 Other Non Opg (Exp)/Inc (35) 99 (16) 98 (4) 20 Associates & JV Inc 0 0 0 0 0 0 Net Interest (Exp)/Inc (45) (19) (33) (21) (16) (62) Exceptional Gain/(Loss) 0 0 0 0 0 0 Pre-tax Profit 52 367 187 522 282 432 Tax 4 (88) (63) (170) (58) (73) Minority Interest (4) (20) (8) (61) (31) 16 Net Profit 97 215 148 258 209 359 Growth Revenue Gth (%) 16.5 17.2 15.2 21.0 32.6 18.8 Opg Profit Gth (%) 100.9 58.6 78.1 54.3 28.7 6.7 Net Profit Gth (%) 31.9 30.4 53.0 20.2 41.5 38.9 Margins Gross Margins (%) 25.6 34.6 20.3 26.7 34.3 34.0 Opg Profit Margins (%) 2.0 3.9 3.2 5.0 3.1 4.5 Net Profit Margins (%) 1.5 2.9 2.0 2.9 2.1 3.4 Source: Company, DBS Vickers

China / Hong Kong Company Focus
Bright Dairy & Food Co Ltd
Page 38
Quarterly Income Statement (RMB m) Margins Trend FY Dec 1Q2014 2Q2014 3Q2014 4Q2014 1Q2015
0%
1%
2%
3%
4%
5%
6%
7%
3Q2013
4Q2013
1Q2014
2Q2014
3Q2014
4Q2014
1Q2015
Operating Margin % Net Income Margin %
Revenue 4,618 5,254 5,443 5,070 4,991 Cost of Goods Sold (3,055) (3,426) (3,637) (3,299) (3,259) Gross Profit 1,563 1,828 1,806 1,771 1,732 Other Oper. (Exp)/Inc (1,422) (1,666) (1,643) (1,459) (1,533) Operating Profit 141 162 163 312 198 Other Non Opg (Exp)/Inc 11 26 19 (17) (20) Associates & JV Inc 0 0 0 0 0 Net Interest (Exp)/Inc (4) (13) (30) (32) (29) Exceptional Gain/(Loss) 0 0 0 0 0 Pre-tax Profit 139 159 151 265 173 Tax (39) (19) (26) (47) (50) Minority Interest (30) (1) 72 (57) (24) Net Profit 70 139 197 162 98 EBITDA 133 133 132 283 192 Growth Revenue Gth (%) 35.1 30.6 28.1 10.3 8.1 Net Profit Gth (%) 42.8 40.8 23.3 64.5 39.2 Margins Gross Margins (%) 33.8 34.8 33.2 34.9 34.7 Opg Profit Margins (%) 3.0 3.1 3.0 6.1 4.0 Net Profit Margins (%) 1.5 2.6 3.6 3.2 2.0 Source: Company, DBS Vickers

China / Hong Kong Company Focus
Bright Dairy & Food Co Ltd
Page 39
Balance Sheet (RMB m) Asset Breakdown
FY Dec 2012A 2013A 2014A 2015F 2016F 2017F Net Fixed Assets -51.4%
Assocs'/JVs -0.0%
Bank, Cash and Liquid
Assets -15.9%
Inventory -17.9%
Debtors -14.9%
Net Fixed Assets 3,391 4,044 5,166 6,612 7,686 8,720 Invts in Associates & JVs 0 0 0 0 0 0 Other LT Assets 986 1,113 1,299 1,334 1,375 1,422 Cash & ST Invts 2,351 2,619 2,002 2,040 2,063 2,109 Inventory 1,016 1,501 2,031 2,297 2,577 2,862 Debtors 1,310 1,386 1,695 1,914 2,165 2,424 Other Current Assets 386 905 691 691 691 691 Total Assets 9,440 11,568 12,883 14,889 16,558 18,228 ST Debt 793 950 1,814 1,814 1,814 1,814 Creditors 2,416 3,507 3,634 4,038 4,531 5,032 Other Current Liab 851 1,491 1,034 1,034 1,034 1,034 LT Debt 708 336 854 2,154 2,954 3,654 Other LT Liabilities 246 260 348 348 348 348 Shareholder’s Equity 4,014 4,278 4,512 4,795 5,148 5,589 Minority Interests 411 746 688 706 729 757 Total Cap. & Liab. 9,440 11,568 12,883 14,889 16,558 18,228 Non-Cash Wkg. Capital (555) (1,206) (252) (171) (133) (90) Net Cash/(Debt) 849 1,333 (666) (1,927) (2,704) (3,359) Debtors Turn (avg days) 32.8 30.2 27.6 28.6 28.6 28.7 Creditors Turn (avg days) 88.5 101.4 98.0 93.1 92.7 93.1 Inventory Turn (avg days) 43.6 43.1 48.5 52.5 52.7 53.0 Asset Turnover (x) 1.6 1.6 1.7 1.7 1.7 1.7 Current Ratio (x) 1.2 1.1 1.0 1.0 1.0 1.0 Quick Ratio (x) 0.9 0.7 0.6 0.6 0.6 0.6 Net Debt/Equity (X) CASH CASH 0.1 0.4 0.5 0.5 Net Debt/Equity ex MI (X) (0.2) (0.3) 0.1 0.4 0.5 0.6 Capex to Debt (%) 72.7 92.9 67.3 44.1 30.8 27.2 Z-Score (X) NA NA NA NA NA NA Source: Company, DBS Vickers
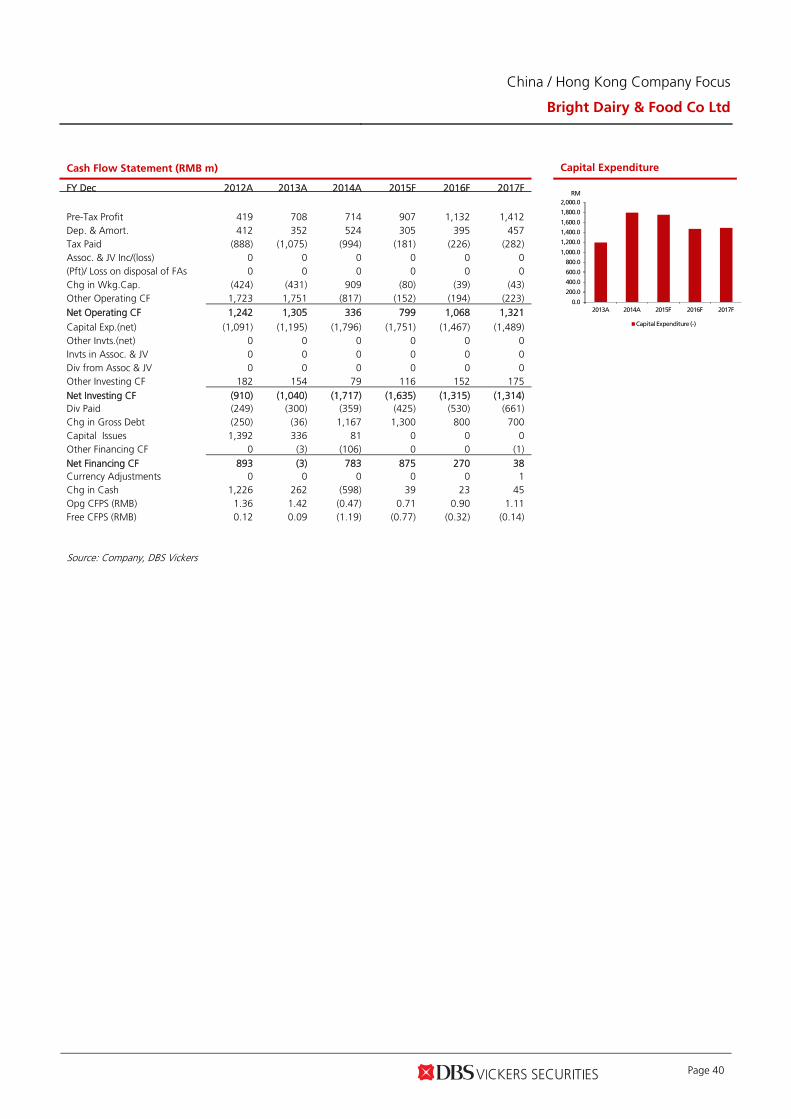
China / Hong Kong Company Focus
Bright Dairy & Food Co Ltd
Page 40
Cash Flow Statement (RMB m) Capital Expenditure
FY Dec 2012A 2013A 2014A 2015F 2016F 2017F
0.0
200.0
400.0
600.0
800.0
1,000.0
1,200.0
1,400.0
1,600.0
1,800.0
2,000.0
2013A 2014A 2015F 2016F 2017F
Capital Expenditure (-)
RM
Pre-Tax Profit 419 708 714 907 1,132 1,412 Dep. & Amort. 412 352 524 305 395 457 Tax Paid (888) (1,075) (994) (181) (226) (282) Assoc. & JV Inc/(loss) 0 0 0 0 0 0 (Pft)/ Loss on disposal of FAs 0 0 0 0 0 0 Chg in Wkg.Cap. (424) (431) 909 (80) (39) (43) Other Operating CF 1,723 1,751 (817) (152) (194) (223) Net Operating CF 1,242 1,305 336 799 1,068 1,321 Capital Exp.(net) (1,091) (1,195) (1,796) (1,751) (1,467) (1,489) Other Invts.(net) 0 0 0 0 0 0 Invts in Assoc. & JV 0 0 0 0 0 0 Div from Assoc & JV 0 0 0 0 0 0 Other Investing CF 182 154 79 116 152 175 Net Investing CF (910) (1,040) (1,717) (1,635) (1,315) (1,314) Div Paid (249) (300) (359) (425) (530) (661) Chg in Gross Debt (250) (36) 1,167 1,300 800 700 Capital Issues 1,392 336 81 0 0 0 Other Financing CF 0 (3) (106) 0 0 (1) Net Financing CF 893 (3) 783 875 270 38 Currency Adjustments 0 0 0 0 0 1 Chg in Cash 1,226 262 (598) 39 23 45 Opg CFPS (RMB) 1.36 1.42 (0.47) 0.71 0.90 1.11 Free CFPS (RMB) 0.12 0.09 (1.19) (0.77) (0.32) (0.14) Source: Company, DBS Vickers

China / Hong Kong Company Focus
Bright Dairy & Food Co Ltd
Page 41
This page has been left blank intentionally

ASIAN INSIGHTS VICKERS SECURITIESwww.dbsvickers.com
ed-JS / sa- CW
BUY
Last Traded Price: HK$38.35 (HSI : 25,399) Price Target : HK$ 47.1 (23% upside) (Prev. HK$45.8) Potential Catalyst: Stronger than expected margin enhancement Where we differ: More conservative on earnings vs consensus Analyst Alice HUI CFA, +852 2971 1960 [email protected] Alison Fok +852 2971 1938 [email protected] Price Relative
Forecasts and Valuation FY Dec (RMB m) 2014A 2015F 2016F 2017FTurnover 50,049 55,784 61,750 67,723 EBITDA 4,241 4,372 4,944 5,694 Pre-tax Profit 3,150 3,469 4,004 4,658 Net Profit 2,351 2,694 3,066 3,526 EPS (RMB) 1.22 1.38 1.57 1.80 EPS (HK$) 1.52 1.72 1.96 2.25 EPS Gth (%) 35.1 12.9 13.8 15.0 Diluted EPS (HK$) 1.52 1.72 1.96 2.25 DPS (HK$) 0.36 0.39 0.44 0.51 BV Per Share (HK$) 13.93 15.10 16.67 18.48 PE (X) 25.2 22.3 19.6 17.0 P/Cash Flow (X) 19.2 13.2 14.2 13.2 P/Free CF (X) 398.5 29.4 35.3 29.4 EV/EBITDA (X) 15.9 15.3 13.1 10.8 Net Div Yield (%) 0.9 1.0 1.1 1.3 P/Book Value (X) 2.8 2.5 2.3 2.1 Net Debt/Equity (X) 0.2 0.1 0.0 CASH ROAE (%) 12.8 11.9 12.3 12.8 Earnings Rev (%): Nil Nil New Consensus EPS (RMB) 1.43 1.69 2.03 Other Broker Recs: B: 22 S: 1 H: 8
Source of all data: Company, DBSV, Thomson Reuters, HKEX
GETTING BIGGER AND BETTER Maintain BUY on solid performance. We maintain our Buy rating on China Mengniu as we expect product mix upgrades and margin expansion would continue drive decent earnings growth in the next 1-2 years. We expect the company to continue gaining market share, with earnings expected to grow at 14.2% CAGR for FY14-16. Its JV with Danone, despite limited scale but growing fast, could be a more significant driver in the medium term considering the strong know-how of Danone and Mengniu’s strength in branding and distribution. Improving product mix to drive sales and margins. We expect yogurt, representing 15% of FY14 sales, to remain a key growth contributor with sales rising by 25% in FY15 (FY14: 37%), helped by star products including Champion, Yoyi C and full-year contribution from Danone’s Bio+ (FY14: Rmb200m). Coupled with solid momentum in other high-margin products such as premium milk, we expect Mengniu’s double-digit growth in top line to be sustainable, with room for margin expansion given the enhancement in product mix and favourable raw material costs. Competition in UHT milk remains tough. We expect the mass UHT milk market to face tougher competition. But with its strategy to place more promotional efforts on this category, there could still be some growth with the cheaper raw material costs (avg. raw milk prices and Fonterra milk powder prices have fallen 15% and 40% yoy respectively) providing a cushion on margins. Valuation: The stock is currently trading at 19.6x FY16F PE, below its historical (24x) as well as sector average valuation (25.5x). Our TP is now rolled over to HK$47.1(previously HK$45.8), based on 24x FY16F PE (prev. c.26x FY15 PE), pegged to its historical average. Key Risks to Our View: Demand, cost, competition and food safety the key risks. Slower than expected demand, raw material cost fluctuation, rising SG&A on increased A&P efforts, surging competition (both domestic and global players) and food safety concerns would be key risks.
At A Glance Issued Capital (m shrs) 1,961 Mkt. Cap (HK$m/US$m) 75,216 / 9,705
Major Shareholders COFCO, Arla, Danone (%) 31.5 Commonwealth Bank of Australia 8.0
Free Float (%) 60.4 3m Avg. Daily Val. (US$m) 28.9 ICB Industry : Consumer Goods / Food Producers
63
83
103
123
143
163
183
203
16.3
21.3
26.3
31.3
36.3
41.3
46.3
Jul-11 Jul-12 Jul-13 Jul-14 Jul-15
Relative IndexHK$
China Mengniu (LHS) Relative HSI INDEX (RHS)
DBS Group Research . Equity 24 July 2015
China / Hong Kong Company Guide
China Mengniu
Edition 1 Version 1 |Bloomberg: 2319 HK EQUITY | Reuters: 2319.HK Refer to important disclosures at the end of this report

ASIAN INSIGHTS VICKERS SECURITIES
Page 43
Company Guide
China Mengniu
CRITICAL DATA POINTS TO WATCH
Earnings Drivers: Yogurt – leader in driving stronger product mix. Yogurt accounted for 15% of FY14 sales. We expect sales growth to reach 25% in FY15 (FY14: 37%), led by higher margin star products such as Champion, Yoyi C, and full-year contribution from Danone’s Bio+ (FY14. RMB200m). Mengniu has launched smaller packaging formats for Yoyi C with more varieties of flavours, while it continues to extend the products’ shelf-life to improve profitability. Recovery in infant formula sales. Despite the tough operating environment in the infant formula market, we see potential catalysts coming from (i) a likely recovery in Yashili’s topline growth; (ii) injection of the remainder of existing infant formula operations from Mengniu to Yashili; and (iii) potential investment into Danone’s Dumex China, which is one of the fastest growing imported brands. Mengniu became a controlling shareholder of Yashili last year. In FY14, Yashili accounted for c.5% of its sales and net profit. Following the acquisition, Yashili has been undergoing restructuring and is refining its distribution network. We expect impact from these efforts to start kicking in gradually. Given the typically higher GP margin for infant formula, a recovery in Yashili would enhance Mengniu’s margin in the medium term. Seeking to improve distribution channels. Mengniu will continue to streamline its distribution channels, shifting from distributor-based to direct selling. This will be implemented in 2015 in first tier and key provincial cities, where the company aims to switch to direct selling in modern channels instead of through distributors. In addition, Mengniu will also proactively seek new channels such as schools and catering. This should result in improved control of its distribution network in the longer run, though in the near term, the process would need to be carefully monitored to minimise any possible negative impact during transition.
FY14 revenue breakdown%
UHT milk47%Milk
beverages24%
Yogurt15%
Ice cream5%
Other dairy products
1%
Yogurt sales & % yoy
0%
10%
20%
30%
40%
50%
60%
70%
0
1,000
2,000
3,000
4,000
5,000
6,000
7,000
8,000
9,000
10,000
2009 2010 2011 2012 2013 2014F 2015F
RMB m
Sales Growth (%)
Yashili net profit contribution as % of total sales
1.2
5.0
0.2 0.0
1.0
2.0
3.0
4.0
5.0
6.0
2H13 1H14 2H14
%
Overall profitability
11%
28%
-21%
30%
44%
15%
-30%-20%-10%0%10%20%30%40%50%
0
500
1,000
1,500
2,000
2,500
3,000
2009 2010 2011 2012 2013 2014F 2015F
RMB m
Net profit Growth (%)
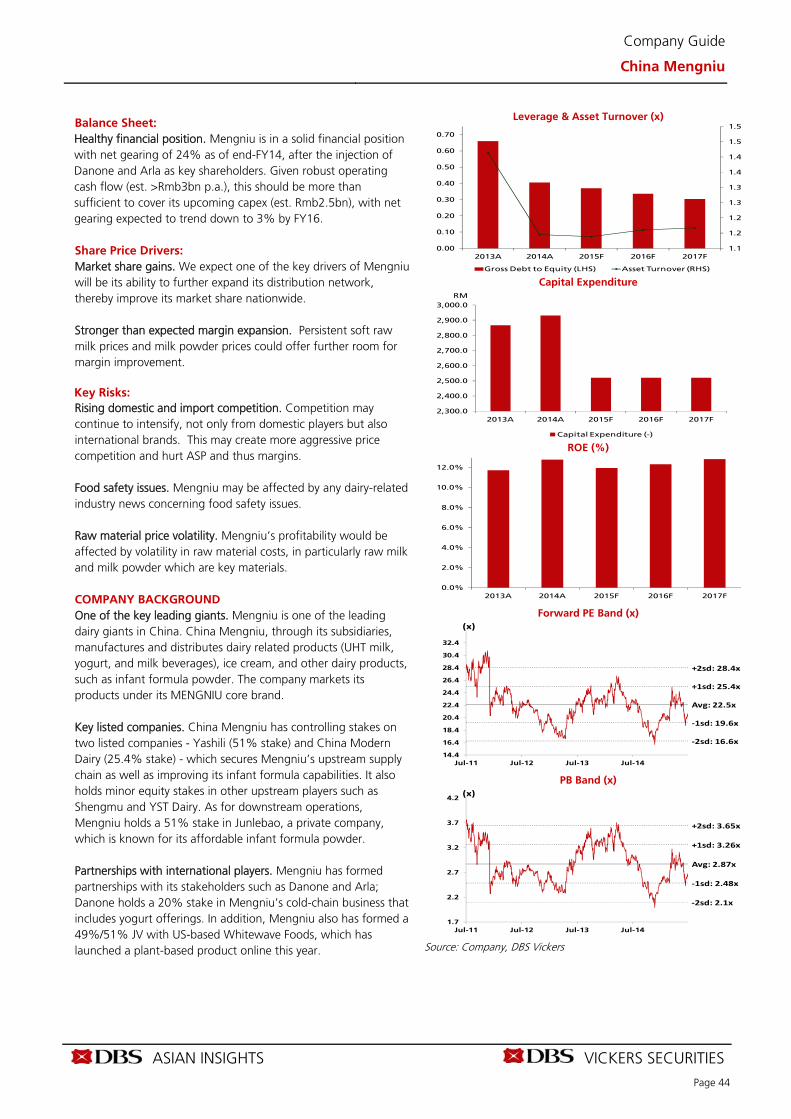
ASIAN INSIGHTS VICKERS SECURITIES
Page 44
Company Guide
China Mengniu
Balance Sheet: Healthy financial position. Mengniu is in a solid financial position with net gearing of 24% as of end-FY14, after the injection of Danone and Arla as key shareholders. Given robust operating cash flow (est. >Rmb3bn p.a.), this should be more than sufficient to cover its upcoming capex (est. Rmb2.5bn), with net gearing expected to trend down to 3% by FY16. Share Price Drivers: Market share gains. We expect one of the key drivers of Mengniu will be its ability to further expand its distribution network, thereby improve its market share nationwide. Stronger than expected margin expansion. Persistent soft raw milk prices and milk powder prices could offer further room for margin improvement. Key Risks: Rising domestic and import competition. Competition may continue to intensify, not only from domestic players but also international brands. This may create more aggressive price competition and hurt ASP and thus margins. Food safety issues. Mengniu may be affected by any dairy-related industry news concerning food safety issues. Raw material price volatility. Mengniu’s profitability would be affected by volatility in raw material costs, in particularly raw milk and milk powder which are key materials. COMPANY BACKGROUND One of the key leading giants. Mengniu is one of the leading dairy giants in China. China Mengniu, through its subsidiaries, manufactures and distributes dairy related products (UHT milk, yogurt, and milk beverages), ice cream, and other dairy products, such as infant formula powder. The company markets its products under its MENGNIU core brand. Key listed companies. China Mengniu has controlling stakes on two listed companies - Yashili (51% stake) and China Modern Dairy (25.4% stake) - which secures Mengniu’s upstream supply chain as well as improving its infant formula capabilities. It also holds minor equity stakes in other upstream players such as Shengmu and YST Dairy. As for downstream operations, Mengniu holds a 51% stake in Junlebao, a private company, which is known for its affordable infant formula powder. Partnerships with international players. Mengniu has formed partnerships with its stakeholders such as Danone and Arla; Danone holds a 20% stake in Mengniu’s cold-chain business that includes yogurt offerings. In addition, Mengniu also has formed a 49%/51% JV with US-based Whitewave Foods, which has launched a plant-based product online this year.
Leverage & Asset Turnover (x)
Capital Expenditure
ROE (%)
Forward PE Band (x)
PB Band (x)
Source: Company, DBS Vickers
1.1
1.2
1.2
1.3
1.3
1.4
1.4
1.5
1.5
0.00
0.10
0.20
0.30
0.40
0.50
0.60
0.70
2013A 2014A 2015F 2016F 2017F
Gross Debt to Equity (LHS) Asset Turnover (RHS)
2,300.0
2,400.0
2,500.0
2,600.0
2,700.0
2,800.0
2,900.0
3,000.0
2013A 2014A 2015F 2016F 2017F
Capital Expenditure (-)
RM
0.0%
2.0%
4.0%
6.0%
8.0%
10.0%
12.0%
2013A 2014A 2015F 2016F 2017F
Avg: 22.5x
+1sd: 25.4x
+2sd: 28.4x
‐1sd: 19.6x
‐2sd: 16.6x
14.4
16.4
18.4
20.4
22.4
24.4
26.4
28.4
30.4
32.4
Jul-11 Jul-12 Jul-13 Jul-14
(x)
Avg: 2.87x
+1sd: 3.26x
+2sd: 3.65x
‐1sd: 2.48x
‐2sd: 2.1x
1.7
2.2
2.7
3.2
3.7
4.2
Jul-11 Jul-12 Jul-13 Jul-14
(x)

ASIAN INSIGHTS VICKERS SECURITIES
Page 45
Company Guide
China Mengniu
Segmental Breakdown (RMB m)
FY Dec 2013A 2014A 2015F 2016F 2017F Revenues (RMB m) Liquid milk 37,903 43,036 48,218 53,613 59,023 Ice cream 3,023 2,716 2,743 2,771 2,798 Other dairy products 253 336 504 655 786 Infant formula 2,177 3,961 4,320 4,711 5,115 Total 43,357 50,049 55,784 61,750 67,723 Source: Company, DBS Vickers
Income Statement (RMB m) FY Dec 2013A 2014A 2015F 2016F 2017F Revenue 43,357 50,049 55,784 61,750 67,723 Cost of Goods Sold (31,660) (34,616) (38,195) (42,169) (46,000)Gross Profit 11,697 15,434 17,589 19,581 21,723Other Opng (Exp)/Inc (9,846) (12,769) (14,569) (16,104) (17,649)Operating Profit 1,852 2,665 3,020 3,476 4,074Other Non Opg (Exp)/Inc 0 0 0 0 0Associates & JV Inc 154 278 239 308 354Net Interest (Exp)/Inc 199 208 210 220 230Dividend Income 0 0 0 0 0Exceptional Gain/(Loss) 0 0 0 0 0Pre-tax Profit 2,205 3,150 3,469 4,004 4,658Tax (367) (459) (531) (651) (800)Minority Interest (231) (340) (245) (287) (331)Preference Dividend 0 0 0 0 0Net Profit 1,631 2,351 2,694 3,066 3,526EBITDA 3,186 4,241 4,372 4,944 5,694Growth Revenue Gth (%) 20.2 15.4 11.5 10.7 9.7EBITDA Gth (%) 27.3 33.1 3.1 13.1 15.2Opg Profit Gth (%) 23.9 43.9 13.3 15.1 17.2Net Profit Gth (%) 29.7 44.1 14.6 13.8 15.0Margins & Ratio Gross Margins (%) 27.0 30.8 31.5 31.7 32.1Opg Profit Margin (%) 4.3 5.3 5.4 5.6 6.0Net Profit Margin (%) 3.8 4.7 4.8 5.0 5.2ROAE (%) 11.7 12.8 11.9 12.3 12.8ROA (%) 5.3 5.4 5.5 5.8 6.1ROCE (%) 6.8 6.7 6.6 7.0 7.4 Div Payout Ratio (%) 22.5 23.3 22.5 22.5 22.5 Net Interest Cover (x) NM NM NM NM NM Source: Company, DBS Vickers

ASIAN INSIGHTS VICKERS SECURITIES
Page 46
Company Guide
China Mengniu
Interim Income Statement (RMB m)
FY Dec 2H2012 1H2013 2H2013 1H2014 2H2014 Revenue 17,837 20,668 22,689 25,836 24,213 Cost of Goods Sold (13,426) (15,149) (16,511) (17,454) (17,162) Gross Profit 4,411 5,519 6,178 8,382 7,052 Other Oper. (Exp)/Inc (3,789) (4,611) (5,210) (7,161) (5,608) Operating Profit 622 908 968 1,221 1,444 Other Non Opg (Exp)/Inc 0 0 0 0 0
Associates & JV Inc 74 30 124 183 95
Net Interest (Exp)/Inc 86 99 100 78 130 Exceptional Gain/(Loss) 0 0 0 0 0 Pre-tax Profit 782 1,036 1,193 1,481 1,669 Tax (91) (186) (181) (253) (207) Minority Interest (79) (101) (130) (180) (160) Net Profit 612 749 881 1,049 1,302 Revenue Gth (%) (5.2) 13.3 27.2 25.0 6.7 Opg Profit Gth (%) (30.9) 4.1 55.5 34.5 49.1 Net Profit Gth (%) (23.4) 16.3 43.9 39.9 47.7 Margins Gross Margins (%) 24.7 26.7 27.2 32.4 29.1 Opg Profit Margins (%) 3.5 4.4 4.3 4.7 6.0 Net Profit Margins (%) 3.4 3.6 3.9 4.1 5.4 Source: Company, DBS Vickers
Balance Sheet (RMB m)
FY Dec 2013A 2014A 2015F 2016F 2017F Net Fixed Assets 9,246 9,667 9,874 11,033 12,087 Invts in Associates & JVs 2,843 3,841 3,841 3,841 3,841 Other LT Assets 11,929 13,240 15,732 15,781 15,753 Cash & ST Invts 7,663 4,650 6,209 8,958 12,179 Inventory 2,577 4,342 3,977 4,390 5,041 Debtors 3,595 9,768 9,689 9,804 9,918 Other Current Assets 2,485 1,573 1,620 1,669 1,719
Total Assets 40,339 47,081 50,942 55,476 60,537 ST Debt
8,554 4,479 1,974 1,974 1,974 Creditors 9,116 9,546 10,465 11,553 12,603 Other Current Liab 393 326 397 517 667 LT Debt 3,336 5,464 7,969 7,969 7,969 Other LT Liabilities 929 2,773 3,255 3,833 4,527 Shareholder’s Equity 15,361 21,489 23,635 26,095 28,931 Minority Interests 2,650 3,003 3,248 3,535 3,867 Total Cap. & Liab. 40,339 47,081 50,942 55,476 60,537 Non-Cash Wkg. Capital (851) 5,811 4,425 3,793 3,409 Net Cash/(Debt) (4,227) (5,293) (3,734) (985) 2,236 Debtors Turn (avg days) 18.5 48.7 63.7 57.6 53.1 Creditors Turn (avg days) 92.4 102.2 98.5 98.0 98.5 Inventory Turn (avg days) 23.9 37.9 40.9 37.2 38.5 Asset Turnover (x) 1.4 1.1 1.1 1.2 1.2 Current Ratio (x) 0.9 1.4 1.7 1.8 1.9 Quick Ratio (x) 0.6 1.0 1.2 1.3 1.4 Net Debt/Equity (X) 0.2 0.2 0.1 0.0 CASH Net Debt/Equity ex MI (X) 0.3 0.2 0.2 0.0 CASH Capex to Debt (%) 24.1 29.5 25.3 25.3 25.3 Z-Score (X) 3.0 3.4 3.4 3.4 3.4 Source: Company, DBS Vickers

ASIAN INSIGHTS VICKERS SECURITIES
Page 47
Company Guide
China Mengniu
Cash Flow Statement (RMB m)
FY Dec 2013A 2014A 2015F 2016F 2017F Pre-Tax Profit 2,229 3,150 3,469 4,004 4,658 Dep. & Amort. 1,218 1,321 1,187 1,236 1,343 Tax Paid (281) (572) (459) (531) (651) Assoc. & JV Inc/(loss) 0 0 0 0 0 (Pft)/ Loss on disposal of FAs 0 0 0 0 0 Chg in Wkg.Cap. 517 (478) 1,315 512 234 Other Operating CF (399) (341) (951) (1,000) (1,020)
Net Operating CF 3,284 3,080 4,561 4,222 4,565 Capital Exp.(net) (2,867) (2,931) (2,519) (2,519) (2,519) Other Invts.(net) 0 0 0 0 0 Invts in Assoc. & JV 0 0 0 0 0 Div from Assoc & JV 0 0 0 0 0 Other Investing CF (12,402) (3,484) (1,122) 1,409 1,592 Net Investing CF (15,269) (6,415) (3,641) (1,111) (927) Div Paid (290) (391) (548) (606) (690) Chg in Gross Debt 10,780 (1,460) 0 0 0 Capital Issues 835 3,752 0 0 0 Other Financing CF 1,006 3,910 1,188 244 273 Net Financing CF 12,331 3,619 640 (362) (417) Currency Adjustments 0 0 0 0 0 Chg in Cash 346 283 1,559 2,749 3,221 Opg CFPS (RMB) 1.53 1.85 1.66 1.90 2.22 Free CFPS (RMB) 0.23 0.08 1.04 0.87 1.05 Source: Company, DBS Vickers
Target Price & Ratings History
Source: DBS Vickers
1 23
45
6
27.029.031.033.035.037.039.041.043.045.047.0
Jul-1
4
Oct
-14
Dec
-14
Feb-
15
May
-15
Jul-1
5
HK$S.No. Date Closing Target Rat ing
Price Price1: 28-Aug-14 HK$38.00 HK$38.30 Hold2: 31-Oct-14 HK$34.25 HK$37.10 Hold3: 5-Dec-14 HK$29.75 HK$32.00 Hold4: 9-Jan-15 HK$33.30 HK$32.80 Hold5: 27-Mar-15 HK$38.70 HK$41.30 Hold6: 4-May-15 HK$39.25 HK$45.8 Buy

ASIAN INSIGHTS VICKERS SECURITIESwww.dbsvickers.com
ed-TH/ sa- AL
BUY Last Traded Price: HK$2.53 (HSI : 25,399) Price Target : 12-Month HK$ 3.35 (32% upside) (Prev HK$3.45) Potential Catalyst: Earlier-than-expected rebound in dairy prices Where we differ: Lower dairy price assumptions for FY15-16 Analyst Alice HUI CFA, +852 2971 1960 [email protected] Alison Fok +852 2971 1938 [email protected] Price Relative
Forecasts and Valuation FY Dec (RMB m) 2014A 2015F 2016F 2017FTurnover 5,027 5,467 6,861 7,558 EBITDA 1,239 1,417 1,659 1,876 Pre-tax Profit 770 928 1,126 1,332 Core Net Profit 1,064 885 1,081 1,279 EPS (RMB) 0.22 0.18 0.22 0.26 EPS (HK$) 0.28 0.23 0.28 0.33 EPS Gth (%) 89.1 (16.8) 22.1 18.3 Diluted EPS (HK$) 0.19 0.23 0.28 0.33 DPS (HK$) 0.01 0.00 0.01 0.01 BV Per Share (HK$) 1.68 3.88 4.18 4.52 PE (X) 9.2 11.0 9.1 7.7 P/Cash Flow (X) 6.2 6.5 5.8 5.3 P/Free CF (X) nm nm 143.2 40.1 EV/EBITDA (X) 11.7 10.5 9.0 8.0 Net Div Yield (%) 0.5 0.0 0.5 0.5 P/Book Value (X) 1.5 0.7 0.6 0.6 Net Debt/Equity (X) 0.7 0.3 0.3 0.3 ROAE (%) 17.4 8.2 6.9 7.6 Earnings Rev (%): (1) (6) NEW Consensus EPS (RMB) 0.20 0.25 Other Broker Recs: B: 14 S: 5 H: 3
Source of all data: Company, DBSV, Thomson Reuters, HKEX
STABLE PROGRESS Maintain BUY on undemanding valuations. We maintain our BUY rating on China Modern Dairy (CMD) as we expect raw milk prices to post a mild rebound in 2016. We believe the weaker earnings in FY15, a 17% decline under our estimates, should have been largely priced in at the current valuation with possible resumption of earnings growth in FY16. In the medium term, we believe leading upstream players like CMD should continue to benefit from rising demand from downstream as well as market consolidation.
Recent acquisition strengthens leading position. In Jul’15, CMD announced the placement of 477m new shares (9.9% of total) to KKR and CDH with a 3-year lock-up period, in exchange for the remaining 82% stake in its two JV farms which holds 16,268 cows. Based on the 5M15 net profit of Rmb44.6m, we estimate the potential earnings enhancement to be 3-5% in FY15/16.
Downstream operations still sound. Downstream sales is sound as CMD’s UHT milk sales remained relatively healthy under a highly competitive landscape. We expect CMD to meet its sales target of Rmb1.5bn for its branded business in FY15. The company's low-temperature products such as yogurt have hit the shelves in Beijing, which could become a new driver in the longer run.
Valuation: We lower our EPS estimates by 5-10% for FY15-16 and introduce FY17 earnings largely on share placement adjustment. CMD is now trading at 9.1x FY16 PE, which is lower than its 1SD below its 3-year historical average of 13x. Maintain our BUY rating with a new TP of HK$3.35 (Prev. HK$3.45).
Risks: Raw milk price volatility. CMD’s earnings are highly affected by raw milk price fluctuations, both domestic and international.
At A Glance Issued Capital (m shrs) 5,305 Mkt. Cap (HK$m/US$m) 13,411 / 1,730
Major Shareholders China Mengniu Dairy Company Limited (%) 25.4 KKR & CDH (%) 9.9
Free Float (%) 21.9 3m Avg. Daily Val. (US$m) 4.6 ICB Industry : Consumer Goods / Beverages
72
92
112
132
152
172
192
212
1.4
1.9
2.4
2.9
3.4
3.9
4.4
Jul-11 Jul-12 Jul-13 Jul-14 Jul-15
Relative IndexHK$
China Modern Dairy (LHS) Relative HSI INDEX (RHS)
DBS Group Research . Equity 24 July 2015
China / Hong Kong Company Guide
China Modern Dairy Edition 1 Version 1 |Bloomberg: 1117 HK Equity | Reuters: 1117.HK
Refer to important disclosures at the end of this report

ASIAN INSIGHTS VICKERS SECURITIES
Page 49
Company Guide
China Modern Dairy
CRITICAL DATA POINTS TO WATCH Earnings Drivers: Production volume to drive upstream sales growth. We expect sales volume, driven by improving milk yields and organic herd size growth, to be the key drivers to upstream earnings. Demand will be mostly absorbed by Mengniu, with a 10-year offtake agreement until 2018. We maintain our view that large-scale dairy farms such as CMD will be the key beneficiaries of the market consolidation in the upstream dairy sector, as large-scale players should have stronger cost competitiveness vs smaller players. In the longer run, the increasing popularity of pasteurised dairy products would further drive the demand for locally produced quality milk. In terms of herd size, we expect the company to grow at 9% organically. Inclusive of its two JVs, we expect herd size to grow 17% this year. Milk yield to grow. With the inclusion of the two JVs, we expect milk yield to be softer this year on average. We estimate milk yield to grow by 1% to 9 tonnes per annum this year (FY14: +7% y-o-y). This should improve as the herd matures. Point of sales expansion key to downstream growth. Downstream sales will be primarily driven by distribution network expansion to improve CMD’s visibility in the market. CMD’s liquid milk products are currently sold in 28 provinces, with decent sales coverage at modern trade channels such as large supermarkets including Carrefour, Walmart, Meetall, Shiji Hualian, C.P Lotus, Yonghui, Auchan, etc. As of Dec’14, CMD had expanded its distribution partners to 463 (FY13: 210), with POS increased to 260k, up c.148% y-o-y (versus downstream sales growth of 159%). We expect downstream sales contribution to grow to 16% of sales (FY14: 9%) to reach 42% in CAGR for FY14-16F.
Raw milk price (CMD)
4.0
4.2
4.4
4.6
4.8
5.0
5.2
2013 2014 2015F 2016F 2017F
RMB/kg
Milk yield (tonne/annum)
8.50
8.90 8.99
9.08
8.20
8.40
8.60
8.80
9.00
9.20
2013 2014 2015F 2016F
RMB/tonne
Sales volume ('000 tonnes)
0%
10%
20%
30%
40%
0
500
1,000
1,500
2,000
2013 2014 2015F 2016F 2017F
'000 tonne
Sales volume % yoy
Raw milk price
3.0 3.2 3.4 3.6 3.8 4.0 4.2 4.4
Jun/
11Se
p/11
Dec
/11
Mar
/12
Jun/
12Se
p/12
Dec
/12
Mar
/13
Jun/
13Se
p/13
Dec
/13
Mar
/14
Jun/
14Se
p/14
Dec
/14
Mar
/15
Jun/
15
RMB/kg
WMP
1,000 1,500 2,000 2,500 3,000 3,500 4,000 4,500 5,000 5,500
Jun/
11
Oct
/11
Feb/
12
Jun/
12
Oct
/12
Feb/
13
Jun/
13
Oct
/13
Feb/
14
Jun/
14
Oct
/14
Feb/
15
Jun/
15
US$/ton

ASIAN INSIGHTS VICKERS SECURITIES
Page 50
Company Guide
China Modern Dairy
Balance Sheet: Heavy capex input. Owing to heavy capex commitment to build dairy farms, CMD’s net gearing was at a relatively high level of 67%. However, CMD should see improvement, having recently done a new share placement as well as having less capex commitment with a more mature herd size to grow organically. Share Price Drivers: Rebound on raw milk prices. A rebound in raw milk prices will lift upstream sales, as well as margins. As the largest upstream player in China, we expect CMD to be one of the key beneficiaries should this happen. While we still expect volume to grow 15% in FY15, the decline in raw milk prices (down 12% y-o-y to Rmb4.4/kg in FY15 under our assumptions, vs 4% q-o-q) would partly offset the volume growth. Meanwhile, we expect cost of sales (of which around 2/3rd comprise of feed costs) to post a slight decline as soft commodity and alfalfa prices remained largely on the stable/downward trend y-o-y. Under this backdrop, a potential recovery in raw milk prices from the current level (a multi-year trough for international prices) should help margins going forward. Stronger growth at downstream operations. CMD is expanding its product range progressively to lower its reliance on upstream earnings. This year, CMD is entering into low-temperature dairy products initially in Beijing. If well-received, CMD will begin expanding to other regions which should further enhance its product offerings.. COMPANY BACKGROUND Largest upstream dairy player. Established in 2005 in Maanshan, Anhui, China Modern Dairy is the largest upstream dairy company in terms of herd size as well as the largest raw milk producer in China. As of FY14, CMD had a total of 201k dairy cows at 25 operating farms across China, with average milk yield at 8.9 ton/annum. A pioneer in large-scale dairy farming. CMD is among the first to adopt a free-stall dairy farming business model in China to ensure higher yields and cost efficiency compared with small-scale backyard farmers. CMD previously relied on imported heifers from Australia to ensure higher productivity as well as faster herd size growth; this has since been halted as CMD has reached a sustainable herd size. Expand operations downstream. CMD expanded its operations downstream under the brand Modern Farming, primarily sold in Shanghai region. In FY15, CMD will expand its product offerings to cover low-temperature dairy products.
Leverage & Asset Turnover (x)
Capital Expenditure
ROE (%)
Forward PE Band (x)
PB Band (x)
Source: Company, DBS Vickers
0.2
0.2
0.2
0.3
0.3
0.3
0.3
0.3
0.4
0.4
0.4
0.00
0.10
0.20
0.30
0.40
0.50
0.60
0.70
0.80
0.90
2013A 2014A 2015F 2016F 2017F
Gross Debt to Equity (LHS) Asset Turnover (RHS)
0.0
500.0
1,000.0
1,500.0
2,000.0
2,500.0
2013A 2014A 2015F 2016F 2017F
Capital Expenditure (-)
RM
0.0%
2.0%
4.0%
6.0%
8.0%
10.0%
12.0%
14.0%
16.0%
2013A 2014A 2015F 2016F 2017F
Avg: 15.7x
+1sd: 20.4x
+2sd: 25x
‐1sd: 11x
‐2sd: 6.3x5.7
10.7
15.7
20.7
25.7
30.7
35.7
Jul-11 Jul-12 Jul-13 Jul-14
(x)
Avg: 1.76x
+1sd: 2.21x
+2sd: 2.65x
‐1sd: 1.32x
‐2sd: 0.87x0.7
1.2
1.7
2.2
2.7
3.2
Jan-12 Jan-13 Jan-14 Jan-15
(x)

ASIAN INSIGHTS VICKERS SECURITIES
Page 51
Company Guide
China Modern Dairy
Segmental Breakdown (RMB m)
FY Dec 2013A 2014A 2015F 2016F 2017F Revenues (RMB m) Upstream dairy 2,968 4,194 4,017 5,161 5,658 UHT Milk 321 833 1,450 1,700 1,900 Total 3,289 5,027 5,467 6,861 7,558 Source: Company, DBS Vickers
Income Statement (RMB m) FY Dec 2013A 2014A 2015F 2016F 2017F Revenue 3,289 5,027 5,467 6,861 7,558 Cost of Goods Sold (2,032) (3,161) (3,837) (4,909) (5,345)Gross Profit 1,257 1,865 1,629 1,952 2,213Other Opng (Exp)/Inc (410) (870) (494) (599) (660)Operating Profit 847 996 1,136 1,353 1,554Other Non Opg (Exp)/Inc 55 18 14 19 16Associates & JV Inc 0 0 0 0 0Net Interest (Exp)/Inc (179) (244) (222) (246) (238)Dividend Income 0 0 0 0 0Exceptional Gain/(Loss) 0 0 0 0 0Pre-tax Profit 518 770 928 1,126 1,332Tax (11) (7) (37) (45) (53)Minority Interest 26 28 5 0 0Preference Dividend 0 0 0 0 0Net Profit 560 1,064 885 1,081 1,279EBITDA 865 1,239 1,417 1,659 1,876Growth Revenue Gth (%) 61.2 52.8 8.8 25.5 10.2EBITDA Gth (%) 42.5 43.2 14.3 17.1 13.1Opg Profit Gth (%) 64.7 17.5 14.1 19.2 14.8Net Profit Gth (%) 78.9 90.0 (16.8) 22.1 18.3Margins & Ratio Gross Margins (%) 38.2 37.1 29.8 28.5 29.3Opg Profit Margin (%) 25.7 19.8 20.8 19.7 20.6Net Profit Margin (%) 17.0 21.2 16.2 15.8 16.9ROAE (%) 10.2 17.4 8.2 6.9 7.6ROA (%) 4.9 8.0 4.6 4.3 4.8ROCE (%) 8.4 8.3 6.2 5.7 6.2 Div Payout Ratio (%) 0.0 6.6 0.0 5.0 5.0 Net Interest Cover (x) 4.7 4.1 5.1 5.5 6.5 Source: Company, DBS Vickers
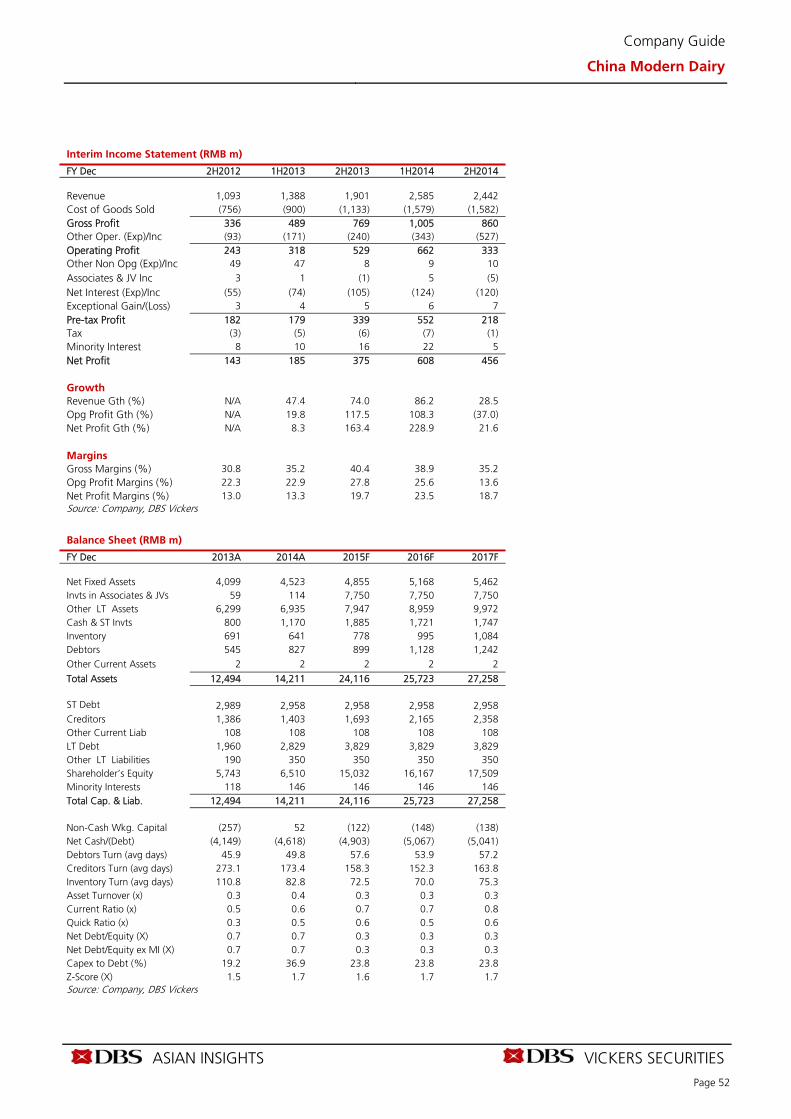
ASIAN INSIGHTS VICKERS SECURITIES
Page 52
Company Guide
China Modern Dairy
Interim Income Statement (RMB m)
FY Dec 2H2012 1H2013 2H2013 1H2014 2H2014 Revenue 1,093 1,388 1,901 2,585 2,442 Cost of Goods Sold (756) (900) (1,133) (1,579) (1,582) Gross Profit 336 489 769 1,005 860 Other Oper. (Exp)/Inc (93) (171) (240) (343) (527) Operating Profit 243 318 529 662 333 Other Non Opg (Exp)/Inc 49 47 8 9 10
Associates & JV Inc 3 1 (1) 5 (5)
Net Interest (Exp)/Inc (55) (74) (105) (124) (120) Exceptional Gain/(Loss) 3 4 5 6 7 Pre-tax Profit 182 179 339 552 218 Tax (3) (5) (6) (7) (1) Minority Interest 8 10 16 22 5 Net Profit 143 185 375 608 456 Growth Revenue Gth (%) N/A 47.4 74.0 86.2 28.5 Opg Profit Gth (%) N/A 19.8 117.5 108.3 (37.0) Net Profit Gth (%) N/A 8.3 163.4 228.9 21.6 Margins Gross Margins (%) 30.8 35.2 40.4 38.9 35.2 Opg Profit Margins (%) 22.3 22.9 27.8 25.6 13.6 Net Profit Margins (%) 13.0 13.3 19.7 23.5 18.7 Source: Company, DBS Vickers
Balance Sheet (RMB m)
FY Dec 2013A 2014A 2015F 2016F 2017F Net Fixed Assets 4,099 4,523 4,855 5,168 5,462 Invts in Associates & JVs 59 114 7,750 7,750 7,750 Other LT Assets 6,299 6,935 7,947 8,959 9,972 Cash & ST Invts 800 1,170 1,885 1,721 1,747 Inventory 691 641 778 995 1,084 Debtors 545 827 899 1,128 1,242 Other Current Assets 2 2 2 2 2
Total Assets 12,494 14,211 24,116 25,723 27,258 ST Debt
2,989 2,958 2,958 2,958 2,958 Creditors 1,386 1,403 1,693 2,165 2,358 Other Current Liab 108 108 108 108 108 LT Debt 1,960 2,829 3,829 3,829 3,829 Other LT Liabilities 190 350 350 350 350 Shareholder’s Equity 5,743 6,510 15,032 16,167 17,509 Minority Interests 118 146 146 146 146 Total Cap. & Liab. 12,494 14,211 24,116 25,723 27,258 Non-Cash Wkg. Capital (257) 52 (122) (148) (138) Net Cash/(Debt) (4,149) (4,618) (4,903) (5,067) (5,041) Debtors Turn (avg days) 45.9 49.8 57.6 53.9 57.2 Creditors Turn (avg days) 273.1 173.4 158.3 152.3 163.8 Inventory Turn (avg days) 110.8 82.8 72.5 70.0 75.3 Asset Turnover (x) 0.3 0.4 0.3 0.3 0.3 Current Ratio (x) 0.5 0.6 0.7 0.7 0.8 Quick Ratio (x) 0.3 0.5 0.6 0.5 0.6 Net Debt/Equity (X) 0.7 0.7 0.3 0.3 0.3 Net Debt/Equity ex MI (X) 0.7 0.7 0.3 0.3 0.3 Capex to Debt (%) 19.2 36.9 23.8 23.8 23.8 Z-Score (X) 1.5 1.7 1.6 1.7 1.7 Source: Company, DBS Vickers
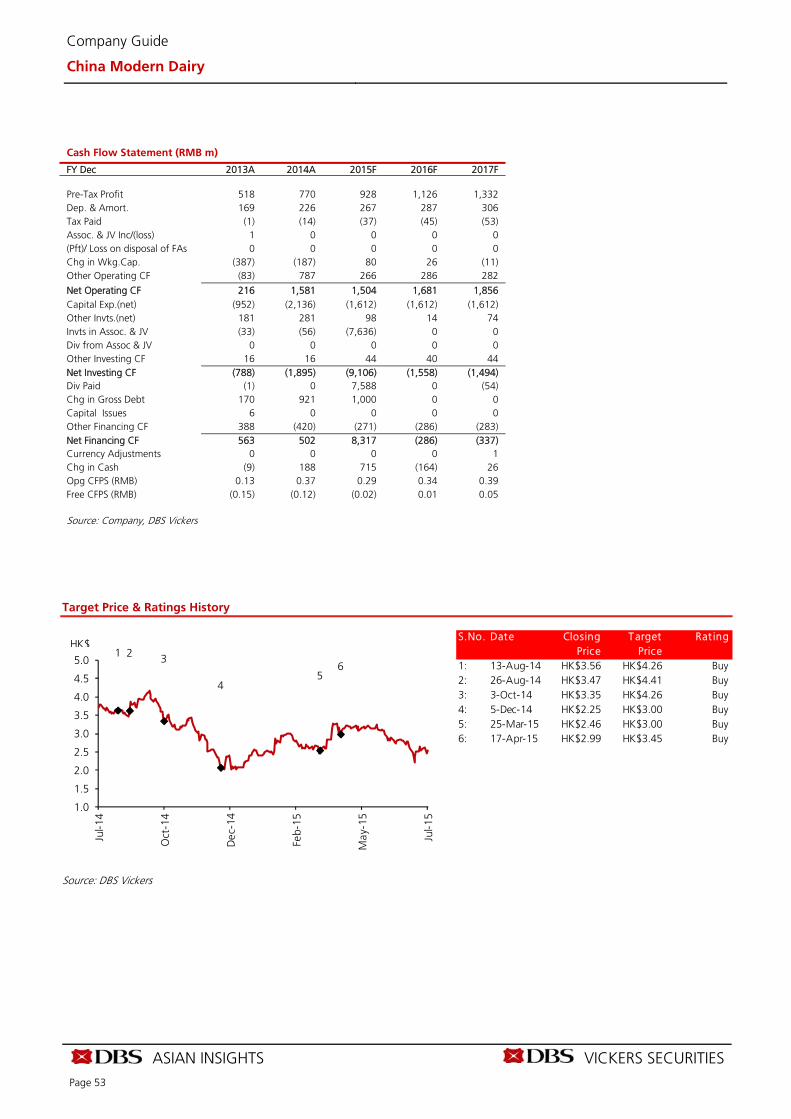
ASIAN INSIGHTS VICKERS SECURITIES
Page 53
Company Guide
China Modern Dairy
Cash Flow Statement (RMB m)
FY Dec 2013A 2014A 2015F 2016F 2017F Pre-Tax Profit 518 770 928 1,126 1,332 Dep. & Amort. 169 226 267 287 306 Tax Paid (1) (14) (37) (45) (53) Assoc. & JV Inc/(loss) 1 0 0 0 0 (Pft)/ Loss on disposal of FAs 0 0 0 0 0 Chg in Wkg.Cap. (387) (187) 80 26 (11) Other Operating CF (83) 787 266 286 282
Net Operating CF 216 1,581 1,504 1,681 1,856 Capital Exp.(net) (952) (2,136) (1,612) (1,612) (1,612) Other Invts.(net) 181 281 98 14 74 Invts in Assoc. & JV (33) (56) (7,636) 0 0 Div from Assoc & JV 0 0 0 0 0 Other Investing CF 16 16 44 40 44 Net Investing CF (788) (1,895) (9,106) (1,558) (1,494) Div Paid (1) 0 7,588 0 (54) Chg in Gross Debt 170 921 1,000 0 0 Capital Issues 6 0 0 0 0 Other Financing CF 388 (420) (271) (286) (283) Net Financing CF 563 502 8,317 (286) (337) Currency Adjustments 0 0 0 0 1 Chg in Cash (9) 188 715 (164) 26 Opg CFPS (RMB) 0.13 0.37 0.29 0.34 0.39 Free CFPS (RMB) (0.15) (0.12) (0.02) 0.01 0.05 Source: Company, DBS Vickers
Target Price & Ratings History
Source: DBS Vickers
1 2 3
45
6
1.0
1.5
2.0
2.5
3.0
3.5
4.0
4.5
5.0
Jul-1
4
Oct
-14
Dec
-14
Feb-
15
May
-15
Jul-1
5
HK$S.No. Date Closing Target Rat ing
Price Price1: 13-Aug-14 HK$3.56 HK$4.26 Buy2: 26-Aug-14 HK$3.47 HK$4.41 Buy3: 3-Oct-14 HK$3.35 HK$4.26 Buy4: 5-Dec-14 HK$2.25 HK$3.00 Buy5: 25-Mar-15 HK$2.46 HK$3.00 Buy6: 17-Apr-15 HK$2.99 HK$3.45 Buy
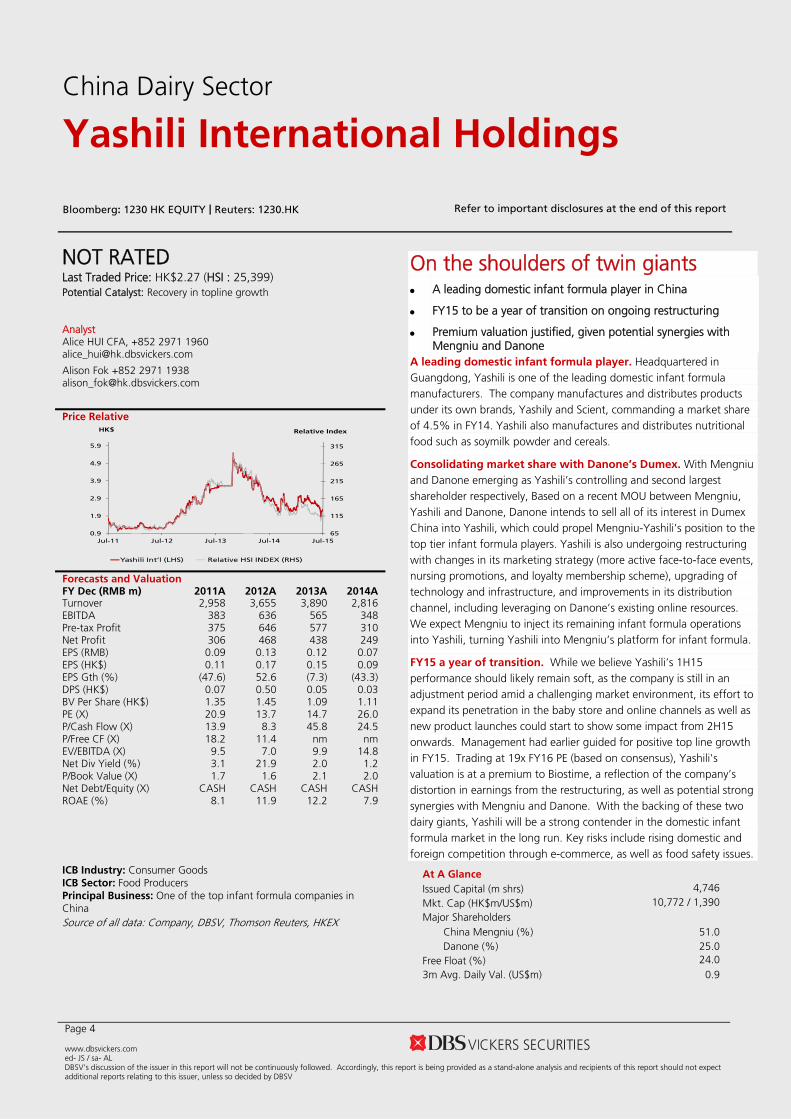
Page 4 www.dbsvickers.com ed- JS / sa- AL DBSV's discussion of the issuer in this report will not be continuously followed. Accordingly, this report is being provided as a stand-alone analysis and recipients of this report should not expect additional reports relating to this issuer, unless so decided by DBSV
NOT RATED
Last Traded Price: HK$2.27 (HSI : 25,399) Potential Catalyst: Recovery in topline growth Analyst Alice HUI CFA, +852 2971 1960 [email protected] Alison Fok +852 2971 1938 [email protected] Price Relative
65
115
165
215
265
315
0.9
1.9
2.9
3.9
4.9
5.9
Jul-11 Jul-12 Jul-13 Jul-14 Jul-15
Relative IndexHK$
Yashili Int’l (LHS) Relative HSI INDEX (RHS)
Forecasts and Valuation FY Dec (RMB m) 2011A 2012A 2013A 2014ATurnover 2,958 3,655 3,890 2,816 EBITDA 383 636 565 348 Pre-tax Profit 375 646 577 310 Net Profit 306 468 438 249 EPS (RMB) 0.09 0.13 0.12 0.07 EPS (HK$) 0.11 0.17 0.15 0.09 EPS Gth (%) (47.6) 52.6 (7.3) (43.3) DPS (HK$) 0.07 0.50 0.05 0.03 BV Per Share (HK$) 1.35 1.45 1.09 1.11 PE (X) 20.9 13.7 14.7 26.0 P/Cash Flow (X) 13.9 8.3 45.8 24.5 P/Free CF (X) 18.2 11.4 nm nm EV/EBITDA (X) 9.5 7.0 9.9 14.8 Net Div Yield (%) 3.1 21.9 2.0 1.2 P/Book Value (X) 1.7 1.6 2.1 2.0 Net Debt/Equity (X) CASH CASH CASH CASH ROAE (%) 8.1 11.9 12.2 7.9
ICB Industry: Consumer Goods ICB Sector: Food Producers Principal Business: One of the top infant formula companies in China Source of all data: Company, DBSV, Thomson Reuters, HKEX
On the shoulders of twin giants A leading domestic infant formula player in China
FY15 to be a year of transition on ongoing restructuring
Premium valuation justified, given potential synergies with Mengniu and Danone
A leading domestic infant formula player. Headquartered in Guangdong, Yashili is one of the leading domestic infant formula manufacturers. The company manufactures and distributes products under its own brands, Yashily and Scient, commanding a market share of 4.5% in FY14. Yashili also manufactures and distributes nutritional food such as soymilk powder and cereals.
Consolidating market share with Danone’s Dumex. With Mengniu and Danone emerging as Yashili’s controlling and second largest shareholder respectively, Based on a recent MOU between Mengniu, Yashili and Danone, Danone intends to sell all of its interest in Dumex China into Yashili, which could propel Mengniu-Yashili’s position to the top tier infant formula players. Yashili is also undergoing restructuring with changes in its marketing strategy (more active face-to-face events, nursing promotions, and loyalty membership scheme), upgrading of technology and infrastructure, and improvements in its distribution channel, including leveraging on Danone’s existing online resources. We expect Mengniu to inject its remaining infant formula operations into Yashili, turning Yashili into Mengniu’s platform for infant formula.
FY15 a year of transition. While we believe Yashili’s 1H15 performance should likely remain soft, as the company is still in an adjustment period amid a challenging market environment, its effort to expand its penetration in the baby store and online channels as well as new product launches could start to show some impact from 2H15 onwards. Management had earlier guided for positive top line growth in FY15. Trading at 19x FY16 PE (based on consensus), Yashili's valuation is at a premium to Biostime, a reflection of the company’s distortion in earnings from the restructuring, as well as potential strong synergies with Mengniu and Danone. With the backing of these two dairy giants, Yashili will be a strong contender in the domestic infant formula market in the long run. Key risks include rising domestic and foreign competition through e-commerce, as well as food safety issues.
At A Glance Issued Capital (m shrs) 4,746 Mkt. Cap (HK$m/US$m) 10,772 / 1,390
Major Shareholders China Mengniu (%) 51.0 Danone (%) 25.0
Free Float (%) 24.0 3m Avg. Daily Val. (US$m) 0.9
China Dairy Sector
Yashili International Holdings
Bloomberg: 1230 HK EQUITY | Reuters: 1230.HK Refer to important disclosures at the end of this report

China Dairy Sector
Yashili International Holdings
Page 55
Company background
One of the top domestic players in China. Yashili is engaged in the production and sales of paediatric milk formula products and nutrition food. It held a market share of 4.5% in China’s infant formula market in 2014. Headquartered in Guangdong province, Yashili operates plants in Guangdong, Shanxi and Heilongjiang, with a new plant in New Zealand expected to commence operations in 2015.
In Nov-13, Mengniu made a general offer to become Yashili’s controlling shareholder at HK$3.5/share. Danone subsequently joined as the second largest shareholder in Feb-15 through a new share placement at HK$3.7/share. Currently, Mengniu and Danone have 51% and 25% stakes respectively.
Yashili has an extensive range of infant formula brands, with its two core brands, Yashily and Scient, targeting mid- to high-end consumers. Yashily Super α-Golden series, the Ambery Golden series and the Arla Merla series (cooperation with Arla foods) target high-end consumers, while Yashily Newwitt series and Scient’s Ordinary Pack Series focus on mid-end consumers. Lastly, Yashily New Formula focuses on low- to mid-end consumers. The Group also sells nutrition food, such as adult milk powder and nutritious paediatric rice cereal.
FY14 sales breakdown
Yashily Formula
65%
Scient Formula
16%
Yashily Nutritions
19%
Source: Company data, DBS Vickers
Growth drivers
Recovery in topline growth. Since Mengniu became Yashili’s controlling shareholder, the Group has invested in information platforms to improve its communication access with consumers. As at FY14, the Group had 27,000 membership stores with 1.1m members. Yashili will place more effort on communicating and understanding consumers’ needs through face-to-face marketing events, increasing promotional events, upgrading technology and infrastructure, as well as leveraging on shareholders’ strength in sales and distribution.
Leveraging on key shareholders’ expertise. Based on the MOU which has been entered between Mengniu, Yashili and Danone t o inject Danone’s Dumex China operations into Yashili, Danone intends to sell all its interest in Dumex China to Yashili, of which the proceeds will be used to subscribe for Mengniu’s shares through COFCO Dairy Investment (CDI). Combining Danone’s market share of 2.8% based on Euromonitor, Mengniu-Yashili’s infant formula market share will propel to second position with 7%, after Nestle. While no financial details are released at this stage, this clearly strengthens Yashili’s position in the infant formula market. Synergies include leveraging on Danone’s sales and distribution network as well as product technology to further improve on its existing product offerings.
E-commerce presence to grow. E-commerce is the fastest-growing sales channel for infant formula, in which international brands have dominant presence due to their stronger brand reputation. This trend should likely continue. Despite this, Yashili should still be able to benefit, given opportunities to leverage on Danone’s existing online platform, as well as potential for its imported brands such as Arla Merla. Yashili will also have dedicated products (Le Pei Jian” [樂培健]) to target its maternity channel.

China Dairy Sector
Yashili International Holdings
Page 56
Yashili’s sales in infant formula (FY14)
10% 7%
37% 44%
53% 50%
0%
10%
20%
30%
40%
50%
60%
70%
80%
90%
100%
Yashily Scient
1st tier 2nd tier 3rd and lower
Source: Company data, DBS Vickers
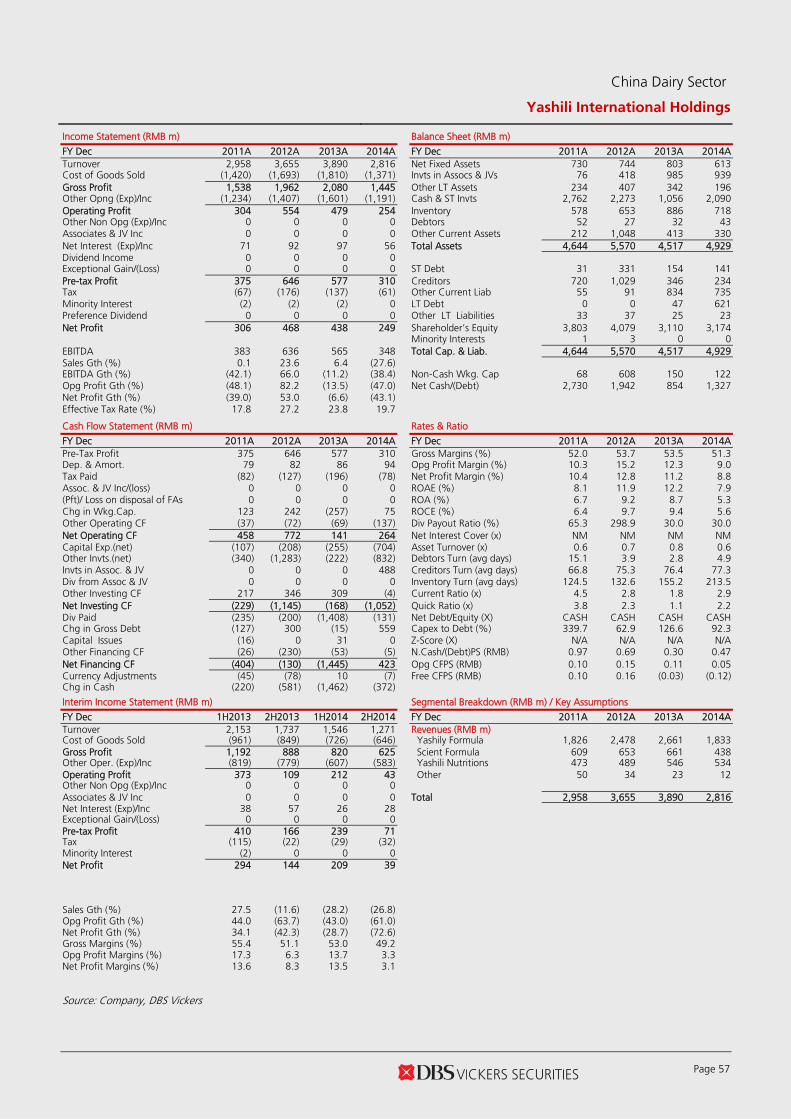
China Dairy Sector
Yashili International Holdings
Page 57
Income Statement (RMB m) Balance Sheet (RMB m)
FY Dec 2011A 2012A 2013A 2014A FY Dec 2011A 2012A 2013A 2014A Turnover 2,958 3,655 3,890 2,816 Net Fixed Assets 730 744 803 613 Cost of Goods Sold (1,420) (1,693) (1,810) (1,371) Invts in Assocs & JVs 76 418 985 939 Gross Profit 1,538 1,962 2,080 1,445 Other LT Assets 234 407 342 196 Other Opng (Exp)/Inc (1,234) (1,407) (1,601) (1,191) Cash & ST Invts 2,762 2,273 1,056 2,090 Operating Profit 304 554 479 254 Inventory 578 653 886 718 Other Non Opg (Exp)/Inc 0 0 0 0 Debtors 52 27 32 43 Associates & JV Inc 0 0 0 0 Other Current Assets 212 1,048 413 330 Net Interest (Exp)/Inc 71 92 97 56 Total Assets 4,644 5,570 4,517 4,929 Dividend Income 0 0 0 0 Exceptional Gain/(Loss) 0 0 0 0 ST Debt 31 331 154 141 Pre-tax Profit 375 646 577 310 Creditors 720 1,029 346 234 Tax (67) (176) (137) (61) Other Current Liab 55 91 834 735 Minority Interest (2) (2) (2) 0 LT Debt 0 0 47 621 Preference Dividend 0 0 0 0 Other LT Liabilities 33 37 25 23 Net Profit 306 468 438 249 Shareholder’s Equity 3,803 4,079 3,110 3,174 Minority Interests 1 3 0 0 EBITDA 383 636 565 348 Total Cap. & Liab. 4,644 5,570 4,517 4,929 Sales Gth (%) 0.1 23.6 6.4 (27.6) EBITDA Gth (%) (42.1) 66.0 (11.2) (38.4) Non-Cash Wkg. Cap 68 608 150 122 Opg Profit Gth (%) (48.1) 82.2 (13.5) (47.0) Net Cash/(Debt) 2,730 1,942 854 1,327 Net Profit Gth (%) (39.0) 53.0 (6.6) (43.1) Effective Tax Rate (%) 17.8 27.2 23.8 19.7 Cash Flow Statement (RMB m) Rates & Ratio
FY Dec 2011A 2012A 2013A 2014A FY Dec 2011A 2012A 2013A 2014A Pre-Tax Profit 375 646 577 310 Gross Margins (%) 52.0 53.7 53.5 51.3 Dep. & Amort. 79 82 86 94 Opg Profit Margin (%) 10.3 15.2 12.3 9.0 Tax Paid (82) (127) (196) (78) Net Profit Margin (%) 10.4 12.8 11.2 8.8 Assoc. & JV Inc/(loss) 0 0 0 0 ROAE (%) 8.1 11.9 12.2 7.9 (Pft)/ Loss on disposal of FAs 0 0 0 0 ROA (%) 6.7 9.2 8.7 5.3 Chg in Wkg.Cap. 123 242 (257) 75 ROCE (%) 6.4 9.7 9.4 5.6 Other Operating CF (37) (72) (69) (137) Div Payout Ratio (%) 65.3 298.9 30.0 30.0 Net Operating CF 458 772 141 264 Net Interest Cover (x) NM NM NM NM Capital Exp.(net) (107) (208) (255) (704) Asset Turnover (x) 0.6 0.7 0.8 0.6 Other Invts.(net) (340) (1,283) (222) (832) Debtors Turn (avg days) 15.1 3.9 2.8 4.9 Invts in Assoc. & JV 0 0 0 488 Creditors Turn (avg days) 66.8 75.3 76.4 77.3 Div from Assoc & JV 0 0 0 0 Inventory Turn (avg days) 124.5 132.6 155.2 213.5 Other Investing CF 217 346 309 (4) Current Ratio (x) 4.5 2.8 1.8 2.9 Net Investing CF (229) (1,145) (168) (1,052) Quick Ratio (x) 3.8 2.3 1.1 2.2 Div Paid (235) (200) (1,408) (131) Net Debt/Equity (X) CASH CASH CASH CASH Chg in Gross Debt (127) 300 (15) 559 Capex to Debt (%) 339.7 62.9 126.6 92.3 Capital Issues (16) 0 31 0 Z-Score (X) N/A N/A N/A N/A Other Financing CF (26) (230) (53) (5) N.Cash/(Debt)PS (RMB) 0.97 0.69 0.30 0.47 Net Financing CF (404) (130) (1,445) 423 Opg CFPS (RMB) 0.10 0.15 0.11 0.05 Currency Adjustments (45) (78) 10 (7) Free CFPS (RMB) 0.10 0.16 (0.03) (0.12) Chg in Cash (220) (581) (1,462) (372)
Interim Income Statement (RMB m) Segmental Breakdown (RMB m) / Key Assumptions
FY Dec 1H2013 2H2013 1H2014 2H2014 FY Dec 2011A 2012A 2013A 2014A Turnover 2,153 1,737 1,546 1,271 Revenues (RMB m) Cost of Goods Sold (961) (849) (726) (646) Yashily Formula 1,826 2,478 2,661 1,833 Gross Profit 1,192 888 820 625 Scient Formula 609 653 661 438 Other Oper. (Exp)/Inc (819) (779) (607) (583) Yashili Nutritions 473 489 546 534 Operating Profit 373 109 212 43 Other 50 34 23 12 Other Non Opg (Exp)/Inc 0 0 0 0 Associates & JV Inc 0 0 0 0 Total 2,958 3,655 3,890 2,816 Net Interest (Exp)/Inc 38 57 26 28 Exceptional Gain/(Loss) 0 0 0 0 Pre-tax Profit 410 166 239 71 Tax (115) (22) (29) (32) Minority Interest (2) 0 0 0 Net Profit 294 144 209 39 Sales Gth (%) 27.5 (11.6) (28.2) (26.8) Opg Profit Gth (%) 44.0 (63.7) (43.0) (61.0) Net Profit Gth (%) 34.1 (42.3) (28.7) (72.6) Gross Margins (%) 55.4 51.1 53.0 49.2 Opg Profit Margins (%) 17.3 6.3 13.7 3.3 Net Profit Margins (%) 13.6 8.3 13.5 3.1 Source: Company, DBS Vickers

Page 58 www.dbsvickers.com ed- JS / sa- AL DBSV's discussion of the issuer in this report will not be continuously followed. Accordingly, this report is being provided as a stand-alone analysis and recipients of this report should not expect additional reports relating to this issuer, unless so decided by DBSV
NOT RATED Last Traded Price: RMB18.63 (CSI300 Index : 4,251) Potential Catalyst: Stronger contribution from high margin products Analyst Alice HUI CFA, +852 2971 1960 [email protected] Alison Fok +852 2971 1938 [email protected] Price Relative
88
138
188
238
288
338
388
5.4
10.4
15.4
20.4
25.4
30.4
35.4
40.4
45.4
Jul-11 Jul-12 Jul-13 Jul-14 Jul-15
Relative IndexRMB
Inner Mongolia Yili Industrial-A (LHS)Relative SHSZ300 Index (RHS)
Forecasts and Valuation FY Dec (RMB m) 2011A 2012A 2013A 2014ATurnover 37,451 41,991 47,779 54,436 EBITDA 2,160 2,274 3,324 5,265 Pre-tax Profit 2,136 2,087 3,060 4,786 Net Profit 1,809 1,717 3,187 4,144 EPS (RMB) 1.13 1.07 1.56 1.35 EPS Gth (%) 16.4 (5.1) 45.2 (13.3) Diluted EPS (RMB) 1.13 1.07 1.56 1.35 DPS (RMB) 0.25 0.33 0.80 0.80 BV Per Share (RMB) 3.77 4.59 7.89 6.08 PE (X) 16.5 17.3 11.9 13.8 P/Cash Flow (X) 8.1 12.4 7.0 23.4 P/Free CF (X) nm nm 17.0 nm EV/EBITDA (X) 13.5 13.4 10.3 9.8 Net Div Yield (%) 1.3 1.8 4.3 4.3 P/Book Value (X) 4.9 4.1 2.4 3.1 Net Debt/Equity (X) CASH 0.1 CASH CASH ROAE (%) 35.3 25.7 27.2 23.8
ICB Industry: Consumer Goods ICB Sector: Food Producers Principal Business: Leading dairy player in China
Source of all data: Company, DBSV, Thomson Reuters, HKEX
Rising dominance Expect continual market share gains to further boost Yili’s
leading position
Strong portfolio of higher-margin brands to take advantage of growing health awareness among consumers
Valuation undemanding against peers Leader of the herd. Established in 1993 and listed on SSE in 1996, Inner-Mongolia Yili is the leading dairy player in China, who enjoys highest profit and margins among its peers. Yili has an extensive product offering including mainly liquid dairy products (UHT dairy products, yogurt, dairy-related and plant-based beverages), milk powder, and low-temperature dairy products. Its strong product capability and effective marketing campaign should enable the company to gain further market share despite its substantial size.
Improving product mix, effective marketing and deepening penetration to drive growth. In FY15, higher margin products such as Satine (UHT drink), QQ Star (kid’s beverage), Ambrosial (UHT yogurt) and Chang Qing (probiotic drinks) will be key profitability drivers. Impact from lower raw material costs remain favourable, as seen in 1Q15’s net margin expansion of 0.7ppt, but this would be partly offset by higher operating expenses on increasing marketing efforts. Yili is active in mass market advertising including sponsorships for popular TV shows such as “Running Man” (奔跑吧兄弟) and ”Where did my father go?” (爸爸去哪儿?) etc.
Undemanding valuation. Yili has formed strategic alliances with international players overseas including Sterilgarda Alimenti SpA (Italy’s largest dairy producer) and Dairy Farmers of America (DFA; US’ largest dairy farm coop) to secure its upstream sourcing capabilities. It has also set up plants in Kansas and in New Zealand to leverage on local upstream supply. Based on the company’s guidance of 12% and 15% growth on FY15 sales and profit respectively, a target likely to be exceeded. The counter is trading at 17.7x FY16F PE (based on consensus estimates), undemanding vs sector peers, considering its consistent topline and profitability outperformance, as well as superior ROE generation.
At A Glance Issued Capital (m shrs) 6,129 Mkt. Cap (RMBm/US$m) 114,178 / 18,383
Major Shareholders Hohhot Investment Co Ltd
(%) 9.3
China Asset Management 3.9 Gang Pan 3.9
Free Float (%) 82.9 3m Avg. Daily Val. (US$m) 530.9
China Dairy Sector
Inner Mongolia Yili Industrial-A
Bloomberg: 600887 CH Equity | Reuters: 600887.SS Refer to important disclosures at the end of this report
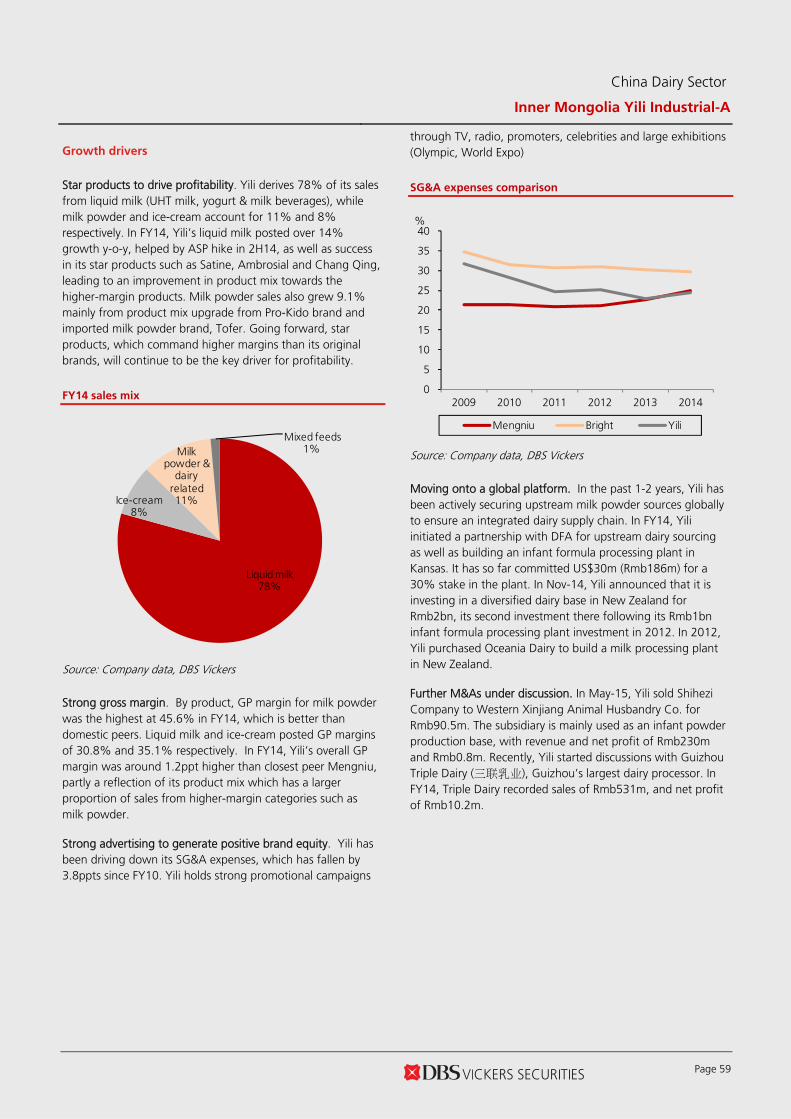
China Dairy Sector
Inner Mongolia Yili Industrial-A
Page 59
Growth drivers
Star products to drive profitability. Yili derives 78% of its sales from liquid milk (UHT milk, yogurt & milk beverages), while milk powder and ice-cream account for 11% and 8% respectively. In FY14, Yili’s liquid milk posted over 14% growth y-o-y, helped by ASP hike in 2H14, as well as success in its star products such as Satine, Ambrosial and Chang Qing, leading to an improvement in product mix towards the higher-margin products. Milk powder sales also grew 9.1% mainly from product mix upgrade from Pro-Kido brand and imported milk powder brand, Tofer. Going forward, star products, which command higher margins than its original brands, will continue to be the key driver for profitability.
FY14 sales mix
Liquid milk78%
Ice-cream8%
Milk powder &
dairy related 11%
Mixed feeds1%
Source: Company data, DBS Vickers
Strong gross margin. By product, GP margin for milk powder was the highest at 45.6% in FY14, which is better than domestic peers. Liquid milk and ice-cream posted GP margins of 30.8% and 35.1% respectively. In FY14, Yili’s overall GP margin was around 1.2ppt higher than closest peer Mengniu, partly a reflection of its product mix which has a larger proportion of sales from higher-margin categories such as milk powder.
Strong advertising to generate positive brand equity. Yili has been driving down its SG&A expenses, which has fallen by 3.8ppts since FY10. Yili holds strong promotional campaigns
through TV, radio, promoters, celebrities and large exhibitions (Olympic, World Expo)
SG&A expenses comparison
0
5
10
15
20
25
30
35
40
2009 2010 2011 2012 2013 2014
%
Mengniu Bright Yili
Source: Company data, DBS Vickers
Moving onto a global platform. In the past 1-2 years, Yili has been actively securing upstream milk powder sources globally to ensure an integrated dairy supply chain. In FY14, Yili initiated a partnership with DFA for upstream dairy sourcing as well as building an infant formula processing plant in Kansas. It has so far committed US$30m (Rmb186m) for a 30% stake in the plant. In Nov-14, Yili announced that it is investing in a diversified dairy base in New Zealand for Rmb2bn, its second investment there following its Rmb1bn infant formula processing plant investment in 2012. In 2012, Yili purchased Oceania Dairy to build a milk processing plant in New Zealand.
Further M&As under discussion. In May-15, Yili sold Shihezi Company to Western Xinjiang Animal Husbandry Co. for Rmb90.5m. The subsidiary is mainly used as an infant powder production base, with revenue and net profit of Rmb230m and Rmb0.8m. Recently, Yili started discussions with Guizhou Triple Dairy (三联乳业), Guizhou’s largest dairy processor. In FY14, Triple Dairy recorded sales of Rmb531m, and net profit of Rmb10.2m.

China Dairy Sector
Inner Mongolia Yili Industrial-A
Page 60
Income Statement (RMB m) Balance Sheet (RMB m)
FY Dec 2011A 2012A 2013A 2014A FY Dec 2011A 2012A 2013A 2014A Turnover 37,451 41,991 47,779 54,436 Net Fixed Assets 8,662 10,419 11,897 14,083 Cost of Goods Sold (26,719) (29,754) (34,317) (36,585) Invts in Assocs & JVs 0 0 0 0 Gross Profit 10,733 12,236 13,462 17,851 Other LT Assets 2,540 3,190 4,513 4,410 Other Opng (Exp)/Inc (9,036) (10,571) (10,836) (13,306) Cash & ST Invts 3,921 2,004 8,173 14,273 Operating Profit 1,697 1,665 2,626 4,545 Inventory 3,310 2,995 3,683 5,008 Other Non Opg (Exp)/Inc 390 471 401 396 Debtors 1,116 937 670 903 Associates & JV Inc 0 0 0 0 Other Current Assets 381 271 3,941 817 Net Interest (Exp)/Inc 49 (49) 33 (155) Total Assets 19,930 19,815 32,877 39,494 Dividend Income 0 0 0 0 Exceptional Gain/(Loss) 0 0 0 0 ST Debt 2,985 2,578 4,086 8,072 Pre-tax Profit 2,136 2,087 3,060 4,786 Creditors 7,431 6,960 8,539 7,444 Tax (304) (351) 141 (619) Other Current Liab 2,449 1,940 2,892 3,241 Minority Interest (23) (19) (14) (22) LT Debt 7 5 0 704 Preference Dividend 0 0 0 0 Other LT Liabilities 751 808 1,047 1,212 Net Profit 1,809 1,717 3,187 4,144 Shareholder’s Equity 6,024 7,335 16,125 18,634 Minority Interests 282 190 188 188 EBITDA 2,160 2,274 3,324 5,265 Total Cap. & Liab. 19,930 19,815 32,877 39,494 Sales Gth (%) 26.2 12.1 13.8 13.9 EBITDA Gth (%) 113.3 5.2 46.2 58.4 Non-Cash Wkg. Cap (5,074) (4,697) (3,137) (3,956) Opg Profit Gth (%) 190.1 (1.9) 57.7 73.1 Net Cash/(Debt) 929 (578) 4,087 5,497 Net Profit Gth (%) 132.8 (5.1) 85.6 30.0 Effective Tax Rate (%) 14.2 16.8 N/A 12.9 Cash Flow Statement (RMB m) Rates & Ratio
FY Dec 2011A 2012A 2013A 2014A FY Dec 2011A 2012A 2013A 2014A Pre-Tax Profit 2,136 2,087 3,060 4,786 Gross Margins (%) 28.7 29.1 28.2 32.8 Dep. & Amort. 731 915 1,143 1,479 Opg Profit Margin (%) 4.5 4.0 5.5 8.3 Tax Paid (100) 0 (458) 139 Net Profit Margin (%) 4.8 4.1 6.7 7.6 Assoc. & JV Inc/(loss) 0 0 0 0 ROAE (%) 35.3 25.7 27.2 23.8 (Pft)/ Loss on disposal of FAs 0 0 0 0 ROA (%) 10.3 8.6 12.1 11.5 Chg in Wkg.Cap. 1,321 (350) 1,539 (3,714) ROCE (%) 16.3 13.2 16.2 15.7 Other Operating CF (418) (243) 190 (253) Div Payout Ratio (%) 22.1 30.5 51.3 59.2 Net Operating CF 3,670 2,409 5,475 2,436 Net Interest Cover (x) NM 33.9 NM 29.3 Capital Exp.(net) (3,789) (3,102) (3,241) (3,946) Asset Turnover (x) 2.1 2.1 1.8 1.5 Other Invts.(net) 260 25 (178) 33 Debtors Turn (avg days) 12.7 8.9 6.1 5.3 Invts in Assoc. & JV 0 0 0 0 Creditors Turn (avg days) 90.8 90.1 84.1 81.3 Div from Assoc & JV 0 0 0 0 Inventory Turn (avg days) 41.0 39.5 36.2 44.2 Other Investing CF 52 20 (2,841) 2,915 Current Ratio (x) 0.7 0.5 1.1 1.1 Net Investing CF (3,476) (3,057) (6,260) (999) Quick Ratio (x) 0.4 0.3 0.6 0.8 Div Paid (88) (530) (606) (1,807) Net Debt/Equity (X) CASH 0.1 CASH CASH Chg in Gross Debt 194 (411) 1,496 4,690 Capex to Debt (%) 126.6 120.1 79.3 45.0 Capital Issues 1 0 6,118 0 Z-Score (X) N/A N/A N/A N/A Other Financing CF (238) 37 242 0 N.Cash/(Debt)PS (RMB) 0.58 (0.36) 2.00 1.79 Net Financing CF (131) (905) 7,251 2,883 Opg CFPS (RMB) 1.47 1.73 1.93 2.01 Currency Adjustments (1) 0 (5) 0 Free CFPS (RMB) (0.07) (0.43) 1.09 (0.49) Chg in Cash 63 (1,553) 6,460 4,320
Interim Income Statement (RMB m) Segmental Breakdown (RMB m)
FY Dec 1H2013 2H2013 1H2014 2H2014 FY Dec 2011A 2012A 2013A 2014A Turnover 24,021 23,758 27,471 26,966 Revenues (RMB m) Cost of Goods Sold (16,761) (17,556) (18,379) (18,206) Liquid milk 26,933 32,271 37,116 42,406 Gross Profit 7,260 6,202 9,092 8,759 Ice-cream 4,222 4,294 4,243 4,284 Other Oper. (Exp)/Inc (5,955) (4,882) (6,640) (6,666) Milk powder & dairy related 5,642 4,484 5,512 6,013 Operating Profit 1,306 1,320 2,451 2,093 Others 469 687 583 1,733 Other Non Opg (Exp)/Inc 182 219 181 215 Associates & JV Inc 0 0 0 0 Total 37,266 41,736 47,454 54,436 Net Interest (Exp)/Inc 7 26 52 (207) Exceptional Gain/(Loss) 0 0 0 0 Pre-tax Profit 1,495 1,565 2,684 2,101 Tax 251 (110) (378) (241) Minority Interest (8) (6) (13) (9) Net Profit 1,738 1,449 2,293 1,851 Sales Gth (%) 13.4 14.2 14.4 13.5 Opg Profit Gth (%) 86.0 37.1 87.8 58.5 Net Profit Gth (%) 128.2 51.6 31.9 27.7 Gross Margins (%) 30.2 26.1 33.1 32.5 Opg Profit Margins (%) 5.4 5.6 8.9 7.8 Net Profit Margins (%) 7.2 6.1 8.3 6.9 Source: Company, DBS Vickers

China Dairy Sector
Inner Mongolia Yili Industrial-A
Page 61
This page has been left blank intentionally
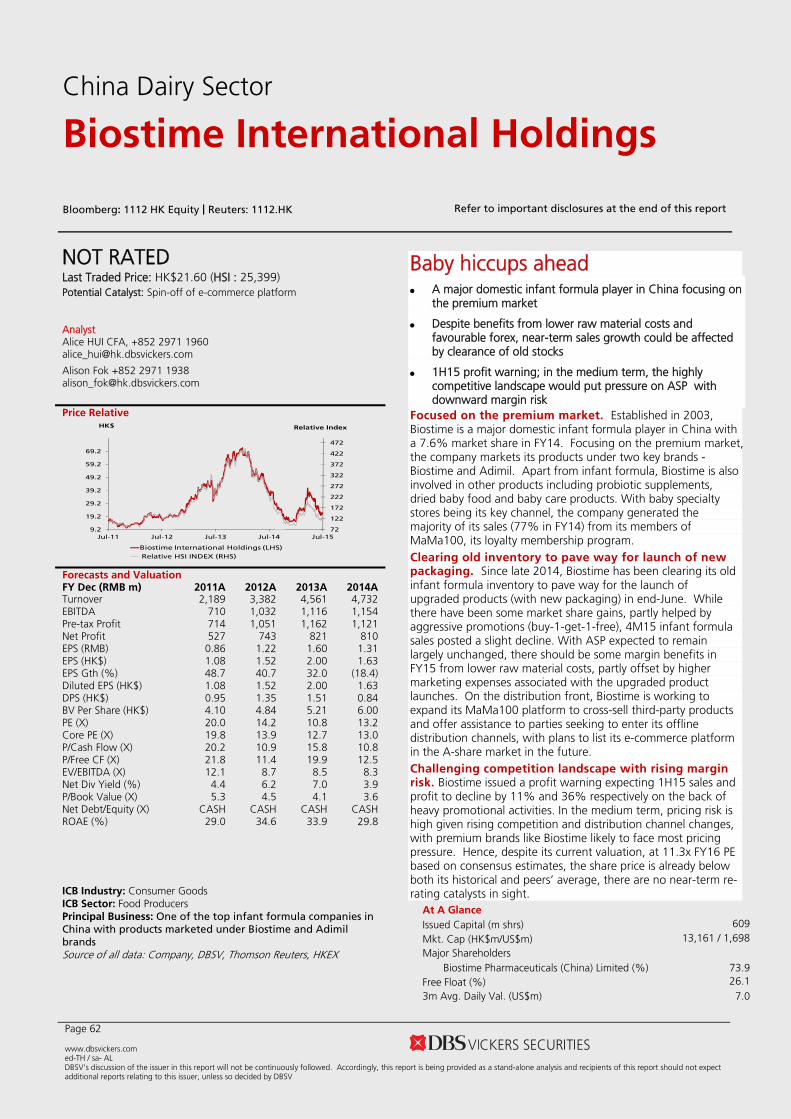
Page 62 www.dbsvickers.com ed-TH / sa- AL DBSV's discussion of the issuer in this report will not be continuously followed. Accordingly, this report is being provided as a stand-alone analysis and recipients of this report should not expect additional reports relating to this issuer, unless so decided by DBSV
NOT RATED Last Traded Price: HK$21.60 (HSI : 25,399) Potential Catalyst: Spin-off of e-commerce platform Analyst Alice HUI CFA, +852 2971 1960 [email protected] Alison Fok +852 2971 1938 [email protected] Price Relative
72
122
172
222
272
322
372
422
472
9.2
19.2
29.2
39.2
49.2
59.2
69.2
Jul-11 Jul-12 Jul-13 Jul-14 Jul-15
Relative IndexHK$
Biostime International Holdings (LHS)Relative HSI INDEX (RHS)
Forecasts and Valuation FY Dec (RMB m) 2011A 2012A 2013A 2014ATurnover 2,189 3,382 4,561 4,732 EBITDA 710 1,032 1,116 1,154 Pre-tax Profit 714 1,051 1,162 1,121 Net Profit 527 743 821 810 EPS (RMB) 0.86 1.22 1.60 1.31 EPS (HK$) 1.08 1.52 2.00 1.63 EPS Gth (%) 48.7 40.7 32.0 (18.4) Diluted EPS (HK$) 1.08 1.52 2.00 1.63 DPS (HK$) 0.95 1.35 1.51 0.84 BV Per Share (HK$) 4.10 4.84 5.21 6.00 PE (X) 20.0 14.2 10.8 13.2 Core PE (X) 19.8 13.9 12.7 13.0 P/Cash Flow (X) 20.2 10.9 15.8 10.8 P/Free CF (X) 21.8 11.4 19.9 12.5 EV/EBITDA (X) 12.1 8.7 8.5 8.3 Net Div Yield (%) 4.4 6.2 7.0 3.9 P/Book Value (X) 5.3 4.5 4.1 3.6 Net Debt/Equity (X) CASH CASH CASH CASH ROAE (%) 29.0 34.6 33.9 29.8
ICB Industry: Consumer Goods ICB Sector: Food Producers Principal Business: One of the top infant formula companies in China with products marketed under Biostime and Adimil brands Source of all data: Company, DBSV, Thomson Reuters, HKEX
Baby hiccups ahead A major domestic infant formula player in China focusing on
the premium market
Despite benefits from lower raw material costs and favourable forex, near-term sales growth could be affected by clearance of old stocks
1H15 profit warning; in the medium term, the highly competitive landscape would put pressure on ASP with downward margin risk
Focused on the premium market. Established in 2003, Biostime is a major domestic infant formula player in China with a 7.6% market share in FY14. Focusing on the premium market, the company markets its products under two key brands - Biostime and Adimil. Apart from infant formula, Biostime is also involved in other products including probiotic supplements, dried baby food and baby care products. With baby specialty stores being its key channel, the company generated the majority of its sales (77% in FY14) from its members of MaMa100, its loyalty membership program. Clearing old inventory to pave way for launch of new packaging. Since late 2014, Biostime has been clearing its old infant formula inventory to pave way for the launch of upgraded products (with new packaging) in end-June. While there have been some market share gains, partly helped by aggressive promotions (buy-1-get-1-free), 4M15 infant formula sales posted a slight decline. With ASP expected to remain largely unchanged, there should be some margin benefits in FY15 from lower raw material costs, partly offset by higher marketing expenses associated with the upgraded product launches. On the distribution front, Biostime is working to expand its MaMa100 platform to cross-sell third-party products and offer assistance to parties seeking to enter its offline distribution channels, with plans to list its e-commerce platform in the A-share market in the future. Challenging competition landscape with rising margin risk. Biostime issued a profit warning expecting 1H15 sales and profit to decline by 11% and 36% respectively on the back of heavy promotional activities. In the medium term, pricing risk is high given rising competition and distribution channel changes, with premium brands like Biostime likely to face most pricing pressure. Hence, despite its current valuation, at 11.3x FY16 PE based on consensus estimates, the share price is already below both its historical and peers’ average, there are no near-term re-rating catalysts in sight.
At A Glance Issued Capital (m shrs) 609 Mkt. Cap (HK$m/US$m) 13,161 / 1,698
Major Shareholders Biostime Pharmaceuticals (China) Limited (%) 73.9
Free Float (%) 26.1 3m Avg. Daily Val. (US$m) 7.0
China Dairy Sector
Biostime International Holdings
Bloomberg: 1112 HK Equity | Reuters: 1112.HK Refer to important disclosures at the end of this report
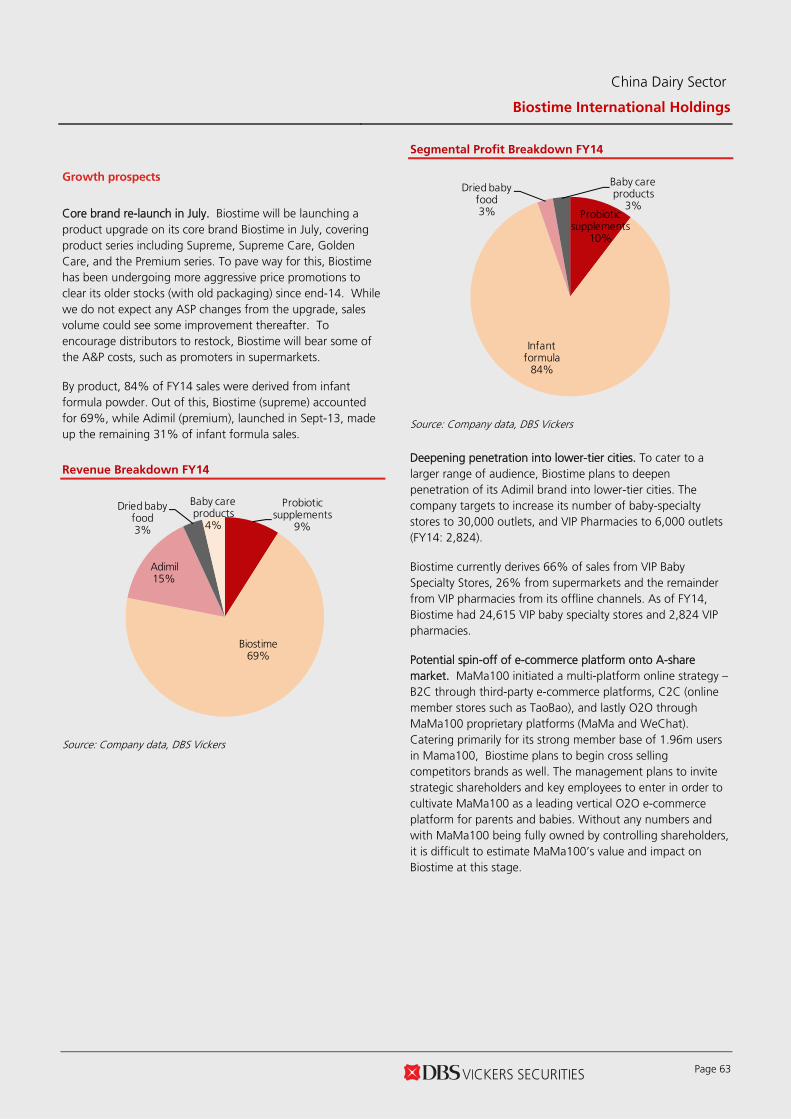
China Dairy Sector
Biostime International Holdings
Page 63
Growth prospects
Core brand re-launch in July. Biostime will be launching a product upgrade on its core brand Biostime in July, covering product series including Supreme, Supreme Care, Golden Care, and the Premium series. To pave way for this, Biostime has been undergoing more aggressive price promotions to clear its older stocks (with old packaging) since end-14. While we do not expect any ASP changes from the upgrade, sales volume could see some improvement thereafter. To encourage distributors to restock, Biostime will bear some of the A&P costs, such as promoters in supermarkets.
By product, 84% of FY14 sales were derived from infant formula powder. Out of this, Biostime (supreme) accounted for 69%, while Adimil (premium), launched in Sept-13, made up the remaining 31% of infant formula sales.
Revenue Breakdown FY14
Probiotic supplements
9%
Biostime 69%
Adimil15%
Dried baby food3%
Baby care products
4%
Source: Company data, DBS Vickers
Segmental Profit Breakdown FY14
Probiotic supplements
10%
Infant formula
84%
Dried baby food3%
Baby care products
3%
Source: Company data, DBS Vickers
Deepening penetration into lower-tier cities. To cater to a larger range of audience, Biostime plans to deepen penetration of its Adimil brand into lower-tier cities. The company targets to increase its number of baby-specialty stores to 30,000 outlets, and VIP Pharmacies to 6,000 outlets (FY14: 2,824).
Biostime currently derives 66% of sales from VIP Baby Specialty Stores, 26% from supermarkets and the remainder from VIP pharmacies from its offline channels. As of FY14, Biostime had 24,615 VIP baby specialty stores and 2,824 VIP pharmacies.
Potential spin-off of e-commerce platform onto A-share market. MaMa100 initiated a multi-platform online strategy – B2C through third-party e-commerce platforms, C2C (online member stores such as TaoBao), and lastly O2O through MaMa100 proprietary platforms (MaMa and WeChat). Catering primarily for its strong member base of 1.96m users in Mama100, Biostime plans to begin cross selling competitors brands as well. The management plans to invite strategic shareholders and key employees to enter in order to cultivate MaMa100 as a leading vertical O2O e-commerce platform for parents and babies. Without any numbers and with MaMa100 being fully owned by controlling shareholders, it is difficult to estimate MaMa100’s value and impact on Biostime at this stage.
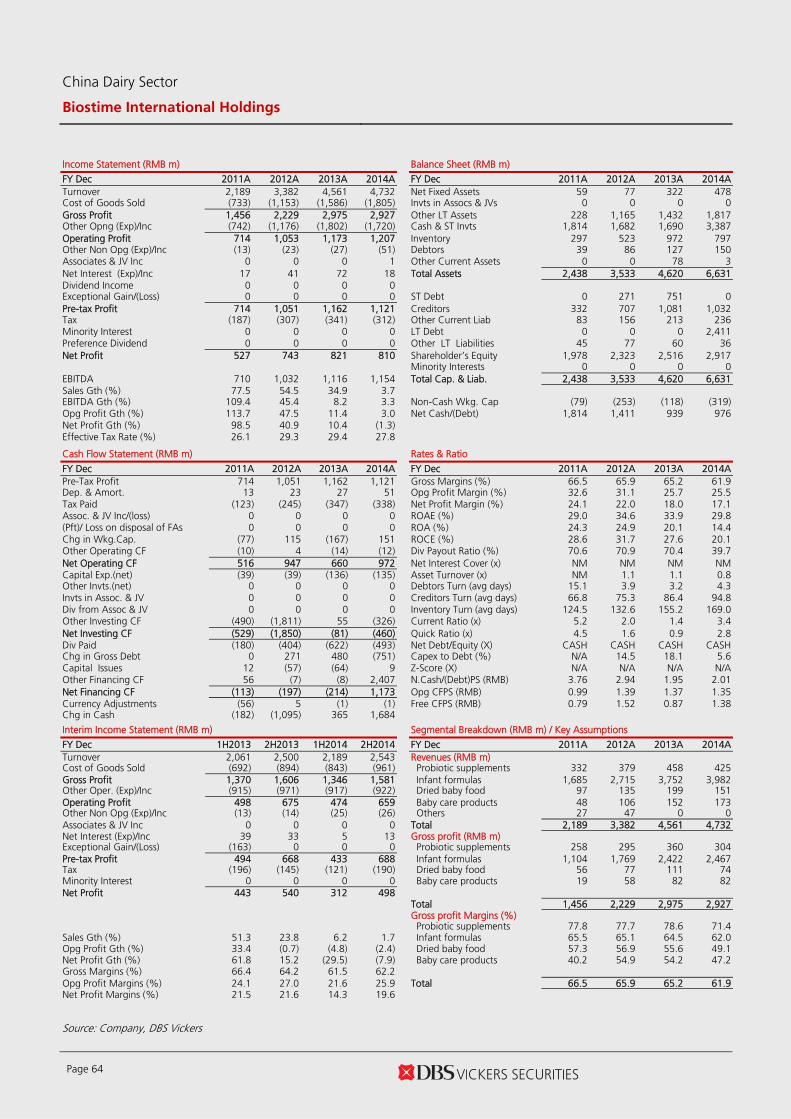
China Dairy Sector
Biostime International Holdings
Page 64
Income Statement (RMB m) Balance Sheet (RMB m)
FY Dec 2011A 2012A 2013A 2014A FY Dec 2011A 2012A 2013A 2014A Turnover 2,189 3,382 4,561 4,732 Net Fixed Assets 59 77 322 478 Cost of Goods Sold (733) (1,153) (1,586) (1,805) Invts in Assocs & JVs 0 0 0 0 Gross Profit 1,456 2,229 2,975 2,927 Other LT Assets 228 1,165 1,432 1,817 Other Opng (Exp)/Inc (742) (1,176) (1,802) (1,720) Cash & ST Invts 1,814 1,682 1,690 3,387 Operating Profit 714 1,053 1,173 1,207 Inventory 297 523 972 797 Other Non Opg (Exp)/Inc (13) (23) (27) (51) Debtors 39 86 127 150 Associates & JV Inc 0 0 0 1 Other Current Assets 0 0 78 3 Net Interest (Exp)/Inc 17 41 72 18 Total Assets 2,438 3,533 4,620 6,631 Dividend Income 0 0 0 0 Exceptional Gain/(Loss) 0 0 0 0 ST Debt 0 271 751 0 Pre-tax Profit 714 1,051 1,162 1,121 Creditors 332 707 1,081 1,032 Tax (187) (307) (341) (312) Other Current Liab 83 156 213 236 Minority Interest 0 0 0 0 LT Debt 0 0 0 2,411 Preference Dividend 0 0 0 0 Other LT Liabilities 45 77 60 36 Net Profit 527 743 821 810 Shareholder’s Equity 1,978 2,323 2,516 2,917 Minority Interests 0 0 0 0 EBITDA 710 1,032 1,116 1,154 Total Cap. & Liab. 2,438 3,533 4,620 6,631 Sales Gth (%) 77.5 54.5 34.9 3.7 EBITDA Gth (%) 109.4 45.4 8.2 3.3 Non-Cash Wkg. Cap (79) (253) (118) (319) Opg Profit Gth (%) 113.7 47.5 11.4 3.0 Net Cash/(Debt) 1,814 1,411 939 976 Net Profit Gth (%) 98.5 40.9 10.4 (1.3) Effective Tax Rate (%) 26.1 29.3 29.4 27.8 Cash Flow Statement (RMB m) Rates & Ratio
FY Dec 2011A 2012A 2013A 2014A FY Dec 2011A 2012A 2013A 2014A Pre-Tax Profit 714 1,051 1,162 1,121 Gross Margins (%) 66.5 65.9 65.2 61.9 Dep. & Amort. 13 23 27 51 Opg Profit Margin (%) 32.6 31.1 25.7 25.5 Tax Paid (123) (245) (347) (338) Net Profit Margin (%) 24.1 22.0 18.0 17.1 Assoc. & JV Inc/(loss) 0 0 0 0 ROAE (%) 29.0 34.6 33.9 29.8 (Pft)/ Loss on disposal of FAs 0 0 0 0 ROA (%) 24.3 24.9 20.1 14.4 Chg in Wkg.Cap. (77) 115 (167) 151 ROCE (%) 28.6 31.7 27.6 20.1 Other Operating CF (10) 4 (14) (12) Div Payout Ratio (%) 70.6 70.9 70.4 39.7 Net Operating CF 516 947 660 972 Net Interest Cover (x) NM NM NM NM Capital Exp.(net) (39) (39) (136) (135) Asset Turnover (x) NM 1.1 1.1 0.8 Other Invts.(net) 0 0 0 0 Debtors Turn (avg days) 15.1 3.9 3.2 4.3 Invts in Assoc. & JV 0 0 0 0 Creditors Turn (avg days) 66.8 75.3 86.4 94.8 Div from Assoc & JV 0 0 0 0 Inventory Turn (avg days) 124.5 132.6 155.2 169.0 Other Investing CF (490) (1,811) 55 (326) Current Ratio (x) 5.2 2.0 1.4 3.4 Net Investing CF (529) (1,850) (81) (460) Quick Ratio (x) 4.5 1.6 0.9 2.8 Div Paid (180) (404) (622) (493) Net Debt/Equity (X) CASH CASH CASH CASH Chg in Gross Debt 0 271 480 (751) Capex to Debt (%) N/A 14.5 18.1 5.6 Capital Issues 12 (57) (64) 9 Z-Score (X) N/A N/A N/A N/A Other Financing CF 56 (7) (8) 2,407 N.Cash/(Debt)PS (RMB) 3.76 2.94 1.95 2.01 Net Financing CF (113) (197) (214) 1,173 Opg CFPS (RMB) 0.99 1.39 1.37 1.35 Currency Adjustments (56) 5 (1) (1) Free CFPS (RMB) 0.79 1.52 0.87 1.38 Chg in Cash (182) (1,095) 365 1,684
Interim Income Statement (RMB m) Segmental Breakdown (RMB m) / Key Assumptions
FY Dec 1H2013 2H2013 1H2014 2H2014 FY Dec 2011A 2012A 2013A 2014A Turnover 2,061 2,500 2,189 2,543 Revenues (RMB m) Cost of Goods Sold (692) (894) (843) (961) Probiotic supplements 332 379 458 425 Gross Profit 1,370 1,606 1,346 1,581 Infant formulas 1,685 2,715 3,752 3,982 Other Oper. (Exp)/Inc (915) (971) (917) (922) Dried baby food 97 135 199 151 Operating Profit 498 675 474 659 Baby care products 48 106 152 173 Other Non Opg (Exp)/Inc (13) (14) (25) (26) Others 27 47 0 0 Associates & JV Inc 0 0 0 0 Total 2,189 3,382 4,561 4,732 Net Interest (Exp)/Inc 39 33 5 13 Gross profit (RMB m) Exceptional Gain/(Loss) (163) 0 0 0 Probiotic supplements 258 295 360 304 Pre-tax Profit 494 668 433 688 Infant formulas 1,104 1,769 2,422 2,467 Tax (196) (145) (121) (190) Dried baby food 56 77 111 74 Minority Interest 0 0 0 0 Baby care products 19 58 82 82 Net Profit 443 540 312 498 Total 1,456 2,229 2,975 2,927 Gross profit Margins (%) Probiotic supplements 77.8 77.7 78.6 71.4 Sales Gth (%) 51.3 23.8 6.2 1.7 Infant formulas 65.5 65.1 64.5 62.0 Opg Profit Gth (%) 33.4 (0.7) (4.8) (2.4) Dried baby food 57.3 56.9 55.6 49.1 Net Profit Gth (%) 61.8 15.2 (29.5) (7.9) Baby care products 40.2 54.9 54.2 47.2 Gross Margins (%) 66.4 64.2 61.5 62.2 Opg Profit Margins (%) 24.1 27.0 21.6 25.9 Total 66.5 65.9 65.2 61.9 Net Profit Margins (%) 21.5 21.6 14.3 19.6 Source: Company, DBS Vickers

China Dairy Sector
Biostime International Holdings
Page 65
This page has been left blank intentionally
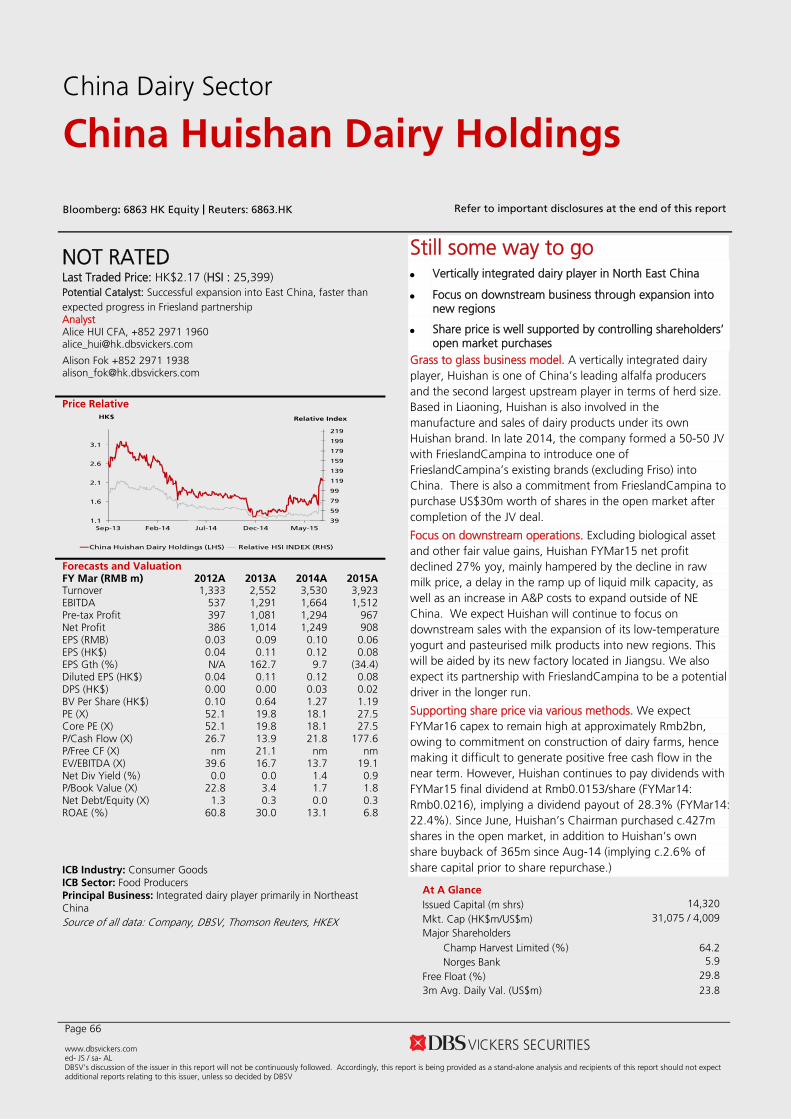
Page 66 www.dbsvickers.com ed- JS / sa- AL DBSV's discussion of the issuer in this report will not be continuously followed. Accordingly, this report is being provided as a stand-alone analysis and recipients of this report should not expect additional reports relating to this issuer, unless so decided by DBSV
NOT RATED Last Traded Price: HK$2.17 (HSI : 25,399) Potential Catalyst: Successful expansion into East China, faster than expected progress in Friesland partnership Analyst Alice HUI CFA, +852 2971 1960 [email protected] Alison Fok +852 2971 1938 [email protected] Price Relative
39
59
79
99
119
139
159
179
199
219
1.1
1.6
2.1
2.6
3.1
Sep-13 Feb-14 Jul-14 Dec-14 May-15
Relative IndexHK$
China Huishan Dairy Holdings (LHS) Relative HSI INDEX (RHS)
Forecasts and Valuation FY Mar (RMB m) 2012A 2013A 2014A 2015ATurnover 1,333 2,552 3,530 3,923 EBITDA 537 1,291 1,664 1,512 Pre-tax Profit 397 1,081 1,294 967 Net Profit 386 1,014 1,249 908 EPS (RMB) 0.03 0.09 0.10 0.06 EPS (HK$) 0.04 0.11 0.12 0.08 EPS Gth (%) N/A 162.7 9.7 (34.4) Diluted EPS (HK$) 0.04 0.11 0.12 0.08 DPS (HK$) 0.00 0.00 0.03 0.02 BV Per Share (HK$) 0.10 0.64 1.27 1.19 PE (X) 52.1 19.8 18.1 27.5 Core PE (X) 52.1 19.8 18.1 27.5 P/Cash Flow (X) 26.7 13.9 21.8 177.6 P/Free CF (X) nm 21.1 nm nm EV/EBITDA (X) 39.6 16.7 13.7 19.1 Net Div Yield (%) 0.0 0.0 1.4 0.9 P/Book Value (X) 22.8 3.4 1.7 1.8 Net Debt/Equity (X) 1.3 0.3 0.0 0.3 ROAE (%) 60.8 30.0 13.1 6.8
ICB Industry: Consumer Goods ICB Sector: Food Producers Principal Business: Integrated dairy player primarily in Northeast China Source of all data: Company, DBSV, Thomson Reuters, HKEX
Still some way to go Vertically integrated dairy player in North East China
Focus on downstream business through expansion into new regions
Share price is well supported by controlling shareholders’ open market purchases
Grass to glass business model. A vertically integrated dairy player, Huishan is one of China’s leading alfalfa producers and the second largest upstream player in terms of herd size. Based in Liaoning, Huishan is also involved in the manufacture and sales of dairy products under its own Huishan brand. In late 2014, the company formed a 50-50 JV with FrieslandCampina to introduce one of FrieslandCampina’s existing brands (excluding Friso) into China. There is also a commitment from FrieslandCampina to purchase US$30m worth of shares in the open market after completion of the JV deal.
Focus on downstream operations. Excluding biological asset and other fair value gains, Huishan FYMar15 net profit declined 27% yoy, mainly hampered by the decline in raw milk price, a delay in the ramp up of liquid milk capacity, as well as an increase in A&P costs to expand outside of NE China. We expect Huishan will continue to focus on downstream sales with the expansion of its low-temperature yogurt and pasteurised milk products into new regions. This will be aided by its new factory located in Jiangsu. We also expect its partnership with FrieslandCampina to be a potential driver in the longer run.
Supporting share price via various methods. We expect FYMar16 capex to remain high at approximately Rmb2bn, owing to commitment on construction of dairy farms, hence making it difficult to generate positive free cash flow in the near term. However, Huishan continues to pay dividends with FYMar15 final dividend at Rmb0.0153/share (FYMar14: Rmb0.0216), implying a dividend payout of 28.3% (FYMar14: 22.4%). Since June, Huishan’s Chairman purchased c.427m shares in the open market, in addition to Huishan’s own share buyback of 365m since Aug-14 (implying c.2.6% of share capital prior to share repurchase.)
At A Glance Issued Capital (m shrs) 14,320 Mkt. Cap (HK$m/US$m) 31,075 / 4,009
Major Shareholders Champ Harvest Limited (%) 64.2
Norges Bank 5.9 Free Float (%) 29.8 3m Avg. Daily Val. (US$m) 23.8
China Dairy Sector
China Huishan Dairy Holdings
Bloomberg: 6863 HK Equity | Reuters: 6863.HK Refer to important disclosures at the end of this report

China Dairy Sector
China Huishan Dairy Holdings
Page 67
Growth drivers
Growing its own feed. One of the key attractions of Huishan Dairy is its feedstock plantation. Huishan currently leases 480,000mu of land, of which 140,000mu is for alfalfa plantation. The remainder leased land will be used to develop oat and corn silage. This will continue to keep its cost of breeding cows lower than the sector average. For example, Huishan’s feed cost per tonne is c.30% below market leader CMD.
Improvement in sales volume and milk yields partly offset by raw milk price decline. As of end Mar-15, Huishan Dairy has a herd size of 180,331 cows, of which 74,389 are milkable cows. In total, Huishan has 69 dairy farms in Liaoning Province, and management expects the herd to grow organically by 10%. The company will halt importing dairy cows this year. While there was a slight improvement in milk yields to 9.1tonnes/annum (FYMar14: 9tonnes/annum), raw milk prices declined by 6% y-o-y to Rmb4.87/kg. We expect the impact from raw milk price decline to be partly offset by sales volume growth in FYMar16.
Downstream sales volume
91,244
123,707
75,257
3,129
66,654
141,374
77,097
2,404 0
20,000
40,000
60,000
80,000
100,000
120,000
140,000
160,000
Fresh milk UHT Yogurt Milk beverage
FY15 Volume tonnes FY14 Volume tonnes
Tonnes
Source: Company data, DBS Vickers
Top driving force: low-temperature products. Huishan is ranked first in market share in NE China in pasteurised milk (44.3%) and yogurt (28.7%), with an overall market share of 20.9% in liquid milk market, according to Frost and Sullivan. Going forward, Huishan aims to target low-temperature product sales (pasteurised milk and yogurt) in NE China,
thereafter moving into East China as the premium UHT product market is highly penetrated by dairy giants such as Mengniu and Yili. As of Mar-15, Huishan has 373 distributors, and 408 direct sales stores in malls and supermarkets. While topline is likely to grow strongly, we expect profitability could be partly offset by A&P costs at the initial stages of expansion.
In Nov-14, Huishan and Alpha Spring (Nantong Zongyi Investment Co) agreed to invest up to Rmb650m together in a JV to further replicate its dairy farm operations in East China (Shanghai, Jiangsu, Zhejiang, Shandong, Anhui). Nantong Zongyi Investment is a listed company which specialises in software and solar cell production in Jiangsu province.
Expanding into milk powder operations. As of Mar-15, Huishan has three milk powder production facilities manufacturing infant formula products under its own brand Gold Queen and Huishan Red. Its other product offerings include whole milk powder, D90 whey powder, and non-dairy creamer.
In Oct-14, Huishan formed a JV with FrieslandCampina to produce and work together to start a new IMF brand with FrieslandCampina. Huishan received an Rmb700m investment from FrieslandCampina in a 50/50 JV inclusive of its Shenyang plant. In addition, FrieslandCampina will acquire USD30m worth of shares in the open market within six month of the completion of the JV. Essentially, this JV will be able (1) to build on existing partnership in the production of non-dairy creamers, (2) secure more demand for Huishan’s raw milk, and lastly (3) to utilise FreislandCampina’s existing sales and distribution network.
Huishan infant formula
Source: Company data, DBS Vickers

China Dairy Sector
China Huishan Dairy Holdings
Page 68
Income Statement (RMB m) Balance Sheet (RMB m)
FY Mar 2012A 2013A 2014A 2015A FY Mar 2012A 2013A 2014A 2015A Turnover 1,333 2,552 3,530 3,923 Net Fixed Assets 2,840 3,637 4,317 6,356 Cost of Goods Sold (783) (1,174) (1,326) (1,663) Invts in Assocs & JVs 0 0 0 0 Gross Profit 550 1,378 2,205 2,261 Other LT Assets 2,695 4,733 9,420 10,171 Other Opng (Exp)/Inc (5) (64) (335) (561) Cash & ST Invts 1,094 1,522 6,147 4,149 Operating Profit 500 1,223 1,500 1,289 Inventory 413 447 915 1,582 Other Non Opg (Exp)/Inc 5 42 9 34 Debtors 148 173 220 271 Associates & JV Inc 0 0 0 0 Other Current Assets 0 0 0 1,805 Net Interest (Exp)/Inc (103) (142) (206) (323) Total Assets 7,190 10,511 21,020 24,334 Dividend Income 0 0 0 0 Exceptional Gain/(Loss) 0 0 0 0 ST Debt 362 909 1,641 2,867 Pre-tax Profit 397 1,081 1,294 967 Creditors 524 910 738 1,401 Tax (11) (67) (45) (60) Other Current Liab 3,280 473 540 986 Minority Interest 0 0 0 (1) LT Debt 1,917 2,103 4,679 5,140 Preference Dividend 0 0 0 0 Other LT Liabilities 224 233 227 255 Net Profit 386 1,014 1,249 908 Shareholder’s Equity 882 5,883 13,195 13,686 Minority Interests 0 0 0 (1) EBITDA 537 1,291 1,664 1,512 Total Cap. & Liab. 7,190 10,511 21,020 24,334 Sales Gth (%) 256.3 91.5 38.3 11.1 EBITDA Gth (%) 373.8 140.6 28.8 (9.1) Non-Cash Wkg. Cap (3,244) (764) (142) 1,271 Opg Profit Gth (%) 459.2 144.5 22.7 (14.0) Net Cash/(Debt) (1,185) (1,489) (174) (3,858) Net Profit Gth (%) N/A 162.7 23.2 (27.4) Effective Tax Rate (%) 2.7 6.2 3.5 6.2 Cash Flow Statement (RMB m) Rates & Ratio
FY Mar 2012A 2013A 2014A 2015A FY Mar 2012A 2013A 2014A 2015A Pre-Tax Profit 460 1,012 1,294 967 Gross Margins (%) 41.2 54.0 62.4 57.6 Dep. & Amort. 37 69 164 222 Opg Profit Margin (%) 37.5 47.9 42.5 32.9 Tax Paid (9) (54) (70) (45) Net Profit Margin (%) 29.0 39.7 35.4 23.1 Assoc. & JV Inc/(loss) 0 0 0 0 ROAE (%) 60.8 30.0 13.1 6.8 (Pft)/ Loss on disposal of FAs 0 0 0 0 ROA (%) 6.1 11.5 7.9 4.0 Chg in Wkg.Cap. 230 228 (537) (2,415) ROCE (%) 15.9 18.3 10.0 5.8 Other Operating CF 34 187 185 1,412 Div Payout Ratio (%) 0.0 0.0 24.9 24.1 Net Operating CF 752 1,442 1,036 141 Net Interest Cover (x) 4.8 8.6 7.3 4.0 Capital Exp.(net) (841) (488) (1,671) (4,279) Asset Turnover (x) 0.2 0.3 0.2 0.2 Other Invts.(net) (84) (50) (2,600) 0 Debtors Turn (avg days) 39.2 22.9 20.3 22.9 Invts in Assoc. & JV 0 0 0 0 Creditors Turn (avg days) 242.9 236.8 258.8 270.9 Div from Assoc & JV 0 0 0 0 Inventory Turn (avg days) 150.5 141.9 213.9 316.4 Other Investing CF (759) (829) (1,652) 0 Current Ratio (x) 0.4 0.9 2.5 1.5 Net Investing CF (1,685) (1,367) (5,923) (4,279) Quick Ratio (x) 0.3 0.7 2.2 0.8 Div Paid 0 0 0 0 Net Debt/Equity (X) 1.3 0.3 0.0 0.3 Chg in Gross Debt 149 386 3,315 1,687 Capex to Debt (%) 36.9 16.2 26.4 53.4 Capital Issues 0 0 5,976 0 Z-Score (X) N/A N/A N/A N/A Other Financing CF 1,276 (124) (195) 0 N.Cash/(Debt)PS (RMB) (0.13) (0.16) (0.02) (0.34) Net Financing CF 1,425 262 9,096 1,687 Opg CFPS (RMB) 0.05 0.11 0.12 0.18 Currency Adjustments (13) (12) (44) 0 Free CFPS (RMB) (0.01) 0.08 (0.05) (0.29) Chg in Cash 479 325 4,166 (2,452)
Interim Income Statement (RMB m) Segmental Breakdown (RMB m)
FY Mar 1H2014 2H2014 1H2015 2H2015 FY Mar 2012A 2013A 2014A 2015A Turnover 1,534 1,997 1,995 1,929 Revenues (RMB m) Cost of Goods Sold (644) (682) (857) (806) Raw milk 672 681 989 1,028 Gross Profit 890 1,314 1,138 1,123 Liquid milk 564 1,707 2,288 2,422 Other Oper. (Exp)/Inc (301) (404) (467) (518) Milk powder 0 88 254 473 Operating Profit 590 911 671 618 Grain products 97 77 0 0 Other Non Opg (Exp)/Inc 4 6 21 13 Associates & JV Inc 0 0 0 0 Total 1,333 2,552 3,530 3,923 Net Interest (Exp)/Inc (107) (98) (156) (167) Gross profit (RMB m) Exceptional Gain/(Loss) 0 0 0 0 Raw milk 326 399 614 614 Pre-tax Profit 482 812 516 451 Liquid milk 217 922 1,499 1,499 Tax (16) (29) (32) (28) Milk powder 0 53 92 92 Minority Interest 0 0 0 (1) Grain products 7 3 0 0 Net Profit 467 783 484 424 Total 550 1,378 2,205 2,205 Gross profit Margins (%) Raw milk 48.5 58.7 62.0 59.7 Sales Gth (%) N/A N/A 30.0 (3.4) Liquid milk 38.4 54.0 65.5 61.9 Opg Profit Gth (%) N/A N/A 13.9 (32.1) Milk powder N/A 60.6 36.2 19.4 Net Profit Gth (%) N/A N/A 3.6 (45.8) Grain products 7.2 4.2 N/A N/A Gross Margins (%) 58.0 65.8 57.1 58.2 Opg Profit Margins (%) 38.4 45.6 33.7 32.0 Total 41.2 54.0 62.4 56.2 Net Profit Margins (%) 30.4 39.2 24.2 22.0 Source: Company, DBS Vickers

China Dairy Sector
China Huishan Dairy Holdings
Page 69
This page has been left blank intentionally

Industry Focus
China Dairy Sector
Page 70
Appendix
M&A relating to F&B sector
Dat e A c qu irer T arget Cat . T y peCou nt ry o f
T arget
J ul-15 China Modern Dairy 2 J V farms Dairy M&A China
J un-15 A lfa Campofrio Pork M&A EU
J un-15 F osun KTG Agriculture M&A EU
Apr-15 CRH CRE Beer M&A China
Apr-15 CokeChina CuliangwangBev erages
Bev erages M&A China
J an-15 Consortium of Taiwanese inv estments Ausnutria Dairy Dairy M&A China
Nov -14 YiliDairy F arm ofAmerica
Dairy Strategic USA
Nov -14 Danone Yashili Dairy New share China
Nov -14 New Hope Group F reedom F oods Dairy Strategic Australia
Oct-14 Bright F ood Salov Oliv e oil M&A Italy
Sep-14 Roy al F rieslandCampina Huishan Dairy Dairy Strategic China
Sep-14 F onterra Beingmate Dairy M&A China
Sep-14 Chongqing General Trading Group Bega Dairy J V Australia
J ul-14 Yunfeng Capital Yili Industrial Group Dairy J V China
J un-14 KKR COF CO-Meat Pork Inv estment CHina
May -14 Bright F ood Tnuv a Mixed M&A Israel
Apr-14 COF CO Noble-Agri Agriculture M&A Global
F eb-14 Danone Mengniu Dairy New share China
F eb-14 COF CO Nidera Agriculture M&A Global
J an-14 Bright F ood Mundella F oods Dairy M&A Australia
J an-14 Mengniu Whitewav e F oods Mixed J V USA
Source: Company data, DBS Vickers
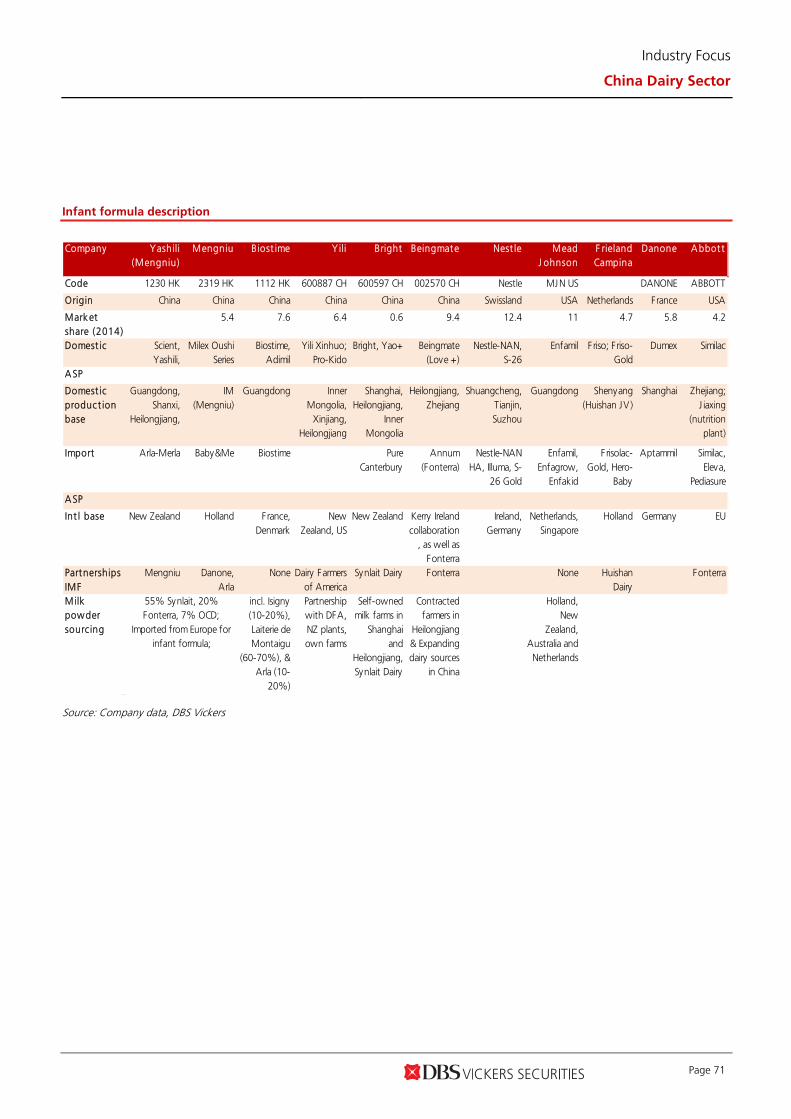
Industry Focus
China Dairy Sector
Page 71
Infant formula description
Company Yashili(Mengniu)
Mengniu Biost ime Yili Bright Beingmate Nest le MeadJ ohnson
F rielandCampina
Danone A bbot t
Code 1230 HK 2319 HK 1112 HK 600887 CH 600597 CH 002570 CH Nestle MJN US DANONE ABBOTT
Origin China China China China China China Swissland USA Netherlands France USA
Marketshare (2014)
5.4 7.6 6.4 0.6 9.4 12.4 11 4.7 5.8 4.2
Domest ic Scient,Yashili,
Milex OushiSeries
Biostime,Adimil
Yili Xinhuo;Pro-Kido
Bright, Yao+ Beingmate(Love +)
Nestle-NAN,S-26
Enfamil F riso; Friso-Gold
Dumex Similac
A SP
Domest icproduct ionbase
Guangdong,Shanxi,
Heilongjiang,
IM(Mengniu)
Guangdong InnerMongolia,
Xinjiang,Heilongjiang
Shanghai,Heilongjiang,
InnerMongolia
Heilongjiang,Zhejiang
Shuangcheng,Tianjin,Suzhou
Guangdong Shenyang(Huishan JV )
Shanghai Zhejiang;J iaxing
(nutritionplant)
Import Arla-Merla Baby&Me Biostime PureCanterbury
Annum(Fonterra)
Nestle-NANHA, Illuma, S-
26 Gold
Enfamil,Enfagrow,
Enfakid
Frisolac-Gold, Hero-
Baby
Aptammil Similac,Eleva,
Pediasure
A SP
Int l base New Zealand Holland France,Denmark
NewZealand, US
New Zealand Kerry Irelandcollaboration
, as well asFonterra
Ireland,Germany
Netherlands,Singapore
Holland Germany EU
PartnershipsIMF
Mengniu Danone,Arla
None Dairy Farmersof America
Synlait Dairy Fonterra None HuishanDairy
Fonterra
Milkpowdersourc ing
incl. Isigny(10-20%),Laiterie deMontaigu
(60-70%), &Arla (10-
20%)
Partnershipwith DFA,NZ plants,own farms
Self-ownedmilk farms in
Shanghaiand
Heilongjiang,Synlait Dairy
Contractedfarmers in
Heilongjiang& Expandingdairy sources
in China
Holland,New
Zealand,Australia andNetherlands
55% Synlait, 20%Fonterra, 7% OCD;
Imported from Europe forinfant formula;
Source: Company data, DBS Vickers

Industry Focus
China Dairy Sector
Page 72
Market size - Dairy
Market size – Drinking milk products
0 2 4 6 8 10 12 14 16 18 20
0
100,000
200,000
300,000
400,000
500,000
600,000
700,000
2010
2011
2012
2013
2014
2015
2016
F
2017
F
2018
F
Dairy (LHS) YoY growth (RHS)
RMB m %
0
5
10
15
20
25
0 50,000
100,000 150,000 200,000 250,000 300,000 350,000 400,000 450,000
2010
2011
2012
2013
2014
2015
2016
F
2017
F
2018
F
Drinking Milk Products (LHS)
RMB m %
Market size – Yoghurt and sour milk products
Market size – Milk formula
0
5
10
15
20
25
30
0
20,000
40,000
60,000
80,000
100,000
120,000
140,000
160,000
2010
2011
2012
2013
2014
2015
2016
F
2017
F
2018
F
Yoghurt and Sour Milk Products (LHS)
RMB m %
0
5
10
15
20
25
0
50,000
100,000
150,000
200,000
250,000
2010
2011
2012
2013
2014
2015
2016
F
2017
F
2018
FMilk Formula (LHS) YoY growth (RHS)
RMB m %
Dairy sector – Geographical breakdown
East China28%
Mid China14%
North and Northeast
China16%
Northwest China7%
South China22%
Southwest China13%
Source: Euromonitor
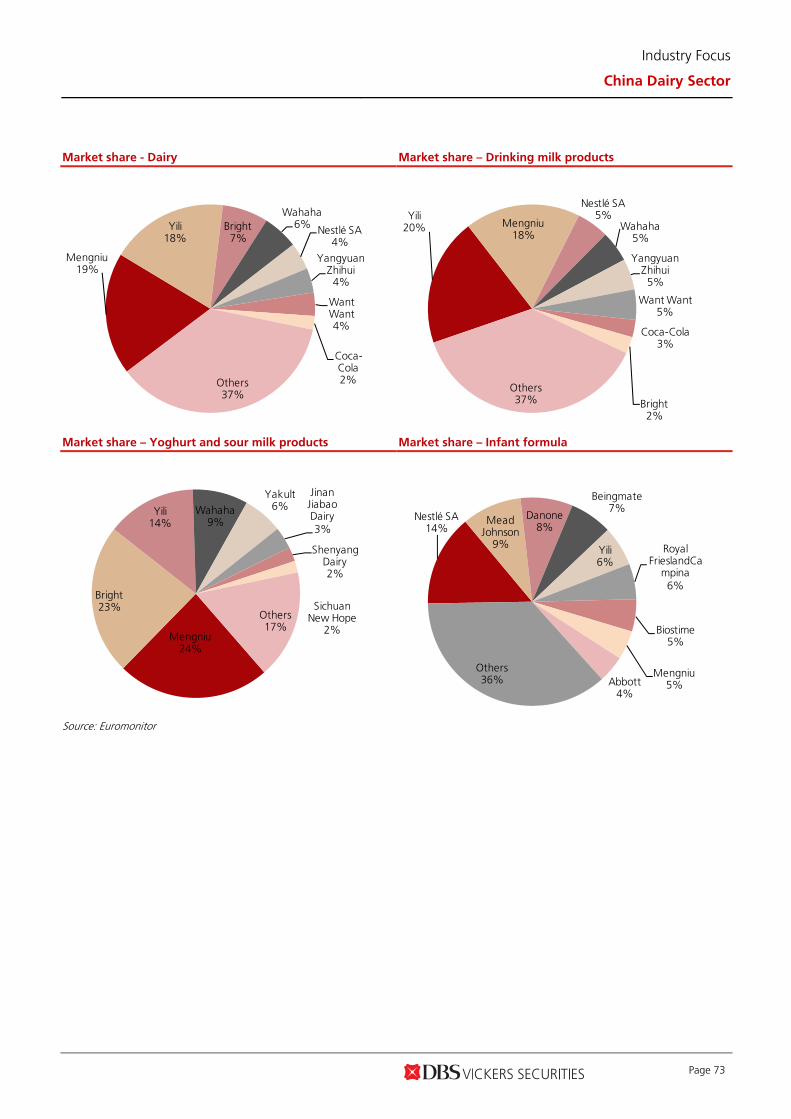
Industry Focus
China Dairy Sector
Page 73
Market share - Dairy
Market share – Drinking milk products
Mengniu19%
Yili18%
Bright7%
Wahaha6% Nestlé SA
4%
Yangyuan Zhihui4%
Want Want4%
Coca-Cola2%Others
37%
Yili20% Mengniu
18%
Nestlé SA5%
Wahaha5%
Yangyuan Zhihui5%
Want Want5%
Coca-Cola3%
Bright2%
Others37%
Market share – Yoghurt and sour milk products
Market share – Infant formula
Mengniu24%
Bright23%
Yili14%
Wahaha9%
Yakult6%
Jinan Jiabao Dairy3%
Shenyang Dairy2%
Sichuan New Hope
2%Others17%
Nestlé SA14%
Mead Johnson
9%
Danone8%
Beingmate7%
Yili6%
Royal FrieslandCa
mpina6%
Biostime5%
Mengniu5%Abbott
4%
Others36%
Source: Euromonitor
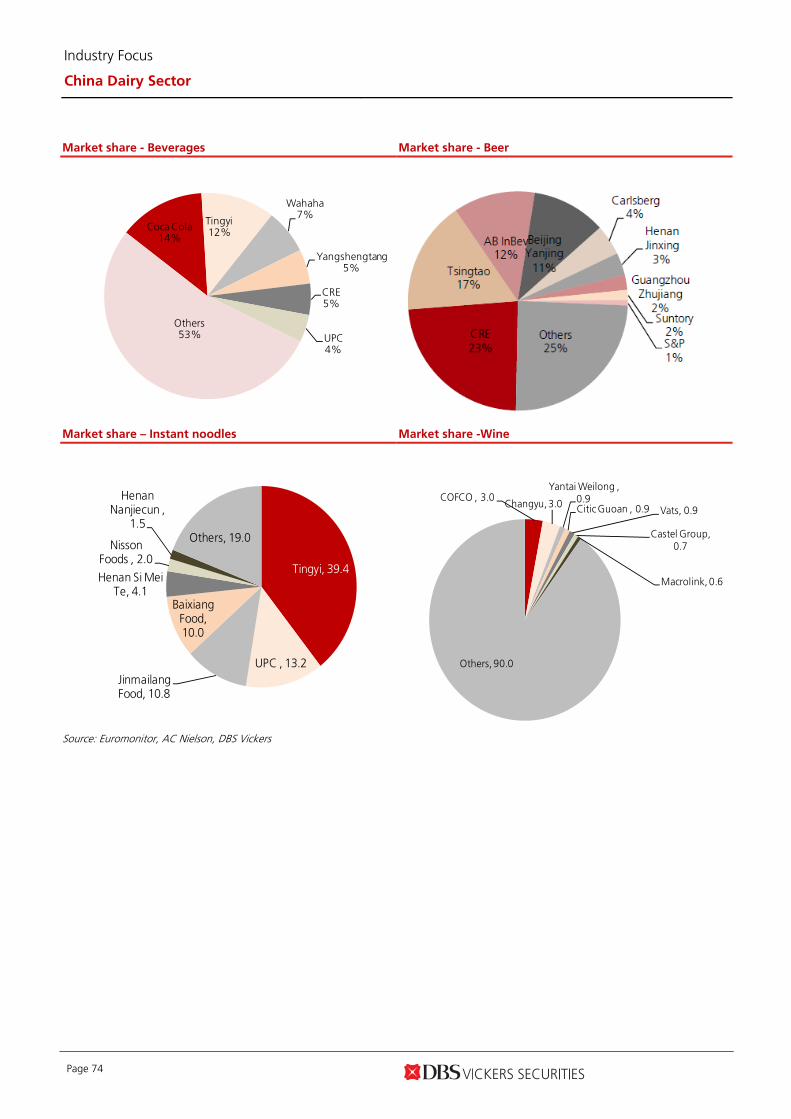
Industry Focus
China Dairy Sector
Page 74
Market share - Beverages
Market share - Beer
Coca Cola 14%
Tingyi12%
Wahaha 7%
Yangshengtang5%
CRE5%
UPC4%
Others53%
Market share – Instant noodles
Market share -Wine
Tingyi, 39.4
UPC , 13.2Jinmailang Food, 10.8
Baixiang Food, 10.0
Henan Si Mei Te, 4.1
Nisson Foods , 2.0
Henan Nanjiecun ,
1.5Others, 19.0
COFCO , 3.0Changyu, 3.0
Yantai Weilong , 0.9Citic Guoan , 0.9 Vats, 0.9
Castel Group, 0.7
Macrolink, 0.6
Others, 90.0
Source: Euromonitor, AC Nielson, DBS Vickers

Industry Focus
China Dairy Sector
Page 75
Dairy: raw milk prices (China) Dairy: WMP Fonterra
3.0
3.2
3.4
3.6
3.8
4.0
4.2
4.4
Jun/
11
Sep/
11
Dec
/11
Mar
/12
Jun/
12
Sep/
12
Dec
/12
Mar
/13
Jun/
13
Sep/
13
Dec
/13
Mar
/14
Jun/
14
Sep/
14
Dec
/14
Mar
/15
Jun/
15
RMB/kg
1,000 1,500 2,000 2,500 3,000 3,500 4,000 4,500 5,000 5,500
Jun/
11
Oct
/11
Feb/
12
Jun/
12
Oct
/12
Feb/
13
Jun/
13
Oct
/13
Feb/
14
Jun/
14
Oct
/14
Feb/
15
Jun/
15
US$/ton
White sugar (China)
Packaging – PET China
3,000
4,000
5,000
6,000
7,000
8,000
Jun/
11
Dec
/11
Jun/
12
Dec
/12
Jun/
13
Dec
/13
Jun/
14
Dec
/14
Jun/
15
RMB/ton
8,000 8,500 9,000 9,500
10,000 10,500 11,000 11,500 12,000 12,500 13,000
Jun/
11
Dec
/11
Jun/
12
Dec
/12
Jun/
13
Dec
/13
Jun/
14
Dec
/14
Jun/
15
RMB/ton
Source: CEIC, Euromonitor
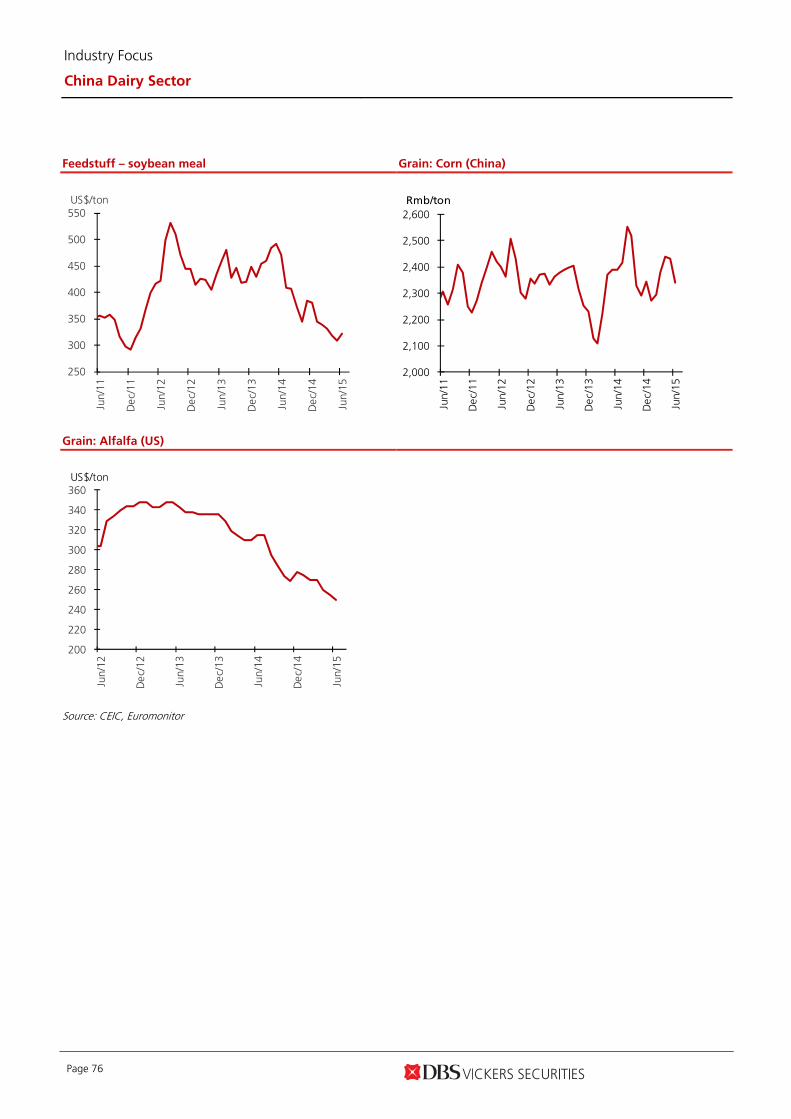
Industry Focus
China Dairy Sector
Page 76
Feedstuff – soybean meal Grain: Corn (China)
250
300
350
400
450
500
550
Jun/
11
Dec
/11
Jun/
12
Dec
/12
Jun/
13
Dec
/13
Jun/
14
Dec
/14
Jun/
15
US$/ton
2,000
2,100
2,200
2,300
2,400
2,500
2,600
Jun/
11
Dec
/11
Jun/
12
Dec
/12
Jun/
13
Dec
/13
Jun/
14
Dec
/14
Jun/
15
Rmb/ton
Grain: Alfalfa (US)
200
220
240
260
280
300
320
340
360
Jun/
12
Dec
/12
Jun/
13
Dec
/13
Jun/
14
Dec
/14
Jun/
15
US$/ton
Source: CEIC, Euromonitor

Industry Focus
China Dairy Sector
Page 77
China dairy industry chain
Growing forage Dairy Farming Dairy product processing Sales & Distribution Background Feed is a mix of forage (corn, silage,
alfalfa) & concentrated feed (corn,
soybean meal, cottonseed meals),
with the majority demand being
satisfied by import
Dairy cows are imported from NZ, AUS and US between
10-14 months. Most choose Holstein breed for its higher
yield.
Processing facilities are typically built with raw milk sources nearby.
Since 08 infant formula scandal, downstream players have formed
integrated vertically to ensure a safe and secure supply chain
Infant formula’s fast growing retail
channel is e-commerce, thereafter
specialty channels.
Market players
Largest exporters to China By herd size Latest Market sh Dairy market share breakdown by RSP % (by comp) Distribution channel breakdown (%) Alfalfa 90% of volume ‐ USA China Modern Dairy 201,507 1.4%
Huishan Dairy 180,331 1.2%
Shengmu 103,252 0.7%
Japfa 57,000 0.4%
Bright Dairy-related 50,000 0.3%
Fontera 49,000 0.3%
YST Dairy 44,623 0.3%
Zhongdi Dairy 21,433 0.1%
Top ten 707,146 4.9%
A s of 2014 (China) 14,500,000
Mengniu Yili Bright Wahaha
90.2
35.3
59.1
5.7
42.7
34.3
4.1
22
6.6
0%
10%
20%
30%
40%
50%
60%
70%
80%
90%
100%
Yogurt Infant formula
Dairy
Modern TraditionalInternet retailing
Corn USA Overall 19 18 7 6
Soybean Argentina Yogurt 16 12 21 12 Drinking Dairy 22 25 3 8
Typical feed mix Infant formula market share RSP % (by comp)
High Fibre60%
Concentrated feed40%
3.9
4.2
4.3
5.9
7.2
8.7
10.0
10.1
0.0 2.0 4.0 6.0 8.0 10.0 12.0
Abbott
Yashili
Royal Friesland
Yili
Biostime
Beingmate
Wyeth
Mead Johnson
%
Recent events
Alfalfa import volume & ASP Date Upstream expansion plans Date Overseas partnerships
340
360
380
400
420
0
20
40
60
80
100
Jan
Mar
May Ju
l
Sep
Nov
2014 Import Volume (LHS)2015 Import Volume (LHS)2014 Import Value (RHS)2015 Import Value (RHS)
US$ per ton'000 ton Feb'14 Bright Dairy joined hands with RRJ Capital todevelop its upstream capabilities and plans to listin 3‐5 years.
Nov'14 Yili pans to partner with Dairy Farmers ofAmerica, in addition to announcing its NZ milkpowder plant expansion
2015 Both CMD & Huishan Dairy guide its overall herdsize to grow 10% organically
Jun'15 Bright Dairy plans to purchase its ParentShanghai Dairy's upstream assets.
Feb?4 Danone increases its stake to 9.9% in Mengniu to build up its cold‐chain business , of which Danone's Bio+has since been launched.
Oct'14 Danone joins as a 2nd largest shareholder with Yashili with plans to work together in infant formula
Oct?4 Friesland Campina invests in a 50/50 JV with Huishan to jointly develop a new infant formula brand and co‐invest in a production plant in Shenyang for RMB692m. Friesland will also purchase US$30m via openmarket purchase.
Feb'15 Fonterra buys c.18% stake in Beingmate and plans to distribute its premium IMF brand Annum throughBeingmate's channels
Mar'15 Want Want develops cold‐chain products with Japan‐Morinaga Milk Industry to be launched in 3Q15
Jun'15 Bright Dairy plans to purchase Israel‐Tnuva Food from Parent Company. Tnuva has >70% market share inIsrael.
Source: Euromonitor, Company data, DBS Vickers
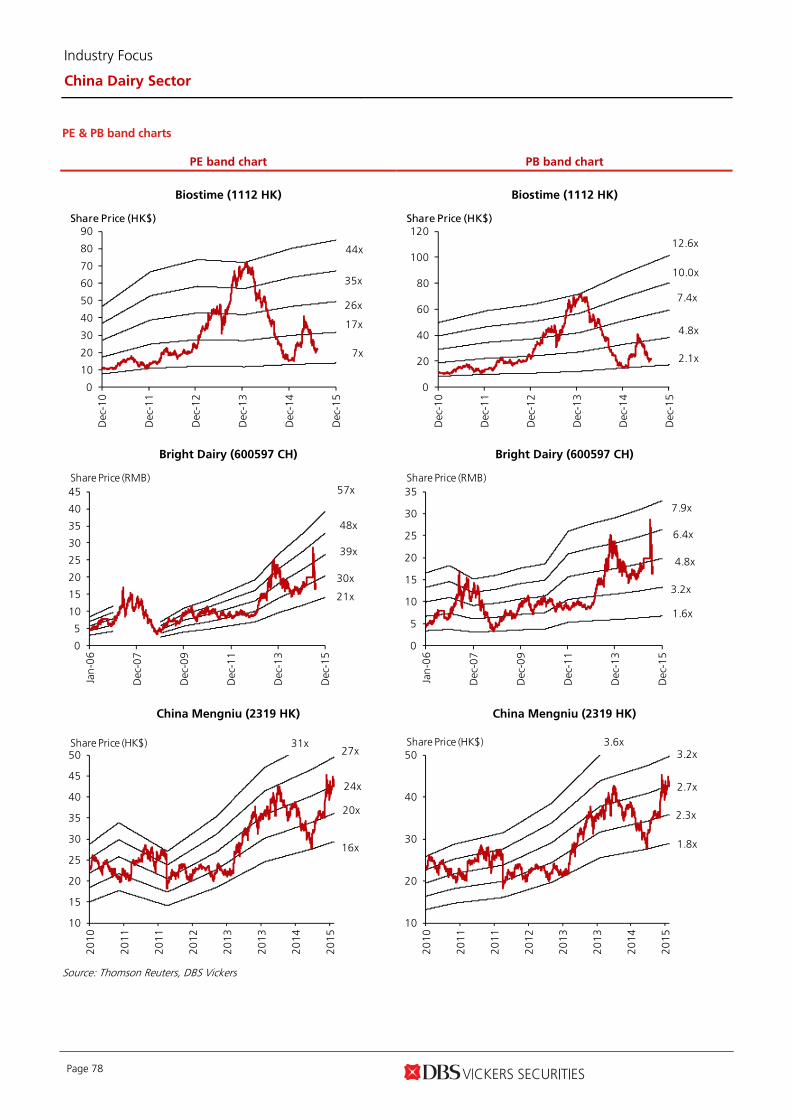
Industry Focus
China Dairy Sector
Page 78
PE & PB band charts
PE band chart PB band chart
Biostime (1112 HK) Biostime (1112 HK)
0
10
20
30
40
50
60
70
80
90
Dec
-10
Dec
-11
Dec
-12
Dec
-13
Dec
-14
Dec
-15
Share Price (HK$)
7x
17x
26x
35x
44x
0
20
40
60
80
100
120
Dec
-10
Dec
-11
Dec
-12
Dec
-13
Dec
-14
Dec
-15
Share Price (HK$)
2.1x
4.8x
7.4x
10.0x
12.6x
Bright Dairy (600597 CH) Bright Dairy (600597 CH)
0
5
10
15
20
25
30
35
40
45
Jan
-06
Dec
-07
Dec
-09
Dec
-11
Dec
-13
Dec
-15
Share Price (RMB)
21x
30x
39x
48x
57x
0
5
10
15
20
25
30
35
Jan
-06
Dec
-07
Dec
-09
Dec
-11
Dec
-13
Dec
-15
Share Price (RMB)
1.6x
3.2x
4.8x
6.4x
7.9x
China Mengniu (2319 HK) China Mengniu (2319 HK)
10
15
20
25
30
35
40
45
50
20
10
20
11
20
11
20
12
20
13
20
13
20
14
20
15
Share Price (HK$)
16x
20x
24x
27x31x
10
20
30
40
50
20
10
20
11
20
11
20
12
20
13
20
13
20
14
20
15
Share Price (HK$)
1.8x
2.3x
2.7x
3.2x3.6x
Source: Thomson Reuters, DBS Vickers
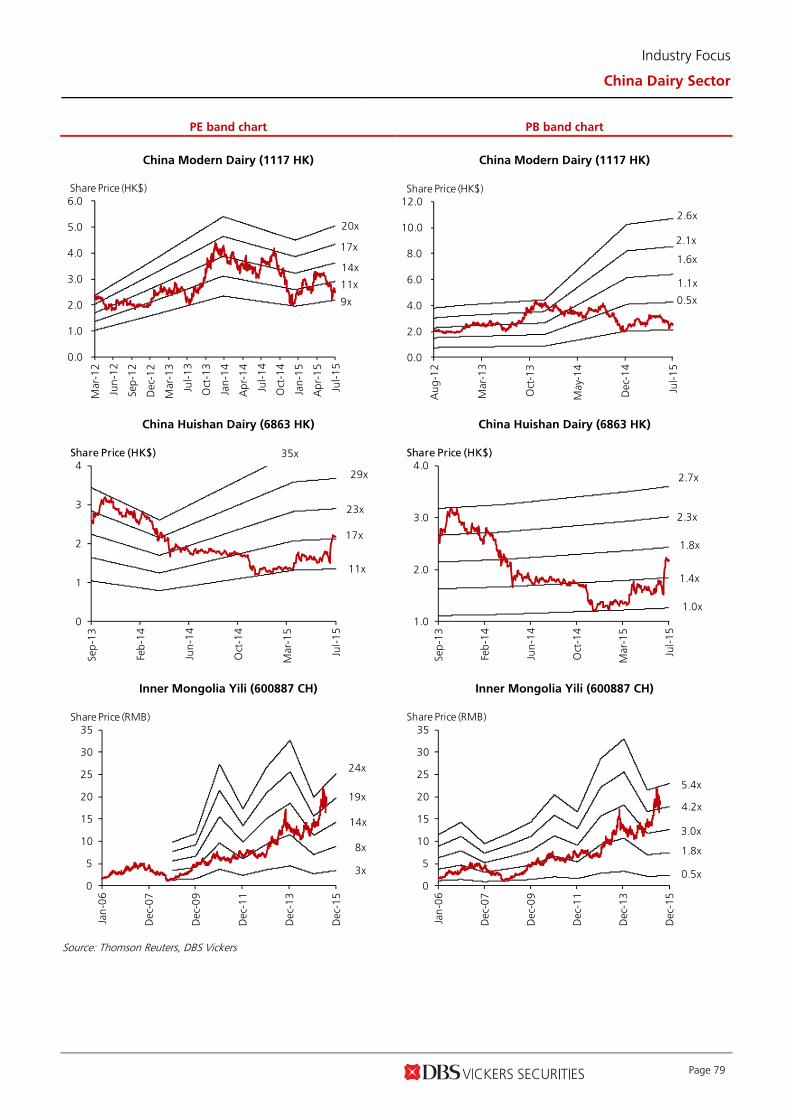
Industry Focus
China Dairy Sector
Page 79
PE band chart PB band chart
China Modern Dairy (1117 HK) China Modern Dairy (1117 HK)
0.0
1.0
2.0
3.0
4.0
5.0
6.0
Mar
-12
Jun
-12
Sep
-12
Dec
-12
Mar
-13
Jul-
13
Oct
-13
Jan
-14
Ap
r-1
4
Jul-
14
Oct
-14
Jan
-15
Ap
r-1
5
Jul-
15
Share Price (HK$)
20x
17x
14x
11x
9x
0.0
2.0
4.0
6.0
8.0
10.0
12.0
Au
g-1
2
Mar
-13
Oct
-13
May
-14
Dec
-14
Jul-
15
Share Price (HK$)
2.6x
2.1x
1.6x
1.1x
0.5x
China Huishan Dairy (6863 HK) China Huishan Dairy (6863 HK)
0
1
2
3
4
Sep
-13
Feb
-14
Jun
-14
Oct
-14
Mar
-15
Jul-
15
Share Price (HK$)
11x
17x
23x
29x
35x
1.0
2.0
3.0
4.0
Sep
-13
Feb
-14
Jun
-14
Oct
-14
Mar
-15
Jul-
15
Share Price (HK$)
1.0x
1.4x
1.8x
2.3x
2.7x
Inner Mongolia Yili (600887 CH) Inner Mongolia Yili (600887 CH)
0
5
10
15
20
25
30
35
Jan
-06
Dec
-07
Dec
-09
Dec
-11
Dec
-13
Dec
-15
Share Price (RMB)
3x
8x
14x
19x
24x
0
5
10
15
20
25
30
35
Jan
-06
Dec
-07
Dec
-09
Dec
-11
Dec
-13
Dec
-15
Share Price (RMB)
0.5x
1.8x
3.0x
4.2x
5.4x
Source: Thomson Reuters, DBS Vickers
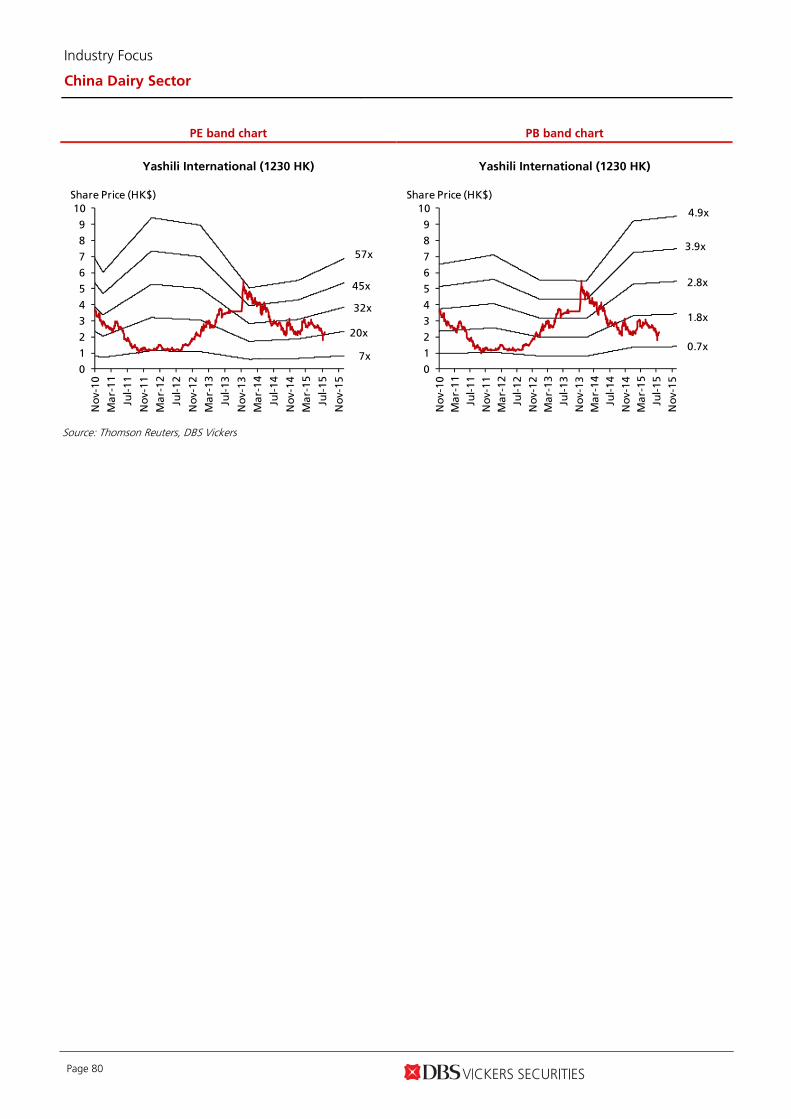
Industry Focus
China Dairy Sector
Page 80
PE band chart PB band chart
Yashili International (1230 HK) Yashili International (1230 HK)
0
1
2
3
4
5
6
7
8
9
10
No
v-1
0
Ma
r-1
1
Jul-
11
No
v-1
1
Ma
r-1
2
Jul-
12
No
v-1
2
Ma
r-1
3
Jul-
13
No
v-1
3
Ma
r-1
4
Jul-
14
No
v-1
4
Ma
r-1
5
Jul-
15
No
v-1
5
Share Price (HK$)
7x
20x
32x
45x
57x
0
1
2
3
4
5
6
7
8
9
10
No
v-1
0M
ar-
11
Jul-
11
No
v-1
1M
ar-
12
Jul-
12
No
v-1
2M
ar-
13
Jul-
13
No
v-1
3M
ar-
14
Jul-
14
No
v-1
4M
ar-
15
Jul-
15
No
v-1
5
Share Price (HK$)
0.7x
1.8x
2.8x
3.9x
4.9x
Source: Thomson Reuters, DBS Vickers

Industry Focus
China Dairy Sector
Page 81
DBSV recommendations are based an Absolute Total Return* Rating system, defined as follows:
STRONG BUY (>20% total return over the next 3 months, with identifiable share price catalysts within this time frame)
BUY (>15% total return over the next 12 months for small caps, >10% for large caps)
HOLD (-10% to +15% total return over the next 12 months for small caps, -10% to +10% for large caps)
FULLY VALUED (negative total return i.e. > -10% over the next 12 months)
SELL (negative total return of > -20% over the next 3 months, with identifiable catalysts within this time frame)
Share price appreciation + dividends GENERAL DISCLOSURE/DISCLAIMER This report is prepared by DBS Vickers (Hong Kong) Limited (“DBSVHK”), a direct wholly-owned subsidiary of DBS Vickers Securities Holdings Pte Ltd ("DBSVH"). This report is intended for clients of DBSV Group only and no part of this document may be (i) copied, photocopied or duplicated in any form or by any means or (ii) redistributed without the prior written consent of DBSVHK. The research set out in this report is based on information obtained from sources believed to be reliable, but we (which collectively refers to DBSVHK and/or DBSVH) do not make any representation or warranty as to its accuracy, completeness or correctness. Opinions expressed are subject to change without notice. This document is prepared for general circulation. Any recommendation contained in this document does not have regard to the specific investment objectives, financial situation and the particular needs of any specific addressee. This document is for the information of addressees only and is not to be taken in substitution for the exercise of judgement by addressees, who should obtain separate independent legal or financial advice. DBSVHK accepts no liability whatsoever for any direct, indirect and/or consequential loss (including any claims for loss of profit) arising from any use of and/or reliance upon this document and/or further communication given in relation to this document. This document is not to be construed as an offer or a solicitation of an offer to buy or sell any securities. DBSVH is a wholly-owned subsidiary of DBS Bank Ltd. DBS Bank Ltd along with its affiliates and/or persons associated with any of them may from time to time have interests in the securities mentioned in this document. DBSVHK, DBS Bank Ltd and their associates, their directors, and/or employees may have positions in, and may effect transactions in securities mentioned herein and may also perform or seek to perform broking, investment banking and other banking services for these companies. Any valuations, opinions, estimates, forecasts, ratings or risk assessments herein constitutes a judgment as of the date of this report, and there can be no assurance that future results or events will be consistent with any such valuations, opinions, estimates, forecasts, ratings or risk assessments. The information in this document is subject to change without notice, its accuracy is not guaranteed, it may be incomplete or condensed and it may not contain all material information concerning the company (or companies) referred to in this report. The valuations, opinions, estimates, forecasts, ratings or risk assessments described in this report were based upon a number of estimates and assumptions and are inherently subject to significant uncertainties and contingencies. It can be expected that one or more of the estimates on which the valuations, opinions, estimates, forecasts, ratings or risk assessments were based will not materialize or will vary significantly from actual results. Therefore, the inclusion of the valuations, opinions, estimates, forecasts, ratings or risk assessments described herein IS NOT TO BE RELIED UPON as a representation and/or warranty by DBSVHK and/or DBSVH (and/or any persons associated with the aforesaid entities), that:
a. such valuations, opinions, estimates, forecasts, ratings or risk assessments or their underlying assumptions will be achieved, and
b. there is any assurance that future results or events will be consistent with any such valuations, opinions, estimates, forecasts, ratings or risk assessments stated therein.
Any assumptions made in this report that refers to commodities, are for the purposes of making forecasts for the company (or companies) mentioned herein. They are not to be construed as recommendations to trade in the physical commodity or in the futures contract relating to the commodity referred to in this report. DBS Vickers Securities (USA) Inc ("DBSVUSA"), a U.S.-registered broker-dealer, does not have its own investment banking or research department, nor has it participated in any investment banking transaction as a manager or co-manager in the past twelve months. ANALYST CERTIFICATION The research analyst primarily responsible for the content of this research report, in part or in whole, certifies that the views about the companies and their securities expressed in this report accurately reflect his/her personal views. The analyst also certifies that no part of his/her compensation was, is, or will be, directly, or indirectly, related to specific recommendations or views expressed in this report. As of the date the report is published, the analyst and his / her spouse and/or relatives and/or associate who are financially dependent on the analyst, do not hold interests in the securities recommended in this report (“interest” includes direct or indirect ownership of securities, directorships and trustee positions).

Industry Focus
China Dairy Sector
Page 82
COMPANY-SPECIFIC / REGULATORY DISCLOSURES 1. DBSVHK and its subsidiaries do not have a proprietary position in the securities recommended in this report as of the date the report is
published.
2. DBSVHK, DBSVUSA, DBS Bank Ltd and/or other affiliates may beneficially own a total of 1% or more of any class of common equity securities of the subject companies mentioned in this document as of the latest available date of the updated information.
3. Compensation for investment banking services: DBSVHK, DBSVUSA, DBS Bank Ltd and/or other affiliates may have received compensation, within the past 12 months, and within the next 3 months may receive or intends to seek compensation for investment banking services from the subject companies mentioned in this document.
DBSVUSA does not have its own investment banking or research department, nor has it participated in any investment banking transaction as a manager or co-manager in the past twelve months. Any US persons wishing to obtain further information, including any clarification on disclosures in this disclaimer, or to effect a transaction in any security discussed in this document should contact DBSVUSA exclusively.
RESTRICTIONS ON DISTRIBUTION General This report is not directed to, or intended for distribution to or use by, any person or entity who is a citizen or resident of or
located in any locality, state, country or other jurisdiction where such distribution, publication, availability or use would be contrary to law or regulation.
Australia This document is being distributed in Australia by DBSVHK, which is exempted from the requirement to hold an Australian Financial Services Licence under the Corporation Act 2001 [“CA”] in respect of financial services provided to the recipients. DBSVHK is regulated by the Securities and Futures Commission under the laws of Hong KONG, which differ from Australian laws. Distribution of this report is intended only for “wholesale investors” within the meaning of the CA.
Hong Kong This report is being distributed in Hong Kong by DBS Vickers (Hong Kong) Limited which is licensed and regulated by the Hong Kong Securities and Futures Commission.
Indonesia This report is being distributed in Indonesia by PT DBS Vickers Securities Indonesia.
Malaysia This report is distributed in Malaysia by AllianceDBS Research Sdn Bhd ("ADBSR"). Recipients of this report, received from ADBSR are to contact the undersigned at 603-2604 3333 in respect of any matters arising from or in connection with this report. In addition to the General Disclosure/Disclaimer found at the preceding page, recipients of this report are advised that ADBSR (the preparer of this report), its holding company Alliance Investment Bank Berhad, their respective connected and associated corporations, affiliates, their directors, officers, employees, agents and parties related or associated with any of them may have positions in, and may effect transactions in the securities mentioned herein and may also perform or seek to perform broking, investment banking/corporate advisory and other services for the subject companies. They may also have received compensation and/or seek to obtain compensation for broking, investment banking/corporate advisory and other services from the subject companies.
Wong Ming Tek, Executive Director, ADBSR
Singapore This report is distributed in Singapore by DBS Bank Ltd (Company Regn. No. 196800306E) or DBSVS (Company Regn No. 198600294G), both of which are Exempt Financial Advisers as defined in the Financial Advisers Act and regulated by the Monetary Authority of Singapore. DBS Bank Ltd and/or DBSVS, may distribute reports produced by its respective foreign entities, affiliates or other foreign research houses pursuant to an arrangement under Regulation 32C of the Financial Advisers Regulations. Where the report is distributed in Singapore to a person who is not an Accredited Investor, Expert Investor or an Institutional Investor, DBS Bank Ltd accepts legal responsibility for the contents of the report to such persons only to the extent required by law. Singapore recipients should contact DBS Bank Ltd at 6327 2288 for matters arising from, or in connection with the report.
Thailand This report is being distributed in Thailand by DBS Vickers Securities (Thailand) Co Ltd. Research reports distributed are only intended for institutional clients only and no other person may act upon it.
United Kingdom
This report is being distributed in the UK by DBS Vickers Securities (UK) Ltd, who is an authorised person in the meaning of the Financial Services and Markets Act and is regulated by The Financial Conduct Authority. Research distributed in the UK is intended only for institutional clients.
Dubai
This research report is being distributed in The Dubai International Financial Centre (“DIFC”) by DBS Bank Ltd., (DIFC Branch) having its office at PO Box 506538, 3rd Floor, Building 3, East Wing, Gate Precinct, Dubai International Financial Centre (DIFC), Dubai, United Arab Emirates. DBS Bank Ltd., (DIFC Branch) is regulated by The Dubai Financial Services Authority. This research report is intended only for professional clients (as defined in the DFSA rulebook) and no other person may act upon it.
United States Neither this report nor any copy hereof may be taken or distributed into the United States or to any U.S. person except in compliance with any applicable U.S. laws and regulations. It is being distributed in the United States by DBSV US, which accepts responsibility for its contents. Any U.S. person receiving this report who wishes to effect transactions in any securities referred to herein should contact DBS Vickers Securities (USA) Inc (“DBSVUSA”) directly and not its affiliate.
Other jurisdictions
In any other jurisdictions, except if otherwise restricted by laws or regulations, this report is intended only for qualified, professional, institutional or sophisticated investors as defined in the laws and regulations of such jurisdictions.
DBS Vickers (Hong Kong) Limited
18th Floor Man Yee building, 68 Des Voeux Road Central, Central, Hong Kong
Tel: (852) 2820-4888, Fax: (852) 2868-1523