Embed Size (px)
Citation preview

Structural assessment and material validation of 3D printed corrugatedspacecraft debris shields
Adrian Dumitrescu(1), Scott J. I. Walker(2), Federico Romei(3), Atul Bhaskar(4)
(1)University of Southampton; University Road, Southampton, SO17 1BJ, UK; [email protected](2)University of Southampton; University Road, Southampton, SO17 1BJ, UK; [email protected]
(3)University of Southampton; University Road, Southampton, SO17 1BJ, UK; [email protected](4)University of Southampton; University Road, Southampton, SO17 1BJ, UK; [email protected]
KEYWORDS: Additive Manufacturing, 3D Printing,Satellite Shielding, Satellite Structures, HypervelocityImpact, ReDSHIFTABSTRACT
In the context of novel and lighter satellite designs, thispaper investigates a 3D printing approach to the stan-dard satellite orbital debris shields. Shields are currentlyproduced using conventional manufacturing techniquesand are limited in terms of design variation. 3D print-ing can lead to a wider range of more optimized shielddesigns that are easier and faster to fabricate comparedwith standard samples. Moreover, metal printing mayenable the shields to augment and support the primarystructure of the satellite in its load bearing functions.
The objective of this paper is to present a structuraland shielding assessment of AlSi10Mg 3D printed sin-gle corrugated orbital debris shields based on experi-mental data generated from 6 static structural samplesand 8 hypervelocity impact (HVI) samples manufac-tured and tested during the ReDSHIFT project. Thesamples were subjected to three point bending (3PB),compression and HVI - the three loading scenarios rel-evant for both structural and shielding purposes. Ex-perimental results from testing of these novel structuresare compared with those for baseline structures to gaininsight into the structural value of the proposed novelshields and into their protection capabilities. Finally,the experimental results are compared with those fromFinite Element Analysis (FEA) carried out within theANSYS APDL 2020 environment (bending and compres-sion) and Smooth Particle Hydrodynamics (SPH) anal-ysis in AUTODYN (HVI). The use of relevant theoryis made to interpret and explain the results. A materialmodel for printed AlSi10Mg is validated and can be usedin the development of such novel corrugated shields thathave the potential of playing a structural role.
1 INTRODUCTIONSatellite shields have evolved from a slab of material tothe first mention of the Whipple shield in 1947[1] to a
variety of shield types that take advantage of the sepa-ration between multiple shield elements. The commonshield types used and investigated today are describedbelow based on the work of Cour-Palais, Chrstiansenand Kerr[2][3][4][5].
Single sheet monolithic Shield - the most rudimen-tary type of shielding and the least mass efficient. ItsBallistic Limit Equation (BLE) is not dependent on thevelocity regime as that dependence relates to the debristhat hits the rear wall, which is non-existent here.
Whipple Shield - the first deviation from the singlesheet monolithic shield. Note that it is less effective atlow impact velocities (same behaviour as a single sheet< 3 km/s) and at certain oblique impact angles at highspeeds. These kinds of impacts result in solid and morepenetrating fragments that hit the rear wall.
Stuffed Whipple (SW) Shield - a standard Whippleshield that incorporates a blanket of Nextel and Kevlarbetween its usual layers. The Nextel cloth generateshigher shock pressures and greater disruption of the pro-jectile compared to an equivalent weight Aluminium (Al)bumper. The Kevlar slows down the remaining frag-ments more effectively than Al due to its high strengthto weight ratio.
Multi-Shock (MS) Shield - a low-weight shieldingalternative to the Whipple shield. It is made up of mul-tiple ultra-thin space sheets usually made out of Nextel.It has been proven to be more efficient than Whippleshields at breaking up projectiles, converting projectilekinetic energy into internal energy of projectile frag-ments and decreasing the velocity of the debris cloudimpacting the rear wall.
Mesh Double-Bumper (MDB) Shield - advanceddesign that provides similar protection and weight sav-ing benefits to the MS shield. It is a Whipple shieldwith an added Aluminium mesh before the bumper anda high-strength fabric layer in front of the rear wall.
The performance of these shields has been thoroughly
1Proc. 8th European Conference on Space Debris (virtual), Darmstadt, Germany, 20–23 April 2021, published by the ESA Space Debris Office
Ed. T. Flohrer, S. Lemmens & F. Schmitz, (http://conference.sdo.esoc.esa.int, May 2021)
tested and in general Whipple shields outperform mono-lithic shields, while multi-bumper shields such as MS andMDB offer improvements over standard Whipple shieldsin several areas.
1.1 Corrugated ShieldsA less common, but very efficient shield type is the cor-rugated shield which so far has been produced throughsubtractive manufacturing techniques. Work on spacedebris shields with corrugated cores has accelerated inthe past few years, but this type of shield design hasbeen around for more than 30 years. In 1991, Schon-berg and Tullos[6] proposed a dual-wall system with acorrugated bumper and compared it to dual-wall shieldswith monolithic bumpers. The corrugated shield provedto be significantly more effective in protecting the rearwall both from penetration and spall compared to theclassic Whipple configuration. The same investigationyielded an approach to determine the optimal corruga-tion angle for minimum secondary impacts caused bydebris ricocheting off of the corrugations.
More recently, the potential of corrugated shields was re-iterated through a numerical simulation study concernedwith the comparison between Whipple shields and cor-rugated shields stuffed (SCS) with epoxy[7]. The simula-tion accuracy was verified both by comparing it to pre-vious experiments on Whipple shields and by compar-ing it to a modified version of the Cour-Palais BLEs fordouble-wall structures[8]. The investigation concludedthat the SCS absorbs more energy and disperses the de-bris cloud more than a Whipple structure of equal mass.
1.2 Performance of Sandwich PanelsLooking beyond purpose-built space debris shields, re-search has also focused on the impact dispersion prop-erties of sandwich panels with Aluminium honeycombcores. This is because such structural configurationsmake up a large portion of the spacecraft primary struc-ture and they will inadvertently be exposed to debrisimpact. In the context of this research, the behaviourof sandwich constructions is relevant as they act as aperformance baseline for the novel corrugated shields inboth impact and static loading.
The effect of a hypervelocity impact on sandwich pan-els with honeycomb cores has been investigated theo-retically and using extensive testing for over 50 years.The consensus is that honeycombs exhibit a phenomenacalled channeling which leads to an inferior performancecompared with a standard Whipple shield (which is ef-fectively a sandwich panel without a core). Channeling
refers to the impact kinetic energy being refrained fromdispersing across a large area due to the honeycomb cellwalls, which leads to higher areal damage on the rearfacesheet (or the rear wall in a Whipple shield)[9]. Inthe case of an Aluminium 6061-T6 honeycomb cell anda Cadmium projectile as well as a Cadmium facesheet,the addition of the honeycomb results in an increase byat least a factor of 3.8 in the rear facesheet thicknessrequired to prevent failure[10]. There are a few experi-mental exceptions that contradict this conclusion, a no-table one being a test campaign by NASA MSFC from1970 which showed an improved shielding performancefor the honeycomb structures[11]. They mentioned theloss of kinetic energy in secondary impacts with cell wallsas a potential explanation for this unexpected result.
1.3 The ReDSHIFT Investigation
ReDSHIFT was a Horizon 2020 EU funded project thatran between 2016 and 2019 and brought together severalacademic and industrial institutions including the Uni-versity of Southampton[12]. Part of the project focus wason the novel assessment of the mechanical and impactperformance of AlSi10Mg 3D printed corrugated shields.Single corrugated panels (SCP) were investigated bothin 3PB and compression and were impact tested togetherwith a set of three printed multi-shock panels. 6 staticstructural samples and 8 HVI samples were tested andmodeled using theory and simulation.
The performance of the corrugated shields is com-pared with that of baseline structures, both in3PB/compression and impact. CFRP sandwich panelswith both standard and printed cores are used as the ele-ment of comparison in 3PB and compression, since theyhave been investigated in a previous paper by the presentauthors[13]. A 3D printed MultiShock Panel (MSP) to-gether with a standard CFRP sandwich panel are used asbaselines in impact and are studied in this paper. Thesecomparisons help gain insight into the performance po-tential of 3D printed corrugated shields, both in termsof debris protection and structural support.
2 EXPERIMENTAL RESULTS
The sample types investigated in 3PB, compression andHVI are shown in Figures 1 and 2 and their geometri-cal features are presented in Tables 1 and 2. The SCPstested in 3PB and compression all have the same corru-gation geometry and a wall thickness of 300 µm. The3PB sample free span is 133 mm.
2

The SCP impact sample is a single corrugation with4 different configurations, varying both the corrugationthickness and the core depth. See Figure 2 and note thatthe facesheets are printed together with the core.
The baseline samples for bending and compression tests
are as follows. Firstly, a standard Al 5056 Hexcel hon-eycomb core sandwich panel with a cell size of 4.8 mmand wall thickness of 18 µm for an apparent core den-sity of 32 kg/m3. Secondly, a sandwich panel with anAlSi10Mg printed core with a cell size of 4.8 mm andwall thickness of 0.3 mm like most of the shields [13].
Sample TypeCorrugationDimensions Sample Dimensions # Samples Name
Single Corrugated Panel
Angle: 450
Height: 6.87 mmWidth: 13.33 mm
Wall thickness: 0.3 mm throughout3PB: 177 mm × 66.9 mm × 6.87 mmComp: 80 mm × 80 mm × 6.87 mm
3 3PB3 Comp
S1B 1 - 3S1C 1 - 3
Table 1: Main properties of 3PB and compression experimental samples
Sample Type Sample Dimensions # Samples Name
Multi-Shock PanelWall Thickness: 0.5 mm throughout
Total Depth: 10 or 20 mm10 mm depth: 120 mm depth: 2
MSP 10MSP 20
Single Corrugated Panel
Facesheet Thickness: 0.5 mmCorrugation Thickness: 0.3 mm or 0.7 mm
Total Depth: 10 mm or 20 mm
10 mm depth/0.3 mm twc: 210 mm depth/0.7 mm twc: 120 mm depth/0.3 mm twc: 120 mm depth/0.7 mm twc: 1
SCP 10 0.3SCP 10 0.7SCP 20 0.3SCP 20 0.7
Table 2: Main properties of HVI experimental samples. Here twc is the corrugation wall thickness
Figure 1: 3D printed shield samples used for 3PB (top)and compression (bottom)[14]
Figure 2: Shield types for impact investigation. Six in-dividual printed single corrugated shields in the bottomfigure [15].
3

The baseline shield is a 3D printed MSP with two coredepths. Samples with both 10 mm and 20 mm coredepths have 4 walls of 0.5 mm thickness each. Honey-comb cores of various core properties are also used astheoretical comparisons.
All 3PB and compression tests were performed on IN-STRON test machines, INSTRON 5560 for 3PB andINSTRON 4204 for compression. The failure load wasreported from the INSTRON load cells with samplingevery 0.1 second. Displacement was captured using im-age tracking in ImageJ with a frame every 0.2 - 1 second.The displacement reported by INSTRON can be inaccu-rate because it includes the displacement of the machineitself, while point tracking isolates the sample displace-ment. In terms of load peaks, the INSTRON data pointsassigned to each image frame have a lower sampling ratecompared to the raw INSTRON data which will reportthe true peaks. Two types of error bars will be reported.One of them shows the variation in load or displace-ment for similar samples undergoing the same loadingscenario. The second shows the displacement variationbetween several points tracked on the same sample. Thelatter is used to confirm that point tracking was done atreliable and robust locations such as at the cross-headand the supports where virtually no body displacementsoccur.
The impact experiments were performed at the CISASHVI Facility using a two-stage Light-Gas Gun (LGG)that can accelerate projectiles of mass up to 100 mg at atop speed of 6 km/s. For this research, Al-1100 spheresfrom 1.5 mm to 2.9 mm were launched at velocities be-tween 3 km/s - 5 km/s at a normal angle[15].
2.1 Three Point Bending
The 3PB samples are listed in Table 1 and their denom-inations are S1B 1-3. S stands for shield, B for bendingand 1-3 for the number of the printed specimen. Theyare the same in compression with C instead of B.
For these experiments, the point of interest is the sam-ple behaviour before failure and the overall stiffness andstrength information obtained from the force - displace-ment curve. The experimental results reported in Table
3 are averaged across the 3 samples of the single corru-gated shield.
Force displacement curves were obtained for all samplesand the experimental average as well as the data for allspecimens is shown in Figure 3. The averaged peak lo-cation is slightly different from what is reported in Table3 because the imaging force data is used instead of theInstron data. Moreover, samples of the same type havea different displacement at failure, so the peak load ofone sample will be averaged with off-peak loads from theother samples for the same displacement.
For all three specimens, the elastic part of the curveis close to linear and does not exhibit the step jumpsshowed by a sandwich panel with a printed honeycombcore as observed previously in [13].
Figure 3: Average force displacement curve for theshields in 3PB (left) and detailed curves for each speci-men (right). Imaging data only.
Figure 4: Sequential failure of sample S1B1 representedby Specimen 1 in the graph on the right of Figure 3
Sample Failure Load (N) Sample error (N)Y displacementat failure (mm) Sample error (mm) Image error (mm)
S1B 291.3121-13.983+13.516 2.2224
-0.1737+0.2049 ±0.0433
Table 3: Experimental results for 3PB
4

The only small jump indicative of a sequential failureof the sample occurs for specimen 3, but it is much lesspronounced compared with the honeycombs from [13].All S1B samples show a steep decrease in the load ap-plied after failure, denoting a clear 3PB loading peak.The consistency in the force displacement curves of allthree samples gives confidence in the robustness of the3PB behaviour of this type of shield. A representativefailure sequence of this shield type is shown in Figure 4.
The mass of the samples was recorded to produce spe-cific values which can then be compared to the resultsobtained for the baseline honeycomb structures[13]. Notethat HSNB stands for a standard honeycomb core sand-wich panel and HA0B stands for a sandwich panel withCFRP facesheets and a 3D printed core. HSNC andHA0C stand for the same, but in compression.
Sample
Averagesample
weight (g)
Samplestiffness(N/mm)
Samplespecific stiffness(N/(mm×g))
S1B 15.95 131.07996 8.21818HSNB 41.13 1827.304 44.42752HA0B 78.72 4541.178 57.6877
Table 4: Mass and stiffness of 3PB shield samples. Hon-eycomb data added for completion[13].
Based on data in Table 4, the simple corrugation is sig-nificantly outperformed by both honeycomb cores. Eventhe worst performing honeycomb structure, the standardHSNB, has a specific stiffness roughly 5 times that of thebest S1B specimen. This is expected since CFRP sand-wich constructions with honeycomb cores are very effec-tive in out-of-plane loading. The sandwich panel witha printed core (HA0B) outperforms both the printedshields and the standard core.
These results indicate that integrating corrugatedshields with honeycomb primary structures may lead toan overall lower specific stiffness of the structure. How-ever, note that the shields are entirely printed and fea-ture no CFRP face sheets. It would also be useful tocompare the two types of core geometry while havingsimilar facesheet properties.
2.2 CompressionThe compression samples are listed in Table 1. Resultsare reported in the same way as before. The bucklingload and displacement at failure under compression arepresented below in Table 5.
The relative movement of the support affected the verti-cal displacement results. A relatively small sample errorof about ± 0.05 mm becomes significant because the av-erage absolute displacement value is of the same magni-tude. In spite of these experimental difficulties, the dis-placement data for S1C samples is relatively consistentand displacement at failure varies by only 28% betweenthe extremes. Strength was measured more reliably andthe variation was of 23% between the highest and lowestbuckling load.
Figure 5: Force - displacement curves for S1C samples.Imaging data only.
The force - displacement curves look similar to those forhoneycombs under compression[13] since they have com-mon sources of experimental error such as significantrelative movement of the sample support.
Sample Buckling Load (N) Sample error (N)Y displacementat failure (mm) Sample error (mm) Image error (mm)
S1C 3481.8399-570.46+303.16 0.2528567
-0.04+0.041 ±0.0519
Table 5: Experimental results for compression
5
Force-displacement plots, obtained from Instron ma-chines, have smooth curves up to the peak, while theimaging plots presented in Figure 5 feature regions wherethe curve crosses itself as displacement decreases insteadof increasing. While the data might seem unreliable,it can be observed that the curves do behave similarlyshowing consistency in their experimental behaviour.
There is also a geometrical aspect which can explain thedisplacement trend observed. For all shields, the cor-rugations make a 450 angle with the facesheets. Whencompressed, the shields naturally want to maintain thatinclination with respect to the facesheets. As a result,as the corrugations get more compressed and this an-gle becomes smaller, the top and bottom faces will de-flect upwards and downwards respectively, in an attemptto maintain the 450 angle. This results in a cubic de-flection of the top and bottom surfaces between everytwo vertices. This geometrical aspect coupled with thenon-ideal experimental setup makes the shield facesheetsslightly deflect in the opposite direction to what was ex-pected and this might partly account for the unusualforce - displacement curves.
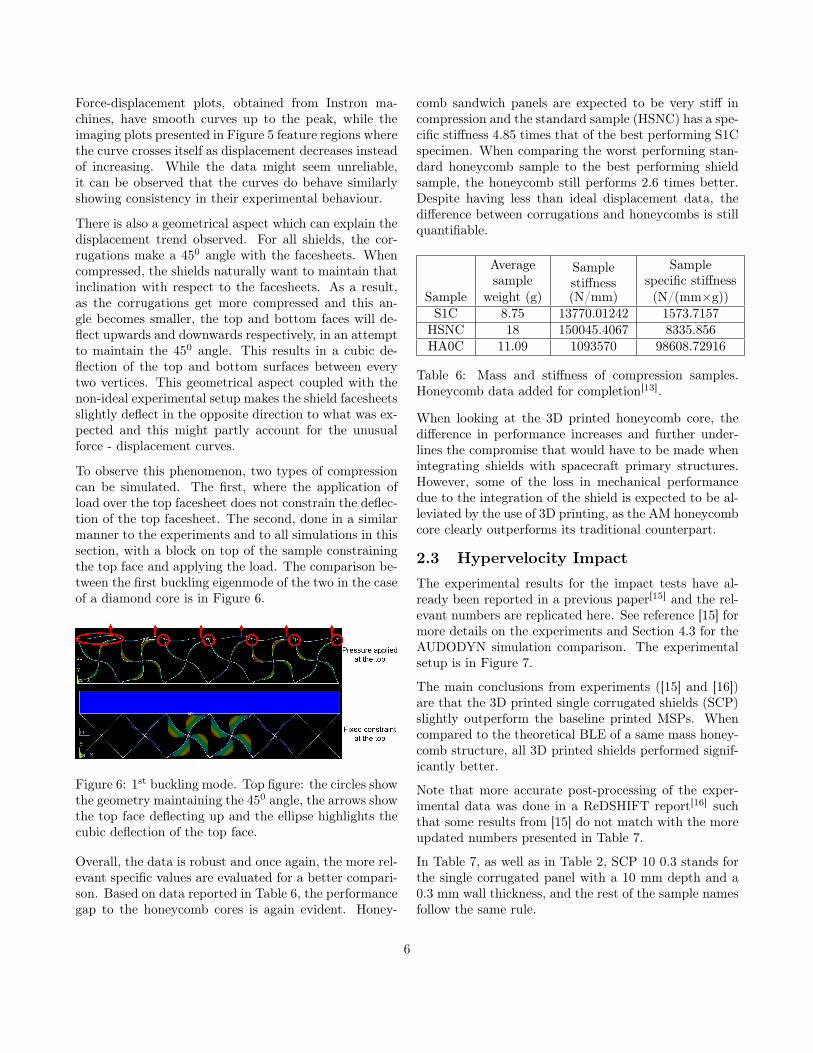
To observe this phenomenon, two types of compressioncan be simulated. The first, where the application ofload over the top facesheet does not constrain the deflec-tion of the top facesheet. The second, done in a similarmanner to the experiments and to all simulations in thissection, with a block on top of the sample constrainingthe top face and applying the load. The comparison be-tween the first buckling eigenmode of the two in the caseof a diamond core is in Figure 6.
Figure 6: 1st buckling mode. Top figure: the circles showthe geometry maintaining the 450 angle, the arrows showthe top face deflecting up and the ellipse highlights thecubic deflection of the top face.
Overall, the data is robust and once again, the more rel-evant specific values are evaluated for a better compari-son. Based on data reported in Table 6, the performancegap to the honeycomb cores is again evident. Honey-
comb sandwich panels are expected to be very stiff incompression and the standard sample (HSNC) has a spe-cific stiffness 4.85 times that of the best performing S1Cspecimen. When comparing the worst performing stan-dard honeycomb sample to the best performing shieldsample, the honeycomb still performs 2.6 times better.Despite having less than ideal displacement data, thedifference between corrugations and honeycombs is stillquantifiable.
Sample
Averagesample
weight (g)
Samplestiffness(N/mm)
Samplespecific stiffness(N/(mm×g))
S1C 8.75 13770.01242 1573.7157HSNC 18 150045.4067 8335.856HA0C 11.09 1093570 98608.72916
Table 6: Mass and stiffness of compression samples.Honeycomb data added for completion[13].
When looking at the 3D printed honeycomb core, thedifference in performance increases and further under-lines the compromise that would have to be made whenintegrating shields with spacecraft primary structures.However, some of the loss in mechanical performancedue to the integration of the shield is expected to be al-leviated by the use of 3D printing, as the AM honeycombcore clearly outperforms its traditional counterpart.
2.3 Hypervelocity ImpactThe experimental results for the impact tests have al-ready been reported in a previous paper[15] and the rel-evant numbers are replicated here. See reference [15] formore details on the experiments and Section 4.3 for theAUDODYN simulation comparison. The experimentalsetup is in Figure 7.
The main conclusions from experiments ([15] and [16])are that the 3D printed single corrugated shields (SCP)slightly outperform the baseline printed MSPs. Whencompared to the theoretical BLE of a same mass honey-comb structure, all 3D printed shields performed signif-icantly better.
Note that more accurate post-processing of the exper-imental data was done in a ReDSHIFT report[16] suchthat some results from [15] do not match with the moreupdated numbers presented in Table 7.
In Table 7, as well as in Table 2, SCP 10 0.3 stands forthe single corrugated panel with a 10 mm depth and a0.3 mm wall thickness, and the rest of the sample namesfollow the same rule.
6

Sample Code
Mean ArealDensity(kg/m2)
Proj D(mm)
Velocity(km/s)
SamplePerforation(Yes/No)
Front PlateHole Diameter
(mm)
Back Plate HoleEquivalent Diameter
(mm)SCP 10 0.3 A03-01 3.97 1.5 4.44 Yes 3.28 8.5SCP 10 0.3 A03-02 3.97 2.9 4.54 Yes 6 11.7SCP 10 0.7 A04-01 5.31 1.5 4.84 No 4.3 N/AMSP 10 A05-01 3.58 1.5 4.49 Yes 2.8 11.7MSP 20 A06-01 3.5 1.5 4.79 Yes 3 ?MSP 20 A06-02 3.5 2.9 4.6 Yes 4.5 38.8
SCP 20 0.3 A08-01 4.03 1.5 4.7 No 4.1 N/ASCP 20 0.7 A09-02 5.42 2.9 4.87 Yes 5.9 27.9
Table 7: HVI corrugated shields experimental results from ReDSHIFT[15][16]
Figure 7: Test setup for the HVI experiments[15]
3 THEORYThe theoretical models that are used as the basis forcalculations in this section, are briefly summarized here.Note that due to the thin walls of the printed structures(300 µm) significant porosity was found in all samples.Micromechanics based models had to be used to obtainan accurate value for the apparent Young’s Modulus andshear modulus of the printed material. This approach isdiscussed in [13] and it is also applied here for all mate-rial properties used in both theory and simulation.
For the 3PB strength solution, the work by Valdevit,Hutchnison and Evans[17][18] was referred to. It studiesboth transverse and longitudinal loading of a corrugated
core. This approach identifies the main failure modesand provides calculations for the sample failure load foreach mode. Note that for transverse loading this workrelies on buckling coefficients that stem from the formu-las developed by Bazant and Cedolin[19]. For stiffnesscalculations sandwich beam bending theory is adaptedto obtain mid-span deflection.
In compression, the analysis given by Cote[20] relies onthe Euler elastic buckling and Shanely[21] plastic bifur-cation stresses. It gives the apparent Young’s Modulusof both a simple corrugation (S1C) and a diamond corewhich in turn provides the sample displacement undera compressive load as well as the peak compressive andtransverse shear strengths of the corrugated core.
For HVI there is currently no dedicated BLE for corru-gated cores and as a result, during ReDSHIFT, scaledversions of existing BLEs were used. They have beenmentioned in[15] and are not discussed here.
Based on the theoretical models developed in the papersmentioned, a set of theoretical predictions can be puttogether for all samples listed in Sections 2.1 and 2.2.
For 3PB the failure load for all failure modes can beobtained and the mode with the lowest predicted loadis compared to the experimental result. On the stiffnessside, note that the core second moment of area is ac-counted for in the mid-span displacement bending termbecause the assumption that the facesheets are signifi-cantly stiffer than the core no longer holds. The resultsfor S1B specimens are shown in Table 8.
SampleFace
Yield (N)Core
Yield (N)Core Yield withLocal Indent (N)
FaceBuckling
(N)
CoreBuckling
(N)Core Buckling withLocal Indent (N)
Deflection(mm)
S1B 227.16 222.76 157.92 82.442 402.95 1937.2 1.595
Table 8: Theoretical Predictions for 3PB corrugation samples. Relevant results in bold.
7

For S1B specimens the failure mode is predicted cor-rectly. Theory predicts face buckling, followed by coreyield with local indentation. In real life the failure modeis a combination of the two as can be observed in Figure3. In 3PB, the theory has qualitative value in predictingexperimental outcomes, even for a 3D printed samplewith relatively thin walls.
Quantitatively, the theory underpredicts the experimen-tal failure load by 84.5 - 253% for S1B specimens (FaceBuckling and Core Yield with Local Indentation valuesconsidered). The strength theoretical results rely heav-ily on assumptions for the corrugation faces end con-straints. In longitudinal loading which is relevant forS1B, for buckling, the simply supported boundary con-dition is used as it is closer to reality. However, it isknown that the actual end constraint is between simplysupported and fully clamped, so the buckling load will beunderpredicted. As a result, it makes sense for theoryto underpredict failure loads in 3PB and these resultsare a confirmation that better understanding is neededregarding the end constraints for this type of structure.
In terms of displacement, the S1B predicted mid-spandeflection at failure is underpredicted by 28.3% on aver-age. This relation to the experimental data is expectedgiven that the real samples will have defects.
In compression, given the imperfections and slightasymmetries in the final structure, it is expected that thetheory would overpredict the buckling load for all sam-ples. Based on the results in Table 9, on the average,the experimental elastic buckling load is overpredictedby 137%. This is a significant improvement when com-pared with the predictions for the 3D printed honeycombfrom [13]. This can be due to the opposing assumptionsregarding core - facesheet interface boundary conditionsfor the two analyses. For the honeycomb, the core wallsconstraint was overpredicted as fully clamped, while forthe corrugation it is underpredicted as pin jointed. How-ever, even though this boundary condition clearly leadsto underprediction compared to the experimental case,the buckling loads are still overpredicted. This is a con-firmation of the fact that the effects of sample imper-fections, such as pores, on the effective wall thicknessare not fully understood and are not accounted for inthe theory. All in all, the theory is close to reality bothquantitatively and qualitatively, but improvements doneed to be made to account for more 3D printed mate-rial imperfections.
In terms of sample stiffness, the theoretical shield dis-placement at the buckling load is significantly underpre-
dicted compared to experimental data.
SampleElastic Buckling
Load (N)
Deflection atExperimental Failure
(mm)S1C 8267.25 0.01128
Table 9: Theoretical predictions for compression corru-gation samples
This is expected because the real samples have impor-tant defects including a bottom facesheet that is notperfectly level, while in theory all joins and surfaces areideal. However, the theoretical results for S1C give atheoretical displacement just 11.2% lower than the sim-ulated value (presented in Section 4.2) which is the morerelevant data to compare the theory with. This is a sat-isfactory outcome which underlines the departure of theexperimental setup from the ideal situation.
4 SIMULATION RESULTSStructural simulations of the shield were performedwithin ANSYS APDL using Shell 281 elements, for the3D printed shields and Solid 186 elements for the sup-port and cross-head in 3PB and for the block loadingthe sample in compression. A friction coefficient of 0.15was applied between the sample and the support andcrosshead in 3PB. For more in depth explanations intohow the static FEA models were constructed please re-fer to [13] since it is concerned with the sandwich panelsimulations that were built in the same way as the cor-rugation models.
4.1 Three Point BendingA half model was used to simplify the model. Applyingsymmetry on the X-Y plane (as shown in Figure 8) fora quarter model caused issues so the option was disre-garded.
A mesh convergence study was performed with the verti-cal displacement change being the variable used to assessconvergence. The element size of the core faces dependson the corrugation size, while the element size of thecorrugation in the transverse direction depends on theelement size of the facesheets. The sizes used for thefacesheets and the core have to be exact fractions ofeach other in order for all corrugation end nodes to bemerged to the facesheet nodes. The following elementsizes are used for S1B after observing that results varyby less than 0.4% when decreasing element size by afurther 33%:
8

• Corrugations: 0.5 mm x 0.83625 mm, where thelatter is a 16th of the corrugation width.
• Top/bottom/middle facesheets: 0.5 mm x 2.23mm, where the latter is a 6th of the corrugationwidth.
Figure 8: Meshed FEA model of the S1B sample
With the setup shown in Figure 8 the results are:
Sample
Vericaldisplacement
(mm)
Samplestiffness(N/mm)
Samplespecific stiffness(N/(mm×g))
S1B 1.545 188.551 11.821
Table 10: Simulation results for 3PB shield samples
The simulations underpredict the vertical displacementby 30% at the average experimental failure load. The dif-ference between the theoretical prediction and the simu-lation result is around 3% which shows good consistencybetween the two idealized calculations and gives confi-dence in being able to scale simulation results reliablyand predict future experimental outcomes for this typeof structure. The variation between FEA and reality canbe down to multiple factors including the perfect bondsin the simulated part, the imperfections of the printedpart and the complex effects of porosity on sample fail-ure.
4.2 CompressionAs the compression samples are smaller and not verycomputationally intensive, the full model was used in-stead of a half or a quarter model. The element size de-pendency on various sample dimensions is the same asbefore. A mesh convergence study showed that both thebuckling load and the vertical displacement change by
less than 0.1% when decreasing the element sizes listedbelow by 50%:
• Corrugations: 1.111 mm which represents a 12th
of the corrugation width.
• Top/bottom/middle facesheets: 1.111 mm x 1.666mm, the two representing a 12th and an 8th of thecorrugation width.
The results with this setup can be seen in Table 11.The buckling load predicted by simulations is 3.65 timeshigher than the experimental results. As with all printedsamples, there are significant local imperfections andglobal asymmetries which lower the experimental buck-ling load, which means that the simulation results areas expected. Sample height and boundary conditions ofthe ends of the free sections ultimately determine thebuckling behavior of the sample. In the FEA model thevertex where the corrugated sections meet the facesheetsgives perfect support to the core members, while in reallife that might not be the case due printing faults.
Sample
ElasticBucklingLoad (N)
Vertical Displacementat ExperimentalBuckling (mm)
S1C 12705.5 0.0127
Table 11: Simulation results for compression shields
Figure 9: Failure of a S1C sample. During compressionthe sample support deflects up towards the sample andas the sample fails, it also slides laterally on the support.
In terms of sample displacement at the experimentalbuckling load, S1C is 20 times stiffer than its experi-mental counterparts. S1C transmits the loads from thevolume pressing on the sample to the corrugated facesthat press on the bottom face which is in contact withthe support, giving a very stiff setup in an ideal situ-ation. However, there are many factors affecting thedisplacement data: moving fixtures, the samples slidingand sample asymmetries. Put together they significantlyincrease the sample displacement at failure as seen in
9

Figure 9 where sample imperfections are clearly visibleespecially close to the edges.
All in all, the compression model offers a good compar-ison to both theory and experiments and it outlines thegeometrical aspects that lead to the discrepancies ob-served.
4.3 Hypervelocity Impact
Hypervelocity impacts depart significantly from thequasi-static loading scenarios investigated up to thispoint, so a different method is needed to build the sim-ulation models and the new setup is described here.
4.3.1 Software and Computational Method
AUTODYN was chosen as the simulation software sinceit is the most frequently used and reliable commerciallyavailable software. For this research it was accessedthrough the ANSYS WorkBench package. The compu-tation technique is also different from standard FE codeswhich split the parts in a mesh which can cause issueswhen dealing with situations where large deformationsare involved. The main problems are mesh tangling anddistortion which then lead to the need for unphysicalerosion algorithms to delete the problematic mesh ele-ments. The method used to bypass these issues and theneed for a numerical grid to calculate spatial derivativesis the smoothed particle hydrodynamic (SPH) technique.It is a meshless Lagrangian technique that was first pro-posed in 1977 for applications in astrophysics and hassince developed into a mature way to deal with impactproblems[22].
4.3.2 Impact Location
When using standard Whipple shields, the impact lo-cation across the shield is irrelevant because the shieldhas the same properties throughout. When corrugationsare included, the impact changes when the strike loca-tion along the corrugation wall changes. There are threemain impact locations to consider: the top, middle andbottom of the corrugated geometry. When the impactorhits the top of the corrugation, it will lose more energyin the initial impact, but it will encounter fewer indi-vidual impacts across the shield depth which may bedetrimental. When it hits in the middle, the number ofindividual impacts is maximized. When it hits the bot-tom, the impactor is allowed to disperse more after theinitial facesheet contact, but the number of individualimpacts is once again at a minimum.
Photos taken during the impact event are available formost experimental samples such that the approximateimpact location can be determined. For all shields thatcontain corrugations, simulations are run for all threeimpact locations to validate the models used. This alsohas an effect on the symmetry of the problem becausethe top and bottom impacts are symmetric across 2planes (XZ and XY), while the middle impact is onlysymmetric across the XY plane. See Figure 10 for axes.
4.3.3 Reducing Computational Time
Due to the fact that the corrugations have to be mod-elled accurately to be able to replicate the experimen-tal results, 3D models are needed. Axisymmetry doesnot apply to corrugated geometries so 2D models can-not be considered. In order to minimize the computa-tional time, SPH particles are used only in the projectileand in the shield sections that are directly in the pathof the projectile, while Lagrangian volume elements areused away from the impact zone. The back facesheet isalso made up of Lagrangian volume elements in order tomodel its deformation more accurately. Moreover, eithera quarter or a half model is used depending on impactlocation and what symmetries apply.
In terms of element size, it is advisable to use around 10SPH particles per facesheet thickness[23]. Keeping com-putational cost in mind, an SPH particle size of 0.075mm was used for all walls, apart from the 0.7 mm thickcorrugation walls where a particle size of 0.1 mm wasapplied. This gave between 5 and 7 SPH particles perwall thickness which was deemed enough to give a realis-tic energy transfer while keeping the computational costwithin reason. The Lagrangian volume elements have a0.05 mm element size through thickness and 0.2 mm inthe in plane directions. The impactor has an SPH parti-cle size of 0.075 mm, equal to that of the top facesheet.
Erosion is needed in all Lagrangian volume elements toremove distorted elements before they become degen-erate. It can also be used to allow the simulation ofmaterial fracture, cutting and penetration. The higherthe impact velocity, the higher the erosion strain recom-mended for use. For impacts up to 5 km/s, applying ero-sion at a geometric strain of 150% is common practice.At higher velocities, the geometric strain could reach300% before the element should be eroded[24]. Whileerosion is not a physical process, if used with care it canlead to an accurate solution while preventing elementsfrom becoming degenerate. In this set of simulationsalthough the impact velocity is below 5 km/s, a highgeometric strain of 500% is used on all volume elements
10

in order to minimize erosion.
Figure 10: HVI model of the A03-01 single corrugatedshield with a middle corrugation impact location. Z axisthrough page.
4.3.4 Material Models
The impactor is made up of Al 1100, a standard ma-terial whose HVI model can be found in the AUTO-DYN library. The shields are made up of 3D printedAlSi10Mg which is yet to be tested for detailed thermaland shock properties, especially at low wall thicknesses.Three major material inputs for the printed AlSi10Mgare needed: equation of state (EOS), strength model andfailure model.
The EOS is needed to relate stress to deformation, inter-nal energy and temperature. Strength gives the plastic-ity model that relates stress and strain. Failure is neededto recognize when tensile limits are reached to modifythe computation to avoid unphysical solutions[25].
After a survey of the models available for EOS, strengthand failure, the most appropriate combination was foundto be a shock EOS, the Johnson Cook strength modeland plastic strain failure. The actual inputs are a mixof contributions from the 3D printed AlSi10Mg materialdata sheet[14], the porosity models developed in [13] andimpact data from previously tested isotropic AluminiumAlloys. These inputs are listed in Table 12 and one of
the goals of this paper is to validate their use.
Equation of State ShockReference Density 1.25 (g/cm3)
Gruneisen coefficient 1.6 (none)Parameter C1 3373 (m/s)Parameter S1 1.3 (none)
Reference Temperature 293 (K)Specific Heat 900 (J/kgK)
Failure Model Plastic StrainPlastic Strain 0.035 (none)
Strength Model Johnson CookShear Modulus 6.5385 e6 (kPa)Yield Stress 2.5 e5 (kPa)
Hardening Constant 3 e5 (kPa)Hardening Exponent 0.35 (none)Strain Rate Constant 0.015 (none)
Thermal Softening Exponent 1 (none)Melting Temperature 600 (K)Ref. Strain Rate (/s) 1 (none)
Table 12: 3D Printed AlSi10Mg material properties usedfor the present set of HVI simulations
Note that [15] mentions a 10% average porosity level forthe shields tested, while the model used and described inTable 12 uses properties scaled for 50% porosity. Thisis because the average porosity of the samples investi-gated in [13] is reliably obtained to be 50% based onArchimedes’ method, while the areal densities reportedin [15] require more analysis. It is agreed that poros-ity varies with wall thickness and that the porosity levelfound in [13] is accurate only for a thickness of 0.3 mm.However, the relation between print thickness and poros-ity level is unknown at the moment for AlSi10Mg andthe present material model will be improved once this re-lation is obtained and different porosities can be appliedfor the 0.3 mm, 0.5 mm and 0.7 mm walls.
4.3.5 Results
As mentioned, for all corrugated shields three simula-tions were run, one for each impact location: corrugationtop, middle and bottom. As a result, 18 3D HVI simu-lations were run in total: three for the baseline printedMSP samples and 15 for the corrugated shields. Thetotal simulation time was 787 hours with five to six sim-ulations running simultaneously at 50% efficiency on aDell XPS 15 9560 with an Intel Core i7-7700 HQ CPU2.8 GHz with 4 cores and 32 GB RAM.
The simulation results are presented in Table 13 in direct
11
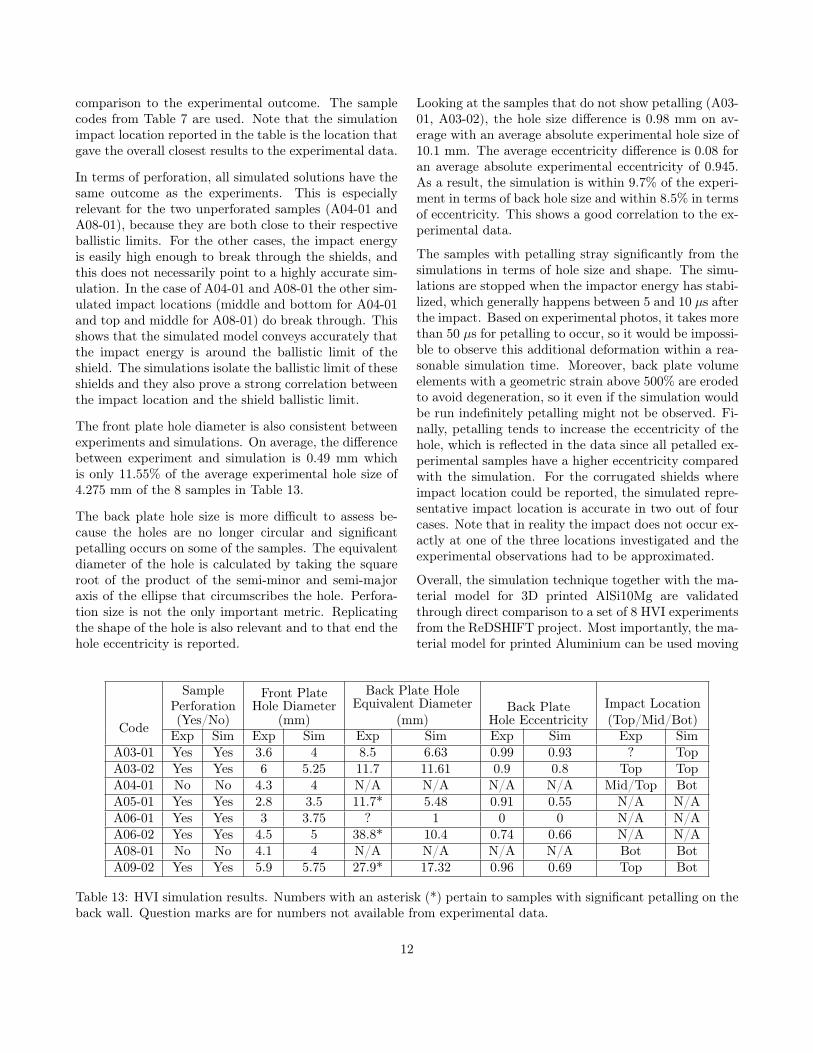
comparison to the experimental outcome. The samplecodes from Table 7 are used. Note that the simulationimpact location reported in the table is the location thatgave the overall closest results to the experimental data.
In terms of perforation, all simulated solutions have thesame outcome as the experiments. This is especiallyrelevant for the two unperforated samples (A04-01 andA08-01), because they are both close to their respectiveballistic limits. For the other cases, the impact energyis easily high enough to break through the shields, andthis does not necessarily point to a highly accurate sim-ulation. In the case of A04-01 and A08-01 the other sim-ulated impact locations (middle and bottom for A04-01and top and middle for A08-01) do break through. Thisshows that the simulated model conveys accurately thatthe impact energy is around the ballistic limit of theshield. The simulations isolate the ballistic limit of theseshields and they also prove a strong correlation betweenthe impact location and the shield ballistic limit.
The front plate hole diameter is also consistent betweenexperiments and simulations. On average, the differencebetween experiment and simulation is 0.49 mm whichis only 11.55% of the average experimental hole size of4.275 mm of the 8 samples in Table 13.
The back plate hole size is more difficult to assess be-cause the holes are no longer circular and significantpetalling occurs on some of the samples. The equivalentdiameter of the hole is calculated by taking the squareroot of the product of the semi-minor and semi-majoraxis of the ellipse that circumscribes the hole. Perfora-tion size is not the only important metric. Replicatingthe shape of the hole is also relevant and to that end thehole eccentricity is reported.
Looking at the samples that do not show petalling (A03-01, A03-02), the hole size difference is 0.98 mm on av-erage with an average absolute experimental hole size of10.1 mm. The average eccentricity difference is 0.08 foran average absolute experimental eccentricity of 0.945.As a result, the simulation is within 9.7% of the experi-ment in terms of back hole size and within 8.5% in termsof eccentricity. This shows a good correlation to the ex-perimental data.
The samples with petalling stray significantly from thesimulations in terms of hole size and shape. The simu-lations are stopped when the impactor energy has stabi-lized, which generally happens between 5 and 10 µs afterthe impact. Based on experimental photos, it takes morethan 50 µs for petalling to occur, so it would be impossi-ble to observe this additional deformation within a rea-sonable simulation time. Moreover, back plate volumeelements with a geometric strain above 500% are erodedto avoid degeneration, so it even if the simulation wouldbe run indefinitely petalling might not be observed. Fi-nally, petalling tends to increase the eccentricity of thehole, which is reflected in the data since all petalled ex-perimental samples have a higher eccentricity comparedwith the simulation. For the corrugated shields whereimpact location could be reported, the simulated repre-sentative impact location is accurate in two out of fourcases. Note that in reality the impact does not occur ex-actly at one of the three locations investigated and theexperimental observations had to be approximated.
Overall, the simulation technique together with the ma-terial model for 3D printed AlSi10Mg are validatedthrough direct comparison to a set of 8 HVI experimentsfrom the ReDSHIFT project. Most importantly, the ma-terial model for printed Aluminium can be used moving
Code
SamplePerforation(Yes/No)
Front PlateHole Diameter
(mm)
Back Plate HoleEquivalent Diameter
(mm)Back Plate
Hole EccentricityImpact Location(Top/Mid/Bot)
Exp Sim Exp Sim Exp Sim Exp Sim Exp SimA03-01 Yes Yes 3.6 4 8.5 6.63 0.99 0.93 ? TopA03-02 Yes Yes 6 5.25 11.7 11.61 0.9 0.8 Top TopA04-01 No No 4.3 4 N/A N/A N/A N/A Mid/Top BotA05-01 Yes Yes 2.8 3.5 11.7* 5.48 0.91 0.55 N/A N/AA06-01 Yes Yes 3 3.75 ? 1 0 0 N/A N/AA06-02 Yes Yes 4.5 5 38.8* 10.4 0.74 0.66 N/A N/AA08-01 No No 4.1 4 N/A N/A N/A N/A Bot BotA09-02 Yes Yes 5.9 5.75 27.9* 17.32 0.96 0.69 Top Bot
Table 13: HVI simulation results. Numbers with an asterisk (*) pertain to samples with significant petalling on theback wall. Question marks are for numbers not available from experimental data.
12

forward to develop novel shield designs that can alsoundertake structural functions. Future testing to obtainmore accurate shock properties for AlSi10Mg and otherprinted materials is still needed and more impact exper-imental samples from ReDSHIFT will be modelled, butthis is a strong starting point.
5 RESULTS CONCLUSION
A summary of the relation between experimental resultsand theoretical/simulation predictions for the staticloading cases is given in Table 14.
On average, for the SCP in bending, both theory andsimulation predict a sample deflection around 29.5% lessthan the experimental value. Theory and simulationproduce very similar results which gives confidence thatsample performance on paper can be scaled reliably topredict experimental results.
In compression, both theory and simulation overpredictthe experimental buckling load as they represent ideal-ized versions of the real experiment. The theory assumesthat corrugation members are built in, while the simula-tion similarly features perfect bonds between the struts.The theoretical buckling load is, on average, within 35%of the simulated value which shows reasonable agreementbetween the two idealized calculations.
In terms of compression sample stiffness, both theoryand simulation significantly underpredict vertical dis-placement at failure. The relative movement of the ex-perimental setup coupled with manufacturing faults inthe printed shields lead to a much lower sample stiff-ness compared to the ideal cases. The positive aspect isthat theory and simulation agree very well for S1C. Thiscomparison is also reported in Table 14 and it shows thattheory is within around 10% of the simulated value.
The HVI simulations are compared to the experimentalresults from five major points of view: sample perfo-ration, front and back plate hole diameter, back holeeccentricity and predicted impact location. All five gavesatisfactory results since the sample perforation is pre-dicted correctly for all samples, the impact location ispredicted well in two out of four cases, the front platehole diameter is within 11.55% of the experimental value,the non-petalled back hole size is within 9.7% and theeccentricity within 8.5%. The material model used forAlSi10Mg is validated together with the computationtechnique and model setup used.
Overall, both theory and simulation replicate experi-
mental results well and give a robust set of idealizeddata that can be later developed and extrapolated fornovel designs. While sample porosity is accounted forin the values of Young’s modulus and shear modulus, abetter understanding regarding the effect of porosity onthe effective load bearing thickness of the printed shieldwalls is needed together with a relation between wallthickness and porosity level.
Sample Theoretical Values Simulation ValuesS1B ∆yth = 0.7177 × ∆yexp ∆ysim = 0.6952 × ∆yexp
S1C
∆yth = 0.0446 × ∆yexp
∆yth = 0.888 × ∆ysimFth = 2.3744 × Fexp
∆ysim = 0.05 × ∆yexp
Fsim = 3.65 × Fexp
Table 14: Theoretical and simulation results comparisonto experimental data
To conclude, this investigation provides insight into thestructural and shielding performance of 3D printed cor-rugated orbital debris shields through direct compari-son to both standard and printed CFRP Al honeycombcores. In both bending and compression the shields per-form worse than either honeycomb which underlines thecompromise that may have to be made when integratingshields with spacecraft primary structures. Moreover,the shielding performance of the printed corrugationsis explored and it is underlined that corrugated shieldsgenerally perform similarly or slightly outperform sim-ilar areal density printed MSPs. A material model forAlSi10Mg and a simulation method are proposed andvalidated for further use, with the caveat that when databecomes available the material model should be changedfor each wall thickness. Real life shock testing for theprinted material is also needed for more accurate simula-tion solutions, while manufacturing inconsistencies andsample defects need to be addressed to obtain consistentprints of valuable structural and shielding performance.
Acknowledgements
The experimental work reported was funded through theEuropean Commission Horizon 2020, Framework Pro-gramme for Research and Innovation (2014-2020), underthe ReDSHIFT project (grant agreement n. 687500).
6 References
[1] Whipple F.L. Meteorites and space travel. AJ,52:131, 1947.
13

[2] Cour-Palais B. Meteoroid protection by multiwallstructures. In Hypervelocity Impact Conference,page 372, 1969.
[3] Christiansen E. Advanced meteoroid and debrisshielding concepts. In Orbital Debris Conference:Technical Issues and Future Directions, page 1336,1990.
[4] Christiansen E.L. Design and performance equa-tions for advanced meteoroid and debris shields. In-ternational Journal of Impact Engineering, 14(1-4):145–156, 1993.
[5] Christiansen E.L. and Kerr J.H. Ballistic limitequations for spacecraft shielding. InternationalJournal of Impact Engineering, 26(1-10):93–104,2001.
[6] Schonberg W.P. and Tullos J.R. Spacecraft wall de-sign for increased protection against penetration byorbital debris impacts. AIAA journal, 29(12):2207–2214, 1991.
[7] Zhou H., Guo R., and Liu R. Protection propertiesof stuffed corrugated sandwich structures under hy-pervelocity impact: Numerical simulation. Journalof Sandwich Structures & Materials, 21(2):532–551,2019.
[8] Reimerdes H.G., Noelke D., and Schäfer F. Mod-ified Cour-Palais/Christiansen damage equationsfor double-wall structures. International journal ofimpact engineering, 33(1-12):645–654, 2006.
[9] Taylor E.A., Herbert M.K., Vaughan B.A.M., andMcDonnell J.A.M. Hypervelocity impact on car-bon fibre reinforced plastic/aluminium honeycomb:comparison with Whipple bumper shields. Interna-tional Journal of Impact Engineering, 23(1):883–893, 1999.
[10] Kinslow R. and Gehring J. W. High-velocity im-pact phenomena, Chapter IX: Engineering Consid-erations. Elsevier, 1970.
[11] Jex D.W., Mac Kay C.A., and Miller A.M. Thecharacteristics of penetration for a double-sheetstructure with honeycomb. 1970.
[12] Revolutionary Design of Spacecraft through Holis-tic Integration of Future Technologies. https://cordis.europa.eu/project/id/687500, Jan2016.
[13] Dumitrescu A., Walker S.J.I., Romei F., and Ba-haskar A. The structural assessment of sandwich
panels with 3D printed cores for spacecraft applica-tions. In European Conference on Spacecraft Struc-tures, Materials and Environmental Testing (EC-SSMET), 2021.
[14] Olivieri L., Giacomuzzo C., Sarego G., andFrancesconi A. ReDSHIFT - 3D Printing DesignStrategy. Technical report, 2019.
[15] Olivieri L., Giacomuzzo C., Francesconi A., GeradinS., Bagatin M., Paccagnella A., Finozzi A., StokesH., Romei F., Walker S.J.I., et al. Experimentalcharacterization of multi-layer 3D-printed shieldsfor microsatellites, Paper IAC-18, A6, 3, 7. In 69thInternational Astronautical Congress (IAC), Bre-men, Germany, pages 1–5, 2018.
[16] Romei F., Rumpf C., and Walker S.J.I. ReDSHIFT- Hypervelocity Impact Test Analysis. Technical re-port, 2019.
[17] Valdevit L., Hutchinson J.W., and Evans A.G.Structurally optimized sandwich panels with pris-matic cores. International Journal of Solids andStructures, 41(18-19):5105–5124, 2004.
[18] Valdevit L., Wei Z., Mercer C., Zok F.W., andEvans A.G. Structural performance of near-optimal sandwich panels with corrugated cores.International Journal of Solids and Structures,43(16):4888–4905, 2006.
[19] Cedolin L. et al. Stability of structures: elastic,inelastic, fracture and damage theories. World Sci-entific, 2010.
[20] Côté F., Deshpande V.S., Fleck N.A., and EvansA.G. The compressive and shear responses of corru-gated and diamond lattice materials. InternationalJournal of Solids and Structures, 43(20):6220–6242,2006.
[21] Shanley F.R. Inelastic column theory. Journal ofthe aeronautical sciences, 14(5):261–268, 1947.
[22] Zhou H., Guo R., and Liu R. Protection propertiesof stuffed corrugated sandwich structures under hy-pervelocity impact: Numerical simulation. Journalof Sandwich Structures & Materials, 21(2):532–551,2019.
[23] Wicklein M., Ryan S., White D.M., and Clegg R.A.Hypervelocity impact on CFRP: testing, materialmodelling, and numerical simulation. InternationalJournal of Impact Engineering, 35(12):1861–1869,2008.
14

[24] Hayhurst C.J., Ranson H.J., Gardner D.J., andBirnbaum N.K. Modelling of microparticle hyper-velocity oblique impacts on thick targets. Interna-
tional journal of impact engineering, 17(1-3):375–386, 1995.
[25] ANSYS. Explicit Dynamics Analysis Guide, 2019.
15