Embed Size (px)
Citation preview
Structural and Wetting Studies of Visible Light Active TiO2
Thin Films
By
Madhusmita Sahoo
(Enrolment No. PHYS 02 2011 04 014 )
Indira Gandhi Centre for Atomic Research, Kalpakkam, India.
A thesis submitted to the
Board of Studies in Physical Sciences
in partial fulfillment of requirements
for the Degree of
DOCTOR OF PHILOSOPHY
of
HOMI BHABHA NATIONAL INSTITUTE
July, 2018

Chapter 0
ii


'
&
$
%
Dedicated To
Lord Jagannath
v
Acknowledgments
It is a pleasure to express my sincere and heartfelt gratitude to Dr. Tom Mathews
for his excellent guidance and encouragement. His attention to details have helped
me improve my skills in writing and comprehension. His cool persona and ability to
think out of the box is something I would like to emulate. It is a pleasure to work
with him and push beyond the limit to achieve superior scientific goals. I would like
to express my heartfelt gratitude to Dr. Tripura Sundari, who devoted her precious
time to read through a part of my thesis. Apart from that i will always remain
indebted to her for all her support in personal space, which made my life easier at
a distant place away from my hometown. I am thankful and find myself extremely
lucky to have interacted with few great and dedicated researchers during the course
of my Ph.D work. Dr Sivakumar’s mathematical skills to explain complex equations
in simpler terms has left me amazed and helped me sail through crucial junctures of
data analysis. I am thankful to Dr Ashok ku Yadav, who guided me through the XAS
analysis even in night, without whom this thesis would not have become a reality. His
scientific temperament is something which i would like to imitate. I appreciate the
friendly nature of Dr S N Jha and Dr Dibyendu Bhattacharya who encouraged me to
explore synchrotron studies and extended beam time to conduct the experiments. I
remain thankful to both of them.I am grateful to Dr S Raju for discussing research
ideas with me which enabled me to frame my research work. I would like to extend my
sincere thanks to the doctoral committee members Dr. M kamaruddin, Dr Arindam
Das, Dr H.N Jena, Dr S Dhara for their comments and suggestions. I would like to
thank Prof. N. V. Chandra Shekar, Dean and Prof. B. V. R. Tata, former Dean,
Physical Sciences for their support.
I thank my juniors, whose presence in the lab and township made my stay pleasant.
My special thanks to Subrata Ghosh, Soumee Chakraborty, Herojit loushambam,
Santanu Parida, Padmalochan Panda for proof reading my manuscripts and thesis. I
vi

thank all my co-authors for their suggestion and timely review of manuscripts. I thank
my friends Vinita Daiya, Molly Mehra from other groups whose presence helped me
relieve stress.
I am indebted to all my teachers for their excellent teaching and support. Above all
I thank my friends and foe alike for teaching me lessons of life. I would also like to
thank the office staff members of MSG for their help. I thank all, who have helped
me in carrying out my research in a meaningful way.
I thank our present group direct Dr G Amarendra and our previous group director
Dr C S Sundar for their support.
vii
Synopsis
TiO2 exists in three phases: anatase, brookite and rutile. Anatase and rutile are
the common polymorphs of synthetic TiO2. Experimental data on TiO2 brookite is
limited due to its rareness and difficulty in preparation. Among rutile and anatase,
anatase has been found to have a wider applicability with optimum performance
in the fields of photo-catalysis,1 solar cell,2 gas sensors,3 hydrophobic -hydrophilic
switching coatings,4 antimicrobial coatings etc.5 Since for all practical purposes rutile
and anatase phase occur commonly, it is prudent to consider the properties of rutile
and anatase while weighing their merits for photo-catalytic applications. It is known
that charge carriers (electrons and holes) are created upon photo-irradiation when
electrons jump from the highest occupied density of states (DOS) of valence band to
the lowest occupied DOS of the conduction band. The utility of these charge carriers
at the surface depends on the amount of charge carriers available on the surface. In
anatase TiO2, the transfer of charge carriers to the surface takes precedence over
inter site transfer owing to the open (crystallographic) structure of anatase phase.
In addition to this, the nature of optical absorption process also affects the photo
catalytic process. It is known that rutile is a direct band gap semiconductor, while
anatase has an indirect band gap. Hence, an electron can jump from valence band
to conduction band in rutile without any help from the surrounding lattice, whereas
it has to rely on surrounding phonons in case of anatase to acquire the necessary
momentum to occupy an excited state. Phonon involvement increases recombination
time. This, combined with the fact that the effective electron mass in rutile is about
twenty times larger than in anatase, means more photoelectrons will reach the surface
in anatase where they can interact with surface species. Hence, for the present study
anatase phase of TiO2 was chosen for various studies. However, anatase titanium
dioxide is a wide band gap (∼3.2eV) semiconducting oxide and one of the main issues
viii
associated with it is the requirement of UV radiation for charge carrier generation.
The most abundant source of UV radiation is sun light which constitutes only ∼ 5% of
it and has been exploited for the photo-catalytic applications. It is well known that the
visible region of solar spectrum is ∼ 50% and the effective utilization of natural solar
energy warrants the proper tapping of this part of spectrum too. Therefore, among
several methods adopted in literature for utilizing the visible light radiation, nitrogen
doping of TiO2 is found to be the most viable method, taking into consideration the
detrimental effects such as photo-corrosion, generation of electron-hole recombination
sites etc.6–11 However, introduction of an anion (nitrogen) in TiO2 lattice results in
creation of oxygen vacancy so as to maintain charge neutrality. Since, structure plays
an important role in deciding the photo-activity, this thesis focuses on synthesizing
phase pure anatase TiO2, N- doped TiO2, oxygen deficient TiO2 (TiO2−x)films and
studying the effect of N-doping and oxygen vacancy on its local structure. In addition,
the visible light activity of N-doped anatase TiO2 and TiO2−x films are studied. A
brief chapterwise outline of the thesis is given below.
Chapter 1: This chapter introduces three predominantly occurring phases of Tita-
nium dioxide, their crystal structures, optical properties and rationale behind band
gap tuning. Several methods of band gap tuning such as surface sensitization, tran-
sition metal doping, nonmetal doping are briefly discussed with special emphasis on
nitrogen doping owing to its technological importance and ease of synthesis. As, ni-
trogen doping leads to concomitant formation of oxygen vacancy in the TiO2 matrix,
the issues related to oxygen vacancy in TiO2 are also discussed in great detail. The
prevailing synthetic methods for N-doping and oxygen deficient TiO2 are carefully
scrutinized for finalizing the suitable synthetic method to be used in this study. The
chapter ends with a presentation of scope of the work and investigations carried out
in the present thesis.
Chapter 2: This chapter describes experimental methods used for synthesizing and
ix
characterising TiO2, N-doped TiO2 and oxygen deficient TiO2 thin films. Synthesiz-
ing and characterising tools include a custom built spray pyrolysis unit and GIXRD
(Grazing Incidence X-ray Diffractometer), FESEM (Field Emission Scanning Electron
Microscope ), Contact angle set-up, UV-Vis spectrometer, XPS (X-ray Photoelectron
Spectrometer) , XAS (X-ray absorption Spectrometer; Indus-II, RRCAT, Indore), re-
spectively. The chapter describes the basic principles of these techniques briefly. In
addition, theoretical aspects and the fitting methodology of X-ray Absorption Spectra
are discussed in detail.
Chapter 3: This chapter focuses on the synthesis and characterisation of N-doped
anatase TiO2 thin films. Emphasis is given on the optical properties, chemical and
bonding nature of the nitrogen dopant. It also discusses the local structure of the
N-doped anatase TiO2 thin films. A brief description of the study and the discussion
of the results covered in this chapter are given below. Nano-structured TiO2 and N-
doped TiO2 thin films were synthesized using a cost effective and environment friendly
spray pyrolysis technique by keeping the substrate temperature (Ts) at 400, 450, 500
and 550 ◦C. Crystallographic studies of the films confirmed formation of phase pure
anatase TiO2. Microstructure studies of these films revealed early stages of grain
formation at Ts = 400 and 450 ◦C and well defined 20 nm wide and 10 nm long
crystalline grains at Ts = 500 and 550 ◦C. Optical absorption studies carried out by
using UV-Vis spectrometer revealed formation of interband states in case of N-doped
TiO2. The stoichiometry of the films was calculated from X-ray photoelectron spectra
and the film synthesized at Ts = 450 ◦C is found to be nearly stoichiometric compared
to the films synthesized at Ts = 400, 500 and 550 ◦C. The chemical nature and location
of the nitrogen dopant was deduced using X-ray photoelectron spectroscopy (XPS)
and X-ray absorption spectroscopy (XAS), respectively. Nitrogen 1s (XPS) spectra
showed three peaks with an energy value of 396.6, 397.5 and ∼400eV, corresponding
to substitutional nitrogen, interstitial nitrogen and as NO species, respectively.12 Out
x
of these three peaks, the peak at 396.6eV is traditionally referred as substitutional
nitrogen by several authors. However, a careful reading of literature revealed that it
corresponds to Ti-N bond of Titanium nitride, implying that it merely represents a Ti-
N linkage and is not exactly substituting lattice oxygen. Moreover, XPS as a technique
is capable of only differentiating different chemical surroundings around a particular
atom and cannot pinpoint the location of the said atom. Hence, X-ray absorption
studies (XAS) are undertaken to delineate the exact location of nitrogen. XAS is
divided into three regions, viz. pre-edge, edge and post-edge. Pre-edge region revealed
three peaks (A1, A2, A3) viz. 4957, 4961, and 4963 eV corresponding to 1s- 1t1g, 1s-
1t2g and 1s- 3eg electronic transition due to the distorted TiO6 octahedron geometry
in anatase phase of TiO2.13,14 Analysis of post edge region, which is also known
as extended absorption fine structure (EXAFS), revealed that nitrogen in the TiO2
host is located at a distance of ∼2.3 A. The average (Ti-O)axial and (Ti-O) equatorial
distances in pristine TiO2 and their changes on nitrogen doping, corresponding to
different nitrogen concentrations, were calculated from the EXAFS results. (Ti-O)
axial and (Ti-O) equatorial bond lengths calculated from EXAFS are found to be in
agreement with the theoretically calculated values by Ceotto et. al.15 There is an
overall increase in (Ti-O) axial and (Ti-O) equatorial bond distances in doped TiO2
with respect to TiO2 thin films, which is attributed to the dominant effect of nitrogen
doped into the crystal lattice.
Chapter 4: This chapter describes synthesis of oxygen deficient TiO2 (TiO2-x) films
and its characterisation using FESEM and GIXRD. Formation of oxygen vacancy and
its effect on the local structure are studied using X-ray absorption spectrometer. The
major findings of these studies are described below.
Anatase TiO2−x films are synthesized by adopting a simple two step method, i.e.,
synthesizing anatase TiO2 films followed by annealing in vacuum/ under hydrogen
flow. Hence, anatase TiO2 films are first synthesized by using the custom made spray
xi
pyrolysis set up as described in chapter 2. Since, it is known from chapter 3 that
synthesis of TiO2 at Ts = 450 ◦C yields stoichiometric anatase TiO2 and synthesis
at Ts = 500 ◦C yields well defined crystalline grains of anatase TiO2, two synthesis
temperatures i.e. ts= 450, 500 ◦C are chosen. The above synthesized films are then
annealed at their respective ts in vacuum (for 2, 4. 6 and 8 hours) and under a
reducing atmosphere (using H2 gas) in a CVD chamber. As, annealing is known
to cause phase transition of anatase to rutile, Grazing incidence X-ray diffraction
(GIXRD) studies are undertaken. GIXRD of the films revealed that there is no
change in crystal structure due to annealing. The crystallite sizes are calculated from
the GIXRD spectra by using Scherrer Formula and are found to be in the range of
29 to 91 nm. The formation of oxygen vacancies, due to annealing in vacuum/ under
H2 flow, is ascertained by comparing the co-ordination number (C.N) obtained from
EXAFS analysis with the C.N obtained by using the equation devised by Frenkel
et. al. for calculating the C.N in nanoparticles.16 The calculated C.N for the nano-
sized crystallites of TiO2−x films in the present study is found out to be 5.9. C.N
obtained from EXAFS analysis is less than 5/5.7 for TiO2−x films synthesized at Ts=
450 0C /500 ◦C. Comparison of C.N between EXAFS calculation and the theoretical
calculation using Frenkel’s equation proved that the oxygen vacancy is indeed induced
due to vacuum/H2 annealing and is not due to nano-sized crystallites. Furthermore,
it is observed that the films synthesized and annealed at Ts = 450 0C are more oxygen
deficient (CN of TiO2−x- 450 ◦C is in the range of 4.6 to 4.8) compared to the films
synthesized at Ts = 500 ◦C (CN of TiO2−x- 500 ◦C is in the range of 4.6 to 5.7). This is
attributed to the porous microstructure of the film synthesized at Ts = 500 ◦C, which
undergoes surface restructuring and absorbs the desorbed oxygen species available
near surface as pointed out by Krivtsov et.al.17 In addition, the effect of oxygen
vacancy on the local structure is understood by analyzing X-ray absorption near edge
spectra (XANES). XANES of oxygen deficient TiO2 films show three peaks (A1, A2,
A3) positioned around 4957, 4961, and 4963 eV with varying intensity. Analyzing peak
xii
position and height of A1, A2 and A3 revealed that TiO2−x films consist of both six and
few five coordinated Ti centers. In addition to the above, oxygen vacancies are known
to induce disorderness in the system, which is reflected in the integrated intensity of
A2 peak. To understand this, A2 peak was fitted and its integrated intensity is found
to be highest for the films annealed for 2 hours. This is in accordance with the fact
that grain size and crystallinity increases with increase in annealing time as seen in the
literature. This chapter also includes the comparison between theoretically simulated
XAS spectra using FEFF with the experimental results to elucidate the pre-edge peak
features of pure anatase TiO2 and oxygen deficient anatase TiO2. Few TiO2−x films
are also prepared by reducing the films under H2 flow and are studied using XAS.
Chapter 5: This chapter focuses on the photo-induced wetting studies of N-doped
anatase TiO2 and TiO2−x films. The major findings of the wetting studies are de-
scribed below. It is observed that nitrogen doping transforms the surface of undoped
TiO2 from hydrophobic to super-hydrophilic upon sunlight irradiation. The surface of
N-doped anatase TiO2 reverted back to the hydrophobic one when kept in dark, indi-
cating reversibility in wetting behaviour, known as switching behaviour. This chapter
also includes kinetics of variation in contact angle upon photo irradiation and under
dark condition. Wetting studies of TiO2-x films revealed that TiO2−x films attained
super-hydrophilicity in 65mins.
Chapter 6: This chapter summarizes the major findings of the studies carried out
on spray pyrolysis synthesized anatase TiO2, N-doped TiO2 and TiO2−x films. The
chapter ends with directions for future work. The important findings from these
studies are as follows:
1. Synthesis of phase pure anatase TiO2 and N-doped TiO2 films (at Ts = 400,
450, 500 and 550 ◦C) by using custom made spray pyrolysis unit is evidenced by
GIXRD studies. Microstructural evolution confirms formation of well defined
grains for films synthesized at Ts= 500 and 550 ◦C.
xiii
2. Nitrogen doping in TiO2 is confirmed from X-ray photo-electron spectra and its
exact position is delineated by using X-ray absorption spectra. EXAFS analysis
reveals that nitrogen in N-doped TiO2 is interstitial in nature and is located at a
distance of ∼2.3 A. The change in local structure owing to N-doping is reflected
in Ti-Oaxial and Ti-Oequatorial bond lengths, which are found to be elongated in
N-doped TiO2.
3. Concomitant formation of oxygen vacancy owing to nitrogen doping is studied
by synthesizing oxygen deficient TiO2 (TiO2−x) films, wherein oxygen vacancies
are deliberately introduced in TiO2 by following a post-synthesis annealing in
vacuum/H2 atmosphere. The formation of oxygen vacancies are confirmed from
the EXAFS analysis of the TiO2−x films. In addition, the change in local co-
ordination i.e. the change in Ti-Oaxial and Ti-Oequatorial bond lengths due to
oxygen vacancy matches with the theoretically calculated bond distance for
oxygen deficient TiO6 octahedrons.
4. The photo-induced wetting studies of N-doped TiO2 films reveal, N-doped TiO2
films become superhydrophilic upon 40 min sunlight irradiation and revert back
to initial hydrophobic state when kept in dark for 5 days. This confirms the
switching (hydrophobic ↔ superhydrophilic) behaviour and the rate of hy-
drophobic → superhydrophilic and superhydrophilic → hydrophobic transition
is found to be 0.224 min−1 and 2.03 x10 −4 min−1, respectively.
xiv
Bibliography
[1] Shaham-Waldmann, N.; Paz, Y. Modified Photocatalysts, Photocatalysis and
Water Purification. Wiley-VCH Verlag GmbH and Co. KGaA, 2013, 103-143.
[2] Richards, B. S. Comparison of TiO2 and other Dielectric Coatings for Buried-
Contact Solar Cells: a Review. Progress in Photovoltaics: Research and Appli-
cations 2004, 12, 253.
[3] Panjawi, N.; Naik, A.; Warwick, M. E. A.; Hyett, G.; Binions, R. The Preparation
of Titanium Dioxide Gas Sensors by the Electric Field Assisted Aerosol CVD
Reaction of Titanium Isopropoxide in Toluene. Chem. Vap. Deposition. 2012, 18,
102.
[4] Miyauchi, M.; Kieda, N.; Hishita, S.; Mitsuhashi, T.; Nakajimam, A.; Watan-
abe, T.; Hashimoto, K. Reversible Wettability Control of TiO2 Surface by Light
Irradiation, Surface Science, 511, 2002, 401.
[5] Muranyi, P.; Schraml, C.; Wunderlich, J. Antimicrobial Efficiency of Titanium
Dioxide-Coated Surfaces. J. Appl. Microbiol. 2010, 108, 1966 - 1973.
[6] Serpone, N. Is The Band Gap of Pristine TiO2 Narrowed by Anion- and Cation-
Doping of Titanium Dioxide in Second-Generation Photocatalysts? J. Phys.
Chem. B. 2006, 110, 24287.
xv
[7] Sathish, M.; Viswanathan, B.; Viswanath, R. P.; Gopinath, C. S. Synthesis,
Characterization, Electronic Structure, and Photocatalytic Activity of Nitrogen-
Doped TiO2 Nanocatalyst. Chem. Mater. 2005, 17, 6349.
[8] Mrowetz, M.; Balcerski,W.; Colussi, A. J.; Hoffmann, M. R. Oxidative Power of
Nitrogen-Doped TiO2 Photocatalysts under Visible Illumination. J. Phys. Chem.
B. 2004, 108, 17269.
[9] Cong, Y.; Zhang, J.; Chen, F.; Anpo, M. Synthesis and Characterization of
Nitrogen-Doped TiO2 Nanophotocatalyst with High Visible Light Activity. J.
Phys. Chem. C. 2007, 111, 6976.
[10] Tian, H.; Hu, L.; Zhang, C.; Liu, W.; Huang, Y.; Mo, L.; Guo, L.; Sheng, J.;
Dai, S. Retarded Charge Recombination in Dye-Sensitized Nitrogen- Doped TiO2
Solar Cells. J. Phys. Chem. C. 2010, 114, 1627.
[11] Raut, N. C.; Mathews, T.; Ajikumar, P. K.; George, R. P.; Dash, S.; Tyagi,
A. K.Sunlight Active Antibacterial Nanostructured N-doped TiO2 Thin Films
Synthesized by an Ultrasonic Spray Pyrolysis Technique. RSC Adv. 2012, 2,
10639.
[12] Saha, N. C.; Tompkins, H. G. Titanium Nitride Oxidation Chemistry: An X-ray
Photoelectron Spectroscopy Study, J. Appl. Phys. 1992, 72, 3072.
[13] Sandstrom, D. R.; Filby, R. H.; Lytle, F. W.; Greegor, R. B. Study of Ti in
Solvent-Refined Coal by X-ray Absorption Spectroscopy. Fuel 1982, 61, 195.
[14] Chen, L. X.; Rajh, T.; Wang, Z.; Thurnauer, M. C. XAFS Studies of Surface
Structures of TiO2 Nanoparticles and Photocatalytic Reduction of Metal Ions. J.
Phys. Chem. B 1997, 101, 10688.
[15] Ceotto, M.; Lo Presti, L.; Cappelletti, G.; Meroni, D.; Spadavecchia, F.; Zecca,
R.; Leoni, M.; Scardi, P.; Bianchi, C. L.; Ardizzone, S., About the Nitrogen Loca-
xvi
tion in Nanocrystalline N-Doped TiO2: Combined DFT and EXAFS Approach,
J. Phys. Chem. C 2012, 116, 1764.
[16] Frenkel,A. I.; Yevick, A.; Cooper, C.; Vasic, R. Modeling the Structure and
Composition of Nanoparticles by Extended X-Ray Absorption Fine-Structure
Spectroscopy. Annu. Rev. Anal. Chem. 2011, 4, 23.
[17] Krivtsov,I.; Ilkaeva, M.; Salas-Colera, E.; Amghouz, Z.; Garcia,J. R.; Diaz, E.;
Ordonez, S. ; Villar-Rodil, S. Consequences of Nitrogen-Doping and Oxygen
Enrichment on Titanium Local Order and Photocatalytic Performance of TiO2
Anatase. J. Phys. Chem. C. 2017, 121, 6770.
xvii
Contents
Page
Synopsis viii
1 Introduction 1
1.1 Titanium Dioxide . . . . . . . . . . . . . . . . . . . . . . . . . . . . . . 1
1.1.1 Optical properties . . . . . . . . . . . . . . . . . . . . . . . . . . 4
1.1.2 Photon Induced Surface Properties . . . . . . . . . . . . . . . . 6
1.2 Photo-induced wetting properties. . . . . . . . . . . . . . . . . . . . . . 10
1.3 Doping . . . . . . . . . . . . . . . . . . . . . . . . . . . . . . . . . . . . 11
1.3.1 Doped TiO2 Photocatalysts . . . . . . . . . . . . . . . . . . . . 13
1.4 Nitrogen Doping . . . . . . . . . . . . . . . . . . . . . . . . . . . . . . 15
1.5 Oxygen Vacancies in TiO2 matrix . . . . . . . . . . . . . . . . . . . . . 17
1.5.1 Issues related to oxygen vacancies synthesis . . . . . . . . . . . 18
1.6 TiO2 Thin films . . . . . . . . . . . . . . . . . . . . . . . . . . . . . . . 19
1.7 Spray pyrolysis Deposition of TiO2 Thin films . . . . . . . . . . . . . . 21
1.8 Overview of the thesis . . . . . . . . . . . . . . . . . . . . . . . . . . . 23
2 Experimental Methods 41
2.1 Synthesis Techniques . . . . . . . . . . . . . . . . . . . . . . . . . . . . 41
2.1.1 Spray Pyrolysis . . . . . . . . . . . . . . . . . . . . . . . . . . . 41
2.2 Characterization Tools . . . . . . . . . . . . . . . . . . . . . . . . . . . 44
2.2.1 Grazing Incidence X-ray diffraction(GIXRD) . . . . . . . . . . . 44
2.2.2 Field Emission Scanning Electron Microscopy(FESEM) . . . . . 45
2.3 Contact Angle Measurement . . . . . . . . . . . . . . . . . . . . . . . . 47
2.4 Theoretical Background of Wetting Studies. . . . . . . . . . . . . . . . 47
2.4.1 Wenzel and Cassie-Baxter Wetting . . . . . . . . . . . . . . . . 49
2.5 Optical and electronic measurements . . . . . . . . . . . . . . . . . . . 51
2.5.1 Ultraviolet Visible Spectroscopy . . . . . . . . . . . . . . . . . . 51
2.5.2 X-ray Photoelectron Spectroscopy(XPS) . . . . . . . . . . . . . 53
2.5.3 X-ray Absorption Spectroscopy(XAS) . . . . . . . . . . . . . . . 54
2.6 Summary . . . . . . . . . . . . . . . . . . . . . . . . . . . . . . . . . . 58
xviii
3 Doping of TiO2 with Nitrogen. 61
3.1 Introduction . . . . . . . . . . . . . . . . . . . . . . . . . . . . . . . . . 61
3.2 Synthesis of N:TiO2 by spray pyrolysis method . . . . . . . . . . . . . . 64
3.3 Characterisation of the N:TiO2 films. . . . . . . . . . . . . . . . . . . . 65
3.3.1 Crystallographic Studies . . . . . . . . . . . . . . . . . . . . . . 65
3.3.2 Microstructure . . . . . . . . . . . . . . . . . . . . . . . . . . . 66
3.4 Nitrogen concentration and nature of Bonding. . . . . . . . . . . . . . . 67
3.5 Optical properties . . . . . . . . . . . . . . . . . . . . . . . . . . . . . . 70
3.5.1 Nature of Bonding . . . . . . . . . . . . . . . . . . . . . . . . . 71
3.6 X-ray Absorption studies . . . . . . . . . . . . . . . . . . . . . . . . . . 74
3.6.1 Analysis of the XAS spectrum . . . . . . . . . . . . . . . . . . . 75
3.6.2 Near edge (Pre-edge) Features . . . . . . . . . . . . . . . . . . . 76
3.6.3 EXAFS (Extended X-ray Absorption fine Structure) . . . . . . 78
3.7 Conclusion . . . . . . . . . . . . . . . . . . . . . . . . . . . . . . . . . . 86
4 Synthesis and Structural Studies of Oxygen deficient TiO2(TiO2−x). 96
4.1 Introduction . . . . . . . . . . . . . . . . . . . . . . . . . . . . . . . . . 96
4.2 Crystallographic studies . . . . . . . . . . . . . . . . . . . . . . . . . . 99
4.2.1 Microstructure . . . . . . . . . . . . . . . . . . . . . . . . . . . 100
4.3 XAS studies of vacuum annealed anatase TiO2 films . . . . . . . . . . . 101
4.3.1 EXAFS Analysis . . . . . . . . . . . . . . . . . . . . . . . . . . 104
4.4 Analysis of X-ray Absorption Near Edge Spectra (XANES) . . . . . . . 109
4.4.1 Discussion on pre-edge Intensity . . . . . . . . . . . . . . . . . . 116
4.5 XAS studies of Films reduced under Hydrogen atmosphere . . . . . . . 117
4.6 Conclusion . . . . . . . . . . . . . . . . . . . . . . . . . . . . . . . . . . 119
5 Photo-induced Wetting Studies on N-doped TiO2 Films 126
5.1 Introduction . . . . . . . . . . . . . . . . . . . . . . . . . . . . . . . . . 126
5.2 Roughness and microstructure . . . . . . . . . . . . . . . . . . . . . . . 128
5.3 Wetting Studies . . . . . . . . . . . . . . . . . . . . . . . . . . . . . . . 129
5.4 Kinetics of the hydrophobic to superhydrophilic transition . . . . . . . 139
5.4.1 Calculation of rate constants . . . . . . . . . . . . . . . . . . . . 140
5.5 Wetting study of an oxygen deficient TiO2 thin film. . . . . . . . . . . 142
5.6 Conclusion . . . . . . . . . . . . . . . . . . . . . . . . . . . . . . . . . . 143
6 Summary and Scope for Future work. 151
6.1 Summary . . . . . . . . . . . . . . . . . . . . . . . . . . . . . . . . . . 151
6.2 Scope of Future Work . . . . . . . . . . . . . . . . . . . . . . . . . . . . 154
xix
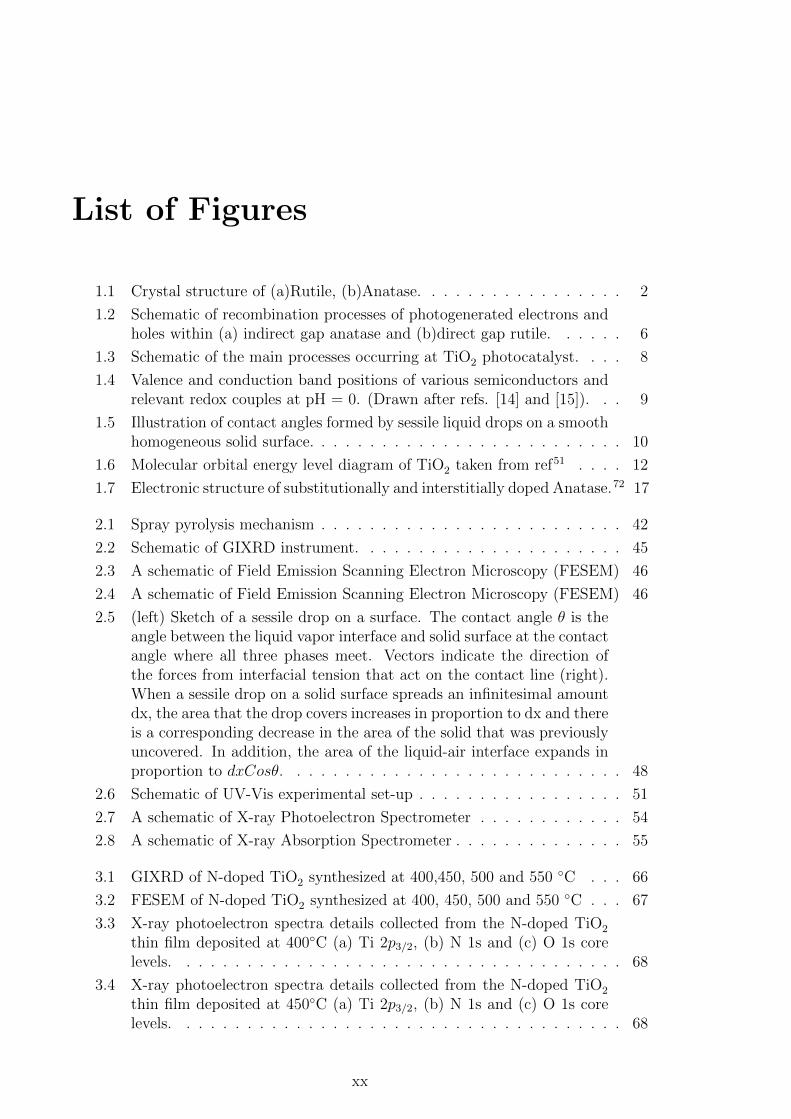
List of Figures
1.1 Crystal structure of (a)Rutile, (b)Anatase. . . . . . . . . . . . . . . . . 2
1.2 Schematic of recombination processes of photogenerated electrons andholes within (a) indirect gap anatase and (b)direct gap rutile. . . . . . 6
1.3 Schematic of the main processes occurring at TiO2 photocatalyst. . . . 8
1.4 Valence and conduction band positions of various semiconductors andrelevant redox couples at pH = 0. (Drawn after refs. [14] and [15]). . . 9
1.5 Illustration of contact angles formed by sessile liquid drops on a smoothhomogeneous solid surface. . . . . . . . . . . . . . . . . . . . . . . . . . 10
1.6 Molecular orbital energy level diagram of TiO2 taken from ref51 . . . . 12
1.7 Electronic structure of substitutionally and interstitially doped Anatase.72 17
2.1 Spray pyrolysis mechanism . . . . . . . . . . . . . . . . . . . . . . . . . 42
2.2 Schematic of GIXRD instrument. . . . . . . . . . . . . . . . . . . . . . 45
2.3 A schematic of Field Emission Scanning Electron Microscopy (FESEM) 46
2.4 A schematic of Field Emission Scanning Electron Microscopy (FESEM) 46
2.5 (left) Sketch of a sessile drop on a surface. The contact angle θ is theangle between the liquid vapor interface and solid surface at the contactangle where all three phases meet. Vectors indicate the direction ofthe forces from interfacial tension that act on the contact line (right).When a sessile drop on a solid surface spreads an infinitesimal amountdx, the area that the drop covers increases in proportion to dx and thereis a corresponding decrease in the area of the solid that was previouslyuncovered. In addition, the area of the liquid-air interface expands inproportion to dxCosθ. . . . . . . . . . . . . . . . . . . . . . . . . . . . 48
2.6 Schematic of UV-Vis experimental set-up . . . . . . . . . . . . . . . . . 51
2.7 A schematic of X-ray Photoelectron Spectrometer . . . . . . . . . . . . 54
2.8 A schematic of X-ray Absorption Spectrometer . . . . . . . . . . . . . . 55
3.1 GIXRD of N-doped TiO2 synthesized at 400,450, 500 and 550 ◦C . . . 66
3.2 FESEM of N-doped TiO2 synthesized at 400, 450, 500 and 550 ◦C . . . 67
3.3 X-ray photoelectron spectra details collected from the N-doped TiO2
thin film deposited at 400◦C (a) Ti 2p3/2, (b) N 1s and (c) O 1s corelevels. . . . . . . . . . . . . . . . . . . . . . . . . . . . . . . . . . . . . 68
3.4 X-ray photoelectron spectra details collected from the N-doped TiO2
thin film deposited at 450◦C (a) Ti 2p3/2, (b) N 1s and (c) O 1s corelevels. . . . . . . . . . . . . . . . . . . . . . . . . . . . . . . . . . . . . 68
xx
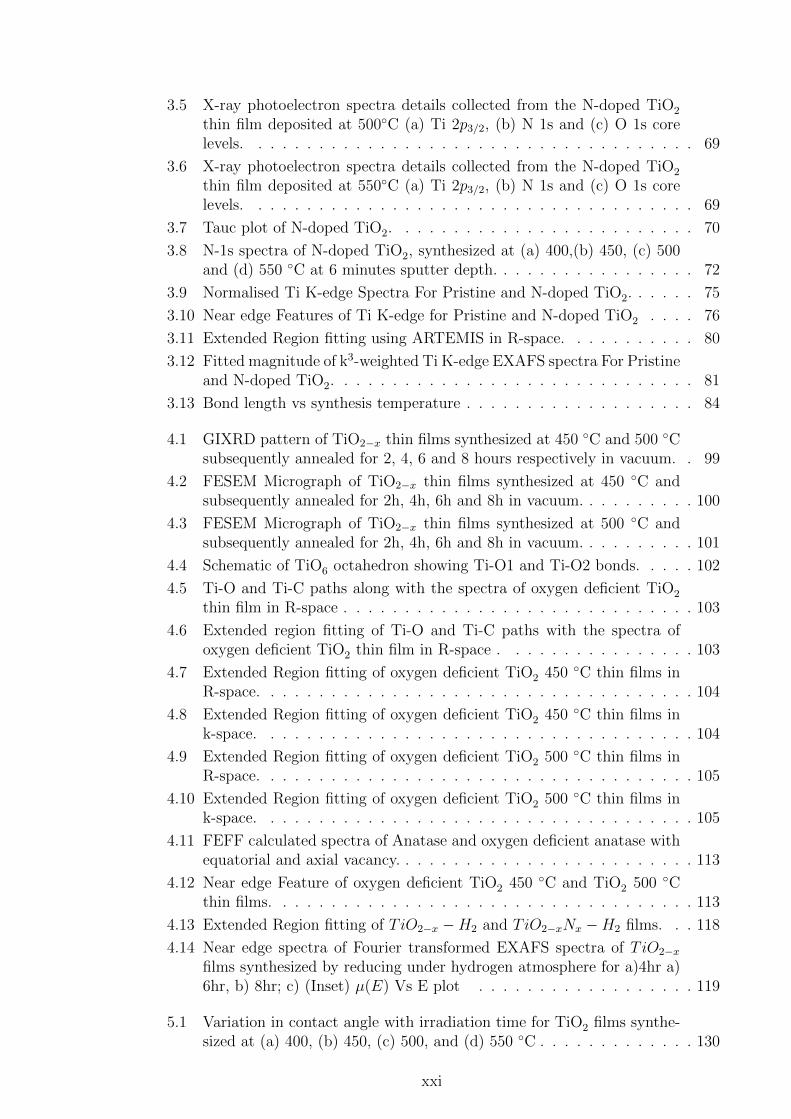
3.5 X-ray photoelectron spectra details collected from the N-doped TiO2
thin film deposited at 500◦C (a) Ti 2p3/2, (b) N 1s and (c) O 1s corelevels. . . . . . . . . . . . . . . . . . . . . . . . . . . . . . . . . . . . . 69
3.6 X-ray photoelectron spectra details collected from the N-doped TiO2
thin film deposited at 550◦C (a) Ti 2p3/2, (b) N 1s and (c) O 1s corelevels. . . . . . . . . . . . . . . . . . . . . . . . . . . . . . . . . . . . . 69
3.7 Tauc plot of N-doped TiO2. . . . . . . . . . . . . . . . . . . . . . . . . 70
3.8 N-1s spectra of N-doped TiO2, synthesized at (a) 400,(b) 450, (c) 500and (d) 550 ◦C at 6 minutes sputter depth. . . . . . . . . . . . . . . . . 72
3.9 Normalised Ti K-edge Spectra For Pristine and N-doped TiO2. . . . . . 75
3.10 Near edge Features of Ti K-edge for Pristine and N-doped TiO2 . . . . 76
3.11 Extended Region fitting using ARTEMIS in R-space. . . . . . . . . . . 80
3.12 Fitted magnitude of k3-weighted Ti K-edge EXAFS spectra For Pristineand N-doped TiO2. . . . . . . . . . . . . . . . . . . . . . . . . . . . . . 81
3.13 Bond length vs synthesis temperature . . . . . . . . . . . . . . . . . . . 84
4.1 GIXRD pattern of TiO2−x thin films synthesized at 450 ◦C and 500 ◦Csubsequently annealed for 2, 4, 6 and 8 hours respectively in vacuum. . 99
4.2 FESEM Micrograph of TiO2−x thin films synthesized at 450 ◦C andsubsequently annealed for 2h, 4h, 6h and 8h in vacuum. . . . . . . . . . 100
4.3 FESEM Micrograph of TiO2−x thin films synthesized at 500 ◦C andsubsequently annealed for 2h, 4h, 6h and 8h in vacuum. . . . . . . . . . 101
4.4 Schematic of TiO6 octahedron showing Ti-O1 and Ti-O2 bonds. . . . . 102
4.5 Ti-O and Ti-C paths along with the spectra of oxygen deficient TiO2
thin film in R-space . . . . . . . . . . . . . . . . . . . . . . . . . . . . . 103
4.6 Extended region fitting of Ti-O and Ti-C paths with the spectra ofoxygen deficient TiO2 thin film in R-space . . . . . . . . . . . . . . . . 103
4.7 Extended Region fitting of oxygen deficient TiO2 450 ◦C thin films inR-space. . . . . . . . . . . . . . . . . . . . . . . . . . . . . . . . . . . . 104
4.8 Extended Region fitting of oxygen deficient TiO2 450 ◦C thin films ink-space. . . . . . . . . . . . . . . . . . . . . . . . . . . . . . . . . . . . 104
4.9 Extended Region fitting of oxygen deficient TiO2 500 ◦C thin films inR-space. . . . . . . . . . . . . . . . . . . . . . . . . . . . . . . . . . . . 105
4.10 Extended Region fitting of oxygen deficient TiO2 500 ◦C thin films ink-space. . . . . . . . . . . . . . . . . . . . . . . . . . . . . . . . . . . . 105
4.11 FEFF calculated spectra of Anatase and oxygen deficient anatase withequatorial and axial vacancy. . . . . . . . . . . . . . . . . . . . . . . . . 113
4.12 Near edge Feature of oxygen deficient TiO2 450 ◦C and TiO2 500 ◦Cthin films. . . . . . . . . . . . . . . . . . . . . . . . . . . . . . . . . . . 113
4.13 Extended Region fitting of TiO2−x −H2 and TiO2−xNx −H2 films. . . 118
4.14 Near edge spectra of Fourier transformed EXAFS spectra of TiO2−xfilms synthesized by reducing under hydrogen atmosphere for a)4hr a)6hr, b) 8hr; c) (Inset) µ(E) Vs E plot . . . . . . . . . . . . . . . . . . 119
5.1 Variation in contact angle with irradiation time for TiO2 films synthe-sized at (a) 400, (b) 450, (c) 500, and (d) 550 ◦C . . . . . . . . . . . . . 130
xxi
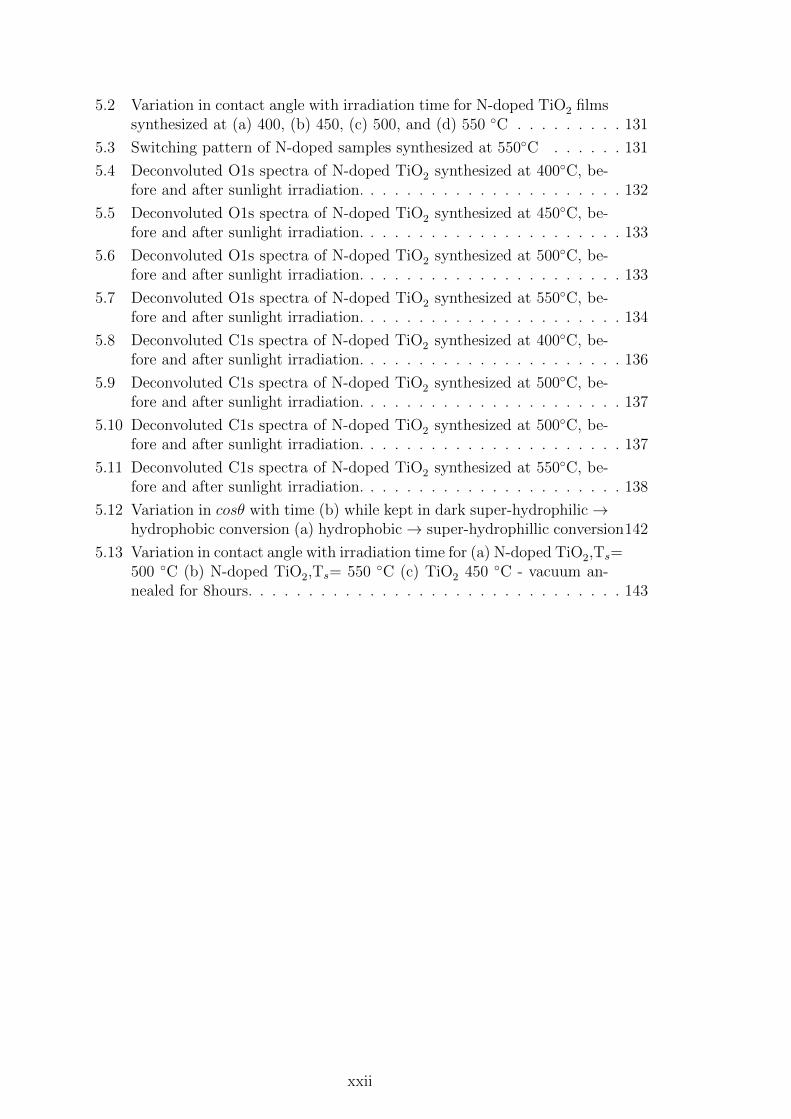
5.2 Variation in contact angle with irradiation time for N-doped TiO2 filmssynthesized at (a) 400, (b) 450, (c) 500, and (d) 550 ◦C . . . . . . . . . 131
5.3 Switching pattern of N-doped samples synthesized at 550◦C . . . . . . 131
5.4 Deconvoluted O1s spectra of N-doped TiO2 synthesized at 400◦C, be-fore and after sunlight irradiation. . . . . . . . . . . . . . . . . . . . . . 132
5.5 Deconvoluted O1s spectra of N-doped TiO2 synthesized at 450◦C, be-fore and after sunlight irradiation. . . . . . . . . . . . . . . . . . . . . . 133
5.6 Deconvoluted O1s spectra of N-doped TiO2 synthesized at 500◦C, be-fore and after sunlight irradiation. . . . . . . . . . . . . . . . . . . . . . 133
5.7 Deconvoluted O1s spectra of N-doped TiO2 synthesized at 550◦C, be-fore and after sunlight irradiation. . . . . . . . . . . . . . . . . . . . . . 134
5.8 Deconvoluted C1s spectra of N-doped TiO2 synthesized at 400◦C, be-fore and after sunlight irradiation. . . . . . . . . . . . . . . . . . . . . . 136
5.9 Deconvoluted C1s spectra of N-doped TiO2 synthesized at 500◦C, be-fore and after sunlight irradiation. . . . . . . . . . . . . . . . . . . . . . 137
5.10 Deconvoluted C1s spectra of N-doped TiO2 synthesized at 500◦C, be-fore and after sunlight irradiation. . . . . . . . . . . . . . . . . . . . . . 137
5.11 Deconvoluted C1s spectra of N-doped TiO2 synthesized at 550◦C, be-fore and after sunlight irradiation. . . . . . . . . . . . . . . . . . . . . . 138
5.12 Variation in cosθ with time (b) while kept in dark super-hydrophilic→hydrophobic conversion (a) hydrophobic→ super-hydrophillic conversion142
5.13 Variation in contact angle with irradiation time for (a) N-doped TiO2,Ts=500 ◦C (b) N-doped TiO2,Ts= 550 ◦C (c) TiO2 450 ◦C - vacuum an-nealed for 8hours. . . . . . . . . . . . . . . . . . . . . . . . . . . . . . . 143
xxii
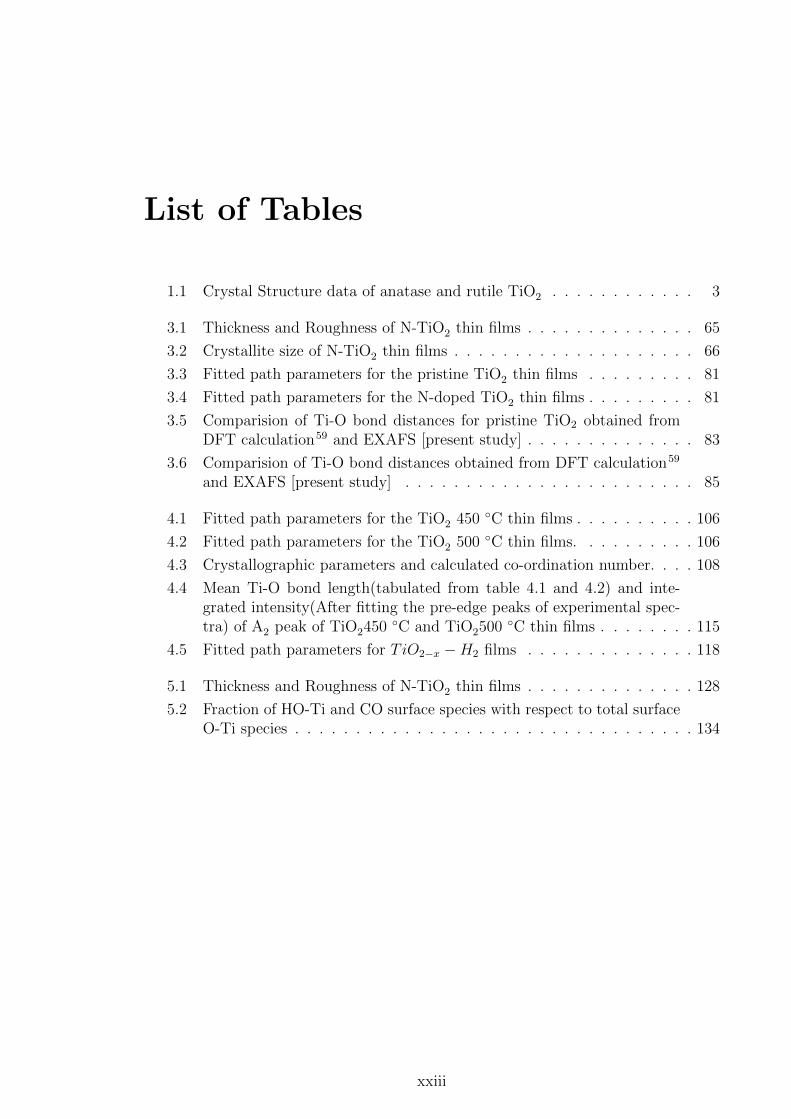
List of Tables
1.1 Crystal Structure data of anatase and rutile TiO2 . . . . . . . . . . . . 3
3.1 Thickness and Roughness of N-TiO2 thin films . . . . . . . . . . . . . . 65
3.2 Crystallite size of N-TiO2 thin films . . . . . . . . . . . . . . . . . . . . 66
3.3 Fitted path parameters for the pristine TiO2 thin films . . . . . . . . . 81
3.4 Fitted path parameters for the N-doped TiO2 thin films . . . . . . . . . 81
3.5 Comparision of Ti-O bond distances for pristine TiO2 obtained fromDFT calculation59 and EXAFS [present study] . . . . . . . . . . . . . . 83
3.6 Comparision of Ti-O bond distances obtained from DFT calculation59
and EXAFS [present study] . . . . . . . . . . . . . . . . . . . . . . . . 85
4.1 Fitted path parameters for the TiO2 450 ◦C thin films . . . . . . . . . . 106
4.2 Fitted path parameters for the TiO2 500 ◦C thin films. . . . . . . . . . 106
4.3 Crystallographic parameters and calculated co-ordination number. . . . 108
4.4 Mean Ti-O bond length(tabulated from table 4.1 and 4.2) and inte-grated intensity(After fitting the pre-edge peaks of experimental spec-tra) of A2 peak of TiO2450 ◦C and TiO2500 ◦C thin films . . . . . . . . 115
4.5 Fitted path parameters for TiO2−x −H2 films . . . . . . . . . . . . . . 118
5.1 Thickness and Roughness of N-TiO2 thin films . . . . . . . . . . . . . . 128
5.2 Fraction of HO-Ti and CO surface species with respect to total surfaceO-Ti species . . . . . . . . . . . . . . . . . . . . . . . . . . . . . . . . . 134
xxiii

Publications Chapter 0
xxiv
Chapter 1
Introduction
1.1 Titanium Dioxide
Semiconducting oxide materials have been the subject of intense research because of
their practical applications. They also provide fundamental insight into the electronic
processes involved when used in various applications. Within the class of inorganic
semiconducting materials, oxide semiconductors display diverse range of properties,
due to their dependence on the nature of metal – oxygen bonding. Wide band gap
semiconducting oxides are of high interest as these exhibit wide ranges of electrical and
optical properties. Among the wide band gap oxide materials, titanium dioxide (TiO2)
nanomaterials are used in a wide range of applications such as (photo)catalysis, sensor
devices, paints, and dye-sensitized solar cells.1–4 The material properties of TiO2
nanoparticles are a function of crystal structure, nanoparticle size, and morphology,
hence are strongly dependent on the method of synthesis.5–7 TiO2 exists in three main
phases: anatase, brookite and rutile. Anatase and rutile are the common polymorphs
of synthetic TiO2. Experimental data on TiO2 brookite is limited due to its rareness
and difficulty in preparation. In view of this, a comparative discussion on Rutile
and Anatase is taken up in the following section. Crystal structure and stability of
these phases determine its usage. Since difference in crystal structure can lead to
1
Titanium Dioxide Chapter 1
different mass densities, the electronic and optical properties of these two phases are
distinctly different. This warrants phase selective synthesis for practical applications.
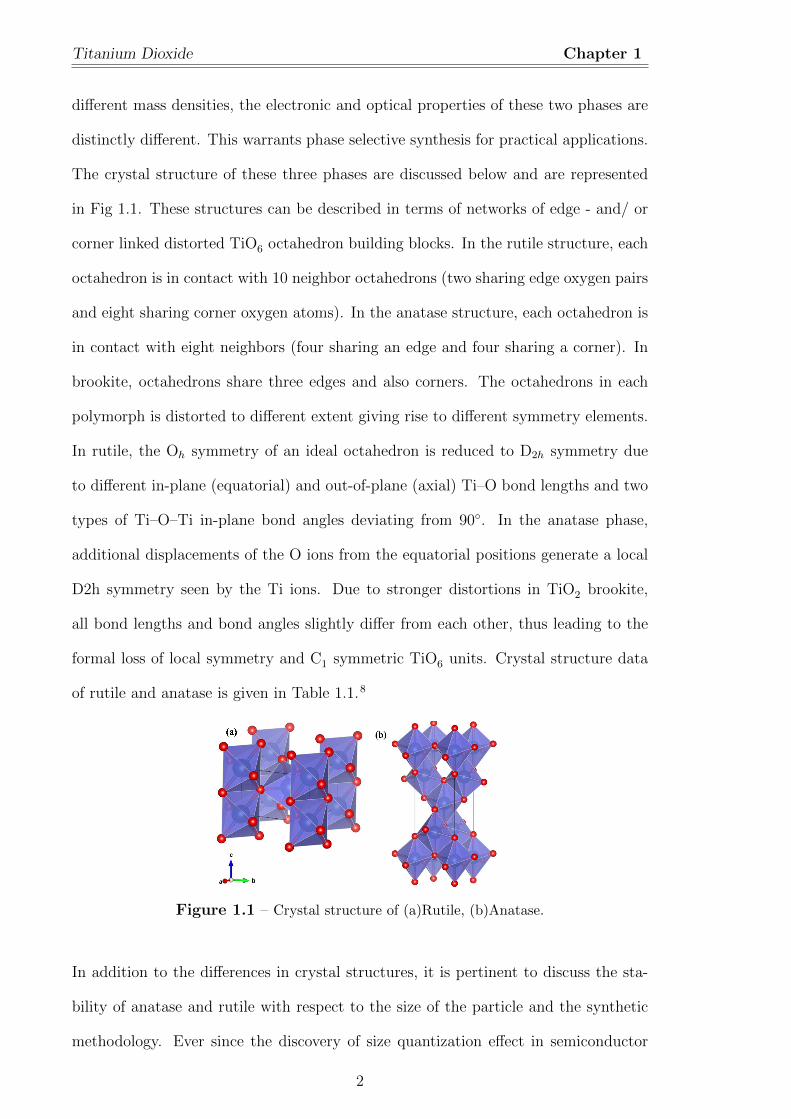
The crystal structure of these three phases are discussed below and are represented
in Fig 1.1. These structures can be described in terms of networks of edge - and/ or
corner linked distorted TiO6 octahedron building blocks. In the rutile structure, each
octahedron is in contact with 10 neighbor octahedrons (two sharing edge oxygen pairs
and eight sharing corner oxygen atoms). In the anatase structure, each octahedron is
in contact with eight neighbors (four sharing an edge and four sharing a corner). In
brookite, octahedrons share three edges and also corners. The octahedrons in each
polymorph is distorted to different extent giving rise to different symmetry elements.
In rutile, the Oh symmetry of an ideal octahedron is reduced to D2h symmetry due
to different in-plane (equatorial) and out-of-plane (axial) Ti–O bond lengths and two
types of Ti–O–Ti in-plane bond angles deviating from 90◦. In the anatase phase,
additional displacements of the O ions from the equatorial positions generate a local
D2h symmetry seen by the Ti ions. Due to stronger distortions in TiO2 brookite,
all bond lengths and bond angles slightly differ from each other, thus leading to the
formal loss of local symmetry and C1 symmetric TiO6 units. Crystal structure data
of rutile and anatase is given in Table 1.1.8
Figure 1.1 – Crystal structure of (a)Rutile, (b)Anatase.
In addition to the differences in crystal structures, it is pertinent to discuss the sta-
bility of anatase and rutile with respect to the size of the particle and the synthetic
methodology. Ever since the discovery of size quantization effect in semiconductor
2
Chapter 1: Introduction Chapter 1
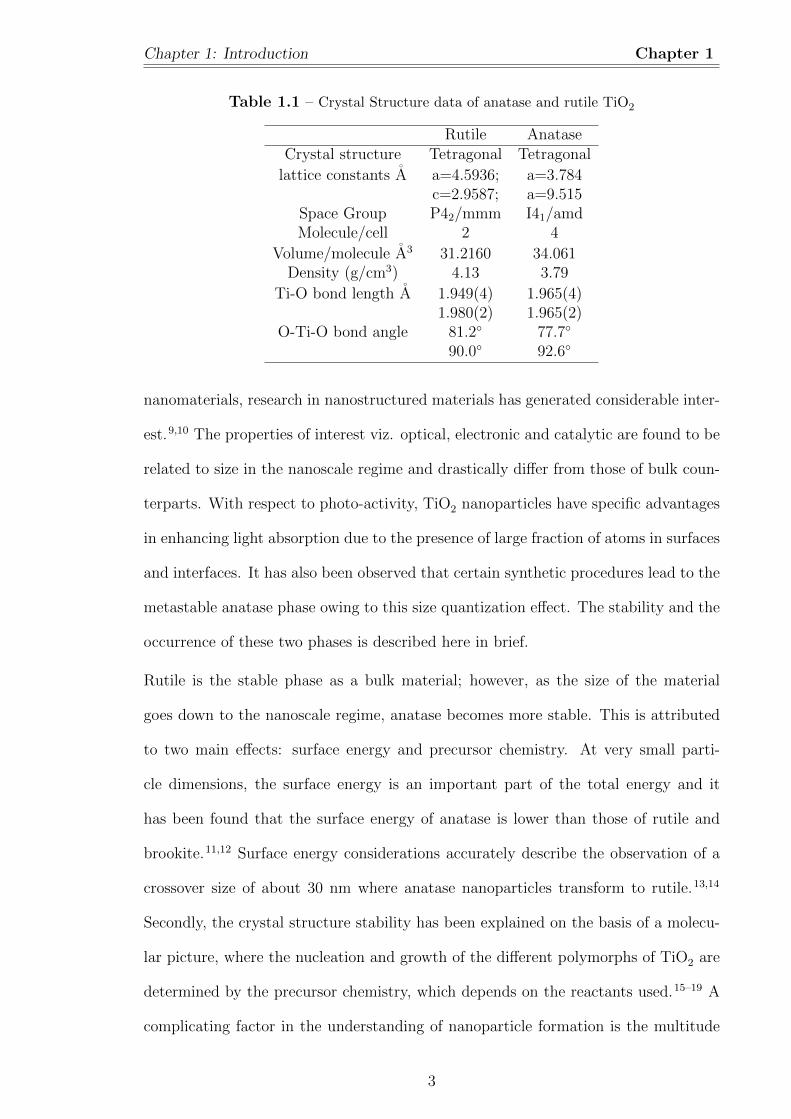
Table 1.1 – Crystal Structure data of anatase and rutile TiO2
Rutile AnataseCrystal structure Tetragonal Tetragonal
lattice constants A a=4.5936; a=3.784c=2.9587; a=9.515
Space Group P42/mmm I41/amdMolecule/cell 2 4
Volume/molecule A3 31.2160 34.061Density (g/cm3) 4.13 3.79
Ti-O bond length A 1.949(4) 1.965(4)1.980(2) 1.965(2)
O-Ti-O bond angle 81.2◦ 77.7◦
90.0◦ 92.6◦
nanomaterials, research in nanostructured materials has generated considerable inter-
est.9,10 The properties of interest viz. optical, electronic and catalytic are found to be
related to size in the nanoscale regime and drastically differ from those of bulk coun-
terparts. With respect to photo-activity, TiO2 nanoparticles have specific advantages
in enhancing light absorption due to the presence of large fraction of atoms in surfaces
and interfaces. It has also been observed that certain synthetic procedures lead to the
metastable anatase phase owing to this size quantization effect. The stability and the
occurrence of these two phases is described here in brief.
Rutile is the stable phase as a bulk material; however, as the size of the material
goes down to the nanoscale regime, anatase becomes more stable. This is attributed
to two main effects: surface energy and precursor chemistry. At very small parti-
cle dimensions, the surface energy is an important part of the total energy and it
has been found that the surface energy of anatase is lower than those of rutile and
brookite.11,12 Surface energy considerations accurately describe the observation of a
crossover size of about 30 nm where anatase nanoparticles transform to rutile.13,14
Secondly, the crystal structure stability has been explained on the basis of a molecu-
lar picture, where the nucleation and growth of the different polymorphs of TiO2 are
determined by the precursor chemistry, which depends on the reactants used.15–19 A
complicating factor in the understanding of nanoparticle formation is the multitude
3
Titanium Dioxide Chapter 1
of experimental conditions used for synthesis of the different TiO2 phases, making
it difficult to compare mechanisms. However, a few selected cases of phase specific
synthesis methods is taken up for discussion here. Cheng et al.15 and Yanagisawa et
al showed that altering reaction conditions in hydrothermal synthesis route can lead
to different phases.16 It was observed that changing pH of the synthesizing medium
favoured a certain phase e.g. acidic medium favoured rutile phase formation while
basic medium favoured anatase phase.15,16 Reyes et al.19 have studied use of vari-
ous reactants to obtain phase pure anatasa, rutile and brookite. They have shown
that phase formation was achieved by hydrothermal treatment at elevated temper-
atures with the appropriate reactants. Anatase nanoparticles were obtained using
acetic acid, while phase-pure rutile and brookite nanoparticles were obtained with
hydrochloric acid at a different concentration. They proposed that anatase formation
is dominated by surface energy effects, and that rutile and brookite formation follows
a dissolution–precipitation mechanism, where chains of sixfold-coordinated titanium
complexes arrange into different crystal structures depending on the reactant chem-
istry.19 Similarly, Rafieian et al.20 have studied the the synthesis of rutile and anatase
thin films using Reactive magnetron sputtering. It was observed that oxygen deficient
atmosphere during deposition lead to substoichiometric TiO2 thin films, which in turn
yield rutile phase upon annealing at a temperature below 500 ◦C. Anatase phase was
obtained from annealing of stoichiometric films.20
From the application point of view rutile is preferred over anatase for optical and
dielectric applications because of its high refractive index and dielectricity. Whereas,
anatase is preferred for all applications related to photocatalytic activity due to its
higher charge carrier mobility.
1.1.1 Optical properties
Anatase and rutile TiO2 have band gaps of 3.2 and 3.0 eV, respectively and therefore,
are visible light transparent. They have refractive indices higher than that of diamond
4
Chapter 1: Introduction Chapter 1
and is highest of all the oxides. Hence, large and pure TiO2 crystals have gem-like
reflectance, refraction, and brilliance and are suitable for use in jewellery. The high
refractive index has also enabled wide use of TiO2 as a white pigment and also in many
other optical applications. Because TiO2 absorbs UV light and is biocompartible, it
is used in sunscreen. Most pertinent for our discussion is the type of bandgap rutile
and anatase possess. For any bandgap, the highest probability of creating charge
carriers happens when there is coupling between highest density of states (DOS)
at the maximum of the valence band and the minimum of the conduction band.
For rutile, this happens at the same point in k-space making it a direct bandgap
semiconductor – wherein an electron can jump to its excited state without any help
from the surrounding lattice. For anatase, this happens at different points in k-space
forcing a stimulated electron to rely on surrounding phonons to acquire the value of
momentum necessary to occupy an excited state. Phonon involvement also increases
recombination time. This, combined with the fact that the effective electron mass in
rutile is about twenty times larger than in anatase, means more photoelectrons will
reach the surface in anatase where they can interact with surface species. In all, the
lifetime of e− − h+ pair in case of rutile is very less (< 1 ns), whereas it is higher
for anatase (> 10 ns). Longer lifetime of e− − h+ pairs in anatase facilitates the
trans-location of the photon-excited electrons and holes from the bulk to the surface,
where the photochemical reactions take place.21,22
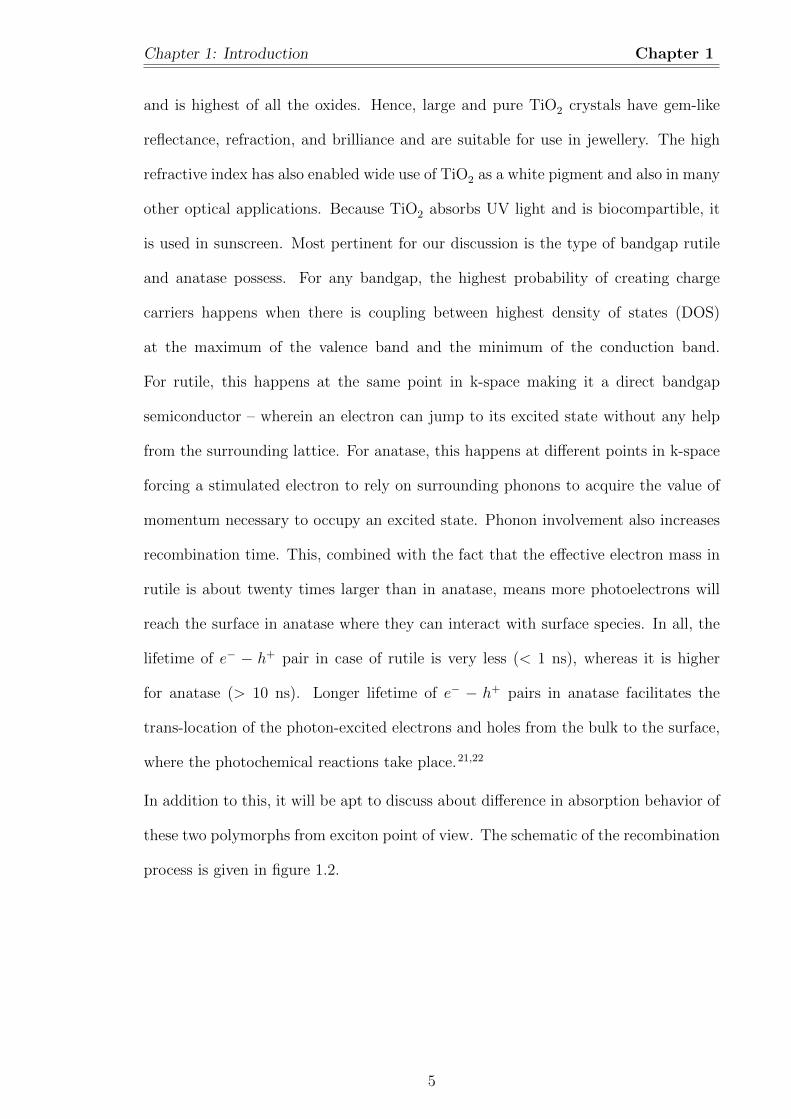
In addition to this, it will be apt to discuss about difference in absorption behavior of
these two polymorphs from exciton point of view. The schematic of the recombination
process is given in figure 1.2.
5

Titanium Dioxide Chapter 1
Figure 1.2 – Schematic of recombination processes of photogenerated electrons andholes within (a) indirect gap anatase and (b)direct gap rutile.
Tang et al have studied the absorption behaviour of anatase and rutile at different
temperatures and found that the absorption edge of rutile is characterized by phonon
sidebands extending near the fundamental transition thresholds at low temperature.
In contrast, the spectral dependence of the absorption edge in anatase fo11ows the
Urbach rule at all temperatures down to liquid-helium temperature. They also con-
cluded that excitons are self-trapped in anatase, while that in rutile are free.23 The
opposite nature of exciton states in anatase and rutile correlates with their structural
differences of having different number of corner and edge sharing octahedrons as dis-
cussed earlier. Excitons in such structures are called charge-transfer excitons. They
result from interaction between conduction-band electrons located on Ti 3d states
and holes formed essentially by the O 2p states. Anatase has a more open structure
compared to rutile owing to the fact that in rutile each TiO6 octahedron is connected
to ten neighboring ones on sharing a corner or an edge and in anatase each octahe-
dron is coordinated only with eight neighboring ones. In consequence, in the anatase
structure, the inter site transfer of excitons is weaker and the excitons travels to the
surface mediated via phonons.23
1.1.2 Photon Induced Surface Properties
A material is known to be photo-responsive when various oxidative and reductive
chemical reactions are induced on its surface in the presence of light. It is well-known
6
Chapter 1: Introduction Chapter 1
that TiO2 is a promising candidate for applications wherein UV light is used to induce
reactions at surface and subsurface level. TiO2 is chemically inert, biocompartible,
photocatalytically active, easy to produce and use, sunlight activated, non-toxic and
cheap. A vast amount of information about the light induced properties of TiO2 espe-
cially photocatlytic properties is available in literature. Its photocatalytic properties
would be discussed in detail in this section. Most of these articles are focused on
TiO2 powders and only a fraction deals with thin films. Although the present work
is focused on thin films, a general understanding of materials properties requires the
knowledge of all forms of TiO2 because many important studies and major advances
in properties are often first reported on powder samples.
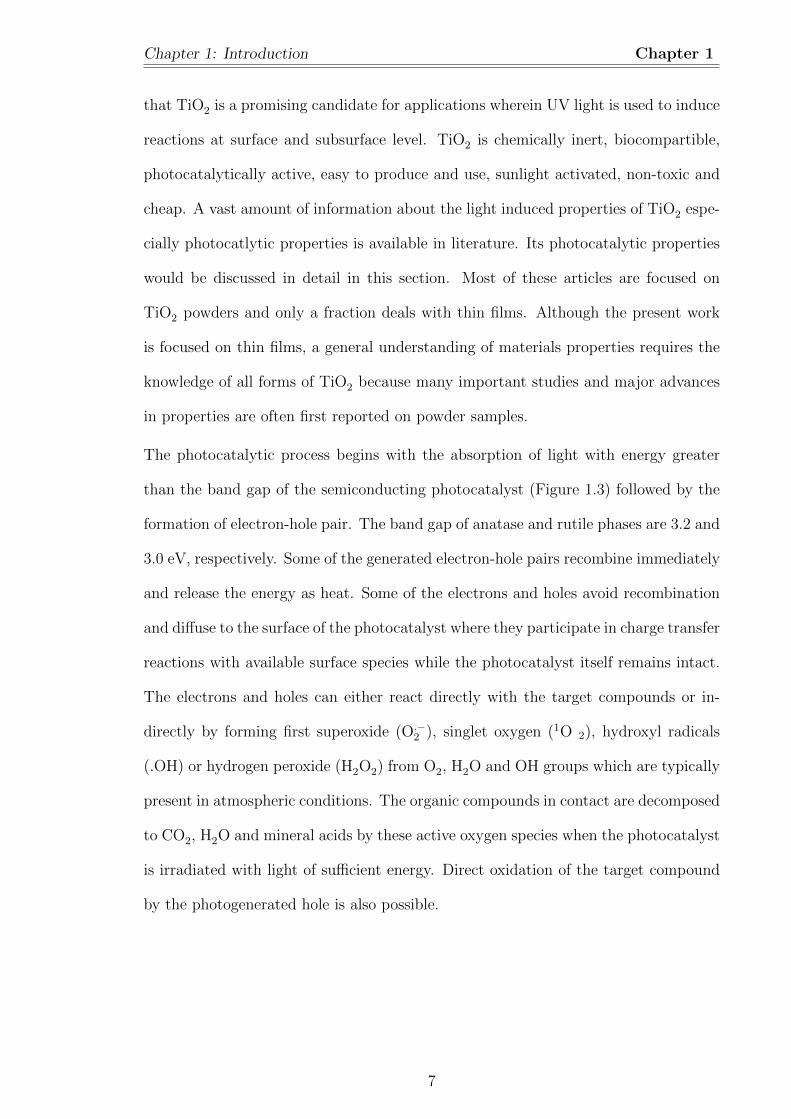
The photocatalytic process begins with the absorption of light with energy greater
than the band gap of the semiconducting photocatalyst (Figure 1.3) followed by the
formation of electron-hole pair. The band gap of anatase and rutile phases are 3.2 and
3.0 eV, respectively. Some of the generated electron-hole pairs recombine immediately
and release the energy as heat. Some of the electrons and holes avoid recombination
and diffuse to the surface of the photocatalyst where they participate in charge transfer
reactions with available surface species while the photocatalyst itself remains intact.
The electrons and holes can either react directly with the target compounds or in-
directly by forming first superoxide (O.−2 ), singlet oxygen (1O 2), hydroxyl radicals
(.OH) or hydrogen peroxide (H2O2) from O2, H2O and OH groups which are typically
present in atmospheric conditions. The organic compounds in contact are decomposed
to CO2, H2O and mineral acids by these active oxygen species when the photocatalyst
is irradiated with light of sufficient energy. Direct oxidation of the target compound
by the photogenerated hole is also possible.
7
Titanium Dioxide Chapter 1
Figure 1.3 – Schematic of the main processes occurring at TiO2 photocatalyst.
The oxidation and reduction mechanisms, involved are dependent on the properties
of the photocatalyst, the nature of the compound being oxidized and the surrounding
medium (water, air and vacuum). The necessary condition is that the reduction reac-
tions by the photogenerated electrons and oxidation reactions by the photogenerated
holes must balance precisely so that the photocatalyst itself remains intact. Among
the two phases of TiO2, anatase phase has been found to possess the best photocat-
alytic properties in spite of its larger band gap (3.2 eV) compared to rutile (3.0 eV).24
The photocatalytic efficiency of TiO2 depends also on the crystalline morphology and
interfacial contact. The Fermi level in anatase is higher by about 0.1 eV than that
of rutile.25 Since, the anatase phase has a higher Fermi level than the rutile phase
by about 0.1 eV, the anatase phase will have lower capacity to adsorb oxygen and
higher degree of hydroxylation (i.e. number of hydroxy groups on the surface) and
thus, should have greater photocatalytic activity than the rutile phase.25–28
As discussed earlier the anatase phase has a wider optical absorption gap, smaller
electron effective mass and hence higher mobility. In addition to this the indirect
band gap of anatase lead to decrease in the recombination rate of the e− − h+ pair
generated upon illumination.
From the application point of view, due to its wide band gap only a small portion of
the solar light, in the UV region, which occupies only 4-5 % of the total solar spectrum,
can be absorbed. Thus, efficient absorption of the visible light which constitutes the
major part of solar spectrum is prevented and the photocatalytic efficiency of TiO2
8
Chapter 1: Introduction Chapter 1
is hindered. Therefore, a stable photocatalyst which could operate under visible light
is an important subject of studies in the past ten years. Various semiconductors
with smaller band gaps have been studied as potential candidates for visible light
photocatalysis, but TiO2 remains the most suitable candidate for large section of
photocatalytic applications. Usually the smaller band gap materials are less stable
and more prone to photocorrosion. A major advantage of TiO2 is its good stability. In
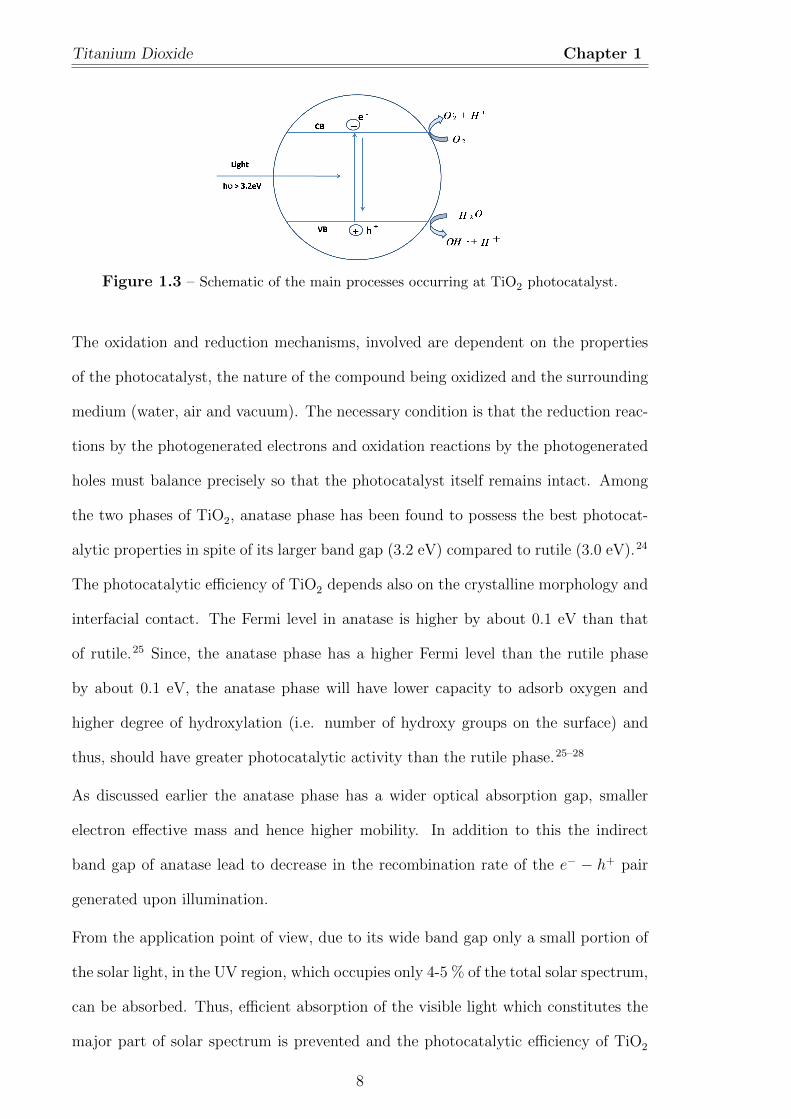
addition, the locations of the valence and conduction band edges in TiO2 are suitable
for photocatalysis.29 Figure 1.4 depicts the valence band maximum and conduction
band minimum of various semi-conductors with respect to the water redox couple.
This helps in finding out which charge transfer reactions are possible on a given
semiconductor. The location of the conduction band should be more negative than
the reduction potential of O2 so that O−2 or HO2 can be created. The production of
O−2 and HO2 by the conduction band electrons is possible on TiO2 but not on WO3 or
Fe2O3 (Figure 1.4). In turn, the location of the valence band should be more positive
than the OH radical generation potential. This requirement is fulfilled by TiO2, ZrO2
and WO3. It should also be kept in mind that the band edge positions and redox
couples move to more negative potentials when the pH is raised.30
Figure 1.4 – Valence and conduction band positions of various semiconductors andrelevant redox couples at pH = 0. (Drawn after refs. [14] and [15]).
9
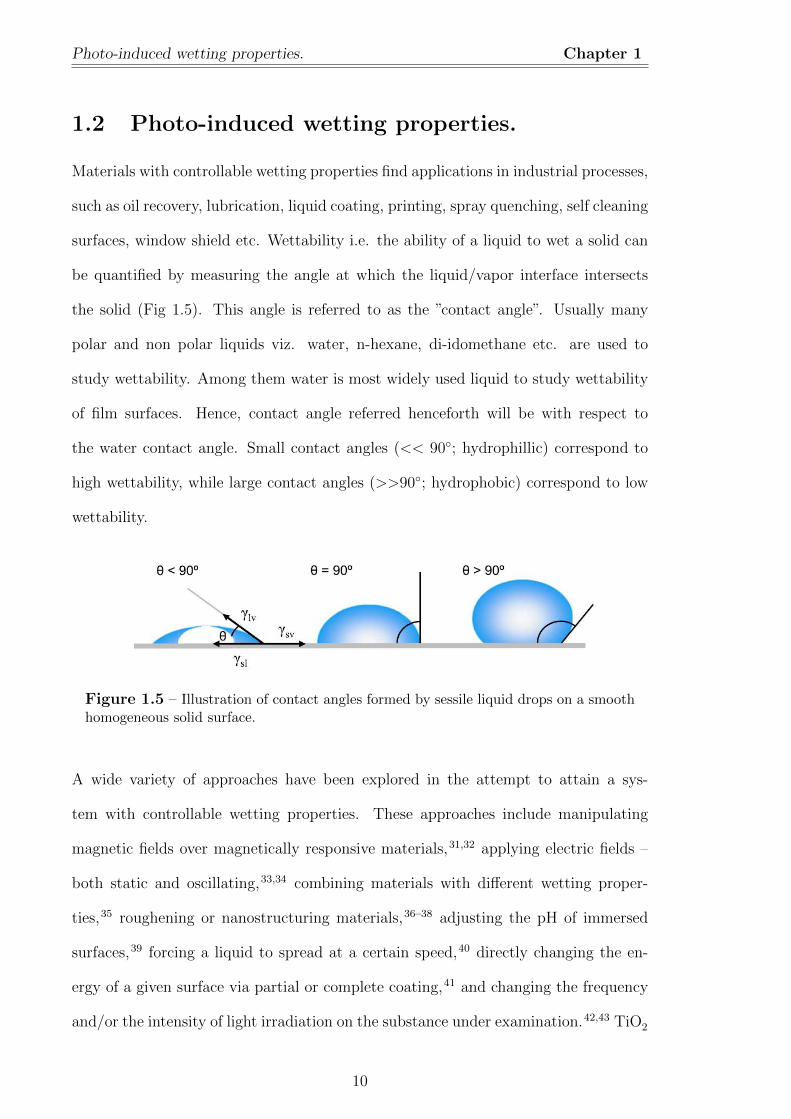
Photo-induced wetting properties. Chapter 1
1.2 Photo-induced wetting properties.
Materials with controllable wetting properties find applications in industrial processes,
such as oil recovery, lubrication, liquid coating, printing, spray quenching, self cleaning
surfaces, window shield etc. Wettability i.e. the ability of a liquid to wet a solid can
be quantified by measuring the angle at which the liquid/vapor interface intersects
the solid (Fig 1.5). This angle is referred to as the ”contact angle”. Usually many
polar and non polar liquids viz. water, n-hexane, di-idomethane etc. are used to
study wettability. Among them water is most widely used liquid to study wettability
of film surfaces. Hence, contact angle referred henceforth will be with respect to
the water contact angle. Small contact angles (<< 90◦; hydrophillic) correspond to
high wettability, while large contact angles (>>90◦; hydrophobic) correspond to low
wettability.
Figure 1.5 – Illustration of contact angles formed by sessile liquid drops on a smoothhomogeneous solid surface.
A wide variety of approaches have been explored in the attempt to attain a sys-
tem with controllable wetting properties. These approaches include manipulating
magnetic fields over magnetically responsive materials,31,32 applying electric fields –
both static and oscillating,33,34 combining materials with different wetting proper-
ties,35 roughening or nanostructuring materials,36–38 adjusting the pH of immersed
surfaces,39 forcing a liquid to spread at a certain speed,40 directly changing the en-
ergy of a given surface via partial or complete coating,41 and changing the frequency
and/or the intensity of light irradiation on the substance under examination.42,43 TiO2
10
Chapter 1: Chapter 1
being a photoactive material as discussed in the previous section, this thesis will have
specific focus on light induced surface wettability of N-doped TiO2 and oxygen de-
ficient TiO2 thin films. It is known that stoichiometric TiO2 surfaces change from
hydrophobic to hydrophillic upon irradiation. However, due to the band gap energy,
this photoinduced hydrophilicity (PIH) will manifest only when the wavelength of the
irradiation is smaller than visible light wavelengths.44 The presented experiments will
explore applications based on this photoinduced wetting property as well as extending
the range of response to visible light wavelengths. The details of theory pertaining to
the contact angle will be discussed in Chapter 2. For the present discussion purpose,
it can be concluded that pristine TiO2 needs band gap alteration for utilization of vis-
ible light spectrum from solar radiation. There are numerous studies on the methods
to utilize visible light using TiO2 photocatlysts, which will be briefly discussed in the
following section.
1.3 Doping
The efficient utilization of solar energy is one of the major goals in the modern era.
Since the discovery of water splitting over TiO2 by Fujishima and Honda,45 the pho-
tocatalytic properties of TiO2 have been widely studied. Of the materials being de-
veloped for photocatalytic applications, TiO2) remains the most promising because
of its high efficiency, low cost, chemical inertness, and photostability.46–48 However,
the widespread technological use of TiO2 is impaired by its wide band gap (3.2 eV
for anatase and 3 eV for Rutile), which requires UV irradiation for photocatalytic
activation. Since, UV light accounts for only a small fraction (8%) of the sunlight
compared to visible light (45%), any shift in the optical response of TiO2 from the UV
to the visible spectral range will have a profound positive effect on the photocatalytic
efficiency of the material.49,50 To engineer any change in the band gap, one needs to
understand the band structure of the TiO2, which is briefly discussed here. Electronic
11
Doping Chapter 1
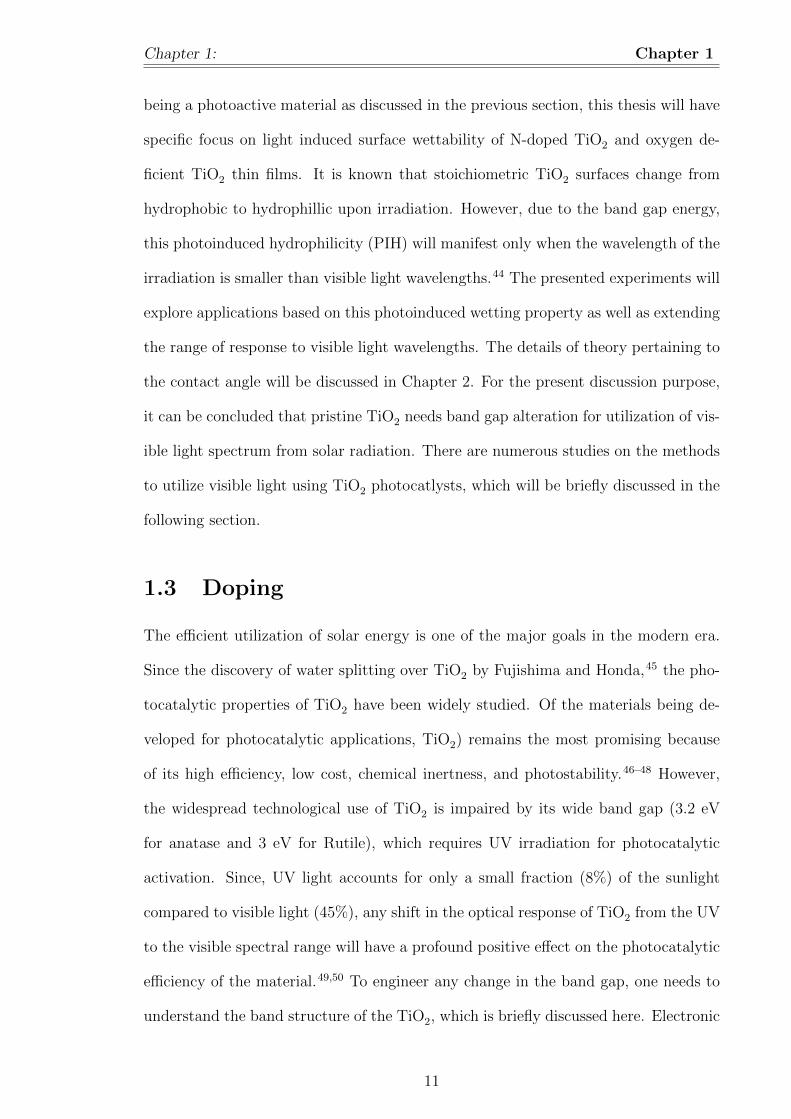
structure of TiO2 has been determined experimentally by various groups.51–54 The
valence bands of TiO2 can be split into three main regions: the σ bonding in the
lower energy region mainly due to O-p σ bonds; the π bonding in the middle energy
region; and O-p π states in the higher energy region due to O-p π nonbonding states
where the hybridization with d states of Ti is almost negligible. The conduction band
is split into Ti eg (> 5 eV) and t2g bands (< 5 eV). The dxy states of t2g are domi-
nantly located at the bottom of the conduction band. The rest of the t2g bands are
anti-bonding with p states of oxygen. The main peaks of the t2g bands are identified
to be constituted by mostly dyz and dzx states.51 The molecular orbital energy level
diagram for TiO2 is given in Fig 1.6.
Figure 1.6 – Molecular orbital energy level diagram of TiO2 taken from ref51
Several methods were adopted to shift the optical response of TiO2 from the UV
to the visible spectral range. Transition metal doping, non-metal doping, surface
sensitization are the most widely used methods to change the optical response of
TiO2. Since doping is the widely used method for enhancing the visible light activity
of TiO2, the recent developments in the area is discussed in the next section. Among
the other methods, surface sensitization is briefly discussed here.
In surface sensitization, different semiconductor photocatalysts having different energy
12
Chapter 1: Chapter 1
levels are coupled.55–58 The photocatalyst surface is loaded with another semiconduc-
tor of lower band gap that can be easily excited by visible light, such that the electron
transfer from the conduction band of the narrow band gap semiconductor to that of
TiO2 can lead to efficient charge separation thereby reducing the e− − h+ recombi-
nation rates. The benefits of this method are expansion of absorption spectrum and
efficient charge separation. The synergic effect of the composite semiconductors is
used in dye-sensitized solar cells.
1.3.1 Doped TiO2 Photocatalysts
An initial approach to shifting the optical response of TiO2 from the UV to the
visible spectral range has been the doping with transition metals and subsequently
with anions. In particular, the primary aim was to narrow the band gap. When the
band gap is narrowed, the oxidation potential of the valence band holes and/or the
reduction potential of the conduction band electrons decreases and the photocatalytic
activity can drop dramatically. This is the case especially if the conduction band edge
drops below the reduction potential of O2 or if the valence band edge rises so that
the oxidation of H2O or OH groups to OH is prevented. Therefore, it is beneficial to
focus on the modification of the valence band while trying to narrow the band gap.
When separate energy states are created in the band gap the outcome can also be a
dramatic decrease in activity. This is caused by the creation of recombination centers
for electrons and holes and it is not clear which energy states are beneficial and which
are not.
Initially, doping of TiO2 has been done with transition-metal elements.59–62 In this
case the modification of the electronic states occurs closer to the conduction band of
TiO2. This typically results when some of the titanium ions are substituted by other
transition metal cations leading to mixing of the d orbitals or creation of separate
impurity levels below the conduction band.
In the case of cation doping, the observed increase in photocatalytic activity is due
13
Doping Chapter 1
to enhanced charge carriers in the presence of the effective dopant. However, metal
doping has several drawbacks. The doped materials have been shown to suffer from
thermal instability, and the metal centers act as electron traps, which reduces the
photocatalytic efficiency. For this reason the photocatalytic activity is very sensitive
to the concentration of the cationic dopant. The photoreactivity of cation doped TiO2
was reported to be a complex function of the dopant concentration, the energy level of
the dopants within the TiO2 lattice, their d electron configuration, the distribution of
dopants, and the light intensity.63 The absorption of TiO2 can be shifted perhaps more
efficiently towards visible light with transition metal doping but the photocatalytic
properties of these materials tend to be usually worse. Furthermore, the preparation of
transition-metal doped TiO2 requires more expensive ion-implantation facilities.64,65
Recently, it was shown that the desired band gap narrowing of TiO2 can be better
achieved by using anionic dopant species such as N, S, C and F rather than metals
ions.48–50,66,67 Especially N, S and C doping is expected to decrease the band gap of
TiO2 due to the metallic nature of the compounds TiN, TiS2 and TiC. The resulting
materials are often referred to as anion doped TiO2 because the dopant is targeted
to substitute O2− ions in the TiO2 lattice. The p orbitals of these dopants will mix
with the O 2p orbitals in TiO2 which causes the rise of the valence band. With small
dopant levels, the mixing is not complete, however, isolated energy states just above
the valence band are created. From the results of the research conducted on anion
doping since early 1990s it can be assumed that the increase in photocatalytic activity
is because of band gap narrowing and/or creation of mid gap localized states depend-
ing on dopant concentration. However, controversial experimental results have been
reported in literature, and different theoretical models have been proposed to analyze
these phenomena. The mechanisms of the optical and photocatalytic properties of
anion-doped semiconductors are still open to discussion.
In addition to doping, creation of oxygen vacancies in TiO2 has been reported to cause
14
Chapter 1: Chapter 1
visible light photocatalytic activity as well.68–70 It is well known that when TiO2 is
reduced it loses oxygen and visible light absorbing F-type color centers are created in
the O vacancies.71 Nakamura et al.68 prepared reduced anatase TiO2 powders by a
H2 plasma treatment at 400 ◦C. No difference in the crystal structure, crystallinity,
and specific surface area was observed between raw TiO2 and plasma-treated TiO2
materials. Only the color of the powders turned from white to light yellow. The
H2 plasma-treated powders showed photocatalytic activity in NOx removal, at wave-
lengths 450-600 nm, whereas the untreated powder did not. Activity under UV light
was also slightly better compared to the undoped sample. Electron spin resonance
(ESR) measurements with visible light irradiation showed a signal for the F+ color
center (O vacancy with one trapped electron) only in the plasma treated samples.
The intensity of the signal correlated fairly well with the NOx removal rate when
different visible light wavelengths were used, thereby indicating that oxygen vacancy
states played an important role in the visible light activity. The energy states caused
by oxygen vacancies were reported to lie about 0.75-1.18 eV below the conduction
band of TiO2.68 Excitation of electrons from the valence band to these states is thus
possible using visible light. Holes left in the valence band are then free to oxidize
compounds directly or through the creation of OH.
1.4 Nitrogen Doping
Stimulated by the report of Asahi et al. in 2001,49 recently there has been an explo-
sion of interest in TiO2 doping with non-metal ions, especially with nitrogen.72 Many
authors have reported that N-doped titanium dioxide (N-TiO2), shows a significant
catalytic activity in various reactions performed under visible light irradiation.50,73–77
However, there is also an open debate on how doping achieves this, as well as disagree-
ments in many of the conclusions drawn from the results.78–80 One of the reasons for
this, is different strategies used for incorporation of nitrogen into titanium dioxide,
15
Nitrogen Doping Chapter 1
either based on chemical reactivity i.e. sol–gel synthesis73,74,81,82, chemical treatments
of the bare oxide,50,73,75,83 oxidation of titanium nitride,84 or by physical methods such
as ion implantation,85–87 magnetron sputtering.88,89 These different procedures lead
to materials with different properties.
Asahi et al. carried out first-principles calculations to examine the effects of substitu-
tional doping of C, N, S, P and F for O in anatase TiO2.49 The computational results
suggested that nitrogen doping would be the best option. They prepared nitrogen
doped TiO2 films by sputtering a TiO2 target in an N2 (40 %)/Ar gas mixture and
annealing at 550 ◦ C in N2 gas for 4 hours. Nitrogen doped TiO2 powders were also
prepared by annealing pure anatase TiO2 powder in NH3 gas at 600 ◦C for 3 hours.
The samples thus prepared were yellowish with a clear visible light absorption tail
reaching to around 500 nm. The substitutional nitrogen doping in the samples was
confirmed using XPS. They observed enhanced photocatalytic activities for nitrogen
doped samples under UV light in comparison to undoped TiO2.
The origin of visible light activity in nitrogen doped TiO2 materials have been investi-
gated and both substitutional and interstitial nitrogen doping has been found effective
in increasing the visible light absorption .49,75,90–92 Nitrogen doping has been also re-
ported to lower the formation energy of oxygen vacancies which can have a strong
impact on the photocatalytic properties.86,92 Visible light photocatalytic activity in
nitrogen doped TiO2 has been reported in many cases but several studies have also
reported serious degradation of photocatalytic performance in these materials.93,94 It
appears that nitrogen doping increases the amount of recombination centers in TiO2
which destroys the photocatalytic activity. The preparation route obviously plays a
decisive role in the outcome.
Properties and behavior of N-TiO2 depends on the chemical nature and the location of
nitrogen in the solid. Presence of different chemical species like NOx,73,74,91,92,95 substi-
tutional N,49,75,76,81 or NHx75 have been proposed. It is essential to know whether the
16
Chapter 1: Chapter 1
species are primarily interstitial or substitutional, because the behavior of these two
species is very different and affect the material properties accordingly. A schematic
of the effect of substitutional and interstitial doping is given in Fig 1.7.
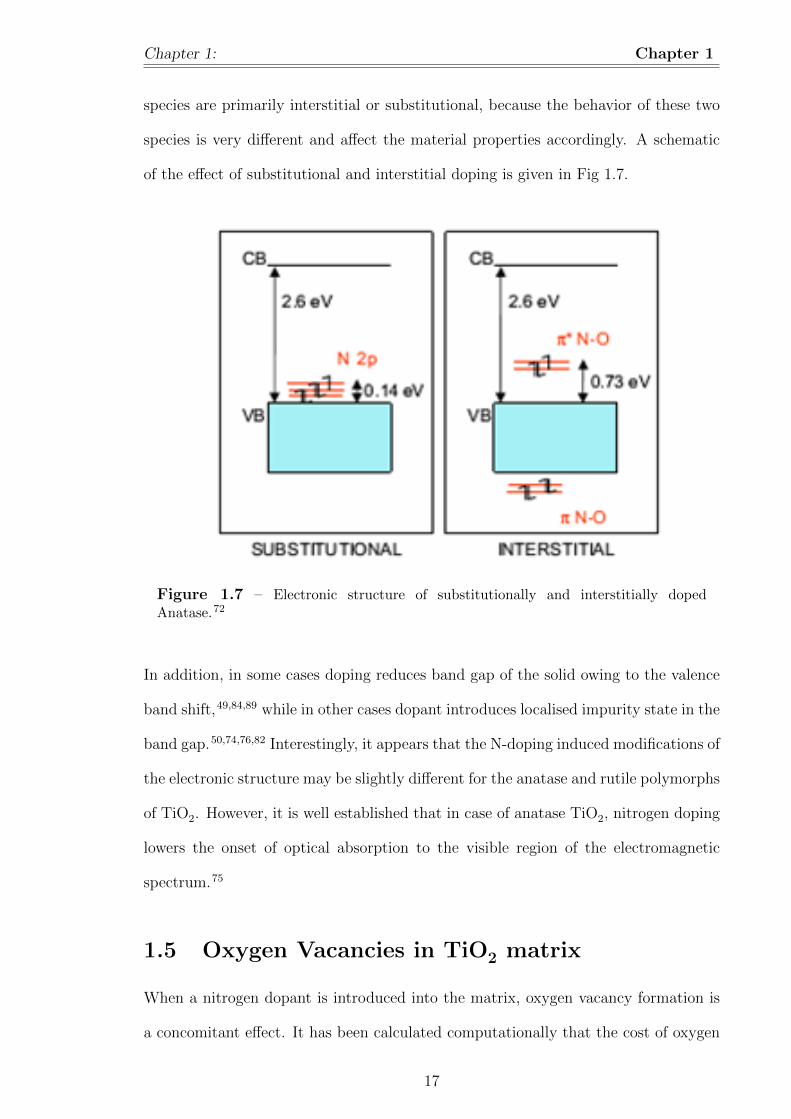
Figure 1.7 – Electronic structure of substitutionally and interstitially dopedAnatase.72
In addition, in some cases doping reduces band gap of the solid owing to the valence
band shift,49,84,89 while in other cases dopant introduces localised impurity state in the
band gap.50,74,76,82 Interestingly, it appears that the N-doping induced modifications of
the electronic structure may be slightly different for the anatase and rutile polymorphs
of TiO2. However, it is well established that in case of anatase TiO2, nitrogen doping
lowers the onset of optical absorption to the visible region of the electromagnetic
spectrum.75
1.5 Oxygen Vacancies in TiO2 matrix
When a nitrogen dopant is introduced into the matrix, oxygen vacancy formation is
a concomitant effect. It has been calculated computationally that the cost of oxygen
17
Oxygen Vacancies in TiO2 matrix Chapter 1
vacancies (Voformation) in bulk anatase TiO2 is drastically reduced in the presence
of N-impurities, from 4.2 eV in pure TiO2 to 0.6 eV in N-doped TiO2.72 Introducing
defects such as oxygen vacancies is one among many methods to improve photoeffi-
ciency of TiO2.96 Oxygen vacancies create trap centers, rather than the recombination
centers unlike the high doping case, and results in the variation of band gap of pristine
TiO2.97
1.5.1 Issues related to oxygen vacancies synthesis
A common factor that keeps appearing in studies on C and N doped visible light
active TiO2 photocatalysts is oxygen vacancies. Because they form so easily and
have significant effects on the properties of TiO2, their role is important. Recently,
Kuznetsov et al. conducted a systematic analysis of the spectral features of various
undoped and doped TiO2 specimens reported in the literature.98 The purpose of the
work was to gain understanding on the origin of visible light activity in samples
doped with different elements. First, absorption bands of various reduced undoped
TiO2 samples, mostly single crystal, were derived from the literature. Six absorption
maxima could be distinguished ranging from 0.73 to 2.93 eV. Next, a careful analysis
of the spectral features of various N, C and S doped samples revealed that they each
contain the same three highest energy absorption bands as detected in the undoped
reduced TiO2 samples. The authors therefore concluded that the origin of visible light
absorption in the visible light active doped TiO2 samples are F-type color centers
associated with oxygen vacancies. These same visible light absorbing defects exist in
the undoped reduced TiO2 and the role of the various dopants seems to be merely to
stabilize and increase the number of these intrinsic defects.
Incorporation of oxygen vacancies into the matrix have been carried out using different
approaches. These methods include surface hydrogenation,99 vacuum activation97
and plasma treatment.100 However, all these methods have some pros and cons. In
hydrogenation method, the surface of TiO2 is terminated with hydrogen leading to
18
Chapter 1: Chapter 1
an enhanced photocatalytic activity101 in visible region; however, it is still unknown
that how does the hydrogenation modify a surface to enhance its optical performance
(photocatalytic activity).102 The drawback of the hydrogenation method is that it
requires high temperature and the obtained TiO2 sample/film are black,101 which
makes the films unable for many optoelectronic applications, such as a transparent
electrode in optoelectronic devices. Both the vacuum activation and plasma treatment
methods create highly stable Ti 3+ and oxygen vacancies.97,100
In vacuum activation method, the sample exhibit higher absorption intensity but it
appears brown in color that may render it unable for transparent electrode applica-
tions. In case of plasma treatment methods, generally hydrogen gas is used to create
Ti3+ and oxygen vacancies in TiO2, but it is avoidable to use such a hazardous and
expensive gas. Other than hydrogen there are few reports on the use of argon103, oxy-
gen104 and nitrogen plasma105 for surface modification of TiO2. It is also known that
the implementation of gas in the treatment chamber may be hazardous; therefore, it
is always required to avoid the use of hazardous gas, and to implement a simple and
low cost approach to meet the requirements.96 Hence, oxygen insertion pathway is
optimised depending on the application.
1.6 TiO2 Thin films
At the initial stage of the study of photocatalysis, TiO2 was used in the form of
powders. After photocatalytic reaction, a filtration step was needed to separate pho-
tocatalysts from slurry. This process adds extra cost to commercial applications.
In order to solve the shortcoming of separating TiO2 particles and avoid the filtra-
tion step, TiO2 thin films were prepared using all types of common liquid and vapor
phase deposition methods.106–109 Photocatalytic results demonstrate that the films
are almost as effective as powder TiO2 catalysts which are used in slurry suspension
systems. In the following section, the introduction to synthesis techniques of TiO2
19
TiO2 Thin films Chapter 1
thin films is briefly discussed.
Among liquid based thin film deposition methods the sol-gel technique is by far the
most popular in the preparation of photocatalytic TiO2 thin films.110–112 The sol-gel
technique is a versatile method offering many possibilities to tune the properties of the
thin film. Dopants and other modifying agents can be easily introduced to the starting
sol to change the properties of the final film. Typically titanium salts or alkoxides
are used as precursors. The precursors are hydrolyzed in a controlled manner thus
forming a polymeric network of Ti-O bonds in a solvent. This state is called the sol,
because it contains colloidal particles in solution. When the solvent evaporates to the
extent that a continuous 3D network of solid material forms, the state has turned into
a gel. The gel is dried to remove all the solvent and usually crystallized by annealing
at high temperature.
Among other liquid phase methods, low temperature liquid phase preparation is also
widely used. This include the direct growth of anatase from TiF4 solutions and
hydrothermal treatment of amorphous TiO2 where temperatures close to 100 ◦C are
enough to induce crystallization.113,114
Other than liquid phase methods, the other method which is used widely is gas phase
methods. Gas phase methods generally lead to higher quality thin films than liquid
phase methods. Lower impurity contents and higher film densities are usually ob-
tained. Vapor deposited TiO2 films are often crystalline in as-deposited condition
itself and a separate heat treatment is not necessary. TiO2 thin films prepared by the
sol-gel technique typically require annealing temperatures around 400-500 ◦C to crys-
tallize whereas vapor phase techniques can produce crystalline anatase TiO2 at much
lower temperatures, e.g. close to 200 ◦C. However, the vacuum equipment makes gas
phase methods significantly more expensive as compared to liquid phase methods.
Sputtering is a physical gas phase deposition method where material is removed from
a target using high energy ions and then collected on a substrate to grow a film. Argon
20
Chapter 1: Chapter 1
is typically used as the sputtering gas. Magnetrons are usually used as the sputtering
source. The method is principally very straightforward. Ideally, the growing film will
have the same composition as the target. In the case of oxides, however, the films tend
to become oxygen deficient. For this reason reactive sputtering is often used where a
reactive gas like O2 is introduced simultaneously into the deposition chamber. Doping
can be accomplished by adding yet another gas such as N2.49
Evaporation is another physical method used to grow photoactive TiO2 thin films. In
this method the source material is heated either resistively or with an electron beam
in high vacuum which causes it to evaporate. The evaporated material is collected on
a substrate thus forming a thin film.
CVD has been used in many studies to prepare photocatalytic TiO2 thin films.115–118
Typically, a decomposition CVD reaction is used where a titanium alkoxide vapor is
led in a controlled manner over the substrate at a temperature where the titanium
precursor molecules decompose leading to TiO2 growth.116,117 Plasma enhanced CVD
(PECVD) has been used to deposit photocatalytic TiO2 thin films using Ti(iOPr)4
and O2 plasma.118 A halide precursor, TiCl4, together with ethyl acetate as the oxygen
source has also been used in the CVD of photocatalytic TiO2 thin films.115
1.7 Spray pyrolysis Deposition of TiO2 Thin films
Among the above mentioned methods for depositing thin films, sol-gel coating is the
most cost effective and simple to use. The two mentioned sol-gel techniques, dip
and spin coating require repeated dipping/spinning and heat treatment. Spray py-
rolysis deposition (SPD) technique is a low cost, easy to manipulate and an easily
implementable technique suitable for large surface area coating in a single step. The
synthesis of TiO2 thin films by spray pyrolysis deposition technique have been re-
ported in the literature.119,120 The spray pyrolysis process consists of atomization of
the precursor solution containing the precursor, and transport of the resulting aerosols
21
Spray pyrolysis Deposition of TiO2 Thin films Chapter 1
towards the hot substrate by means of a gas stream.121,122 Within the hot zone above
the substrate, the precursors undergo decomposition in the presence of oxygen result-
ing in the formation of the oxide films on the substrate by surface reaction.123 The
temperature of the substrate influences the parameters: aerosol transport towards
the substrate, solvent evaporation, possibility of the droplets impacting the surface
and the dynamics of their spreading and most importantly the mechanistic path way
involved in decomposition.121,124 Therefore, the substrate temperature plays a major
role in defining the morphology, composition and adherence of the deposited film. The
solvents with lower density and surface tension (such as the alcohol based ones) enable
creation of droplets of smaller size. The solvents with lower boiling point vaporize eas-
ily and this can have a major consequence for achieving pyrolytic decomposition.125,126
Highly soluble precursors are generally preferred, and volatile molecules are required
as co-product for accelerating pyrolysis based decomposition [126,127]. In most cases,
the chemical spray pyrolysis process uses metallo-organic compounds in non-aqueous
solvents as precursor.127 The deposition of films by spray pyrolysis of an aqueous so-
lution has also been reported in literature.128 Ultrasonic spray pyrolysis deposition
technique is akin to a open atmospheric chemical vapor deposition system hence, it
is a perfect tool for the preparation of different kinds of undoped and doped TiO2
films and nanostructures for coating and photocatalytic study in large surface area,
in comparison to other physical methods of deposition of thin films like magnetron
sputtering, pulsed laser deposition, electron beam evaporation, activated reactive va-
por deposition etc. To conclude, anatase TiO2 is the metastable polymorph of TiO2.
It has always remained a primary concern for the researchers to synthesize single
phase anatase TiO2 and optimise its photo responsive properties. In addition, the
wide band gap of anatase has also led the researchers to do band gap engineering by
various methods with various dopants such as metals, non-metals, oxygen vacancies
etc. Hence, this thesis is primarily focused on synthesis and studying the properties
of N-doped and oxygen deficient anatase TiO2.
22

Chapter 1: Chapter 1
1.8 Overview of the thesis
The thesis spans over five chapters. The content of each chapter is described below in
brief. Chapter 1 briefly introduces the general properties of TiO2, necessity of doping,
effect of doping with nitrogen, need for studying the oxygen vacancies in the matrix
and various methods of introducing oxygen vacancies.
Chapter 2 describes various experimental methods used for synthesizing and charac-
terising N-doped and oxygen deficient anatase thin films. The synthsizing tool includes
a custom built spray pyrolysis unit used for synthesis of thin films. In addition, ba-
sic principles of various characterising tools such as GIXRD (Grazing Incidence X-ray
Diffractometer (Bruker D8 Discover) used for crystallographic measurements, FESEM
(Field Emission Scanning Electron Microscope of Carl Zeiss make) used for studying
the microstructure, Contact angle set-up used for studying water contact angle, UV-
Vis spectrometer used for studying the optical properties, XPS(X-ray Photoelectron
Spectrometer)used for studying chemical nature and position of the dopant, XAS
(X-ray absorption Spectrometer; Indus-II) used for pinpointing the dopant position
and understanding electronic transitions have been briefly discussed. This chapter
also briefly discusses the theoretical background behind the X-ray absorption spec-
troscopy .
Chapter 3 focuses on the synthesis and characterisation of N-doped Anatase TiO2
thin films. This chapter emphasizes on the optical property, chemical and bonding
nature of the nitrogen dopant using XPS and X-ray Absorption studies(XAS) (Indus-
2 synchrotron source). This chapter discusses the use of XAS to pinpoint the exact
location of nitrogen dopant (Interstitial or substitutional) in TiO2 matrix.
Chapter 4 describes two types of synthetic methods adopted for deliberate insertion
of oxygen vacancies in TiO2 matrix, characterisation of the films by using GIXRD,
FESEM and it’s X-ray absorption studies to conclude the insertion of oxygen vacan-
cies in the matrix.
23

Overview of the thesis Chapter 1
Chapter 5 details the contact angle studies of the N-doped TiO2 and oxygen deficient
TiO2. The kinetics of the change in contact angle upon photo irradiation and under
dark condition is also elucidated in this chapter.
Chapter 6 summarizes the major findings of the studies carried out on spray pyrolysis
synthesized anatase TiO2 and the directions for future work.
24
Bibliography
[1] Hagfeldt, A. and Gratzel, M. Light-Induced Redox Reactions in Nanocrystalline
Systems. Chem. Rev. 1995, 95, 49.
[2] Hoffmann, M. R.; Martin, S. T.; Choi, W.; Bahnemann, D. W. Environmental
Applications of Semiconductor Photocatalysis. Chem. Rev. 1995, 95, 69.
[3] Linsebigler, A. L.; Lu, G.; Yates, J. T.Photocatalysis on TiO2 Surfaces: Princi-
ples, Mechanisms, and Selected Results. Chem. ReV. 1995, 95, 735.
[4] Chen X.; Mao, S. S. Titanium Dioxide Nanomaterials: Synthesis, Properties,
Modifications, and Applications. Chem. Rev. 2007, 107, 2891.
[5] Barringer E A and Bowen H K High-Purity, Monodisperse TiOz Powders by
Hydrolysis of Titanium Tetraethoxide. 1. Synthesis and Physical Properties.
Langmuir. 1985, 1, 420.
[6] Jean, J. H.; Ring, T. A. Nucleation and Growth of Monosized TiO2 Powders
from Alcohol Solution. Langmuir, 1986, 2, 251.
[7] Look, J-L.; Zukoski, C. F. Alkoxide-Derived Titania Particles: Use of Elec-
trolytes to Control Size and Agglomeration levels. J. Am. Ceram. Soc. 1992,
75, 1587.
[8] Landmann,M. ; Rauls, E. ; Schmidt, W. G. The Electronic Structure and Optical
Response of Rutile, Anatase and Brookite TiO2. J. Phys.: Condens. Matter.
2012, 24, 195503 (6pp).
25
BIBLIOGRAPHY Chapter 1
[9] Brus, L. E. Electron-electron and electron-hole Interactions in Small Semicon-
ductor Crystallites: The Size Dependence of the Lowest Excited Electronic
State. The Journal of Chemical Physics. 1984, 80 (9), 4403.
[10] Efros, A. I. L.; Efros, A. L. Interband Absorption of Light in a Semiconductor
Sphere. Sov. Phys. Semicond. 1982, 16, 772.
[11] Zhang, H.; Banfield, J. Understanding Polymorphic Phase Transformation Be-
havior during Growth of Nanocrystalline Aggregates: Insights from TiO2. J.
Phys. Chem.B. 2000, 104, 3481.
[12] Naicker, P. K.; Cummings, P. T.; Zhang, H.; Banfield, J. F. Characterization
of Titanium Dioxide Nanoparticles Using Molecular Dynamics Simulations. J.
Phys. Chem. B. 2005, 109, 15243.
[13] Zhang, H; Banfield J. Thermodynamic Analysis of Phase Stability of Nanocrys-
talline Titania. J. Mater. Chem. 1998, 8, 2073.
[14] Navrotsky A. Energetics of Nanoparticle Oxides: Interplay between Surface
Energy and Polymorphism. Geochem. Trans. 2003, 4, 34.
[15] Cheng, H.; Ma, J.; Zhao, Z.; Qi, L. Hydrothermal Preparation of Uniform
Nanosize Rutile and Anatase Particles. Chem. Mater. 1995, 7, 663.
[16] Yanagisawa, K.; Ovenstone, J. Crystallization of Anatase from Amorphous Ti-
tania Using the Hydrothermal Technique: Effects of Starting Material and Tem-
perature. J. Phys. Chem.B. 1999, 103, 7781.
[17] Li, J-G.; Ishigaki, T.; Sun, X. Anatase, Brookite, and Rutile Nanocrystals via
Redox Reactions under Mild Hydrothermal Conditions: Phase-Selective Syn-
thesis and Physicochemical Properties. J. Phys. Chem. C. 2007, 111, 4969.
26
BIBLIOGRAPHY Chapter 1
[18] Aruna, S. T.; Tirosh, S.; Zaban, A. Nanosize Rutile Titania Particle Synthesis
via Hydrothermal Method without Mineralizers. J. Mater. Chem. 2000, 10,
2388.
[19] Reyes-Coronado,D.; Rodrıguez-Gattorno, G.; Espinosa-Pesqueira, M. E.; Cab,
C.; Coss,R de.; Oskam, G. Phase-pure TiO2 Nanoparticles: Anatase, Brookite
and Rutile. Nanotechnology. 2008, 19, 145605.
[20] Rafieian,D. ; Ogieglo, W.; Savenije, T.; Lammertink, R. G. H. Controlled Forma-
tion of Anatase and Rutile TiO2 Thin Films by Reactive Magnetron Sputtering.
AIP Advances. 2015, 5, 097168.
[21] Zhang, J.; Zhou, P.; Liu, J.; Yu, J. New Understanding of the Difference of
Photocatalytic Activity among Anatase, Rutile and Brookite TiO2. Phys. Chem.
Chem. Phys. 2014, 16, 20382.
[22] Xu, M.; Gao, Y.; Moreno, E.M.; Kunst, M.; Muhler, M.; Wang, Y.; Idriss, H.
and Woll, C. Photocatalytic Activity of Bulk TiO2 Anatase and Rutile Single
Crystals using Infrared Absorption Spectroscopy. Phys. Rev. Lett. 2011, 106,
138302.
[23] Tang, H.; Levy, F.; Berger, H.; Schmid, P. E. Urbach Tail of Anatase TiO2.
Physical Review B. 1995, 52(11),7771.
[24] Mo, S.; Ching, W. Electronic and Optical Properties of Three Phases of Tita-
nium Dioxide: Rutile, Anatase, and Brookite. Phys. Rev. B. 1995, 51, 13023.
[25] Maruska, H.P.; Ghosh, A.K. Photocatalytic Decomposition of Water at Semi-
conductor Electrodes. Solar Energy. 1978, 20, 443.
[26] Tanaka, K.; Capule,M. F. V. ; Hasinaga, T. Effect of Crystallinity of TiO2 on
its Photocatalytic Action. Chem. Phys. Lett. 1991, 187, 73.
27
BIBLIOGRAPHY Chapter 1
[27] Gerischer, H. ; Heller, A.J. Photocatalytic Oxidation of Organic Molecules at
TiO2 Particles by Sunlight in Aerated Water. Electrochem. Soc. 1992, 139, 113.
[28] Bickley, R.I.; Gonzales-Carreno, T.; Lee, J.L.; Palmisano, L. ; Tilley, R.J.D.
A Structural Investigation of Titanium Dioxide Photocatalysts. J. Solid State
Chem. 1991, 92, 178.
[29] Mills, A.; LeHunte, S. An overview of Semiconductor Photocatalysis. J. Pho-
tochem. Photobiol. A. 1997, 108, 1.
[30] Fujishima, A.; Zhang, X. ; Tryk, D.A. TiO2 Photocatalysis and related Surface
Phenomena. Surf. Sci. Rep. 2008, 63, 515.
[31] Nguyen, N. T.; Zhu, G.; Chua, Y. C.; Phan, V. N.; Tan, S. H. Magneto-wetting
and Sliding Motion of a Sessile Ferrofluid Droplet in the Presence of a Permanent
Magnet. Langmuir, 2010, 26, 12553.
[32] Zhou, Q.; Ristenpart, W. D.; Stroeve, P. Magnetically Induced Decrease in
Droplet Contact Angle on Nanostructured Surfaces. Langmuir 2011, 27, 11747.
[33] Chen, L.; Bonaccurso, E. Electrowetting From Statics to Dynamics. Adv. Colloid
Interface Sci. 2014, 210, 2.
[34] de Gennes, P. G. Wetting: Statics and Dynamics. Rev. Mod. Phys. 1985, 5 7,
827.
[35] de Gennes, P.-G.; Brochard-Wyart, F.; Quere, D. Capillarity and Wetting Phe-
nomena: Drops, Bubbles, Pearls, Waves; 1st ed.; Springer Science: New York,
NY, USA, 2010.
[36] Lee, D.; Rubner, M. F.; Cohen, R. E. All-Nanoparticle Thin-Film Coatings.
Nano Lett. 2006, 6, 2305.
28

BIBLIOGRAPHY Chapter 1
[37] Dettre, R. H.; Johnson Jr., R. E. Contact Angle Hysteresis. II. Contact Angle
Measurements on Rough Surfaces. Adv. Chem. Ser. 1964, 43, 136.
[38] Marmur, A. The Lotus Effect: Superhydrophobicity and Metastability. Lang-
muir 2004, 20, 3517.
[39] Liu, H.; Wang, C.; Zou, S.; Wei, Z.; Tong, Z. Simple, Reversible Emulsion
System Switched by pH on the Basis of Chitosan Without Any Hydrophobic
Modification. Langmuir 2012, 28, 11017.
[40] Eggers, J.; Stone, H. A. Characteristic Lengths at Moving Contact Lines for
a Perfectly Wetting Fluid: The Influence of Speed on the Dynamic Contact
Angle. J. Fluid Mech. 2004, 505, 309.
[41] Puah, L. S.; Sedev, R.; Fornasiero, D.; Ralston, J.; Blake, T. Influence of Surface
Charge on Wetting Kinetics. Langmuir. 2010, 26, 17218.
[42] Ichimura, K. Light-Driven Motion of Liquids on a Photoresponsive Surface.
Science. 2000, 288, 1624.
[43] Wang, J.; Mao, B.; Gole, J. L.; Burda, C. Visible Light Driven Reversible
and Switchable Hydrophobic to Hydrophilic Nitrogen-Doped Titania Surfaces:
Correlation with Photocatalysis. Nanoscale. 2010, 2, 2257.
[44] Wang, R.; Hashimoto, K.; Fujishima, A. Light-Induced Amphiphilic Surfaces.
Nature. 1997, 388, 431.
[45] Fujishima, A.; Honda, K. Electrochemical Photolysis of Water at a Semicon-
ductor Electrode. Nature. 1972, 238, 37.
[46] Serpone, N.; Pelizzetti, E. Photocatalysis: Fundamentals and Applications; Wi-
ley: New York, 1989.
29
BIBLIOGRAPHY Chapter 1
[47] Linsebigler, A. L.; Lu, G.; Yates, J. T. Photocatalysis on TiO2 Surfaces: Prin-
ciples, Mechanisms, and Selected Results. Chem. ReV. 1995, 95, 735.
[48] Burda, C.; Lou, Y.; Chen, X.; Samia, A. C. S.;Stout, J.; Gole, J. L. Enhanced
Nitrogen Doping in TiO2 Nanoparticles. Nano Lett. 2003, 3, 1049.
[49] Asahi, R.; Morikawa, T.; Ohwaki, T.; Aoki, K.; Taga, Y. Visible Light Photo-
catalysis in Nitrogen Doped Titanium Oxides. Science. 2001, 293, 269.
[50] Irie, H.; Wanatabe, Y.; Hashimoto, K. Nitrogen-Concentration Dependence on
Photocatalytic Activity of TiO2−xNx Powders. J. Phys. Chem. B. 2003, 107,
5483.
[51] Asahi, R.; Taga, Y.; Mannstadt, W.; Freeman, A. Electronic and Optical Prop-
erties of Anatase TiO2 J. Phys. ReV. B. 2000, 61, 7459.
[52] Wu, Z. Y.; Ouvrared, G.; Gressier, P.; Natoli, C. R. Ti and O K edges for
Titanium Oxides by Multiple Scattering Calculations: Comparison to XAS and
EELS spectra. Phys. ReV. B. 1997, 55, 10382.
[53] Brydson, R.; Sauer, H.; Engel, W.; Thomas, J. M.; Zeitler, E.; Kosugi,N.;
Kuroda, H. Electron Energy Loss and X-ray Absorption Spectroscopy of Rutile
and Anatase: a Test of Structural Sensitivity. J. Phys.: Condens. Matter. 1989,
1, 797.
[54] Choi, H. C.; Ahn, H. J.; Jung, Y. M.; Lee, M. K.; Shin, H. J.; Kim,S. B.; Sung,
Y. E. Characterization of the Structures of Size-Selected TiO2 Nanoparticles
Using X-ray Absorption Spectroscopy. Appl. Spectrosc. 2004, 58, 598.
[55] Evans, J.E.; Springer, K.W.; Zhang, J.Z. Femtosecond Studies of Interparticle
Electron Transfer in a Coupled CdS-TiO2 colloidal system. J. Chem. Phys.
1994, 101, 6222.
30
BIBLIOGRAPHY Chapter 1
[56] Vinodgopal, K.; Kamat, P.V. Enhanced Rates of Photocatalytic Degradation
of an Azo Dye Using SnO2/TiO2 Coupled Semiconductor Thin Films. Environ.
Sci. Technol. 1995, 29, 841.
[57] Amiridis, M.D. ; Solar, J.P. Selective Catalytic Reduction of Nitric Oxide by
Ammonia over V2O5/TiO2 , V2O5/TiO2/SiO2 , and V2O5- WO3/TiO2 Cata-
lysts: Effect of Vanadia Content on the Activation Energy Ind. Eng. Chem.
Res. 1996, 35, 978.
[58] Ho, W.K.; Yu, J.C.; Lin, J.; Yu, J.G.; Li, P.S. Preparation and Photocatalytic
Behavior of MoS2 and WS2 Nanocluster Sensitized TiO2. Langmuir. 2004, 20,
5865.
[59] Wang, C.; Bahnemann, D. W.; Dohrmann, J. K. A Novel Preparation of Iron
Doped TiO2 Nanoparticles with Enhanced Photocatalytic Activity. Chem. Com-
mun. 2000, 16, 1539.
[60] Wang, Y.; Hao, Y.; Cheng, H.; Ma, H.; Xu, B.; Li, W.; Cai, S. The Photoelectro-
chemistry of Transition Metal Ion Doped TiO2 Nanocrystalline Electrodes and
Higher Solar Cell Conversion Efficiency based on Zn2+-doped TiO2 electrode.
J. Mater. Sci. 1999, 34, 2773.
[61] Coloma, F.; Marquez, F.; Rochester, C. H.; Anderson, J. A. Determination of
the Nature and Reactivity of Copper Sites in Cu-TiO2 Catalysts. Phys. Chem.
Chem. Phys. 2000, 2, 5320.
[62] Umebayashi, T.; Yamaki, T.; Itoh, H.; Asai, K. Analysis of Electronic Structures
of 3d Transition Metal Doped TiO2 Based on Band Calculations. J. Phys. Chem.
Solids. 2002, 63, 1909.
31
BIBLIOGRAPHY Chapter 1
[63] Choi,W.; Termin, A.; Hoffmann, M.R. The Role of Metal Ion Dopants in
Quantum-Sized TiO2: Correlation between Photoreactivity and Charge Car-
rier Recombination Dynamics. J. Phys. Chem. 1994, 98, 13669.
[64] Wang, Y.; Cheng, H.; Hao, Y.; Ma, J.; Li, W.; Cai, S. Photoelectrochemical
Properties of Metal Ion Doped TiO2 Nanocrystalline Electrodes. Thin Solid
Films. 1999, 349, 120.
[65] Yamashita, H.; Honda, M.; Harada, M.; Ichihashi, Y.; Anpo, M.; Hirao, T.;
Itoh, N.; Iwamoto, N. Preparation of Titanium Oxide Photocatalysts Anchored
on Porous Silica Glass by a Metal Ion-Implanttion Method and Their Photocat-
alytic Reactivities for the Degradation of 2-Propanol Diluted in Water. J. Phys.
Chem. B. 1998, 102, 10707.
[66] Yu, J. C.; Yu, J. G.; Ho, W. K.; Jiang, Z. T.; Zhang, L. Z. Effects of F- Doping
on the Photocatalytic Activity and Microstructures of Nanocrystalline TiO2
Powders. Chem. Mater. 2002, 14, 3808.
[67] Khan, S. U. M.; Al-Shahry, M.; Ingler, W. B., Jr. Efficient Photochemical Water
Splitting by a Chemically Modified N-TiO2. Science. 2002, 297, 2243.
[68] Nakamura, I.; Negishi, N.; Kutsuna,S.; Ihara, T.; Sugihara, S.; Takeuchi,K. Role
of Oxygen Vacancy in the Plasma-treated TiO2 Photocatalyst with Visible Light
Activity for NO removal. J. Mol. Catal. A-Chem. 2000, 161, 205.
[69] Justicia,I.; Ordejon,P.; Canto,G.; Mozos,J.L.; Fraxedas, J.; Battiston,G.A.; Ger-
basi, R.; Figueras, A. Designed Self-Doped Titanium Oxide Thin Films for Ef-
ficient Visible-Light Photocatalysis. Adv. Mater. 2002, 14, 1399.
[70] Justicia,I.; Garcia,G.; Battiston,G.A.; Gerbasi,R.; Ager,F.; Guerra,M.; Caix-
ach,J.; Pardo,J.A.; Rivera, J.; Figueras, A.Photocatalysis in the Visible Range
32

BIBLIOGRAPHY Chapter 1
of Sub-stoichiometric Anatase Films Prepared by MOCVD. Electrochimica Acta.
2005, 50, 4605.
[71] Kuznetsov,V.N.; Serpone, N. On the Origin of the Spectral Bands in the Vis-
ible Absorption Spectra of Visible-Light-Active TiO2 Specimens Analysis and
Assignments. J. Phys. Chem. C. 2009, 113, 15110.
[72] Di Valentin, C.; Finazzi, E.; Pacchioni, G.; Selloni, A.; Livraghi, S.; Paganini,
M. C.; Giamello, E. N-doped TiO2 : Theory and experiment. Chemical Physics.
2007, 339, 44.
[73] Sato, S. Photocatalytic Activity of NOx-doped TiO2 in the visible light region.
Chem. Phys. Lett. 1986, 123, 126.
[74] Sakthivel, S.; Janczarek, M.; Kisch, H. Visible Light Activity and Photoelec-
trochemical Properties of Nitrogen-Doped TiO2. J. Phys. Chem. B. 2004, 108,
19384.
[75] Diwald, O.; Thompson, T.L.; Zubkov, T.; Goralski, E.G.; Walck, S.D.; Yates
Jr. J.T. Photochemical Activity of Nitrogen-Doped Rutile TiO2 (110) in Visible
Light. J. Phys. Chem. B. 2004, 108, 6004.
[76] Miyauchi, M.; Ikezawa, A.; Tobimatsu, H.; Irie, H.; Hashimoto, K. Zeta poten-
tial and photocatalytic activity of nitrogen doped TiO2 thin films. Phys. Chem.
Chem. Phys. 2004, 6, 865.
[77] Gole, J.L.; Stout, J.D.; Burda, C.; Lou, Y.; Chen, X. Highly Efficient Formation
of Visible Light Tunable TiO2−xNx Photocatalysts and Their Transformation
at the Nanoscale. J. Phys. Chem. B. 2004, 108, 1230.
[78] Thompson, T.L.; Yates Jr., J.T. Surface Science Studies of the Photoactivation
of TiO2 New Photochemical Processes. Chem. Rev. 2006, 106, 4428.
33

BIBLIOGRAPHY Chapter 1
[79] Yates, H.M.; Nolan, M.G.; Sheel, D.W.; Pemble, M.E. The role of Nitrogen
Doping on the Development of Visible Light-induced Photocatalytic Activity
in Thin TiO2 Films Grown on Glass by Chemical Vapour Deposition. J. Pho-
tochem. Photobiol. A. 2006, 179, 213.
[80] Ni, M.; Leung, M.K.H.; Leung, D.Y.C.; Sumathy, K.; A Review and Recent
Developments in Photocatalytic Water-splitting using TiO2 for Hydrogen Pro-
duction. Renew. Sustain. Energy Rev. 2007, 11, 401.
[81] Z. Lin, A. Orlov, R.M. Lambert, M.C. Payne, New Insights into the Origin of
Visible Light Photocatalytic Activity of Nitrogen-Doped and Oxygen-Deficient
Anatase TiO2. J. Phys. Chem. B. 2005, 109, 20948.
[82] Sathish, M.; Viswanathan, B.; Viswanath, R.P.; Gopinath, C.S. Synthesis,
Characterization, Electronic Structure, and Photocatalytic Activity of Nitrogen-
Doped TiO2 Nanocatalyst. Chem. Mater. 2005, 17, 6349.
[83] Nosaka, Y.; Matsushita, M.; Nasino, J.; Nosaka, A.Y. Nitrogen-doped Tita-
nium Dioxide Photocatalysts for Visible Response Prepared by using Organic
Compounds. Sci. Technol. Adv. Mat. 2005, 6, 143.
[84] Morikawa, T.; Asahi, R.; Ohwaki, T.; Aoki, K.; Taga, Y. Band-Gap Narrowing
of Titanium Dioxide by Nitrogen Doping. Jpn. J. Appl. Phys. 2001, 40, L561.
[85] Diwald, O.; Thompson, T.L.; Goralski, E.G.; Walck, S.D.; Yates Jr., J.T. The
Effect of Nitrogen Ion Implantation on the Photoactivity of TiO2 Rutile Single
Crystals. J. Phys. Chem. B. 2004, 108, 52.
[86] Batzill, M.; Morales, E.H.; Diebold, U. Influence of Nitrogen Doping on the
Defect Formation and Surface Properties of TiO2 Rutile and Anatase. Phys.
Rev. Lett. 2006, 96, 026103.
34
BIBLIOGRAPHY Chapter 1
[87] Ghicov, A. ; Macak, J.M.; Tsuchiya, H.; Kunze, J.; Haeublein, V.; Frey, L;
Schmuki, P. Ion Implantation and Annealing for an Efficient N-Doping of TiO2
Nanotubes. Nano Lett. 2006, 6, 1080.
[88] Mwabora, J.M.; Lindgren, T.; Avendano, E.; Jaramillo, T.F.; Lu, J.; Lindquist,
S.E.; Granqvist, C.G. Structure, Composition, and Morphology of Photoelectro-
chemically Active TiO2−xNx Thin Films Deposited by Reactive DC Magnetron
Sputtering. J. Phys. Chem. B. 2004, 108, 20193.
[89] Y. Nakano, T. Morikawa, T. Ohwaki, Y. Taga, Deep-level Optical Spectroscopy
Investigation of N-doped TiO2 Films. Appl. Phys. Lett. 2005, 86, 132104.
[90] Valentin,C.D.; Pacchioni, G. ; Selloni, A. Origin of the Different Photoactivity
of N-doped Anatase and Rutile TiO2. Phys. Rev. B. 2007, 70, 085116.
[91] Chen, X.; Burda, C. Photoelectron Spectroscopic Investigation of Nitrogen-
Doped Titania Nanoparticles. J. Phys. Chem. B. 2004, 108, 15446.
[92] Di Valentin, C.; Pacchioni, G.; Selloni, A.; Livraghi, S.; Giamello, E. Characteri-
zation of Paramagnetic Species in N-Doped TiO2 Powders by EPR Spectroscopy
and DFT Calculations. J. Phys. Chem. B. 2005, 109, 11414.
[93] Mrowetz,M.; Balcerski,W.; Colussi,A.J.; Hoffmann, M.R. Oxidative Power
of Nitrogen-Doped TiO2 Photocatalysts under Visible Illumination. J. Phys.
Chem. B. 2004, 108, 17269.
[94] Yates,H.M.; Nolan,M.G.; Sheel,D.W.; Pemble, M.E. The Role of Nitrogen Dop-
ing on the Development of Visible Light-Induced Photocatalytic Activity in
Thin TiO2 Films Grown on Glass by Chemical Vapour Deposition. J. Pho-
tochem. Photobiol. A. 2006, 179, 213.
[95] Sakatani, Y.; Nunoshige, J.; Ando, H.; Okusako, K.; Koike, H.; Takata, T.;
Kondo, J.N.; Hara, M.; Domen, K. Photocatalytic Decomposition of Acetalde-
35
BIBLIOGRAPHY Chapter 1
hyde under Visible Light Irradiation over La3+ and N Co-doped TiO2. Chem.
Lett. 2003, 32, 1156.
[96] Bharti, B.; Kumar, S.; Lee, H.; Kumar, R. Formation of Oxygen Vacancies and
Ti3+ State in TiO2 Thin Film and Enhanced Optical Properties by Air Plasma
Treatment. Scientific Reports. 2016, 6, Article number: 32355
[97] Liu, Y.; Wang, J.; Yang, P.; Matras-Postolek, K. Self-modification of TiO2
one-Dimensional Nano-materials by Ti3+ and Oxygen Vacancy using Ti2O3 as
Precursor. RSC Adv. 2015, 5, 61657.
[98] Kuznetsov, V.N.; Serpone, N. On the Origin of the Spectral Bands in the Vis-
ible Absorption Spectra of Visible Light Active TiO2 Specimens Analysis and
Assignments. J. Phys. Chem. C. 2009, 113, 15110.
[99] Lu, X. et al.Hydrogenated TiO2 Nanotube Arrays for Supercapacitors. Nano
Lett. 2012, 12, 1690.
[100] Konstantakou, M. et al.Influence of Fluorine Plasma Treatment of TiO2 Films
on the Behavior of Dye Solar Cells Employing the Co (II)/(III) Redox Couple.
J. Phys. Chem. C. 2014, 118, 16760.
[101] Lu, H. et al.Safe and Facile Hydrogenation of Commercial Degussa P25 at room
Temperature with Enhanced Photocatalytic Activity. RSC Adv. 2014, 4, 1128.
[102] Zheng, Z.; Huang, B.; Lu, J.; Wang, Z.; Qin, X.; Zhang, X.; Dai, Y.; Whangbo,
M. H. Hydrogenated Titania: Synergy of Surface Modification and Morphology
Improvement for Enhanced Photocatalytic Activity. Chem. Commun. 2012, 48,
5733.
[103] Heo, C. H., Lee, S. B.; Boo, J. H. Deposition of TiO2 thin films using RF
magnetron sputtering method and study of their surface characteristics. Thin
Solid Films. 2005, 475, 183.
36
BIBLIOGRAPHY Chapter 1
[104] Li, Y.; Jang, B. W. L. Investigation of Calcination and O2 Plasma Treatment
Effects on TiO2 Supported Palladium Catalysts. Ind. Eng. Chem. Res. 2010,
49, 8433.
[105] Yamada, K. et al.Photocatalytic Activity of TiO2 Thin Films Doped with Ni-
trogen using a Cathodic Magnetron Plasma Treatment. Thin Solid Films. 2008,
516,7560.
[106] Guillard, C.; Beaugiraud, B.; Dutriez, C.; Herrmann, J.M.;Jaffrezic, H.;
Jaffrezic-Renault, N.; Lacroix, M. Physicochemical Properties and Photocat-
alytic Activities of TiO2 Films Prepared by Sol-gel Methods. Appl. Catal. B.
2002, 39, 331.
[107] Chen, Y.J.; Dionysiou, D.D. Correlation of Structural Properties and Film
Thickness to Photocatalytic Activity of Thick TiO2 Films Coated on Stainless
Steel. Appl. Catal. B. 2006, 69, 24.
[108] H. Choi, E. Stathatos and D.D. Dionysiou, Sol–gel Preparation of Mesoporous
Photocatalytic TiO2 Films and TiO2/Al2O3 Composite Membranes for Envi-
ronmental Applications. Appl. Catal. B. 2006, 63, 60.
[109] Tao, J.C.; Shen, Y.; Gu, F.; Zhu, J.Z.; Zhang, J.C. Synthesis and Characteriza-
tion of Mesoporous Titania Particles and Thin Films. J. Mater. Sci. Technol.
2007, 23, 513.
[110] Y. Paz and A. Heller, Photo-oxidatively Self-cleaning Transparent Titanium
Dioxide Films on Soda lime Glass: the Deleterious Effect of Sodium Contami-
nation and its Prevention. J. Mater. Res. 1997, 12, 2759.
[111] Yu, J.; Zhao, X.; Zhao, Q. Effect of Surface Structure on Photocatalytic Activity
of TiO2 Thin Films Prepared by Sol-Gel Method. Thin Solid Films. 2000, 379,
7.
37
BIBLIOGRAPHY Chapter 1
[112] Ghamsari, M. S.; Bahramian, A.R. High Transparent Sol-Gel Derived Nanos-
tructured TiO2 Thin Film. Materials Letters. 2008, 62, 361.
[113] Imai, H.; Matsuta, M.; Shimizu, K.; Hirashima, H.; Negishi, N. Morphology
Transcription with TiO2 using Chemical solution Growth and its Application
for Photocatalysts. Solid State Ionics. 2002, 151, 183.
[114] Chen, Q.; Qian, Y.;Chen, Z.; Wu, W.; Chen, Z.; Zhou, G.; Zhang, Y. Hydrother-
mal Epitaxy of highly Oriented TiO2 Thin Films on Silicon. Appl. Phys. Lett.
1995, 66, 1608.
[115] A. Mills, N. Elliott, I.P. Parkin, S.A. O’Neill and R.J. Clark, Novel TiO2 CVD
films for Semiconductor Photocatalysis. J. Photochem. Photobiol: A. 2002, 151,
171.
[116] Bessergenev, V.G.; Khmelinskii, I.V.; Pereira, R.J.F.; Krisuk, V.V.; Turgam-
baeva, A.E.; Igumenov, I.K. Preparation of TiO2 Films by CVD method and
its Electrical, Structural and Optical Properties. Vacuum. 2002, 64, 275.
[117] Bessergenev, V.G.; Pereira, R.J.F.; Mateus, M.C.; Khmelinskii, I.V.; Vascon-
celos, D.A.;Nicula, R.;Burkel, E.; do Rego”A.M. B.; Saprykin, A.I. Study of
Physical and Photocatalytic Properties of Titanium Dioxide Thin Films Pre-
pared from Complex Precursors by Chemical Vapour Deposition. Thin Solid
Films. 2006, 503, 29.
[118] Guillard, C.;Debayle, D.; Gagnaire, A.; Jaffrezic, H.; Herrmann, J.M. Physical
Properties and Photocatalytic Efficiencies of TiO2 Films Prepared by PECVD
and Sol-Gel Methods. Mater. Res. Bull. 2004, 39, 1445.
[119] More, A.M.; Gunjkar, J.L.; Lokhande, C.D.; Mane, R.S.; Han, S.H. Systematic
interconnected Web-like Architecture Growth of Sprayed TiO2 films. Micron.
2007, 38, 500.
38
BIBLIOGRAPHY Chapter 1
[120] Conde-Gallardo, A.; Guerrero, M.; Castillo, N.; Soto, A.B.; Fragoso, R.; Ca-
banasMoreno, J.G. Thin Solid Films. 2005, 473, 68.
[121] Perednis, D.; Gauckler, L. Thin Film Deposition Using Spray Pyrolysis. J. Elec-
troceramics. 2005, 14, 103.
[122] Roger, C.; Corbitt,T.; Xu,C.; Zeng, D.; Powell, Q.; Chandler, C.D.; Nyman, M.;
Hampden-Smith, M.J.; Kodas, T.T. Principles of Molecular Precursor Selection
for Aerosol Synthesis of Materials. Nanostruct. Mater. 1994, 4, 529.
[123] Schwartz, R.W.; Schneller, T.; Waser, R. Chemical Solution Deposition of Elec-
tronic Oxide Films. Comptes Rendus Chim. 2004, 7, 433.
[124] Bouzidi, A.; Benramdane, N.; Derraz, H.T.; Mathieu, C.; Khelifa, B.; Desfeux,
R. Effect of Substrate Temperature on the Structural and Optical Properties of
MoO3 Thin Films Prepared by Spray Pyrolysis Technique. Mater. Sci. Eng. B.
2003, 97, 5.
[125] Patil, P.S. Versatility of Chemical Spray Pyrolysis Technique. Mater. Chem.
Phys. 1999, 59, 185.
[126] Wang, W.N.; Purwanto, A.; Lenggoro, I. W.; Okuyama, K.; Chang, H.; Jang,H.
D. Investigation on the Correlations between Droplet and Particle Size Distri-
bution in Ultrasonic Spray Pyrolysis. Ind. Eng. Chem. Res. 2008, 47, 1650.
[127] Castaneda, L.; Alonso, J.C.; Ortiz, A.; Andrade, E.; Saniger, J.M.; Banuelos,
J.G. Spray Pyrolysis Deposition and Characterization of Titanium Oxide Thin
Films. Mater. Chem. Phys. 2002, 77, 938.
[128] Natarajan, C.; Fukunaga, N. ; Nogami, G. Titanium Dioxide Thin Film De-
posited by Spray Pyrolysis of Aqueous Solution. Thin solid Films. 1998, 322,
6.
39

40
Chapter 2
Experimental Methods
2.1 Synthesis Techniques
This chapter elucidates the synthetic route and various characterization and analytical
tools adopted to characterize and decipher the properties of thin films. Pristine Tita-
nium dioxide and N-doped Titanium dioxide were synthesized using spray pyrolysis,
which is described below in detail.
2.1.1 Spray Pyrolysis
Spray pyrolysis is a synthetic method whose principle is similar to Chemical vapour
deposition(CVD). It has several advantages owing to low operational cost, operation
at atmospheric pressure, rapid film growth, mass production, reproducibilty and large
surface area coverage. In case of spray pyrolysis usually a liquid is used as a precursor
as compared to CVD, wherein mostly a solid is used as precursor. The liquid precursor
is vapourized and transported to a pre-heated substrate, where it undergoes various
physico-chemical processes described herein to form a thin film. During initial days of
deciphering the mechanism of spray pyrolysis, substrate temperature, initial droplet
size and entrained particle size was considered as a major factors of deposition.Figure
2.1 shows the mechanism with respect to the above factors.
41
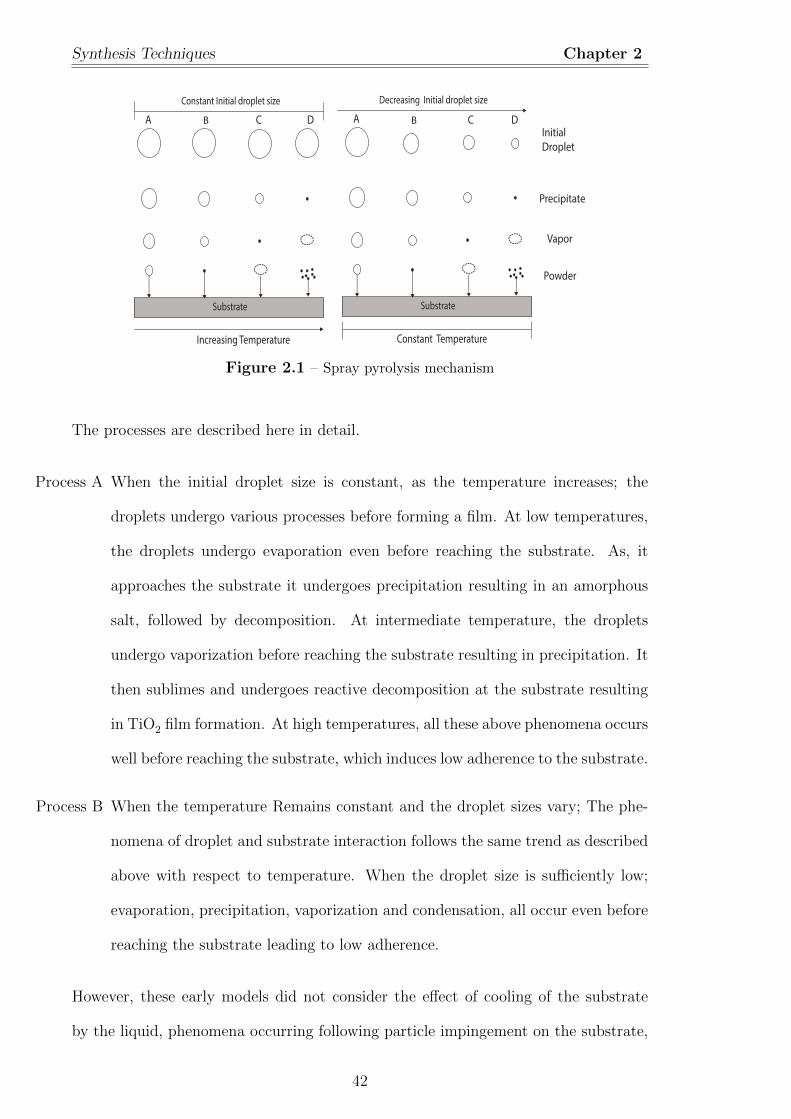
Synthesis Techniques Chapter 2
Constant Temperature
Decreasing Initial droplet size
Substrate
Increasing Temperature
Constant Initial droplet size
Substrate
A B C D A B C DInitial
Droplet
Precipitate
Vapor
Powder
Figure 2.1 – Spray pyrolysis mechanism
The processes are described here in detail.
Process A When the initial droplet size is constant, as the temperature increases; the
droplets undergo various processes before forming a film. At low temperatures,
the droplets undergo evaporation even before reaching the substrate. As, it
approaches the substrate it undergoes precipitation resulting in an amorphous
salt, followed by decomposition. At intermediate temperature, the droplets
undergo vaporization before reaching the substrate resulting in precipitation. It
then sublimes and undergoes reactive decomposition at the substrate resulting
in TiO2 film formation. At high temperatures, all these above phenomena occurs
well before reaching the substrate, which induces low adherence to the substrate.
Process B When the temperature Remains constant and the droplet sizes vary; The phe-
nomena of droplet and substrate interaction follows the same trend as described
above with respect to temperature. When the droplet size is sufficiently low;
evaporation, precipitation, vaporization and condensation, all occur even before
reaching the substrate leading to low adherence.
However, these early models did not consider the effect of cooling of the substrate
by the liquid, phenomena occurring following particle impingement on the substrate,
42
Chapter 2: Experimental Methods Chapter 2
entrained particle size effects, nature of chemical bonding between thin film and sub-
strate, crystallinity of the thin film, nanostructure and morphology of thin film and
annealing effects on the thin film.To deal with the above limitations and complex
situations arising out of it, the subsequent models concentrated on the explanation of
whether a CVD process can take place or not during spray pyrolysis.
• The temperature of the heated substrate must be similar to the limit of stability
of the salt complex, so that the precipitates are able to approach the substrate
without decomposing/oxidizing on the substrate or subliming before they reach
the substrate; they must sublime at the substrate.
• The particle size of the precipitates should be sufficiently small so that the
relatively high surface energy component may facilitate sublimation to the vapor
phase at the substrate, where condensation and strong chemisorption can occur.
If the temperature is too low, then the precursor liquid droplets or subsequent precipi-
tates are coarse and have insufficient surface and thermal energy to allow vaporization.
If the temperature is too high, then sublimation takes place at a sufficient distance
away from the substrate such that oxide particles are formed away from the substrate
and subsequently impinge onto the substrate and bond by weak physisorption.
In summary, for the CVD process to occur, several conditions must exist:
1. The substrate temperature must be at least and preferably similar to that of the
decomposition temperature of the salt complex. (a) The substrate temperature, speed
of droplet delivery, transit path length, and other experimental variables must be such
that the temperature is sufficiently high to prevent impingement of entrained liquid
droplets or precipitates on the substrate. (b) The substrate temperature, speed of
droplet delivery, transit path length, and other experimental variables must be such
that the temperature is sufficiently low to prevent sublimation of entrained precipitates
before approaching the substrate.
43
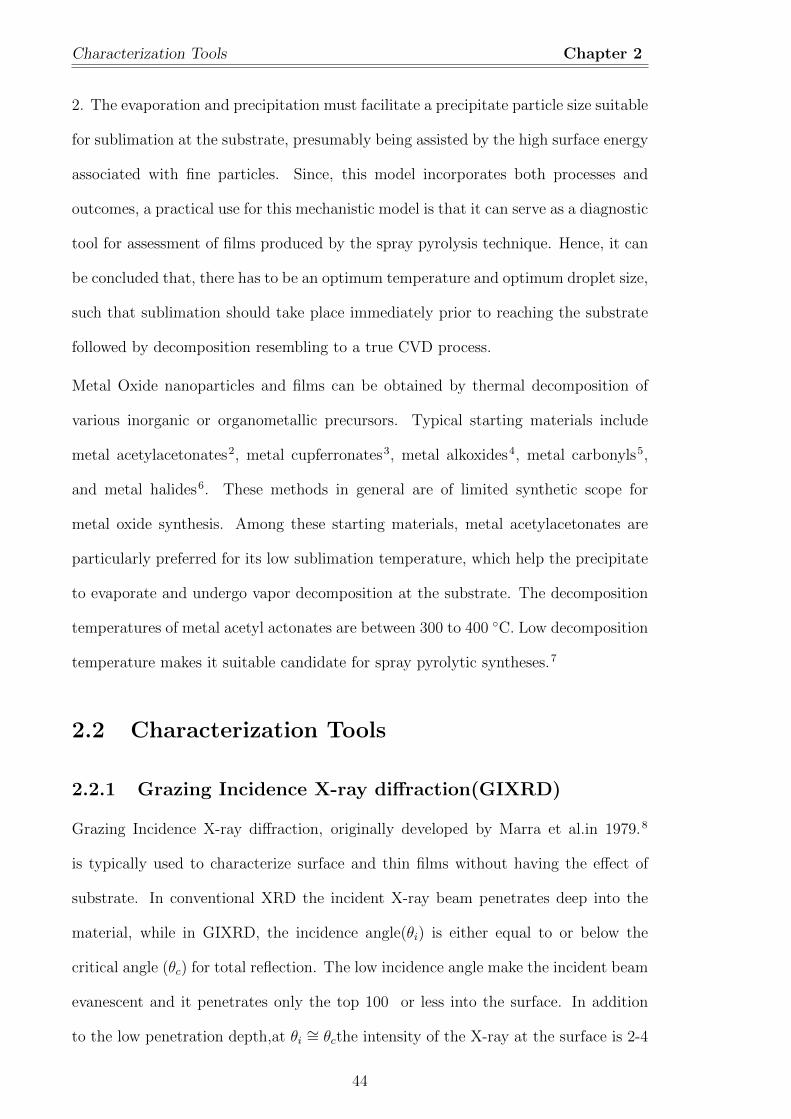
Characterization Tools Chapter 2
2. The evaporation and precipitation must facilitate a precipitate particle size suitable
for sublimation at the substrate, presumably being assisted by the high surface energy
associated with fine particles. Since, this model incorporates both processes and
outcomes, a practical use for this mechanistic model is that it can serve as a diagnostic
tool for assessment of films produced by the spray pyrolysis technique. Hence, it can
be concluded that, there has to be an optimum temperature and optimum droplet size,
such that sublimation should take place immediately prior to reaching the substrate
followed by decomposition resembling to a true CVD process.
Metal Oxide nanoparticles and films can be obtained by thermal decomposition of
various inorganic or organometallic precursors. Typical starting materials include
metal acetylacetonates2, metal cupferronates3, metal alkoxides4, metal carbonyls5,
and metal halides6. These methods in general are of limited synthetic scope for
metal oxide synthesis. Among these starting materials, metal acetylacetonates are
particularly preferred for its low sublimation temperature, which help the precipitate
to evaporate and undergo vapor decomposition at the substrate. The decomposition
temperatures of metal acetyl actonates are between 300 to 400 ◦C. Low decomposition
temperature makes it suitable candidate for spray pyrolytic syntheses.7
2.2 Characterization Tools
2.2.1 Grazing Incidence X-ray diffraction(GIXRD)
Grazing Incidence X-ray diffraction, originally developed by Marra et al.in 1979.8
is typically used to characterize surface and thin films without having the effect of
substrate. In conventional XRD the incident X-ray beam penetrates deep into the
material, while in GIXRD, the incidence angle(θi) is either equal to or below the
critical angle (θc) for total reflection. The low incidence angle make the incident beam
evanescent and it penetrates only the top 100 or less into the surface. In addition
to the low penetration depth,at θi ∼= θcthe intensity of the X-ray at the surface is 2-4
44
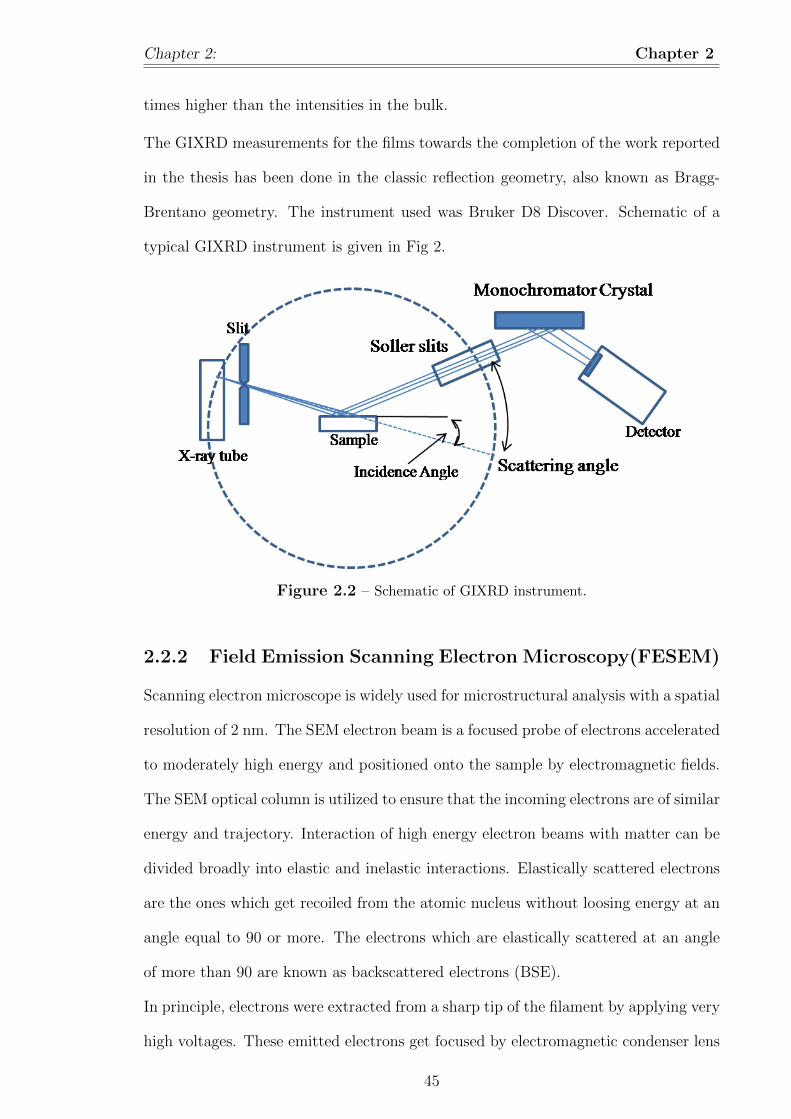
Chapter 2: Chapter 2
times higher than the intensities in the bulk.
The GIXRD measurements for the films towards the completion of the work reported
in the thesis has been done in the classic reflection geometry, also known as Bragg-
Brentano geometry. The instrument used was Bruker D8 Discover. Schematic of a
typical GIXRD instrument is given in Fig 2.
Figure 2.2 – Schematic of GIXRD instrument.
2.2.2 Field Emission Scanning Electron Microscopy(FESEM)
Scanning electron microscope is widely used for microstructural analysis with a spatial
resolution of 2 nm. The SEM electron beam is a focused probe of electrons accelerated
to moderately high energy and positioned onto the sample by electromagnetic fields.
The SEM optical column is utilized to ensure that the incoming electrons are of similar
energy and trajectory. Interaction of high energy electron beams with matter can be
divided broadly into elastic and inelastic interactions. Elastically scattered electrons
are the ones which get recoiled from the atomic nucleus without loosing energy at an
angle equal to 90 or more. The electrons which are elastically scattered at an angle
of more than 90 are known as backscattered electrons (BSE).
In principle, electrons were extracted from a sharp tip of the filament by applying very
high voltages. These emitted electrons get focused by electromagnetic condenser lens
45
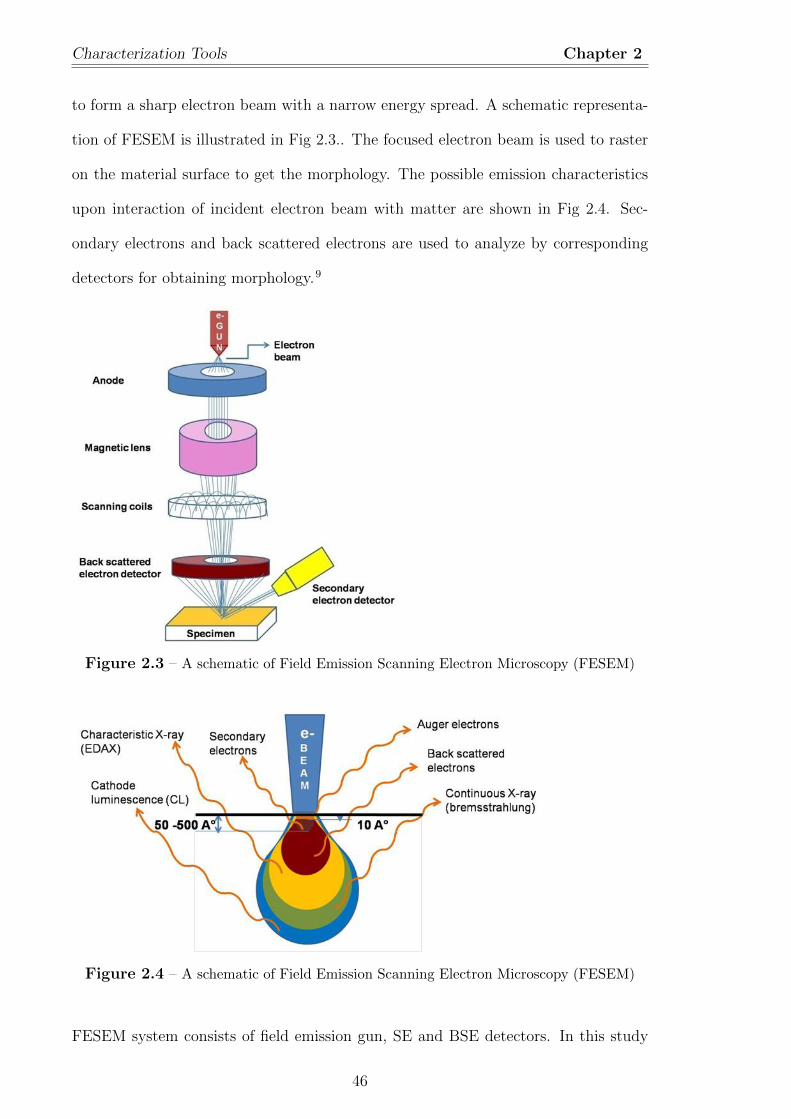
Characterization Tools Chapter 2
to form a sharp electron beam with a narrow energy spread. A schematic representa-
tion of FESEM is illustrated in Fig 2.3.. The focused electron beam is used to raster
on the material surface to get the morphology. The possible emission characteristics
upon interaction of incident electron beam with matter are shown in Fig 2.4. Sec-
ondary electrons and back scattered electrons are used to analyze by corresponding
detectors for obtaining morphology.9
Figure 2.3 – A schematic of Field Emission Scanning Electron Microscopy (FESEM)
Figure 2.4 – A schematic of Field Emission Scanning Electron Microscopy (FESEM)
FESEM system consists of field emission gun, SE and BSE detectors. In this study
46
Chapter 2: Chapter 2
we used FESEM (Supra 55, Carl zeiss, Germany) to obtain the morphology of the
TiO2 films.
2.3 Contact Angle Measurement
The water contact angle experiments for the films in this thesis were carried out by
using a contact angle meter equipped with a CCD camera (Holmarc, HO-IAD-CAM-
01, India). The contact angles were determined by analyzing the high resolution
images of the water droplets on the thin films using ImageJ software.A brief overview
of the theoretical aspects of contact angle studies is given in the following section.
2.4 Theoretical Background of Wetting Studies.
The ability of a liquid to wet a solid can be quantified by measuring the angle at which
the liquid/vapor interface intersects the solid-liquid interfacial plane (Fig 2.5). This
angle is referred to as the “contact angle” and the line where the interface contacts the
solid is called the three-phase contact line. The relation between the contact angle
and the surface tensions/surface energies at the three phase boundaries has been first
described by Young in his famous article ”An essay on the cohesion of fluids”in 1805.10
This lead to the famous Young’s equation which is the first of its kind equation to
describe the relation between contact angle and surface tensions/surface energies and
is given below.
cosθ =γSL − γSV
γLV(2.1)
There has been debates on whether the representation of interfacial tension/surface
tension as a viable term can meaningfully describe the thermodynamics of the whole
system. Many researchers have contended in favour of surface tension whereas many
have negated it in favour of surface energy.26,27 However, for the sake of simplicity
and since the present study is not exactly on the thermodynamic aspect,the term
interfacial energy is used in a broader sense and a simple derivation considering the
47
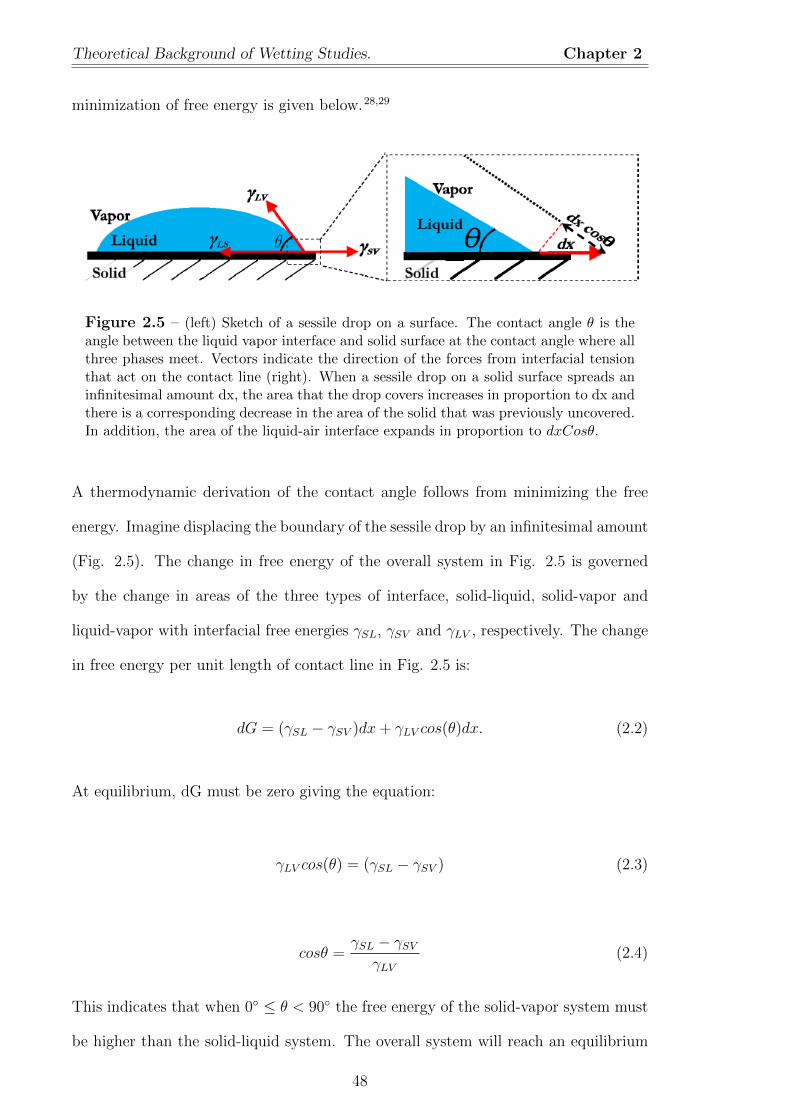
Theoretical Background of Wetting Studies. Chapter 2
minimization of free energy is given below.28,29
Figure 2.5 – (left) Sketch of a sessile drop on a surface. The contact angle θ is theangle between the liquid vapor interface and solid surface at the contact angle where allthree phases meet. Vectors indicate the direction of the forces from interfacial tensionthat act on the contact line (right). When a sessile drop on a solid surface spreads aninfinitesimal amount dx, the area that the drop covers increases in proportion to dx andthere is a corresponding decrease in the area of the solid that was previously uncovered.In addition, the area of the liquid-air interface expands in proportion to dxCosθ.
A thermodynamic derivation of the contact angle follows from minimizing the free
energy. Imagine displacing the boundary of the sessile drop by an infinitesimal amount
(Fig. 2.5). The change in free energy of the overall system in Fig. 2.5 is governed
by the change in areas of the three types of interface, solid-liquid, solid-vapor and
liquid-vapor with interfacial free energies γSL, γSV and γLV , respectively. The change
in free energy per unit length of contact line in Fig. 2.5 is:
dG = (γSL − γSV )dx+ γLV cos(θ)dx. (2.2)
At equilibrium, dG must be zero giving the equation:
γLV cos(θ) = (γSL − γSV ) (2.3)
cosθ =γSL − γSV
γLV(2.4)
This indicates that when 0◦ ≤ θ < 90◦ the free energy of the solid-vapor system must
be higher than the solid-liquid system. The overall system will reach an equilibrium
48
Chapter 2: Chapter 2
in which the liquid has spread and minimizes the exposed solid to lower the overall
free energy. Therefore, systems with contact angles in this range are referred to as
“wetting”. When 90◦ < θ ≤ 180◦ the opposite occurs and the liquid will be repelled
by the surface in order to minimize the covered surface to lower the overall energy.
Systems with contact angles in this range are referred to as “non-wetting”.
In the case of water, wetting and non-wetting surfaces are called hydrophilic and
hydrophobic.
2.4.1 Wenzel and Cassie-Baxter Wetting
Young’s equation can be applied only to a flat surface not to a rough one. Thus,
several models describing the contact angle at a rough solid surface has been proposed.
Wenzel proposed the first ever model for a rough surface, which is briefly discussed
here. Roughness increases the total area of the solid surface that contributes to the
interfacial free energy, and thus changes the contact angle. The “roughness factor” –
denoted r – is defined as:
r =actual surface
geometric surface(2.5)
The difference between these two surfaces is presented verbatim from the original
article considering its importance and contribution to the field of contact angle. ”Ge-
ometric surface is the surface as measured in the plane of the interface. Where perfect
smoothness is an acceptable assumption, as at liquid-liquid or liquid-gas interfaces,
actual surface and geometric surface are identical, but at the surface of any real solid
the actual surface area will be greater than the geometric surface area because of
surface roughness.”30 Hence, the contributions of solid free energies in eqn. 2.2 is
increased by r, leading to:
cosθapp = rcosθtrue (2.6)
49
Theoretical Background of Wetting Studies. Chapter 2
where θapp is the expected angle on rough surfaces,θtrue the local angle on an equivalent
smooth surface and the system will be perfectly wetting (non-wetting) if the right
hand side is greater than +1 (less than -1). This equation is often referred to as the
Wenzel equation for rough surfaces.31 Since the true area will always be larger than
the smooth area, r will always be greater than one. Therefore, if a smooth surface
is wetting, then a rough surface of the same material will wet more readily making
the apparent contact angle smaller. By the same reasoning, a surface with a contact
angle above 90◦ will gain a higher contact angle if that surface is roughened.
Cassie Baxter extended the wenzel’s analysis to porous structure, wherein the con-
cept of air traps were shown to play a role in determining the contact angle. A
brief understanding of the model is briefly discussed here.In a heterogeneous surface
with different local wetting properties, the interfacial free energy is assumed to be a
weighted average of different types of surface with weight φi equal to the fraction of
the surface that has a local contact angle θi. The cosine of the apparent contact angle
will just be the weighted average of the cosines for each type of surface and is given
by the following equation:
cosθapp = φ1Cosθ1 + φ2Cosθ2 + . . . , (2.7)
which is known as the Cassie-Baxter equation.32 A special situation involves the so-
called “Lotus effect” where the surface is nanostructured in such a way that spreading
water traps air in the nano-sized holes instead of filling the holes with water.33 This
trapped air has an effective contact angle of 180◦ making the surface superhydropho-
bic.
50
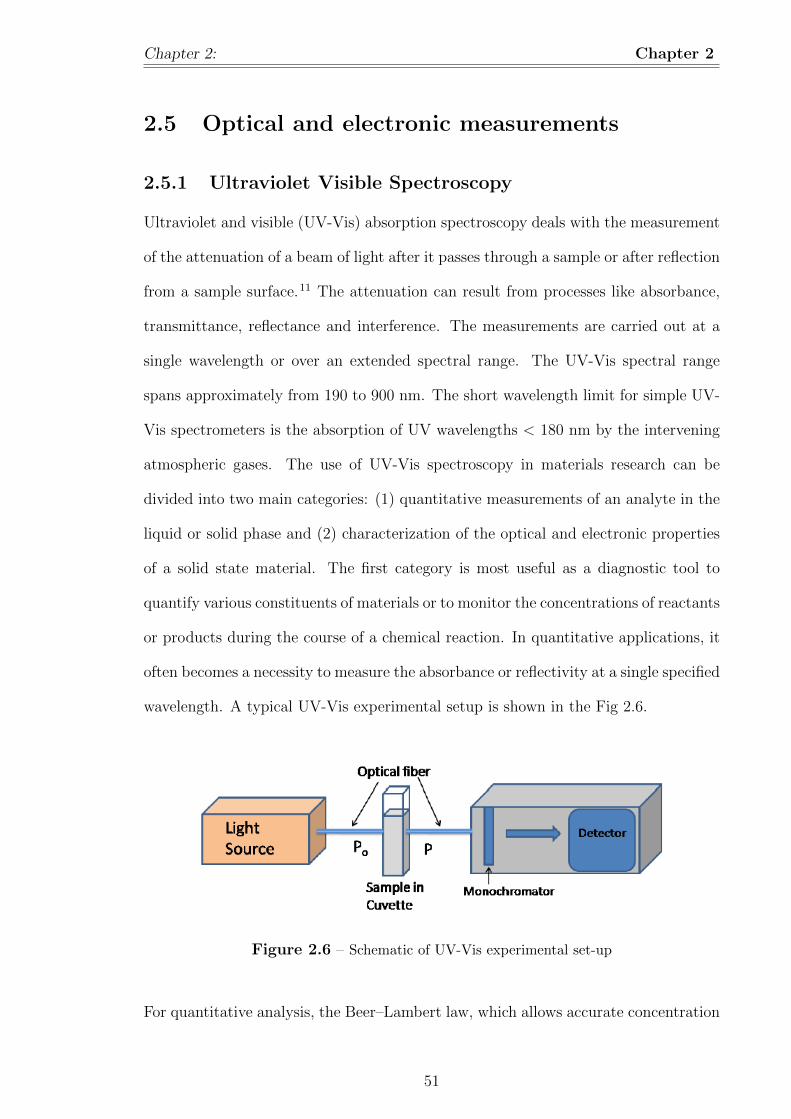
Chapter 2: Chapter 2
2.5 Optical and electronic measurements
2.5.1 Ultraviolet Visible Spectroscopy
Ultraviolet and visible (UV-Vis) absorption spectroscopy deals with the measurement
of the attenuation of a beam of light after it passes through a sample or after reflection
from a sample surface.11 The attenuation can result from processes like absorbance,
transmittance, reflectance and interference. The measurements are carried out at a
single wavelength or over an extended spectral range. The UV-Vis spectral range
spans approximately from 190 to 900 nm. The short wavelength limit for simple UV-
Vis spectrometers is the absorption of UV wavelengths < 180 nm by the intervening
atmospheric gases. The use of UV-Vis spectroscopy in materials research can be
divided into two main categories: (1) quantitative measurements of an analyte in the
liquid or solid phase and (2) characterization of the optical and electronic properties
of a solid state material. The first category is most useful as a diagnostic tool to
quantify various constituents of materials or to monitor the concentrations of reactants
or products during the course of a chemical reaction. In quantitative applications, it
often becomes a necessity to measure the absorbance or reflectivity at a single specified
wavelength. A typical UV-Vis experimental setup is shown in the Fig 2.6.
Figure 2.6 – Schematic of UV-Vis experimental set-up
For quantitative analysis, the Beer–Lambert law, which allows accurate concentration
51
Optical and electronic measurements Chapter 2
measurement of the absorbing species, is given as
A = εcl (2.8)
Where A is the absorbance, ε the molar absorbance or absorption coefficient, c the
concentration of the analyte in the solution (in mg/ml) and l is the path length of light
in the sample (in cm). The relationship between absorbance A and the experimentally
measured transmittance T is
a = −log(T ) = −log PP0
(2.9)
Where P is the radiant power (radiant energy on unit area in unit time) after it
passes through the sample and P0 is the initial radiant power (schematically shown
in Fig. 2.6), both T and A are unit less. However, the Beer-Lambert Law breaks
down for solutions of higher concentration, yielding departure from linear behavior.
In the case of solid materials, the UV-Vis spectrum can measure the band gap and
identify any localized excitations or impurities. The measurements are carried out
either in the transmittance or reflectance mode. In samples, light interacts with the
matter by means of different processes such as reflection, refraction and diffraction,
and eventually emerges out diffusively (scatters in all directions). For different transi-
tion mechanisms, it has been proved that along the sharp absorption edge, the energy
of incident photon and the band gap (Eg) of a semiconductor will have the following
relation
αn = A(hν − Eg) (2.10)
(αhν)γ = A(hν − Eg) (2.11)
where the value of γ depends on the interband transition mechanism.
Among the various methods, Tauc’s plot is widely used to determine the band gap of
52
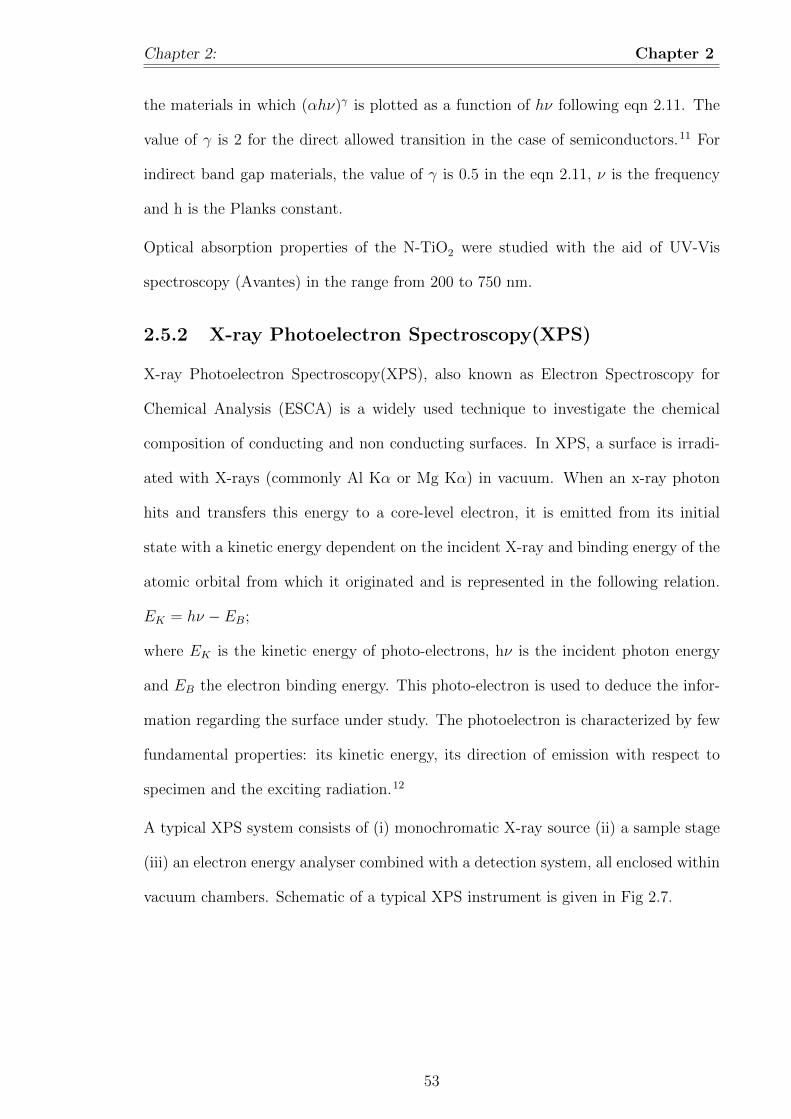
Chapter 2: Chapter 2
the materials in which (αhν)γ is plotted as a function of hν following eqn 2.11. The
value of γ is 2 for the direct allowed transition in the case of semiconductors.11 For
indirect band gap materials, the value of γ is 0.5 in the eqn 2.11, ν is the frequency
and h is the Planks constant.
Optical absorption properties of the N-TiO2 were studied with the aid of UV-Vis
spectroscopy (Avantes) in the range from 200 to 750 nm.
2.5.2 X-ray Photoelectron Spectroscopy(XPS)
X-ray Photoelectron Spectroscopy(XPS), also known as Electron Spectroscopy for
Chemical Analysis (ESCA) is a widely used technique to investigate the chemical
composition of conducting and non conducting surfaces. In XPS, a surface is irradi-
ated with X-rays (commonly Al Kα or Mg Kα) in vacuum. When an x-ray photon
hits and transfers this energy to a core-level electron, it is emitted from its initial
state with a kinetic energy dependent on the incident X-ray and binding energy of the
atomic orbital from which it originated and is represented in the following relation.
EK = hν − EB;
where EK is the kinetic energy of photo-electrons, hν is the incident photon energy
and EB the electron binding energy. This photo-electron is used to deduce the infor-
mation regarding the surface under study. The photoelectron is characterized by few
fundamental properties: its kinetic energy, its direction of emission with respect to
specimen and the exciting radiation.12
A typical XPS system consists of (i) monochromatic X-ray source (ii) a sample stage
(iii) an electron energy analyser combined with a detection system, all enclosed within
vacuum chambers. Schematic of a typical XPS instrument is given in Fig 2.7.
53
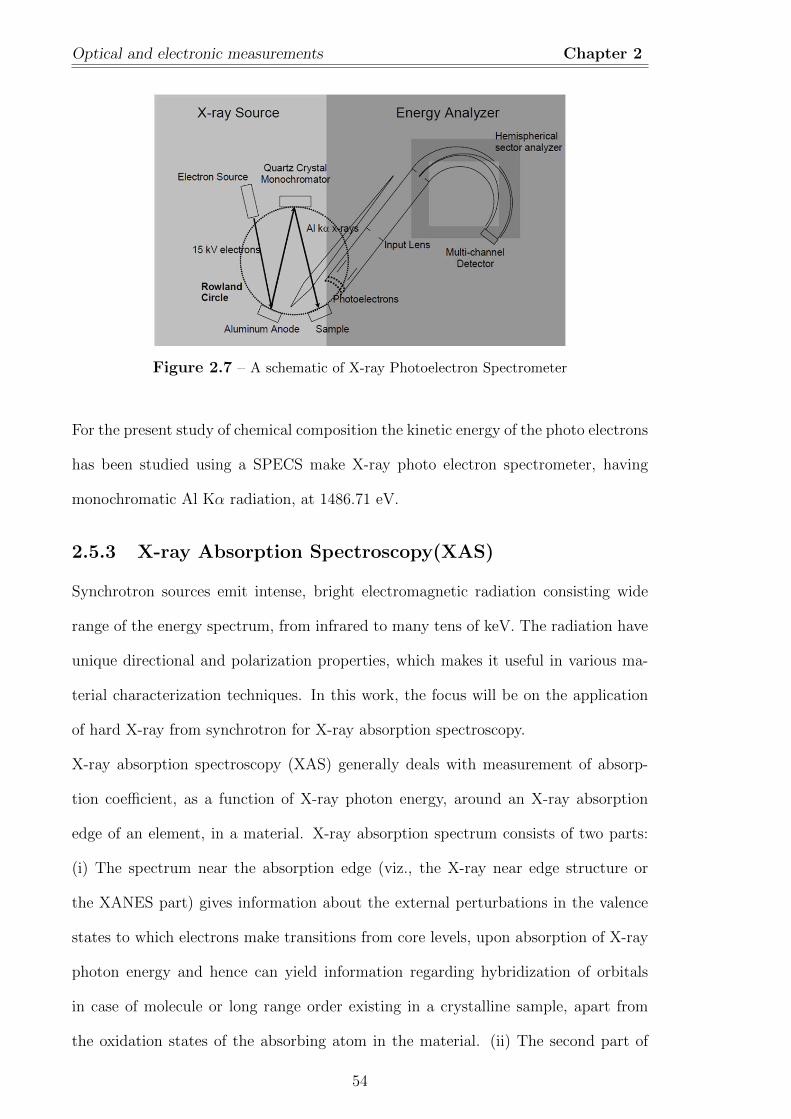
Optical and electronic measurements Chapter 2
Figure 2.7 – A schematic of X-ray Photoelectron Spectrometer
For the present study of chemical composition the kinetic energy of the photo electrons
has been studied using a SPECS make X-ray photo electron spectrometer, having
monochromatic Al Kα radiation, at 1486.71 eV.
2.5.3 X-ray Absorption Spectroscopy(XAS)
Synchrotron sources emit intense, bright electromagnetic radiation consisting wide
range of the energy spectrum, from infrared to many tens of keV. The radiation have
unique directional and polarization properties, which makes it useful in various ma-
terial characterization techniques. In this work, the focus will be on the application
of hard X-ray from synchrotron for X-ray absorption spectroscopy.
X-ray absorption spectroscopy (XAS) generally deals with measurement of absorp-
tion coefficient, as a function of X-ray photon energy, around an X-ray absorption
edge of an element, in a material. X-ray absorption spectrum consists of two parts:
(i) The spectrum near the absorption edge (viz., the X-ray near edge structure or
the XANES part) gives information about the external perturbations in the valence
states to which electrons make transitions from core levels, upon absorption of X-ray
photon energy and hence can yield information regarding hybridization of orbitals
in case of molecule or long range order existing in a crystalline sample, apart from
the oxidation states of the absorbing atom in the material. (ii) The second part of
54
Chapter 2: Chapter 2
the spectrum which extends from 50 eV to ∼ 700 eV above the absorption edge, is
generally called the Extended X-ray absorption fine structure (EXAFS) part, which
is generally characterized by the presence of fine structure oscillations and can give
precise information regarding the short range order and local structure around the par-
ticular atomic species in the material. This determination is confined to a distance
given by the mean free path of the photoelectron in the condensed matter, which is
between 5-7 A radius from the element. The above charatersistic along with the fact
that EXAFS is an element specific tool, makes EXAFS a powerful structural local
probe. With the advent of modern bright Synchrotron radiation sources, this tech-
nique has emerged to be the most powerful local structure determination technique,
which can be applied to any type of material viz. amorphous, polycrystalline, poly-
mers, surfaces and solutions. Furthermore, EXAFS does not require any particular
experimental conditions, such as high vacuum and hence, samples of various physical
forms can be adapted for measurements in the experimental stations. Schematic of a
typical X-ray Absorption measurement is given in Fig 2.8.
Figure 2.8 – A schematic of X-ray Absorption Spectrometer
2.5.3.1 Theoretical Background
The X-ray absorption coefficient for an atom in the photon energy range of 1-100 keV
is generally dominated by Photoelectric effect, which is a monotonically decreasing
function of energy, with several discontinuities known as absorption edges. These dis-
continuities occur when the energy of the incident photons equals the binding energy
of different core levels of the atom and are classified with capital letters (K,L,M...)
according to the principal quantum number of the core level ground state (n = 1,
2, 3...).An incident photon is able to extract a core electron, if its energy is equal
55
Optical and electronic measurements Chapter 2
to or greater than the edge energy. If the absorbing atom is isolated in space, the
photoelectron propagates as an unperturbed isotropic wave, but in a real material
since the absorber is surrounded by several neighbouring atoms, photoelectrons get
backscattered and the final state of the photoelectron can be described, by the super-
position of the original and scattered waves. This leads to an interference phenomenon
that modifies the interaction probability between core electrons and incident photons.
Constructive interference increases while destructive interference decreases the ab-
sorption coefficient of the atom. This interference phenomenon, for a given energy of
the photoelectron, depends on the distance between emitting and scattering atoms
and their scattering strengths and coordination numbers. Since the oscillations in the
absorption spectra are important, the experimentally obtained µ versus E data is first
plotted as µ(E) versus E, where µ(E) is defined as follows:
χ(E) =µ(E)− µ0(E)
∆µ0(E0)(2.12)
where E0 is the absorption edge energy, µ(E) is the experimentally measured fluo-
rescence, ∆µ0(E0) is the edge step and µ0(E) is a smooth background curve that is
fit to the data to remove several extraneous contributions to the data. Data analy-
sis in EXAFS is either done in k-space or in fourier transformed R-space. Hence the
absorption co-efficient χ(E) is converted to k-space(χ(k)) using the following relation.
k =
√2m(E − E0)
~2(2.13)
where m is the mass of the electron, χ(k) is often weighted by either k3/k2 to amplify
oscillations at high/low k. The k-weighted χ(k) functions are fourier transformed to
R- space using ARTEMIS software package to generate the χ(R) versus R spectra in
terms of real distances from the centre of the absorbing atom. χ(R) versus R (radial
distances) plots are then used to derive the co-ordination number and radial distances
56
Chapter 2: Chapter 2
of the atoms in various co-ordination spheres.
Various physical parameters like, co-ordination number, bond distance etc is derived
from EXAFS signal by using the following analytical expression, which is derived
using dipole approximation:13
χ(k) =∑ Njfj(k)e−2k2σ2
j e−2Rjλ
kR2j
Sin[2kRj + δj(k)] (2.14)
where, Nj is the number of j th neighbours of the absorbing atom sitting at a distance
of Rj, having a scattering amplitude of fj and creates a phase change of δj as the
photoelectron get scattered by its potential. The term σj represents the fluctuation
at the atomic positions (having both structural as well as thermal effect) and λ is the
mean free path which determines the probability of the scattering photoelectron to
come back at the absorber, after being backscattered by the neighbour.
Different relevant parameters from the EXAFS signal are determined by fitting the
experimental EXAFS spectra with the above theoretical expression. The amplitude,
distance, phase and degeneracy of the different contributions corresponding to differ-
ent interactions (nearest neighbour and further interactions), are used as fitting pa-
rameters for fitting the experimental data. Different codes for EXAFS data analysis
programme are available among which, IFEFFIT package is most commonly used14.
For a typical fitting of the spectra, crystallographic inputs of anatase phase is used.
The real space fittings are performed between 0.9 to 4A. Fourier transform are carried
out from k = 2 to 8 A−1 with multiple k-weight. It is known that reduced χ2 is far
greater than 1 in case of EXAFS due to poor assessment of the uncertainty in data and
due to imperfections in the calculations that go into the model. Hence, the goodness
of the fit has been measured by minimizing an alternate statistical parameter; known
as R-factor. R-Factor is defined by the equation;
R =
∑maxi=min[Re(χd(ri)− χt(ri))2 + Im(χd(ri)− χt(ri))2]∑max
i=min[Re(χd(ri))2 + Im(χd(ri))2](2.15)
57
Summary Chapter 2
2.5.3.2 Experimental Details of XAS Measurement
EXAFS measurements with synchrotron radiation are generally carried out in two
different modes viz., scanning and dispersive. Scanning modeis used for the work
reported in this thesis.The experimental arrangement in scanning mode (generally
called a beamline) uses a Double-Crystal–Monochromator (DCM) to select a partic-
ular energy from the incident synchrotron beam, which is then made incident on the
sample and the intensity of the transmitted beam passing through the sample, or that
of the fluorescence beam emerging out of the sample, is recorded with suitable detec-
tors along with the incident intensity at each energy, by scanning the DCM crystals.
Since, all the samples were thin films in the current work, fluorescence mode was used
to record the data. The experiments were done at INDUS-2 Synchrotron radiation
source a RRCAT, Indore, BL-09,15 which is a Scanning EXAFS beamline.
2.6 Summary
The experimental techniques utilized for the study of N-TiO2 thin films reported
in this thesis are described briefly with basic principle, major components of the
apparatus, and their technical specifications with schematic or block diagrams.
58
Bibliography
[1] Nakaruk, A.; Sorrell, C. C. Conceptual Model for Spray Pyrolysis Mechanism:
Fabrication and Annealing of Titania Thin Films. J. Coat. Technol. Res. 2010,
7, 665.
[2] Pinna, N.; Garnweitner, G.; Antonietti, M.; Niederberger, M. A General Non-
aqueous Route to Binary Metal Oxide Nanocrystals Involving a C-C bond Cleav-
age. J. Am. Chem. Soc. 2005, 127, 5608.
[3] Rockenberger, J.; Scher, E. C.; Alivisatos, A. P. A new Nonhydrolytic Single-
Precursor Approach to Surfactant-capped Nanocrystals of Transition Metal Ox-
ides. J. Am. Chem. Soc. 1999, 121, 11595.
[4] O’Brien, S.; Brus, L.; Murray, C. B. Synthesis of Monodisperse Nanoparticles of
Barium Titanate: Toward a Generalized Strategy of Oxide Nanoparticle Synthe-
sis. J. Am. Chem. Soc. 2001, 123, 12085.
[5] Hyeon, T.; Lee, S. S.; Park, J.; Chung,Y.; Na, H. B. Synthesis of Highly Crys-
talline and Monodisperse Maghemite Nanocrystallites without a Size-selection
Process. J. Am. Chem. Soc. 2001, 123, 12798.
[6] Huang, Q.; Gao, L. A simple Route for the Synthesis of Rutile TiO2 Nanorods.
Chemistry Letter. 2003, 32, 638.
[7] Hoene, Joan Von; Charles, Robert G.;Hickam, William M. Thermal Decomposi-
tion of Metal Acetylacetonates. J. Phys.Chem. 1958, 62, 1098
59
BIBLIOGRAPHY Chapter 2
[8] Marra, W.C.; Eisenberger P.; Cho, A. Y. X-ray Total External-reflection-Bragg
Diffraction: A Structural Study of the GaAs-Al Interface. J. Appl. Phys. 1979,
50, 6927.
[9] Kaufmann, E.N. Characterization of Materials. John Wiley and Sons, Inc. Hobo-
ken, New Jersey. ISBN: 0-471-26882-8.
[10] Young, T. An Essay on the Cohesion of Fluids. Philos. Trans. R. Soc. Lond.
1805, 95, 65.
[11] Fuloria, N. K.; Fuloria, S. Spectroscopy: Fundamentals and Data Interpretation,
Studium Press India Pvt. Ltd. 2013
[12] Briggs, D.; Seah, M.P. Practical Surface Analysis by Auger and X-ray Pho-
toelectron Spectroscopy, John Wiley and Sons, New York (1985); ISBN 10:
047126279X ISBN 13: 9780471262794
[13] Konigsberger, D.C. ;Prince, R. X-Ray Absorption: Principles, Applications,
Techniques of EXAFS, SEXAFS and XANES, (Wiley, New York, 1988)
[14] Newville, M.; Ravel, B.; Haskel, D.; Rehr, J.J.; Stern, E.A.; Yacoby, Y. Analysis
of Multiple-scattering XAFS Data using Theoretical Standards Physica B. 1995,
154, 208.
[15] Basu, S.; Nayak, C.; Yadav, A. K.; Agrawal, A.; Poswal, A. K.; Bhattacharyya,
D.; Jha, S. N.; Sahoo, N. K. A Comprehensive Facility for EXAFS Measurements
at the INDUS-2 Synchrotron Source at RRCAT, Indore, India. J. Phys.: Conf.
Ser. 2014, 493, 012032.
60
Chapter 3
Doping of TiO2 with Nitrogen.
3.1 Introduction
Titanium dioxide(TiO2) is a wide band gap semiconducting oxide which finds applica-
tion in the field of photo-catalysis,1 solar cells,2 gas sensors,3 hydrophobic -hydrophilic
switching coatings,4 antimicrobial coatings etc.5 owing to their tunable band struc-
ture. The photo-generated conduction band electrons and the valence band holes
induce relevant redox surface reactions. However, one of the main issues associated
with TiO2 is the requirement of UV radiation with respect to its photo-activity for
generating conduction band electrons and valence band holes. The most abundant
source of this UV radiation is solar radiation which constitutes only ∼ 5% of it and has
been exploited for the photo-catalytic applications. It is well known that the visible
region of solar spectrum is ∼ 50% and the effective utilization of this natural solar
energy warrants the proper tapping of this part of spectrum too. Therefore, several
methods have been adopted in literature for this purpose. As will be explained in the
next section, nitrogen doping of TiO2 seems to be the most viable method. Narrowing
the band gap of earth-abundant wideband gap metal oxide photocatalysts to increase
their visible light absorption is crucial in advancing their applications in solar-to-fuel
energy conversion.
61
Introduction Chapter 3
Doping of TiO2 by Nitrogen:
Among the various band engineering methods adopted to make visible light active
TiO2 , nitrogen doping has been found to be the most effective, taking into considera-
tion the detrimental effects such as photo-corrosion, generation of electron-hole recom-
bination sites etc.6–11 The visible light activity in N-doped TiO2 has been attributed
to either reduction of band gap9,12 or presence of isolated interband states.13–15 This
band gap alteration is dependent on the nature of nitrogen containing chemical species
in TiO2. In this context, it is pertinent to discuss chemical nature of the nitrogen in
TiO2, which in turn affect the band structure. Amongst the various methods for prob-
ing the chemical nature of nitrogen, X-ray Photoelectron spectroscopy(XPS) is the
widely used technique. Since, XPS utilizes the binding energy of the photo-electrons
to understand the surrounding chemical environment at a local level, titanium oxy
nitride systems are referred in this article primarily to understand the chemical na-
ture of nitrogen inside TiO2 matrix.16,17. Other aspects of oxy-nitride systems with
respect to difficulties in its synthesis are out of the purview of this work. Coming
back to the chemical nature of the nitrogen in TiO2, it is known that when nitrogen
is doped in TiO2, it can either replace the lattice oxygen or sit in the interstitial po-
sitions of the lattice, referred as substitutional nitrogen (Ns) and interstitial nitrogen
(Ni) respectively. It is known that in case of substitutional nitrogen the band gap is
lowered, while interstitial nitrogen introduces interband states.18 It has been proposed
in literature that, doping of TiO2 under oxygen rich(deficient) atmospheres may lead
to interstitial(substitutional) doping respectively.18 In addition, nitrogen doping also
leads to formation of molecular N2 or NO kind of species in TiO2 matrix. In the case
of nitrogen-doped metal oxides, and oxynitrides, only the actual substitution of O2−
with N3− with high N concentrations result in the desired band gap narrowing by
elevating the valence band edge.16,18 Furthermore, the position of nitrogen dopants
with respect to the surface has an impact on the photoconversion efficiency.19,20 Syn-
thesis of N-doped TiO2 in controlled conditions involves replacing the oxygen in TiO2
62
Chapter 3: Doping of TiO2 with Nitrogen. Chapter 3
by nitrogen atoms, which leads to creation of oxygen vacancies.21–23 Theoretical cal-
culations evidence that electronic structure of N-doped TiO2 strongly depends on
concentration of oxygen vacancies.24 Hence, controlling the number of oxygen vacan-
cies is paramount in obtaining the desired band gap. Details regarding the oxygen
vacancies in TiO2 under similar synthetic conditions as studied in this thesis will be
discussed in another chapter. In addition, theoretical calculations revealed that a
significant band gap narrowing occurs only under heavy nitrogen doping.25,26 Thus,
for band gap narrowing following conditions should be realized: (i) anionic N → O
substitution and minimization of N2 and NO structural defects, (ii) the optimal con-
centration of oxygen vacancies and (iii) the high doping level. Though, initially band
gap narrowing was considered as the precondition to obtain visible light activity in
TiO2,it can still be obtained by introduction of interband states when nitrogen goes to
a non-crystallographic location known as interstitial nitrogen. These interband states
consist of N 2p states which lies just above the valence band consisting of O 2p states.
The electrons get excited from these states to conduction band at a lower energy than
the band gap energy thus making the material visible light active.
As the location (substitutional /interstitial), concentration and chemical state of ni-
trogen is crucial, it is pertinent to discuss these aspects in detail. Amongst the tech-
niques available to probe the aforementioned properties, XPS (X-ray Photoelectron
Spectroscopy) and XAS (X-ray Absorption spectroscopy)are two techniques which
are widely used and are used in this thesis. Although, an alternate technique such as
electron paramagnetic resonance(EPR) is often used to determine the chemical state,
concentration and location of nitrogen vis-a-vis the TiO2 lattice which can detect very
low concentrations of paramagnetic species, it can not discriminate between intersti-
tial and substitutional sites.18 XPS is a surface analytical technique, which reveals
information from surface and subsurface level by adopting in-situ sputtering tech-
niques. The X-ray photo-electron spectrum corresponding to N 1s electron is noisy
63
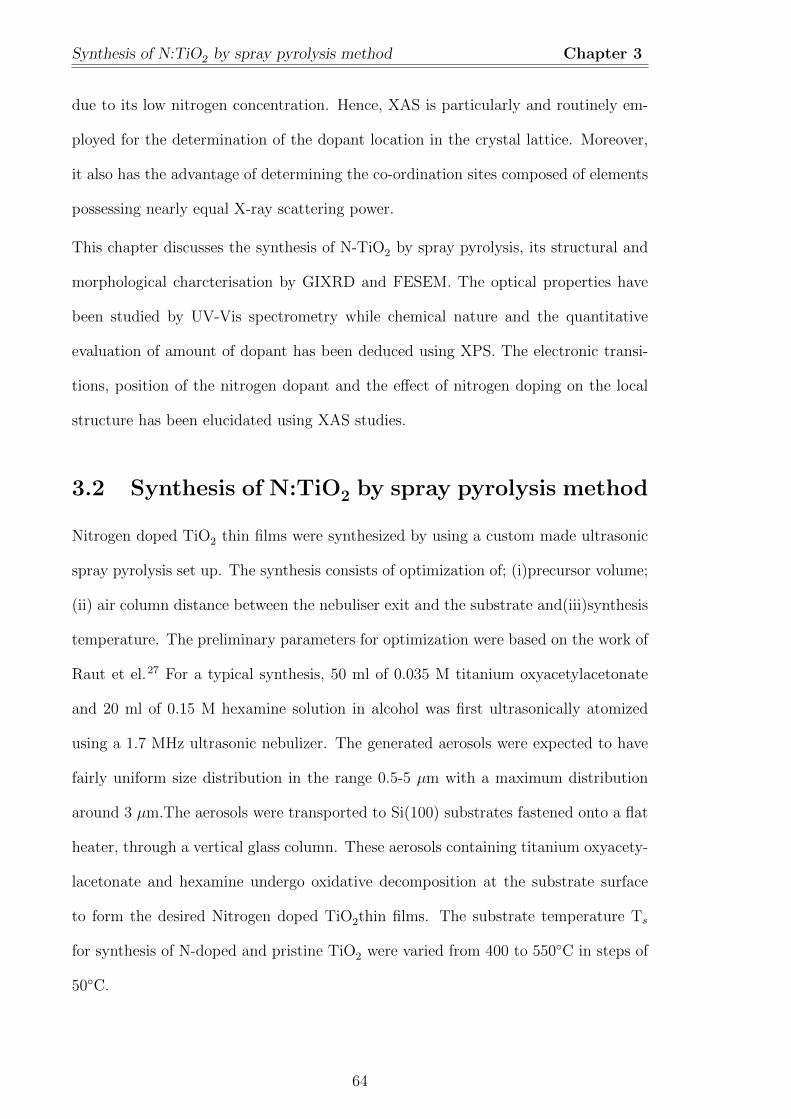
Synthesis of N:TiO2 by spray pyrolysis method Chapter 3
due to its low nitrogen concentration. Hence, XAS is particularly and routinely em-
ployed for the determination of the dopant location in the crystal lattice. Moreover,
it also has the advantage of determining the co-ordination sites composed of elements
possessing nearly equal X-ray scattering power.
This chapter discusses the synthesis of N-TiO2 by spray pyrolysis, its structural and
morphological charcterisation by GIXRD and FESEM. The optical properties have
been studied by UV-Vis spectrometry while chemical nature and the quantitative
evaluation of amount of dopant has been deduced using XPS. The electronic transi-
tions, position of the nitrogen dopant and the effect of nitrogen doping on the local
structure has been elucidated using XAS studies.
3.2 Synthesis of N:TiO2 by spray pyrolysis method
Nitrogen doped TiO2 thin films were synthesized by using a custom made ultrasonic
spray pyrolysis set up. The synthesis consists of optimization of; (i)precursor volume;
(ii) air column distance between the nebuliser exit and the substrate and(iii)synthesis
temperature. The preliminary parameters for optimization were based on the work of
Raut et el.27 For a typical synthesis, 50 ml of 0.035 M titanium oxyacetylacetonate
and 20 ml of 0.15 M hexamine solution in alcohol was first ultrasonically atomized
using a 1.7 MHz ultrasonic nebulizer. The generated aerosols were expected to have
fairly uniform size distribution in the range 0.5-5 µm with a maximum distribution
around 3 µm.The aerosols were transported to Si(100) substrates fastened onto a flat
heater, through a vertical glass column. These aerosols containing titanium oxyacety-
lacetonate and hexamine undergo oxidative decomposition at the substrate surface
to form the desired Nitrogen doped TiO2thin films. The substrate temperature Ts
for synthesis of N-doped and pristine TiO2 were varied from 400 to 550◦C in steps of
50◦C.
64
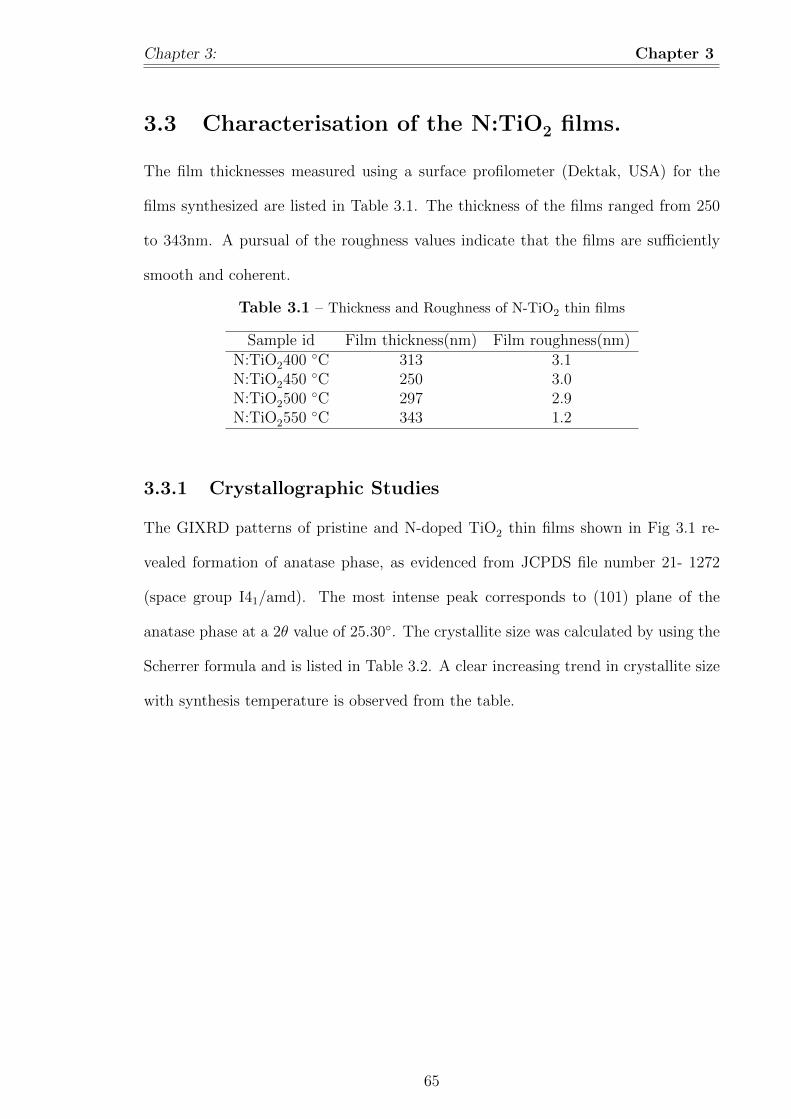
Chapter 3: Chapter 3
3.3 Characterisation of the N:TiO2 films.
The film thicknesses measured using a surface profilometer (Dektak, USA) for the
films synthesized are listed in Table 3.1. The thickness of the films ranged from 250
to 343nm. A pursual of the roughness values indicate that the films are sufficiently
smooth and coherent.
Table 3.1 – Thickness and Roughness of N-TiO2 thin films
Sample id Film thickness(nm) Film roughness(nm)N:TiO2400 ◦C 313 3.1N:TiO2450 ◦C 250 3.0N:TiO2500 ◦C 297 2.9N:TiO2550 ◦C 343 1.2
3.3.1 Crystallographic Studies
The GIXRD patterns of pristine and N-doped TiO2 thin films shown in Fig 3.1 re-
vealed formation of anatase phase, as evidenced from JCPDS file number 21- 1272
(space group I41/amd). The most intense peak corresponds to (101) plane of the
anatase phase at a 2θ value of 25.30◦. The crystallite size was calculated by using the
Scherrer formula and is listed in Table 3.2. A clear increasing trend in crystallite size
with synthesis temperature is observed from the table.
65
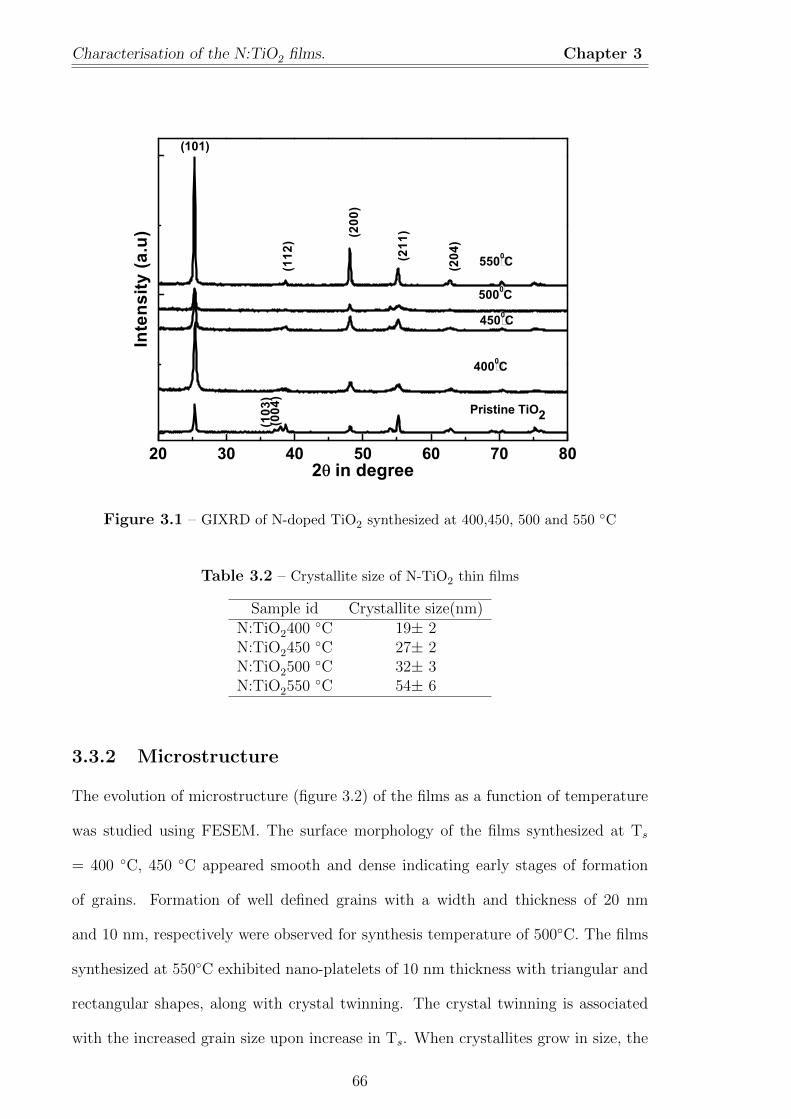
Characterisation of the N:TiO2 films. Chapter 3
20 30 40 50 60 70 80
450�0C
400�0C
(112
)(0
04)
(103
)
(204
)
(211
)(200
)
Pristine TiO2
550�0C
500�0C
In
tens
ity (a
.u)
2 in degree
(101)
Figure 3.1 – GIXRD of N-doped TiO2 synthesized at 400,450, 500 and 550 ◦C
Table 3.2 – Crystallite size of N-TiO2 thin films
Sample id Crystallite size(nm)N:TiO2400 ◦C 19± 2N:TiO2450 ◦C 27± 2N:TiO2500 ◦C 32± 3N:TiO2550 ◦C 54± 6
3.3.2 Microstructure
The evolution of microstructure (figure 3.2) of the films as a function of temperature
was studied using FESEM. The surface morphology of the films synthesized at Ts
= 400 ◦C, 450 ◦C appeared smooth and dense indicating early stages of formation
of grains. Formation of well defined grains with a width and thickness of 20 nm
and 10 nm, respectively were observed for synthesis temperature of 500◦C. The films
synthesized at 550◦C exhibited nano-platelets of 10 nm thickness with triangular and
rectangular shapes, along with crystal twinning. The crystal twinning is associated
with the increased grain size upon increase in Ts. When crystallites grow in size, the
66
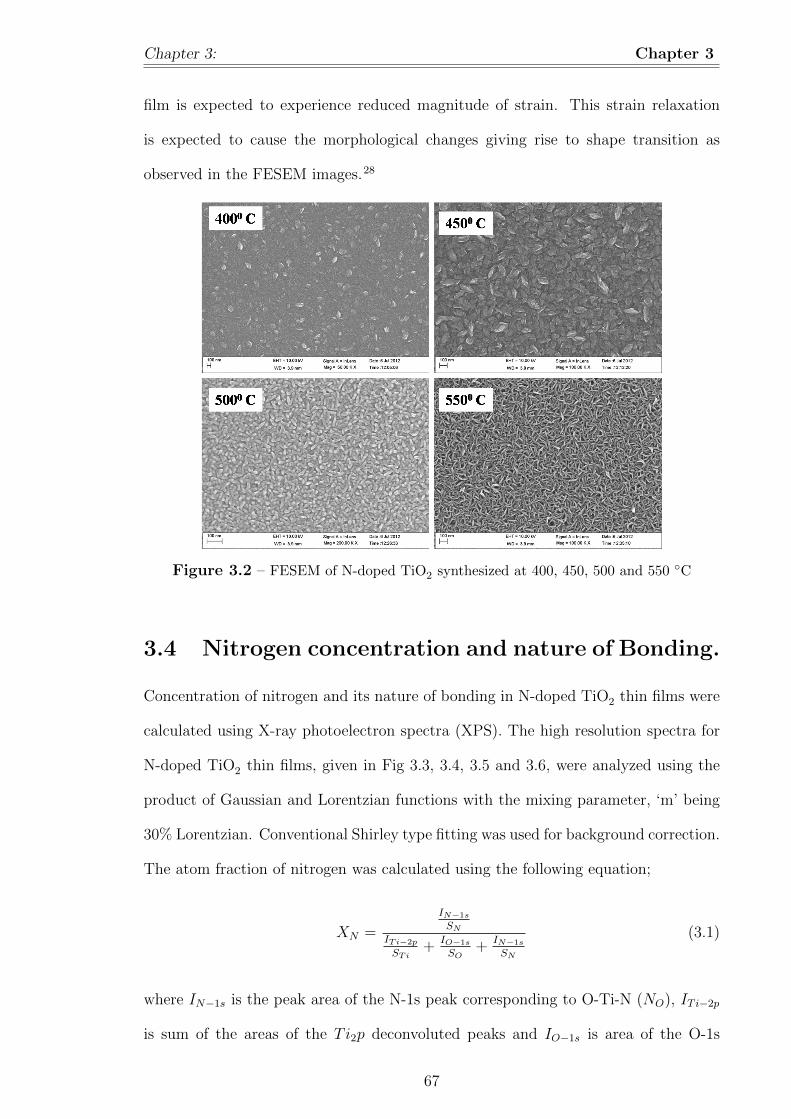
Chapter 3: Chapter 3
film is expected to experience reduced magnitude of strain. This strain relaxation
is expected to cause the morphological changes giving rise to shape transition as
observed in the FESEM images.28
Figure 3.2 – FESEM of N-doped TiO2 synthesized at 400, 450, 500 and 550 ◦C
3.4 Nitrogen concentration and nature of Bonding.
Concentration of nitrogen and its nature of bonding in N-doped TiO2 thin films were
calculated using X-ray photoelectron spectra (XPS). The high resolution spectra for
N-doped TiO2 thin films, given in Fig 3.3, 3.4, 3.5 and 3.6, were analyzed using the
product of Gaussian and Lorentzian functions with the mixing parameter, ‘m’ being
30% Lorentzian. Conventional Shirley type fitting was used for background correction.
The atom fraction of nitrogen was calculated using the following equation;
XN =
IN−1s
SNITi−2p
STi+ IO−1s
SO+ IN−1s
SN
(3.1)
where IN−1s is the peak area of the N-1s peak corresponding to O-Ti-N (NO), IT i−2p
is sum of the areas of the Ti2p deconvoluted peaks and IO−1s is area of the O-1s
67
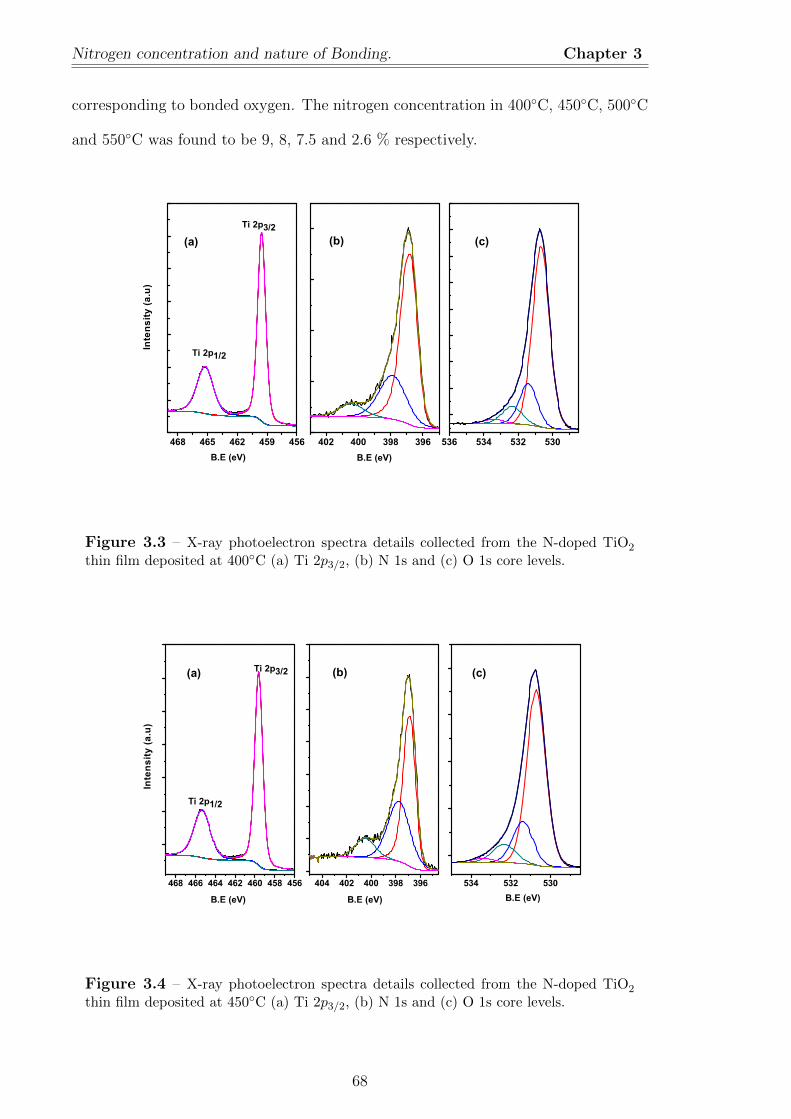
Nitrogen concentration and nature of Bonding. Chapter 3
corresponding to bonded oxygen. The nitrogen concentration in 400◦C, 450◦C, 500◦C
and 550◦C was found to be 9, 8, 7.5 and 2.6 % respectively.
468 465 462 459 456 402 400 398 396 536 534 532 530
Inte
nsity
(a.u
)
Ti 2p1/2
Ti 2p3/2
B.E (eV)
(a)
(b)
B.E (eV)
(c)
Figure 3.3 – X-ray photoelectron spectra details collected from the N-doped TiO2
thin film deposited at 400◦C (a) Ti 2p3/2, (b) N 1s and (c) O 1s core levels.
468 466 464 462 460 458 456 404 402 400 398 396 534 532 530
(a) Ti 2p3/2
Ti 2p1/2
Inte
nsity
(a.u
)
(b)
B.E (eV)B.E (eV)B.E (eV)
(c)
Figure 3.4 – X-ray photoelectron spectra details collected from the N-doped TiO2
thin film deposited at 450◦C (a) Ti 2p3/2, (b) N 1s and (c) O 1s core levels.
68
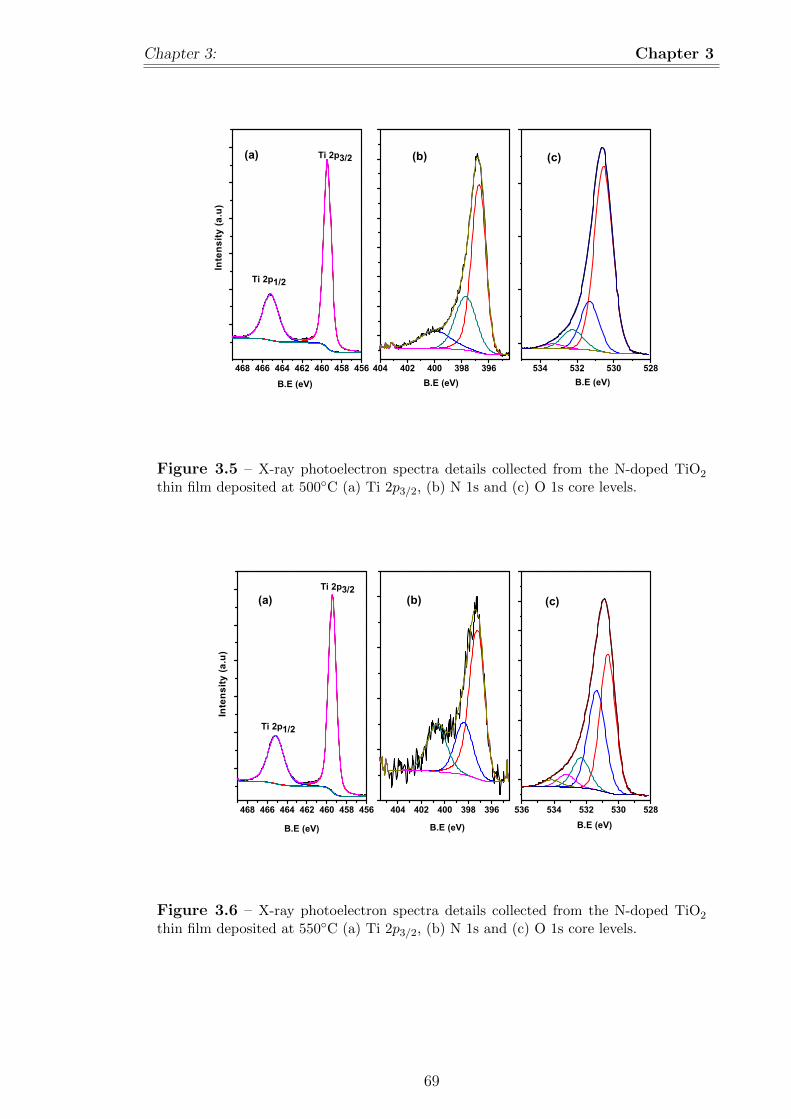
Chapter 3: Chapter 3
468 466 464 462 460 458 456 404 402 400 398 396 534 532 530 528
(a)
B.E (eV)B.E (eV)B.E (eV)
Ti 2p3/2
Ti 2p1/2
(b)
(c)
Inte
nsity
(a.u
)
Figure 3.5 – X-ray photoelectron spectra details collected from the N-doped TiO2
thin film deposited at 500◦C (a) Ti 2p3/2, (b) N 1s and (c) O 1s core levels.
468 466 464 462 460 458 456 404 402 400 398 396 536 534 532 530 528
(a)
B.E (eV)B.E (eV)B.E (eV)
Inte
nsity
(a.u
)
Ti 2p3/2
Ti 2p1/2
(b)
(c)
Figure 3.6 – X-ray photoelectron spectra details collected from the N-doped TiO2
thin film deposited at 550◦C (a) Ti 2p3/2, (b) N 1s and (c) O 1s core levels.
69
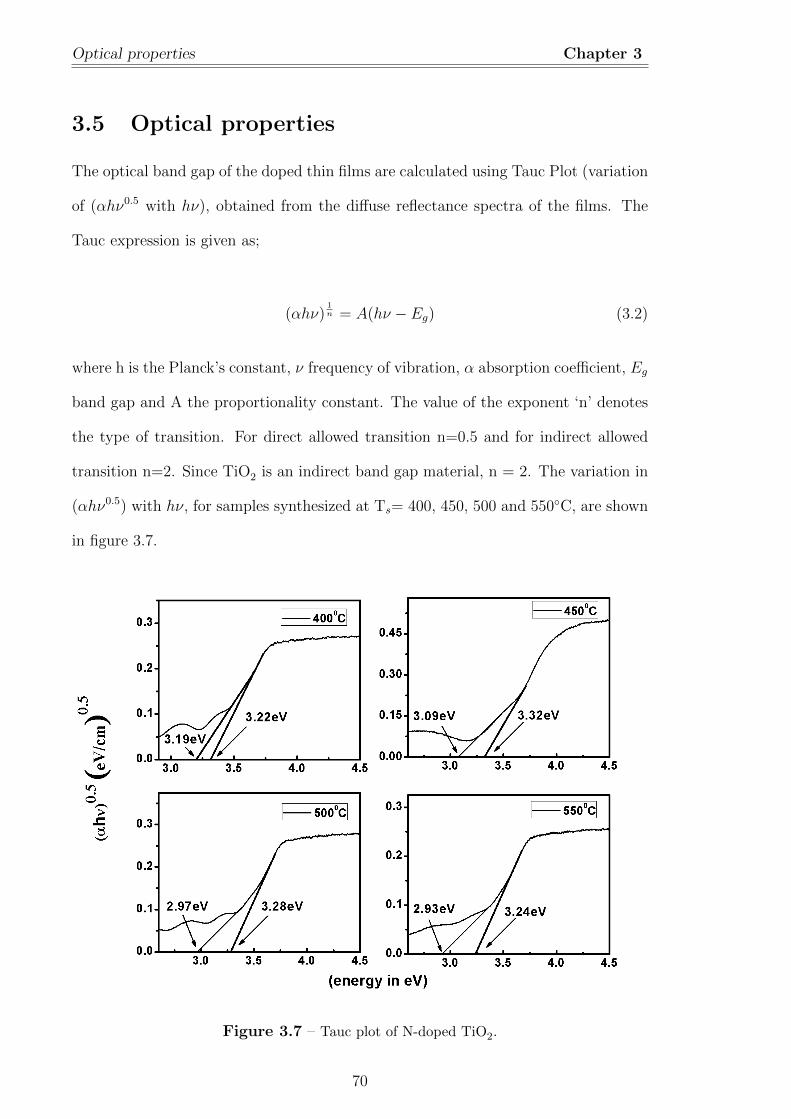
Optical properties Chapter 3
3.5 Optical properties
The optical band gap of the doped thin films are calculated using Tauc Plot (variation
of (αhν0.5 with hν), obtained from the diffuse reflectance spectra of the films. The
Tauc expression is given as;
(αhν)1n = A(hν − Eg) (3.2)
where h is the Planck’s constant, ν frequency of vibration, α absorption coefficient, Eg
band gap and A the proportionality constant. The value of the exponent ‘n’ denotes
the type of transition. For direct allowed transition n=0.5 and for indirect allowed
transition n=2. Since TiO2 is an indirect band gap material, n = 2. The variation in
(αhν0.5) with hν, for samples synthesized at Ts= 400, 450, 500 and 550◦C, are shown
in figure 3.7.
Figure 3.7 – Tauc plot of N-doped TiO2.
70
Chapter 3: Chapter 3
It is seen from the spectra that there are two linear regions. The optical band gap
obtained by taking the x-intercept at y=0 was between 3.22 eV - 3.32 eV. The intercept
from the smaller linear region show energy states situated at 3.19, 3.09, 2.97 and 2.93
eV for films synthesized at Ts = 400, 450, 500 and 550 ◦C respectively. The additional
features in the tail region of the spectra are due to the modified electronic structures
although direct one to one correlation is not straight forward.14 The presence of a
linear region corresponding to the energy less than the band gap energy indicates
introduction of interband states, as mixing of N-2p states with O-2p states are too
weak to produce significant band gap narrowing in absence of a higher amount of
N-doping.13,45,46.These interband states consists of N 2p states with a finite electron
density and are situated at a difference of around 0.2 to 0.3 eV. Since, these states lie
above the valence band, the electrons from these states are excited to the conduction
band at an energy value corresponding to visible region of the spectrum. This is
in agreement with the study of Lee et al., whose first principle density-functional
calculation has shown that absorption of visible light is due to isolated N-2p states
(Interband states) above the valence band maximum.14
3.5.1 Nature of Bonding
In this work, hexamine is used as a precursor to introduce nitrogen into the TiO2
matrix. Decomposition of hexamine yields H2, NH3, mono-, di- and trimethylamin
etc in the working temperature regime of this work (400- 550 ◦C).29,30 These nitrogen
containing species when pyrolysed along with titanium oxy-acetyl acetonate in an open
atmospheric condition may lead to various species like NO, NH, molecular nitrogen,
Ti-N-O and Ti-O-N kind of linkages inside TiO2 matrix. Hence, to understand the
chemical nature of the nitrogen in TiO2 N-1s apectra obtained from XPS are analysed
here.
71
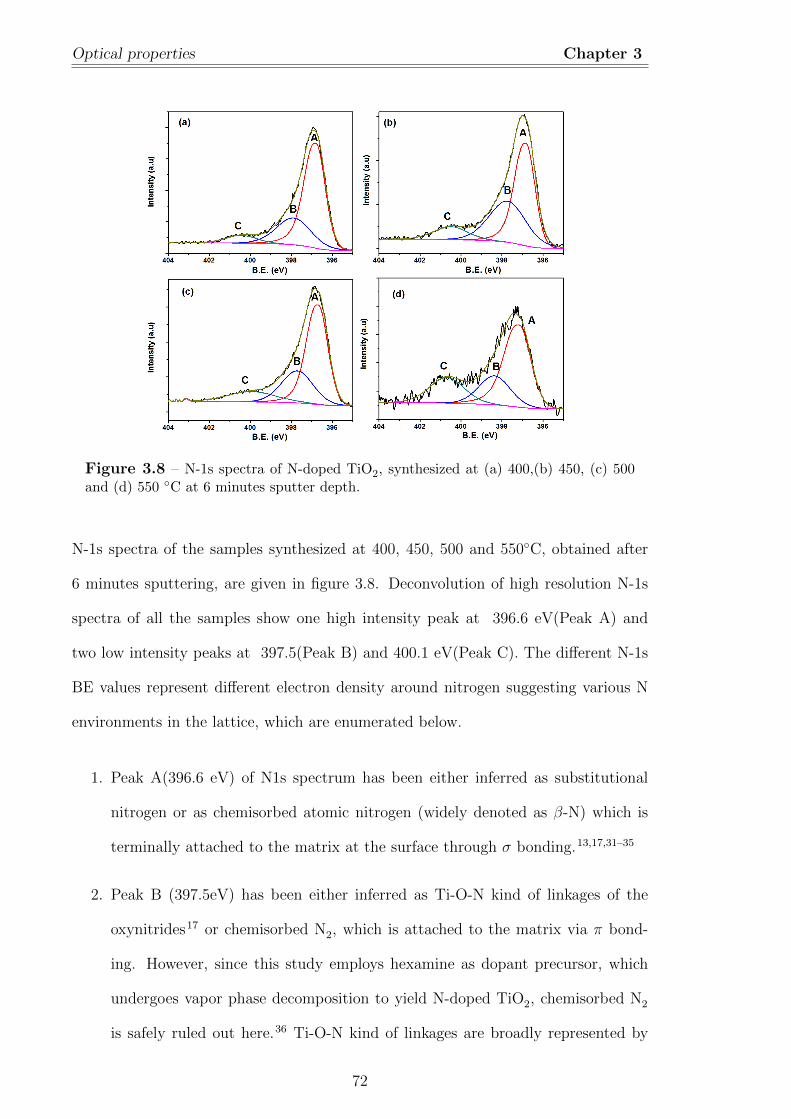
Optical properties Chapter 3
Figure 3.8 – N-1s spectra of N-doped TiO2, synthesized at (a) 400,(b) 450, (c) 500and (d) 550 ◦C at 6 minutes sputter depth.
N-1s spectra of the samples synthesized at 400, 450, 500 and 550◦C, obtained after
6 minutes sputtering, are given in figure 3.8. Deconvolution of high resolution N-1s
spectra of all the samples show one high intensity peak at 396.6 eV(Peak A) and
two low intensity peaks at 397.5(Peak B) and 400.1 eV(Peak C). The different N-1s
BE values represent different electron density around nitrogen suggesting various N
environments in the lattice, which are enumerated below.
1. Peak A(396.6 eV) of N1s spectrum has been either inferred as substitutional
nitrogen or as chemisorbed atomic nitrogen (widely denoted as β-N) which is
terminally attached to the matrix at the surface through σ bonding.13,17,31–35
2. Peak B (397.5eV) has been either inferred as Ti-O-N kind of linkages of the
oxynitrides17 or chemisorbed N2, which is attached to the matrix via π bond-
ing. However, since this study employs hexamine as dopant precursor, which
undergoes vapor phase decomposition to yield N-doped TiO2, chemisorbed N2
is safely ruled out here.36 Ti-O-N kind of linkages are broadly represented by
72
Chapter 3: Chapter 3
the binding energies in the range of 395.6- 397.1 eV. Saha et al. has studied
oxynitrides and found that when the nitrides undergo oxidation the peak at
397.1eV experiences a shift in its position depending on the degree of oxidation.
Hence, the peak at 397.5 eV can be ascribed to Ti-O-N kind of linkages of the
oxynitrides and has been described as an intermediate peak by Saha et al.17
The variation in binding energy in the range of 395.6- 397.1 eV also depends on
the variation in the oxygen to nitrogen ratio.
3. Peaks in the regime of 399–401 eV are ascribed to surface adsorbed NO,37 bulk
interstitial NO2−,38 interstitial N2 ,33 and interstitial N.39–41 In this work, peak
C (only a small peak centered at 400 eV) is observed and is attributed to either
NO kind of chemical species or interstitial NO2−.42–44
Since, the position of nitrogen in a lattice affects the electronic structure of the mate-
rial, it is prudent to discuss Peak A in detail here, which signifies nitrogen replacing
an oxygen from its lattice point in TiO2 lattice. A careful and detailed literature sur-
vey in this aspect revealed that Peak A is broadly referred as substitutional nitrogen
owing to the fact that it matches with the binding energy of N1s in Titanium Nitride
crystallographic phase and does not necessarily mean that nitrogen replaces an oxy-
gen from the lattice site. It is known that XPS as a technique is capable of measuring
the binding energy which in turn is indicative of its oxidation state. However, it does
not offer any insight into the crystallographic positions occupied by an atom, which
is being probed. Hence, it is safe to say that peak A represents Ti-N kind of linkages
without committing to its crystallographic site.
As the crystallographic position can not be deduced from XPS, it can not be com-
mitted at this juncture whether the chemical species is NO or interstitial nitrogen
sitting at a non lattice point with a Ti-N bond length different from the Ti-N bond
distance when ’N’ is located at a lattice point. Thus, the XPS data reveal incorpora-
tion of nitrogen to the TiO2 crystal lattice as Ti-N and NO. Three kinds of chemical
73
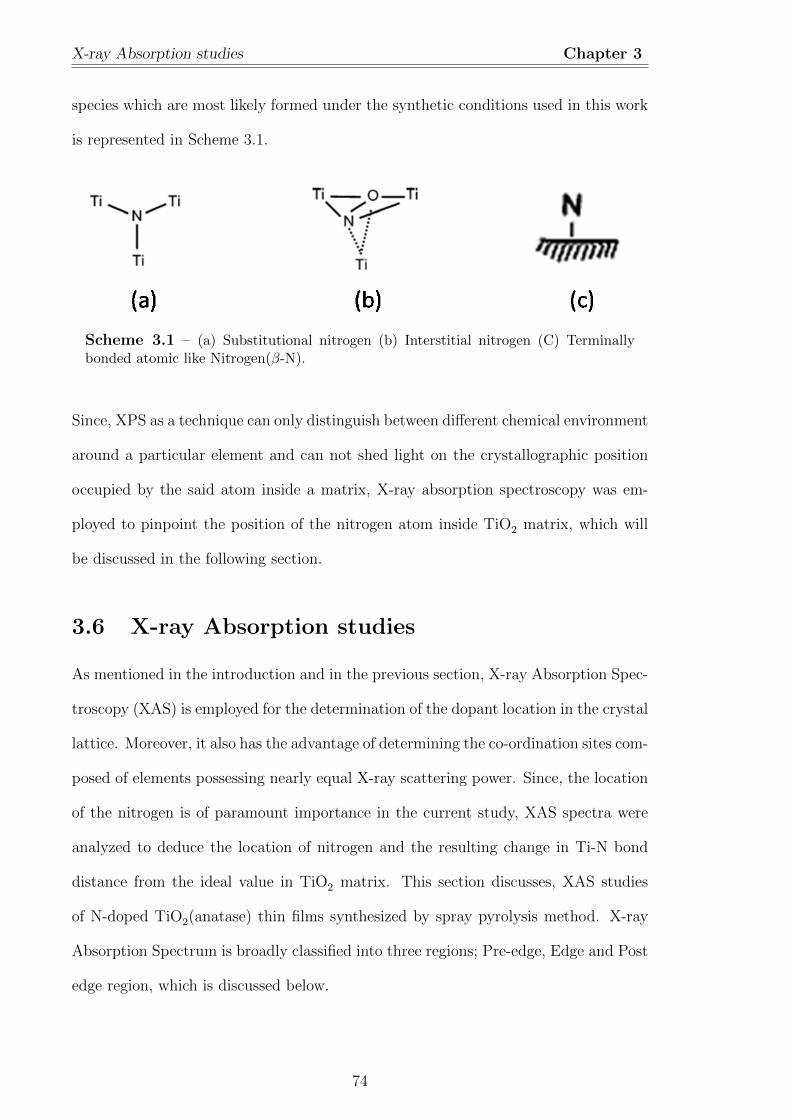
X-ray Absorption studies Chapter 3
species which are most likely formed under the synthetic conditions used in this work
is represented in Scheme 3.1.
Scheme 3.1 – (a) Substitutional nitrogen (b) Interstitial nitrogen (C) Terminallybonded atomic like Nitrogen(β-N).
Since, XPS as a technique can only distinguish between different chemical environment
around a particular element and can not shed light on the crystallographic position
occupied by the said atom inside a matrix, X-ray absorption spectroscopy was em-
ployed to pinpoint the position of the nitrogen atom inside TiO2 matrix, which will
be discussed in the following section.
3.6 X-ray Absorption studies
As mentioned in the introduction and in the previous section, X-ray Absorption Spec-
troscopy (XAS) is employed for the determination of the dopant location in the crystal
lattice. Moreover, it also has the advantage of determining the co-ordination sites com-
posed of elements possessing nearly equal X-ray scattering power. Since, the location
of the nitrogen is of paramount importance in the current study, XAS spectra were
analyzed to deduce the location of nitrogen and the resulting change in Ti-N bond
distance from the ideal value in TiO2 matrix. This section discusses, XAS studies
of N-doped TiO2(anatase) thin films synthesized by spray pyrolysis method. X-ray
Absorption Spectrum is broadly classified into three regions; Pre-edge, Edge and Post
edge region, which is discussed below.
74

Chapter 3: Chapter 3
3.6.1 Analysis of the XAS spectrum
4950 4960 4970 4980 4990 5000 5010 50200.0
0.2
0.4
0.6
0.8
1.0
1.2
1.4
1.6White line TiO2-xNx_500oC
TiO2_500oC
TiO2-xNx_450oC
TiO2_450oC
TiO2-xNx_400oC
TiO2_400oC
Nor
mal
ized
Energy/eV
Pre-edge Peaks(A
1,A
2,A
3)
B
White Line
4965 4970 4975 4980
0.5
1.0
1.5
Figure 3.9 – Normalised Ti K-edge Spectra For Pristine and N-doped TiO2.
X-ray Absorption Spectrum of spray pyrolysis synthesized TiO2 and N-doped TiO2
anatase films is given in Figure 3.9. XAS spectra possesses three distinct regions viz.
the edge, pre-edge (Peak A1, A2 and A3) and an extended region after the edge. The
edge has a white line (Figure 3.9) above the edge in the present study. The white
line is characteristic of anatase phase as confirmed from section 3.3.1) and can be
attributed to the promotion of a photoelectron to the vacant np orbital of Ti or the
anti-bonding orbitals of Ti-O.47
In addition to this, XAS spectra is characterized by sharpness of absorption step
maxima and the rate at which the absorption spectra tails off, which is a function
of sample thickness according to Grunes et al.48 They observed that thinner sam-
ples produce sharp absorption step and a rapidly decaying tail. By comparing the
absorption spectra of the doped and pristine TiO2 thin films, it has been observed
that the absorption spectrum tails off rapidly for samples synthesized at Ts= 500◦C,
which are the thinnest compared to that of those synthesized at Ts= 400, 450◦C .48,50
75
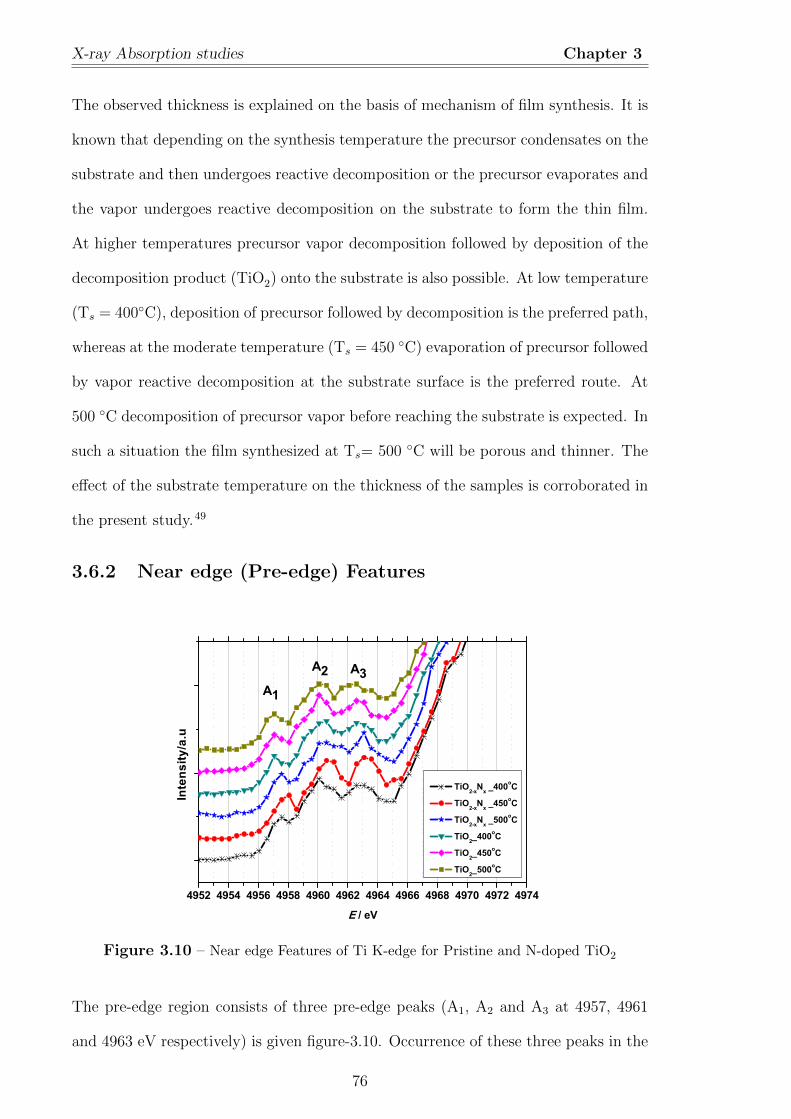
X-ray Absorption studies Chapter 3
The observed thickness is explained on the basis of mechanism of film synthesis. It is
known that depending on the synthesis temperature the precursor condensates on the
substrate and then undergoes reactive decomposition or the precursor evaporates and
the vapor undergoes reactive decomposition on the substrate to form the thin film.
At higher temperatures precursor vapor decomposition followed by deposition of the
decomposition product (TiO2) onto the substrate is also possible. At low temperature
(Ts = 400◦C), deposition of precursor followed by decomposition is the preferred path,
whereas at the moderate temperature (Ts = 450 ◦C) evaporation of precursor followed
by vapor reactive decomposition at the substrate surface is the preferred route. At
500 ◦C decomposition of precursor vapor before reaching the substrate is expected. In
such a situation the film synthesized at Ts= 500 ◦C will be porous and thinner. The
effect of the substrate temperature on the thickness of the samples is corroborated in
the present study.49
3.6.2 Near edge (Pre-edge) Features
4952 4954 4956 4958 4960 4962 4964 4966 4968 4970 4972 4974
A1
A3A2
E / eV
TiO2-xNx _400oC
TiO2-xNx _450oC
TiO2-xNx _500oC
TiO2_400oC
TiO2_450oC
TiO2_500oC
Inte
nsity
/a.u
Figure 3.10 – Near edge Features of Ti K-edge for Pristine and N-doped TiO2
The pre-edge region consists of three pre-edge peaks (A1, A2 and A3 at 4957, 4961
and 4963 eV respectively) is given figure-3.10. Occurrence of these three peaks in the
76
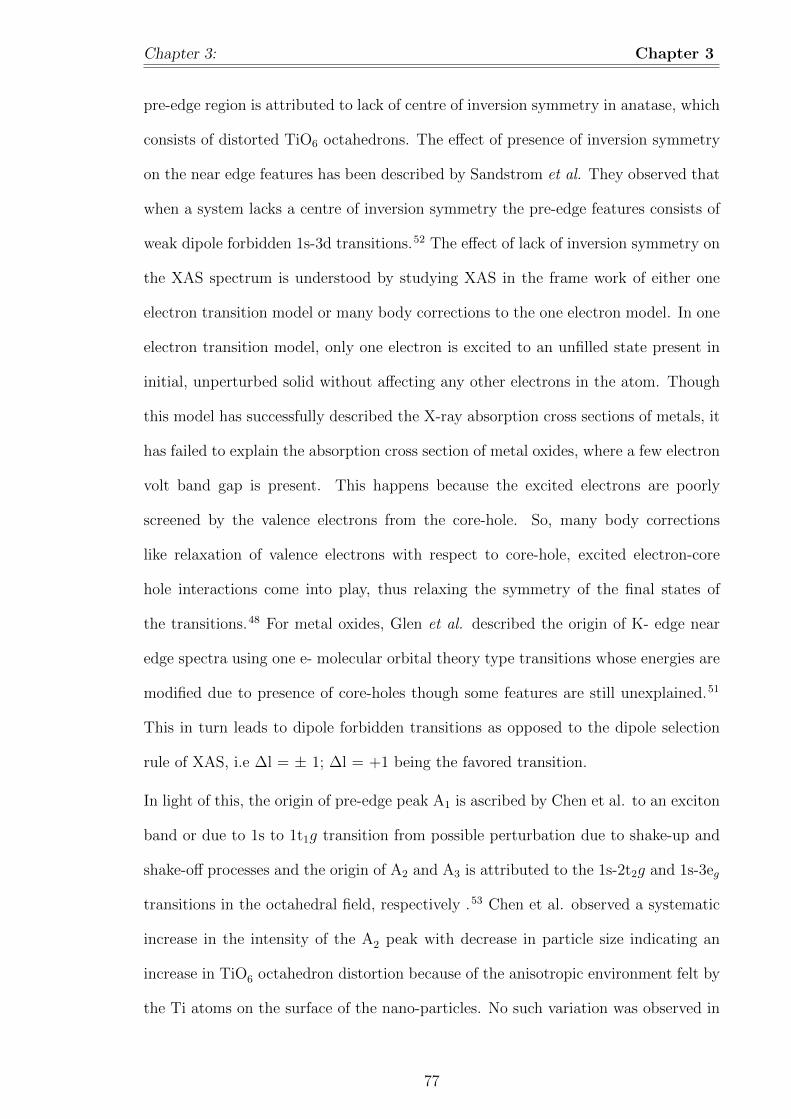
Chapter 3: Chapter 3
pre-edge region is attributed to lack of centre of inversion symmetry in anatase, which
consists of distorted TiO6 octahedrons. The effect of presence of inversion symmetry
on the near edge features has been described by Sandstrom et al. They observed that
when a system lacks a centre of inversion symmetry the pre-edge features consists of
weak dipole forbidden 1s-3d transitions.52 The effect of lack of inversion symmetry on
the XAS spectrum is understood by studying XAS in the frame work of either one
electron transition model or many body corrections to the one electron model. In one
electron transition model, only one electron is excited to an unfilled state present in
initial, unperturbed solid without affecting any other electrons in the atom. Though
this model has successfully described the X-ray absorption cross sections of metals, it
has failed to explain the absorption cross section of metal oxides, where a few electron
volt band gap is present. This happens because the excited electrons are poorly
screened by the valence electrons from the core-hole. So, many body corrections
like relaxation of valence electrons with respect to core-hole, excited electron-core
hole interactions come into play, thus relaxing the symmetry of the final states of
the transitions.48 For metal oxides, Glen et al. described the origin of K- edge near
edge spectra using one e- molecular orbital theory type transitions whose energies are
modified due to presence of core-holes though some features are still unexplained.51
This in turn leads to dipole forbidden transitions as opposed to the dipole selection
rule of XAS, i.e ∆l = ± 1; ∆l = +1 being the favored transition.
In light of this, the origin of pre-edge peak A1 is ascribed by Chen et al. to an exciton
band or due to 1s to 1t1g transition from possible perturbation due to shake-up and
shake-off processes and the origin of A2 and A3 is attributed to the 1s-2t2g and 1s-3eg
transitions in the octahedral field, respectively .53 Chen et al. observed a systematic
increase in the intensity of the A2 peak with decrease in particle size indicating an
increase in TiO6 octahedron distortion because of the anisotropic environment felt by
the Ti atoms on the surface of the nano-particles. No such variation was observed in
77
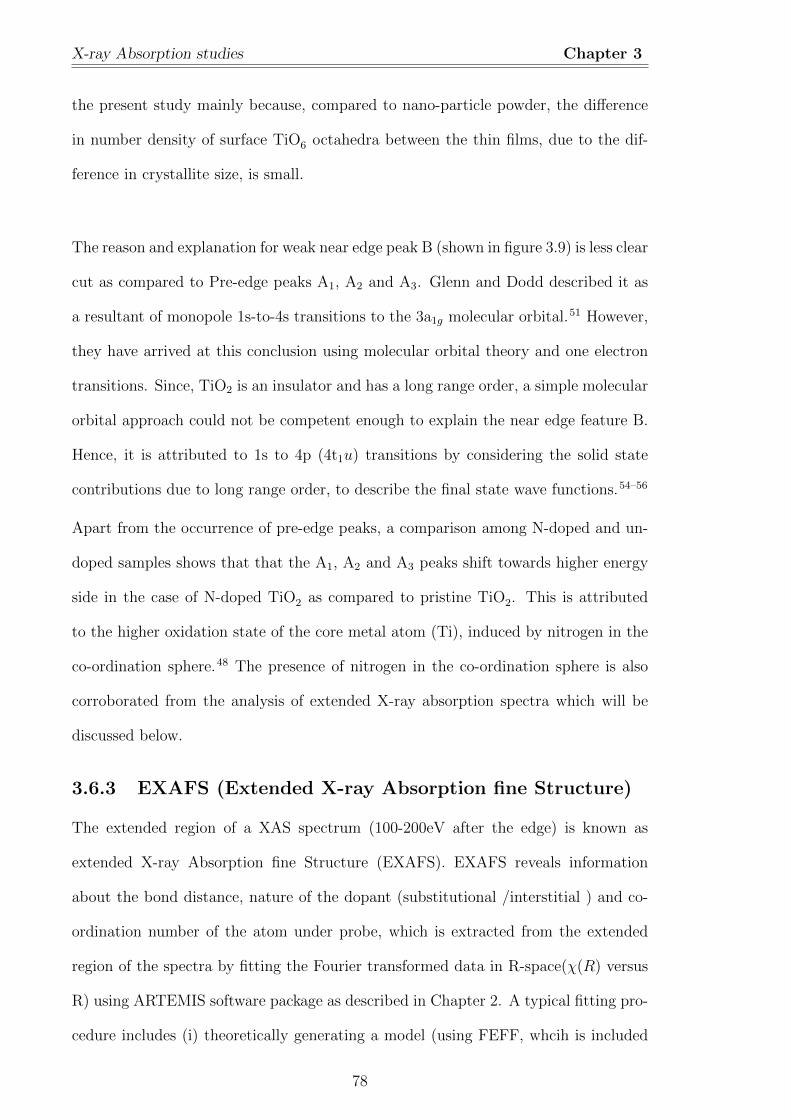
X-ray Absorption studies Chapter 3
the present study mainly because, compared to nano-particle powder, the difference
in number density of surface TiO6 octahedra between the thin films, due to the dif-
ference in crystallite size, is small.
The reason and explanation for weak near edge peak B (shown in figure 3.9) is less clear
cut as compared to Pre-edge peaks A1, A2 and A3. Glenn and Dodd described it as
a resultant of monopole 1s-to-4s transitions to the 3a1g molecular orbital.51 However,
they have arrived at this conclusion using molecular orbital theory and one electron
transitions. Since, TiO2 is an insulator and has a long range order, a simple molecular
orbital approach could not be competent enough to explain the near edge feature B.
Hence, it is attributed to 1s to 4p (4t1u) transitions by considering the solid state
contributions due to long range order, to describe the final state wave functions.54–56
Apart from the occurrence of pre-edge peaks, a comparison among N-doped and un-
doped samples shows that that the A1, A2 and A3 peaks shift towards higher energy
side in the case of N-doped TiO2 as compared to pristine TiO2. This is attributed
to the higher oxidation state of the core metal atom (Ti), induced by nitrogen in the
co-ordination sphere.48 The presence of nitrogen in the co-ordination sphere is also
corroborated from the analysis of extended X-ray absorption spectra which will be
discussed below.
3.6.3 EXAFS (Extended X-ray Absorption fine Structure)
The extended region of a XAS spectrum (100-200eV after the edge) is known as
extended X-ray Absorption fine Structure (EXAFS). EXAFS reveals information
about the bond distance, nature of the dopant (substitutional /interstitial ) and co-
ordination number of the atom under probe, which is extracted from the extended
region of the spectra by fitting the Fourier transformed data in R-space(χ(R) versus
R) using ARTEMIS software package as described in Chapter 2. A typical fitting pro-
cedure includes (i) theoretically generating a model (using FEFF, whcih is included
78
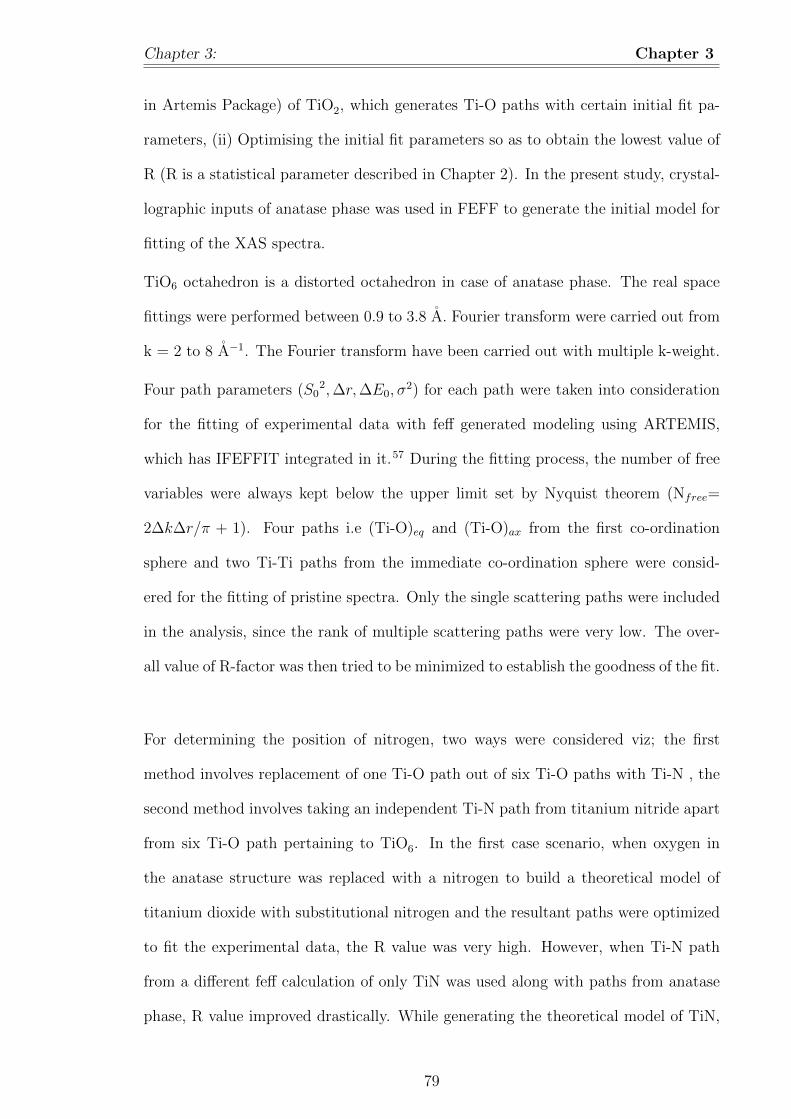
Chapter 3: Chapter 3
in Artemis Package) of TiO2, which generates Ti-O paths with certain initial fit pa-
rameters, (ii) Optimising the initial fit parameters so as to obtain the lowest value of
R (R is a statistical parameter described in Chapter 2). In the present study, crystal-
lographic inputs of anatase phase was used in FEFF to generate the initial model for
fitting of the XAS spectra.
TiO6 octahedron is a distorted octahedron in case of anatase phase. The real space
fittings were performed between 0.9 to 3.8 A. Fourier transform were carried out from
k = 2 to 8 A−1. The Fourier transform have been carried out with multiple k-weight.
Four path parameters (S02,∆r,∆E0, σ
2) for each path were taken into consideration
for the fitting of experimental data with feff generated modeling using ARTEMIS,
which has IFEFFIT integrated in it.57 During the fitting process, the number of free
variables were always kept below the upper limit set by Nyquist theorem (Nfree=
2∆k∆r/π + 1). Four paths i.e (Ti-O)eq and (Ti-O)ax from the first co-ordination
sphere and two Ti-Ti paths from the immediate co-ordination sphere were consid-
ered for the fitting of pristine spectra. Only the single scattering paths were included
in the analysis, since the rank of multiple scattering paths were very low. The over-
all value of R-factor was then tried to be minimized to establish the goodness of the fit.
For determining the position of nitrogen, two ways were considered viz; the first
method involves replacement of one Ti-O path out of six Ti-O paths with Ti-N , the
second method involves taking an independent Ti-N path from titanium nitride apart
from six Ti-O path pertaining to TiO6. In the first case scenario, when oxygen in
the anatase structure was replaced with a nitrogen to build a theoretical model of
titanium dioxide with substitutional nitrogen and the resultant paths were optimized
to fit the experimental data, the R value was very high. However, when Ti-N path
from a different feff calculation of only TiN was used along with paths from anatase
phase, R value improved drastically. While generating the theoretical model of TiN,
79
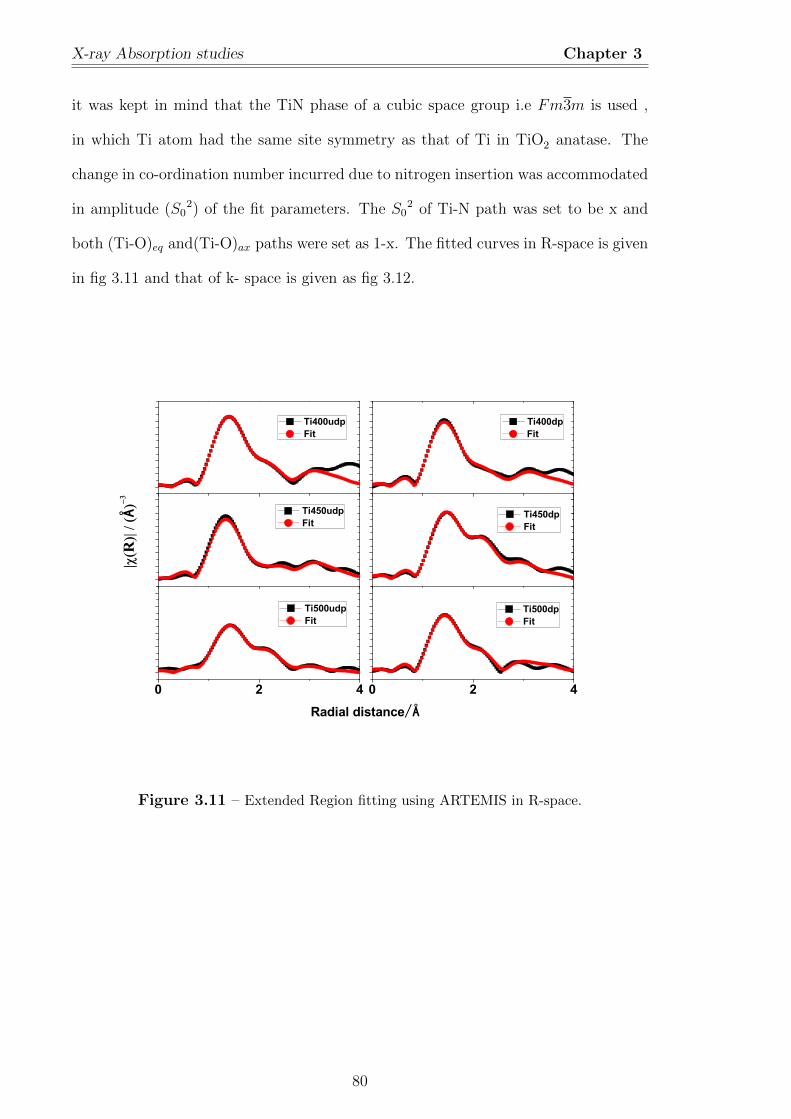
X-ray Absorption studies Chapter 3
it was kept in mind that the TiN phase of a cubic space group i.e Fm3m is used ,
in which Ti atom had the same site symmetry as that of Ti in TiO2 anatase. The
change in co-ordination number incurred due to nitrogen insertion was accommodated
in amplitude (S02) of the fit parameters. The S0
2 of Ti-N path was set to be x and
both (Ti-O)eq and(Ti-O)ax paths were set as 1-x. The fitted curves in R-space is given
in fig 3.11 and that of k- space is given as fig 3.12.
0 2 4 0 2 4
Ti400udp Fit
Ti400dp Fit
Ti450udp Fit
Ti450dp Fit
Ti500udp Fit
RÅ
Ti500dp Fit
Radial distance/Å
Figure 3.11 – Extended Region fitting using ARTEMIS in R-space.
80
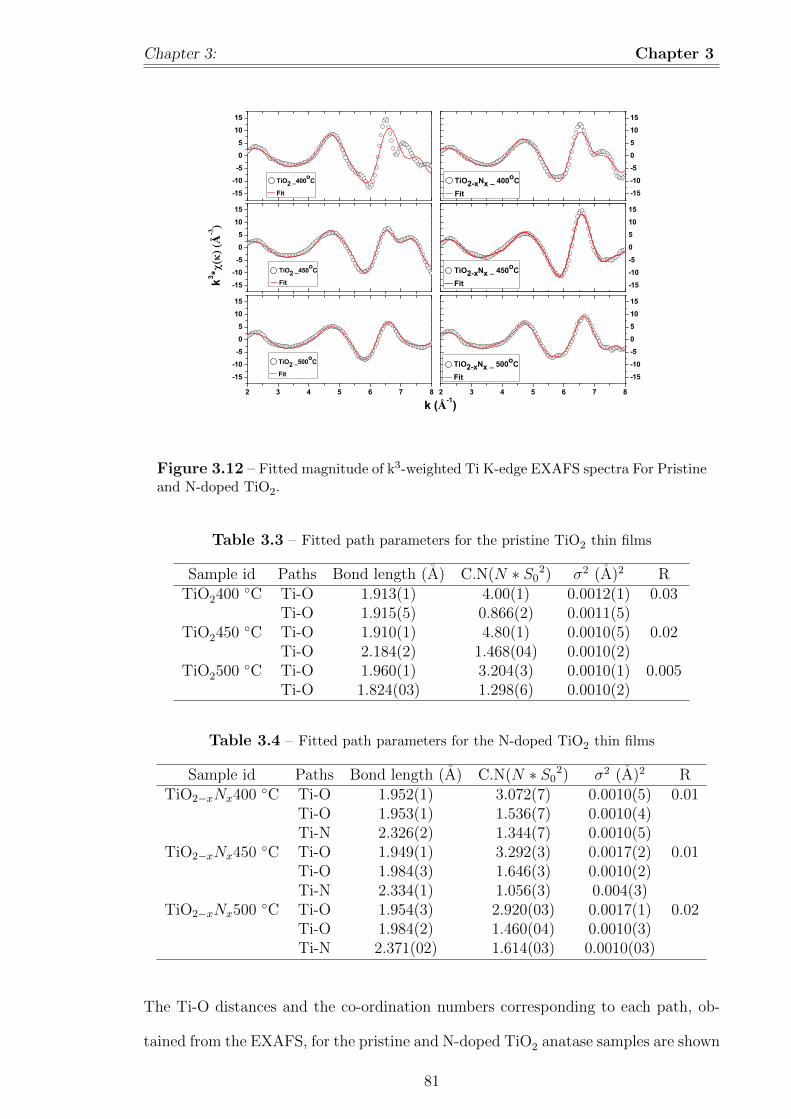
Chapter 3: Chapter 3
-15-10-505
1015
-15-10-5051015
-15-10-505
1015
-15-10-5051015
2 3 4 5 6 7 8
-15-10-505
1015
2 3 4 5 6 7 8
-15-10-5051015
TiO2 _400oC
Fit
TiO2-xNx _ 400oC Fit
TiO2 _450oC
Fit
k (Å-1)
k3 *
Å-3
TiO2-xNx _ 450oC Fit
TiO2 _500oC
Fit
TiO2-xNx _ 500oC Fit
Figure 3.12 – Fitted magnitude of k3-weighted Ti K-edge EXAFS spectra For Pristineand N-doped TiO2.
Table 3.3 – Fitted path parameters for the pristine TiO2 thin films
Sample id Paths Bond length (A) C.N(N ∗ S02) σ2 (A)2 R
TiO2400 ◦C Ti-O 1.913(1) 4.00(1) 0.0012(1) 0.03Ti-O 1.915(5) 0.866(2) 0.0011(5)
TiO2450 ◦C Ti-O 1.910(1) 4.80(1) 0.0010(5) 0.02Ti-O 2.184(2) 1.468(04) 0.0010(2)
TiO2500 ◦C Ti-O 1.960(1) 3.204(3) 0.0010(1) 0.005Ti-O 1.824(03) 1.298(6) 0.0010(2)
Table 3.4 – Fitted path parameters for the N-doped TiO2 thin films
Sample id Paths Bond length (A) C.N(N ∗ S02) σ2 (A)2 R
TiO2−xNx400 ◦C Ti-O 1.952(1) 3.072(7) 0.0010(5) 0.01Ti-O 1.953(1) 1.536(7) 0.0010(4)Ti-N 2.326(2) 1.344(7) 0.0010(5)
TiO2−xNx450 ◦C Ti-O 1.949(1) 3.292(3) 0.0017(2) 0.01Ti-O 1.984(3) 1.646(3) 0.0010(2)Ti-N 2.334(1) 1.056(3) 0.004(3)
TiO2−xNx500 ◦C Ti-O 1.954(3) 2.920(03) 0.0017(1) 0.02Ti-O 1.984(2) 1.460(04) 0.0010(3)Ti-N 2.371(02) 1.614(03) 0.0010(03)
The Ti-O distances and the co-ordination numbers corresponding to each path, ob-
tained from the EXAFS, for the pristine and N-doped TiO2 anatase samples are shown
81
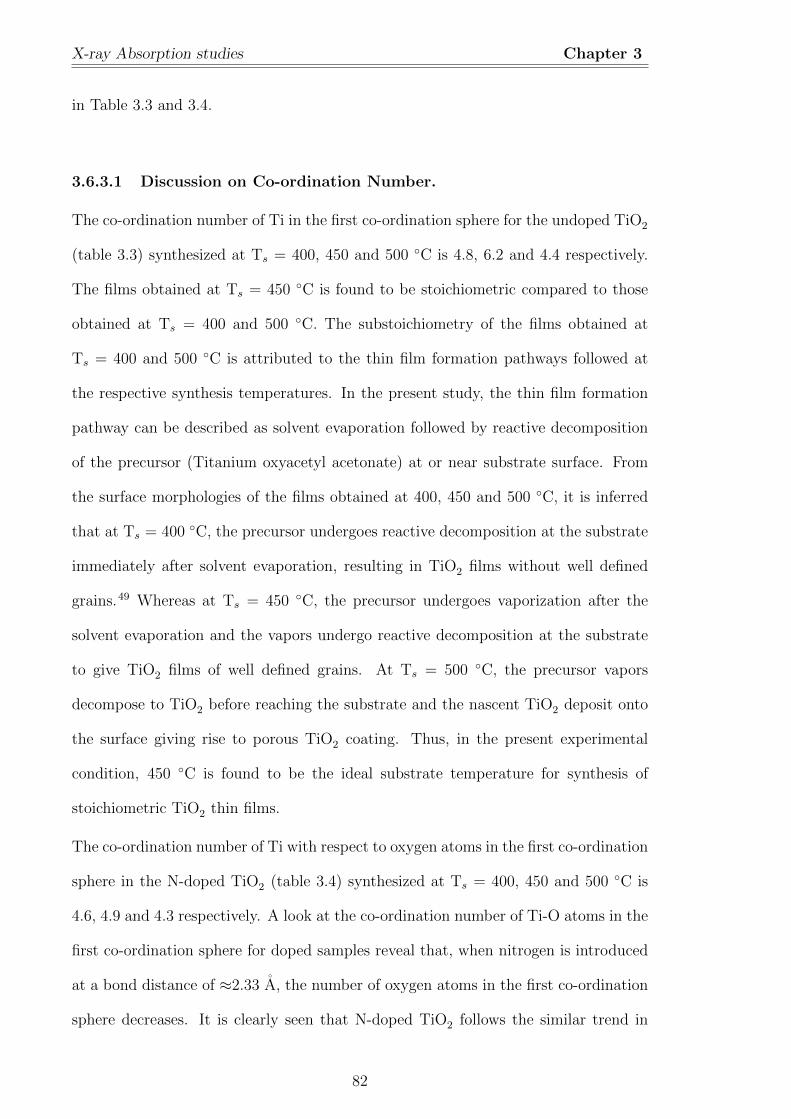
X-ray Absorption studies Chapter 3
in Table 3.3 and 3.4.
3.6.3.1 Discussion on Co-ordination Number.
The co-ordination number of Ti in the first co-ordination sphere for the undoped TiO2
(table 3.3) synthesized at Ts = 400, 450 and 500 ◦C is 4.8, 6.2 and 4.4 respectively.
The films obtained at Ts = 450 ◦C is found to be stoichiometric compared to those
obtained at Ts = 400 and 500 ◦C. The substoichiometry of the films obtained at
Ts = 400 and 500 ◦C is attributed to the thin film formation pathways followed at
the respective synthesis temperatures. In the present study, the thin film formation
pathway can be described as solvent evaporation followed by reactive decomposition
of the precursor (Titanium oxyacetyl acetonate) at or near substrate surface. From
the surface morphologies of the films obtained at 400, 450 and 500 ◦C, it is inferred
that at Ts = 400 ◦C, the precursor undergoes reactive decomposition at the substrate
immediately after solvent evaporation, resulting in TiO2 films without well defined
grains.49 Whereas at Ts = 450 ◦C, the precursor undergoes vaporization after the
solvent evaporation and the vapors undergo reactive decomposition at the substrate
to give TiO2 films of well defined grains. At Ts = 500 ◦C, the precursor vapors
decompose to TiO2 before reaching the substrate and the nascent TiO2 deposit onto
the surface giving rise to porous TiO2 coating. Thus, in the present experimental
condition, 450 ◦C is found to be the ideal substrate temperature for synthesis of
stoichiometric TiO2 thin films.
The co-ordination number of Ti with respect to oxygen atoms in the first co-ordination
sphere in the N-doped TiO2 (table 3.4) synthesized at Ts = 400, 450 and 500 ◦C is
4.6, 4.9 and 4.3 respectively. A look at the co-ordination number of Ti-O atoms in the
first co-ordination sphere for doped samples reveal that, when nitrogen is introduced
at a bond distance of ≈2.33 A, the number of oxygen atoms in the first co-ordination
sphere decreases. It is clearly seen that N-doped TiO2 follows the similar trend in
82
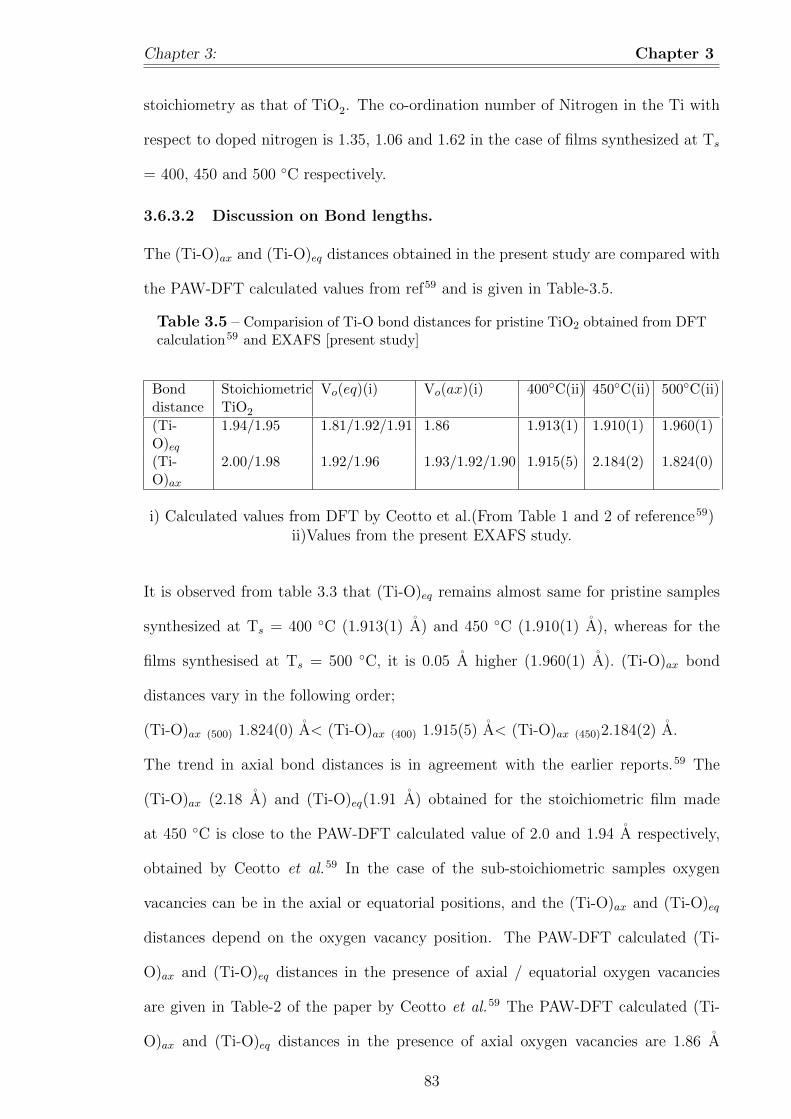
Chapter 3: Chapter 3
stoichiometry as that of TiO2. The co-ordination number of Nitrogen in the Ti with
respect to doped nitrogen is 1.35, 1.06 and 1.62 in the case of films synthesized at Ts
= 400, 450 and 500 ◦C respectively.
3.6.3.2 Discussion on Bond lengths.
The (Ti-O)ax and (Ti-O)eq distances obtained in the present study are compared with
the PAW-DFT calculated values from ref59 and is given in Table-3.5.
Table 3.5 – Comparision of Ti-O bond distances for pristine TiO2 obtained from DFTcalculation59 and EXAFS [present study]
Bond Stoichiometric Vo(eq)(i) Vo(ax)(i) 400◦C(ii) 450◦C(ii) 500◦C(ii)distance TiO2
(Ti-O)eq
1.94/1.95 1.81/1.92/1.91 1.86 1.913(1) 1.910(1) 1.960(1)
(Ti-O)ax
2.00/1.98 1.92/1.96 1.93/1.92/1.90 1.915(5) 2.184(2) 1.824(0)
i) Calculated values from DFT by Ceotto et al.(From Table 1 and 2 of reference59)ii)Values from the present EXAFS study.
It is observed from table 3.3 that (Ti-O)eq remains almost same for pristine samples
synthesized at Ts = 400 ◦C (1.913(1) A) and 450 ◦C (1.910(1) A), whereas for the
films synthesised at Ts = 500 ◦C, it is 0.05 A higher (1.960(1) A). (Ti-O)ax bond
distances vary in the following order;
(Ti-O)ax (500) 1.824(0) A< (Ti-O)ax (400) 1.915(5) A< (Ti-O)ax (450)2.184(2) A.
The trend in axial bond distances is in agreement with the earlier reports.59 The
(Ti-O)ax (2.18 A) and (Ti-O)eq(1.91 A) obtained for the stoichiometric film made
at 450 ◦C is close to the PAW-DFT calculated value of 2.0 and 1.94 A respectively,
obtained by Ceotto et al.59 In the case of the sub-stoichiometric samples oxygen
vacancies can be in the axial or equatorial positions, and the (Ti-O)ax and (Ti-O)eq
distances depend on the oxygen vacancy position. The PAW-DFT calculated (Ti-
O)ax and (Ti-O)eq distances in the presence of axial / equatorial oxygen vacancies
are given in Table-2 of the paper by Ceotto et al.59 The PAW-DFT calculated (Ti-
O)ax and (Ti-O)eq distances in the presence of axial oxygen vacancies are 1.86 A
83
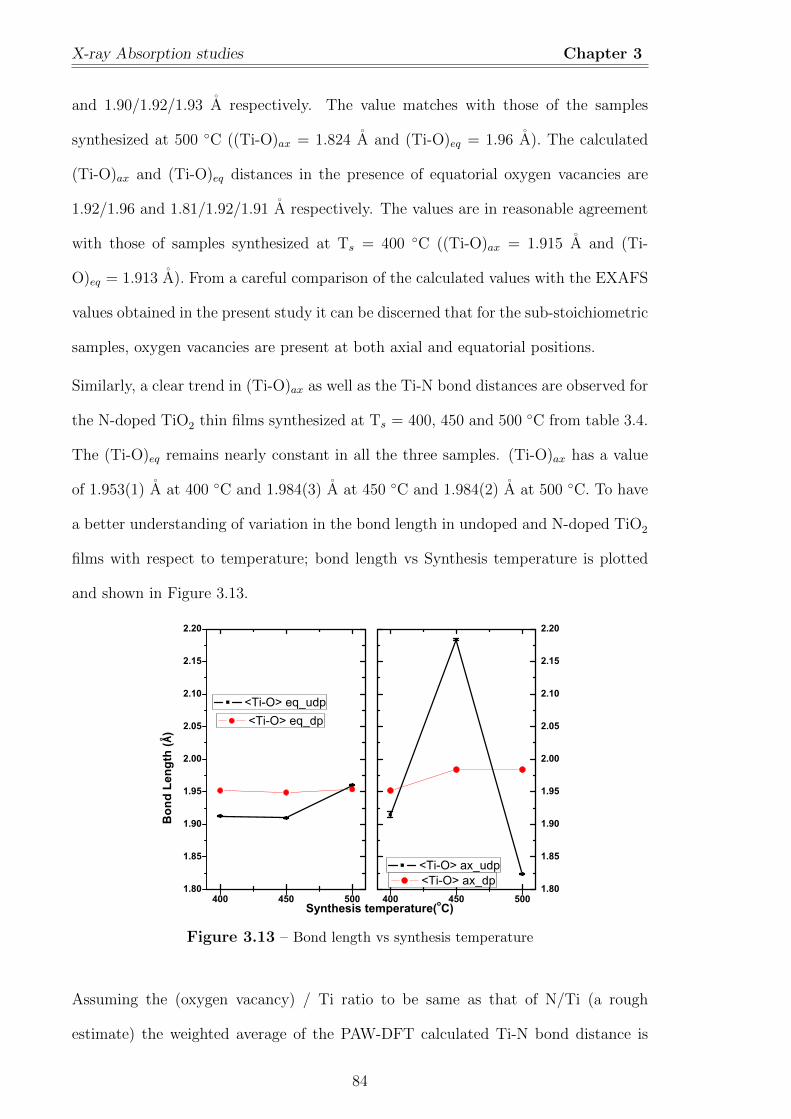
X-ray Absorption studies Chapter 3
and 1.90/1.92/1.93 A respectively. The value matches with those of the samples
synthesized at 500 ◦C ((Ti-O)ax = 1.824 A and (Ti-O)eq = 1.96 A). The calculated
(Ti-O)ax and (Ti-O)eq distances in the presence of equatorial oxygen vacancies are
1.92/1.96 and 1.81/1.92/1.91 A respectively. The values are in reasonable agreement
with those of samples synthesized at Ts = 400 ◦C ((Ti-O)ax = 1.915 A and (Ti-
O)eq = 1.913 A). From a careful comparison of the calculated values with the EXAFS
values obtained in the present study it can be discerned that for the sub-stoichiometric
samples, oxygen vacancies are present at both axial and equatorial positions.
Similarly, a clear trend in (Ti-O)ax as well as the Ti-N bond distances are observed for
the N-doped TiO2 thin films synthesized at Ts = 400, 450 and 500 ◦C from table 3.4.
The (Ti-O)eq remains nearly constant in all the three samples. (Ti-O)ax has a value
of 1.953(1) A at 400 ◦C and 1.984(3) A at 450 ◦C and 1.984(2) A at 500 ◦C. To have
a better understanding of variation in the bond length in undoped and N-doped TiO2
films with respect to temperature; bond length vs Synthesis temperature is plotted
and shown in Figure 3.13.
400 450 5001.80
1.85
1.90
1.95
2.00
2.05
2.10
2.15
2.20
400 450 5001.80
1.85
1.90
1.95
2.00
2.05
2.10
2.15
2.20
Bon
d Le
ngth
(Å)
Synthesis temperature(oC)
<Ti-O> eq_udp
<Ti-O> ax_udp
<Ti-O> eq_dp
<Ti-O> ax_dp
Figure 3.13 – Bond length vs synthesis temperature
Assuming the (oxygen vacancy) / Ti ratio to be same as that of N/Ti (a rough
estimate) the weighted average of the PAW-DFT calculated Ti-N bond distance is
84
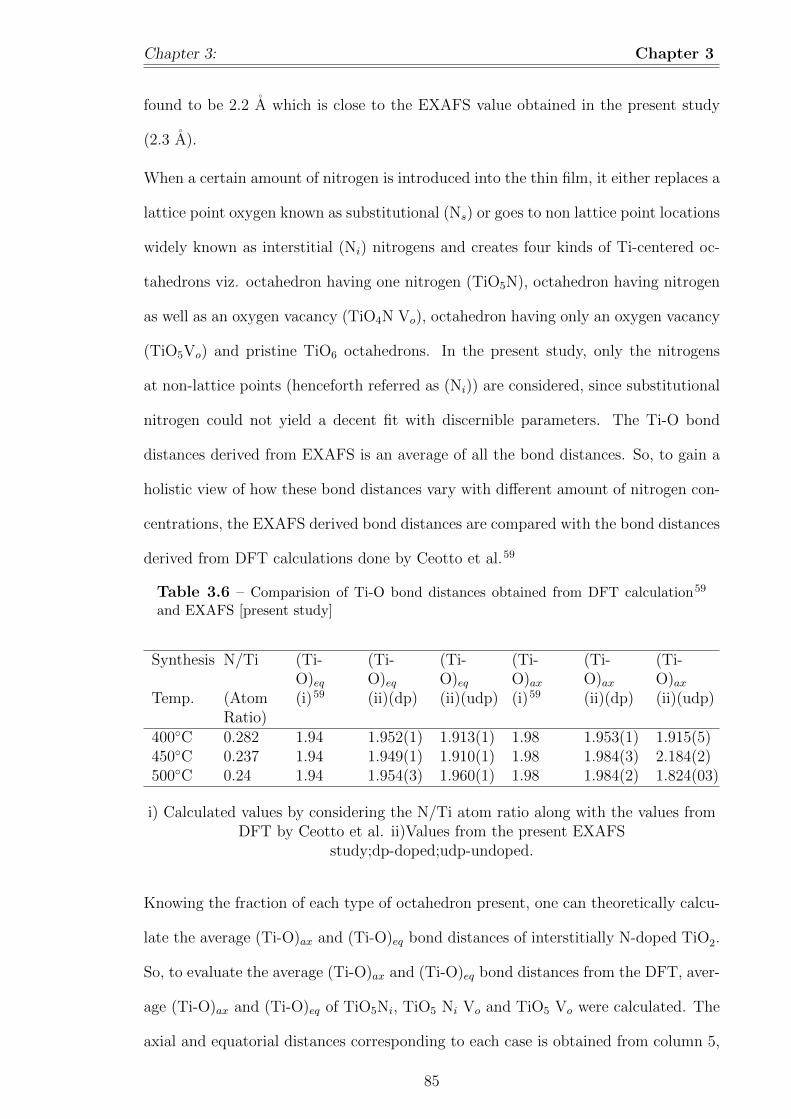
Chapter 3: Chapter 3
found to be 2.2 A which is close to the EXAFS value obtained in the present study
(2.3 A).
When a certain amount of nitrogen is introduced into the thin film, it either replaces a
lattice point oxygen known as substitutional (Ns) or goes to non lattice point locations
widely known as interstitial (Ni) nitrogens and creates four kinds of Ti-centered oc-
tahedrons viz. octahedron having one nitrogen (TiO5N), octahedron having nitrogen
as well as an oxygen vacancy (TiO4N Vo), octahedron having only an oxygen vacancy
(TiO5Vo) and pristine TiO6 octahedrons. In the present study, only the nitrogens
at non-lattice points (henceforth referred as (Ni)) are considered, since substitutional
nitrogen could not yield a decent fit with discernible parameters. The Ti-O bond
distances derived from EXAFS is an average of all the bond distances. So, to gain a
holistic view of how these bond distances vary with different amount of nitrogen con-
centrations, the EXAFS derived bond distances are compared with the bond distances
derived from DFT calculations done by Ceotto et al.59
Table 3.6 – Comparision of Ti-O bond distances obtained from DFT calculation59
and EXAFS [present study]
Synthesis N/Ti (Ti-O)eq
(Ti-O)eq
(Ti-O)eq
(Ti-O)ax
(Ti-O)ax
(Ti-O)ax
Temp. (AtomRatio)
(i)59 (ii)(dp) (ii)(udp) (i)59 (ii)(dp) (ii)(udp)
400◦C 0.282 1.94 1.952(1) 1.913(1) 1.98 1.953(1) 1.915(5)450◦C 0.237 1.94 1.949(1) 1.910(1) 1.98 1.984(3) 2.184(2)500◦C 0.24 1.94 1.954(3) 1.960(1) 1.98 1.984(2) 1.824(03)
i) Calculated values by considering the N/Ti atom ratio along with the values fromDFT by Ceotto et al. ii)Values from the present EXAFS
study;dp-doped;udp-undoped.
Knowing the fraction of each type of octahedron present, one can theoretically calcu-
late the average (Ti-O)ax and (Ti-O)eq bond distances of interstitially N-doped TiO2.
So, to evaluate the average (Ti-O)ax and (Ti-O)eq bond distances from the DFT, aver-
age (Ti-O)ax and (Ti-O)eq of TiO5Ni, TiO5 Ni Vo and TiO5 Vo were calculated. The
axial and equatorial distances corresponding to each case is obtained from column 5,
85
Conclusion Chapter 3
6 of Table 1 and column 6, 7 of table 2 ref [59].59. For a given N/Ti fraction ”x”, there
will be x number of ocathedrons, which are affected by nitrogen(i.e. TiO5Ni, TiO5
Ni Vo and TiO5 Vo ) and 1-x number of pristine octahedrons (TiO6). The average
(Ti-O)ax is then given by the summation of x fraction of (Ti-O)ax(DFT N-doped) and
(1-x) fraction of (Ti-O)ax(DFT Pristine). Similar method is followed for the bond dis-
tance of (Ti-O)eq. The value of (Ti-O)ax( DFT Pristine) or (Ti-O)eq(DFT Pristine)
is obtained from column 2 of table 1 of ref [59].59 The final calculated average Ti-O
distance for interstitially doped N-TiO2 corresponding to different N-concentrations
of the present study is given in Table 3.6 and is compared with the Ti-O distances
obtained from the present EXAFS results. There is very good agreement between the
DFT calculated values and those obtained from EXAFS study for samples synthesized
at 450 and 500◦C. The agreement for samples made at 400 ◦C is reasonable.
In addition, it is observed that there is an overall increase in (Ti-O)eq and (Ti-O)ax
bond distances in doped samples with respect to pristine sample, which can be at-
tributed to the dominant effect of nitrogen occupying the interstitial position. Ceotto
et al. have shown that, when the nitrogen goes to interstitial position the axial bond
lengths elongate as observed in the present study, corroborating the claim that the
nitrogen prefers interstitial position over substitutional.
3.7 Conclusion
Nano-structured pristine and N-doped TiO2 thin films were synthesized using a cost
effective and environmental friendly spray pyrolysis technique at 400, 450, 500 and
550 ◦C. Morphological and crystallographic studies of the films confirmed formation
of well defined crystalline grains of anatase phase. Nitrogen concentration of the
films were calculated from X-ray photoelectron spectra. It was observed that the
maximum nitrogen concentration that we could obtain is 9%. However, this did
not lead to any band gap narrowing as observed from UV-Vis spectroscopy. The
86

Chapter 3: Chapter 3
location of the nitrogen dopant was deduced using two complimentary techniques
such as XPS and XAS. In addition, the exact location of nitrogen in the TiO2 host
lattice in the thin films was found to be at non lattice point from the extended x-
ray absorption fine structure. The average Ti-O axial and Ti-O equatorial distances
in pristine TiO2 and their changes on N-doping, corresponding to different nitrogen
concentrations, were calculated from the EXAFS results. The Ti-O bond distances for
the films synthesized at 450 and 500 ◦C are in good agreement with those evaluated
using the DFT calculated Ti-O bond distances, for various configurations, given in the
literature. The relatively small disparity in case of 400 ◦C needs further investigations
to be made. The effect of reduced dimensionality in case of thin films was elucidated
by analysing the near edge features. The change in transition probability due to
particle size leading to increase in intensity of A2 peak is not pronounced in the thin
films. The effect of film thickness was evident from the rapidly decaying tail and the
sharp absorption step for the thin films synthesized at 500 ◦C.
87
Bibliography
[1] Shaham-Waldmann, N.; Paz, Y. Modified Photocatalysts, Photocatalysis and
Water Purification. Wiley-VCH Verlag GmbH & Co. KGaA, 2013, 103.
[2] Richards, B. S. Comparison of TiO2 and other Dielectric Coatings for Buried-
contact Solar Cells: a Review. Progress in Photovoltaics: Research and Applica-
tions. 2004, 12, 253.
[3] Panjawi, N.; Naik, A.; Warwick, M. E. A.; Hyett, G.; Binions, R. The Preparation
of Titanium Dioxide Gas Sensors by the Electric Field Assisted Aerosol CVD
Reaction of Titanium Isopropoxide in Toluene. Chem. Vap. Deposition. 2012,
18, 102.
[4] Miyauchi,M.;Kieda,N.;Hishita,S.; Mitsuhashi,T.; Nakajimam,A.; Watanabe,T.;
Hashimoto,K. Reversible Wettability Control of TiO2 Surface by Light Irradia-
tion. Surface Science. 2002, 511, 401.
[5] Muranyi, P.; Schraml, C.; Wunderlich, J. Antimicrobial Efficiency of Titanium
Dioxide-Coated Surfaces. J. Appl. Microbiol. 2010, 108, 1966.
[6] Serpone, N. Is The Band Gap of Pristine TiO2 Narrowed by Anion- and Cation-
Doping of Titanium Dioxide in Second-Generation Photocatalysts? J. Phys.
Chem. B. 2006, 110, 24287.
88
BIBLIOGRAPHY Chapter 3
[7] Sathish, M.; Viswanathan, B.; Viswanath, R. P.; Gopinath, C. S. Synthesis,
Characterization, Electronic Structure, and Photocatalytic Activity of Nitrogen-
Doped TiO2 Nanocatalyst. Chem. Mater. 2005, 17, 6349.
[8] Mrowetz, M.; Balcerski, W.; Colussi, A. J.; Hoffmann, M. R. Oxidative Power of
Nitrogen-Doped TiO2 Photocatalysts under Visible Illumination. J. Phys. Chem.
B. 2004, 108, 17269.
[9] Cong, Y.; Zhang, J.; Chen, F.; Anpo, M. Synthesis and Characterization of
Nitrogen-Doped TiO2 Nanophotocatalyst with High Visible Light Activity. J.
Phys. Chem. C. 2007, 111, 6976.
[10] Tian, H.; Hu, L.; Zhang, C.; Liu, W.; Huang, Y.; Mo, L.; Guo, L.; Sheng, J.;
Dai, S. Retarded Charge Recombination in Dye-Sensitized Nitrogen-Doped TiO2
Solar Cells. J. Phys. Chem. C. 2010, 114, 1627.
[11] Raut, N. C.; Mathews, T.; Ajikumar, P. K.; George, R. P.; Dash, S.; Tyagi,
A. K.Sunlight Active Antibacterial Nanostructured N-doped TiO2 Thin Films
Synthesized by an Ultrasonic Spray Pyrolysis Technique. RSC Adv. 2012, 2,
10639.
[12] Sreemany, M.; Sen, S. A Simple Spectrophotometric Method for Determination
of the Optical Constants and Band Gap Energy of Multiple Layer TiO2 Thin
Films. Materials Chemistry and Physics. 2004, 83, 169.
[13] Asahi, R.; Morikawa, 322 T.; Ohwaki, T.; Aoki, K.; Taga, Y. Visible-Light Pho-
tocatalysis in Nitrogen-Doped Titanium Oxides. Science. 2001, 293, 269.
[14] Lee, J.-Y.; Park, J.; Cho, J.-H. Electronic Properties of N- and C-Doped TiO2.
Appl. Phys.Lett. 2005, 87, 011904(1).
89
BIBLIOGRAPHY Chapter 3
[15] Chen, X.; Burda, C. The Electronic Origin of the Visible-Light Absorption Prop-
erties of C-, N- and S-Doped TiO2 Nanomaterials. J. Am. Chem. Soc. 2008, 130,
5018.
[16] Wu, Y.; Lazic, P.; Hautier,G.; Perssonb, K. ; Ceder, G. First Principles High
Throughput Screening of Oxynitrides for Water-Splitting Photocatalysts, Energy
Environ. Sci. 2013, 6, 157.
[17] Saha, N. C.; Tompkins, H. G. Titanium Nitride Oxidation Chemistry: An X-ray
Photoelectron Spectroscopy Study. J. Appl. Phys. 1992, 72, 3072.
[18] Di Valentin, C.; Finazzi, E.; Pacchioni, G.; Selloni, A.; Livraghi, S.; Paganini, M.
C.; Gi-amello, E., N-Doped TiO2: Theory and Experiment. Chem. Phys. 2007,
339, 44.
[19] Cao, J.; Zhang, Y.; Tong, H.; Li, P.; Kako, T.; Ye, J. Selective Local Nitrogen
Doping in a TiO2 Electrode for Enhancing Photoelectrochemical Water Splitting.
Chem. Commun. 2012, 48,8649.
[20] Zhao, Z.; Li, Z.; Zou, Z. Water Adsorption and Decomposition on N/V-Doped
Anatase TiO2 (101) Surfaces. J. Phys. Chem. C. 2013, 117, 6172.
[21] Rumaiz,A. K.; Woicik,J.C.; Cockayne,E.; Lin, H.Y.; Jaffari,G.H.; Shah, S.I. Oxy-
gen Vacancies in N doped Anatase TiO2: Experiment and First-principles Cal-
culations. Appl. Phys. Lett. 2009, 95, 262111.
[22] Korotin, M.A.; Zainullina, V.M. Investigation of the Influence of Nonstoichiome-
try and Doping with Carbon and Nitrogen on the Electronic Spectrum of Rutile
by the Coherent Potential Method. Phys. Solid State. 2013, 55, 952.
[23] Wu, H.C.; Lin, Y.S.; Lin, S.W. Calculations mechanisms of visible light pho-
tocatalysis in N-doped anatase TiO2 with Oxygen Vacancies from GGA + U
Calculations, Int. J. Photoenergy. 2013, 2013, 289328.
90

BIBLIOGRAPHY Chapter 3
[24] Esaka,F.; Fuuya, K.; Shimada,H.; Imamura,M.; Matsubayashi,N.; Sato,H.; Nishi-
jima,A.; Kawana, A.; Ichimura, H.; Kikuchi, T. A Comparison of Surface Oxi-
dation of Titanium Nitride and Chromium Nitride Films Studied by X-ray Ab-
sorption and Photoelectron Spectroscopy. J. Vac. Sci. Technol. 1997, 15, 2521.
[25] Rodriguez,J.A.; Jirsak,T.; Liu,G.; Hrbek,J.; Dvorak,J.; Maiti, A. Chemistry of
NO2 on Oxide Surfaces: Formation of NO3 on TiO2(1 1 0) and NO2↔ O Vacancy
Interactions. J. Am. Chem. Soc. 2001, 123, 9597.
[26] Petala, A.; Tsikritzis,D.; Kollia,M.; Ladas, S.; Kennou, S.; Kondarides, D.I.
Synthesis and Characterization of N-doped TiO2 Photocatalysts with Tunable
Response to Solar Radiation (original). Appl. Surf. Sci. 2014, 305, 281.
[27] Raut, N. C.; Mathews,T.; Ajikumar,P. K.; George, R. P.; Dash, S.; Tyagi,A.
K. Sunlight Active Antibacterial Nanostructured N-doped TiO2 Thin Films Syn-
thesized by an Ultrasonic Spray Pyrolysis Technique. RSC Advances. 2012, 2,
10639.
[28] Tersof, I.; Tromp, R. M. Shape Transition in Growth of Strained Islands: Spon-
taneous Formation of Quantum Wires. Phys. Rev. Lett. 1993, 70, 2782.
[29] Gusev, E. A.; Delidovich,S. V.; Kraaovskeya, L. I.Investigation of Urotropine
Thermal Decomposition Reaction in Self Generated Atmosphere by Means of
Thermal Analysis method. Thermochimica Acta. 1985, 93, 21.
[30] Dreyfors, J. M.; Jones, S. B.; Sayed, Y. Hexamethylenetetramine: A Review. J.
Am. Ind. Hyg. Assoc. 1989, 50(11), 579.
[31] Chambers, S. A.; Cheung, S. H.; Shutthanandan, V.; Thevuthasan, S.; Bowman,
M. K.; Joly, A. G. Properties of Structurally Excellent N-doped TiO2 Rutile.
Chem. Phys. 2007, 339, 27.
91
BIBLIOGRAPHY Chapter 3
[32] Diwald, O.; Thompson, T. L.; Zubkov, T.; Goralski, E. G.; Walck, S. D.; Yates, J.
T. Photochemical Activity of Nitrogen-Doped Rutile TiO2(110) in Visible Light.
J. Phys. Chem. B. 2004, 108, 6004.
[33] Cheung,S. H.; Nachimuthu,P.; Joly, A. G.; Engelhard,M. H.; Bowman, M. K.;
Chambers,S. A. N Incorporation and Electronic Structure in N-doped TiO2(110)
Rutile. Surf. Sci. 2007, 601, 1754.
[34] Cheung, S. H.; Nachimuthu, P.; Engelhard, M. H.; Wang, C. M.; Chambers,S.
A. N incorporation, composition and electronic structure in N-doped TiO2(001)
anatase epitaxial films grown on LaAlO3(001) Surf. Sci., 2008, 602, 133.
[35] Ohsawa,T.; Lyubinetsky,I.; Du, Y.; Henderson, M. A.; Shutthanandan,V.; Cham-
bers, S. A. Crystallographic Dependence of Visible-Light Photoactivity in Epi-
taxial TiO2−xNx Anatase and Rutile. Phys. Rev. B: Condens. Matter. 2009, 79,
085401.
[36] Shinn, N. D.; Tsang, K.-L. Strain-induced surface reactivity: Low Temperature
Cr /W(ll 0) Nitridation. J. Vac. Sci. Technol. A. 1991, 9 (3), 1558.
[37] Chen, H. Y.; Nambu, A.; Wen, W.; Graciani, J.; Zhong,Z.; Hanson, J. C.; Fujita,
E.; Rodriguez, J. A. Reaction of NH3 with Titania: N-Doping of the Oxide and
TiN Formation. J. Phys. Chem. C. 2007, 111, 1366.
[38] Che,M.; Naccache, C. Nature Of Paramagnetic Species Produced by Oxygen
Treatment of Titanium Dioxide. Chem. Phys. Lett. 1971, 8, 45.
[39] Mi,L.; Xu, P.; Wang, P. N. Experimental study on the bandgap narrowings of
TiO2 films calcined under N2 or NH3 atmosphere. Appl. Surf. Sci. 2008, 255,
2574.
92
BIBLIOGRAPHY Chapter 3
[40] Valentin, C. Di; Pacchioni,G.; Selloni,A.; Livraghi, S.; Giamello, E. Characteri-
zation of Paramagnetic Species in N-Doped TiO2 Powders by EPR Spectroscopy
and DFT Calculations. J. Phys. Chem. B. 2005, 109, 11414.
[41] Graciani,J.; Alvarez, L. J.; Rodriguez ,J. A.; Sanz, J. F. N-Doping of Rutile TiO2
(110) Surface. A Theoretical DFT Study. J. Phys. Chem. C. 2008, 112, 2624.
[42] Palgrave, R. G.; Payne, D. J.; Egdell, R. G. Nitrogen Diffusion in Doped TiO2
(110) Single crystals: a Combined XPS and SIMS Study. J. Mater. Chem. 2009,
19, 8418.
[43] Oropeza, F. E.; Harmer, J.; Egdell, R. G.; Palgrave, R. G. A Critical Evaluation
of the Mode of Incorporation of Nitrogen in Doped Anatase Photocatalysts. Phys.
Chem. Chem. Phys. 2010, 12, 960.
[44] Takahashi, I.; Payne, D. J.; Palgrave, R. G.; Egdell, R. G. High Resolution X-
ray Photoemission Study of Nitrogen Doped TiO2 Rutile Single Crystals Chem.
Phys. Lett. 2008, 454, 314.
[45] Wang, J.; Tafen, D. N.; Lewis, J. P.; Hong, Z.; Manivannan, A.; Zhi, M.; Li, M.;
Wu, N. Origin of Photocatalytic Activity of Nitrogen-Doped TiO2 Nanobelts. J.
Am. Chem. Soc. 2009, 131, 12290.
[46] Nakamura, R.; Tanaka, T.; Nakato, Y. Mechanism for Visible Light Responses
in Anodic Photocurrents at N-Doped TiO2 Film Electrodes. J. Phys. Chem. B.
2004, 108, 10617.
[47] Zubavichus, Y. V.; Slovokhotov, Y. L.; Nazeeruddin, M. K.; Zakeeruddin, S. M.;
Grtzel, M.; Shklover, V. Structural Characterization of Solar Cell Prototypes
Based on Nanocrystalline TiO2 Anatase Sensitized with Ru Complexes. X-ray
Diffraction, XPS, and XAFS Spectroscopy Study. Chem. Mater. 2002, 14, 3556.
93
BIBLIOGRAPHY Chapter 3
[48] Grunes, L. A. Study of the K Edges of 3d Transition Metals in Pure and Oxide
Form by X-ray-Absorption Spectroscopy. Phys. Rev. B. 1983, 27, 2111.
[49] Sahoo, M.; Mathews, T.; Antony, R. P.; Krishna, D. N.; Dash, S.; Tyagi, A.
K. Physico-Chemical Processes and Kinetics of Sunlight-Induced Hydrophobic
- Superhydrophilic Switching of Transparent N-Doped TiO2 Thin Films. ACS
Appl. Mater. Interfaces. 2013, 5, 3967.
[50] Pease, D. M. The Thickness Effect in X-ray Absorption Edges of Metals and
Alloys. Appl. Spectrosc. 1976, 30, 405.
[51] Glen, G. L.; Dodd, C. G. Use of Molecular Orbital Theory to Interpret X-Ray
K-Absorption Spectral Data. J. Appl. Phys. 1968, 39, 5372.
[52] Sandstrom, D. R.; Filby, R. H.; Lytle, F. W.; Greegor, R. B. Study of Ti in
Solvent-Refined Coal by X-ray Absorption Spectroscopy. Fuel. 1982, 61, 195.
[53] Chen, L. X.; Rajh, T.; Wang, Z.; Thurnauer, M. C. XAFS Studies of Surface
Structures of TiO2 Nanoparticles and Photocatalytic Reduction of Metal Ions.
J. Phys. Chem. B. 1997, 101, 10688.
[54] Tsutsumi, K.; Aita, O.; Ichikawa, K. X-ray Ti K Spectra and Band Structures
of Oxides of Titanium. Phys. Rev. B. 1977, 15, 4638.
[55] Belli, M.; Scafati, A.; Bianconi, A.; Mobilio, S.; Palladino, L.; Reale, A.; Burat-
tini, E. X-ray Absorption Near Edge Structures (XANES) in Simple and Complex
Mn Compounds. Solid State Commun. 1980, 35, 355.
[56] Bair, R. A.; Goddard, W. A. Ab initio Studies of the X-ray Absorption Edge
in Copper Complexes. I. Atomic Cu2+ and Cu(ii)Cl2. Phys. Rev. B 1980, 22,
2767-2776.
94
BIBLIOGRAPHY Chapter 3
[57] Newville, M.; Ravel, B.; Haskel, D.; Rehr, J.; Stern, E.; Yacoby, Y. Analysis of
Multiple-Scattering {XAFS} Data using Theoretical Standards. Phys. B. 1995,
208-209, 154.
[58] Belver, C.; Bellod, R.; Stewart, S.; Requejo, F.; Fernandez-Garcia, M. Nitrogen-
Containing TiO2 Photocatalysts: Part 2. Photocatalytic Behavior under Sunlight
Excitation. Appl. Catal. B. 2006, 65, 309.
[59] Ceotto, M.; Lo Presti, L.; Cappelletti, G.; Meroni, D.; Spadavecchia, F.; Zecca,
R.; Leoni, M.; Scardi, P.; Bianchi, C. L.; Ardizzone, S., About the Nitrogen Loca-
tion in Nanocrystalline N-Doped TiO2: Combined DFT and EXAFS Approach,
J. Phys. Chem. C. 2012, 116, 1764.
95
Chapter 4
Synthesis and Structural Studies of
Oxygen deficient TiO2(TiO2−x).
4.1 Introduction
It is well known that introduction of an anion in titanium dioxide lattice results in
creation of oxygen vacancy so as to maintain charge neutrality. In particular, in the
case of nitrogen doped TiO2, three oxygen atoms are replaced for every two nitrogen
atoms, thereby creating one oxygen vacancy per formula unit. In addition to the
above, intrinsic oxygen vacancies are known to be present in oxide materials. Since,
creation of oxygen vacancy is concurrent effect, it is pertinent to assess the effect of
oxygen vacancy on the structural and electronic properties of TiO2 comprehensively
when oxygen vacancies are introduced in a controlled manner. In addition, a possible
disadvantage of N-doping is that at high level of N-doping, the charge carrier recombi-
nation rate also increases.1 hence, it is advantageous to make TiO2 visible light active
by creating oxygen vacancies without external doping. In the light of this, researchers
in the last decade have focused mainly on the effect of oxygen vacancies on electronic,
optical, adsorption and photocatalytic properties of TiO2, with little attention to the
effect on local structure of TiO2. This chapter focuses on the synthesis of oxygen
96
Chapter 4: Synthesis and Structural Studies of Oxygen deficient TiO2(TiO2−x).Chapter 4
deficient TiO2 thin films and the effect of oxygen vacancy on the local structure by
using X-ray absorption spectroscopy (XAS). Among other techniques for detection of
oxygen vacancies, Raman Spectroscopy,2 X-ray Photo electron Spectroscopy(XPS),3,4
Electron Spin Resonance Spectroscopy,5 and Transmission Electron Microscopy have
been widely used. Inherent methodology used for data acquisition and sample han-
dling using these tools, limit their use in pin pointing the location and local structure
around oxygen vacancies. Moreover, the scope of these techniques also act as an
impediment to probe beyond the presence of oxygen vacancies. In addition to the
techniques spelt above, several indirect methods, such as temperature programmed
desorption have also been employed to detect oxygen vacancies. For example, in ref.6,
CO2 has been used as a probe molecule to study the extent of oxidation/reduction of
surface from adsorption/desorption behaviour of CO2.6 Although several direct and
indirect techniques address the issue of oxygen vacancy, the associated changes intro-
duced in local structure with the creation of oxygen vacancies is best addressed by
XAS. The added advantage of XAS is that the samples can be used in all the physical
forms, viz., powder, thin films and liquids. The measurements in the present study
were carried out in ambient condition.
Synthesis of Oxygen Deficient Anatase TiO2 :
In general, oxygen deficient TiO2 is synthesized by utilizing one of the following meth-
ods as described in literature viz. thermal treatment, annealing under high vacuum
and high temperature conditions, high energy particle bombardment, thermal treat-
ment under oxygen depleted condition, doping with metal or nonmetal ions and oxy-
gen vacancy generation under reaction condition.7 All methods mentioned above have
their own pros and cons.
It is shown by Pan et al. that in the case of high energy particle bombardment with
electrons, oxygen vacancies are generated at the surface. However, it is a reversible
process, where oxygen deficient surfaces restructure to the pristine sample at a very
97
Introduction Chapter 4
low temperature. Alternatively, when argon ions are bombarded on the surfaces,
it effectively generates permanent and irreversible oxygen vacancies. However, this
method is known to create bombardment related surface damages. Methods such as
doping with metal/nonmetal ions or reactive conditions for creation of oxygen vacancy
inserts unintended dopants and chemical contaminants in the lattice.
Hence, a simple method of vacuum annealing/annealing under hydrogen atmosphere
was chosen in the present study for creating oxygen vacancies.6,8
An important fact that needs to be borne in mind while choosing the method of
synthesizing oxygen deficient TiO2 is its phase purity. This is an essential prerequisite
for a credible XAS analysis, owing to the restrictions on number of free variables
(Nyquist theorem limits the number of free variables) during the fitting of extended X-
ray absorption spectra.9,10 However, it has been shown conclusively in Chapter 3 that
the custom made spray pyrolysis unit used in the present study indeed yields phase
pure anatase films. Therefore, phase pure anatase TiO2 films that were synthesized by
spray pyrolysis technique are annealed in vacuum/H2 environment to create oxygen
deficient TiO2 films. Owing to difficulties in annealing under hydrogen environments
(extensive safety precautions are needed to handle H2), most of the oxygen deficient
TiO2 are synthesized by annealing in vacuum. However, for the sake of completeness,
XAS studies of few samples synthesized in H2 environment are also included in this
chapter.
It has been found in Chapter 3 that TiO2 thin films synthesized by the custom made
spray pyrolysis unit at Ts = 450 and 500 ◦C are crystalline, phase pure and nearly
stoichiometric. Hence, in this work TiO2 films synthesized at Ts = 450 and 500 ◦C
are considered and synthesized for delineating the role of synthesis temperature on
the creation of oxygen vacancies. The above synthesized films were then annealed in
vacuum (at T = Ts of the respective film)/ under hydrogen flow in a CVD chamber.
98
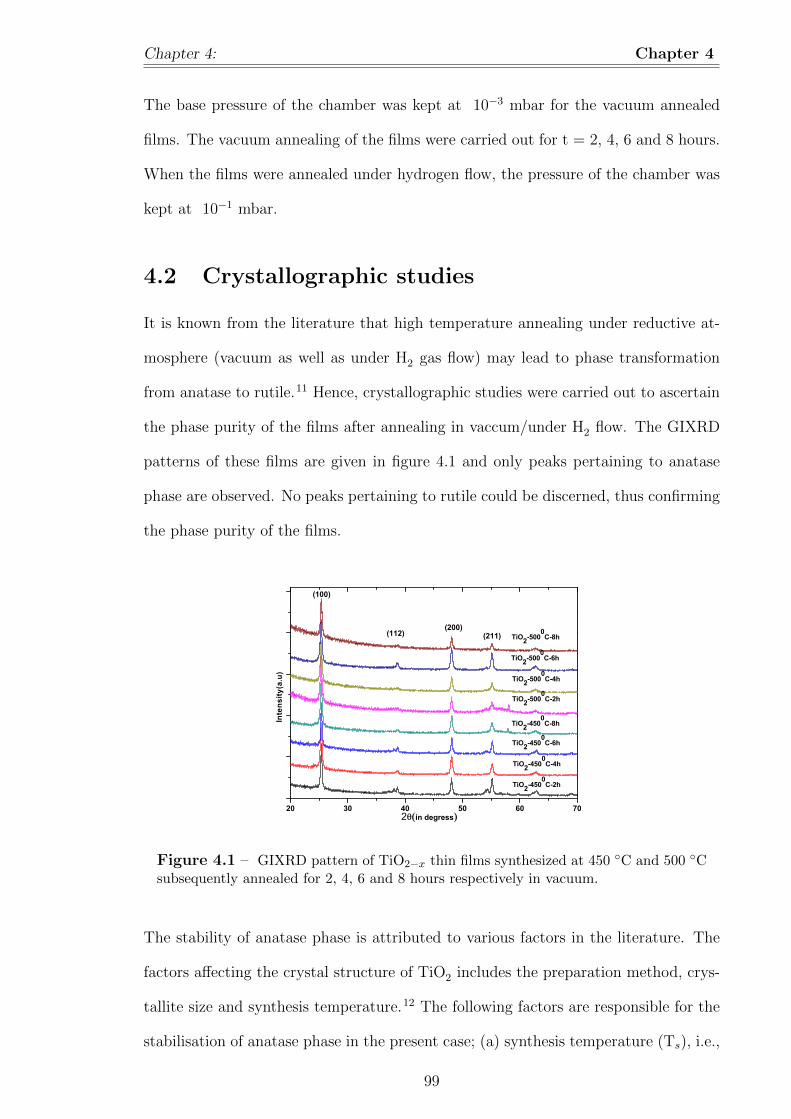
Chapter 4: Chapter 4
The base pressure of the chamber was kept at 10−3 mbar for the vacuum annealed
films. The vacuum annealing of the films were carried out for t = 2, 4, 6 and 8 hours.
When the films were annealed under hydrogen flow, the pressure of the chamber was
kept at 10−1 mbar.
4.2 Crystallographic studies
It is known from the literature that high temperature annealing under reductive at-
mosphere (vacuum as well as under H2 gas flow) may lead to phase transformation
from anatase to rutile.11 Hence, crystallographic studies were carried out to ascertain
the phase purity of the films after annealing in vaccum/under H2 flow. The GIXRD
patterns of these films are given in figure 4.1 and only peaks pertaining to anatase
phase are observed. No peaks pertaining to rutile could be discerned, thus confirming
the phase purity of the films.
20 30 40 50 60 70
TiO2-4500C-2h
(211)(200)
(112)
(100)
2 in degress
TiO2-5000C-8h
TiO2-5000C-6h
TiO2-5000C-4h
TiO2-4500C-8h
TiO2-4500C-6h
TiO2-5000C-2h
TiO2-4500C-4h
Inte
nsity
(a.u
)
Figure 4.1 – GIXRD pattern of TiO2−x thin films synthesized at 450 ◦C and 500 ◦Csubsequently annealed for 2, 4, 6 and 8 hours respectively in vacuum.
The stability of anatase phase is attributed to various factors in the literature. The
factors affecting the crystal structure of TiO2 includes the preparation method, crys-
tallite size and synthesis temperature.12 The following factors are responsible for the
stabilisation of anatase phase in the present case; (a) synthesis temperature (Ts), i.e.,
99
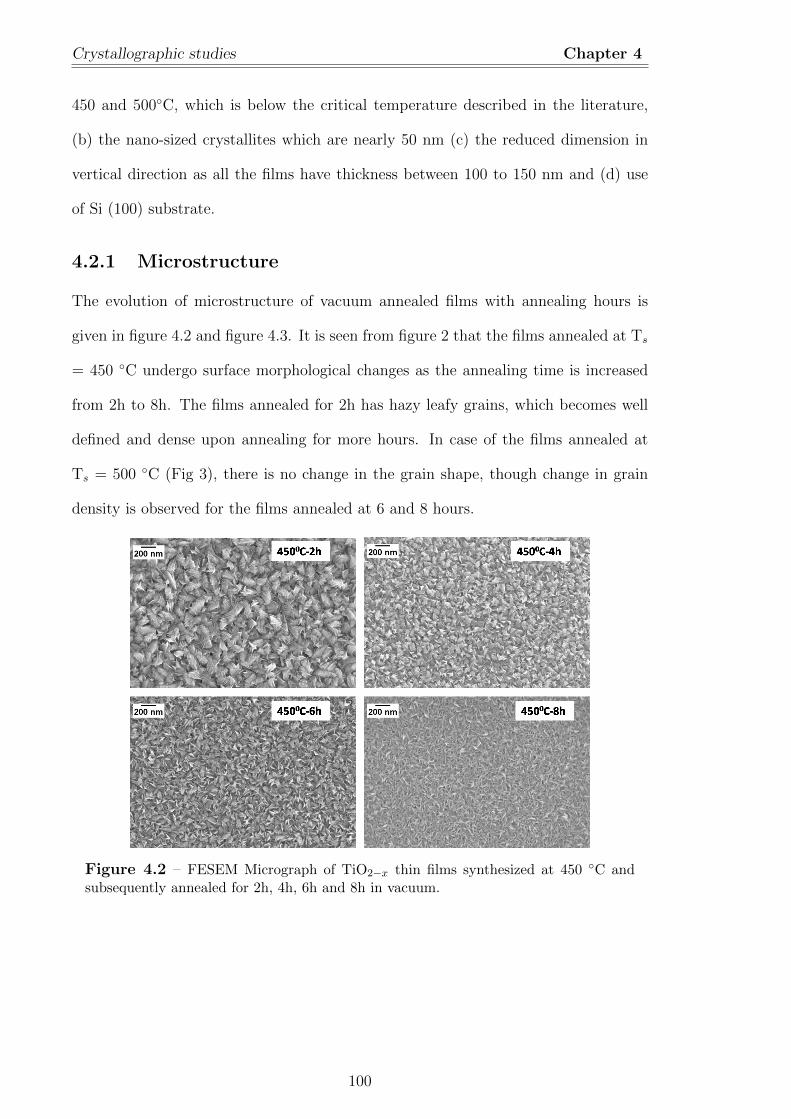
Crystallographic studies Chapter 4
450 and 500◦C, which is below the critical temperature described in the literature,
(b) the nano-sized crystallites which are nearly 50 nm (c) the reduced dimension in
vertical direction as all the films have thickness between 100 to 150 nm and (d) use
of Si (100) substrate.
4.2.1 Microstructure
The evolution of microstructure of vacuum annealed films with annealing hours is
given in figure 4.2 and figure 4.3. It is seen from figure 2 that the films annealed at Ts
= 450 ◦C undergo surface morphological changes as the annealing time is increased
from 2h to 8h. The films annealed for 2h has hazy leafy grains, which becomes well
defined and dense upon annealing for more hours. In case of the films annealed at
Ts = 500 ◦C (Fig 3), there is no change in the grain shape, though change in grain
density is observed for the films annealed at 6 and 8 hours.
Figure 4.2 – FESEM Micrograph of TiO2−x thin films synthesized at 450 ◦C andsubsequently annealed for 2h, 4h, 6h and 8h in vacuum.
100
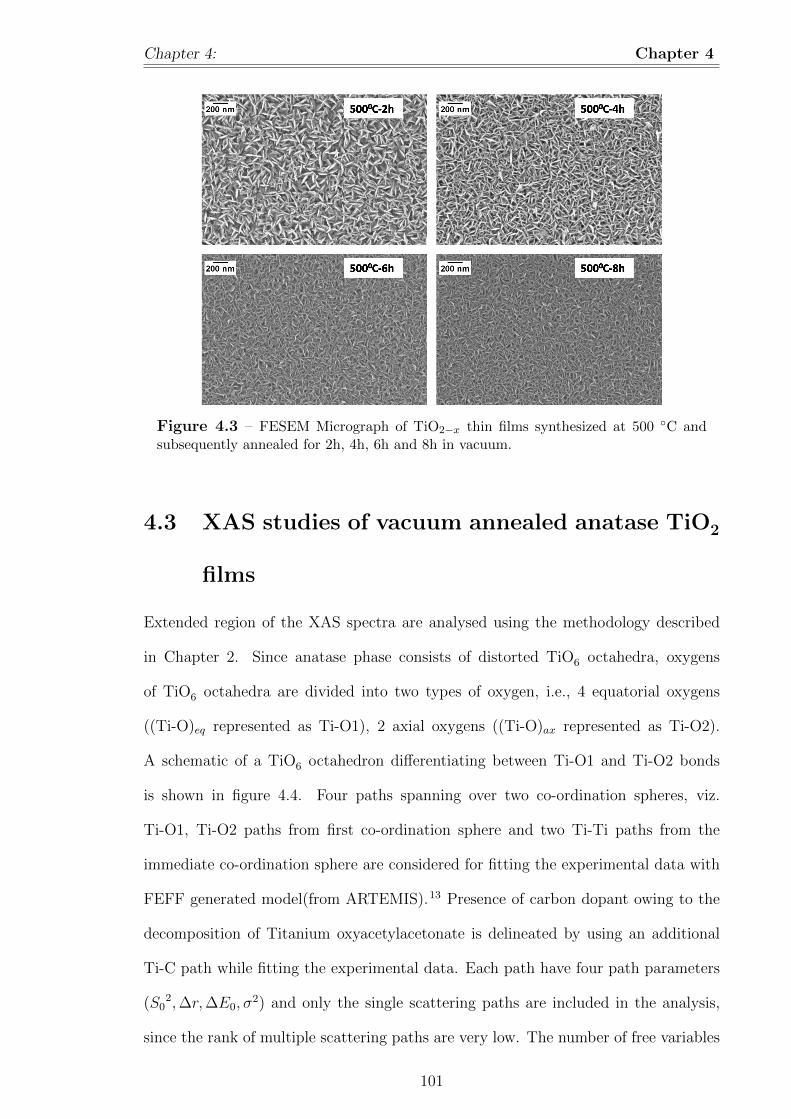
Chapter 4: Chapter 4
Figure 4.3 – FESEM Micrograph of TiO2−x thin films synthesized at 500 ◦C andsubsequently annealed for 2h, 4h, 6h and 8h in vacuum.
4.3 XAS studies of vacuum annealed anatase TiO2
films
Extended region of the XAS spectra are analysed using the methodology described
in Chapter 2. Since anatase phase consists of distorted TiO6 octahedra, oxygens
of TiO6 octahedra are divided into two types of oxygen, i.e., 4 equatorial oxygens
((Ti-O)eq represented as Ti-O1), 2 axial oxygens ((Ti-O)ax represented as Ti-O2).
A schematic of a TiO6 octahedron differentiating between Ti-O1 and Ti-O2 bonds
is shown in figure 4.4. Four paths spanning over two co-ordination spheres, viz.
Ti-O1, Ti-O2 paths from first co-ordination sphere and two Ti-Ti paths from the
immediate co-ordination sphere are considered for fitting the experimental data with
FEFF generated model(from ARTEMIS).13 Presence of carbon dopant owing to the
decomposition of Titanium oxyacetylacetonate is delineated by using an additional
Ti-C path while fitting the experimental data. Each path have four path parameters
(S02,∆r,∆E0, σ
2) and only the single scattering paths are included in the analysis,
since the rank of multiple scattering paths are very low. The number of free variables
101
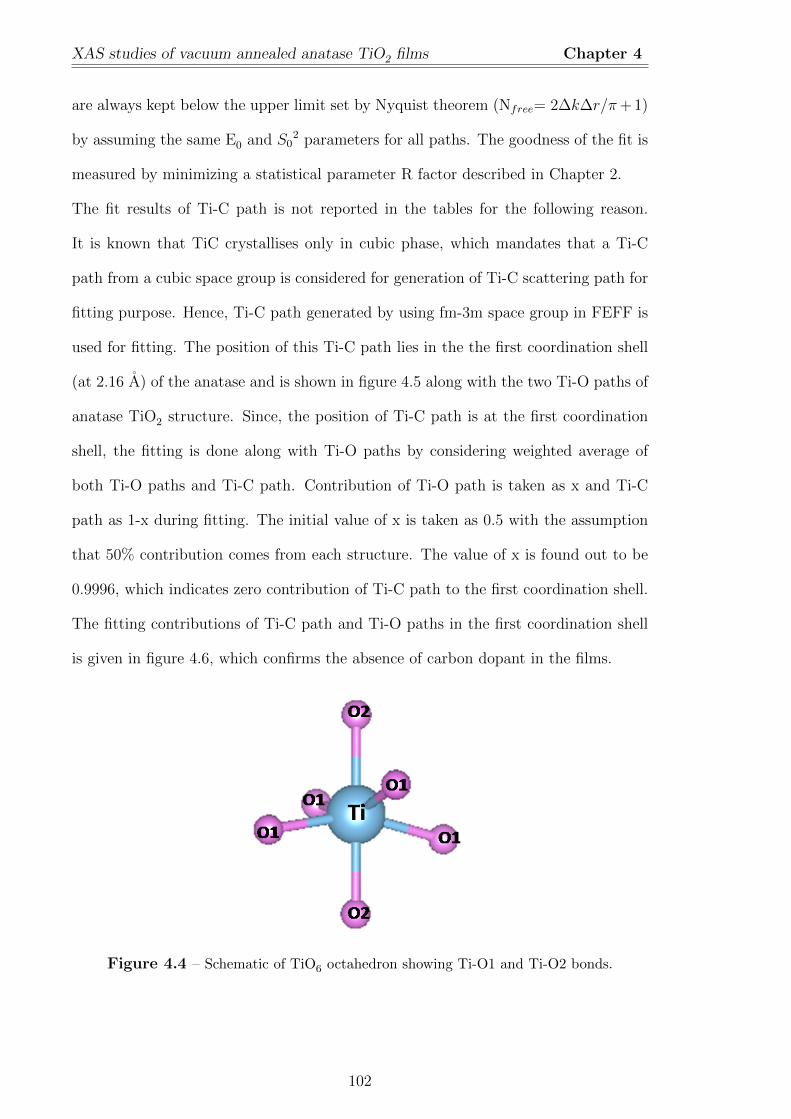
XAS studies of vacuum annealed anatase TiO2 films Chapter 4
are always kept below the upper limit set by Nyquist theorem (Nfree= 2∆k∆r/π+ 1)
by assuming the same E0 and S02 parameters for all paths. The goodness of the fit is
measured by minimizing a statistical parameter R factor described in Chapter 2.
The fit results of Ti-C path is not reported in the tables for the following reason.
It is known that TiC crystallises only in cubic phase, which mandates that a Ti-C
path from a cubic space group is considered for generation of Ti-C scattering path for
fitting purpose. Hence, Ti-C path generated by using fm-3m space group in FEFF is
used for fitting. The position of this Ti-C path lies in the the first coordination shell
(at 2.16 A) of the anatase and is shown in figure 4.5 along with the two Ti-O paths of
anatase TiO2 structure. Since, the position of Ti-C path is at the first coordination
shell, the fitting is done along with Ti-O paths by considering weighted average of
both Ti-O paths and Ti-C path. Contribution of Ti-O path is taken as x and Ti-C
path as 1-x during fitting. The initial value of x is taken as 0.5 with the assumption
that 50% contribution comes from each structure. The value of x is found out to be
0.9996, which indicates zero contribution of Ti-C path to the first coordination shell.
The fitting contributions of Ti-C path and Ti-O paths in the first coordination shell
is given in figure 4.6, which confirms the absence of carbon dopant in the films.
Figure 4.4 – Schematic of TiO6 octahedron showing Ti-O1 and Ti-O2 bonds.
102
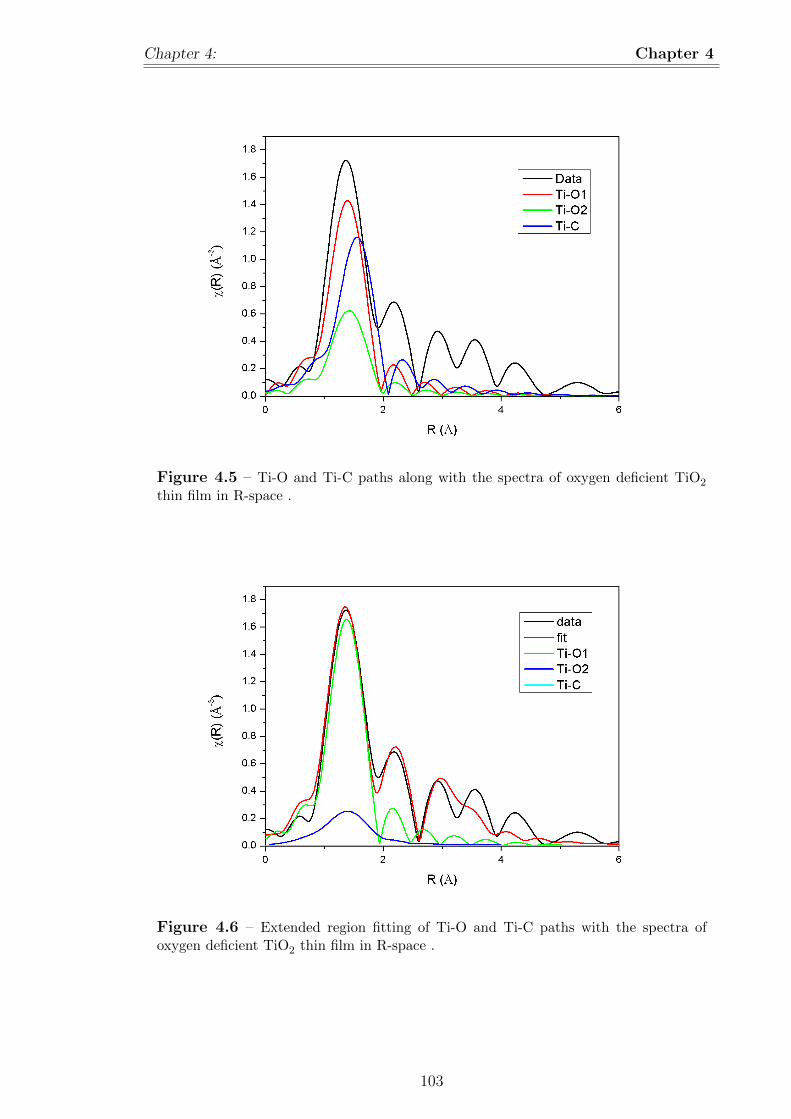
Chapter 4: Chapter 4
Figure 4.5 – Ti-O and Ti-C paths along with the spectra of oxygen deficient TiO2
thin film in R-space .
Figure 4.6 – Extended region fitting of Ti-O and Ti-C paths with the spectra ofoxygen deficient TiO2 thin film in R-space .
103
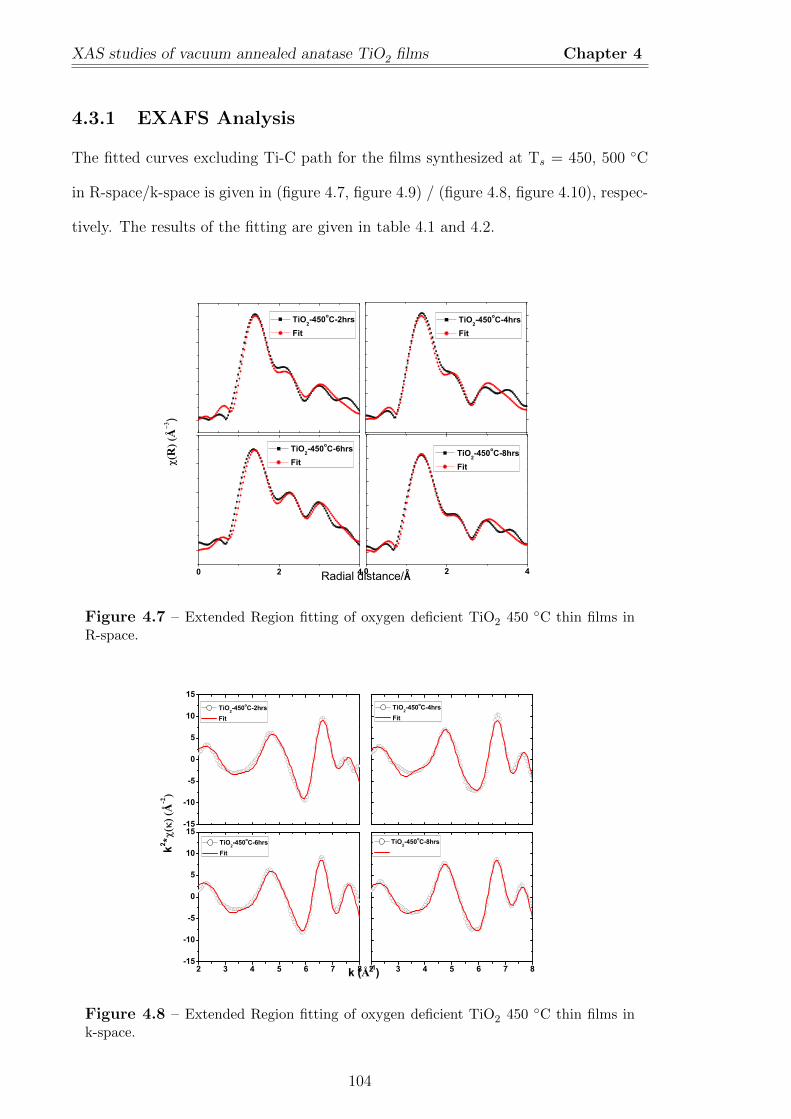
XAS studies of vacuum annealed anatase TiO2 films Chapter 4
4.3.1 EXAFS Analysis
The fitted curves excluding Ti-C path for the films synthesized at Ts = 450, 500 ◦C
in R-space/k-space is given in (figure 4.7, figure 4.9) / (figure 4.8, figure 4.10), respec-
tively. The results of the fitting are given in table 4.1 and 4.2.
0 2 4 0 2 4
TiO2-450oC-2hrs
Fit
TiO2-450oC-4hrs
Fit
TiO2-450oC-6hrs
Fit
RÅ
)
Radial distance/Å
TiO2-450oC-8hrs
Fit
Figure 4.7 – Extended Region fitting of oxygen deficient TiO2 450 ◦C thin films inR-space.
-15
-10
-5
0
5
10
15
2 3 4 5 6 7 8-15
-10
-5
0
5
10
15
2 3 4 5 6 7 8
TiO2-450oC-2hrs Fit
k2 *Å
-2
k (Å-1)
TiO2-450oC-4hrs Fit
TiO2-450oC-6hrs Fit
TiO2-450oC-8hrs
Figure 4.8 – Extended Region fitting of oxygen deficient TiO2 450 ◦C thin films ink-space.
104
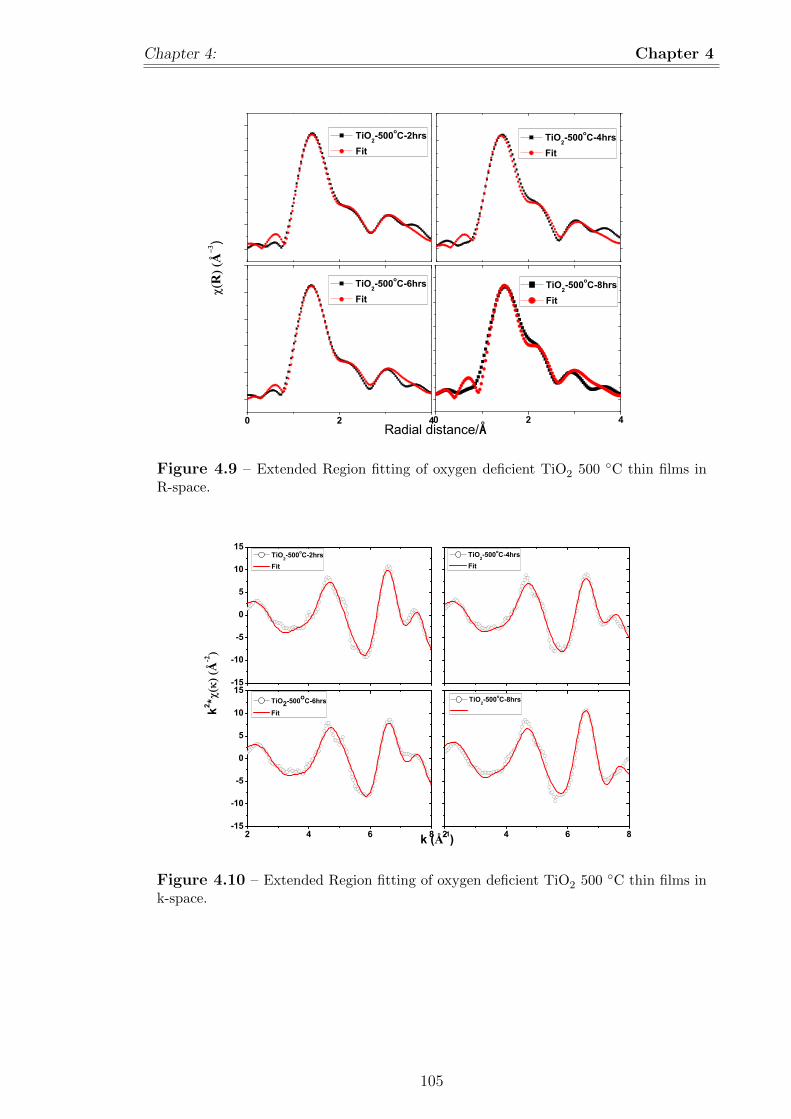
Chapter 4: Chapter 4
0 2 40 2 4
TiO2-500oC-2hrs
Fit
TiO2-500oC-4hrs
Fit
RÅ
)
Radial distance/Å
TiO2-500oC-6hrs
Fit
TiO2-500oC-8hrs
Fit
Figure 4.9 – Extended Region fitting of oxygen deficient TiO2 500 ◦C thin films inR-space.
-15
-10
-5
0
5
10
15
2 4 6 8-15
-10
-5
0
5
10
15
2 4 6 8
TiO2-500oC-2hrs Fit
TiO2-500oC-4hrs Fit
TiO2-500oC-6hrs
Fitk2 *Å
-2
k (Å-1)
TiO2-500oC-8hrs
Figure 4.10 – Extended Region fitting of oxygen deficient TiO2 500 ◦C thin films ink-space.
105
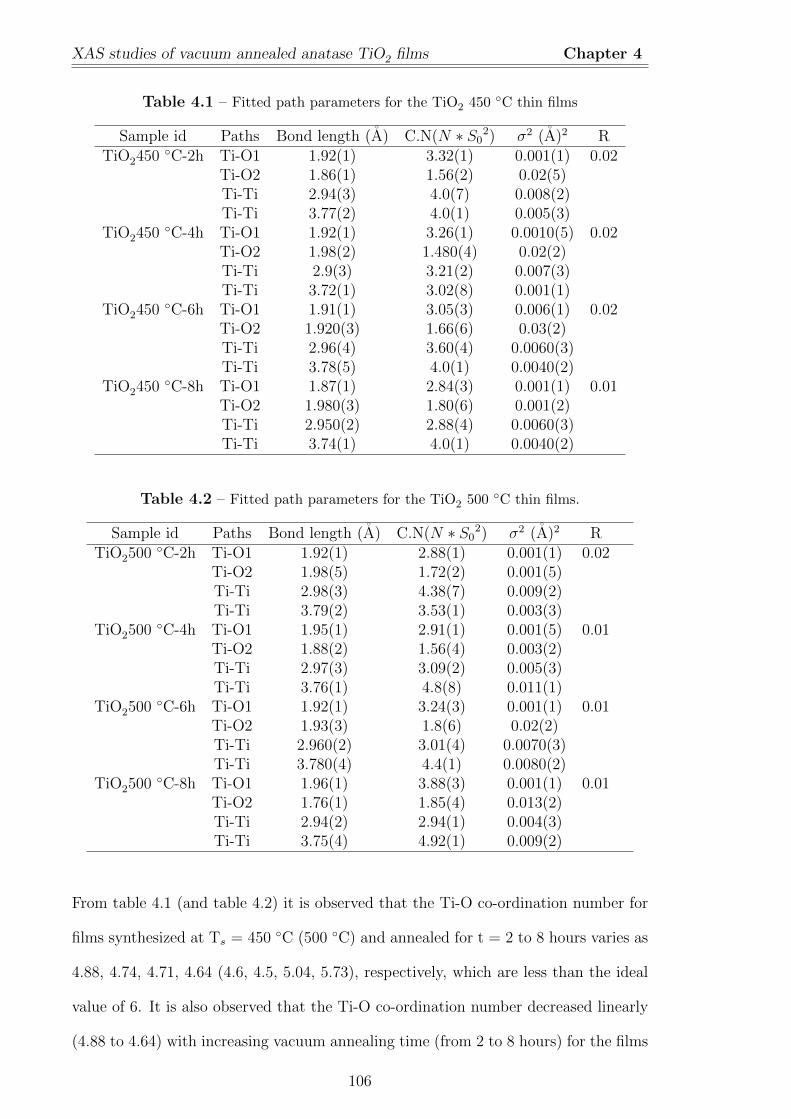
XAS studies of vacuum annealed anatase TiO2 films Chapter 4
Table 4.1 – Fitted path parameters for the TiO2 450 ◦C thin films
Sample id Paths Bond length (A) C.N(N ∗ S02) σ2 (A)2 R
TiO2450 ◦C-2h Ti-O1 1.92(1) 3.32(1) 0.001(1) 0.02Ti-O2 1.86(1) 1.56(2) 0.02(5)Ti-Ti 2.94(3) 4.0(7) 0.008(2)Ti-Ti 3.77(2) 4.0(1) 0.005(3)
TiO2450 ◦C-4h Ti-O1 1.92(1) 3.26(1) 0.0010(5) 0.02Ti-O2 1.98(2) 1.480(4) 0.02(2)Ti-Ti 2.9(3) 3.21(2) 0.007(3)Ti-Ti 3.72(1) 3.02(8) 0.001(1)
TiO2450 ◦C-6h Ti-O1 1.91(1) 3.05(3) 0.006(1) 0.02Ti-O2 1.920(3) 1.66(6) 0.03(2)Ti-Ti 2.96(4) 3.60(4) 0.0060(3)Ti-Ti 3.78(5) 4.0(1) 0.0040(2)
TiO2450 ◦C-8h Ti-O1 1.87(1) 2.84(3) 0.001(1) 0.01Ti-O2 1.980(3) 1.80(6) 0.001(2)Ti-Ti 2.950(2) 2.88(4) 0.0060(3)Ti-Ti 3.74(1) 4.0(1) 0.0040(2)
Table 4.2 – Fitted path parameters for the TiO2 500 ◦C thin films.
Sample id Paths Bond length (A) C.N(N ∗ S02) σ2 (A)2 R
TiO2500 ◦C-2h Ti-O1 1.92(1) 2.88(1) 0.001(1) 0.02Ti-O2 1.98(5) 1.72(2) 0.001(5)Ti-Ti 2.98(3) 4.38(7) 0.009(2)Ti-Ti 3.79(2) 3.53(1) 0.003(3)
TiO2500 ◦C-4h Ti-O1 1.95(1) 2.91(1) 0.001(5) 0.01Ti-O2 1.88(2) 1.56(4) 0.003(2)Ti-Ti 2.97(3) 3.09(2) 0.005(3)Ti-Ti 3.76(1) 4.8(8) 0.011(1)
TiO2500 ◦C-6h Ti-O1 1.92(1) 3.24(3) 0.001(1) 0.01Ti-O2 1.93(3) 1.8(6) 0.02(2)Ti-Ti 2.960(2) 3.01(4) 0.0070(3)Ti-Ti 3.780(4) 4.4(1) 0.0080(2)
TiO2500 ◦C-8h Ti-O1 1.96(1) 3.88(3) 0.001(1) 0.01Ti-O2 1.76(1) 1.85(4) 0.013(2)Ti-Ti 2.94(2) 2.94(1) 0.004(3)Ti-Ti 3.75(4) 4.92(1) 0.009(2)
From table 4.1 (and table 4.2) it is observed that the Ti-O co-ordination number for
films synthesized at Ts = 450 ◦C (500 ◦C) and annealed for t = 2 to 8 hours varies as
4.88, 4.74, 4.71, 4.64 (4.6, 4.5, 5.04, 5.73), respectively, which are less than the ideal
value of 6. It is also observed that the Ti-O co-ordination number decreased linearly
(4.88 to 4.64) with increasing vacuum annealing time (from 2 to 8 hours) for the films
106
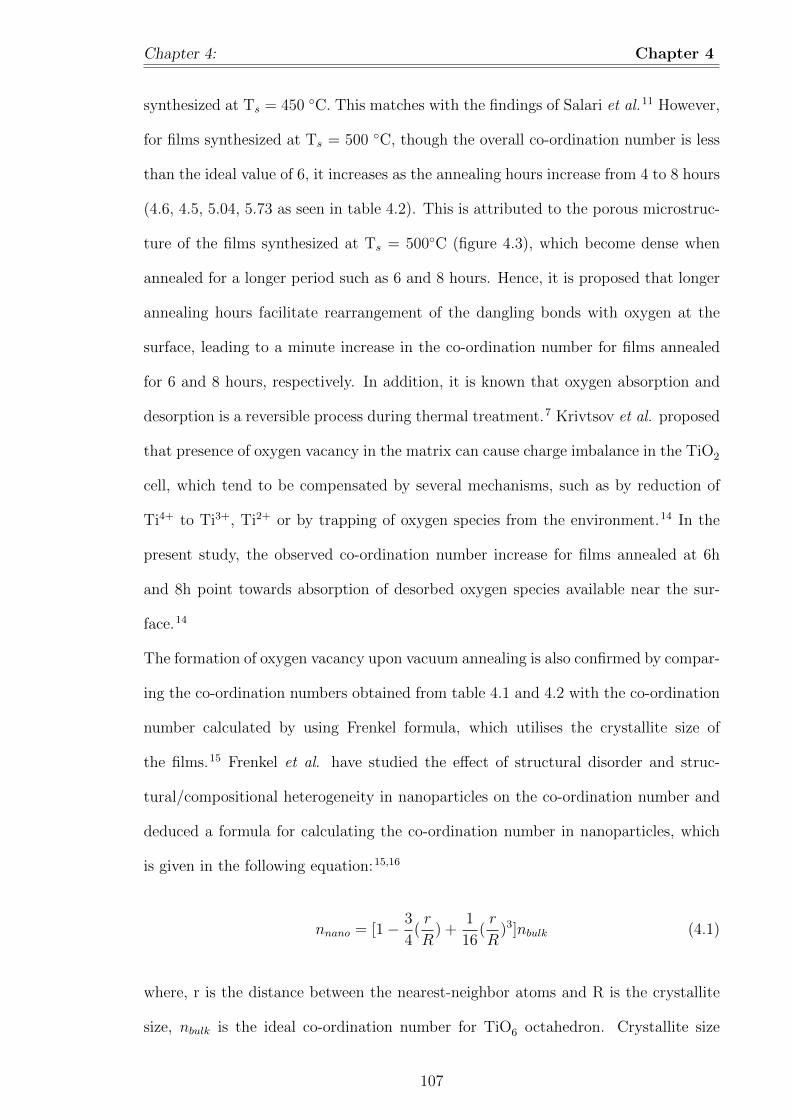
Chapter 4: Chapter 4
synthesized at Ts = 450 ◦C. This matches with the findings of Salari et al.11 However,
for films synthesized at Ts = 500 ◦C, though the overall co-ordination number is less
than the ideal value of 6, it increases as the annealing hours increase from 4 to 8 hours
(4.6, 4.5, 5.04, 5.73 as seen in table 4.2). This is attributed to the porous microstruc-
ture of the films synthesized at Ts = 500◦C (figure 4.3), which become dense when
annealed for a longer period such as 6 and 8 hours. Hence, it is proposed that longer
annealing hours facilitate rearrangement of the dangling bonds with oxygen at the
surface, leading to a minute increase in the co-ordination number for films annealed
for 6 and 8 hours, respectively. In addition, it is known that oxygen absorption and
desorption is a reversible process during thermal treatment.7 Krivtsov et al. proposed
that presence of oxygen vacancy in the matrix can cause charge imbalance in the TiO2
cell, which tend to be compensated by several mechanisms, such as by reduction of
Ti4+ to Ti3+, Ti2+ or by trapping of oxygen species from the environment.14 In the
present study, the observed co-ordination number increase for films annealed at 6h
and 8h point towards absorption of desorbed oxygen species available near the sur-
face.14
The formation of oxygen vacancy upon vacuum annealing is also confirmed by compar-
ing the co-ordination numbers obtained from table 4.1 and 4.2 with the co-ordination
number calculated by using Frenkel formula, which utilises the crystallite size of
the films.15 Frenkel et al. have studied the effect of structural disorder and struc-
tural/compositional heterogeneity in nanoparticles on the co-ordination number and
deduced a formula for calculating the co-ordination number in nanoparticles, which
is given in the following equation:15,16
nnano = [1− 3
4(r
R) +
1
16(r
R)3]nbulk (4.1)
where, r is the distance between the nearest-neighbor atoms and R is the crystallite
size, nbulk is the ideal co-ordination number for TiO6 octahedron. Crystallite size
107
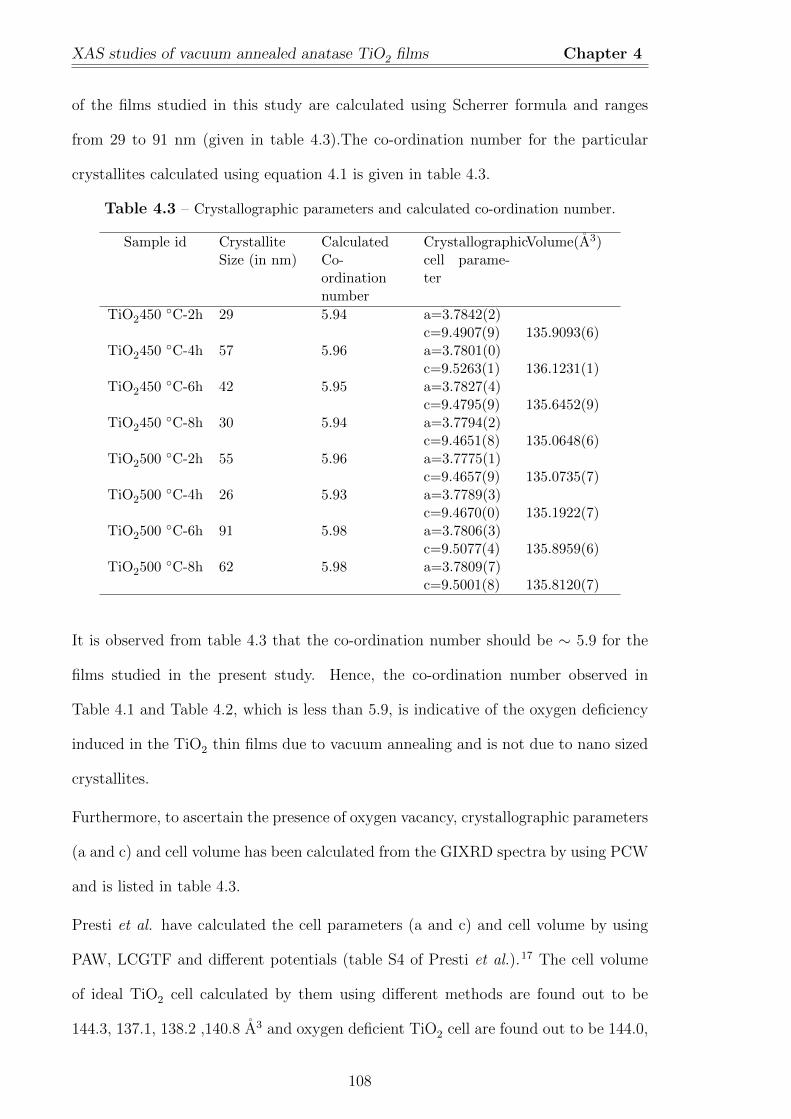
XAS studies of vacuum annealed anatase TiO2 films Chapter 4
of the films studied in this study are calculated using Scherrer formula and ranges
from 29 to 91 nm (given in table 4.3).The co-ordination number for the particular
crystallites calculated using equation 4.1 is given in table 4.3.
Table 4.3 – Crystallographic parameters and calculated co-ordination number.
Sample id CrystalliteSize (in nm)
CalculatedCo-ordinationnumber
Crystallographiccell parame-ter
Volume(A3)
TiO2450 ◦C-2h 29 5.94 a=3.7842(2)c=9.4907(9) 135.9093(6)
TiO2450 ◦C-4h 57 5.96 a=3.7801(0)c=9.5263(1) 136.1231(1)
TiO2450 ◦C-6h 42 5.95 a=3.7827(4)c=9.4795(9) 135.6452(9)
TiO2450 ◦C-8h 30 5.94 a=3.7794(2)c=9.4651(8) 135.0648(6)
TiO2500 ◦C-2h 55 5.96 a=3.7775(1)c=9.4657(9) 135.0735(7)
TiO2500 ◦C-4h 26 5.93 a=3.7789(3)c=9.4670(0) 135.1922(7)
TiO2500 ◦C-6h 91 5.98 a=3.7806(3)c=9.5077(4) 135.8959(6)
TiO2500 ◦C-8h 62 5.98 a=3.7809(7)c=9.5001(8) 135.8120(7)
It is observed from table 4.3 that the co-ordination number should be ∼ 5.9 for the
films studied in the present study. Hence, the co-ordination number observed in
Table 4.1 and Table 4.2, which is less than 5.9, is indicative of the oxygen deficiency
induced in the TiO2 thin films due to vacuum annealing and is not due to nano sized
crystallites.
Furthermore, to ascertain the presence of oxygen vacancy, crystallographic parameters
(a and c) and cell volume has been calculated from the GIXRD spectra by using PCW
and is listed in table 4.3.
Presti et al. have calculated the cell parameters (a and c) and cell volume by using
PAW, LCGTF and different potentials (table S4 of Presti et al.).17 The cell volume
of ideal TiO2 cell calculated by them using different methods are found out to be
144.3, 137.1, 138.2 ,140.8 A3 and oxygen deficient TiO2 cell are found out to be 144.0,
108
Chapter 4: Chapter 4
136.0, 138.1, 140.0 A3. The calculated cell volumes i.e. ∼ 136.0 A3 for the films in
the present study matches with the cell volume of oxygen deficient TiO2 calculated
by Presti et al. This corroborates the finding from EXAFS analysis regarding the
formation of oxygen vacancies.
Moreover, Ceotto et al. have calculated the Ti-O bond distances for oxygen defected
octahedron. They considered axial, equatorial oxygen vacancy and calculated the
bond distances for other Ti-O bonds using PAW-DFT. The PAW-DFT calculated
bond distances of oxygen defected octahedron (from the table 2 of Ceotto et al.9) varies
like VO/1.86/1.93/1.92/1.90/1.90 A and 1.92/1.96/VO/1.81/1.92/1.91 A for axial and
equatorial oxygen vacancy respectively. The PAW-DFT calculated Ti-O1 and Ti-O2
bonds have average values of 1.86A , 1.91A and 1.94A , 1.88A for octahedra with
axial and equatorial vacancy, respectively.9 Since, XAS gives the average value of
several defected octahedra, the bond lengths(Ti-O1 and Ti-O2) represented in Table
4.1 and 4.2 matches with the PAW-DFT calculated values.9
4.4 Analysis of X-ray Absorption Near Edge Spec-
tra (XANES)
In this section the near edge features which is 20 eV below the Ti K-edge is discussed.
Near edge features contain information regarding the electronic transitions in a system.
In the present work TiO2−x thin films have been synthesized, wherein oxygen vacancies
have been deliberately introduced into the matrix to study it’s effect on the local co-
ordination and electronic properties. Introduction of oxygen vacancy into the matrix
of TiO2 lead to many changes like change of Ti4+ oxidation state to Ti3+ 18 and
distortion in the local TiO6 co-ordination. Distortion in TiO6 octahedron could be
due to elongation or shortening of Ti-O bond lengths. Change in Ti-O bond length
leads to change in Ti 3d and O 2p density of states(DOS). This alters the titanium-
oxygen orbital overlap, thus affecting the total DOS and its corresponding electronic
109
Analysis of X-ray Absorption Near Edge Spectra (XANES) Chapter 4
transitions are reflected in the pre-edge features. The effect of oxygen vacancy on the
co-ordination number is already explained in the previous section by analysing the
extended X-ray absorption fine structure, in this section the effect of oxygen vacancy
on the near edge-spectral features is discussed.
Theoretical background of XANES and it’s application to the
distorted octahedra of anatase (TiO2−x Films)
The number of pre-edge peaks and its broad features i.e. occurence of A1, A2, A3
peaks and B peaks are similar in both rutile and anatase phase of TiO2 as shown by
Grunes et al. and Sandstrom et al.19,20 Since, symmetry of TiO6 octahedron is reduced
from Oh due to distortion in both rutile and anatase, it can be safely presumed that
the effect of the distortion on the pre-edge features will also follow the same trend
and can be compared with each other.21 Hence, in this section the pre-edge features
pertaining to anatase TiO2 is compared with the literature of rutile phase.24,25 In
addition, FEFF calculation for pristine anatase and oxygen deficient anatase phase is
also discussed.
It is known that x-ray absorption near edge structures(XANES) are signature of the
co-ordination around central metal atom. The pre-edge features are traditionally
described by using Molecular orbital theory or solid state band theory. According
to Molecular orbital theory(MOT), XANES arises due to electronic transitions in
the molecular orbitals.19 MOT is inherently symmetry dependent. In case of TiO2
anatase, the pre-edge peaks are due to weak quadrupole 1s → 3d transitions. Though
this interpretation is still used widely, sophisticated solid state band theory indicates
that these transitions arises due to O 2p - Ti 3d mixing rather than the dipole forbid-
den 1s-3d transitions. Since, p-d mixing is dependent on the orientation of orbitals,
symmetry around the central metal atom plays a crucial role while explaining the pre-
edge peaks. It has been amply proven in the literature that p-orbitals offer necessary
symmetry and energetic adequacy to undergo p-d mixing when the symmetry of the
110
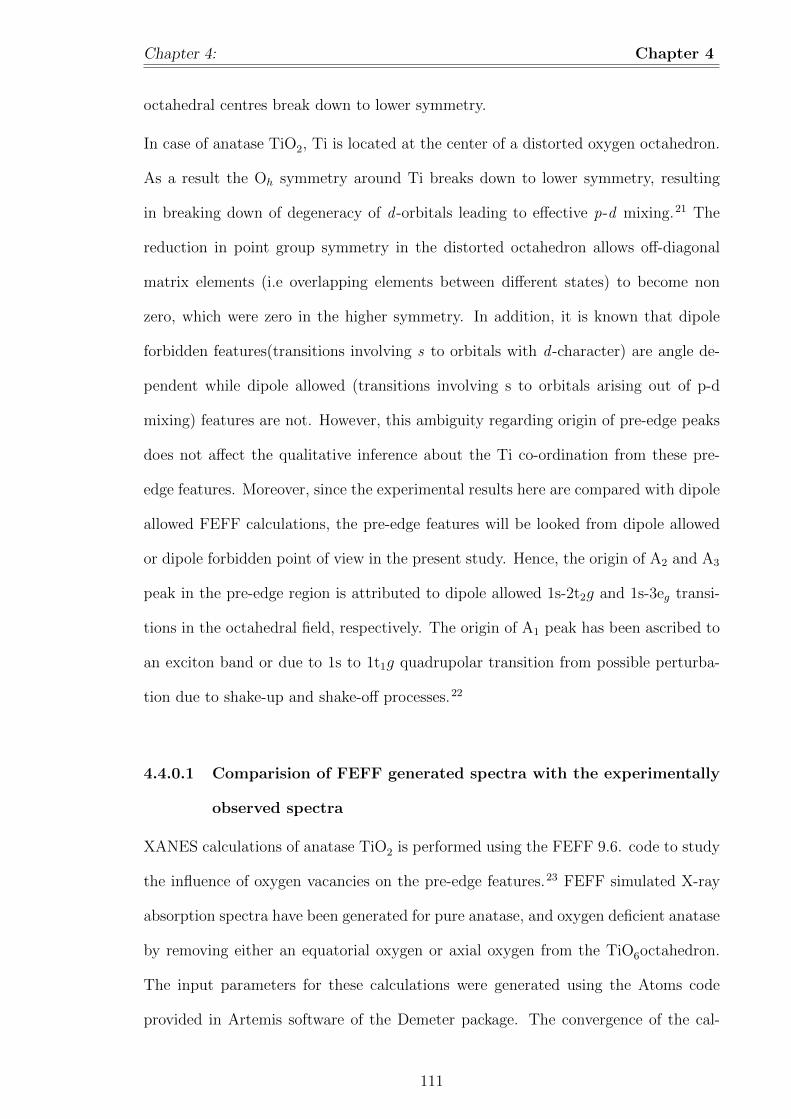
Chapter 4: Chapter 4
octahedral centres break down to lower symmetry.
In case of anatase TiO2, Ti is located at the center of a distorted oxygen octahedron.
As a result the Oh symmetry around Ti breaks down to lower symmetry, resulting
in breaking down of degeneracy of d -orbitals leading to effective p-d mixing.21 The
reduction in point group symmetry in the distorted octahedron allows off-diagonal
matrix elements (i.e overlapping elements between different states) to become non
zero, which were zero in the higher symmetry. In addition, it is known that dipole
forbidden features(transitions involving s to orbitals with d -character) are angle de-
pendent while dipole allowed (transitions involving s to orbitals arising out of p-d
mixing) features are not. However, this ambiguity regarding origin of pre-edge peaks
does not affect the qualitative inference about the Ti co-ordination from these pre-
edge features. Moreover, since the experimental results here are compared with dipole
allowed FEFF calculations, the pre-edge features will be looked from dipole allowed
or dipole forbidden point of view in the present study. Hence, the origin of A2 and A3
peak in the pre-edge region is attributed to dipole allowed 1s-2t2g and 1s-3eg transi-
tions in the octahedral field, respectively. The origin of A1 peak has been ascribed to
an exciton band or due to 1s to 1t1g quadrupolar transition from possible perturba-
tion due to shake-up and shake-off processes.22
4.4.0.1 Comparision of FEFF generated spectra with the experimentally
observed spectra
XANES calculations of anatase TiO2 is performed using the FEFF 9.6. code to study
the influence of oxygen vacancies on the pre-edge features.23 FEFF simulated X-ray
absorption spectra have been generated for pure anatase, and oxygen deficient anatase
by removing either an equatorial oxygen or axial oxygen from the TiO6octahedron.
The input parameters for these calculations were generated using the Atoms code
provided in Artemis software of the Demeter package. The convergence of the cal-
111
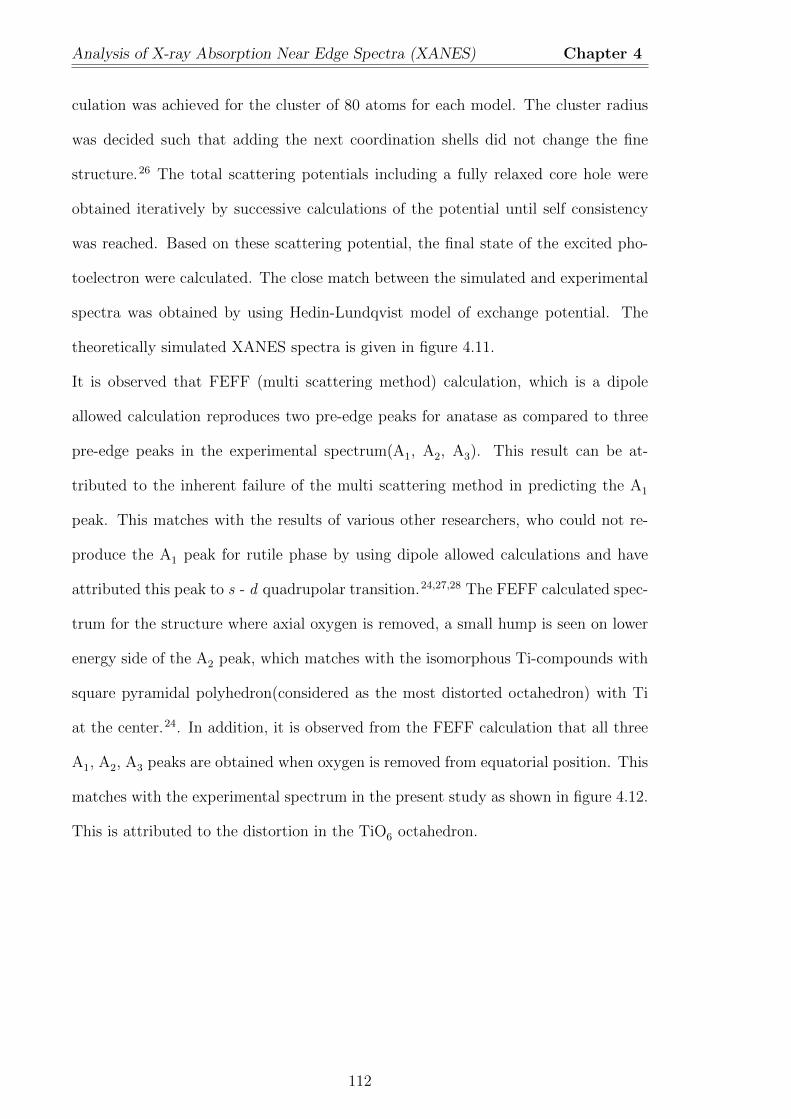
Analysis of X-ray Absorption Near Edge Spectra (XANES) Chapter 4
culation was achieved for the cluster of 80 atoms for each model. The cluster radius
was decided such that adding the next coordination shells did not change the fine
structure.26 The total scattering potentials including a fully relaxed core hole were
obtained iteratively by successive calculations of the potential until self consistency
was reached. Based on these scattering potential, the final state of the excited pho-
toelectron were calculated. The close match between the simulated and experimental
spectra was obtained by using Hedin-Lundqvist model of exchange potential. The
theoretically simulated XANES spectra is given in figure 4.11.
It is observed that FEFF (multi scattering method) calculation, which is a dipole
allowed calculation reproduces two pre-edge peaks for anatase as compared to three
pre-edge peaks in the experimental spectrum(A1, A2, A3). This result can be at-
tributed to the inherent failure of the multi scattering method in predicting the A1
peak. This matches with the results of various other researchers, who could not re-
produce the A1 peak for rutile phase by using dipole allowed calculations and have
attributed this peak to s - d quadrupolar transition.24,27,28 The FEFF calculated spec-
trum for the structure where axial oxygen is removed, a small hump is seen on lower
energy side of the A2 peak, which matches with the isomorphous Ti-compounds with
square pyramidal polyhedron(considered as the most distorted octahedron) with Ti
at the center.24. In addition, it is observed from the FEFF calculation that all three
A1, A2, A3 peaks are obtained when oxygen is removed from equatorial position. This
matches with the experimental spectrum in the present study as shown in figure 4.12.
This is attributed to the distortion in the TiO6 octahedron.
112

Chapter 4: Chapter 4
4980 5000 5020 50400.0
0.2
0.4
0.6
0.8
1.0
1.2
1.4
1.6
1.8
2.0
A3
A2
Energy(eV)
Equatorial vacancy Axial vacancy Anatase
A1Hump
4965 4970 4975 49800.0
0.2
0.4
0.6 Equatorial Vacancy Axial Vacancy
Figure 4.11 – FEFF calculated spectra of Anatase and oxygen deficient anatase withequatorial and axial vacancy.
0.0
0.2
0.4
0.6
0.8
1.0
1.2
1.4
0.0
0.2
0.4
0.6
0.8
1.0
1.2
1.4
4965 4970 4975 4980 4985 4990 49950.0
0.2
0.4
0.6
0.8
1.0
1.2
1.4
4965 4970 4975 4980 4985 4990 49950.0
0.2
0.4
0.6
0.8
1.0
1.2
1.4
A3A2
450C-2h 500C-2h
(a)White Line
A1B
B
(b)
450C-4h 500C-4hA1
A2 A3
B
(c)
Energy(eV)
450C-6h 500C-6h
A1A2 A3
B
(d)
450C-8h 500C-8h
A1A2 A3
4965 4970 4975 49800.0
0.1
0.2
A1
A2 A3
4965 4970 4975 49800.0
0.1
0.2
A2 A3
A1
4965 4970 4975 49800.0
0.1
0.2
A1
A2 A3
4965 4970 4975 49800.0
0.1
0.2
A1
Figure 4.12 – Near edge Feature of oxygen deficient TiO2 450 ◦C and TiO2 500 ◦Cthin films.
N.Jiang et al. have carried out theoretical analysis of Ti XANES for delineating the
dependence of pre-edge peaks on various geometrical parameters; viz. co-ordination,
symmetry, Ti-O bond length and bond angle.24 They considered both density func-
113
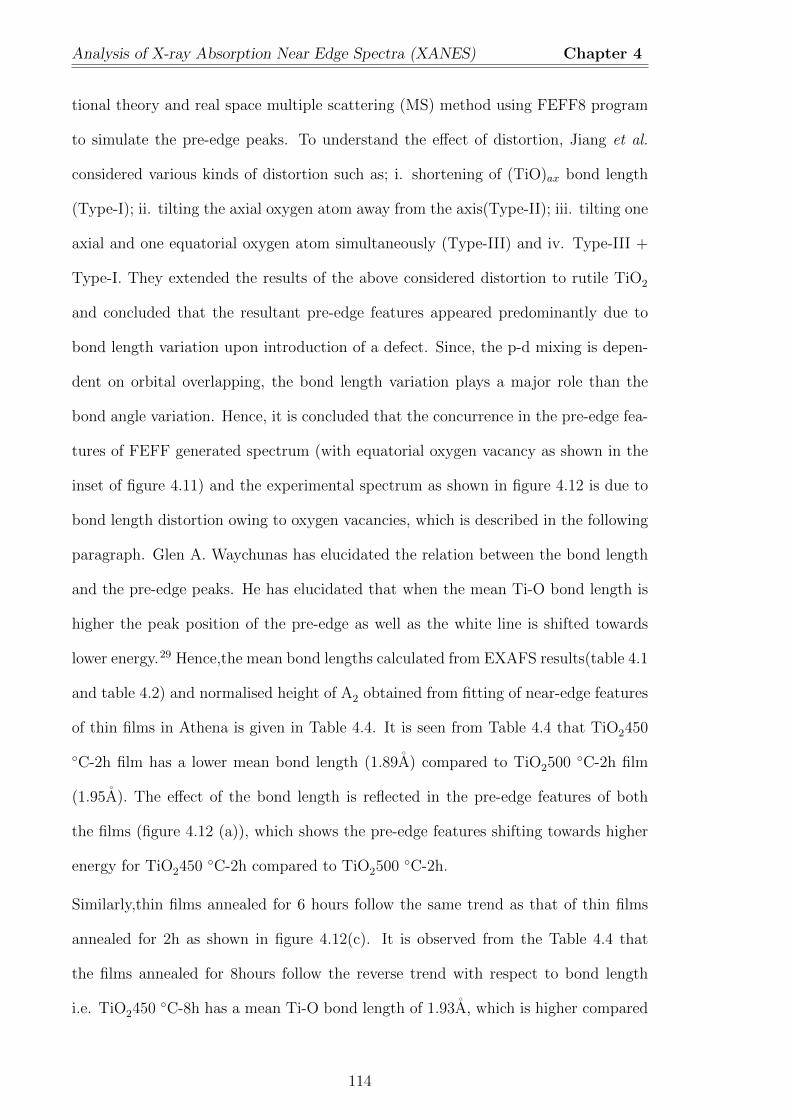
Analysis of X-ray Absorption Near Edge Spectra (XANES) Chapter 4
tional theory and real space multiple scattering (MS) method using FEFF8 program
to simulate the pre-edge peaks. To understand the effect of distortion, Jiang et al.
considered various kinds of distortion such as; i. shortening of (TiO)ax bond length
(Type-I); ii. tilting the axial oxygen atom away from the axis(Type-II); iii. tilting one
axial and one equatorial oxygen atom simultaneously (Type-III) and iv. Type-III +
Type-I. They extended the results of the above considered distortion to rutile TiO2
and concluded that the resultant pre-edge features appeared predominantly due to
bond length variation upon introduction of a defect. Since, the p-d mixing is depen-
dent on orbital overlapping, the bond length variation plays a major role than the
bond angle variation. Hence, it is concluded that the concurrence in the pre-edge fea-
tures of FEFF generated spectrum (with equatorial oxygen vacancy as shown in the
inset of figure 4.11) and the experimental spectrum as shown in figure 4.12 is due to
bond length distortion owing to oxygen vacancies, which is described in the following
paragraph. Glen A. Waychunas has elucidated the relation between the bond length
and the pre-edge peaks. He has elucidated that when the mean Ti-O bond length is
higher the peak position of the pre-edge as well as the white line is shifted towards
lower energy.29 Hence,the mean bond lengths calculated from EXAFS results(table 4.1
and table 4.2) and normalised height of A2 obtained from fitting of near-edge features
of thin films in Athena is given in Table 4.4. It is seen from Table 4.4 that TiO2450
◦C-2h film has a lower mean bond length (1.89A) compared to TiO2500 ◦C-2h film
(1.95A). The effect of the bond length is reflected in the pre-edge features of both
the films (figure 4.12 (a)), which shows the pre-edge features shifting towards higher
energy for TiO2450 ◦C-2h compared to TiO2500 ◦C-2h.
Similarly,thin films annealed for 6 hours follow the same trend as that of thin films
annealed for 2h as shown in figure 4.12(c). It is observed from the Table 4.4 that
the films annealed for 8hours follow the reverse trend with respect to bond length
i.e. TiO2450 ◦C-8h has a mean Ti-O bond length of 1.93A, which is higher compared
114
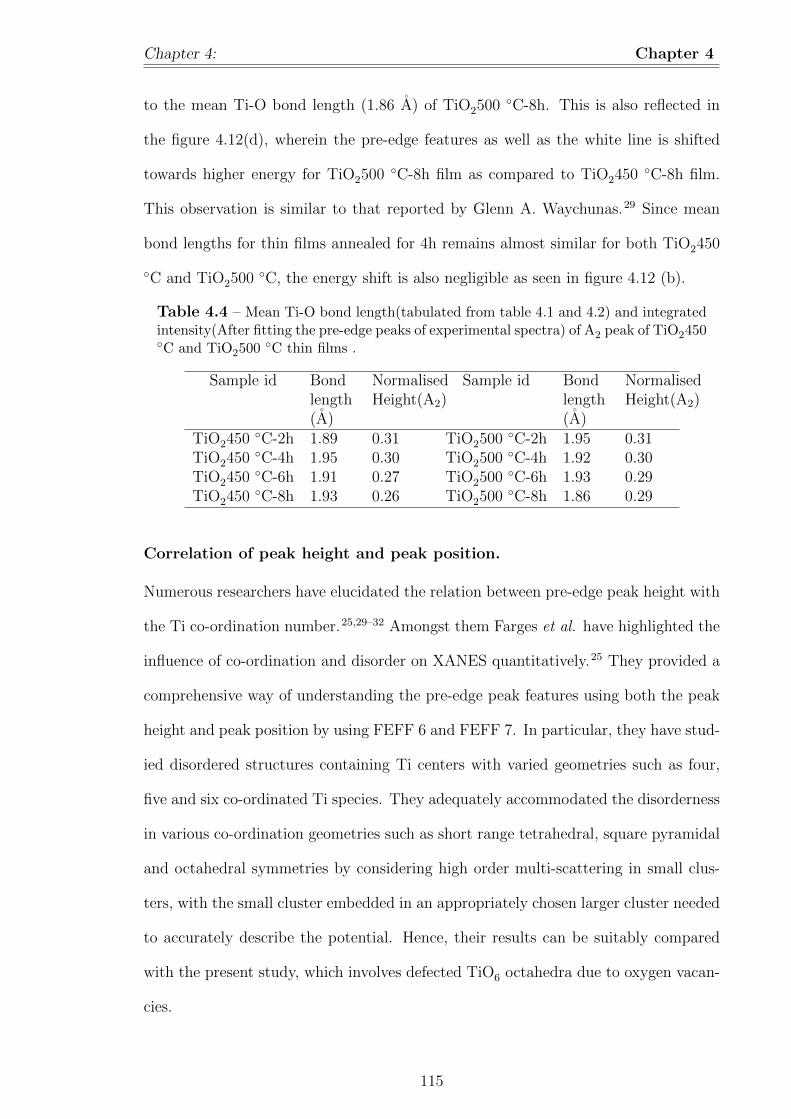
Chapter 4: Chapter 4
to the mean Ti-O bond length (1.86 A) of TiO2500 ◦C-8h. This is also reflected in
the figure 4.12(d), wherein the pre-edge features as well as the white line is shifted
towards higher energy for TiO2500 ◦C-8h film as compared to TiO2450 ◦C-8h film.
This observation is similar to that reported by Glenn A. Waychunas.29 Since mean
bond lengths for thin films annealed for 4h remains almost similar for both TiO2450
◦C and TiO2500 ◦C, the energy shift is also negligible as seen in figure 4.12 (b).
Table 4.4 – Mean Ti-O bond length(tabulated from table 4.1 and 4.2) and integratedintensity(After fitting the pre-edge peaks of experimental spectra) of A2 peak of TiO2450◦C and TiO2500 ◦C thin films .
Sample id Bondlength(A)
NormalisedHeight(A2)
Sample id Bondlength(A)
NormalisedHeight(A2)
TiO2450 ◦C-2h 1.89 0.31 TiO2500 ◦C-2h 1.95 0.31TiO2450 ◦C-4h 1.95 0.30 TiO2500 ◦C-4h 1.92 0.30TiO2450 ◦C-6h 1.91 0.27 TiO2500 ◦C-6h 1.93 0.29TiO2450 ◦C-8h 1.93 0.26 TiO2500 ◦C-8h 1.86 0.29
Correlation of peak height and peak position.
Numerous researchers have elucidated the relation between pre-edge peak height with
the Ti co-ordination number.25,29–32 Amongst them Farges et al. have highlighted the
influence of co-ordination and disorder on XANES quantitatively.25 They provided a
comprehensive way of understanding the pre-edge peak features using both the peak
height and peak position by using FEFF 6 and FEFF 7. In particular, they have stud-
ied disordered structures containing Ti centers with varied geometries such as four,
five and six co-ordinated Ti species. They adequately accommodated the disorderness
in various co-ordination geometries such as short range tetrahedral, square pyramidal
and octahedral symmetries by considering high order multi-scattering in small clus-
ters, with the small cluster embedded in an appropriately chosen larger cluster needed
to accurately describe the potential. Hence, their results can be suitably compared
with the present study, which involves defected TiO6 octahedra due to oxygen vacan-
cies.
115

Analysis of X-ray Absorption Near Edge Spectra (XANES) Chapter 4
The XANES region of the X-ray absorption spectra of vaccuum annealed TiO2450 ◦C
and TiO2500 ◦C thin films were fitted using peak fitting feature of Athena with three
Gaussian peaks. The peak parameters for A2 peak is given in the table 4.4. The edge
part was simulated with arctan function.29 Farges et al have studied mixture of four,
five and sixfold co-ordinated Ti compounds and have illuciadted that peak height alone
cannot be conclusively used for determination of Ti- cordination. However use of both
peak height and peak position can conclusively tell about the co-ordination number
(Fig 6 of Ref-23). It is observed that the A2 pre-edge peak position is ∼ 4971 eV for
all the TiO2−x thin films and their normalised peak intensity ranges from 0.26 to 0.31.
Hence, it is concluded that films consist of both six fold and few five fold co-ordinated
Ti centers taking both peak position and peak height into consideration. This is
evident from the co-ordination numbers calculated from the EXAFS analysis described
in section 4.4.1. Since, EXAFS gives an average value of several co-ordination spheres,
the co-ordination number for the films in the present study varies between 4 to 6 as
seen from the EXAFS analysis. Hence, from XANES and EXAFS, it is concluded
that vacuum annealing of spray pyrolysis synthesized TiO2 films results in oxygen
deficient thin films without any phase transition of the thin films. In addition to the
co-ordination number, the disorderness in the TiO6 octahedra also affect the pre-edge
intensity, which is described below.
4.4.1 Discussion on pre-edge Intensity
In this section the effect of disorderness in the TiO6 octahedra on the pre-edge intensity
is discussed. It is known that the integrated intensity is a function of degree of p-
d mixing, which is a result of distortion in TiO6 octahedra in anatase TiO2. In
particular, Waychunas and Jiang et. al. observed that the effect of distortion is more
pronounced in the second pre-edge peak intensity (A2).29,24 To understand the above
effect, peak fitting results of A2 given in Table 4.4 are analysed. The peak intensity
of A2 (in table 4.4) reveals that TiO2−x thin films (for both the set of films i.e films
116
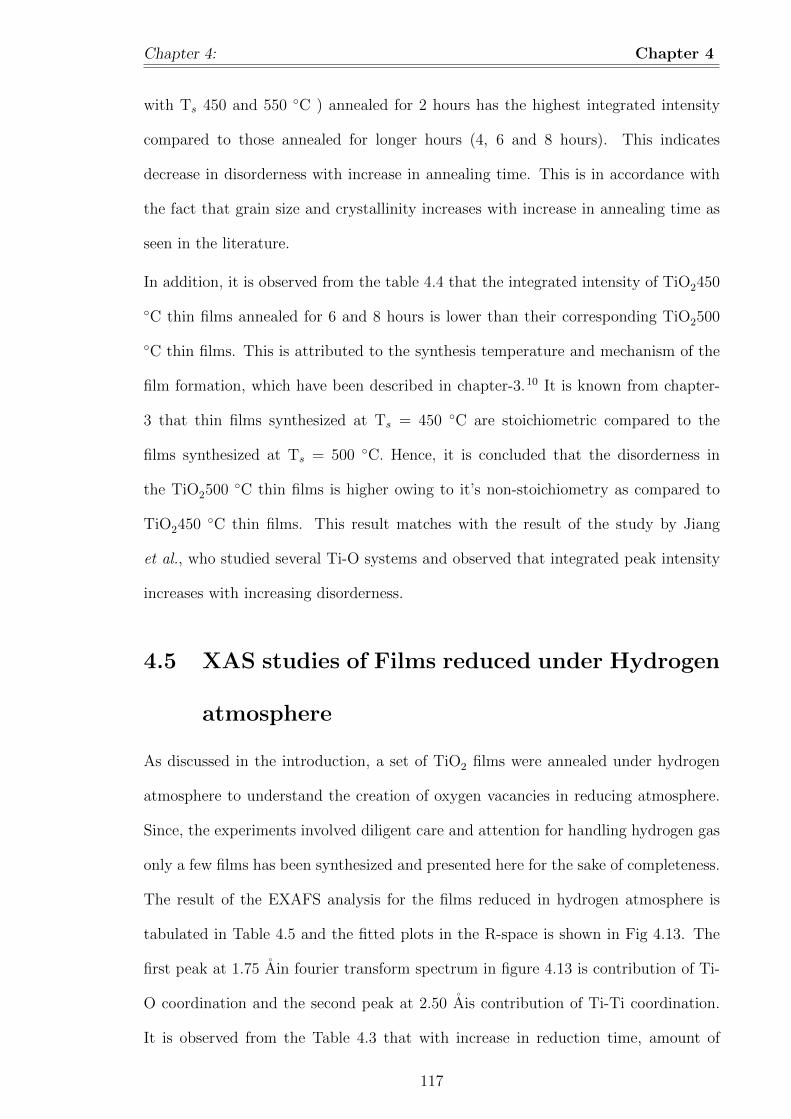
Chapter 4: Chapter 4
with Ts 450 and 550 ◦C ) annealed for 2 hours has the highest integrated intensity
compared to those annealed for longer hours (4, 6 and 8 hours). This indicates
decrease in disorderness with increase in annealing time. This is in accordance with
the fact that grain size and crystallinity increases with increase in annealing time as
seen in the literature.
In addition, it is observed from the table 4.4 that the integrated intensity of TiO2450
◦C thin films annealed for 6 and 8 hours is lower than their corresponding TiO2500
◦C thin films. This is attributed to the synthesis temperature and mechanism of the
film formation, which have been described in chapter-3.10 It is known from chapter-
3 that thin films synthesized at Ts = 450 ◦C are stoichiometric compared to the
films synthesized at Ts = 500 ◦C. Hence, it is concluded that the disorderness in
the TiO2500 ◦C thin films is higher owing to it’s non-stoichiometry as compared to
TiO2450 ◦C thin films. This result matches with the result of the study by Jiang
et al., who studied several Ti-O systems and observed that integrated peak intensity
increases with increasing disorderness.
4.5 XAS studies of Films reduced under Hydrogen
atmosphere
As discussed in the introduction, a set of TiO2 films were annealed under hydrogen
atmosphere to understand the creation of oxygen vacancies in reducing atmosphere.
Since, the experiments involved diligent care and attention for handling hydrogen gas
only a few films has been synthesized and presented here for the sake of completeness.
The result of the EXAFS analysis for the films reduced in hydrogen atmosphere is
tabulated in Table 4.5 and the fitted plots in the R-space is shown in Fig 4.13. The
first peak at 1.75 Ain fourier transform spectrum in figure 4.13 is contribution of Ti-
O coordination and the second peak at 2.50 Ais contribution of Ti-Ti coordination.
It is observed from the Table 4.3 that with increase in reduction time, amount of
117
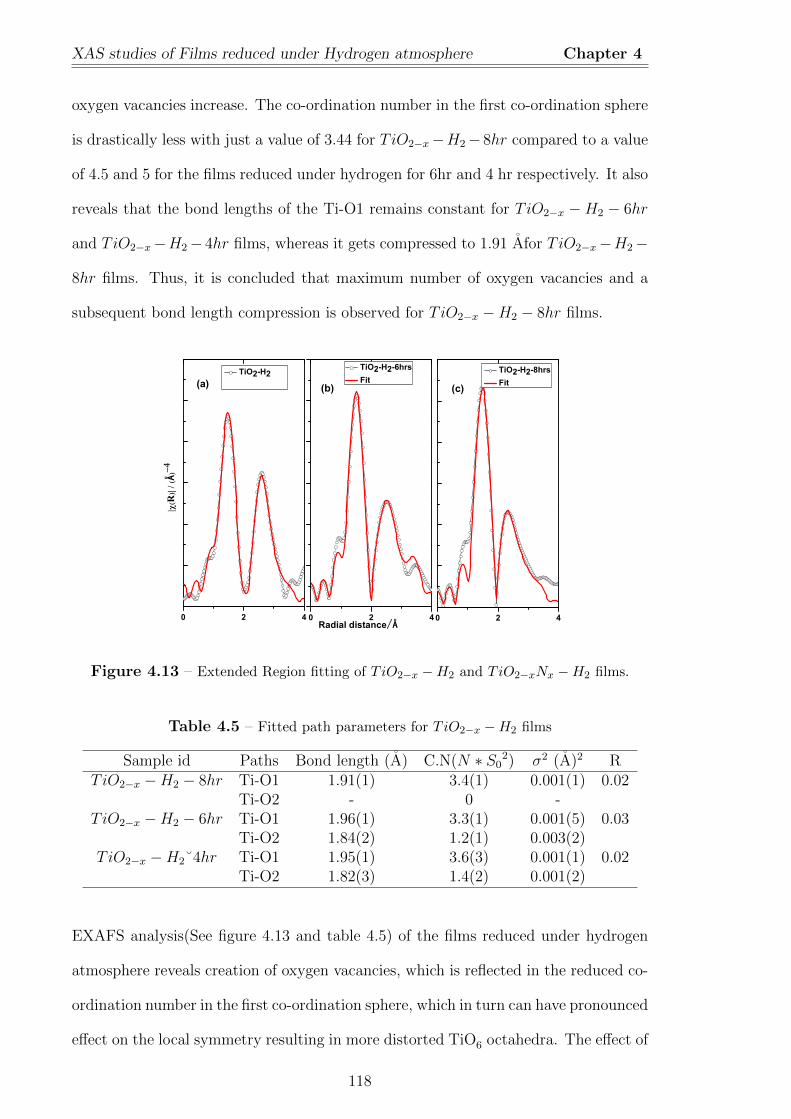
XAS studies of Films reduced under Hydrogen atmosphere Chapter 4
oxygen vacancies increase. The co-ordination number in the first co-ordination sphere
is drastically less with just a value of 3.44 for TiO2−x−H2− 8hr compared to a value
of 4.5 and 5 for the films reduced under hydrogen for 6hr and 4 hr respectively. It also
reveals that the bond lengths of the Ti-O1 remains constant for TiO2−x −H2 − 6hr
and TiO2−x−H2− 4hr films, whereas it gets compressed to 1.91 Afor TiO2−x−H2−
8hr films. Thus, it is concluded that maximum number of oxygen vacancies and a
subsequent bond length compression is observed for TiO2−x −H2 − 8hr films.
0 2 4 0 2 40 2 4Radial distance/Å
RÅ
TiO2-H2-6hrs Fit(a)
(b)
TiO2-H2-8hrs Fit(c)
TiO2-H2
Figure 4.13 – Extended Region fitting of TiO2−x −H2 and TiO2−xNx −H2 films.
Table 4.5 – Fitted path parameters for TiO2−x −H2 films
Sample id Paths Bond length (A) C.N(N ∗ S02) σ2 (A)2 R
TiO2−x −H2 − 8hr Ti-O1 1.91(1) 3.4(1) 0.001(1) 0.02Ti-O2 - 0 -
TiO2−x −H2 − 6hr Ti-O1 1.96(1) 3.3(1) 0.001(5) 0.03Ti-O2 1.84(2) 1.2(1) 0.003(2)
TiO2−x −H2˘4hr Ti-O1 1.95(1) 3.6(3) 0.001(1) 0.02Ti-O2 1.82(3) 1.4(2) 0.001(2)
EXAFS analysis(See figure 4.13 and table 4.5) of the films reduced under hydrogen
atmosphere reveals creation of oxygen vacancies, which is reflected in the reduced co-
ordination number in the first co-ordination sphere, which in turn can have pronounced
effect on the local symmetry resulting in more distorted TiO6 octahedra. The effect of
118
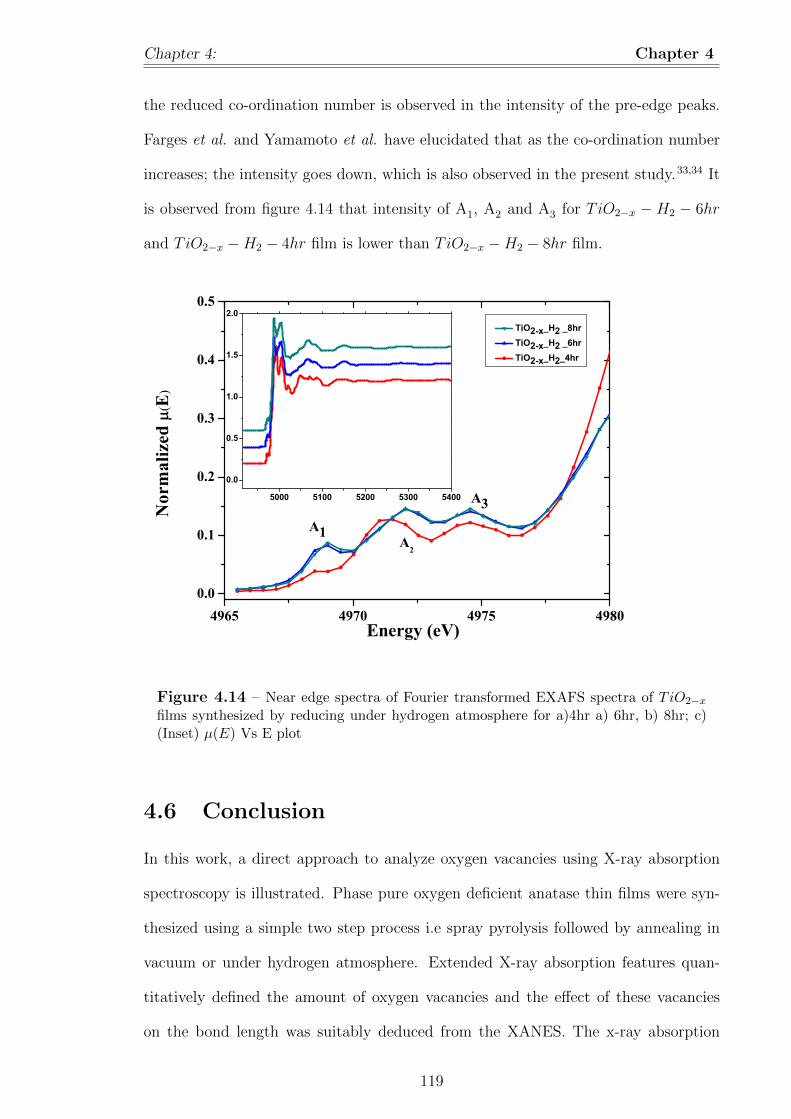
Chapter 4: Chapter 4
the reduced co-ordination number is observed in the intensity of the pre-edge peaks.
Farges et al. and Yamamoto et al. have elucidated that as the co-ordination number
increases; the intensity goes down, which is also observed in the present study.33,34 It
is observed from figure 4.14 that intensity of A1, A2 and A3 for TiO2−x − H2 − 6hr
and TiO2−x −H2 − 4hr film is lower than TiO2−x −H2 − 8hr film.
4965 4970 4975 49800.0
0.1
0.2
0.3
0.4
0.5
5000 5100 5200 5300 5400
0.0
0.5
1.0
1.5
2.0
A2
A3
TiO2-x_H2 _8hr TiO2-x_H2 _6hr TiO2-x_H2_4hr
Energy (eV)
Nor
mal
ized
E
A1
Figure 4.14 – Near edge spectra of Fourier transformed EXAFS spectra of TiO2−xfilms synthesized by reducing under hydrogen atmosphere for a)4hr a) 6hr, b) 8hr; c)(Inset) µ(E) Vs E plot
4.6 Conclusion
In this work, a direct approach to analyze oxygen vacancies using X-ray absorption
spectroscopy is illustrated. Phase pure oxygen deficient anatase thin films were syn-
thesized using a simple two step process i.e spray pyrolysis followed by annealing in
vacuum or under hydrogen atmosphere. Extended X-ray absorption features quan-
titatively defined the amount of oxygen vacancies and the effect of these vacancies
on the bond length was suitably deduced from the XANES. The x-ray absorption
119
Conclusion Chapter 4
near edge(XANES) features revealed qualitative information regarding the electronic
transitions of these oxygen deficient TiO2 thin films.
120
Bibliography
[1] Wang, J.; Tapio, K.; Habert, A.; Sorgues, S.; Colbeau-Justin, C.; Ratier, B.;
Scarisoreanu, M.; Toppari, J.; Herlin-Boime, N.; Boucle, J. Influence of Nitrogen
Doping on Device Operation for TiO2 Based Solid State Dye Sensitized Solar
Cells: Photo-Physics from Materials to Devices. Nanomaterials. 2016, 6, 35.
[2] Guo, M.; Lu, J. Q.; Wu, Y. N.; Wang, Y. J.; Luo, M. F. UV and Visible Raman
Studies of Oxygen Vacancies in Rare-Earth-Doped Ceria. Langmuir. 2011, 27,
3872.
[3] Chen, Q. L.; Gabaly, F. E.; Akgul, F. A.; Liu, Z.; Mun, B. S.; Yamaguchi, S.;
Braun, A. Observation of Oxygen Vacancy Filling under Water Vapor in Ceramic
Proton Conductors in Situ with Ambient Pressure XPS. Chem. Mater. 2013, 25,
4690.
[4] Gordon, T. R.; Cargnello, M.; Paik, T.; Mangolini, F.; Weber, R. T.; Fornasiero,
P.; Murray, C. B. Nonaqueous Synthesis of TiO2 Nanocrystals Using TiF4 to En-
gineer Morphology, Oxygen Vacancy Concentration, and Photocatalytic Activity.
J. Am. Chem. Soc. 2012, 134, 6751.
[5] Ji, W. W.; Lee, M. H.; Hao, L. Y.; Xu, X.; Agathopoulos, S.; Zheng, D. W.;
Fang, C. H. Role of Oxygen Vacancy on the Photoluminescence of BaMgSiO4
:Eu Phosphors: Experimental and Theoretical Analysis Inorg. Chem. 2015, 54,
1556.
121
BIBLIOGRAPHY Chapter 4
[6] Thompson,T. L.; Yates, J. T. Jr. TiO2-based photocatalysis: surface defects,
oxygen and charge transfer. Topics in Catalysis. 2005, 35, 197.
[7] Pan, X.; Yang, M. Q.; Fu,X.; Zhang, N.; Xu, Y. J. Defective TiO2 with oxy-
gen vacancies: synthesis, properties and photocatalytic applications. Nanoscale.
2013, 5, 3601.
[8] Liu, L.; Zhao,C.; Li, Y. Spontaneous Dissociation of CO2 to CO on Defective
Surface of Cu(I)/ TiO2−x Nanoparticles at Room Temperature. J. Phys. Chem.
C. 2012, 116, 7904.
[9] Ceotto, M.; Lo Presti, L.; Cappelletti, G.; Meroni, D.; Spadavecchia, F.; Zecca,
R.; Leoni, M.; Scardi, P.; Bianchi, C. L.; Ardizzone, S., About the Nitrogen Loca-
tion in Nanocrystalline N-Doped TiO2: Combined DFT and EXAFS Approach,
J. Phys. Chem. C. 2012, 116, 1764.
[10] Sahoo, M.; Yadav, A. K.; Jha, S. N.; Bhattacharyya, D.; Mathews,T.; Sahoo,
N. K.; Dash, S.; Tyagi, A. K. Nitrogen Location and Ti-O Bond Distances in
Pristine and N-doped TiO2 anatase Thin Films by X-ray Absorption Studies. J.
Phys. Chem. C. 2015, 119, 17640.
[11] M. Salari, K. Konstantinov ; Liu, H. K. Enhancement of the capacitance in T iO2
nanotubes through controlled introduction of oxygen vacancies J.Mater.Chem.
2011, 21, 5128.
[12] Chen, X.; Mao, S. S. Titanium Dioxide Nanomaterials: Synthesis, Properties,
Modifications, and Applications. Chem. Rev.2007, 107, 2891.
[13] Newville, M.; Ravel, B.; Haskel, D.; Rehr, J.; Stern, E.; Yacoby, Y. Analysis of
Multiple-Scattering {XAFS} Data using Theoretical Standards. Phys. B. 1995,
208-209, 154.
122
BIBLIOGRAPHY Chapter 4
[14] Krivtsov,I.; Ilkaeva, M.; Salas-Colera, E.; Amghouz, Z.; Garcia,J. R.; Diaz, E.;
Ordonez, S.;Villar-Rodil, S. Consequences of Nitrogen-Doping and Oxygen En-
richment on Titanium Local Order and Photocatalytic Performance of TiO2
Anatase. J.Phys. Chem. C. 2017, 121, 6770.
[15] Frenkel,A. I.; Yevick, A.; Cooper, C.; Vasic,R. Modeling the Structure and Com-
position of Nanoparticles by Extended X-Ray Absorption Fine-Structure Spec-
troscopy. Annu. Rev. Anal. Chem. 2011, 4, 23.
[16] Calvin, S.; Miller, M. M.; Goswami, R.; Cheng, S. F.; Mulvaney, S. P. ; Whitman,
L. J.; Harris, V. G. Determination of crystallite size in a magnetic nanocomposite
using extended X-ray absorption fine structure.J. Appl. Phys. 2003, 94, 778.
[17] Presti,L. L.; Ceotto,M.; Spadavecchia, F.;Cappelletti, G.; Meroni, D.; Acres,
R. G.; Ardizzone,S. Role of the Nitrogen Source in Determining Structure and
Morphology of N-Doped Nanocrystalline TiO2. J. Phys. Chem. C.2014, 118,
4797.
[18] Bharti,B; Kumar, S;Lee , Heung-No; Kumar, R; Formation of oxygen vacancies
and Ti3+ state in TiO2 thin film and enhanced optical properties by air plasma
treatment.Scientific Reports 2016, 6, Article number: 32355.
[19] Grunes, L. A. Study of the K Edges of 3d Transition Metals in Pure and Oxide
Form by X-ray-Absorption Spectroscopy. Phys. Rev. B. 1983, 27, 2111.
[20] Sandstrom, D. R.; Filby, R. H.; Lytle, F. W.; Greegor, R. B. Study of Ti in
Solvent-Refined Coal by X-ray Absorption Spectroscopy. Fuel 1982, 61, 195.
[21] Landmann, M.; Rauls, E.; Schmidt,W. G. The electronic structure and optical
response of rutile, anatase and brookite TiO2 J. Phys.: Condens. Matter. 2012,
24 195503.
123
BIBLIOGRAPHY Chapter 4
[22] Chen, L. X.; Rajh, T.; Wang, Z.; Thurnauer, M. C. XAFS Studies of Surface
Structures of TiO2 Nanoparticles and Photocatalytic Reduction of Metal Ions.
J. Phys. Chem. B. 1997, 101, 10688.
[23] Rehr, J.J.; Kas,J.J.;Vila, F.D.; Prange, M.P.; Jorissen, K. Parameter-free calcu-
lations of X-ray spectra with FEFF9. Phys. Chem. Chem. Phys.2010, 12,5503.
[24] Jiang, N.; Su, D.; Spence, J. C. H. Determination of Ti coordination from
pre-edge peaks in Ti K-edge XANES. Physical Review B. 2007, 76, 214117(1)-
214117(9)
[25] Farges,F.; Brown,G. E.; Jr.; Rehr, J. J. TiK-edge XANES studies of Ti co-
ordination and disorder in oxide compounds: Comparison between theory and
experiment. Phys. Rev. B. 1997, 56, 1809.
[26] Demenchenko,I. N.; Denlinger, J. D.; Chernyshova, M.; Yu, K. M.; Speaks, D. T.;
Olalde-Velasco, P.; Hemmers, O.; Walukiewicz, W.; Derkachova, A.; Lawniczak-
Jablonska, K. Full multiple scattering analysis XANES at the Cd L3 and O K
edges in CdO films combined with a soft X-ray emission investigation. Physical
Review B, 2010, 82, 075107.
[27] Fronzoni, G.; De Francesco, R.; Stener, M.; Causa, M. X-ray Absorption Spec-
troscopy of Titanium Oxide by Time Dependent Density Functional Calculations.
J. Phys. Chem. B,2006, 110,9899.
[28] Chaboy,J. ;Nakajima, N.; Tezuka,Y. Ab initio x-ray absorption near-edge struc-
ture study of Ti K-edge in rutile. J. Phys.: Condens. Matter ,2007,19, 266206.
[29] Waychunas, G. A. Synchrotron radiation XANES spectroscopy of Ti in minerals:
Effects of Ti bonding distances, Ti valence, and site geometry on absorption edge
structure. American Mineralogist.1987, 72,89.
124
BIBLIOGRAPHY Chapter 4
[30] Greegor R. B.; Lytle. W. F.;Sandstrom, D. R.; Wong, J.; Schultz, P. Investiga-
tion of TiO2-SiO2 glasses by X-ray Absorption Spectroscopy. Journal of Non-
Crystalline Solids. 1983, 55, 27.
[31] Yarker C. A.;Johnson P.A.V.;Wright A.C. Neutron diffraction and EXAFS evi-
dence for TiO5 units in Vitreous K20-TiO2-2 SiO2. J. Non-Cryst. Solids. 1986,
79, 117.
[32] Farges,F.; Brown,G. E.; Jr.; Rehr, J. J. Coordination chemistry of Ti (IV) in
silicate glasses and melts: I. XAFS study of titanium coordination in oxide model
compounds. Geochim. Cosmochim. Acta 1996, 60, 3023.
[33] Farges,F.; Brown, G. E. Jr.; Rehr, J. J. Ti K-edge XANES studies of Ti co-
ordination and disorder in oxide compounds: Comparison between theory and
experiment J. Phys. Chem. C. 1997, 111, 1809.
[34] Yamamoto, T. Assignment of pre-edge peaks in K-edge X-ray absorption spec-
tra of 3d transition metal compounds: electric dipole or quadrupole? X-Ray
Spectrom. 2008, 37, 572.
[35] Paula C. Angelome et al. Mesoporous Anatase TiO2 Films: Use of Ti K XANES
for the Quantification of the Nanocrystalline Character and Substrate Effects in
the Photocatalysis Behavior, Physical Review B 2007, 111, 10886.
125

Chapter 5
Photo-induced Wetting Studies on
N-doped TiO2 Films
5.1 Introduction
In chapter 3, XPS and detailed EXAFS studies on N-doped TiO2 confirms the doping
of nitrogen in the interstitial position of TiO2matrix. Optical absorption studies on
these films signaled the formation of interband states viz. N 2p states lying above
the valence band. These interband states are known to facilitate absorption in the
visible region, by exciting electrons from N 2p states to conduction band and thereby
increasing the number of electrons and holes1–4 as compared to pristine TiO2. These
photo-generated charge carriers can then be utilized in various surface redox reactions,
which in turn make the material self cleaning and anti-fogging. Anti-fogging property
of a material is studied from its wetting-dewetting behaviour. Wetting behaviour of
TiO2 surfaces is explained on the basis of two mechanisms, which are briefly discussed
here. The first mechanism (shown in Scheme 5.1) is redox reactions at surfaces,
wherein electrons reduce Ti4+ is to Ti3+ and holes oxidize the O2− anions. This
results in ejection of oxygen atoms thereby creating oxygen vacancies. The water
molecules occupy the oxygen vacancies, producing adsorbed OH groups, which tend
126
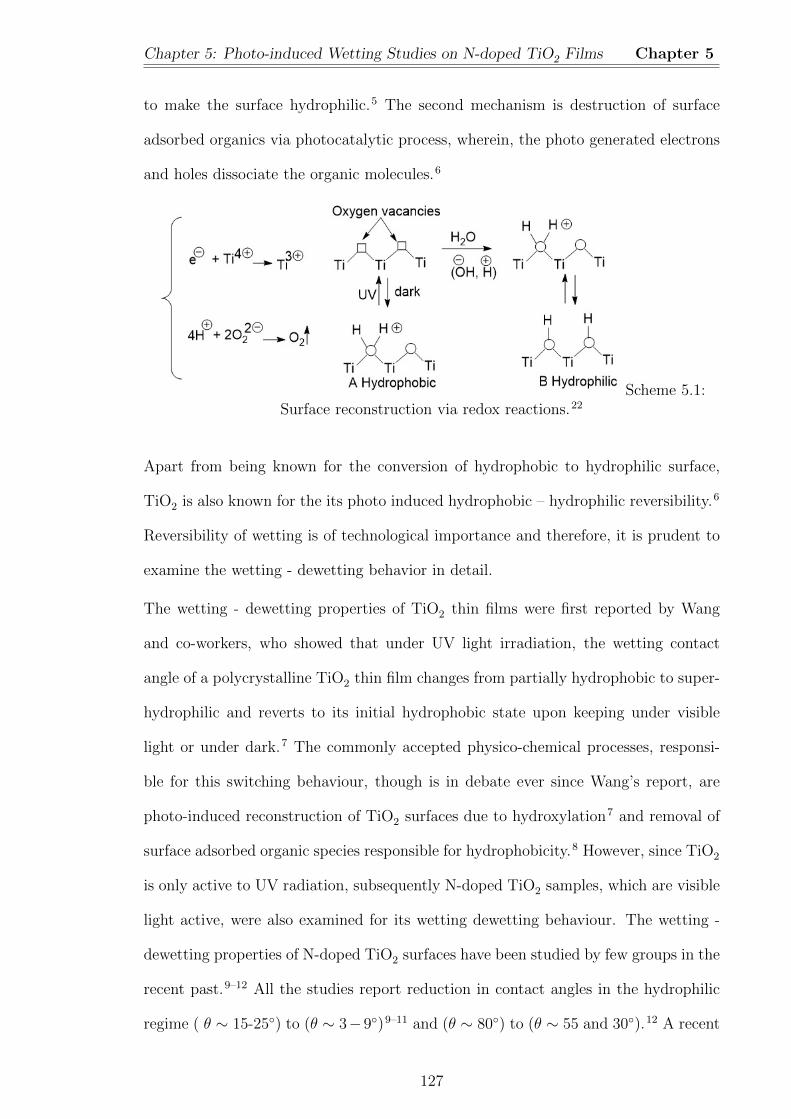
Chapter 5: Photo-induced Wetting Studies on N-doped TiO2 Films Chapter 5
to make the surface hydrophilic.5 The second mechanism is destruction of surface
adsorbed organics via photocatalytic process, wherein, the photo generated electrons
and holes dissociate the organic molecules.6
Scheme 5.1:Surface reconstruction via redox reactions.22
Apart from being known for the conversion of hydrophobic to hydrophilic surface,
TiO2 is also known for the its photo induced hydrophobic – hydrophilic reversibility.6
Reversibility of wetting is of technological importance and therefore, it is prudent to
examine the wetting - dewetting behavior in detail.
The wetting - dewetting properties of TiO2 thin films were first reported by Wang
and co-workers, who showed that under UV light irradiation, the wetting contact
angle of a polycrystalline TiO2 thin film changes from partially hydrophobic to super-
hydrophilic and reverts to its initial hydrophobic state upon keeping under visible
light or under dark.7 The commonly accepted physico-chemical processes, responsi-
ble for this switching behaviour, though is in debate ever since Wang’s report, are
photo-induced reconstruction of TiO2 surfaces due to hydroxylation7 and removal of
surface adsorbed organic species responsible for hydrophobicity.8 However, since TiO2
is only active to UV radiation, subsequently N-doped TiO2 samples, which are visible
light active, were also examined for its wetting dewetting behaviour. The wetting -
dewetting properties of N-doped TiO2 surfaces have been studied by few groups in the
recent past.9–12 All the studies report reduction in contact angles in the hydrophilic
regime ( θ ∼ 15-25◦) to (θ ∼ 3−9◦)9–11 and (θ ∼ 80◦) to (θ ∼ 55 and 30◦).12 A recent
127
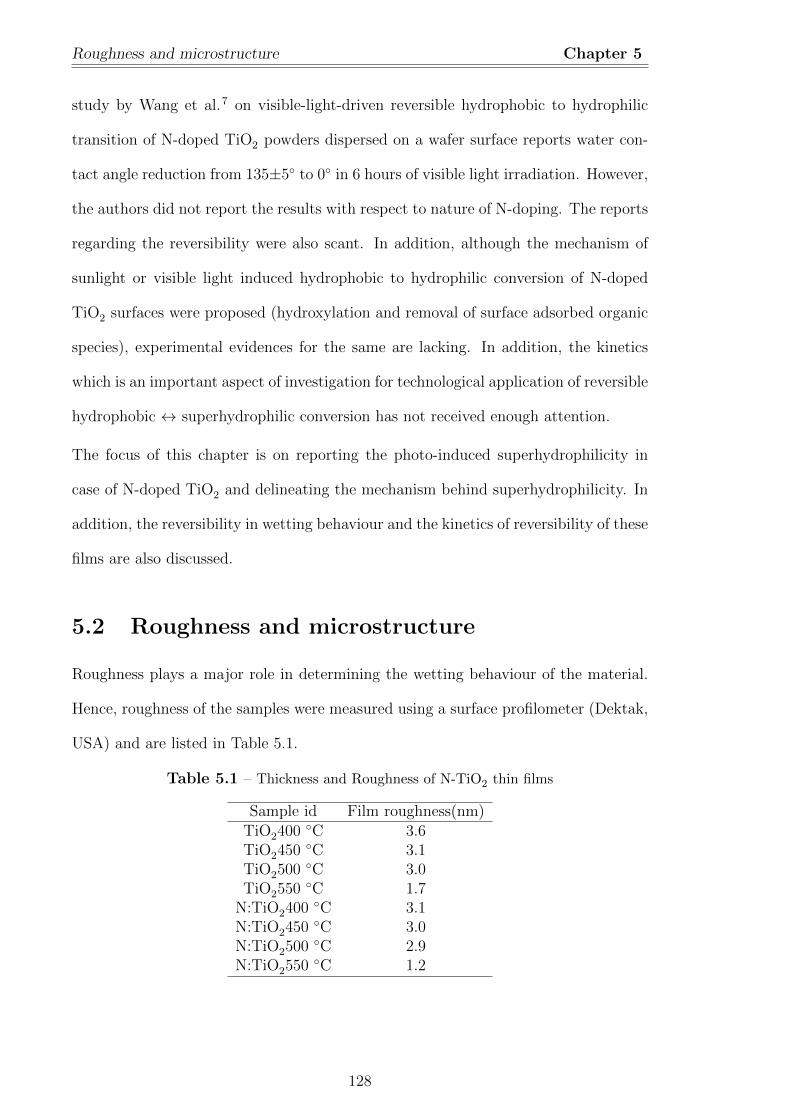
Roughness and microstructure Chapter 5
study by Wang et al.7 on visible-light-driven reversible hydrophobic to hydrophilic
transition of N-doped TiO2 powders dispersed on a wafer surface reports water con-
tact angle reduction from 135±5◦ to 0◦ in 6 hours of visible light irradiation. However,
the authors did not report the results with respect to nature of N-doping. The reports
regarding the reversibility were also scant. In addition, although the mechanism of
sunlight or visible light induced hydrophobic to hydrophilic conversion of N-doped
TiO2 surfaces were proposed (hydroxylation and removal of surface adsorbed organic
species), experimental evidences for the same are lacking. In addition, the kinetics
which is an important aspect of investigation for technological application of reversible
hydrophobic ↔ superhydrophilic conversion has not received enough attention.
The focus of this chapter is on reporting the photo-induced superhydrophilicity in
case of N-doped TiO2 and delineating the mechanism behind superhydrophilicity. In
addition, the reversibility in wetting behaviour and the kinetics of reversibility of these
films are also discussed.
5.2 Roughness and microstructure
Roughness plays a major role in determining the wetting behaviour of the material.
Hence, roughness of the samples were measured using a surface profilometer (Dektak,
USA) and are listed in Table 5.1.
Table 5.1 – Thickness and Roughness of N-TiO2 thin films
Sample id Film roughness(nm)TiO2400 ◦C 3.6TiO2450 ◦C 3.1TiO2500 ◦C 3.0TiO2550 ◦C 1.7
N:TiO2400 ◦C 3.1N:TiO2450 ◦C 3.0N:TiO2500 ◦C 2.9N:TiO2550 ◦C 1.2
128
Chapter 5: Chapter 5
5.3 Wetting Studies
The wetting characteristics of the N-doped samples were evaluated by water con-
tact angle (CA) measurements. Figure 5.1 and 5.2 shows the time evolution of the
water contact angle of pristine TiO2 and N-doped TiO2 synthesized at different sub-
strate temperatures (Ts = 400, 450,500, 550 ◦C) after sunlight irradiation of ∼10 mW
cm−2 intensity for a duration of 40 minutes. The intensity of sunlight was measured
throughout the course of the experiment to ascertain constant irradiation intensity.
As seen from the figures (5.1 and 5.2), all the samples showed CA in the range of
88 to 105 ◦ prior to irradiation (at t=0) and therefore exhibit hydrophobicity. The
difference in the initial wetting contact angle (WCA) is attributed to the difference
in surface roughness (as shown in Table 5.1). According to Cassie and Baxter32,35
the WCA increases with roughness due to the cushioning effect from trapped air.
In particular, the samples synthesized at Ts , 400, 450 and 500 ◦C have roughness
around 3 nm and have wetting contact angle around 105 ◦. The sample synthesized
at 550◦C has the least surface roughness (1.2 nm) and therefore has the lowest WCA
(88◦). The observation in the present experiment is in agreement with the WCA of a
smooth polycrystalline anatase TiO2 surface (free of OH-Ti) of WCA 82 as estimated
by Borras and Gonzalez-Elipe.36,37 A comparative look at fig 5.1 and 5.2 reveals that
although the pristine films synthesized at 500 and 550 ◦C attained hydrophilicity with
contact angle value∼ 17◦ at t= 40mins, it did not attain superhydrophilicity. Whereas
N-doped TiO2 samples showed superhydrophilicity with a contact angle value of ∼ 7◦.
This decresse in WCA between doped and unoped TiO2 for identical conditions of ex-
posure to sunlight indicates the visible light induced hydrophobic→ super-hydrophilic
conversion in N-doped TiO2 samples. In order to examine the reversibility in wetting
behavior, the most super-hydrophilic N-doped sample (Ts=550 ◦C) with the lowest
WCA (7 ◦)was selected and was subjected to alternate exposure to sunlight and dark.
The reversibility was tested for several such dark-sunlight illuminated cycles and re-
129
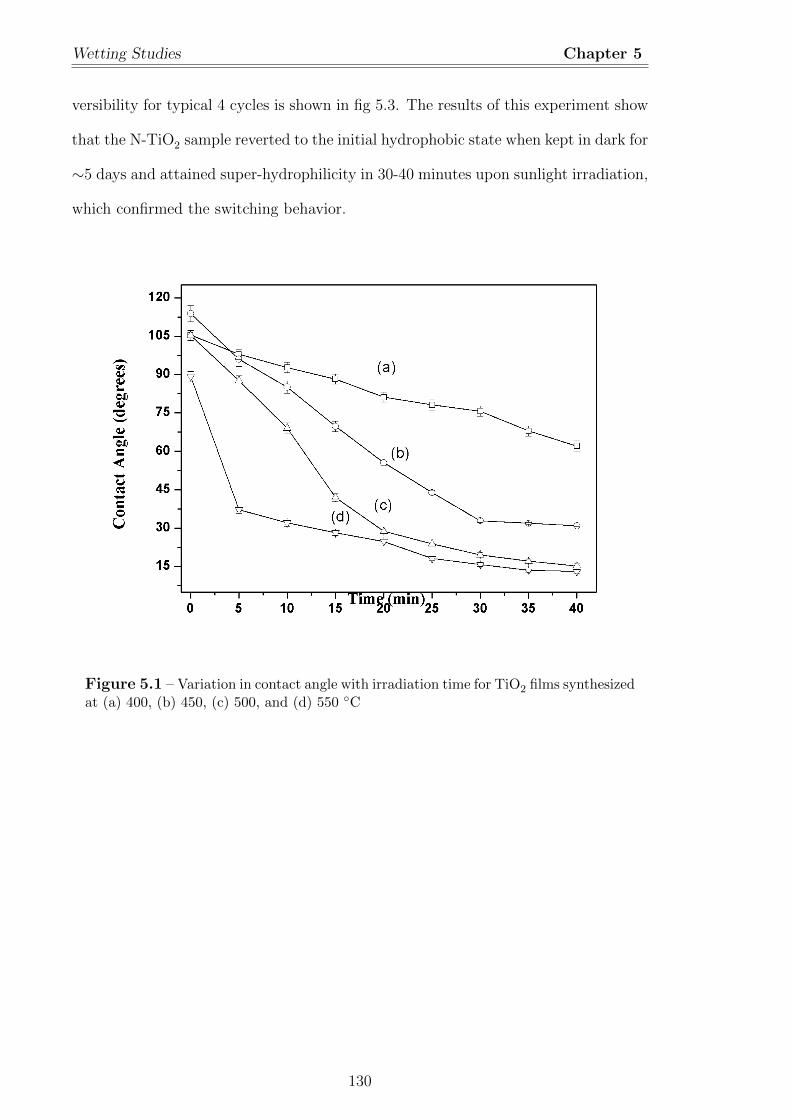
Wetting Studies Chapter 5
versibility for typical 4 cycles is shown in fig 5.3. The results of this experiment show
that the N-TiO2 sample reverted to the initial hydrophobic state when kept in dark for
∼5 days and attained super-hydrophilicity in 30-40 minutes upon sunlight irradiation,
which confirmed the switching behavior.
Figure 5.1 – Variation in contact angle with irradiation time for TiO2 films synthesizedat (a) 400, (b) 450, (c) 500, and (d) 550 ◦C
130
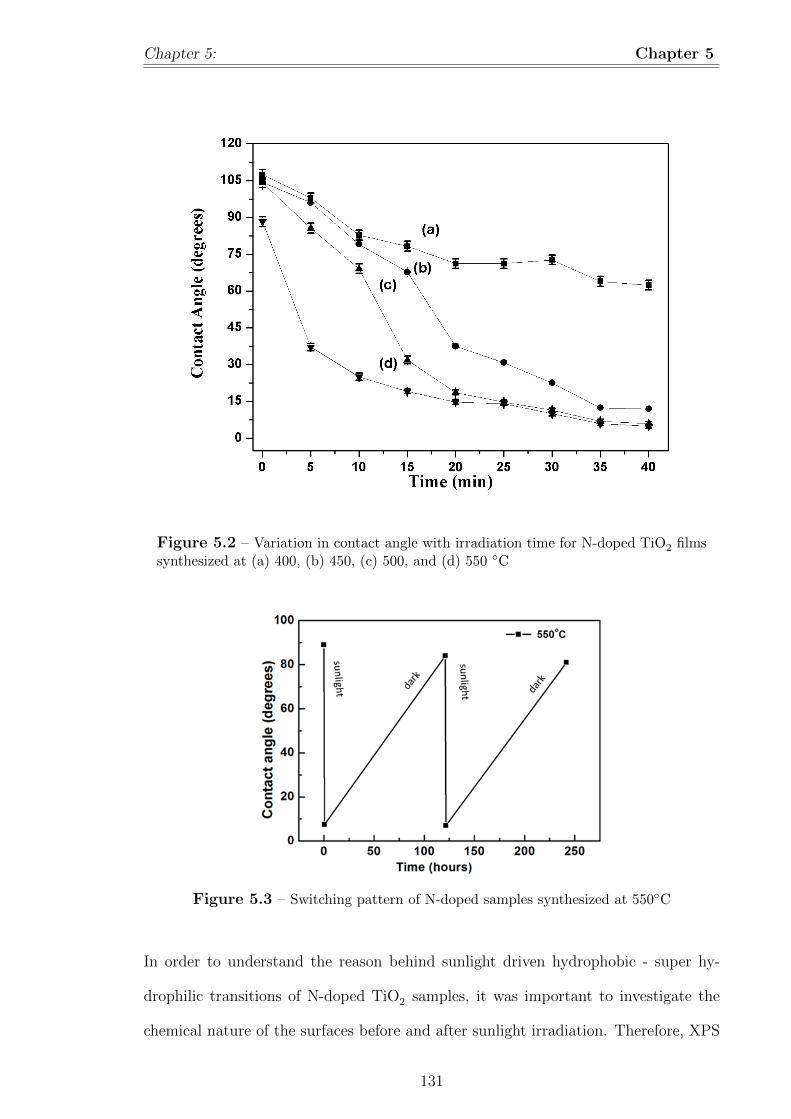
Chapter 5: Chapter 5
Figure 5.2 – Variation in contact angle with irradiation time for N-doped TiO2 filmssynthesized at (a) 400, (b) 450, (c) 500, and (d) 550 ◦C
Figure 5.3 – Switching pattern of N-doped samples synthesized at 550◦C
In order to understand the reason behind sunlight driven hydrophobic - super hy-
drophilic transitions of N-doped TiO2 samples, it was important to investigate the
chemical nature of the surfaces before and after sunlight irradiation. Therefore, XPS
131
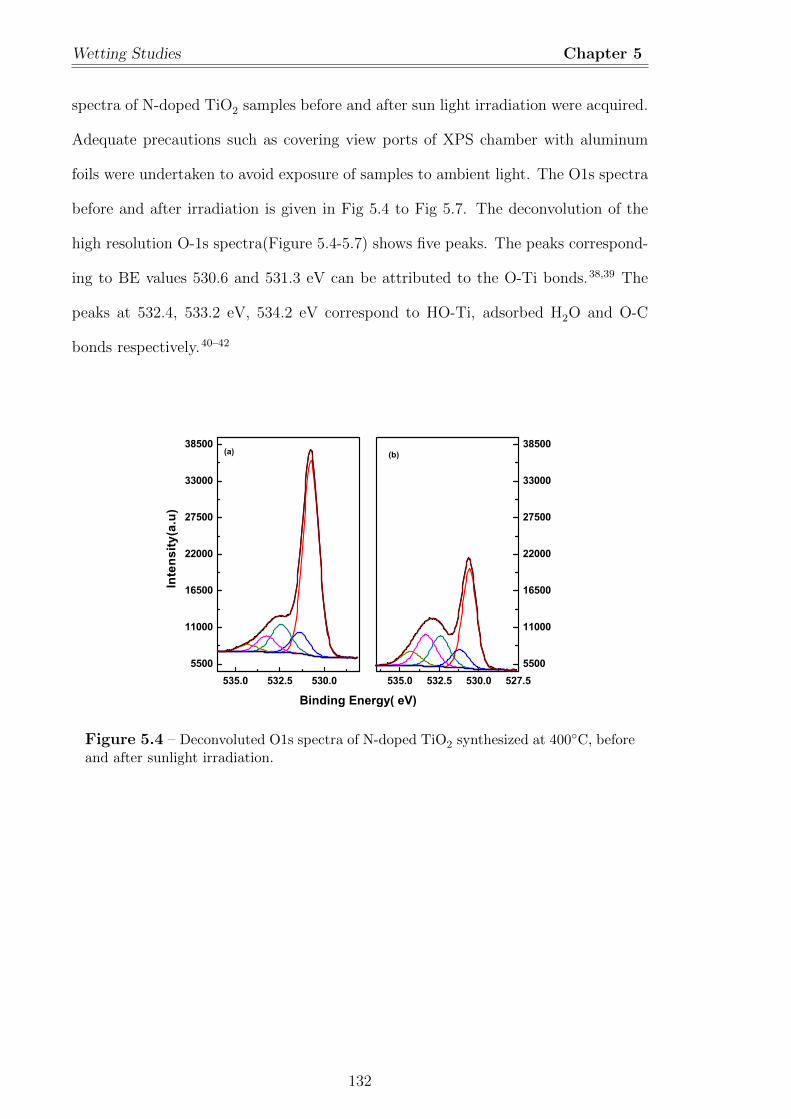
Wetting Studies Chapter 5
spectra of N-doped TiO2 samples before and after sun light irradiation were acquired.
Adequate precautions such as covering view ports of XPS chamber with aluminum
foils were undertaken to avoid exposure of samples to ambient light. The O1s spectra
before and after irradiation is given in Fig 5.4 to Fig 5.7. The deconvolution of the
high resolution O-1s spectra(Figure 5.4-5.7) shows five peaks. The peaks correspond-
ing to BE values 530.6 and 531.3 eV can be attributed to the O-Ti bonds.38,39 The
peaks at 532.4, 533.2 eV, 534.2 eV correspond to HO-Ti, adsorbed H2O and O-C
bonds respectively.40–42
535.0 532.5 530.05500
11000
16500
22000
27500
33000
38500
535.0 532.5 530.0 527.55500
11000
16500
22000
27500
33000
38500(a)
Inte
nsity
(a.u
)
Binding Energy( eV)
(b)
Figure 5.4 – Deconvoluted O1s spectra of N-doped TiO2 synthesized at 400◦C, beforeand after sunlight irradiation.
132
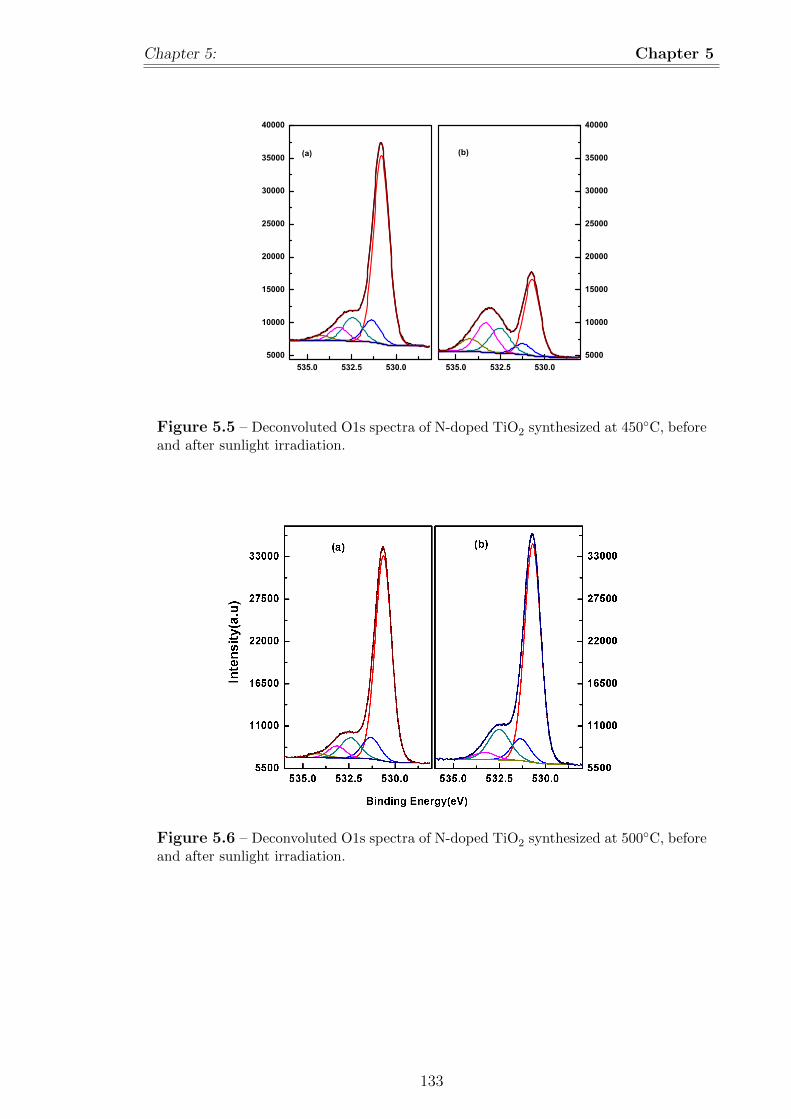
Chapter 5: Chapter 5
535.0 532.5 530.05000
10000
15000
20000
25000
30000
35000
40000
535.0 532.5 530.05000
10000
15000
20000
25000
30000
35000
40000
(a)
(b)
Figure 5.5 – Deconvoluted O1s spectra of N-doped TiO2 synthesized at 450◦C, beforeand after sunlight irradiation.
Figure 5.6 – Deconvoluted O1s spectra of N-doped TiO2 synthesized at 500◦C, beforeand after sunlight irradiation.
133
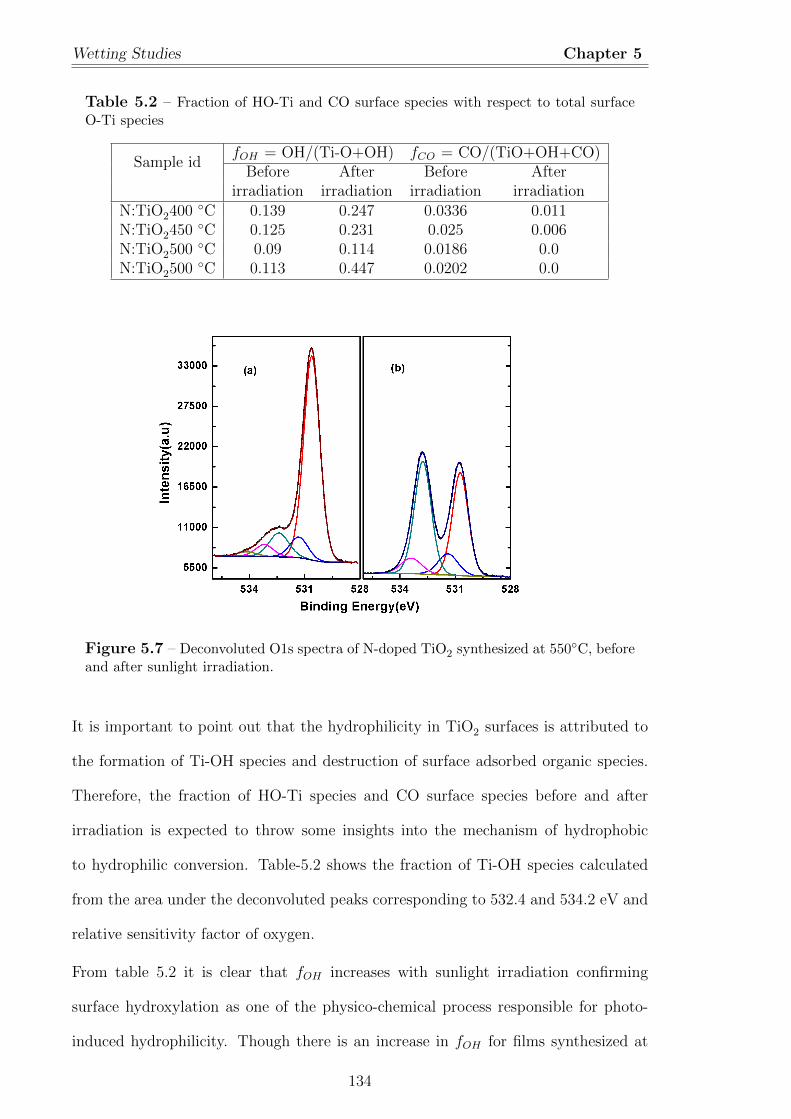
Wetting Studies Chapter 5
Table 5.2 – Fraction of HO-Ti and CO surface species with respect to total surfaceO-Ti species
Sample idfOH = OH/(Ti-O+OH) fCO = CO/(TiO+OH+CO)
Before After Before Afterirradiation irradiation irradiation irradiation
N:TiO2400 ◦C 0.139 0.247 0.0336 0.011N:TiO2450 ◦C 0.125 0.231 0.025 0.006N:TiO2500 ◦C 0.09 0.114 0.0186 0.0N:TiO2500 ◦C 0.113 0.447 0.0202 0.0
Figure 5.7 – Deconvoluted O1s spectra of N-doped TiO2 synthesized at 550◦C, beforeand after sunlight irradiation.
It is important to point out that the hydrophilicity in TiO2 surfaces is attributed to
the formation of Ti-OH species and destruction of surface adsorbed organic species.
Therefore, the fraction of HO-Ti species and CO surface species before and after
irradiation is expected to throw some insights into the mechanism of hydrophobic
to hydrophilic conversion. Table-5.2 shows the fraction of Ti-OH species calculated
from the area under the deconvoluted peaks corresponding to 532.4 and 534.2 eV and
relative sensitivity factor of oxygen.
From table 5.2 it is clear that fOH increases with sunlight irradiation confirming
surface hydroxylation as one of the physico-chemical process responsible for photo-
induced hydrophilicity. Though there is an increase in fOH for films synthesized at
134
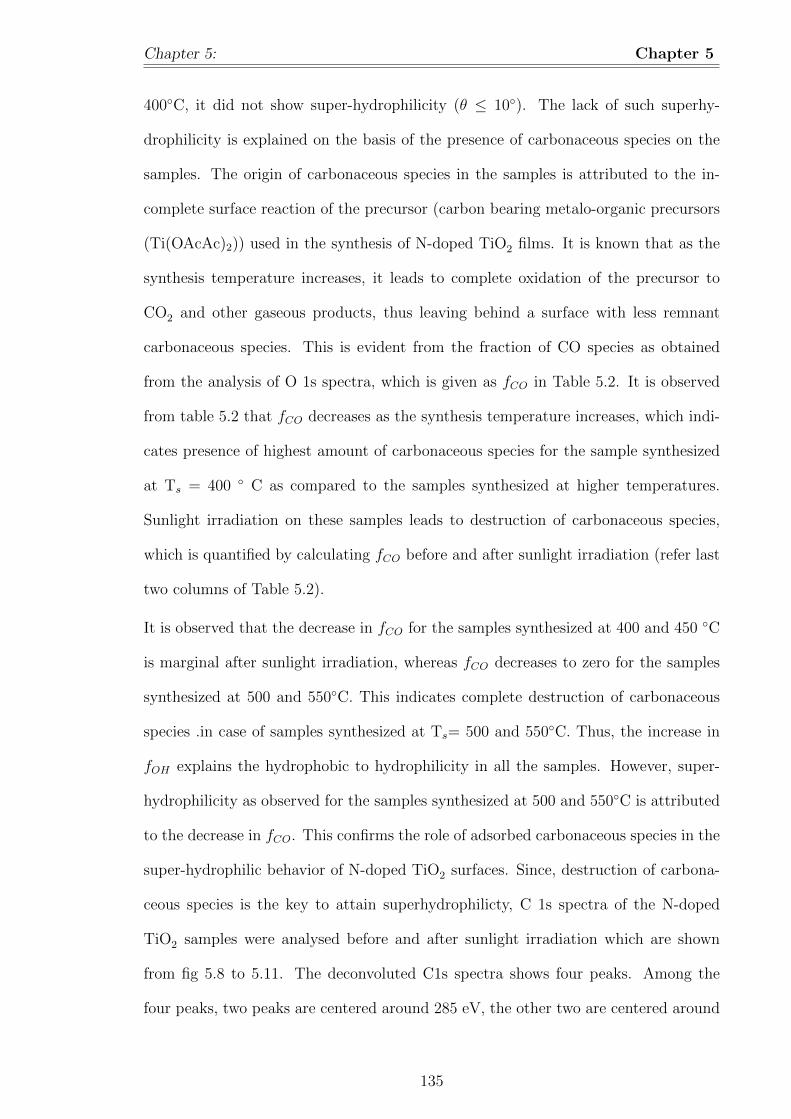
Chapter 5: Chapter 5
400◦C, it did not show super-hydrophilicity (θ ≤ 10◦). The lack of such superhy-
drophilicity is explained on the basis of the presence of carbonaceous species on the
samples. The origin of carbonaceous species in the samples is attributed to the in-
complete surface reaction of the precursor (carbon bearing metalo-organic precursors
(Ti(OAcAc)2)) used in the synthesis of N-doped TiO2 films. It is known that as the
synthesis temperature increases, it leads to complete oxidation of the precursor to
CO2 and other gaseous products, thus leaving behind a surface with less remnant
carbonaceous species. This is evident from the fraction of CO species as obtained
from the analysis of O 1s spectra, which is given as fCO in Table 5.2. It is observed
from table 5.2 that fCO decreases as the synthesis temperature increases, which indi-
cates presence of highest amount of carbonaceous species for the sample synthesized
at Ts = 400 ◦ C as compared to the samples synthesized at higher temperatures.
Sunlight irradiation on these samples leads to destruction of carbonaceous species,
which is quantified by calculating fCO before and after sunlight irradiation (refer last
two columns of Table 5.2).
It is observed that the decrease in fCO for the samples synthesized at 400 and 450 ◦C
is marginal after sunlight irradiation, whereas fCO decreases to zero for the samples
synthesized at 500 and 550◦C. This indicates complete destruction of carbonaceous
species .in case of samples synthesized at Ts= 500 and 550◦C. Thus, the increase in
fOH explains the hydrophobic to hydrophilicity in all the samples. However, super-
hydrophilicity as observed for the samples synthesized at 500 and 550◦C is attributed
to the decrease in fCO. This confirms the role of adsorbed carbonaceous species in the
super-hydrophilic behavior of N-doped TiO2 surfaces. Since, destruction of carbona-
ceous species is the key to attain superhydrophilicty, C 1s spectra of the N-doped
TiO2 samples were analysed before and after sunlight irradiation which are shown
from fig 5.8 to 5.11. The deconvoluted C1s spectra shows four peaks. Among the
four peaks, two peaks are centered around 285 eV, the other two are centered around
135
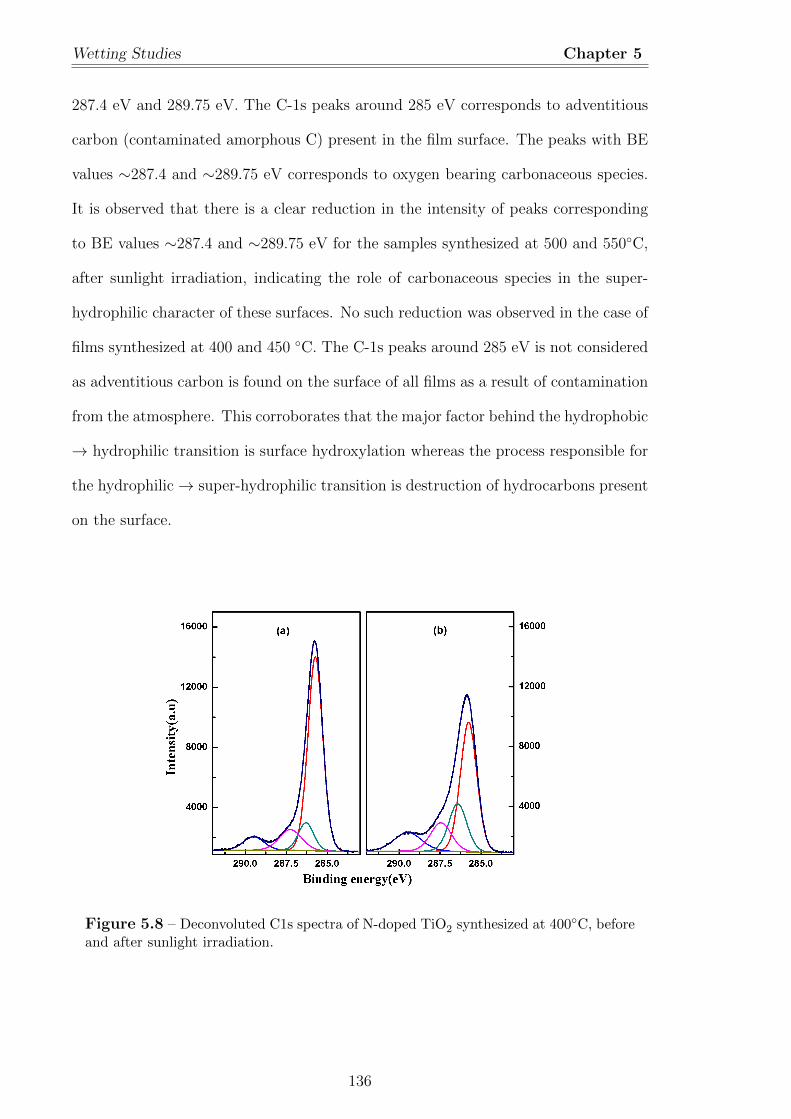
Wetting Studies Chapter 5
287.4 eV and 289.75 eV. The C-1s peaks around 285 eV corresponds to adventitious
carbon (contaminated amorphous C) present in the film surface. The peaks with BE
values ∼287.4 and ∼289.75 eV corresponds to oxygen bearing carbonaceous species.
It is observed that there is a clear reduction in the intensity of peaks corresponding
to BE values ∼287.4 and ∼289.75 eV for the samples synthesized at 500 and 550◦C,
after sunlight irradiation, indicating the role of carbonaceous species in the super-
hydrophilic character of these surfaces. No such reduction was observed in the case of
films synthesized at 400 and 450 ◦C. The C-1s peaks around 285 eV is not considered
as adventitious carbon is found on the surface of all films as a result of contamination
from the atmosphere. This corroborates that the major factor behind the hydrophobic
→ hydrophilic transition is surface hydroxylation whereas the process responsible for
the hydrophilic→ super-hydrophilic transition is destruction of hydrocarbons present
on the surface.
Figure 5.8 – Deconvoluted C1s spectra of N-doped TiO2 synthesized at 400◦C, beforeand after sunlight irradiation.
136
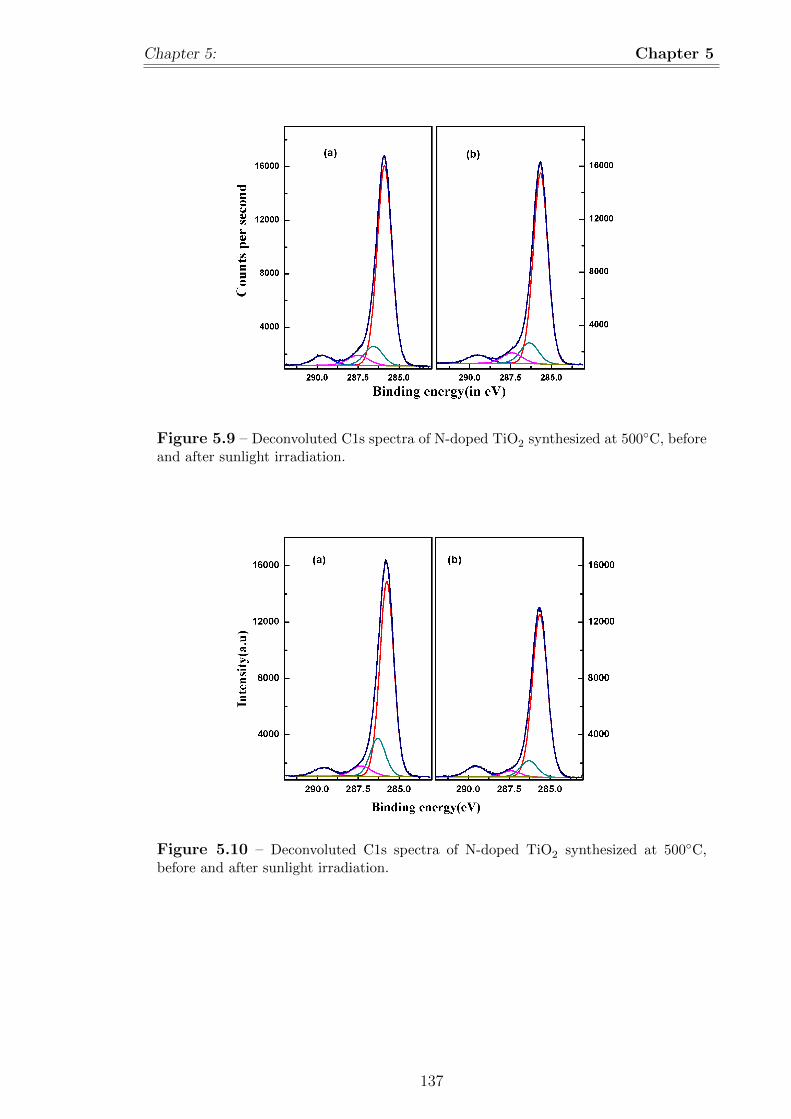
Chapter 5: Chapter 5
Figure 5.9 – Deconvoluted C1s spectra of N-doped TiO2 synthesized at 500◦C, beforeand after sunlight irradiation.
Figure 5.10 – Deconvoluted C1s spectra of N-doped TiO2 synthesized at 500◦C,before and after sunlight irradiation.
137
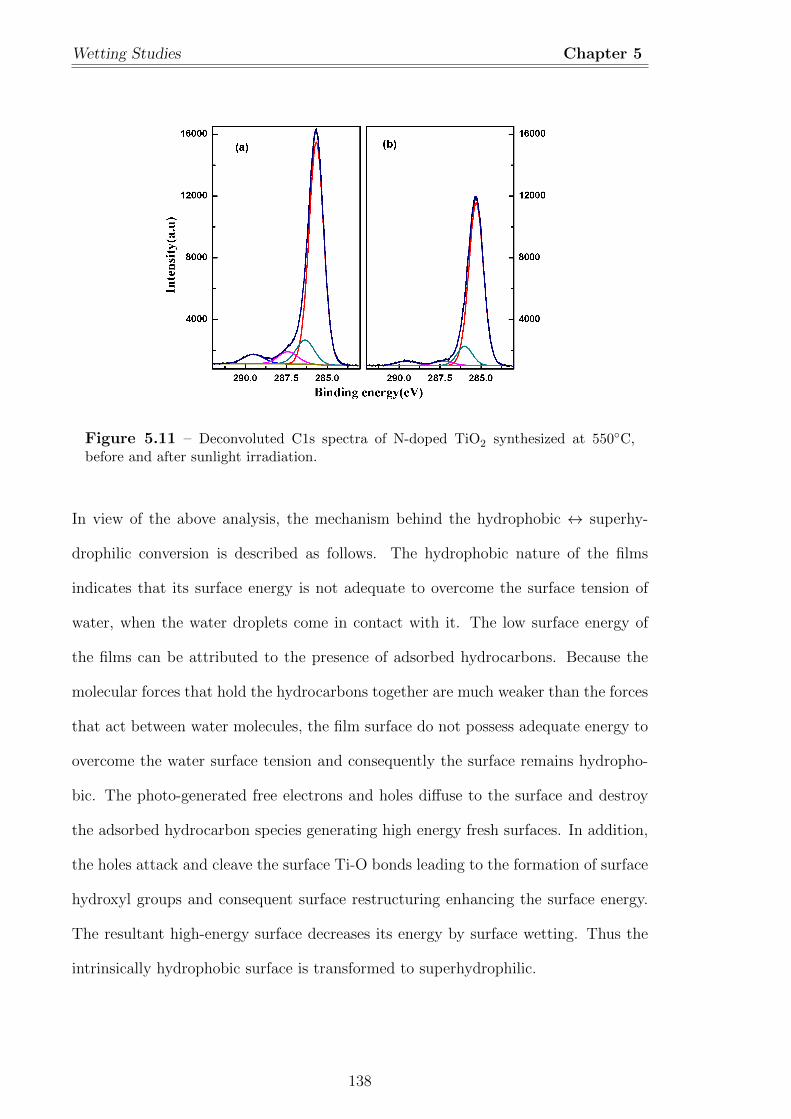
Wetting Studies Chapter 5
Figure 5.11 – Deconvoluted C1s spectra of N-doped TiO2 synthesized at 550◦C,before and after sunlight irradiation.
In view of the above analysis, the mechanism behind the hydrophobic ↔ superhy-
drophilic conversion is described as follows. The hydrophobic nature of the films
indicates that its surface energy is not adequate to overcome the surface tension of
water, when the water droplets come in contact with it. The low surface energy of
the films can be attributed to the presence of adsorbed hydrocarbons. Because the
molecular forces that hold the hydrocarbons together are much weaker than the forces
that act between water molecules, the film surface do not possess adequate energy to
overcome the water surface tension and consequently the surface remains hydropho-
bic. The photo-generated free electrons and holes diffuse to the surface and destroy
the adsorbed hydrocarbon species generating high energy fresh surfaces. In addition,
the holes attack and cleave the surface Ti-O bonds leading to the formation of surface
hydroxyl groups and consequent surface restructuring enhancing the surface energy.
The resultant high-energy surface decreases its energy by surface wetting. Thus the
intrinsically hydrophobic surface is transformed to superhydrophilic.
138
Chapter 5: Chapter 5
5.4 Kinetics of the hydrophobic to superhydrophilic
transition
The kinetics of hydrophobic ↔ superhydrophilic transition can be studied from the
variation of cosine of contact angle (cosθ) with time. According to Young’s theory
the cosθ of a liquid droplet on a solid surface is a function of the interfacial energy
between the solid and liquid25 that in turn changes with the surface fraction of hy-
drophilic region. The three interfacial energies are related to the cosθ by the Young’s
equation as given in equation 5.1 :
γcosθ = γSG − γSL (5.1)
where γ is the surface tension of liquid, γSG is the interfacial energy between the
solid and the gas, and γSL is the interfacial energy between the solid and the liquid.
Upon photo-irradiation the hydrophobic regions are converted to hydrophilic regions
reducing the interfacial energy between the solid surface and liquid.
The simplest possible relation between the interfacial energy, γSG - γSL, and the
surface fraction of hydrophilic regions, c, is a linear relation,
γSG − γSL = γ1c+ γ2 (5.2)
Now, Young’s equation(equation 5.1)can be rewritten as
f ≡ cosθ =γSG − γSL
γ= f1c+ f2 (5.3)
where f1 = γ1/ γ,f2 = γ2 / γ.When c = 0, cosθ has the value of f2, whereas at c =
1 it has a value of f1 + f2. The hydrophilic regions turn back to hydrophobic in the
dark. When both the hydrophilic conversion and its back-reaction are characterized
by single rate constants, the kinetics of the change of the surface fraction of hydrophilic
139
Kinetics of the hydrophobic to superhydrophilic transition Chapter 5
regions is given by
d
dtc(t) = kf (1− c)− kbc (5.4)
where kf is the forward reaction rate constant and kb denotes the backward reaction
rate constant. By substituting the solution of eq 5.4 into eq 5.3 the time evolution of
cosθ after photo-irradiation is obtained as
f(t) = f1[kf
kf + kb− (
kfkf + kb
− c(0))exp−(kf + kb)t] + f2 (5.5)
Hence, the value of of cosθ increases from the initial value of
f(t = 0) = f1c(0) + f2 (5.6)
to the final value corresponding to saturated hydrophilicity,
f(t→∞) =f1
kf + kb+ f2 (5.7)
The rate constant for the hydrophillic to the hydrophobic conversion in the dark is
given by,
fb(t) = f1cb(0)exp(−kb)t+ f2 (5.8)
Where, fb(t) is the decay function in the dark and cb(0) is the initial surface fraction
of hydrophilic regions.
5.4.1 Calculation of rate constants
Exponential equation represented in equation 5.8 was used for fitting the decay in cosθ
values with respect to time which was obtained for the hydrophilic to hydrophobic
conversion (Fig 5.12 (a)). The fitted parameters yielded f2 as 0.1918 and kb (the rate
of super-hydrophilic → hydrophobic conversion) as 1.97 x 10⁻⁴ min−1. At t= 0,c=0
140
Chapter 5: Chapter 5
equation 5.6 gives us cosθ = f2. Hence,the contact angle at t=0 ( taking f2 =0.1918)
was calculated to be 79◦. Similarly, the hydrophobic to super-hydrophilic conversion
rate, kf , under sunlight can be obtained from the plot of cosθ against irradiation
time(Fig 5.12(b)), using the value of kb. The calculated rate, kf , is 0.216 min−1.
Since k f >> kb the largest value of cosθ obtained at t = ∞ (see equation 5.7) can
be described by
cosθ = f1 + f2 (5.9)
Using the highest value of cosθ in this experiment which corresponds to 0.99 in equa-
tion 5.9, value of f1 ( γ1/γ) was found out to be 0.798. When f1 and f2 is substituted
in the equation 5.9, which also represents the state of superhydrophilicty, the contact
angle was found out to be 8.1◦. The smallest and largest contact angle (8.1◦ and 79◦)
calculated from the analysis of cosθ versus time curves given in figure 5.12(a) and
5.12(b) matches with the corresponding experimentally observed values of 5◦ and
88◦ (Fig 5.2 (d)).
141
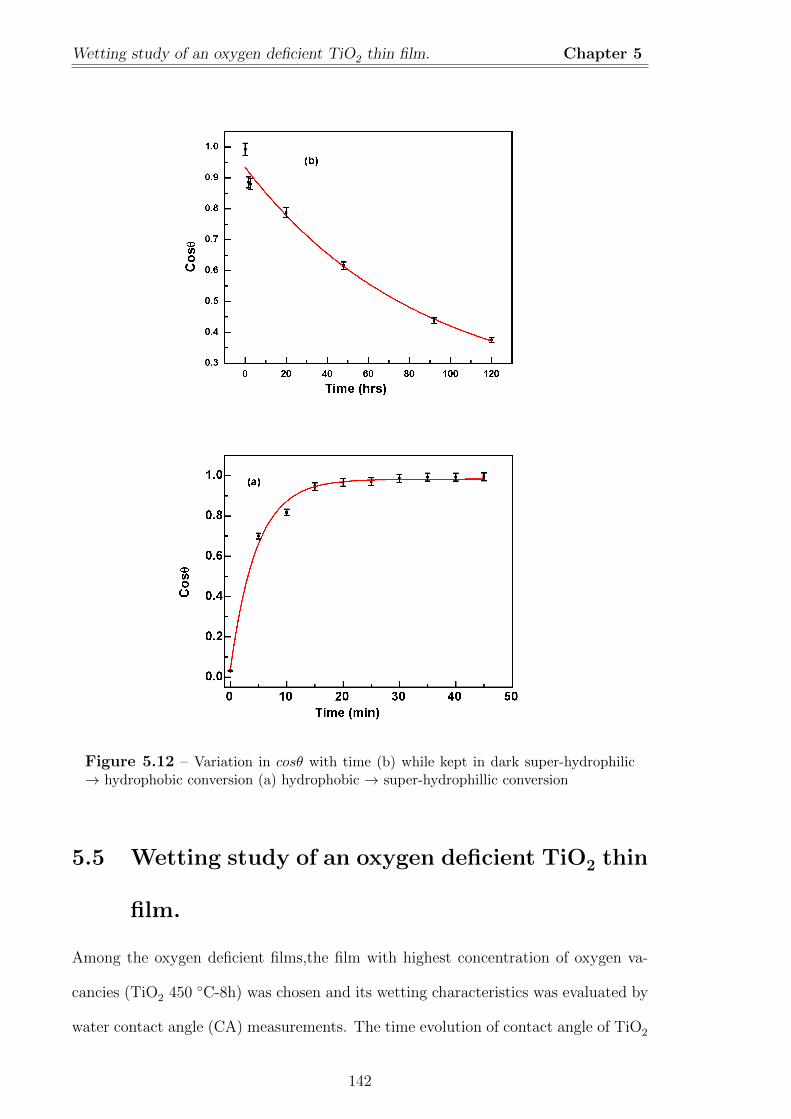
Wetting study of an oxygen deficient TiO2 thin film. Chapter 5
Figure 5.12 – Variation in cosθ with time (b) while kept in dark super-hydrophilic→ hydrophobic conversion (a) hydrophobic → super-hydrophillic conversion
5.5 Wetting study of an oxygen deficient TiO2 thin
film.
Among the oxygen deficient films,the film with highest concentration of oxygen va-
cancies (TiO2 450 ◦C-8h) was chosen and its wetting characteristics was evaluated by
water contact angle (CA) measurements. The time evolution of contact angle of TiO2
142
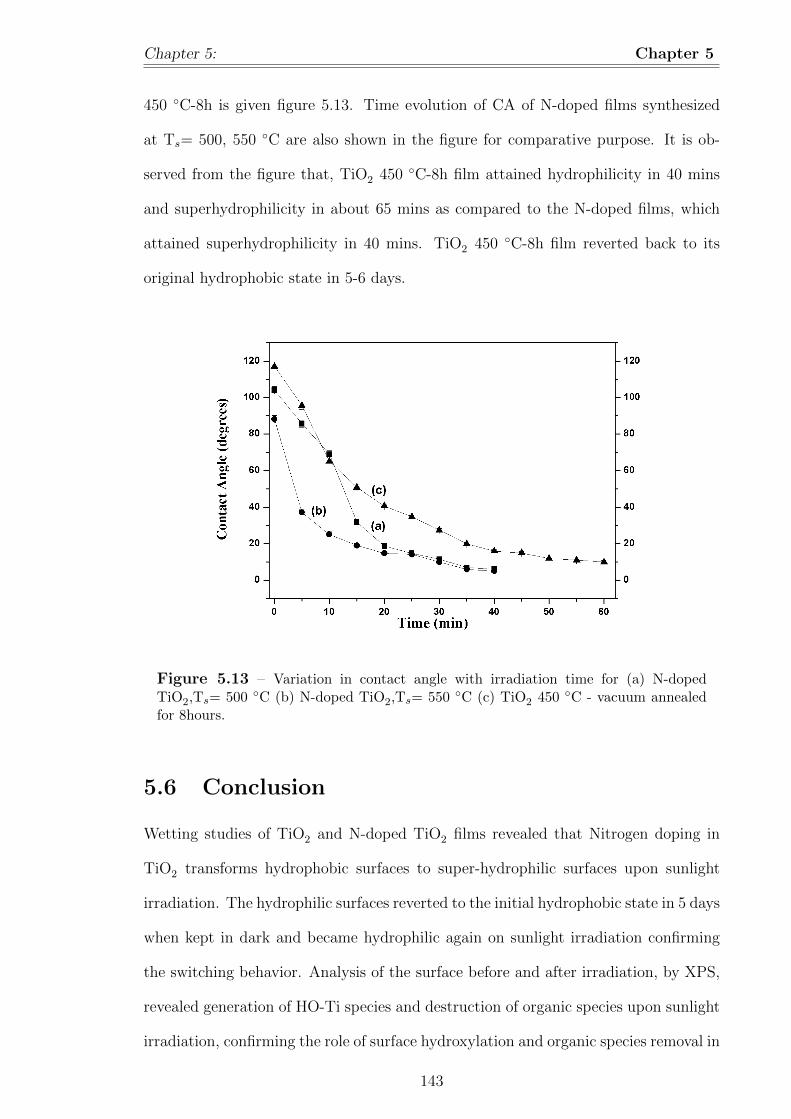
Chapter 5: Chapter 5
450 ◦C-8h is given figure 5.13. Time evolution of CA of N-doped films synthesized
at Ts= 500, 550 ◦C are also shown in the figure for comparative purpose. It is ob-
served from the figure that, TiO2 450 ◦C-8h film attained hydrophilicity in 40 mins
and superhydrophilicity in about 65 mins as compared to the N-doped films, which
attained superhydrophilicity in 40 mins. TiO2 450 ◦C-8h film reverted back to its
original hydrophobic state in 5-6 days.
Figure 5.13 – Variation in contact angle with irradiation time for (a) N-dopedTiO2,Ts= 500 ◦C (b) N-doped TiO2,Ts= 550 ◦C (c) TiO2 450 ◦C - vacuum annealedfor 8hours.
5.6 Conclusion
Wetting studies of TiO2 and N-doped TiO2 films revealed that Nitrogen doping in
TiO2 transforms hydrophobic surfaces to super-hydrophilic surfaces upon sunlight
irradiation. The hydrophilic surfaces reverted to the initial hydrophobic state in 5 days
when kept in dark and became hydrophilic again on sunlight irradiation confirming
the switching behavior. Analysis of the surface before and after irradiation, by XPS,
revealed generation of HO-Ti species and destruction of organic species upon sunlight
irradiation, confirming the role of surface hydroxylation and organic species removal in
143
Conclusion Chapter 5
the wetting behaviour. The rate of hydrophobic→ superhydrophilic conversion when
irradiated with sunlight and the rate of superhydrophilic → hydrophobic conversion
when the irradiated film is kept under dark calculated following the theoretical analysis
of Seki and Tachiya is 0.224 min−1 and 2.03x10 −4 min−1 respectively. The oxygen
deficient film also showed superhydrophilicity upon exposure to sunlight for 65 mins
as compared to N-doped films, which attained superhydrophilicity in 40 mins.
144
Bibliography
[1] Lee, J. Y.; Park, J.; Cho, J. H. Electronic Properties of N-and C-doped TiO2
Appl. Phys. Lett. 2005, 87, 11904.
[2] Xiaobo, C.; Burda, C. The Electronic Origin of the Visible-Light Absorption
Properties of C-, N- and S-Doped TiO2 Nanomaterials. J. Am. Chem. Soc. 2008,
130, 5018.
[3] Nakamura, R.; Tanaka, T.; Nakato, Y. Mechanism for Visible Light Responses
in Anodic Photocurrents at N-Doped TiO2 Film Electrodes J. Phys. Chem. B.
2004, 108, 10617.
[4] Asahi, R.; Morikawa, T.; Ohwaki, T.; Aoki, K.; Taga, Y. Visible-Light Photo-
catalysis in Nitrogen-Doped Titanium Oxides. Science. 2001, 293, 269.
[5] Fujishima, A.; Rao,T. N.; Tryk, D. A. Titanium Dioxide Photocatalysis: Photo-
chemistry Reviews. J. of Photochemistry and Photobiology C. 2000, 1, 1.
[6] Carp, O.; Huisman, C.L.; Reller, A. Photoinduced Reactivity of Titanium Diox-
ide. Progress in Solid State Chemistry. 2004, 32, 33.
[7] Wang, R.; Hashimoto, K.; Fujishima, A. Light-induced Amphiphilic Surfaces.
Nature. 1997, 388, 431.
[8] Zubkov, T.; Stahl, D.; Thompson, T. L.; Panayotov, D.; Diwald, O.; Yates, J.
Ultraviolet Light-Induced Hydrophilicity Effect on TiO2(110)(1×1). Dominant
145
BIBLIOGRAPHY Chapter 5
Role of the Photooxidation of Adsorbed Hydrocarbons Causing Wetting by Water
Droplets. J. Phys. Chem. B. 2005, 109, 15454.
[9] Yang, M. C.; Yang, T. S.; Wong, M. S. Nitrogen-Doped Titanium Oxide Films as
Visible Light Photocatalyst by Vapor Deposition, Thin Solid Films. 2004, 1-5,
469.
[10] Yang, T. S.; Yang, M. C.; Shiu, C. B.; Chang, W. K.; Wong, M. S. Effect of
N2 Ion Flux on the Photocatalysis of Nitrogen-Doped Titanium Oxide films by
Electron-Beam Evaporation. Appl. Surf. Sci. 2006, 252, 3729.
[11] Irie, H.; Washizuka, S.; Yoshino, N.; Hashimoto, K. Visible-Light Induced Hy-
drophilicity on Nitrogen-Substituted Titanium Dioxide Films. Chem. Commun.
2003, 11, 1298-1299.
[12] Borras, A.; Lopez, C.; Rico, V.; Gracia, F.; Gonzalez-Elipe, A. R.; Richter, E.;
Battiston, G.; Gerbasi, R.; McSporran, N.; Sauthier, G.; Gyorgy, E.; Figueras,
A. Effect of Visible and UV Illumination on the Water Contact Angle of TiO2
Thin Films with Incorporated Nitrogen. J. Phys. Chem. C. 2007, 111, 1801.
[13] Yu, J.C.; Ho, W.; Lin, J.; Yip, H.; Wong, P. K. Photocatalytic Activity, An-
tibacterial Effect, and Photoinduced Hydrophilicity of TiO2 Films Coated on a
Stainless Steel Substrate. Environ. Sci. Technol. 2003, 37, 2296.
[14] Allain, E.; Besson, S.; Durand, C.; Moreau, M.; Gacoin, T.; Boilot, J.P. Trans-
parent Mesoporous Nanocomposite Films for Self-Cleaning Applications. Adv.
Funct. Mater. 2007, 17, 549.
[15] Antony, R.P.; Mathews, T.; Ramesh, C.; Murugesan, N.; Dasgupta, A.; Dhara,
S.; Dash, S.; Tyagi, A. K. Efficient Photocatalytic Hydrogen Generation by Pt
Modified TiO2 Nanotubes Fabricated by Rapid Breakdown Anodization. Int. J.
Hydrogen Energy. 2012, 37, 8268.
146
BIBLIOGRAPHY Chapter 5
[16] Oregan, B.; Gratzel, M. A Low-Cost, High-Efficiency Solar Cell Based on Dye-
Sensitized Colloidal TiO2 Films. Nature. 1991, 353, 737.
[17] Nazeeruddin, M. K.; Kay, A.; Rodicio, I.; Humphry-Baker, R.; Mueller, E.;
Liska, P.; Vlachopoulos, N.; Graetzel, M. Conversion of Light to Electricity by
Cis-X2Bis (2, 2’-bipyridyl-4, 4’-dicarboxylate) Ruthenium (II) Charge-Transfer
Sensitizers (X= Cl−, Br−, I−, CN−, and SCN−) on Nanocrystalline Titanium
Dioxide Electrodes. J.Am.Chem.Soc. 1993, 115, 6382.
[18] Iftimie, N.; Crisan, M.; Braileanu, A.; Crisan, D. C.; Nastuta, A.; Rusu, G. B.;
Popa, P. D.; Mardare, D. On the Sensing Gas Properties of Titanium Dioxide
Films. J. Optoelectron. Adv. Mater. 2008, 10, 2363.
[19] Martinez-Ferrero, E.; Sakatani, Y.; Boissiere, C.; Grosso, D.; Fuertes, A.;
Fraxedas, J.; Sanchez, C. Nanostructured Titanium Oxynitride Porous Thin
Films as Efficient Visible-Active Photocatalysts. Adv. Funct. Mater. 2007, 17,
3348.
[20] Bozzi, A.; Yuranova, T.; Guasaquillo, I.; Laubb, D.; Kiwi, J. J. Photochem.
Photobiol. A. 2005, 174, 156.
[21] Nakajima, A.; Hashimoto, K.; Watanabe, T.; Takai, K.; Yamauchi, G.; Fu-
jishima, A. Transparent Superhydrophobic Thin Films with Self-Cleaning Prop-
erties. Langmuir. 2000, 16, 7044.
[22] Fujishima, A.; Zhang, X. T.; Tryk, D. A. TiO2 Photocatalysis and Related Sur-
face Phenomena. Surf. Sci. Rep. 2008, 63, 515.
[23] Parkin, I.P.; Palgrave, R. G. Self-Cleaning Coatings. J. Mater. Chem. 2005, 15,
1689.
[24] Seki, K.; Tachiya, M. Kinetics of Photoinduced Hydrophilic Conversion Processes
of TiO2 Surfaces J. Phys. Chem. B. 2004, 108 (15), 4806.
147
BIBLIOGRAPHY Chapter 5
[25] Young, T. An Essay on the Cohesion of Fluids. Philos. Trans. R. Soc. London .
1805, 95, 65.
[26] Adamson,A. W. ; Ling, I. The Status of Contact Angle as a Thermodynamic
Property, Contact Angle, Wettability, and Adhesion, Chapter 3, 57.
[27] Johnson Jr.R. E. Conflicts between Gibbsian Thermodynamics and Recent Treat-
ments of Interfacial Energies in Solid-Liquid-Vapor, J. Phys. Chem. 1959, 63
(10),1655–1658.
[28] Seo, K.; Kim, M.; Kim,D. H. Re-derivation of Young’s Equation, Wen-
zel Equation, and Cassie-Baxter Equation Based on Energy Minimization,
doi:10.5772/61066.
[29] Whyman,G.; Bormashenko, E.; Stein, T. The rigorous derivation of Young,
Cassie–Baxter and Wenzel equations and the analysis of the contact angle hys-
teresis phenomenon, Chemical Physics Letters. 2008, 450, 355.
[30] Wenzel, R.N. Resistance of Solid Surfaces to Wetting by Water, Industrial and
Engineering Chemistry. 1936, 28, 987.
[31] de Gennes, P. G. Wetting: Statics and Dynamics. Rev. Mod. Phys. 1985, 57,
827.
[32] Cassie, A. B. D.; Baxter, S. Wettability of Porous Surfaces. Trans. Faraday Soc.
1944, 40, 546.
[33] Rosario, R.; Gust, D.; Garcia, A. A.; Hayes, M.; Taraci, J. L.; Clement, T.;
Dailey, J. W.; Picraux, S. T. Lotus Effect Amplifies Light-Induced Contact Angle
Switching. J. Phys. Chem. B. 2004, 108, 12640.
[34] Marmur, A. The Lotus Effect: Superhydrophobicity and Metastability. Lang-
muir. 2004, 20, 3517.
148
BIBLIOGRAPHY Chapter 5
[35] Feng, X.; Zhai, J.; Jiang, L. The Fabrication and Wwitchable Superhydropho-
bicity of TiO2 Nanorod Films. Angew. Chem. Int. Ed. 2005, 44 (32), 5115.
[36] Borras, A.; Gonzalez-Elipe, A. R. Wetting Properties of Polycrystalline TiO2
Surfaces: A Scaling Approach to the Roughness Factors, Langmuir. 2010, 26
(20),15875.
[37] Miwa, M.; Nakajima, A.; Fujishima, A.; Hashimoto, K.; Watanabe, T. Effects of
the Surface Roughness on Sliding Angles of Water Droplets on Superhydrophobic
Surfaces, Langmuir. 2000, 16, 5754.
[38] Ingo, G. M.; Dire, S.; Babonneau, F. XPS Studies of SiO2-TiO2 Powders Prepared
By Sol-Gel Process. Appl. Surf. Sci. 1993, 70 - 71, 230.
[39] Kuznetsov, M. V.; Zhuravlev, J. F.; Gubanov, V. A. XPS Analysis of Adsorption
of Oxygen Molecules on the Surface of Ti and TiNx Films in Vacuum. J. Electron
Spectrosc. Relat. Phenom. 1992, 58, 169.
[40] Pouilleau, J.; Devilliers, D.; Groult, H.; Marcus, P. Surface Study of a Titanium-
Based Ceramic Electrode Material by X-Ray Photoelectron Spectroscopy. J.
Mater. Sci. 1998, 32, 5645.
[41] Nefedov, V. I.; Gati, D.; Dzhurinskii, B. F.; Sergushin, N. P.; Salyn, Y. V. Journal
of Inorganic Chemistry.(Zhurnal Neorganicheskoi Khimii). 1975, 20, 2307.
[42] Glenis, S.; Benz, M.; LeGoff, E.; Schindler, J. L.; Kannewur, C. R.; Kanatzidis,
M. G. Polyfuran: A New Synthetic Approach and Electronic Properties. J. Am.
Chem. Soc. 1993, 115, 12519.
[43] Raut, N. C; Mathews, T.; Ajikumar, P. K.; George, R. P.; Dash, S.; Tyagi,
A. K. Sunlight Active Antibacterial Nanostructured N-Doped TiO2 Thin Films
Synthesized by an Ultrasonic Spray Pyrolysis Technique. RSC Adv. 2012, 2,
10639.
149

BIBLIOGRAPHY Chapter 5
[44] Raut, N. C.; Mathews, T.; Panda, K.; Sundaravel, B.; Dash, S.; Tyagi, A. K.
Enhancement of Electron Field Emission Properties of TiO2−x Nanoplatelets by
N-doping. RSC Adv. 2012, 2, 812.
150
Chapter 6
Summary and Scope for Future
work.
6.1 Summary
Nano-structured TiO2 and N-doped TiO2 thin films are synthesized using a cost ef-
fective and environment friendly spray pyrolysis technique by keeping the substrate
temperature (Ts) at 400, 450, 500 and 550 ◦C. Crystallographic studies of the films
confirm formation of phase pure anatase TiO2. Microstructure studies of these films
reveal early stages of grain formation at Ts = 400 and 450 ◦C and well defined 20 nm
wide and 10 nm long crystalline grains at Ts = 500 and 550 ◦C. Optical absorption
studies carried out by using UV-Vis spectrometer reveal formation of interband states
in case of N-doped TiO2. The stoichiometry of the films are calculated from X-ray
photoelectron spectra and the film synthesized at Ts = 450 ◦C is found to be nearly
stoichiometric compared to the films synthesized at Ts = 400, 500 and 550 ◦C. The
chemical nature and location of the nitrogen dopant is deduced using X-ray photo-
electron spectroscopy (XPS) and X-ray absorption spectroscopy (XAS), respectively.
Nitrogen 1s (XPS) spectra showed three peaks with an energy value of 396.6, 397.5
and ∼400eV, corresponding to substitutional nitrogen, interstitial nitrogen and NO
151
Summary Chapter 6
species, respectively.1 Out of these three peaks, the peak at 396.6eV is traditionally
referred as substitutional nitrogen by several authors. However, a careful reading of
literature revealed that it corresponds to Ti-N bond of Titanium nitride, implying
that it merely represents a Ti-N linkage and is not exactly substituting lattice oxy-
gen. As XPS cannot pinpoint the location of the said atom, X-ray absorption studies
(XAS) are undertaken to delineate the exact location of nitrogen, which revealed that
nitrogen in the TiO2 host is located at a distance of ∼ 2.3 A. In addition to this,
pre-edge region of the XAS reveals three peaks (A1, A2, A3) at 4957, 4961, and 4963
eV corresponding to 1s- 1t1g, 1s- 1t2g and 1s- 3eg electronic transition due to the dis-
torted TiO6 octahedral geometry in anatase phase of TiO2.2,3 Analysis of post edge
region of X-ray absorption spectra, which is also known as extended absorption fine
structure (EXAFS), reveals that average (Ti-O)axial and (Ti-O)equatorial distances are
increased in doped TiO2 with respect to pristine TiO2 thin films. The (Ti-O)axial and
(Ti-O)equatorial bond lengths for N-doped TiO2 calculated from EXAFS are found to
be in agreement with the theoretically calculated values by Ceotto et. al.4
Since, nitrogen doping of TiO2 leads to creation of oxygen vacancies, oxygen deficient
anatase TiO2 films are synthesized to study the effect of oxygen vacancies alone. For
introducing oxygen vacancies, first anatase TiO2 films are synthesized by the custom
made spray pyrolysis unit by keeping the substarte temperature at Ts= 450 ◦C and
500 ◦C. These films are then subjected to annealing in vaccum/ reducing (H2) environ-
ment. As, annealing is known to cause phase transition of anatase to rutile, grazing
incidence X-ray diffraction (GIXRD) studies are undertaken. GIXRD of the films
revealed that there is no change in crystal structure due to annealing. The crystallite
sizes are calculated from the GIXRD spectra by using Scherrer formula and are found
to be in the range 29 to 91 nm. The formation of oxygen vacancies, due to anneal-
ing in vacuum/ reducing environment, is ascertained by comparing the co-ordination
152
Chapter 6: Summary and Scope for Future work. Chapter 6
number (C.N) obtained from EXAFS analysis with the C.N obtained by using the
equation devised by Frenkel et. al. for calculating the C.N in nanoparticles.5 The
calculated C.N for the nano-sized crystallites of oxygen deficient TiO2 films in the
present study is found to be 5.9. C.N obtained from EXAFS analysis is less than
5/5.7 for oxygen deficient TiO2 films synthesized at Ts= 450 ◦C /500 ◦C. Comparison
of C.N obtained from EXAFS studies and the theoretical calculation using Frenkel’s
equation proved that the oxygen vacancies are indeed created in TiO2 films due to
vacuum/H2 annealing and is not due to nano-sized crystallites. Furthermore, it is
observed that the films synthesized and annealed at Ts = 450 ◦C are more oxygen
deficient (CN of TiO2−x-450 ◦C is in the range of 4.6 to 4.8) compared to the films
synthesized at Ts = 500 ◦C (CN of TiO2−x-500 ◦C is in the range of 4.6 to 5.7). This
is attributed to the porous microstructure of the film synthesized at Ts = 500 ◦C,
which undergoes surface restructuring and absorbs the desorbed oxygen species avail-
able near surface as pointed out by Krivstov et.al.6 In addition, the effect of oxygen
vacancy on the local structure is understood by analyzing X-ray absorption near edge
spectra (XANES). XANES of oxygen deficient TiO2 films show three peaks (A1, A2,
A3) positioned around 4957, 4961, and 4963 eV with varying intensity. Analyzing
peak position and height of A1, A2 and A3 reveals that oxygen deficient TiO2 films
consist of both six and few five coordinated Ti centers. In addition to the above,
oxygen vacancies are known to induce disorderness in the system, which is reflected
in the integrated intensity of A2 peak. To understand this, A2 peak was fitted and its
integrated intensity is found to be highest for the films annealed for 2 hours. This is
in accordance with the fact that grain size and crystallinity increases with increase in
annealing time as given in the literature. Comparison between theoretically simulated
XAS spectra using FEFF with the experimental result reveals that oxygen deficient
anatase TiO2 also gives rise to three pre-edge peaks and there is no change in the
local symmetry owing to oxygen deficiency.
153
Scope of Future Work Chapter 6
Nitrogen doping and oxygen vacancies change the electronic structure of TiO2, which
in turn can make the films visible light active. Hence, wetting studies are performed
on these films. The photo-induced wetting studies of N-doped TiO2 films reveal, they
become superhydrophilic upon 40 min sunlight irradiation and revert back to hy-
drophobic state when kept in dark for 5 days. This confirms the switching (hydropho-
bic ↔ superhydrophilic) behaviour and the rate of hydrophobic → superhydrophilic
and superhydrophilic → hydrophobic transition is found to be 0.224 min−1 and 2.03
x 10−4 min−1, respectively. Similar photo-induced wetting behaviour is also observed
for oxygen deficient TiO2 films.
6.2 Scope of Future Work
• Oxygen deficient TiO2 synthesized by vacuum annealing has been studied. The
samples synthesized under reductive atmosphere could not be pursued due to
difficulties in handling H2. Hence, an extensive study of oxygen deficient TiO2
synthesized by annealing films under hydrogen atmosphere can be pursued fur-
ther.
• Oxygen vacancies alters the band gap by reducing Ti4+ states to Ti3+.Since, Ti
3d states contribute primarily to the conduction band of TiO2, it is expected
that oxygen vacancies would affect the conduction band of TiO2. Hence, a
detailed band structure analysis can be undertaken for oxygen deficient TiO2
films by using Ultraviolet Photo-electron Spectroscopy (UPS) and Reflection
high-energy electron loss spectroscopy (RHEELS).
• Wetting studies of doped and oxygen deficient TiO2 revealed reversible hy-
drophobic to superhydrophilic conversion of TiO2 surfaces upon sunlight irra-
diation. Though superhydrophilicity is attained in 40 to 50 mins, its reversal
to initial hydrophobic state when kept in dark took a long time. Hence, efforts
should be made to reduce the superhydrophilic to hydrophobic state, so that
154

Chapter 6: Chapter 6
the material can truly be utilised in various applications.
155
Bibliography
[1] Saha, N. C.; Tompkins, H. G. Titanium nitride oxidation chemistry: An X-ray
Photoelectron Spectroscopy Study. J. Appl. Phys. 1992, 72, 3072.
[2] Sandstrom, D. R.; Filby, R. H.; Lytle, F. W.; Greegor, R. B. Study of Ti in
Solvent-Refined Coal by X-ray Absorption Spectroscopy. Fuel. 1982, 61, 195.
[3] Chen, L. X.; Rajh, T.; Wang, Z.; Thurnauer, M. C. XAFS Studies of Surface
Structures of TiO2 Nanoparticles and Photocatalytic Reduction of Metal Ions.
J. Phys. Chem. B. 1997, 101, 10688.
[4] Ceotto, M.; Lo Presti, L.; Cappelletti, G.; Meroni, D.; Spadavecchia, F.; Zecca,
R.; Leoni, M.; Scardi, P.; Bianchi, C. L.; Ardizzone, S., About the Nitrogen Loca-
tion in Nanocrystalline N-Doped TiO2: Combined DFT and EXAFS Approach.
J. Phys. Chem. C. 2012, 116, 1764.
[5] Frenkel,A. I.; Yevick, A.; Cooper, C.; Vasic,R. Modeling the Structure and Com-
position of Nanoparticles by Extended X-Ray Absorption Fine-Structure Spec-
troscopy. Annu. Rev. Anal. Chem. 2011, 4, 23.
[6] Krivtsov,I.; Ilkaeva, M.; Salas-Colera, E.; Amghouz, Z.; Garcia,J. R.; Diaz, E.;
Ordonez, S.;Villar-Rodil, S. Consequences of Nitrogen-Doping and Oxygen En-
richment on Titanium Local Order and Photocatalytic Performance of TiO2
Anatase. J.Phys. Chem. C. 2017, 121, 6770-6780.
156